Table of ContentsUNITED STATES
SECURITIES AND EXCHANGE COMMISSION
Washington, D.C. 20549
FORM 10-K
[X] | ANNUAL REPORT PURSUANT TO SECTION 13 OR 15(d) OF THE SECURITIES EXCHANGEACT OF 1934 |
| For the fiscal year ended March 31, 2017 |
OR
[ ] | TRANSITION REPORT PURSUANT TO SECTION 13 OR 15(d) OF THE SECURITIES EXCHANGE ACT OF 1934 |
| For the transition period from _______________ to _______________ |
Commission File Number:1-35693
HAMILTON BANCORP, INC.
(Exact name of registrant as specified in its charter)
MARYLAND (State or other jurisdiction of incorporation or organization) | 46-0543309 (I.R.S. Employer Identification No.) |
501 Fairmount Avenue, Suite 200, Towson, Maryland (Address of principal executive offices) | 21286 (Zip Code) |
(410) 823-4510
(Registrant’s telephone number, including area code)
Securities registered pursuant to Section 12(b) of the Act:
Title of each class | Name of each exchange on which registered |
Common Stock, par value $0.01 per share | Nasdaq Capital Market |
Securities registered pursuant to Section 12(g) of the Act: None
Indicate by check mark if the registrant is a well-known seasoned issuer, as defined in Rule 405 of the Securities Act. Yes [ ] No [ X ]
Indicate by check mark if the registrant is not required to file reports pursuant to Section 13 or Section 15(d) of the Act. Yes [ ] No [ X ]
Indicate by check mark whether the registrant (1) has filed all reports required to be filed by Section 13 or 15(d) of the Securities Exchange Act of 1934 during the preceding 12 months (or for such shorter period that the registrant was required to file such reports), and (2) has been subject to such filing requirements for the past 90 days. Yes [ X ] No [ ]
Indicate by check mark whether the registrant has submitted electronically and posted on its corporate Web site, if any, every Interactive Data File required to be submitted and posted pursuant to Rule 405 of Regulation S-T (§ 232.405 of this chapter) during the preceding 12 months (or for such shorter period that the registrant was required to submit and post such files). Yes [ X ] No [ ]
Indicate by check mark if disclosure of delinquent filers pursuant to Item 405 of Regulation S-K is not contained herein, and will not be contained, to the best of the registrant’s knowledge, in definitive proxy or information statements incorporated by reference in Part III of this Form 10-K or any amendment to this Form 10-K. [ X ]
Indicate by check mark whether the registrant is a large accelerated filer, an accelerated filer, a non-accelerated filer, smaller reporting company, or an emerging growth company.See the definitions of “large accelerated filer,” “accelerated filer,” “smaller reporting company,” and “emerging growth company” in Rule 12b-2 of the Exchange Act.
Large accelerated filer [ ] | Accelerated filer [ ] |
Non-accelerated filer [ ] (Do not check if a smaller reporting company) | Smaller reporting company [ X ] |
Emerging growth company [ X ] | |
If an emerging growth company, indicate by check mark if the registrant has elected not to use the extended transition period for complying with any new or revised financial accounting standards provided pursuant to Section 13(a) of the Exchange Act. [ ]
Indicate by check mark whether the registrant is a shell company (as defined by Rule 12b-2 of the Act).
Yes [ ] No [ X ]
The aggregate market value of the voting and non-voting common equity held by non-affiliates as ofSeptember 30, 2016was $44,404,394
The number of shares outstanding of the registrant’s common stock as of June 29, 2017 was 3,411,075.
DOCUMENTS INCORPORATED BY REFERENCE:
Proxy Statement for the Registrant’s Annual Meeting of Stockholders (Part III)
INDEX
This page intentionally left blank.
This report contains certain “forward-looking statements” within the meaning of the federal securities laws. These statements are not historical facts; rather, they are statements based on Hamilton Bancorp, Inc.’s current expectations regarding its business strategies, intended results and future performance. Forward-looking statements are preceded by terms such as “expects,” “believes,” “anticipates,” “intends” and similar expressions.
Management’s ability to predict results or the effect of future plans or strategies is inherently uncertain. Factors which could affect actual results include changes in interest rates, national and regional economic conditions, legislative and regulatory changes, monetary and fiscal policies of the U.S. government, including policies of the U.S. Treasury and the Federal Reserve Board, the credit quality and composition of the loan and investment portfolios, valuation of assets acquired, deposit flows, competition, demand for loan products and for financial services in Hamilton Bancorp, Inc.’s market area, changes in real estate market values in Hamilton Bancorp, Inc.’s market area, changes in relevant accounting principles and guidelines and the inability of third party service providers to perform as required.For further discussion of factors that may affect the results, see “Item 1A. Risk Factors” in this Annual Report on Form 10-K (“Annual Report”). These factors should be considered in evaluating the forward-looking statements and undue reliance should not be placed on such statements. Except as required by law, we disclaim any intention or obligation to update or revise any forward-looking statements after the date of this Annual Report, whether as a result of new information, future events or otherwise.
In this Annual Report, the terms “we,” “our,” and “us” refer to Hamilton Bancorp, Inc. and Hamilton Bank, unless the context indicates another meaning. In addition, we sometimes refer to Hamilton Bancorp, Inc. as “Hamilton Bancorp,” and to Hamilton Bank as the “Bank.”
PARTI
Item1. BUSINESS
General
Hamilton Bancorp, Inc. (the “Company”) is a Maryland chartered corporation incorporated on June 7, 2012 to serve as the stock holding company for Hamilton Bank (the “Bank”), a federally chartered savings bank. On October 10, 2012, in accordance with a Plan of Conversion adopted by its Board of Directors and approved by its members, the Bank converted from a mutual savings bank to a stock savings bank and became the wholly owned subsidiary of the Company. In connection with the conversion, the Company sold 3,703,000 shares of common stock at a price of $10.00 per share, through which the Company received net proceeds of approximately $35,580,000. Hamilton Bancorp’s principal business activity is the ownership of the Bank’s capital stock and the management of the offering proceeds it retained in connection with the Bank’s conversion. Hamilton Bancorp does not own or lease any property but instead uses the premises, equipment and other property of the Bank with the payment of appropriate rental fees, as required by applicable law and regulations, under the terms of an expense allocation agreement. In the future, Hamilton Bancorp may acquire or organize other operating subsidiaries.
Founded in 1915 and celebrating over 100 years of service, the Bank is a community-oriented financial institution, dedicated to serving the financial needs of consumer and businesses within its market area. Our lending market area is considered greater Maryland, southern Pennsylvania, Washington D.C., and northern Virginia. We offer a variety of deposit and loan products in our market area. Our real estate loans consist primarily of one-to- four family mortgage loans (including owner-occupied and investor loans), as well as commercial real estate loans, and home equity loans and lines of credit. We also offer commercial term, leases and line of credit loans and, to a limited extent, consumer loans consisting primarily of automobile loans and loans secured by deposits. We currently operate out of our corporate headquarters in Towson, Maryland and our seven full-service branch offices located in Baltimore City, Cockeysville, Towson, Rosedale, Ellicott City and Pasadena, Maryland. Our market area for deposits is primarily the local counties surrounding our offices.
We also invest in securities, which consist primarily of U.S. government agency, municipal and corporate bond obligations, mortgage-backed securities and collateralized mortgage obligations issued or guaranteed by U.S. government-sponsored enterprises, and to a much lesser extent, equity securities of government-sponsored enterprises.
We offer a variety of deposit accounts, including certificate of deposit accounts, money market accounts, savings accounts, NOW accounts and individual retirement accounts. Over the past two years we have borrowed funds from the Federal Home Loan Bank (FHLB) to meet growing loan demand, including $11.5 million in FHLB advances in March 2017 to assist with the purchase of $23 million in residential mortgage loan pools. We have also acquired FHLB advances through our acquisitions of Fraternity Community Bancorp, Inc. and Fairmount Bancorp, Inc. completed in May 2016 and September 2015, respectively. We are committed to offering alternative banking delivery systems, including ATMs, online banking and remote deposit capture.
RecentAcquisitions
On May 13, 2016, the Company completed its acquisition of Fraternity Community Bancorp, Inc. (“Fraternity Community Bancorp”) through the merger of Fraternity Community Bancorp, the parent company of Fraternity Federal Savings & Loan Association, with and into the Company pursuant to the Agreement and Plan of Merger dated October 12, 2015. As a result of the merger, each shareholder of Fraternity Community Bancorp received a cash payment equal to nineteen dollars and twenty-five cents ($19.25) for each share of Fraternity Community Bancorp common stock, or an aggregate of approximately $25.7 million. Immediately after the acquisition of Fraternity Community Bancorp, Fraternity Federal Savings & Loan Association was merged with and into the Bank, with the Bank the surviving bank.
On September 11, 2015, the Company completed its acquisition of Fairmount Bancorp, Inc. (“Fairmount Bancorp”) through the merger of Fairmount Bancorp, the parent company of Fairmount Bank, with and into the Company pursuant to the Agreement and Plan of Merger dated April 15, 2015. As a result of the acquisition, each shareholder of Fairmount Bancorp received a cash payment equal to thirty dollars ($30.00) for each share of Fairmount Bancorp common stock, or an aggregate of approximately $15.4 million. Immediately after the acquisition of Fairmount Bancorp, Fairmount Bank was merged with and into the Bank, with the Bank the surviving bank.
As a result of the acquisitions, we have added three branches to our branch structure in the Baltimorearea. (See Note 3 –“Acquisitions” of the consolidated financial statements for additional discussion about each acquisition.)
Available Information
The Bank’s website address iswww.hamilton-bank.com. Available through the Investor Relations area of our website are annual reports on Form 10-K, quarterly reports on Form 10-Q, news releases on Form 8-K, and any amendments to those reports filed or furnished pursuant to Section 13(a) or 15(d) of the Exchange Act. In general, we intend that these reports be available as soon as practicable after they are filed with or furnished to the Securities and Exchange Commission (“SEC”). Information on the Bank’s website should not be considered a part of this Annual Report.
Market Area
We conduct our operations from our seven full-service banking offices in Maryland. Our primary deposit market includes the areas surrounding our banking offices in Cockeysville, Pasadena, Towson, Rosedale, Ellicott City and two locations in Baltimore City. In May 2016, we closed our stand-alone branch office in the Cockeysville area of Baltimore County and merged it into one of our recently acquired branches that is close in proximity and served the same Cockeysville community and surrounding area. The acquired branch is smaller in size, offering cost savings, and provides easier access for our customers so their needs can be better served. The combining of these two branches makes our Cockeysville branch our largest branch by deposits with just over $100 million in deposits as of March 31, 2017. We are also in the process of relocating our Ellicott City branch to a new property a short distance away from its current location. The landlord, whom the current location is leased from, is converting the existing branch property into other commercial space.
The Bank considers greater Maryland, southern Pennsylvania, Washington D.C., and northern Virginia its primary lending area for its various consumer, commercial and mortgage lending services. It is the policy of the Bank to focus on lending to customers within its primary lending area, and/or to collateralize secured loans with real property located within the primary lending area. However, we occasionally make loans secured by collateral located outside of our primary lending market, especially to borrowers with whom we have an existing relationship or who have a significant presence within our primary market. Our primary lending market contains a diverse cross section of employment sectors, with a mix of services, manufacturing, wholesale/retail trade, federal and local government, health care facilities and finance related employment. The city of Baltimore is now considered a major center for both the financial and health service industries.
Our branch network includes Baltimore City and the Maryland counties of Anne Arundel, Howard, and Baltimore. Maryland continues to rank first in the nation with respect to median household income, as reflected in 2015 with median household income of nearly $76,000 compared to a national average of $56,000. Both Howard and Anne Arundel county rank amongst the top counties in the state with respect to household income and report lower unemployment. Baltimore City, Baltimore County, Howard, and Anne Arundel County reported preliminary unemployment rates of 6.3%, 4.5%, 3.2% and 3.7%, respectively, for December 2016, compared to the statewide and national unemployment rates of 4.2% and 4.7%, respectively.
Competition
We face significant competition within our market both in making loans and attracting deposits. Our market area has a high concentration of financial institutions including large money center and regional banks, community banks and credit unions. Some of our competitors offer products and services that we currently do not offer, such as trust services and private banking. Our competition for loans and deposits comes principally from commercial banks, savings institutions, internet banks, mortgage banking firms, consumer finance companies, credit unions, and non-bank lenders. We face additional competition for deposits from short-term money market funds, brokerage firms, mutual funds and insurance companies. Our primary focus is to build and develop profitable customer relationships across all lines of business while maintaining our position as a community bank.
As of June 30, 2016 (the latest date for which information is available), our market share was 0.42% of total deposits in Baltimore City, making us the 10th largest out of 27financial institutions in Baltimore City. In addition, as of June 30, 2016, our deposit market share was 1.33%, 0.41% and 0.70% of total deposits in Baltimore County, Anne Arundel, and Howard County, respectively, making us the 11thlargest out of 33financial institutions in Baltimore County, the 20th largest out of 28financial institutions in Anne Arundel County and 15th largest out of 19 financial institutions in Howard County.
Lending Activities
General.Historically, our principal lending activity has been the origination of mortgage loans collateralized by one-to-four family residential real estate located within our primary market area. In recent years we have reduced our emphasis on the origination of one-to-four family mortgage lending to become less reliant on the origination of such loans for growth and to emphasize the origination of commercial business and commercial real estate lending. This will allow the Bank to develop a more diversified loan portfolio, generate loan growth from different resources, and provide our customers with more products and services that fit their needs. In connection with this strategy, we have hired several commercial real estate and commercial business loan officers with strong experience in these lending areas. In addition, back office commercial loan personnel have also been hired to assist with the processing, underwriting, and monitoring of our commercial loan portfolio. Our commercial loan underwriting analysis is maintained in-house and allows us to be more efficient in originating loans and enhance the customer experience. We currently sell a majority of our one-to-four family mortgage loans with terms over 10 years into the secondary market. In addition to commercial business loans and leases, commercial real estate loans and residential mortgage loans, we also offer home equity loans and lines of credit, residential and commercial construction loans, and, to a much lesser extent, other consumer loans.
Although our portfolio of one-to-four family residential loans increased significantly both in amount and as a percentage of total loans during fiscal 2017, the increase was primarily due to our acquisition of Fraternity Community Bancorp in May 2016.
Loan Portfolio Composition.Set forth below is selected information concerning the composition of our loan portfolio in dollar amounts and in percentages as of the dates indicated. Amounts shown do not include loans held for sale equal to $-0-, $259,000, $581,000, $-0- and $197,000 at March 31, 2017, 2016, 2015, 2014 and 2013, respectively.
| | | At March 31, | |
| | | 2017 | | | 2016 | | | 2015 | |
| | | Amount | | | Percent | | | Amount | | | Percent | | | Amount | | | Percent | |
| | | (Dollars in thousands) | |
Real estate loans: | | | | | | | | | | | | | | | | | | | | | | | | |
Residential mortgage loans: | | | | | | | | | | | | | | | | | | | | | | | | |
One- to four-family residential | | $ | 157,446 | | | | 46.4 | % | | $ | 69,300 | | | | 31.1 | % | | $ | 49,865 | | | | 31.1 | % |
One- to four-family investor | | | 25,522 | | | | 7.5 | | | | 27,860 | | | | 12.5 | | | | 12,971 | | | | 8.1 | |
Commercial construction | | | 3,190 | | | | 0.9 | | | | 8,527 | | | | 3.8 | | | | 6,362 | | | | 4.0 | |
Commercial | | | 107,564 | | | | 31.7 | | | | 78,115 | | | | 35.1 | | | | 59,273 | | | | 36.9 | |
Total real estate loans | | | 293,722 | | | | 86.6 | | | | 183,802 | | | | 82.5 | | | | 128,471 | | | | 80.1 | |
Commercial business loans | | | 21,537 | | | | 6.4 | | | | 20,395 | | | | 9.2 | | | | 18,490 | | | | 11.5 | |
Consumer: | | | | | | | | | | | | | | | | | | | | | | | | |
Home equity loans and lines ofcredit | | | 20,544 | | | | 6.1 | | | | 14,391 | | | | 6.5 | | | | 12,261 | | | | 7.6 | |
Other consumer | | | 3,197 | | | | 0.9 | | | | 4,179 | | | | 1.9 | | | | 1,166 | | | | 0.8 | |
Total consumer loans | | | 23,741 | | | | 7.0 | | | | 18,570 | | | | 8.3 | | | | 13,427 | | | | 8.4 | |
Total loans receivable | | | 339,000 | | | | 100.0 | % | | | 222,767 | | | | 100.0 | % | | | 160,388 | | | | 100.0 | % |
| | | | | | | | | | | | | | | | | | | | | | | | | |
Premium (discount) on loans acquired | | | 76 | | | | | | | | (769 | ) | | | | | | | - | | | | | |
Net deferred loan origination feesand costs | | | (143 | ) | | | | | | | (139 | ) | | | | | | | (103 | ) | | | | |
Allowance for loan losses | | | (2,195 | ) | | | | | | | (1,702 | ) | | | | | | | (1,690 | ) | | | | |
| | | | | | | | | | | | | | | | | | | | | | | | | |
Total loans receivable, net | | $ | 336,738 | | | | | | | $ | 220,157 | | | | | | | $ | 158,595 | | | | | |
| | | At March 31, | |
| | | 2014 | | | 2013 | |
| | | Amount | | | Percent | | | Amount | | | Percent | |
| | | (Dollars in thousands) | |
Real estate loans: | | | | | | | | | | | | | | | | |
Residential mortgage loans: | | | | | | | | | | | | | | | | |
One- to four-family residential | | $ | 57,674 | | | | 39.8 | % | | $ | 63,912 | | | | 39.6 | % |
One- to four-family investor | | | 14,000 | | | | 9.7 | | | | 15,826 | | | | 9.8 | |
Commercial construction | | | 3,268 | | | | 2.3 | | | | 3,508 | | | | 2.2 | |
Commercial | | | 41,406 | | | | 28.6 | | | | 36,239 | | | | 22.5 | |
Total real estate loans | | | 116,348 | | | | 80.4 | | | | 119,485 | | | | 74.1 | |
Commercial business loans | | | 15,657 | | | | 10.8 | | | | 26,937 | | | | 16.7 | |
Consumer: | | | | | | | | | | | | | | | | |
Home equity loans and lines ofcredit | | | 11,660 | | | | 8.0 | | | | 13,727 | | | | 8.5 | |
Other consumer | | | 1,154 | | | | 0.8 | | | | 1,123 | | | | 0.7 | |
Total consumer loans | | | 12,814 | | | | 8.8 | | | | 14,850 | | | | 9.2 | |
Total loans receivable | | | 144,819 | | | | 100.0 | % | | | 161,272 | | | | 100.0 | % |
| | | | | | | | | | | | | | | | | |
Premium (discount) on loans acquired | | | - | | | | | | | | 15 | | | | | |
Net deferred loan origination feesand costs | | | (119 | ) | | | | | | | (96 | ) | | | | |
Allowance for loan losses | | | (1,786 | ) | | | | | | | (2,071 | ) | | | | |
| | | | | | | | | | | | | | | | | |
Total loans receivable, net | | $ | 142,914 | | | | | | | $ | 159,120 | | | | | |
Loan Portfolio Maturities and Yields.The following table summarizes the scheduled repayments of our loan portfolio at March 31, 2017. Demand loans, loans having no stated repayment schedule or maturity, and overdraft loans are reported as being due in one year or less.
| | | | One- to Four-Family ResidentialReal Estate | | | One- to Four-Family Investor RealEstate | | | Commercial Construction Real Estate | | | Commercial Real Estate | |
| | | | Amount | | | Weighted Average Rate | | | Amount | | | Weighted Average Rate | | | Amount | | | Weighted Average Rate | | | Amount | | | Weighted Average Rate | |
| | | | (Dollars in thousands) | |
Due During the Years Ending March 31, | | | | | | | | | | | | | | | | | | | | | | | | | | | | | | | | | |
2018 | | | $ | 7,409 | | | | 4.01 | % | | $ | 3,177 | | | | 7.6 | % | | $ | 1,816 | | | | 5.55 | % | | $ | 11,571 | | | | 4.91 | % |
2019 | | | | 579 | | | | 4.8 | | | | 1,152 | | | | 7.44 | | | | - | | | | - | | | | 5,403 | | | | 5.76 | |
2020 | | | | 507 | | | | 4.54 | | | | 779 | | | | 6.81 | | | | - | | | | - | | | | 11,242 | | | | 4.29 | |
| 2021 to 2022 | | | | 2,557 | | | | 4.26 | | | | 3,275 | | | | 5.78 | | | | - | | | | - | | | | 6,999 | | | | 4.65 | |
| 2023 to 2027 | | | | 7,073 | | | | 3.74 | | | | 7,976 | | | | 6.73 | | | | 1,247 | | | | 4.48 | | | | 61,021 | | | | 4.26 | |
| 2028 to 2032 | | | | 13,430 | | | | 3.58 | | | | 2,895 | | | | 5.16 | | | | 127 | | | | 6.00 | | | | 4,383 | | | | 5.66 | |
2033 and beyond | | | | 125,891 | | | | 4.19 | | | | 6,268 | | | | 4.7 | | | | - | | | | - | | | | 6,945 | | | | 4.99 | |
| | | | | | | | | | | | | | | | | | | | | | | | | | | | | | | | | | |
Total | | | $ | 157,446 | | | | 4.11 | % | | $ | 25,522 | | | | 6.07 | % | | $ | 3,190 | | | | 5.15 | % | | $ | 107,564 | | | | 4.54 | % |
| | | | Commercial Business | | | Home Equity Loans and Lines ofCredit | | | Other Consumer | | | Total | |
| | | | Amount | | | Weighted Average Rate | | | Amount | | | Weighted Average Rate | | | Amount | | | Weighted Average Rate | | | Amount | | | Weighted Average Rate | |
Due During the Years Ending March 31, | | | (Dollars in thousands) | |
2018 | | | $ | 9,158 | | | | 4.37 | % | | $ | 166 | | | | 4.52 | % | | $ | 43 | | | | 6.54 | % | | $ | 33,340 | | | | 4.85 | % |
2019 | | | | 751 | | | | 4.16 | | | | 159 | | | | 6.25 | | | | 143 | | | | 3.18 | | | | 8,187 | | | | 5.75 | |
2020 | | | | 1,252 | | | | 4.36 | | | | 261 | | | | 4.33 | | | | 447 | | | | 3.06 | | | | 14,488 | | | | 4.40 | |
| 2021 to 2022 | | | | 4,845 | | | | 4.89 | | | | 694 | | | | 4.91 | | | | 625 | | | | 3.39 | | | | 18,995 | | | | 4.82 | |
| 2023 to 2027 | | | | 4,203 | | | | 4.95 | | | | 2,635 | | | | 4.33 | | | | 516 | | | | 9.43 | | | | 84,671 | | | | 4.52 | |
| 2028 to 2032 | | | | 1,328 | | | | 4.83 | | | | 5,625 | | | | 4.46 | | | | 374 | | | | 8.94 | | | | 28,162 | | | | 4.38 | |
2033 and beyond | | | | - | | | | 0.00 | | | | 11,004 | | | | 3.91 | | | | 1,049 | | | | 2.77 | | | | 151,157 | | | | 4.22 | |
| | | | | | | | | | | | | | | | | | | | | | | | | | | | | | | | | | |
Total | | | $ | 21,537 | | | | 4.62 | % | | $ | 20,544 | | | | 4.18 | % | | $ | 3,197 | | | | 4.80 | % | | $ | 339,000 | | | | 4.45 | % |
Fixed and Adjustable-Rate Loan Schedule.The following table sets forth at March 31, 2017, the dollar amount of all fixed-rate and adjustable-rate loans due after March 31, 2018.
| | | Due after March 31, 2018 | |
| | | Fixed | | | Adjustable | | | Total | |
| | | (In thousands) | |
Real estate loans: | | | | | | | | | | | | |
One- to four-family residential | | $ | 126,702 | | | $ | 23,334 | | | $ | 150,036 | |
One- to four-family investor | | | 20,330 | | | | 2,015 | | | | 22,345 | |
Commercial construction | | | 1,374 | | | | - | | | | 1,374 | |
Commercial | | | 87,023 | | | | 8,970 | | | | 95,993 | |
Commercial business loans | | | 9,940 | | | | 2,440 | | | | 12,380 | |
Consumer loans: | | | | | | | | | | | | |
Home equity loans and lines of credit | | | 4,631 | | | | 15,747 | | | | 20,378 | |
Other consumer | | | 3,153 | | | | - | | | | 3,153 | |
Total loans | | $ | 253,153 | | | $ | 52,506 | | | $ | 305,659 | |
Residential Mortgage Loans.Hamilton Bank originates mortgage loans secured by owner occupied one-to-four family residential properties. To a lesser extent, we have also acquired, participated and made loans to investors for the purchase of one-to-four family residential properties that are not owner-occupied. As of March 31, 2017, we had a total of $183.0 million of residential mortgage loans secured by one-to-four family properties, of which $157.4 million, or 86.1%, were secured by properties serving as the primary residence of the owner. The remaining $25.2 million, or 13.9%, of such loans were secured by non owner-occupied residential properties. Almost all of our residential mortgage loans are secured by properties in the Greater Baltimore area.
Historically, the terms of our one-to-four family mortgage loans retained in our portfolio ranged from 10 to 30 years. Beginning in 2009, in order to lower our interest rate risk in a rising rate environment, we have sold to the secondary market the majority of our one-to-four family fixed rate loans that have been originated with terms exceeding 10 years. Towards the end of fiscal 2017 though, we once again began to portfolio some of the fixed-rate residential mortgages we originated due to the amount of run-off experienced within the portfolio. During fiscal 2017 and 2016, we sold $2.2 million, or 23.5%, and $4.4 million, or 68.0%, of one-to-four family mortgage loans that we originated with terms exceeding 10 years, respectively. Our residential mortgage portfolio is almost entirely comprised of fixed-rate loans, with 83.3% of residential mortgage loans due after March 31, 2018 having fixed rates at March 31, 2017. During the year ended March 31, 2017, we originated $4.4 million in residential mortgage loans with adjustable-rates.
We generally do not make new one-to-four family mortgage loans on owner-occupied properties with loan-to-value ratios exceeding 95% at the time the loan is originated, and all loans with loan-to-value ratios in excess of 80% require private mortgage insurance. Loan to value ratios on refinances may not exceed 80%, and loan-to-value ratios for non-owner occupied properties may not exceed 85%. In addition, borrower debt may generally not exceed 43% of the borrower’s monthly cash flow. With respect to borrower debt on loans secured by non-owner occupied properties, we look to the investor’s aggregate debt and cash flows from all investment properties the investor operates. We require all properties securing residential mortgage loans to be appraised by a board-approved independent appraiser.
Loans secured by non-owner occupied properties typically have 5 to 10 year terms and amortize over a 25 to 30 year period. Because of the increased risk associated with non-owner occupied properties, interest rates on such loans are higher than owner-occupied properties; averaging 6.1% during the year ended March 31, 2017.We have generally only originated loans secured by non-owner occupied properties to investors that reside in our market area.
In an effort to provide financing for first-time home buyers, we offer 30-year fixed-rate one-to-four family mortgage loans with loan-to-value ratios up to 95%, which cannot be readily sold to the secondary market and are held in portfolio. In fiscal 2017 and 2016, we did not originate any such loans which we did not sell.
We also make “jumbo loans” (loans above $424,100, the current maximum conforming loan amount as established by the Federal Housing Finance Agency) that we may sell into the secondary market or retain in the Bank’s portfolio depending upon the residential mortgage run-off at the time. Jumbo loans that we originate and sell, typically have 30 year terms and maximum loan-to-value ratios of 80%. At March 31, 2017, our largest outstanding portfolio jumbo residential mortgage loan was for $2.3 million at origination, with a current book balance of $2.0 million. This loan is performing in accordance with its original terms.
From 2009 through part of fiscal 2017, applications for loans that we intended to sell were processed through Mortgage Department Services, LLC (“MDS”), a company in which we had a minority interest. In fiscal 2017 we brought this process in-house using various software programs. Each application and loan is reviewed to ensure that the loan meets the standards for sale to the secondary market and the Bank’s portfolio (See “—Loan Originations, Participations, Purchases and Sales”). When we sell loans in the secondary market, we typically sell the loans at a premium and record the income immediately as a gain on sale of loans. All such loans are sold with servicing released and in most cases, with recourse that we provide to the purchaser in the case of (i) delinquency within the first 90 days of sale or (ii) breaches of customary representations and warranties to the buyers.
All residential mortgage loans that we originate include “due-on-sale” clauses, which give us the right to declare a loan immediately due and payable in the event that, among other things, the borrower sells or otherwise disposes of the real property subject to the mortgage and the loan is not repaid. All borrowers are required to obtain title insurance for the benefit of Hamilton Bank. We also require homeowner’s insurance and fire and casualty insurance and, where circumstances warrant, flood insurance.
Commercial Real Estate Loans.We originate commercial real estate loans in the Greater Baltimore area that are secured by properties used for business purposes such as small office buildings or retail facilities. We have increased our origination of commercial real estate loans over the last several years, and intend to continue to grow this portion of our loan portfolio in the future. At March 31, 2017, commercial real estate loans amounted to 31.7% of total loans or $107.6 million, including $11.9 million acquired in the Fraternity acquisition, compared to approximately $36.2 million, or 22.5% of total loans, at March 31, 2013.
Our commercial real estate loans are underwritten based on our loan underwriting polices. Our policies provide that such loans may be made in amounts of up to 85% of the appraised value of the property, provided that the property is more than 50% owner-occupied or 75% of the appraised value of the property if it is not owner-occupied. Our commercial real estate loans typically have terms of 5 to 10 years and amortize for a period of up to 25 years. In the past year we have originated an increased amount of commercial real estate loans with terms of 7 to 10 years based upon the strength of the property cash flow and loan to value ratio. Interest rates may be fixed or adjustable. If adjustable, then they are generally based on the Prime rate of interest, LIBOR, or U.S. Treasuries Constant Maturity.
The regulatory loan-to-one borrower limit is 15% of a bank’s unimpaired capital plus unimpaired surplus. As a result of the additional capital received in the stock offering, Hamilton Bank’s loans-to-one borrower limit is approximately $6.4 million. We have adopted an internal limit equal to 75% of the Bank’s loan-to-one borrower limit. We generally target commercial real estate loans with balances of $250,000 to $4.0 million. At March 31, 2017, our commercial real estate loans had an average balance of $861,000. At that same date, our largest commercial real estate relationship included one loan totaling $4.9 million. This loan is secured by a shopping center, and was performing in accordance with their original terms at March 31, 2017.
Commercial real estate lending involves additional risks compared to one-to-four family residential lending because payments on loans secured by commercial real estate properties are often dependent on the successful operation or management of the properties, and/or the collateral value of the commercial real estate securing the loan. Repayment of such loans may be subject, to a greater extent than residential loans, to adverse conditions in the real estate market or the economy. Also, commercial real estate loans typically involve larger loan balances in relation to single borrowers or groups of related borrowers. Commercial real estate loans generally have a higher rate of interest and shorter term than residential mortgage loans because of increased risks associated with this type of lending.We seek to minimize these risks through our underwriting standards. We have experienced a decrease over the past several years in delinquencies and non-performing loans in our commercial real estate loan portfolio. See “Risk Factors—Our increase in commercial real estate loans has increased our credit risk.”
Commercial Business Loans.We originate commercial business loans and lines of credit secured by non-real estate business assets. These loans are generally originated to small and middle market businesses in our primary market area. Our commercial business loans are generally used for working capital purposes or for acquiring equipment, inventory or furniture, and are primarily secured by business assets other than real estate, such as business equipment, inventory and accounts receivable. We have increased our origination of commercial business loans over the last few years and intend to continue to grow this portfolio at a moderate pace. At March 31, 2017, commercial business loans and lines of credit outstanding totaled $21.5 million, including $513,000 acquired in the Fraternity Community Bancorp acquisition, which amounted to 6.4% of total loans, compared to approximately $15.7 million, or 10.8% of total loans, at March 31, 2014.At March 31, 2017, we also had $10.7 million of unused commercial business lines of credit.
Our commercial business loans have terms up to 5 years at both fixed and adjustable rates of interest, although, adjustable rates of interest are preferred and obtained when possible. Our commercial business loans are underwritten based on our commercial business loan underwriting policies.We typically avoid making commercial business loans to purchase highly specialized, custom made equipment which may be difficult to dispose of in the event of default. When making commercial business loans, we consider the financial statements, lending history and debt service capabilities of the borrower (generally requiring a minimum debt service coverage ratio of 1.20:1.00), the projected cash flows of the business, and the value of the collateral, if any. The majority all commercial business loans are guaranteed by the principals of the borrower.
Hamilton Bank is also qualified to make Small Business Administration (“SBA”) loans. The SBA program is an economic development program which finances the expansion of small businesses. Under the SBA program, we originate and fund loans under the SBA 7(a) Loan Program which qualify for guarantees up to 85% for loans less than or equal to $150,000 and 75% for loans greater than $150,000. We also originate loans under the SBA’s CDC/504 Loan Program in which we generally provide 50% of the financing, taking a first lien on the real property as collateral. We do not treat the SBA guarantee as a substitute for a borrower meeting our credit standards, and, except for minimum capital levels or maximum loan terms, the borrower must meet our other credit standards as applicable to loans outside the SBA process. During fiscal 2017 and fiscal 2016, we did not originate any loans under the SBA 7(a) Loan Program.
We focus on the origination of commercial business loans in amounts between $250,000 and $4.0 million. At March 31, 2017, our commercial business loans had an average outstanding balance of $201,000. At that same date, our largest commercial business loan was a commercial line of credit with a commitment balance of $4.0 million, of which $2.2 million was advanced. The loan is secured by the business assets of the company and is performing in accordance with its original terms at March 31, 2017.
Commercial business loans generally have a greater credit risk than one-to-four family residential mortgage loans. Unlike residential mortgage loans, which generally are made on the basis of the borrower’s ability to make repayment from his or her employment and other income, and which are secured by real property whose value tends to be more easily ascertainable, commercial business loans are of higher risk and typically are made on the basis of the borrower’s ability to make repayment from the cash flow of the borrower’s business. As a result, the availability of funds for the repayment of commercial business loans may be substantially dependent on the success of the business itself. Further, the collateral securing the loans may depreciate over time, may be difficult to appraise and may fluctuate in value based on the success of the business. We seek to minimize these risks through our underwriting standards. See “Risk Factors - Our entry into commercial real estate and commercial business lending may result in higher losses on our loans.”
Home Equity Loans and Lines of Credit. We offer home equity loans and lines of credit that are secured by the borrower’s primary or secondary residence. At March 31, 2017, we had $20.5 million, or 6.1% of our total loan portfolio in home equity loans and lines of credit. At that date we also had $23.0 million of undisbursed funds related to home equity lines of credit.
Home equity loans and lines of credit are generally underwritten using the same criteria that we use to underwrite one-to-four family residential mortgage loans. Home equity loans and lines of credit may be underwritten with a loan-to-value ratio of up to 80% when combined with the principal balance of the existing first mortgage loan. Our home equity loans are primarily originated with fixed rates of interest with terms of up to 20 years. Our home equity lines of credit are originated with adjustable-rates based on the prime rate of interest plus or minus an applicable margin and require interest paid monthly. Home equity loans and lines of credit are available in amounts of between $10,000 and $1.0 million.
Home equity loans and lines of credit secured by second mortgages have greater risk than one-to-four family residential mortgage loans secured by first mortgages. We face the risk that the collateral will be insufficient to compensate us for loan losses and costs of foreclosure. When customers default on their loans, we attempt to foreclose on the property and resell the property as soon as possible to minimize foreclosure and carrying costs. However, the value of the collateral may not be sufficient to compensate us for the amount of the unpaid loan and we may be unsuccessful in recovering the remaining balance from those customers. Particularly with respect to our home equity loans and lines of credit, decreases in real estate values could adversely affect the value of property securing the loan.
Construction Loans.We originate construction loans for both commercial and residential real estate. Construction loans we originate generally provide for the payment of interest only during the construction phase. At the end of the construction phase, the loan converts to a permanent mortgage loan at the same or a different rate of interest.The construction period on the residential homes is typically nine to twelve months, at which time Hamilton Bank is repaid through permanent financing by a third party with servicing released or the loan is converted under the loan documents to a permanent loan and is retained in the Bank’s portfolio.
Before making a commitment to fund a construction loan, Hamilton Bank requires detailed cost estimates to complete the project and an appraisal of the property by an independent licensed appraiser. Hamilton Bank also reviews and inspects each property before disbursement of funds during the term of the construction loan. Loan proceeds are disbursed after inspection based on the percentage of completion method. Construction loans for one-to-four family residential real estate may be underwritten with a loan-to-value ratio of up to 80% or 95% with private mortgage insurance. Commercial construction loans generally may not exceed a loan-to-value ratio of 75% to 80%.
Construction lending generally involves a greater degree of risk than other one-to-four family mortgage lending. The repayment of the construction loan is, to a great degree, dependent upon the successful and timely completion of construction. Various potential factors including construction delays or the financial viability of the builder may further impair the borrower’s ability to repay the loan.
At March 31, 2017, total construction loans represented $9.6 million, or 2.8%, of Hamilton Bank’s total loans, of which $6.4 million consisted of residential construction loans and $3.2 million were commercial construction. At March 31, 2017, the commitment to fund or advance funds on total construction loans equaled $15.1 million. At March 31, 2017, our largest construction loan was a residential construction loan with a contractual principal balance of $927,200 and a recorded investment balance of $927,000. The loan is secured by the residential property being constructed and is performing in accordance with its original terms at March 31, 2017.
Other Consumer Loans.We make loans secured by deposit accounts up to 90% of the amount of the depositor’s deposit account balance. On a more limited basis, we also originate automobile loans to our customers. Other consumer loans totaled $3.2 million, or0.9% of our total loan portfolio, at March 31, 2017.
Loan Originations, Participations,Purchases and Sales.Most of our loan originations are generated by our loan personnel operating at our corporate headquarters and banking office locations. All loans we originate are underwritten pursuant to our policies and procedures.While we originate fixed-rate and adjustable-rate loans, our ability to generate each type of loan depends upon relative borrower demand and the pricing levels as set in the local marketplace by competing banks, thrifts, credit unions, and mortgage banking companies. Our volume of real estate loan originations is influenced significantly by market interest rates. As a result, the volume of our real estate loan originations can vary from period to period.
Consistent with our interest rate risk strategy, in the low interest rate environment that has existed in recent years, we have sold on a servicing-released basis the majority of our one-to-four family residential mortgage loans with maturities over 10 years that we have originated. All loan applications originated from 2009 through the first part of 2017, that we had the intention of selling, were processed through MDS. MDS has since been dissolved and we started directly underwriting and selling loans in the secondary market ourselves in 2017. Through the Fraternity acquisition, we obtained the necessary software and personnel to be able to process loans we intend to sell in-house. We receive a premium for each loan that is delivered or sold to the secondary market. When a loan is sold, it is sold with servicing released and in most cases, with recourse that we provide to the purchaser in the event of (i) delinquency within the first 90 days of sale or (ii) breaches of customary representations and warranties to the buyers. As a result of the acquisitions, the amount of normal attrition and prepayments associated with the one-to-four family residential mortgage portfolio has increased significantly. Consequently, we have begun to portfolio some of our residential mortgage loan originations versus selling them in the secondary market so as to maintain our loan diversification going forward.
From time to time, we have purchased loan participations in commercial loans in which we are not the lead lender that are secured by real estate or other assets within the state of Maryland. With regard to all loan participations, we follow our customary loan underwriting and approval policies, and although we may be only approving and servicing a portion of the loan, we underwrite the loan request as if we had originated the loan to ensure cash flow and collateral are sufficient. At March 31, 2017, our loan participations totaled $14.9 million, or 4.4% of our total loan portfolio, the majority of which were in our primary market area. Of the $14.9 million in participations, $126,000 is on nonaccrual at March 31, 2017, a decrease of $510,000 from March 31, 2016. We do not specifically look to loan participations as a means to increase loan volume; however, we do look at opportunities for participations, if presented, on a case by case basis.
In addition to loan participations, we may look to purchase pools or portfolios of loans from time-to-time to enhance growth and earnings potential. As with participations, we follow our customary loan underwriting standards when reviewing a particular pool of loans to determine if the purchase makes sense. Based upon the number of loans within a particular pool, we may not be able to review the loan pool on a loan-by-loan basis, but will review the loan data requested on the entire pool, such as delinquency, credit scores, and appraised values and examine an adequate sample of the individual loans that make up the loan pool. In March 2017 we purchased $23.4 million of one-to-four family jumbo residential mortgage loans in two separate pools at a premium of 102.5% each. The purchases were funded with approximately $12.5 million in cash and $11.5 million in borrowings from the FHLB. We entered into a cash flow hedge with respect to the borrowings to lock in a long-term cost of funds and minimize some of the interest rate risk associated with purchasing longer-term assets.
In May 2016, in connection with the acquisition of Fraternity Federal Savings and Loan, we acquired approximately $108.7 million in outstanding loans. As of March 31, 2017, the outstanding balance of those acquired from Fraternity totaled $91.2 million, or 26.9% of gross loans, of which $28,000 are on non-accrual. The remaining loans are performing as agreed under their current terms at March 31, 2017. In September 2015, prior to Fraternity, we acquired Fairmount Bank and approximately $53.6 million in outstanding loans, of which $37.9 million remain outstanding at March 31, 2017. The outstanding Fairmount loans make-up 11.2% of gross loans at March 31, 2017.
As noted earlier, we may sell residential mortgage loans into the secondary market at a premium. We also have the ability to sell certain pools of loans to increase liquidity, improve current earnings, divest of a concentration of loans, or manage problem credits. When selling a pool of loans, we analyze whether the sale makes sense from a profit standpoint and then look for several bids from various parties so as to maximize the price with respect to the sale. In fiscal 2017 we sold two pools of loans with a combined book value of $4.5 million. Both pools consisted primarily of one-to-four family non-owner occupied residential mortgage (“residential investor”) loans acquired in the Fairmount Bank acquisition. The financial performance of the residential investor loans sold was deteriorating and the underlying collateral did not provide sufficient support. Selling the pool of loans made the most sense with respect to managing these problem credits and reducing any additional losses going forward.
The following table shows our loan origination, repayment and sale activities for the fiscal years indicated.
| | | Year Ended March 31, | |
| | | 2017 | | | 2016 | |
| | | (In thousands) | |
| | | | | | | | | |
Total loans at beginning of year | | $ | 222,767 | | | $ | 160,388 | |
Loans originated: | | | | | | | | |
Real estate loans: | | | | | | | | |
Residential mortgage loans: | | | | | | | | |
One- to four-family residential | | | 21,837 | | | | 15,715 | |
One- to four-family investor | | | - | | | | - | |
Commercial construction | | | 4,759 | | | | 416 | |
Commercial | | | 25,397 | | | | 21,959 | |
Total real estate loans | | | 51,993 | | | | 38,090 | |
| | | | | | | | | |
Commercial business loans | | | 10,117 | | | | 7,607 | |
Consumer: | | | | | | | | |
Home equity loans and lines of credit | | | 5,920 | | | | 3,447 | |
Other consumer | | | 112 | | | | 34 | |
Total consumer loans | | | 6,032 | | | | 3,481 | |
| | | | | | | | | |
Total loans originated | | | 68,142 | | | | 49,178 | |
| | | | | | | | | |
Fraternity Bank loans acquired | | | 108,804 | | | | - | |
Residential Jumbo loan pool purchase | | | 23,422 | | | | - | |
Automobile loan pool purchased | | | - | | | | 2,971 | |
Fairmount Bank loans acquired | | | - | | | | 53,578 | |
| | | | | | | | | |
Deduct: | | | | | | | | |
Principal repayments | | | 62,724 | | | | 31,930 | |
Loans sold in the secondary market | | | 6,640 | | | | 4,395 | |
Transferred to foreclosed real estate | | | 127 | | | | - | |
Unused lines of credit | | | 14,644 | | | | 7,023 | |
| | | | | | | | | |
Net loan activity | | | 116,233 | | | | 62,379 | |
| | | | | | | | | |
Total loans at end of year | | $ | 339,000 | | | $ | 222,767 | |
Loan Approval Procedures and Authority.Our lending activities follow written, non-discriminatory underwriting standards and loan origination procedures developed by management and approved by our board of directors. The loan approval process is intended to assess the borrower’s ability to repay the loan and the value of the collateral that will secure the loan. To assess the borrower’s ability to repay, our policies provide for the review of the borrower’s employment and credit history and information on the historical and projected income and expenses of the borrower. We will also evaluate a guarantor when a guarantee is provided as part of the loan.
Hamilton Bank’s policies and loan approval limits are established by our board of directors. Designated Bank officers and loan committee are assigned levels of loan authority. Having loan authority gives the individuals or committee the ability to authorize the extension of credit. Every extension of credit requires two signatures, one of which must have sufficient authority given the risk rating and aggregate exposure. The second approver cannot be an individual assigned less loan authority than the sponsor of the loan. Loan authority is recommended by the Chief Credit Officer and approved by the Loan Committee.All loan authorities are reviewed and confirmed annually by the Loan Committee. The Chief Credit Officer, and or the President may recommend interim changes to establish loan limits or assign loan authority for new officers. These interim changes shall be presented to the Loan Committee for approval at its next regularly scheduled meeting. The Chief Credit Officer and/or the President also have the authority to reduce or remove loan authority. Such changes in lending authority are to be reported to Loan Committee after the fact.
Securities Activities
General.Our investment policy is developed by management and approved by the board of directors. The objectives of the policy are to: (i) ensure adequate liquidity for loan demand and deposit fluctuations, and to allow us to alter our liquidity position to meet both day-to-day and long-term changes in assets and liabilities; (ii) manage interest rate risk in accordance with our interest rate risk policy; (iii) provide collateral for pledging requirements; (iv) maximize return on our investments; and (v) maintain a balance of high quality diversified investments to minimize risk.
Our Investment Committee, consisting of our President and Chief Executive Officer, our Chief Financial Officer, and Controller is responsible for implementing our investment policy, including approval of investment strategies and monitoring investment performance. The President and Chief Financial Officer are authorized to execute purchases or sales of securities. The board of directors regularly reviews our investment strategies and the market value of our investment portfolio.
We account for investment and mortgage-backed securities in accordance with Accounting Standards Codification (ASC) Topic 320, “Investments – Debt and Equity Securities.” ASC 320 requires that investments be categorized as held-to maturity, trading, or available for sale. Our securities are generally categorized as available-for-sale based on our need to meet daily liquidity needs and to take advantage of profits that may occur from time to time. At March 31, 2017, all of our securities were classified as available for sale.
Federally chartered savings institutions have authority to invest in various types of assets, including government-sponsored enterprise obligations, securities of various federal agencies, residential mortgage-backed securities, certain certificates of deposit of insured financial institutions, overnight and short-term loans to other banks, corporate debt instruments, debt instruments of municipalities and Fannie Mae and Freddie Mac equity securities. At March 31, 2017, our investment portfolio consisted almost entirely of securities and mortgage-backed securities issued by U.S. Government agencies, municipalities or U.S. Government-sponsored enterprises. At that same date we also held $2.0 million of corporate bonds, which equaled approximately 2.0% of our total investment securities based upon the fair value of such securities.The principal and interest on our mortgage-backed securities are guaranteed by the issuing entity.
At March 31, 2017, we owned just over $2.0 million in Federal Home Loan Bank of Atlanta stock. As a member of Federal Home Loan Bank of Atlanta, we are required to purchase stock in the Federal Home Loan Bank of Atlanta. At March 31, 2017, we had no investments in a single company or entity (other than an agency of the U.S. Government, a municipality or a U.S. Government-sponsored enterprise) that had an aggregate book value in excess of 10% of our equity.
In fiscal 2017, our investment balances increased through the acquisition of Fraternity and the build-up of excess cash. Prior to fiscal 2017, our investment balances had decreased due to either calls or maturing bonds, normal principal pay downs on our mortgage backed securities, or the sale of certain securities. The proceeds from these reductions in securities have been used to fund loan activity and acquisitions, and to a lesser extent reinvested in investment securities.
Amortized Cost and Estimated Fair Value of Securities.The following table sets forth certain information regarding the amortized cost and estimated fair values of our securities as of the dates indicated.
| | | At March 31, | |
| | | 2017 | | | 2016 | | | 2015 | |
| | | Amortized Cost | | | Fair Value | | | Amortized Cost | | | Fair Value | | | Amortized Cost | | | Fair Value | |
| | | (In thousands) | |
Mortgage-backed securities: | | | | | | | | | | | | | | | | | | | | | | | | |
Fannie Mae | | $ | 35,034 | | | $ | 34,473 | | | $ | 27,774 | | | $ | 27,712 | | | $ | 44,083 | | | $ | 43,831 | |
Ginnie Mae | | | 10,003 | | | | 9,924 | | | | 5,988 | | | | 6,006 | | | | 2,415 | | | | 2,456 | |
Freddie Mac | | | 30,593 | | | | 30,132 | | | | 20,178 | | | | 20,222 | | | | 25,281 | | | | 25,070 | |
Other | | | 6,365 | | | | 6,304 | | | | - | | | | - | | | | - | | | | - | |
Total mortgage-backed securities | | | 81,995 | | | | 80,833 | | | | 53,940 | | | | 53,940 | | | | 71,779 | | | | 71,357 | |
U.S. Government agencies | | | 3,525 | | | | 3,512 | | | | 10,519 | | | | 10,533 | | | | 17,509 | | | | 17,312 | |
Municipal bonds | | | 17,096 | | | | 16,168 | | | | 4,061 | | | | 4,112 | | | | 2,149 | | | | 2,317 | |
Corporate bonds | | | 2,000 | | | | 1,916 | | | | 2,000 | | | | 1,899 | | | | 2,000 | | | | 1,953 | |
| | | | | | | | | | | | | | | | | | | | | | | | | |
Total | | $ | 104,616 | | | $ | 102,429 | | | $ | 70,520 | | | $ | 70,484 | | | $ | 93,437 | | | $ | 92,939 | |
Portfolio Maturities and Yields.The composition and maturities of the debt investment securities portfolio at March 31, 2017 are summarized in the following table. Maturities are based on the final contractual payment dates, and do not reflect the impact of prepayments or early redemptions that may occur.
| | | At March 31, 2017 | |
| | | One Year or Less | | | More Than One Year Through Five Years | | | More Than Five Years Through Ten Years | | | More Than Ten Years | | | Total Securities | |
| | | Amortized Cost | | | Weighted Average Yield | | | Amortized Cost | | | Weighted Average Yield | | | Amortized Cost | | | Weighted Average Yield | | | Amortized Cost | | | Weighted Average Yield | | | Amortized Cost | | | Estimated Fair Value | | | Weighted Average Yield | |
| | | (Dollars in thousands) | |
Mortgage-backed securities: | | | | | | | | | | | | | | | | | | | | | | | | | | | | | | | | | | | | | | | | | | | | |
Fannie Mae | | $ | - | | | | 0.00 | % | | $ | 4,518 | | | | 3.91 | % | | $ | 3,456 | | | | 2.36 | % | | $ | 27,060 | | | | 2.42 | % | | $ | 35,034 | | | $ | 34,473 | | | | 2.61 | % |
Ginnie Mae | | | - | | | | - | | | | 1 | | | | 3.24 | | | | 44 | | | | 3.29 | | | | 9,958 | | | | 2.71 | | | | 10,003 | | | | 9,924 | | | | 2.71 | |
Freddie Mac | | | - | | | | - | | | | - | | | | - | | | | 4,257 | | | | 2.62 | | | | 26,336 | | | | 2.54 | | | | 30,593 | | | | 30,132 | | | | 2.55 | |
Other | | | - | | | | - | | | | 525 | | | | 3.94 | | | | - | | | | - | | | | 5,840 | | | | 3.52 | | | | 6,365 | | | | 6,304 | | | | 3.52 | |
Total mortgage-backed securities | | | - | | | | - | | | | 5,044 | | | | 3.9 | % | | | 7,757 | | | | 2.51 | % | | | 69,194 | | | | 2.60 | % | | | 81,995 | | | | 80,833 | | | | 2.67 | % |
U.S. Government agencies | | | - | | | | - | | | | 2,781 | | | | 1.81 | | | | 744 | | | | 2.14 | | | | - | | | | - | | | | 3,525 | | | | 3,512 | | | | 1.88 | |
Municipal bonds | | | - | | | | - | | | | 1,453 | | | | 2.54 | | | | 2,794 | | | | 3.40 | | | | 12,849 | | | | 3.56 | | | | 17,096 | | | | 16,168 | | | | 3.45 | |
Corporate bonds | | | - | | | | - | | | | - | | | | - | | | | 2,000 | | | | 2.20 | | | | - | | | | - | | | | 2,000 | | | | 1,916 | | | | 2.20 | |
| | | | | | | | | | | | | | | | | | | | | | | | | | | | | | | | | | | | | | | | | | | | | |
Total | | $ | - | | | | 0.00 | % | | $ | 9,278 | | | | 3.07 | % | | $ | 13,295 | | | | 2.63 | % | | $ | 82,043 | | | | 2.75 | % | | $ | 104,616 | | | $ | 102,429 | | | | 2.76 | % |
Sources of Funds
General.Deposits, scheduled amortization and prepayments of loan principal, maturities and calls of securities and funds provided by operations are our primary sources of funds for use in lending, investing and for other general purposes. We historically have not used Federal Home Loan Bank of Atlanta (FHLB) advances to fund our operations. However, beginning in the second half of fiscal 2015, we began to once again borrow from the FHLB as a means to fund our loan growth, including $11.5 million in FHLB advances in March 2017 that were used to fund the purchase of $23.4 million of jumbo residential loans. Additionally, in fiscal 2016 and 2017 we acquired $10.5 million and $15.0 million of FHLB advances in the acquisitions of Fairmount and Fraternity, respectively. As of March 31, 2017, we have $35.6 million in advances outstanding from the FHLB.
Deposits.We offer deposit products having a range of interest rates and terms. We currently offer statement savings accounts, NOW accounts, noninterest-bearing demand accounts, health savings accounts (HSA), money market accounts and certificates of deposit. We also offer the Certificate of Deposit Account Registry Service (CDARS) program to our customers. Our strategic plan includes a greater emphasis on developing commercial business activities, both deposit and lending customer relationships.
Deposit flows are significantly influenced by general and local economic conditions, changes in prevailing interest rates, internal pricing decisions and competition. Our deposits are primarily obtained from areas surrounding our branch offices. In order to attract and retain deposits we rely on paying competitive interest rates and providing quality service.
Based on experience, we believe that our deposits are relatively stable. However, the ability to attract and maintain deposits and the rates paid on these deposits, has been and will continue to be significantly affected by market conditions. At March 31, 2017, $247.6 million, or 60.1% of our total deposit accounts were certificates of deposit, of which $124.9 million had maturities of one year or less.
The following tables set forth the distribution of our average deposit accounts, by account type, for the years indicated. Our focus has been on growing our lower costing core deposits (considered all deposits other certificates of deposit) and relying less on originating certificates of deposit.
| | | For the Years Ended March 31, | |
| | | 2017 | | | 2016 | | | 2015 | |
| | | Average Balance | | | Percent | | | Weighted Average Rate | | | Average Balance | | | Percent | | | Weighted Average Rate | | | Average Balance | | | Percent | | | Weighted Average Rate | |
| | | (Dollars in thousands) | |
Deposit type: | | | | | | | | | | | | | | | | | | | | | | | | | | | | | | | | | | | | |
Certificates of deposit | | $ | 259,721 | | | | 63.8 | % | | | 0.89 | % | | $ | 172,064 | | | | 65.0 | % | | | 0.96 | % | | $ | 160,764 | | | | 69.3 | % | | | 1.00 | % |
Money market | | | 61,568 | | | | 15.1 | | | | 0.37 | | | | 35,124 | | | | 13.3 | | | | 0.17 | | | | 29,168 | | | | 12.6 | | | | 0.12 | |
Statement savings | | | 43,527 | | | | 10.7 | | | | 0.15 | | | | 25,843 | | | | 9.8 | | | | 0.10 | | | | 15,343 | | | | 6.6 | | | | 0.05 | |
Noninterest bearing demand | | | 24,078 | | | | 5.9 | | | | - | | | | 19,282 | | | | 7.3 | | | | - | | | | 16,765 | | | | 7.2 | | | | - | |
NOW accounts | | | 18,333 | | | | 4.5 | | | | 0.03 | | | | 12,447 | | | | 4.7 | | | | 0.03 | | | | 9,967 | | | | 4.3 | | | | 0.03 | |
| | | | | | | | | | | | | | | | | | | | | | | | | | | | | | | | | | | | | |
Total deposits | | $ | 407,227 | | | | 100.0 | % | | | 0.64 | % | | $ | 264,760 | | | | 100.0 | % | | | 0.66 | % | | $ | 232,007 | | | | 100.0 | % | | | 0.71 | % |
The following table sets forth certificates of deposit classified by interest rate as of the dates indicated.
| | | At March 31, | |
| | | 2017 | | | 2016 | | | 2015 | |
| | | (In thousands) | |
Interest Rate: | | | | | | | | | | | | |
Less than 2.00% | | $ | 241,121 | | | $ | 181,572 | | | $ | 134,569 | |
2.00% to 2.99% | | | 6,512 | | | | 13,459 | | | | 15,127 | |
3.00% to 3.99% | | | - | | | | - | | | | - | |
4.00% to 4.99% | | | - | | | | - | | | | - | |
5.00% and above | | | - | | | | - | | | | - | |
| | | | | | | | | | | | | |
Total | | $ | 247,633 | | | $ | 195,031 | | | $ | 149,696 | |
Maturities ofCertificates of Deposit Accounts.The following table sets forth the amount and maturities of certificates of deposit accounts at the dates indicated.
| | | At March 31, 2017 | |
| | | Period to Maturity | |
| | | Less Than or Equal to One Year | | | More Than One to Two Years | | | More Than Two to Three Years | | | More Than Three Years | | | Total | | | Percent of Total | |
| | | (Dollars in thousands) | |
Interest Rate Range: | | | | | | | | | | | | | | | | | | | | | | | | |
Less than 2.00% | | $ | 124,057 | | | $ | 59,929 | | | $ | 23,948 | | | $ | 33,187 | | | $ | 241,121 | | | | 97.4 | % |
2.00% to 2.99% | | | 804 | | | | 1,996 | | | | 2,056 | | | | 1,656 | | | | 6,512 | | | | 2.6 | |
3.00% to 3.99% | | | - | | | | - | | | | - | | | | - | | | | - | | | | - | |
4.00% to 4.99% | | | - | | | | - | | | | - | | | | - | | | | - | | | | - | |
5.00% to 5.99% | | | - | | | | - | | | | - | | | | - | | | | - | | | | - | |
| | | | | | | | | | | | | | | | | | | | | | | | | |
Total | | $ | 124,861 | | | $ | 61,925 | | | $ | 26,004 | | | $ | 34,843 | | | $ | 247,633 | | | | 100.0 | % |
As of March 31, 2017, the aggregate amount of outstanding certificates of deposit at Hamilton Bank in amounts greater than or equal to $100,000 was approximately $103.4 million. The following table presents the maturity of these certificates of deposit at such date.
Period to Maturity | | At March 31, 2017 | |
| | | (In thousands) | |
| | | | | |
Three months or less | | $ | 15,520 | |
Over three through six months | | | 9,899 | |
Over six months through one year | | | 21,904 | |
Over one year to three years | | | 38,958 | |
Over three years | | | 17,118 | |
| | | | | |
Total | | $ | 103,399 | |
Borrowed Funds. As a member of the FHLB, Hamilton Bank is eligible to obtain advances upon the security of the Federal Home Loan Bank common stock owned and certain loan products, provided certain standards related to credit-worthiness have been met. Federal Home Loan Bank advances are available pursuant to several credit programs, each of which has its own interest rate and range of maturities. At March 31, 2017, based on available collateral, we had the ability to borrow approximately $88.2 million from the Federal Home Loan Bank of Atlanta. We historically have not used Federal Home Loan Bank of Atlanta (FHLB) advances to fund our operations. However, beginning in the second half of fiscal 2015, we began to once again borrow from the FHLB as a means to fund our loan growth, including $11.5 million in FHLB advances in March 2017 that were used to supplement the purchase of two loan pools totaling $23.4 million of jumbo residential loans. Additionally, in fiscal 2016 and 2017 we acquired $10.5 million and $15.0 million of FHLB advances in the acquisition of Fairmount and Fraternity, respectively. As of March 31, 2017, we have $35.6 million in advances outstanding from the FHLB as presented in the table below.
| | | March 31, 2017 | | March 31, 2016 |
| | | Amount | | | Rate | | | Maturity Date | | Amount | | | Rate | | Maturity Date |
FHLB advance | | | 5,550,000 | | | | 0.94 | % | | 6/9/2017 | | | 2,000,000 | | | | 0.43 | % | 6/3/2016 |
FHLB advance | | | 6,000,000 | | | | 0.93 | % | | 6/29/2017 | | | 2,000,000 | | | | 0.60 | % | 9/6/2016 |
FHLB advance * | | | 1,000,000 | | | | 4.24 | % | | 7/31/2017 | | | 1,500,000 | | | | 0.75 | % | 3/31/2017 |
FHLB advance ** | | | 5,000,000 | | | | 4.28 | % | | 7/31/2017 | | | 1,000,000 | | | | 4.24 | % | 7/31/2017 |
FHLB advance * | | | 1,000,000 | | | | 4.01 | % | | 8/21/2017 | | | 1,000,000 | | | | 4.01 | % | 8/21/2017 |
FHLB advance * | | | 1,000,000 | | | | 0.91 | % | | 8/31/2017 | | | 1,000,000 | | | | 0.91 | % | 8/31/2017 |
FHLB advance * | | | 1,500,000 | | | | 3.23 | % | | 11/24/2017 | | | 1,500,000 | | | | 3.23 | % | 11/24/2017 |
FHLB advance * | | | 1,500,000 | | | | 3.40 | % | | 11/27/2017 | | | 1,500,000 | | | | 3.40 | % | 11/27/2017 |
FHLB advance * | | | 1,000,000 | | | | 2.60 | % | | 7/2/2018 | | | 1,000,000 | | | | 2.60 | % | 7/2/2018 |
FHLB advance * | | | 1,000,000 | | | | 3.05 | % | | 7/3/2018 | | | 1,000,000 | | | | 3.05 | % | 7/3/2018 |
FHLB advance ** | | | 5,000,000 | | | | 3.94 | % | | 7/23/2018 | | | 1,000,000 | | | | 2.60 | % | 10/2/2018 |
FHLB advance ** | | | 5,000,000 | | | | 3.38 | % | | 9/19/2018 | | | - | | | | | | |
FHLB advance * | | | 1,000,000 | | | | 2.60 | % | | 10/2/2018 | | | - | | | | | | |
| | | | 35,550,000 | | | | | | | | | | 14,500,000 | | | | | | |
Premium on FHLB advances assumed | | | 547,650 | | | | | | | | | | 305,237 | | | | | | |
Total FHLB advances | | $ | 36,097,650 | | | | | | | | | $ | 14,805,237 | | | | | | |
* Advances assumed in the Fairmount Bancorp acquisition
** Advances assumed in the Fraternity Community Bancorp acquisition
Hamilton Bank may also borrow up to $5.0 million from a correspondent bank under a secured federal funds line of credit, and $1.0 million under an unsecured line of credit. We would be required to pledge investment securities to draw upon the secured line of credit. During fiscal 2017, there was nothing drawn upon either line of credit.
Employees
As of March 31, 2017, we had 74 full-time equivalent employees. Our employees are not represented by any collective bargaining group. Management believes that we have a good working relationship with our employees.
Subsidiary Activities
Hamilton Bancorp has one direct subsidiary, Hamilton Bank. At March 31, 2017, Hamilton Bank has five wholly owned subsidiaries including 3110 FC, LLC, a Maryland limited liability company that was formed to hold other real estate owned acquired through foreclosure or deed-in-lieu of foreclosure. On May 13 , 2016, in connection with the acquisition of Fraternity Community Bancorp, the Bank acquired four additional subsidiaries: 4819 Palmer Avenue LLC, a limited liability company organized under the laws of the State of Maryland ("4819 Palmer"); 764 Washington Boulevard LLC, a limited liability company organized under the laws of the State of Maryland ("764 WB LLC"); 764 Washington Boulevard II LLC, a limited liability company organized under the laws of the State of Maryland ("764 WB LLC II"); and Fraternity Insurance Agency, Inc., an inactive corporation organized under the laws of the State of Maryland. 4819 Palmer, 764 WB LLC and 764 WB LLC II were each formed by Fraternity Federal Savings & Loan Association to hold other real estate owned.
REGULATION AND SUPERVISION
General
As a federal savings bank, Hamilton Bank is subject to examination and regulation by the Office of the Comptroller of the Currency (the “OCC”), and is also subject to examination by the Federal Deposit Insurance Corporation (the “FDIC’). The federal system of regulation and supervision establishes a comprehensive framework of activities in which Hamilton Bank may engage and is intended primarily for the protection of depositors and the FDIC’s Deposit Insurance Fund, and not for the protection of stockholders. Under this system of federal regulation, financial institutions are periodically examined to ensure that they satisfy applicable standards with respect to matters such as their capital adequacy, assets, management, earnings, liquidity and sensitivity to market interest rates. Hamilton Bank is also regulated to a lesser extent by the Board of Governors of the Federal Reserve System (the “Federal Reserve Board”), which governs the reserves to be maintained against deposits and other matters. Hamilton Bank must comply with the consumer protection regulations issued by the Consumer Financial Protections Bureau. Hamilton Bank also is a member of and owns stock in the Federal Home Loan Bank of Atlanta, which is one of the twelve regional banks in the Federal Home Loan Bank System. The OCC examines Hamilton Bank and prepares reports for the consideration of its board of directors on any operating deficiencies. Hamilton Bank’s relationship with its depositors and borrowers is also regulated to a great extent by federal law and, to a much lesser extent, state law, especially in matters concerning the ownership of deposit accounts, the form and content of Hamilton Bank’s loan documents and certain consumer protection matters.
As a savings and loan holding company, Hamilton Bancorp is subject to examination and supervision by, and is required to file certain reports with, the Federal Reserve Board. Hamilton Bancorp is also subject to the rules and regulations of the Securities and Exchange Commission under the federal securities laws.
Set forth below are certain material regulatory requirements that are applicable to Hamilton Bank and Hamilton Bancorp. This description of statutes and regulations is not intended to be a complete description of such statutes and regulations and their effects on Hamilton Bank and Hamilton Bancorp. Any change in these laws or regulations, whether by Congress or the applicable regulatory agencies, could have a material adverse impact on Hamilton Bancorp, Hamilton Bank and their operations.
Federal Banking Regulation
Business Activities.A federal savings bank derives its lending and investment powers from the Home Owners’ Loan Act, as amended, and applicable federal regulations. Under these laws and regulations, Hamilton Bank may invest in mortgage loans secured by residential and nonresidential real estate, commercial business loans and consumer loans, certain types of debt securities and certain other assets, subject to applicable limits. The Dodd-Frank Act authorized, for the first time, the payment of interest on commercial checking accounts. Hamilton Bank may also establish subsidiaries that may engage in certain activities not otherwise permissible for Hamilton Bank, including real estate investment and securities and insurance brokerage.
Capital Requirements. Federal regulations require FDIC-insured depository institutions to meet several minimum capital standards: a common equity Tier 1 capital to risk-based assets ratio of 4.5%, a Tier 1 capital to risk-based assets ratio of 6.0%, a total capital to risk-based assets of 8%, and a 4% Tier 1 capital to total assets leverage ratio. The existing capital requirements were effective January 1, 2015 and are the result of a final rule implementing regulatory amendments based on recommendations of the Basel Committee on Banking Supervision and certain requirements of the Dodd-Frank Act.
For purposes of the regulatory capital requirements, common equity Tier 1 capital is generally defined as common stockholders’ equity and retained earnings. Tier 1 capital is generally defined as common equity Tier 1 and additional Tier 1 capital. Additional Tier 1 capital includes certain noncumulative perpetual preferred stock and related surplus and minority interests in equity accounts of consolidated subsidiaries. Total capital includes Tier 1 capital (common equity Tier 1 capital plus additional Tier 1 capital) and Tier 2 capital. Tier 2 capital is comprised of capital instruments and related surplus, meeting specified requirements, and may include cumulative preferred stock and long-term perpetual preferred stock, mandatory convertible securities, intermediate preferred stock and subordinated debt. Also included in Tier 2 capital is the allowance for loan and lease losses limited to a maximum of 1.25% of risk-weighted assets and, for institutions that have exercised an opt-out election regarding the treatment of Accumulated Other Comprehensive Income (“AOCI”), up to 45% of net unrealized gains on available-for-sale equity securities with readily determinable fair market values. Institutions that have not exercised the AOCI opt-out have AOCI incorporated into common equity Tier 1 capital (including unrealized gains and losses on available-for-sale-securities). Hamilton Bank exercised the opt out option.Calculation of all types of regulatory capital is subject to deductions and adjustments specified in the regulations.
In determining the amount of risk-weighted assets for purposes of calculating risk-based capital ratios, all assets, including certain off-balance sheet exposures (e.g., recourse obligations, direct credit substitutes, residual interests) are multiplied by a risk weight factor assigned by the regulations based on the risks believed inherent in the type of asset. Higher levels of capital are required for asset categories believed to present greater risk. For example, a risk weight of 0% is assigned to cash and U.S. government securities, a risk weight of 50% is generally assigned to prudently underwritten first lien one to four- family residential mortgages, a risk weight of 100% is assigned to commercial and consumer loans, a risk weight of 150% is assigned to certain past due loans and a risk weight of between 0% to 600% is assigned to permissible equity interests, depending on certain specified factors.
In addition to establishing the minimum regulatory capital requirements, the regulations limit capital distributions and certain discretionary bonus payments to management if the institution does not hold a “capital conservation buffer” consisting of 2.5% of common equity Tier 1 capital to risk-weighted asset above the amount necessary to meet its minimum risk-based capital requirements. The capital conservation buffer requirement is being phased in beginning January 1, 2016 at 0.625% of risk-weighted assets and increasing each year until fully implemented at 2.5% of risk-weighted assets on January 1, 2019. The buffer requirement increased to 1.25% as of January 1, 2017.
In assessing an institution’s capital adequacy, the OCC takes into consideration, not only these numeric factors, but qualitative factors as well, and has the authority to establish higher capital requirements for individual institutions if deemed necessary.
At March 31, 2017, Hamilton Bank’s capital exceeded all applicable regulatory requirements.
Loans to One Borrower.Generally, a federal savings bank may not make a loan or extend credit to a single or related group of borrowers in excess of 15% of unimpaired capital and surplus. An additional amount may be loaned, equal to 10% of unimpaired capital and surplus, if the loan is secured by readily marketable collateral, which generally does not include real estate. As of March 31, 2017, Hamilton Bank was in compliance with the loans-to-one-borrower limitations.
Qualified Thrift Lender Test.As a federal savings bank, Hamilton Bank must satisfy the qualified thrift lender, or “QTL,” test. Under the QTL test, Hamilton Bank must either (i) maintain at least 65% of its “portfolio assets” in “qualified thrift investments” in at least nine months of the most recent 12 months or (ii) qualify as a “domestic building and loan association” as defined in the Internal Revenue Code. “Portfolio assets” generally means total assets of a savings institution, less the sum of specified liquid assets up to 20% of total assets, goodwill and other intangible assets, and the value of property used in the conduct of the savings institution’s business. A federal savings bank that fails the QTL test must operate under specified restrictions specified in the Home Owners’ Loan Act. The Dodd-Frank Act made noncompliance with the QTL Test subject to enforcement action for a violation of law. At March 31, 2017, Hamilton Bank held 83.29% of its “portfolio assets” in “qualified thrift investments,” and satisfied the QTL Test.
Capital Distributions.Federal regulations govern capital distributions by a federal savings bank, which include cash dividends, stock repurchases and other transactions charged to the capital account. A federal savings bank must file an application with the OCC for approval of a capital distribution if:
| ● | the total capital distributions for the applicable calendar year exceed the sum of the savings bank’s net income for that year to date plus the savings bank’s retained net income for the preceding two years; |
| | ● | the savings bank would not be at least adequately capitalized following the distribution; |
| | ● | the distribution would violate any applicable statute, regulation, agreement or regulatory condition; or |
| | ● | the savings bank is not eligible for expedited treatment of its filings. |
Even if an application is not otherwise required, every savings bank that is a subsidiary of a savings and loan holding company, such as Hamilton Bank, must still file a notice with the Federal Reserve Board at least 30 days before the board of directors declares a dividend or approves a capital distribution.
A notice or application related to a capital distribution may be disapproved if:
| ● | the federal savings bank would be undercapitalized following the distribution; |
| | ● | the proposed capital distribution raises safety and soundness concerns; or |
| | ● | the capital distribution would violate a prohibition contained in any statute, regulation, or agreement. |
In addition, the Federal Deposit Insurance Act provides that an insured depository institution may not make any capital distribution if, after making such distribution, the institution would fail to satisfy any applicable regulatory capital requirement. A federal savings bank also may not make a capital distribution that would reduce its regulatory capital below the amount required for the liquidation account established in connection with its conversion to stock form. In addition, Hamilton Bank’s ability to pay dividends will now be limited if Hamilton Bank does not have the capital conservation buffer required by the new capital rules, which may limit the ability of Hamilton Bancorp to pay dividends to its stockholders. See — “Capital Requirements.”
Community Reinvestment Act and Fair Lending Laws. All federal savings banks have a responsibility under the Community Reinvestment Act and related regulations to help meet the credit needs of their communities, including low- and moderate-income borrowers. In connection with its examination of a federal savings bank, the OCC is required to assess the federal savings bank’s record of compliance with the Community Reinvestment Act. A savings bank’s failure to comply with the provisions to the Community Reinvestment Act could, at a minimum, result in denial of certain corporate applications such as branch mergers, or in restrictions on its activities. In addition, the Equal Credit Opportunity Act and the Fair Housing Act prohibit lenders from discriminating in their lending practices on the basis of characteristics specified in those statutes. The failure to comply with the Equal Credit Opportunity Act and the Fair Housing Act could result in enforcement actions by the OCC, as well as other federal regulatory agencies and the Department of Justice. Hamilton Bank received a “satisfactory” Community Reinvestment Act rating in its last federal examination in 2015.
Transactions with Related Parties. A federal savings bank’s authority to engage in transactions with its affiliates is limited by Sections 23A and 23B of the Federal Reserve Act and federal regulation. An affiliate is generally a company that controls, or is under common control with an insured depository institution, such as Hamilton Bank. Hamilton Bancorp is an affiliate of Hamilton Bank because of its control of Hamilton Bank. In general, transactions between an insured depository institution and its affiliates are subject to certain quantitative limits and collateral requirements. In addition, federal regulations prohibit a savings bank from lending to any of its affiliates that are engaged in activities that are not permissible for bank holding companies and from purchasing the securities of any affiliate, other than a subsidiary. Finally, transactions with affiliates must be consistent with safe and sound banking practices, not involve the purchase of low-quality assets and be on terms that are as favorable to the institution as comparable transactions with non-affiliates. Federal regulations require savings banks to maintain detailed records of all transactions with affiliates.
Hamilton Bank’s authority to extend credit to its directors, executive officers and 10% stockholders, as well as to entities controlled by such persons, is currently governed by the requirements of Sections 22(g) and 22(h) of the Federal Reserve Act and Regulation O of the Federal Reserve Board. Among other things, these provisions generally require that extensions of credit to insiders:
| | ● | be made on terms that are substantially the same as, and follow credit underwriting procedures that are not less stringent than those prevailing for comparable transactions with unaffiliated persons and that do not involve more than the normal risk of repayment or present other unfavorable features; and |
| | ● | not to exceed certain limitations on the amount of credit extended to such persons, individually and in the aggregate, which limits are based, in part, on the amount of Hamilton Bank’s capital. |
In addition, extensions of credit in excess of certain limits must be approved by Hamilton Bank’s loan committee or board of directors. Extensions of credit to executive officers are subject to additional limits based on the type of extension involved.
Enforcement. The OCC has primary enforcement responsibility over federal savings banks and has the authority to bring enforcement action against all “institution-affiliated parties,” including officers, directors and employees, as well as stockholders, attorneys, appraisers and accountants who knowingly or recklessly participate in wrongful action likely to have an adverse effect on an insured institution. Formal enforcement action by the OCC may range from the issuance of a capital directive or cease and desist order, to removal of officers and/or directors of the institution and the appointment of a receiver or conservator. Civil penalties cover a wide range of violations and actions, and range up to $25,000 per day, unless a finding of reckless disregard is made, in which case penalties may be as high as $1 million per day. The FDIC also has the authority to terminate deposit insurance or to recommend to the OCC that enforcement action be taken with respect to a particular savings bank. If action is not taken by the OCC, the FDIC has authority to take action under specified circumstances.
Standards for Safety and Soundness. Federal law requires each federal banking agency to prescribe certain standards for all insured depository institutions. These standards relate to, among other things, internal controls, information systems and audit systems, loan documentation, credit underwriting, interest-rate risk exposure, asset growth, compensation and other operational and managerial standards as the agency deems appropriate. Interagency guidelines set forth the safety and soundness standards that the federal banking agencies use to identify and address problems at insured depository institutions before capital becomes impaired. If the appropriate federal banking agency determines that an institution fails to meet any standard prescribed by the guidelines, the agency may require the institution to submit to the agency an acceptable plan to achieve compliance with the standard. If an institution fails to meet these standards, the appropriate federal banking agency may require the institution to implement an acceptable compliance plan. Failure to implement such a plan can result in further enforcement action, including the issuance of a cease and desist order or the imposition of civil money penalties.
Federal law requires that federal bank regulators take “prompt corrective action” with respect to institutions that do not meet minimum capital requirements. For this purpose, the law establishes five capital categories: well capitalized, adequately capitalized, undercapitalized, significantly undercapitalized and critically undercapitalized. The applicable OCC regulations were amended to incorporate the previously mentioned increased regulatory capital standards that were effective January 1, 2015. Under the amended regulations, an institution is deemed to be “well capitalized” if it has a total risk-based capital ratio of 10.0% or greater, a Tier 1 risk-based capital ratio of 8.0% or greater, a leverage ratio of 5.0% or greater anda common equity Tier 1 ratio of 6.5% or greater. An institution is “adequately capitalized” if it has a total risk-based capital ratio of 8.0% or greater, a Tier 1 risk-based capital ratio of 6.0% or greater, a leverage ratio of 4.0% or greater and a common equity Tier 1 ratio of 4.5% or greater. An institution is “undercapitalized” if it has a total risk-based capital ratio of less than 8.0%, a Tier 1 risk-based capital ratio of less than 6.0%, a leverage ratio of less than 4.0% or a common equity Tier 1 ratio of less than 4.5%. An institution is deemed to be “significantly undercapitalized” if it has a total risk-based capital ratio of less than 6.0%, a Tier 1 risk-based capital ratio of less than 4.0%, a leverage ratio of less than 3.0% ora common equity Tier 1 ratio of less than 3.0%. An institution is considered to be “critically undercapitalized” if it has a ratio of tangible equity (as defined in the regulations) to total assets that is equal to or less than 2.0%.
Generally a receiver or conservator must be appointed for an institution that is “critically undercapitalized” within specific time frames. The regulations also provide that a capital restoration plan must be filed with the OCC within 45 days of the date a federal savings bank receives notice that it is “undercapitalized,” “significantly undercapitalized” or “critically undercapitalized.” Any holding company for the institution required to submit a capital restoration plan must guarantee the lesser of an amount equal to 5% of the institution’s assets at the time it was notified or deemed to be undercapitalized by the OCC, or the amount necessary to restore the institution to adequately capitalized status. This guarantee remains in place until the OCC notifies the savings institution that it has maintained adequately capitalized status for each of four consecutive calendar quarters, and the OCC has the authority to require payment and collect payment under the guarantee. Various restrictions, such as on capital distributions and growth, also apply to “undercapitalized” institutions. The OCC may also take any one of a number of discretionary supervisory actions against undercapitalized institutions, including the issuance of a capital directive and the replacement of senior executive officers and directors.
As of March 31, 2017, Hamilton Bank was classified as a “well capitalized” institution.
Insurance of Deposit Accounts.The Deposit Insurance Fund of the FDIC insures deposits at FDIC-insured financial institutions such as Hamilton Bank. Deposit accounts in Hamilton Bank are insured by the FDIC generally up to a maximum of $250,000 per separately insured depositor and up to a maximum of $250,000 for self-directed retirement accounts.
The FDIC assesses insured depository institutions to maintain the Deposit Insurance Fund. Under the FDIC’s risk-based assessment system, institutions deemed less risky pay lower assessments. Assessments for institutions of less than $10 billion of assets are now based on financial measures and supervisory ratings derived from statistical modeling estimating the probability of failure of an institution’s failure within three years. That system, effective July 1, 2016, replaced the previous system under which institutions were placed into risk categories.
The Dodd-Frank Act required the FDIC to revise its procedures to base assessments upon each insured institution’s total assets less tangible equity instead of deposits. The FDIC finalized a rule, effective April 1, 2011, that set the assessment range at 2.5 to 45 basis points of total assets less tangible equity. In conjunction with the Deposit Insurance Fund’s reserve ratio achieving 1.15%, the assessment range (inclusive of possible adjustments) was reduced for insured institutions of less than $10 billion of total assets to 1.5 basis points to 30 basis points, effective July 1, 2016.
The Dodd-Frank Act increased the minimum target Deposit Insurance Fund ratio from 1.15% of estimated insured deposits to 1.35% of estimated insured deposits. The Federal Deposit Insurance Corporation must seek to achieve the 1.35% ratio by September 30, 2020. The Dodd-Frank Act requires insured institutions with assets of $10 billion or more to fund the increase from 1.15% to 1.35% and, effective July 1, 2016, such institutions are subject to a surcharge to achieve that goal. The Dodd-Frank Act eliminated the 1.5% maximum fund ratio, instead leaving it to the discretion of the Federal Deposit Insurance Corporation, and the Federal Deposit Insurance Corporation has exercised that discretion by establishing a long-range fund ratio of 2%.
In addition to the FDIC assessments, the Financing Corporation (“FICO”) is authorized to impose and collect, with the approval of the FDIC, assessments for anticipated payments, issuance costs and custodial fees on bonds issued by the FICO in the 1980s to recapitalize the former Federal Savings and Loan Insurance Corporation. The bonds issued by the FICO are due to mature in 2017 through 2019. For the quarter ended March 31, 2017, the annualized FICO assessment was equal to 0.56 basis points of total assets less tangible capital.
The FDIC has authority to increase insurance assessments. Any significant increases would have an adverse effect on the operating expenses and results of operations of Hamilton Bank. Management cannot predict what assessment rates will be in the future.
Insurance of deposits may be terminated by the FDIC upon a finding that an institution has engaged in unsafe or unsound practices, is in an unsafe or unsound condition to continue operations or has violated any applicable law, regulation, rule, order or condition imposed by the FDIC. We do not currently know of any practice, condition or violation that may lead to termination of our deposit insurance.
Prohibitions Against Tying Arrangements. Federal savings banks are prohibited, subject to some exceptions, from extending credit to or offering any other service, or fixing or varying the consideration for such extension of credit or service, on the condition that the customer obtain some additional service from the institution or its affiliates or not obtain services of a competitor of the institution.
Federal Home Loan Bank System. Hamilton Bank is a member of the Federal Home Loan Bank System, which consists of 12 regional Federal Home Loan Banks. The Federal Home Loan Bank System provides a central credit facility primarily for member institutions as well as other entities involved in home mortgage lending. As a member of the Federal Home Loan Bank of Atlanta, Hamilton Bank is required to acquire and hold shares of capital stock in the Federal Home Loan Bank. As of March 31, 2017, Hamilton Bank was in compliance with this requirement.
Federal Reserve System
Federal Reserve Board regulations require savings banks to maintain noninterest-earning reserves against their transaction accounts, such as negotiable order of withdrawal and regular checking accounts. At March 31, 2017, Hamilton Bank was in compliance with these reserve requirements.
Other Regulations
Interest and other charges collected or contracted for by Hamilton Bank are subject to state usury laws and federal laws concerning interest rates. Hamilton Bank’s operations are also subject to federal laws applicable to credit transactions, such as the:
| | ● | Truth-In-Lending Act, governing disclosures of credit terms to consumer borrowers; including the Loan Estimate and Closing Disclosure required for residential mortgage loans; |
| | ● | Real Estate Settlement Procedures Act, requiring that borrowers for mortgage loans for one-to-four family residential real estate receive various disclosures, including good faith estimates of settlement costs, lender servicing and escrow account practices, and prohibiting certain practices that increase the cost of settlement services; |
| | ● | Home Mortgage Disclosure Act, requiring financial institutions to provide information to enable the public and public officials to determine whether a financial institution is fulfilling its obligation to help meet the housing needs of the community it serves; |
| | ● | Equal Credit Opportunity Act, prohibiting discrimination on the basis of race, creed or other prohibited factors in extending credit; |
| | ● | Fair and Accurate Credit Transaction Act, formerly known as the as the Fair Credit Reporting Act, governing the use and provision of information to credit reporting agencies; |
| | ● | Unfair or Deceptive Acts or Practices laws and regulations; |
| | ● | Fair Debt Collection Act, governing the manner in which consumer debts may be collected by collection agencies; |
| | ● | Truth in Savings Act; and |
| | ● | Rules and regulations of the various federal agencies charged with the responsibility of implementing such federal laws. |
In addition, the Consumer Financial Protection Bureau issues regulations and standards under these federal consumer protection laws that affect our consumer businesses. These include regulations setting “ability to repay” and “qualified mortgage” standards for residential mortgage loans and mortgage loan servicing and originator compensation standards. Hamilton Bank is evaluating recent regulations and proposals, and devotes significant compliance, legal and operational resources to compliance with consumer protection regulations and standards.
The operations of Hamilton Bank also are subject to the:
| | ● | Right to Financial Privacy Act, which imposes a duty to maintain confidentiality of consumer financial records and prescribes procedures for complying with administrative subpoenas of financial records; |
| | ● | Electronic Funds Transfer Act and Regulation E promulgated there under, which govern automatic deposits to and withdrawals from deposit accounts and customers’ rights and liabilities arising from the use of automated teller machines and other electronic banking services; |
| | ● | Check Clearing for the 21st Century Act (also known as “Check 21”), which gives “substitute checks,” such as digital check images and copies made from that image, the same legal standing as the original paper check; |
| | ● | The USA PATRIOT Act, which requires savings banks to, among other things, establish broadened anti-money laundering compliance programs, and due diligence policies and controls to ensure the detection and reporting of money laundering. Such required compliance programs are intended to supplement existing compliance requirements that also apply to financial institutions under the Bank Secrecy Act and the Office of Foreign Assets Control regulations; and |
| | ● | The Gramm-Leach-Bliley Act, which places limitations on the sharing of consumer financial information by financial institutions with unaffiliated third parties. Specifically, the Gramm-Leach-Bliley Act requires all financial institutions offering financial products or services to retail customers to provide such customers with the financial institution’s privacy policy and provide such customers the opportunity to “opt out” of the sharing of certain personal financial information with unaffiliated third parties. |
Holding Company Regulation
General. Hamilton Bancorp is a savings and loan holding company within the meaning of Home Owners’ Loan Act. As such, Hamilton Bancorp is registered with the Federal Reserve Board and is subject to regulations, examinations, supervision and reporting requirements applicable to savings and loan holding companies. In addition, the Federal Reserve Board has enforcement authority over Hamilton Bancorp and any future non-savings institution subsidiaries. Among other things, this authority permits the Federal Reserve Board to restrict or prohibit activities that are determined to be a serious risk to the subsidiary savings institution.
Permissible Activities.Under present law, the business activities of Hamilton Bancorp are generally limited to those activities permissible for financial holding companies under Section 4(k) of the Bank Holding Company Act of 1956, as amended, provided certain conditions are met, including electing such status or, in the absence of such an election, for multiple savings and loan holding companies. A financial holding company may engage in activities that are financial in nature, including underwriting equity securities and insurance as well as activities that are incidental to financial activities or complementary to a financial activity. A multiple savings and loan holding company is generally limited to activities permissible for bank holding companies under Section 4(c) (8) of the Bank Holding Company Act, subject to regulatory approval, and certain additional activities authorized by federal regulations. As of March 31, 2017, Hamilton Bancorp, Inc. has not elected financial holding company status.
Federal law prohibits a savings and loan holding company, including Hamilton Bancorp, directly or indirectly, or through one or more subsidiaries, from acquiring more than 5% of another savings institution or holding company thereof, without prior regulatory approval. It also prohibits the acquisition or retention of, with certain exceptions, more than 5% of a non-subsidiary company engaged in activities that are not closely related to banking or financial in nature, or acquiring or retaining control of an institution that is not federally insured. In evaluating applications by holding companies to acquire savings institutions, the Federal Reserve Board must consider the financial and managerial resources, future prospects of the company and institution involved, the effect of the acquisition on the risk to the federal deposit insurance fund, the convenience and needs of the community and competitive factors.
The Federal Reserve Board is prohibited from approving any acquisition that would result in a multiple savings and loan holding company controlling savings institutions in more than one state, subject to two exceptions:
| | ● | the approval of interstate supervisory acquisitions by savings and loan holding companies; and |
| | ● | the acquisition of a savings institution in another state if the laws of the state of the target savings institution specifically permit such acquisition. |
The states vary in the extent to which they permit interstate savings and loan holding company acquisitions.
Capital. Savings and loan holding companies have not historically been subjected to consolidated regulatory capital requirements. The Dodd-Frank Act required the Federal Reserve Board to promulgate consolidated capital requirements for depository institution holding companies that are no less stringent, both quantitatively and in terms of components of capital, than those applicable to their subsidiary depository institutions. The previously discussed final rule regarding regulatory capital requirements implemented these Dodd-Frank Act requirements. As is the case with institutions themselves, the capital conservation buffer is being phased in between 2016 and 2019. However, legislation was enacted in December 2014 which required the Federal Reserve Board to amend its “Small Bank Holding Company” exemption from consolidated holding company capital requirements to (i) extend its applicability to savings and loan holding companies and (ii) raise the threshold for the exemption from $500 million to $1 billion in consolidated assets. Regulations doing so were effective May 15, 2015. Consequently, both bank and savings and loan holding companies with under $1 billion in consolidated assets, including Hamilton Bancorp, are exempt from the consolidated regulatory capital requirements unless the Federal Reserve Board determines otherwise on a case by case basis.
Source of Strength.The Dodd-Frank Act extended the “source of strength” doctrine to savings and loan holding companies. The Federal Reserve Board has issued regulations requiring that all savings and loan holding companies serve as a source of managerial and financial strength to their subsidiary savings and loan associations by providing capital, liquidity and other support in times of financial stress.
Dividends. The Federal Reserve Board has issued a policy statement regarding the payment of dividends and the repurchase of shares of common stock by bank holding companies and savings and loan holding companies. In general, the policy provides that dividends should be paid only out of current earnings and only if the prospective rate of earnings retention by the holding company appears consistent with the organization’s capital needs, asset quality and overall financial condition. Regulatory guidance provides for prior regulatory consultation with respect to capital distributions in certain circumstances such as where the company’s net income for the past four quarters, net of dividends previously paid over that period, is insufficient to fully fund the dividend or the company’s overall rate or earnings retention is inconsistent with the company’s capital needs and overall financial condition. The ability of a savings and loan holding company to pay dividends may be restricted if a subsidiary savings and loan association becomes undercapitalized. The policy statement also states that a savings and loan holding company should inform the Federal Reserve Board supervisory staff prior to redeeming or repurchasing common stock or perpetual preferred stock if the savings and loan holding company is experiencing financial weaknesses or if the repurchase or redemption would result in a net reduction, as of the end of a quarter, in the amount of such equity instruments outstanding compared with the beginning of the quarter in which the redemption or repurchase occurred. These regulatory policies may affect the ability of Hamilton Bancorp to pay dividends, repurchase shares of common stock or otherwise engage in capital distributions.
Acquisition. Under the Federal Change in Bank Control Act, a notice must be submitted to the Federal Reserve Board if any person (including a company), or group acting in concert, seeks to acquire direct or indirect “control” of a savings and loan holding company. Under certain circumstances, a change of control may occur, and prior notice is required, upon the acquisition of 10% or more of the company’s outstanding voting stock, unless the Federal Reserve Board has found that the acquisition will not result in control of the company. A change in control definitively occurs upon the acquisition of 25% or more of the company’s outstanding voting stock. Under the Change in Bank Control Act, the Federal Reserve Board generally has 60 days from the filing of a complete notice to act, taking into consideration certain factors, including the financial and managerial resources of the acquirer and the competitive effects of the acquisition.
Federal Securities Laws
Hamilton Bancorp’s common stock is registered with the Securities and Exchange Commission under the Securities Exchange Act of 1934, as amended. Hamilton Bancorp is subject to the information, proxy solicitation, insider trading restrictions and other requirements under the Securities Exchange Act of 1934.
The registration under the Securities Act of 1933 of shares of common stock issued in the stock offering does not cover the resale of those shares. Shares of common stock purchased by persons who are not our affiliates may be resold without registration. Shares purchased by our affiliates are subject to the resale restrictions of Rule 144 under the Securities Act of 1933. If we meet the current public information requirements of Rule 144 under the Securities Act of 1933, each affiliate of ours that complies with the other conditions of Rule 144, including those that require the affiliate’s sale to be aggregated with those of other persons, would be able to sell in the public market, without registration, a number of shares not to exceed, in any three-month period, the greater of 1% of our outstanding shares, or the average weekly volume of trading in the shares during the preceding four calendar weeks. In the future, we may permit affiliates to have their shares registered for sale under the Securities Act of 1933.
Emerging Growth Company Status
The JOBS Act which was enacted in April 2012 has made numerous changes to the federal securities laws to facilitate access to capital markets. Under the JOBS Act, a company with total annual gross revenues of less than $1.0 billion during its most recently completed fiscal year qualifies as an “emerging growth company.” Hamilton Bancorp qualifies as an emerging growth company under the JOBS Act.
An “emerging growth company” may choose not to hold stockholder votes to approve annual executive compensation (more frequently referred to as “say-on-pay” votes) or executive compensation payable in connection with a merger (more frequently referred to as “say-on-golden parachute” votes). An emerging growth company also is not subject to the requirement that its auditors attest to the effectiveness of the company’s internal control over financial reporting, and can provide scaled disclosure regarding executive compensation; however, Hamilton Bancorp will also not be subject to the auditor attestation requirement or additional executive compensation disclosure so long as it remains a “smaller reporting company” under Securities and Exchange Commission regulations (generally less than $75 million of voting and non-voting equity held by non-affiliates). Finally, an emerging growth company may elect to comply with new or amended accounting pronouncements in the same manner as a private company, but must make such election when the company is first required to file a registration statement. Such an election is irrevocable during the period a company is an emerging growth company. Hamilton Bancorp has elected to comply with new or amended accounting pronouncements in the same manner as a private company.
A company loses emerging growth company status on the earlier of: (i) the last day of the fiscal year of the company during which it had total annual gross revenues of $1.0 billion or more; (ii) the last day of the fiscal year of the issuer following the fifth anniversary of the date of the first sale of common equity securities of the company pursuant to an effective registration statement under the Securities Act of 1933; (iii) the date on which such company has, during the previous three-year period, issued more than $1.0 billion in non-convertible debt; or (iv) the date on which such company is deemed to be a “large accelerated filer” under Securities and Exchange Commission regulations (generally, at least $700 million of voting and non-voting equity held by non-affiliates).
Sarbanes-Oxley Act of 2002
The Sarbanes-Oxley Act addresses, among other issues, corporate governance, auditing and accounting, executive compensation, and enhanced and timely disclosure of corporate information. As directed by the Sarbanes-Oxley Act, our Chief Executive Officer and Chief Financial Officer are required to certify that our quarterly and annual reports do not contain any untrue statement of a material fact. The rules adopted by the Securities and Exchange Commission under the Sarbanes-Oxley Act have several requirements, including having these officers certify that: (i) they are responsible for establishing, maintaining and regularly evaluating the effectiveness of our internal control over financial reporting; (ii) they have made certain disclosures to our auditors and the audit committee of the board of directors about our internal control over financial reporting; and (iii) they have included information in our quarterly and annual reports about their evaluation and whether there have been changes in our internal control over financial reporting or in other factors that could materially affect internal control over financial reporting.
ITEM1A. RISK FACTORS
Our increase in commercial real estate loans has increased our credit risk.
Beginning in 2009, we changed our business strategy with respect to organic growth to become less reliant upon one-to-four family lending and emphasize commercial lending; in particularly commercial real estate lending. To support this strategy, we hired additional commercial lenders, as well as enhanced our back office monitoring and loan administration with additional personnel. We have also participated in commercial real estate loans originated by other institutions in the past.At March 31, 2017, commercial real estate loans totaled $107.6 million, or 31.7% of total loans, compared to $36.2 million, or 22.5% of total loans, at March 31, 2013. This increase includes a combined $16.0 million of commercial real estate loans acquired inour acquisition of Fairmount Bancorp, Inc. in September 2015 and Fraternity Community Bancorp, Inc. in May 2016.
Commercial real estate loans generally have more risk than the one-to-four family residential real estate loans that we originate. Because the repayment of commercial real estate loans depends on the successful management and operation of the borrower’s properties or businesses, repayment of such loans can be affected by adverse conditions in the local real estate market or economy. Commercial real estate loans may also involve relatively large loan balances to individual borrowers or groups of related borrowers. In addition, a downturn in the real estate market or the local economy could adversely affect the value of properties securing the loan or the revenues from the borrower’s business, thereby increasing the risk of nonperforming loans.
Given our recent increase in commercial real estate lending over the past two years, and that a significant portion of our portfolio in commercial real estate loans is not seasoned, we have a limited loss history with which to measure the level of risk in our commercial real estate loan portfolio. Delinquencies and loan losses related to our commercial real estate loans could increase more than we have provided for in our allowance for loan losses as we continue to emphasize this type of lending activity.
A portion of our one-to-fourfamily residential mortgage loans is comprised of non-owner occupied (investor) properties, which increases the credit risk on this portion of our loan portfolio.
A portion of our loan portfolio is comprised of loans secured by non-owner occupied one-to-four family properties, which we refer to as “investor loans”. At March 31, 2017, $25.5 million of our one-to-four family residential mortgage loans in our portfolio, or 7.5% of total loans, were comprised of investor loans. We acquired approximately $9.2 million of investor loans in connection with our acquisition of Fraternity Community Bancorp, Inc. in May 2016 and another $17.1 million with respect to our acquisition of Fairmount Bancorp, Inc. in September 2015. There is a greater credit risk inherent in non-owner occupied properties, than in owner-occupied since the repayment of these loans may depend, in part, on the successful management of the property and/or the borrower’s ability to lease the unit or units of the property. A downturn in the real estate market or the local economy could adversely affect the value of properties securing these loans or the revenues derived from these properties, which could affect the borrower’s ability to repay the loan.
In addition, we have limited experience with the performance of the investor loans acquired in connection with the acquisition of Fraternity Community Bancorp, Inc. and Fairmount Bancorp, Inc. See — “We have relatively limited experience with the performance of loans acquired in our recent acquisitions of Fraternity Community Bancorp, Inc. and Fairmount Bancorp, Inc. Certain of our estimates related to accounting for acquired loans may differ from actual results" below regarding risks associated with our recent acquisition of these and other loans.
We have relatively limited experience with the performance of loans acquired in our recent acquisitions ofFraternity Community Bancorp, Inc.and Fairmount Bancorp, Inc.Certain of our estimates related to accounting for acquired loans may differ from actual results.
We acquired Fraternity Community Bancorp, Inc. in May 2016, and Fairmount Bancorp, Inc. in September 2015. It is difficult to assess the future performance of loans recently added to our portfolio as part of these acquisitions because our relatively limited experience with such loans does not provide us with a significant history from which to judge future collectability. These loans may experience higher delinquency or charge-off levels than our historical loan portfolio experience, which could adversely affect our future performance.
In addition, under generally accepted principles for business combinations, there is no loan loss allowance initially recorded for acquired loans, which are recorded at net fair value on the acquisition date. This net fair value generally includes embedded loss estimates for acquired loans with deteriorated credit quality. These estimates are based on projections of expected cash flows for these problem loans, which in many cases rely on estimates deriving from the liquidation of collateral.
If the estimates we have made regarding the performance of loans we have acquired are inadequate, the fair value estimates may exceed the actual collectability of the balances, and this may result in the related loans being considered by us as impaired, which would result in a reduction in interest income. The tangible book value we measure is based in part on these estimates, and if fair value estimates differ from actual collectability, then subsequent earnings may also differ from original estimates. Measures of tangible book value and earnings impact of business combinations are frequently used in evaluating the merits and value of business combinations. Numerous assumptions and estimates are integral to purchased loan accounting, and actual results could be different from prior estimates.
If our allowance for loan losses is not sufficient to cover actual loan losses, our earnings could decrease.
We make various assumptions and judgments about the collectability of our loan portfolio, including the creditworthiness of our borrowers and the value of the real estate and other assets serving as collateral for the repayment of many of our loans. In determining the amount of the allowance for loan losses, we review our loans and our loss and delinquency experience, and we evaluate economic conditions. If our assumptions are incorrect, our allowance for loan losses may not be sufficient to cover probable incurred losses in our loan portfolio, resulting in additions to our allowance for loan losses. Additions to the allowance for loan losses are established through the provision for losses on loans which is charged against income.
The unseasoned nature of much of our commercial real estate loans and commercial business loans increases the risk that our allowance may be insufficient to absorb losses without significant additional provisions. See — “Our increase in commercial real estate loans has increased our credit risk,” above. At March 31, 2017, our allowance for loan losses was $2.2 million, or 0.65% of gross loans and 94.5% of non-performing loans.
In addition, if the loans we have acquired in our recent acquisitions of Fraternity Community Bancorp, Inc. and Fairmount Bancorp, Inc. do not perform as we have estimated, our allowance for loan losses may not be adequate. See — “We have relatively limited experience with the performance of loans acquired in our recent acquisitions of Fraternity Community Bancorp, Inc. and Fairmount Bancorp, Inc. Certain of our estimates related to accounting for acquired loans may differ from actual results," above.
Significant increases to our allowance materially decrease our net income. In addition, bank regulators periodically review our allowance for loan losses and may require us to increase our provision for loan losses or recognize further loan charge-offs. Any increase in our allowance for loan losses or loan charge-offs as required by these regulatory authorities might have a material adverse effect on our financial condition and results of operations.
The Financial Accounting Standards Board has adopted a new accounting standard that will become effective for us on January 1, 2020. This standard, referred to as Current Expected Credit Loss, or CECL, will require financial institutions to determine periodic estimates of lifetime expected credit losses on loans, and recognize the expected credit losses as allowances for loan losses. This will change the current method of providing allowances for loan losses that are probable, which would likely require us to increase our allowance for loan losses, and to greatly increase the types of data we would need to collect and review to determine the appropriate level of the allowance for loan losses.
Our recent acquisitions of Fairmount Bancorp, Inc. and Fraternity Community Bancorp, Inc. involve integrations and other risks.
Acquisitions involve a number of risks and challenges including: our ability to integrate the branches and operations we acquire, and the associated internal controls and regulatory functions, into our current operations; our ability to limit the outflow of deposits held by our new customers in the acquired branches and to successfully retain and manage the loans we acquire; our ability to attract new deposits and to generate new interest-earning assets in geographic areas we have not previously served. Additionally, no assurance can be given that the operation of acquired branches would not adversely affect our existing profitability; that we would be able to achieve results in the future similar to those achieved by our existing banking business; that we would be able to compete effectively in the market areas served by acquired branches; or that we would be able to manage any growth resulting from the transaction effectively. We face the additional risk that the anticipated benefits of the acquisition may not be realized fully or at all, or within the time period expected.
Historically low interest rates and/or changes in interest rates may adversely affect our net interest income and profitability.
While it has was the policy of the Federal Reserve Board to maintain interest rates at historically low levels over the past several years through its targeted federal funds rate and the purchase of mortgage-backed securities, the Federal Reserve Board raised the federal funds rate by a quarter point three times to 1.0% beginning in December 2015. As a general matter, our net interest income was adversely impacted by the low rate environment that existed over the past several years, however, at this point it is uncertain what impact the recent rate increases might have on our net interest income (the difference between interest income we earn on our assets and the interest expense we pay on our liabilities). It is also uncertain when the Federal Reserve Board might raise or lower the federal funds rate in the future. If interest rates continue to rise, it may negatively impact the housing markets and the U.S. economic recovery. If rates remain relatively low it could create deflationary pressures, which while possibly lowering our operating costs, could have a significant negative effect on our borrowers, especially our business borrowers, and the values of underlying collateral securing loans, which could negatively affect our financial performance.
Our profitability depends substantially on our net interest income, which is the difference between the interest income earned on our interest-earning assets and the interest expense paid on our interest-bearing liabilities. Increases in interest rates may decrease loan demand (which would also decrease our ability to generate noninterest income through the sale of loans into the secondary market and related fees for continuing to service those sold loans, particularly SBA loans sold) and make it more difficult for borrowers to repay adjustable-rate loans. In addition, as market interest rates rise, we will have competitive pressures to increase the rates we pay on deposits. Because interest rates we pay on our deposits could be expected to increase more quickly than the increase in the yields we earn on our interest-earning assets, our net interest income would be adversely affected.
We also are subject to reinvestment risk associated with changes in interest rates. Changes in interest rates may affect the average life of loans and mortgage-related securities. Decreases in interest rates can result in increased prepayments of loans and mortgage-related securities, as borrowers refinance to reduce borrowing costs. Under these circumstances, we are subject to reinvestment risk to the extent that we are unable to reinvest the cash received from such prepayments at rates that are comparable to the interest rates on existing loans and securities.
We may not be able to continue to support the realization of our deferred tax asset.
In accordance with AccountingStandards Codification (ASC) 740,Accounting for Income Taxes, we regularly assess available positive and negative evidence to determine whether it is more likely than not that our deferred tax asset balances will be recovered from reversals of deferred tax liabilities, potential utilization of net operating loss carrybacks, tax planning strategies and future taxable income. At March 31, 2017, we had a deferred tax asset of $8.9 million, a valuation allowance of $42,000, and a net deferred tax asset of $8.0 million. We recognized the deferred tax asset because management believes, based on financial projections, that it is more likely than not, we will have sufficient future earnings to utilize this asset to offset future income tax liabilities. Realization of a deferred tax asset requires us to apply significant judgment because it requires the future occurrence of circumstances that cannot be predicted with certainty. We have experienced losses during the last four years, and we may not achieve sufficient future taxable income as the basis for the ultimate realization of our deferred tax asset. Accordingly, we may have to establish an increased valuation allowance at some point in the future which would be a charge to operations that would adversely affect our stockholders’ equity. Currently, we do not recognize $4.3 million of our deferred tax asset associated with net operating loss carryforwards for regulatory capital purposes.
Any changes in the Federal or State tax laws may negatively impact the Company’s financial performance.
The Company is subject to changes in tax law that could increase the effective tax rate and any amounts payable to the state or federal government. These law changes may be retroactive to previous periods and as a result, could negatively affect the current and future financial performance of the Company. In addition, a decrease in the statutory tax rate would result in the re-pricing of the deferred tax asset and negatively impact earnings.
We could potentially recognize goodwill impairment charges.
As of March 31, 2017, we had $8.6 million of goodwill related to acquisitions. Goodwill is not amortized but is tested for impairment annually or more frequently if events or changes in circumstances indicate that the asset might be impaired. Impairment testing requires that the fair value of Hamilton Bank be compared to the carrying amount of the Bank’s net assets, including goodwill. If the fair value of the Bank is less than book value, an expense may be required to write-down the related goodwill to the proper carrying value. We test for impairment of goodwill during February of each year. As a result of impairment testing performed during February 2017, no impairment charge was recorded. However, future declines in our banking franchise value could result in goodwill impairment expense that is material to our earnings.
Strong competition within our market areas may limit our growth and profitability.
Competition in the banking and financial services industry within our market area is intense. In our market area we compete with commercial banks, savings institutions, mortgage brokerage firms, credit unions, finance companies, mutual funds, insurance companies, and brokerage and investment banking firms operating locally and elsewhere. Many of these competitors have substantially greater resources and lending limits than we have and offer certain services that we do not or cannot provide. Our profitability depends upon our continued ability to successfully compete in our market area. The greater resources and broader range of deposit and loan products offered by our competition may limit our ability to increase our interest-earning assets and profitability. We expect competition to remain intense in the future as a result of legislative, regulatory and technological changes and the continuing trend of consolidation in the financial services industry. Technological advances, for example, have lowered barriers to entry, allowed banks to expand their geographic reach by providing services over the Internet and made it possible for non-depository institutions to offer products and services that traditionally have been provided by banks. Competition for deposits and the origination of loans could limit our ability to successfully implement our business plan, and could adversely affect our results of operations in the future.
Competition in the banking and financial services industry is coming not only from local markets but from technology oriented financial services(“FinTech”) companies,which are subject to limited regulation. They offer user friendly front-end, quick turnaround times for loans and other benefits. While Hamilton is evaluatingFinTech companies with the possibility of developing relationships for efficiency in processing and/or as a source of loans and other business, we cannot limit the possibility that our customers or future prospects will work directly with aFinTech company instead. This could impact our growth and profitability going forward.
We operate in a highly regulated environment and we may be adversely affected by changes in laws and regulations.
We are subject to extensive regulation, supervision and examination by the Federal Reserve Board and the Office of the Comptroller of the Currency, our primary federal regulators, and the Federal Deposit Insurance Corporation, as insurer of our deposits. Such regulation and supervision governs the activities in which an institution and its holding company may engage, and are intended primarily for the protection of the insurance fund and the depositors and borrowers of Hamilton Bank rather than for holders of our common stock. Regulatory authorities have extensive discretion in their supervisory and enforcement activities, including the imposition of restrictions on our operations, the classification of our assets and determination of the level of our allowance for loan losses. Any change in such regulation and oversight, whether in the form of regulatory policy, regulations, legislation or supervisory action, may have a material impact on our operations.
Income from secondary mortgage market operations is volatile, and we may incur losses or charges with respect to our secondary mortgage market operations which would negatively affect our earnings.
We may sell in the secondary market a portion of residential mortgage loans that we originate with terms over 10 years on a servicing released basis, earning noninterest income in the form of gains on sale. When interest rates rise, the demand for mortgage loans tends to fall and may reduce the number of loans available for sale. In addition to interest rate levels, weak or deteriorating economic conditions also tend to reduce loan demand. We do sell loans in the secondary market with recourse based upon delinquency or breach of customary representations and warranties we provide to the buyers. If we breach those representations and warranties, the buyers can require us to repurchase the loans and we may incur a loss on the repurchase.
Our recent investments in municipal debt securities expose us to additional credit risks.
The composition and allocation of our investment portfolio has historically emphasized U.S. agency mortgage-backed securities and U.S. agency debentures. While such assets still make up the great majority of our investment portfolio at March 31, 2017, we have recently increased the amount of bank-qualified municipal obligations in our portfolio. Unlike U.S. agency securities, the municipal debt securities acquired are backed only by the credit of their issuers and not guaranteed by the federal government. These investments expose us to a greater degree of credit risk than U.S. agency securities. Any decline in the credit quality of these securities exposes us to the risk that the market value of the securities could decrease which may require us to write down their value on our books and could lead to a possible default in payment.
Legislative and regulatory initiatives may affect our business activities and increase operating costs.
The potential exists for additional federal or state laws and regulations regarding lending, funding practices, capital, and liquidity standards. Bank regulatory agencies are expected to be more active in responding to concerns and trends identified in examinations, including the expected issuance of many formal enforcement orders. In addition, new laws, regulations, and other regulatory changes may also increase our compliance costs and affect our business and operations. Moreover, the FDIC sets the cost of our FDIC insurance premiums, which can affect our profitability.
The Dodd-Frank Act made extensive changes in the regulation of insured depository institutions. The Dodd-Frank Act, among other things, impacted assessments for deposit insurance, capital requirements, risk retention on the origination of certain securitized loans and debit card interchange fees. It also introduced a number of reforms related to mortgage originations. There is a significant possibility that the Dodd-Frank Act will, at a minimum, result in continued increases in regulatory burden, compliance costs and interest expense.
New laws, regulations, and other regulatory changes, along with negative developments in the financial industry and the domestic and international credit markets, may significantly affect the markets in which we do business, the markets for and value of our loans and investments, and our ongoing operations, costs and profitability. For more information, see “Regulation and Supervision” in Item 1 of this Annual Report.
We may incur fines, penalties and other negative consequences from regulatory violations, possibly even inadvertent or unintentional violations.
We maintain systems and procedures designed to ensure that we comply with applicable laws and regulations. However, some legal and regulatory frameworks provide for the imposition of fines or penalties for noncompliance even though the noncompliance was inadvertent or unintentional and even though there was in place at the time systems and procedures designed to ensure compliance. There may be negative consequences resulting from a finding of noncompliance, including restrictions on certain activities. Such a finding may also damage our reputation as described above and could restrict the ability of institutional investment managers to invest in our securities.
Systems failures, interruptions or breaches of security could have an adverse effect on our financial condition and results of operations.
We are subject to certain operational risks, including, but not limited to, data processing system failures and errors, inadequate or failed internal processes, customer or employee fraud and catastrophic failures resulting from terrorist acts or natural disasters. We depend upon data processing, software, communication, and information exchange on a variety of computing platforms and networks and over the Internet, and we rely on the services of a variety of vendors to meet our data processing and communication needs. Despite instituted safeguards, we cannot be certain that all of our systems are entirely free from vulnerability to attack or other technological difficulties or failures. Information security risks have increased significantly due to the use of online, telephone and mobile banking channels by clients and the increased sophistication and activities of organized crime, hackers, terrorists and other external parties. Our technologies, systems, networks and our clients’ devices have been subject to, and are likely to continue to be the target of, cyber-attacks, computer viruses, malicious code, phishing attacks or information security breaches that could result in the unauthorized release, gathering, monitoring, misuse, loss or destruction of our or our clients’ confidential, proprietary and other information, the theft of client assets through fraudulent transactions or disruption of our or our clients’ or other third parties’ business operations. If information security is breached or other technology difficulties or failures occur, information may be lost or misappropriated, services and operations may be interrupted and we could be exposed to claims from customers. While we maintain a system of internal controls and procedures, any of these results could have a material adverse effect on our business, financial condition, results of operations or liquidity.
Regulations relating to privacy, information security and data protection could increase our costs, affect or limit how we collect and use personal information and adversely affect our business opportunities.
We are subject to various privacy, information security and data protection laws, including requirements concerning security breach notification, and we could be negatively impacted by these laws. For example, our business is subject to the Gramm-Leach-Bliley Act which, among other things: (i) imposes certain limitations on our ability to share nonpublic personal information about our customers with nonaffiliated third parties; (ii) requires that we provide certain disclosures to customers about our information collection, sharing and security practices and afford customers the right to “opt out” of any information sharing by us with nonaffiliated third parties (with certain exceptions) and (iii) requires we develop, implement and maintain a written comprehensive information security program containing safeguards appropriate based on our size and complexity, the nature and scope of our activities, and the sensitivity of customer information we process, as well as plans for responding to data security breaches. Various state and federal banking regulators and states have also enacted data security breach notification requirements with varying levels of individual, consumer, regulatory or law enforcement notification in certain circumstances in the event of a security breach. Moreover, legislators and regulators in the United States are increasingly adopting or revising privacy, information security and data protection laws that potentially could have a significant impact on our current and planned privacy, data protection and information security-related practices, our collection, use, sharing, retention and safeguarding of consumer or employee information, and some of our current or planned business activities. This could also increase our costs of compliance and business operations and could reduce income from certain business initiatives. This includes increased privacy-related enforcement activity at the federal level, by the Federal Trade Commission, as well as at the state level, such as with regard to mobile applications.
Compliance with current or future privacy, data protection and information security laws (including those regarding security breach notification) affecting customer or employee data to which we are subject could result in higher compliance and technology costs and could restrict our ability to provide certain products and services, which could have a material adverse effect on our business, financial conditions or results of operations. Our failure to comply with privacy, data protection and information security laws could result in potentially significant regulatory or governmental investigations or actions, litigation, fines, sanctions and damage to our reputation, which could have a material adverse effect on our business, financial condition or results of operations.
We rely on other companies to provide key components of our business infrastructure.
Third-party vendors provide key components of our business infrastructure such as internet connections, network access and core application processing. While we have selected these third party vendors carefully, we do not control their actions. Any problems caused by these third parties, including as a result of their not providing us their services for any reason or their performing their services poorly, could adversely affect our ability to deliver products and services to our customers or otherwise conduct our business efficiently and effectively. Replacing these third party vendors could also entail significant delay and expense.
If our risk management framework does not effectively identify or mitigate our risks, we could suffer losses.
Our risk management framework seeks to mitigate risk and appropriately balance risk and return. We have established processes and procedures intended to identify, measure, monitor and report the types of risk to which we are subject, including credit risk, operations risk, compliance risk, reputation risk, strategic risk, market risk, liquidity risk, and information technology risk. We seek to monitor and control our risk exposure through a framework of policies, procedures and reporting requirements. Management of our risks in some cases depends upon the use of analytical and/or forecasting models. If the models used to mitigate these risks are inadequate, we may incur losses. In addition, there may be risks that exist, or that develop in the future, that we have not appropriately anticipated, identified or mitigated. If our risk management framework does not effectively identify or mitigate our risks, we could suffer unexpected losses and could be materially adversely affected.
ITEM1B. UNRESOLVED STAFF COMMENTS
None.
ITEM2. PROPERTIES
We conduct our business through our main banking office located in Baltimore City, Maryland, five other full-service branch offices located in Baltimore City and the Maryland counties of Baltimore, Howard and Anne Arundel, and our executive and administrative office located in Towson, Maryland, which also serves as a full service banking office. The aggregate net book value of our premises, excluding premises held for sale, was $3.7 million at March 31, 2017. Our facilities are adequate and suitable for our operations as conducted by us. The following table sets forth certain information with respect to our offices, including lease expiration dates for leased properties.
Location | | Leased or Owned | | Year Opened/ Acquired | | Lease Expiration Date |
| | | | | | | |
Main Office: | | | | | | |
| | | | | | | |
5600 Harford Road Baltimore, Maryland 21214 | | Owned | | 1937 | | — |
| | | | | | | |
Branches: | | | | | | |
| | | | | | | |
8108 Jumpers Hole Road Pasadena, Maryland 21122 | | Owned | | 2009 | | — |
| | | | | | | |
8216 Philadelphia Road Rosedale, Maryland 21237 | | Owned | | 2015 | | — |
| | | | | | | |
764 Washington Boulevard Baltimore City, Maryland 21230 (1) | | Owned | | 2016 | | — |
| | | | | | | |
8460 Baltimore National Pike Ellicott City, Maryland 21043 (1,3) | | Leased | | 2016 | | July 31, 2017 |
| | | | | | | |
9050 National Pike Ellicott City, Maryland 21042 (3) | | Leased | | 2017 | | August 31, 2023 |
| | | | | | | |
10283 York Road Cockeysville, Maryland 21030 (1) | | Leased | | 2016 | | Jan. 31, 2020 |
| | | | | | | |
9 Cranbrook Road Cockeysville, Maryland 21030 (2) | | Leased | | 2000 | | May 1, 2020 |
| | | | | | | |
Executive and Administrative Office: | | | | | | |
| | | | | | | |
501 Fairmount Ave. Suite 200 Towson, Maryland 21286 | | Leased | | 2011 | | November 30, 2021 |
______________________
(1) | Properties were acquired in the Fraternity Community Bancorp acquisition on May 13, 2016. |
(2) | Lease was renewed under a 5 year option on May 1, 2015. This branch was closed May 2, 2016 because of its close proximity to the newly acquired branch located at 10283 York Road. Customer deposits were transferred accordingly. We are still obligated to remit lease payments under the lease terms. |
(3) | The lease for 8460 Baltimore National Pike has been extended until July 31, 2017, at which time the branch will be relocated within a mile to 9050 Baltimore National Pike. The lessor is reconstructing the property located at 8460 Baltimore National Pike for an alternative use. Customers deposits will transferred to the new location accordingly. |
ITEM3. LEGAL PROCEEDINGS
Periodically, there have been various claims and lawsuits against us, such as claims to enforce liens, condemnation proceedings on properties in which we hold security interests, claims involving the making and servicing of real property loans and other issues incident to our business. We are not a party to any pending legal proceedings that we believe would have a material adverse effect on our financial condition, results of operations or cash flows.
ITEM4. MINE SAFETY DISCLOSURES
Not applicable.
PARTII
ITEM5. | MARKET FOR REGISTRANT’S COMMON EQUITY, RELATED STOCKHOLDER MATTERS AND ISSUER PURCHASES OF EQUITY SECURITIES |
Market and Dividend Information.
The Company’s common stock is listed on the NASDAQ Capital Market (“NASDAQ”) under the trading symbol “HBK.” The Company completed its initial public offering on October 10, 2012, and its stock commenced trading on the same day.
The following table sets forth the high and low sales prices of the Company’s common stock as reported by NASDAQ for the periods indicated. The Company has not paid any dividends to its stockholders to date. See “Dividends” below.
| | | Price Range Per Share | |
Fiscal 2017: | | High | | | Low | |
| | | | | | | | | |
Fourth Quarter | | $ | 15.55 | | | $ | 14.28 | |
Third Quarter | | | 14.50 | | | | 13.50 | |
Second Quarter | | | 14.19 | | | | 13.33 | |
First Quarter | | | 14.25 | | | | 13.30 | |
| | | | | | | | | |
| | | | | | | | | |
| | | Price Range Per Share | |
Fiscal 2016: | | High | | | Low | |
| | | | | | | | | |
Fourth Quarter | | $ | 14.50 | | | $ | 13.31 | |
Third Quarter | | | 16.00 | | | | 13.51 | |
Second Quarter | | | 14.34 | | | | 13.30 | |
First Quarter | | | 14.50 | | | | 13.53 | |
Holders.
As of June 29, 2017, there were approximately 136 holders of record of the Company’s common stock.
Dividends.
The Company has not paid any dividends to its shareholders to date. The payment of dividends in the future will depend upon a number of factors, including capital requirements, the Company’s financial condition and results of operations, tax considerations, statutory and regulatory limitations and general economic conditions. In addition, the Company’s ability to pay dividends is dependent on dividends received from Hamilton Bank. For more information regarding restrictions on the payment of cash dividends by the Company and by Hamilton Bank, see “Business—Regulation and Supervision—Holding Company Regulation—Capital Distributions”, “Business— Regulation and Supervision—Federal Savings Institution Regulation—Capital Distributions” and Note 15 to the Consolidated Financial Statements included in this Annual Report. No assurances can be given that any dividends will be paid or that, if paid, will not be reduced or eliminated in the future.
Recent Sales of Unregistered Securities; Use of Proceeds from Registered Securities.
None.
Purchases of Equity Securities by the Issuer and Affiliated Purchasers.
There were no shares repurchased by the Company during fiscal 2017.
ITEM6. SELECTED FINANCIAL DATA
The following tables set forth selected historical financial and other data of Hamilton Bancorp, Inc. for the periods and at the dates indicated. The following is only a summary and you should read it in conjunction with the consolidated financial statements of Hamilton Bancorp, Inc. and notes beginning on page F-1 of this Annual Report. The information at March 31, 2017 and 2016 and for the years then ended is derived in part from the audited consolidated financial statements that appear in this Annual Report. The information at March 31, 2015, 2014 and 2013 and for the years then ended is derived in part from audited financial statements that do not appear in this Annual Report.
| | | At March 31, | |
| | | 2017 | | | 2016 | | | 2015 | | | 2014 | | | 2013 | |
| | | (In thousands) | |
Selected Financial Condition Data: | | | | | | | | | | | | | | | | | | | | |
| | | | | | | | | | | | | | | | | | | | | |
Total assets | | $ | 514,530 | | | $ | 392,917 | | | $ | 291,040 | | | $ | 302,769 | | | $ | 331,962 | |
Cash and cash equivalents | | | 29,354 | | | | 67,449 | | | | 16,644 | | | | 33,073 | | | | 33,969 | |
Investment securities (1) | | | 21,597 | | | | 16,544 | | | | 21,582 | | | | 26,778 | | | | 27,034 | |
Mortgage-backed securities | | | 80,832 | | | | 53,940 | | | | 71,357 | | | | 76,776 | | | | 89,200 | |
Loans, net (2) | | | 336,738 | | | | 220,416 | | | | 159,176 | | | | 142,914 | | | | 159,317 | |
Federal Home Loan Bank of Atlantastock at cost | | | 2,020 | | | | 1,043 | | | | 523 | | | | 266 | | | | 401 | |
Bank-owned life insurance | | | 18,253 | | | | 12,710 | | | | 12,360 | | | | 12,002 | | | | 11,623 | |
Deposits | | | 412,856 | | | | 313,994 | | | | 222,319 | | | | 238,820 | | | | 260,117 | |
Borrowings | | | 36,125 | | | | 14,805 | | | | 6,000 | | | | - | | | | - | |
Total equity | | | 59,791 | | | | 61,545 | | | | 60,800 | | | | 61,770 | | | | 67,436 | |
__________________________________________
(1) | Includes U.S. agency securities, municipal and corporate bonds, and to a much lesser extent, FHLMC debt securities. |
(2) | Includes loans held for sale of $-0-, $259,000, $581,000, $-0- and $197,000 at March 31, 2017, 2016, 2015, 2014 and 2013, respectively. |
| | | For the Years Ended March 31, | |
| | | 2017 | | | 2016 | | | 2015 | | | 2014 | | | 2013 | |
| | | (In thousands, except per share data) | |
Selected Operating Data: | | | | | | | | | | | | | | | | | | | | |
| | | | | | | | | | | | | | | | | | | | | |
Interest revenue | | $ | 16,762 | | | $ | 11,318 | | | $ | 9,383 | | | $ | 10,236 | | | $ | 10,885 | |
Interest expense | | | 2,871 | | | | 1,843 | | | | 1,662 | | | | 1,916 | | | | 2,802 | |
Net interest income | | | 13,891 | | | | 9,475 | | | | 7,721 | | | | 8,320 | | | | 8,083 | |
Provision for loan losses | | | 3,395 | | | | 440 | | | | 170 | | | | 1,874 | | | | 1,730 | |
Net interest income afterprovision for loan losses | | | 10,496 | | | | 9,035 | | | | 7,551 | | | | 6,446 | | | | 6,353 | |
Noninterest revenue | | | 1,054 | | | | 1,554 | | | | 1,108 | | | | 1,056 | | | | 941 | |
Noninterest expense | | | 13,237 | | | | 10,260 | | | | 9,310 | | | | 9,689 | | | | 7,773 | |
Income (loss) before income taxes (benefit) | | | (1,687 | ) | | | 329 | | | | (651 | ) | | | (2,187 | ) | | | (479 | ) |
Income taxes (benefit) | | | (758 | ) | | | 422 | | | | (337 | ) | | | (992 | ) | | | (307 | ) |
Net income (loss) | | $ | (929 | ) | | $ | (93 | ) | | $ | (314 | ) | | $ | (1,195 | ) | | $ | (172 | ) |
| | | | | | | | | | | | | | | | | | | | | |
Basic loss per common share | | $ | (0.29 | ) | | $ | (0.03 | ) | | $ | (0.10 | ) | | $ | (0.35 | ) | | $ | (0.05 | ) |
Diluted loss per common share | | $ | (0.29 | ) | | $ | (0.03 | ) | | $ | (0.10 | ) | | $ | (0.35 | ) | | $ | (0.05 | ) |
| | | At or For the Years Ended March 31, | |
| | | 2017 | | | 2016 | | | 2015 | | | 2014 | | | 2013 | |
| | | | | | | | | | | | | | | | | | | | | |
Selected Financial Ratios and Other Data: | | | | | | | | | | | | | | | | | | | | |
| | | | | | | | | | | | | | | | | | | | | |
Performance Ratios: | | | | | | | | | | | | | | | | | | | | |
Return on average assets (ratio of net lossto average total assets) | | | (0.19 | )% | | | (0.03 | )% | | | (0.11 | )% | | | (0.38 | )% | | | (0.05 | )% |
Return on average equity (ratio of net lossto average equity) | | | (1.57 | )% | | | (0.15 | )% | | | (0.54 | )% | | | (1.84 | )% | | | (0.33 | )% |
Interest rate spread (1) | | | 2.97 | % | | | 2.89 | % | | | 2.70 | % | | | 2.68 | % | | | 2.44 | % |
Net interest margin (2) | | | 3.04 | % | | | 3.02 | % | | | 2.85 | % | | | 2.85 | % | | | 2.62 | % |
Efficiency ratio expressed as a percentage (3) | | | 83.92 | % | | | 90.43 | % | | | 106.27 | % | | | 99.90 | % | | | 86.14 | % |
Noninterest expense to average total assets | | | 2.66 | % | | | 3.02 | % | | | 3.17 | % | | | 3.08 | % | | | 2.37 | % |
Noninterest revenue to average total assets | | | 0.21 | % | | | 0.46 | % | | | 0.37 | % | | | 0.33 | % | | | 0.29 | % |
Average interest-earning assets to averageinterest-bearing liabilities | | | 111.69 | % | | | 121.98 | % | | | 125.10 | % | | | 125.30 | % | | | 119.36 | % |
Average equity to average total assets | | | 11.85 | % | | | 17.98 | % | | | 19.84 | % | | | 20.58 | % | | | 15.72 | % |
| | | | | | | | | | | | | | | | | | | | | |
Asset Quality Ratios: | | | | | | | | | | | | | | | | | | | | |
Non-performing assets to total assets | | | 0.55 | % | | | 1.40 | % | | | 0.93 | % | | | 1.88 | % | | | 1.77 | % |
Non-performing loans to gross loans | | | 0.69 | % | | | 2.27 | % | | | 1.41 | % | | | 3.48 | % | | | 3.18 | % |
Allowance for loan losses to non-performing loans | | | 94.49 | % | | | 33.70 | % | | | 74.97 | % | | | 35.44 | % | | | 40.36 | % |
Allowance for loan losses to gross loans | | | 0.65 | % | | | 0.76 | % | | | 1.05 | % | | | 1.23 | % | | | 1.28 | % |
Net charge-offs to average loans | | | 0.92 | % | | | 0.22 | % | | | 0.18 | % | | | 1.41 | % | | | 1.96 | % |
| | | | | | | | | | | | | | | | | | | | | |
Capital Ratios: | | | | | | | | | | | | | | | | | | | | |
Common equity tier 1 capital(to risk-weighted assets) (4) | | | 12.13 | % | | | 19.06 | % | | | 24.37 | % | | | - | | | | - | |
Total capital (to risk-weighted assets) (4) | | | 12.81 | % | | | 19.81 | % | | | 25.32 | % | | | 28.38 | % | | | 26.70 | % |
Tier 1 capital (to risk-weighted assets) (4) | | | 12.13 | % | | | 19.06 | % | | | 24.37 | % | | | 27.28 | % | | | 25.52 | % |
Tier 1 capital (to total adjusted assets) (4) | | | 8.28 | % | | | 11.78 | % | | | 15.82 | % | | | 15.10 | % | | | 14.13 | % |
Equity to total assets | | | 11.62 | % | | | 15.66 | % | | | 20.89 | % | | | 20.40 | % | | | 20.31 | % |
Tangible equity to tangible assets | | | 9.99 | % | | | 14.05 | % | | | 20.12 | % | | | 19.65 | % | | | 19.62 | % |
| | | | | | | | | | | | | | | | | | | | | |
Number of: | | | | | | | | | | | | | | | | | | | | |
Full service offices | | | 7 | | | | 5 | | | | 4 | | | | 4 | | | | 5 | |
Full time equivalent employees | | | 74 | | | | 61 | | | | 55 | | | | 58 | | | | 56 | |
(1) | The interest rate spread represents the difference between the weighted-average yield on interest-earning assets and the weighted-average cost of interest-bearing liabilities for the period. |
| (2) | The net interest margin represents net interest income as a percent of average interest-earning assets for the period. |
| (3) | The efficiency ratio represents noninterest expense divided by the sum of net interest income and noninterest income, excluding investment and property gains, branch consolidation and merger related expense, and write-downs and losses on foreclosed real estate. |
| (4) | Capital ratios are for Bank only. |
ITEM7. MANAGEMENT’S DISCUSSION AND ANALYSIS OF FINANCIAL CONDITION AND RESULTS OF OPERATION
This discussion and analysis reflects our consolidated financial statements and other relevant statistical data, and is intended to enhance your understanding of our financial condition and results of operations. The information in this section has been derived from the audited consolidated financial statements, which appear beginning on page F-1 of this Annual Report. You should read the information in this section in conjunction with the business and financial information regarding Hamilton Bancorp, Inc. provided in this Annual Report.
Statements included in this management's discussion and analysis include non-GAAP financial measures and should be read along with the accompanying tables which provide a reconciliation of non-GAAP financial measures to GAAP financial measures. The Company's management uses the following non-GAAP financial measures, including: (i) net income pre-acquisition and branch consolidation related expenses and gain on sale of branch; and (ii) tangible common equity, in its analysis of the Company's performance. The net income pre-acquisition and branch consolidation related expenses and gain on sale of branch and tangible common equity non-GAAP reconciliations, which include tangible book value per share, are presented in the “Overview” section below.
Management believes that non-GAAP financial measures provide additional useful information that allows readers to evaluate the ongoing performance of the Company without regard to transactional activities. Non-GAAP financial measures should not be considered as an alternative to any measure of performance or financial condition as promulgated under GAAP, and investors should consider the Company's performance and financial condition as reported under GAAP and all other relevant information when assessing the performance or financial condition of the Company. Non-GAAP financial measures have limitations as analytical tools, and investors should not consider them in isolation or as a substitute for analysis of the Company's results or financial condition as reported under GAAP.
Overview
The Company and its wholly owned subsidiary, Hamilton Bank, continue to show significant growth in both revenue and asset size for the year ending March 31, 2017 as compared to the year ending March 31, 2016. Net interest income improved $4.4 million, or 47 percent, during fiscal 2017 compared to fiscal 2016 as the Company continued to show strong loan demand, closed on its acquisition of Fraternity Community Bancorp, Inc. (“Fraternity”) and worked towards reducing its cost of funds. The Company was able to increase non-interest revenue relating to service charges and earnings on bank-owned life insurance (“BOLI”) over the same time period due to the increase in core deposits and BOLI resulting from the acquisition of Fraternity. Finally, non-interest expense increased $3.0 over the twelve months ending March 31, 2017 compared to the same period a year ago. That increase was partially due to $1.3 million in expenses associated with the acquisition of Fraternity, including expenses relating to non-compete and consulting agreements, branch consolidation, and typical legal and professional fees connected with an acquisition. Management made a strategic decision to close an existing branch that serviced the same geographic area as an acquired Fraternity branch. Since the Bank was obligated under the existing lease, we had to recognize the present value of the remaining lease payments immediately, or roughly $495,000 in lease expense. The remaining increase in non-interest expense relates to the additional expenses associated with operating as a larger institution. The acquisition of Fraternity closed on May 13, 2016. Management has diligently worked at monitoring and improving efficiencies to reduce our overall operating expenses and improve our efficiency ratio going forward.
The following highlights contain additional financial data and events that have occurred during the fiscal year ending March 31, 2017:
| | ● | Successfully completed the acquisition of Fraternity in May 2016 (seeNote 3 – Acquisitions in the Notes to our Consolidated Financial Statement for more details). The acquisition, along with organic loan growth, is primarily responsible for increasing our asset size $121.6 million, or 31.0%, from $392.2 million at March 31, 2016 to $514.5 million at March 31, 2017. |
| | ● | Gross loans at March 31, 2016 increased by $116.2 million, or 52.2%, to $339.0 million year over year. This growth was attributable to $108.8 million in loans acquired in the Fraternity acquisition, $68.1 million in organic growth from loans originated by the Bank and $23.4 in loan pools that were purchased from third parties. The loan volume is reflected in the $5.2 million, or 53.8%, increase in interest income on loans. |
| | ● | Total deposits increased $98.9 million, or 31.5%, to $412.9 million at March 31, 2017, compared to total deposits of $314.0 million at March 31, 2016, including an increase of 38.6% or $45.8 million in core deposits (core deposits are considered all deposits except certificates of deposits). This growth included $110.0 million in Fraternity acquired deposits. |
| | ● | Nonperforming loans as a percentage of gross loans declined to 0.69% from 2.27% at March 31, 2016, a 70% overall improvement. Nonperforming loans equaled $2.3 million at March 31, 2017, including one borrowing relationship for $1.5 million that has already been written-down $1.1 million in the current year, compared to $5.1 million at March 31, 2016. |
| | ● | The allowance for loan loss as a percentage of nonperforming loans increased to 94.5% from 33.7% at March 31, 2016. Approximately $3.4 million was recorded through the provision for loan loss in fiscal 2017 compared to $440,000 in fiscal 2016 based upon net charge-offs of $2.9 million and $428,000, respectively. |
| | ● | The large provision for the 2017 fiscal year was a result of charge-offs, including $1.1 million associated with one commercial real estate relationship and $1.6 million in charge-offs relating to a pool of 1-4 family non-owner occupied real estate (“investor”) loans that were written down to fair value and sold. The pool of loans was obtained primarily through our Fairmount acquisition and sold in March 2017 due to deteriorating collateral values and cash flow problems. The sale of loans was a strategic decision to minimize the expected costs and potential future losses associated with these loans. |
| | ● | As a result of the large loan loss provision discussed in the bullet point above, the Company reported a net loss of $929,000 or $(0.29) per common share in fiscal 2017 compared to a net loss of $93,000 or $(0.03) per common share for fiscal 2016. In addition to the provision, the comparative results were impacted by acquisitions, non-compete and consulting agreements relating to acquisitions, branch consolidation expenses in the current period and the sale of our Towson branch in the prior year. Excluding the acquisition expenses, which are not tax deductible, and other related expenses, earnings for fiscal 2017 would have been a loss of $40,000 or $(0.01) per common share, as illustrated in the following table: |
| | | Fiscal year ended | |
| | | March 31, | |
| | | 2017 | | | 2016 | | | Difference | |
| | | (dollars in thousands) | |
Reported net loss | | $ | (929 | ) | | $ | (93 | ) | | $ | (836 | ) |
Add: Reported tax expense (benefit) | | | (758 | ) | | | 422 | | | | (1,180 | ) |
Reported pre-tax (loss) income | | | (1,687 | ) | | | 329 | | | | (2,016 | ) |
Add: Non-deductible merger related expenses | | | 219 | | | | 900 | | | | (681 | ) |
Add: Non-compete and consulting expenses | | | 612 | | | | - | | | | 612 | |
Add: Branch consolidation expense | | | 495 | | | | - | | | | 495 | |
Less: Gain on sale of branch | | | - | | | | (407 | ) | | | 407 | |
Adjusted pre-tax (loss) income - (Non-GAAP) | | | (361 | ) | | | 822 | | | | (1,183 | ) |
Estimated tax (benefit) expense | | | (321 | ) | | | 261 | | | | (582 | ) |
Adjusted net (loss) income - (Non-GAAP) | | | (40 | ) | | | 561 | | | | (601 | ) |
Adjusted basic (loss) earnings per common share - (Non-GAAP) | | $ | (0.01 | ) | | $ | 0.18 | | | $ | (0.19 | ) |
- The non-GAAP financial measures shown above should not be viewed as a substitute for net income (loss) or earnings (loss) per share in accordance with GAAP. The Company’s management believes that the presentation of net income on a non-GAAP basis, excluding acquisition related expenses provides useful information for evaluating the Company’s operating results and any related trends that may be affecting the Company’s business.
Excluding acquisition related costs from net income, basic earnings per share for the periods shown is calculated as follows:
| | | Year Ended | | | Year Ended | |
| | | March 31, 2017 | | | March 31, 2016 | |
| | | (dollars in thousands) | |
| | | | | | | | | |
Adjusted net (loss) income | | $ | (40 | ) | | $ | 561 | |
Average common shares outstanding - basic | | | 3,180,292 | | | | 3,169,181 | |
Adjusted basic (loss) earnings per common share | | $ | (0.01 | ) | | $ | 0.18 | |
| | ● | Net interest income for fiscal 2017 was $13.9 million compared to $9.5 million for fiscal 2016, an increase of $4.4 million or 46.6%. This increase is primarily related to the Company’s acquisitions of Fairmount and Fraternity, as well as strong organic loan growth and an effort to reduce our cost of funds. |
| | ● | As a result of the acquisition of Fraternity, the Company acquired one branch that serviced the same area as an existing Hamilton branch. Based upon due diligence and forecasted expense savings, management chose to close the existing Hamilton branch and maintain the acquired Fraternity branch in that area. As part of closing the existing Hamilton branch, the Company recognized a $495,000 expense that reflected the remaining term of the lease. This expense is reported as branch consolidation expense for fiscal 2017. |
| | ● | The Company ended fiscal 2017 with a book value of $17.53 per common share and a tangible book value of $14.80 per common share compared to $18.03 and $15.87, respectively, at March 31, 2016. Tangible book value decreased as a result of the net loss for the year and the $2.1 million of goodwill and other intangible assets created in the Fraternity acquisition. |
| | | March 31, 2017 | | | March 31, 2016 | |
Tangible book value per common share: | | | | | | | | |
Total shareholders' equity | | $ | 59,791,230 | | | $ | 61,544,583 | |
Less: Goodwill and other intangible assets | | | (9,302,828 | ) | | | (7,386,111 | ) |
Tangible common equity | | $ | 50,488,402 | | | $ | 54,158,472 | |
| | | | | | | | | |
Outstanding common shares | | | 3,411,075 | | | | 3,413,646 | |
| | | | | | | | | |
Tangible book value per common share | | $ | 14.80 | | | $ | 15.87 | |
| | ● | The Company maintained strong liquidity and at March 31, 2017 the Bank was deemed “well capitalized” under federal regulations. |
Strategic Plan
We have based our 2018-2020 strategic plan on the objective of improving shareholder value and growth through creating sustainable and profitable growth given the current and expected economic and competitive environment in the financial services industry. Our short-term goals include continuing the growth of our loan portfolio, changing the mix of our deposits base to be more concentrated in lower costing core deposits, collecting payments on non-accrual and past due loans, enhancing and improving credit quality, expanding fee income, maintaining a sensible branch network, and using technology to improve efficiencies and enhance the customer experience.
We identified several strategic priorities inour three year Strategic Plan. Those priorities included focusing on the following core areas:
| | ● | Efficient Operating Revenue Growth – Generating sustainable, profitable operating revenue through smart growth of earning assets that are funded by low-cost core deposits and growth of noninterest income. In addition, we will focus on efficient utilization of the Bank’s assets and other resources. This strategic priority includes prudent loan growth, sales strategies to attract and grow small business deposit and other fee income services, strategic marketing campaigns, studying and benchmarking efficiency and productivity, and focusing on ways to utilize technology to drive earnings. |
| | ● | Well-defined and integrated delivery channels – Create and support delivery channels and branch strategy that leverages technology and optimizes efficiencies. This strategy will focus on enhancing the overall customer experience through a seamless integration of all delivery channels, including both existing and newly rolled-out channels. |
| | ● | Acquisition strategy and planning - It is expected that the banking industry will continue to consolidate over the coming years due to a competitive market and the cost of regulatory compliance. Hamilton Bancorp is well positioned to take advantage of strategic opportunities that present themselves either through potential mergers or acquisitions in our marketplace. This may include other financial institutions, individual branches, or loan purchases. The focus will be on proactive evaluation and contact with potential targets and the implementation of a capital strategy to fund such acquisitions, including investor relations. These opportunities, however, will be aligned with our strategic vision and goal of creating shareholder value and growth. We currently have no agreements or arrangements relating to any merger or acquisition. |
Although the current economic climate continues to present significant challenges for the financial industry, management feels that based on our strategic initiatives we have positioned the Company to capitalize on the opportunities that may become available in the current economy, as well as a healthier economy going forward.
Critical Accounting Policies
The discussion and analysis of the financial condition and results of operations are based on our consolidated financial statements, which are prepared in conformity with generally accepted accounting principles used in the United States of America. The preparation of these consolidated financial statements requires management to make estimates and assumptions affecting the reported amounts of assets and liabilities, disclosure of contingent assets and liabilities, and the reported amounts of income and expenses. We consider the accounting policies discussed below to be critical accounting policies. The estimates and assumptions that we use are based on historical experience and various other factors and are believed to be reasonable under the circumstances. Actual results may differ from these estimates under different assumptions or conditions, resulting in a change that could have a material impact on the carrying value of our assets and liabilities and our results of operations.
On April 5, 2012, the Jumpstart Our Business Startups Act of 2012 (the “JOBS Act”) was signed into law. The JOBS Act contains provisions that, among other things, reduce certain reporting requirements for qualifying public companies. As an “emerging growth company” we may delay adoption of new or revised accounting pronouncements applicable to public companies until such pronouncements are made applicable to private companies. We have chosen to take advantage of the benefits of this extended transition period. Accordingly, our consolidated financial statements may not be comparable to companies that comply with such new or revised accounting standards.
For a discussion of significant accounting policies,see Note 1—Nature of Operations andSummary of Significant Accounting Policies in the Notes to our Consolidated Financial Statements. The following are the accounting policies that we believe require the most subjective or complex judgments, and as such could be most subject to revision as new information becomes available:
Allowance for Loan Losses.The allowance for loan losses is the estimated amount considered necessary to cover inherent credit losses in the loan portfolio at the balance sheet date. The allowance is established through the provision for losses on loans which is charged against income. In determining the allowance for loan losses, management makes significant estimates and has identified this policy as one of our most critical accounting policies.
Management, at a minimum, performs a quarterly evaluation of the allowance for loan losses. Consideration is given to historical losses in conjunction with a variety of other factors including, but not limited to, current economic conditions, delinquency statistics, geographic and industry concentrations, the adequacy of the underlying collateral, the financial strength of the borrower, results of internal loan reviews and other relevant factors. This evaluation is inherently subjective as it requires material estimates that may be susceptible to significant change.
The analysis has two components, specific and general allocations. Specific allocations can be made for estimated losses related to loans that are determined to be impaired. Impairment is measured by determining the present value of expected future cash flows or, for collateral-dependent loans, the fair value of the collateral adjusted for market conditions and selling expenses. If the fair value of the loan is less than the loan’s carrying value, a charge is recorded for the difference. The general allocation is determined by segregating the remaining loans by type of loan, risk weighting (if applicable) and payment history. We also analyze historical loss experience, delinquency trends, general economic conditions and geographic and industry concentrations. This analysis establishes factors that are applied to the loan groups to determine the amount of the general reserve.
We cannot predict with certainty the amount of loan charge-offs that we will incur. Our regulatory agencies, as an integral part of their examination processes, periodically review our allowance for credit losses. Such agencies may require that we recognize additions to the allowance for credit losses based on their judgments about information available to them at the time of their examination. To the extent that actual outcomes differ from management’s estimates, additional provisions to the allowance for credit losses may be required that would adversely impact earnings in future periods.
Securities Valuation and Impairment. We classify our investments in debt and equity securities as either held to maturity or available for sale. Securities classified as held to maturity are recorded at cost or amortized cost. Available-for-sale securities are carried at fair value. We obtain our fair values from a third party service. This service’s fair value calculations are based on quoted market prices when such prices are available. If quoted market prices are not available, estimates of fair value are computed using a variety of techniques, including extrapolation from the quoted prices of similar instruments or recent trades for thinly traded securities, fundamental analysis, or through obtaining purchase quotes. Due to the subjective nature of the valuation process, it is possible that the actual fair values of these investments could differ from the estimated amounts, thereby affecting our financial position, results of operations and cash flows.
If the estimated value of investments is less than the cost or amortized cost, we evaluate whether an event or change in circumstances has occurred that may have a significant adverse effect on the fair value of the investment. If such an event or change has occurred and we determine that the impairment is other-than-temporary, we record the impairment of the investment in the period in which the event or change occurred. We also consider how long a security has been in a loss position in determining if it is other than temporarily impaired. Management also assesses the nature of the unrealized losses taking into consideration factors such as changes in risk-free interest rates, general credit spread widening, market supply and demand, creditworthiness of the issuer, and quality of the underlying collateral. At March 31, 2017, all of our securities were either issued by U.S. government agencies, U.S. government-sponsored enterprises, municipalities, or corporations.
Goodwill Impairment.Goodwill represents the excess purchase price paid over the fair value of the net assets acquired. Goodwill is not amortized but is tested for impairment annually or more frequently if events or changes in circumstances indicate that the asset might be impaired. The Company is considered the Reporting Unit for purposes of impairment testing. Impairment testing requires that the fair value of the Company be compared to the carrying amount of the Company’s net assets, including goodwill. If the fair value of the Company exceeds the book value, no write-down of recorded goodwill is required. If the fair value of the Company is less than book value, an expense may be required to write-down the related goodwill to the proper carrying value. We test for impairment of goodwill during February of each year. We estimate the fair value of the Company utilizing four valuation methods including the Comparable Transactions Approach, the Control Premium Approach, the Public Market Peers Approach, and the Discounted Cash Flow Approach.
Based on our impairment testing during February 2017, there was no evidence of impairment of the Company’s goodwill or intangible assets.
Business Combinations.Business combinations are accounted for using the acquisition method of accounting. Under the acquisition method of accounting, acquired assets and assumed liabilities are included with the acquirer's accounts as of the date of acquisition at estimated fair value, with any excess of purchase price over the fair value of the net assets acquired (including identifiable core deposit intangibles) capitalized as goodwill. In the event that the fair value of the net assets acquired exceeds the purchase price, an acquisition gain is recorded for the difference in consolidated statements of operations for the period in which the acquisition occurred. The core deposit intangible asset is recognized as an asset apart from goodwill when it arises from contractual or other legal rights or if it is capable of being separated or divided from the acquired entity and sold, transferred, licensed, rented or exchanged. In addition, acquisition-related costs and restructuring costs are recognized as period expenses as incurred.
Income Taxes.We account for income taxes under the asset/liability method. We recognize deferred tax assets for the future consequences attributable to differences between the financial statement carrying amounts of existing assets and liabilities and their respective tax bases, as well as operating loss and tax credit carry-forwards. We measure deferred tax assets and liabilities using enacted tax rates expected to apply to taxable income in the years in which those temporary differences are expected to be recovered or settled. We recognize the effect on deferred tax assets and liabilities of a change in tax rates in income in the period indicated by the enactment date. We establish a valuation allowance for deferred tax assets when, in the judgment of management, it is more likely than not that such deferred tax assets will not become realizable. The judgment about the level of future taxable income is dependent to a great extent on matters that may, at least in part, be beyond our control. It is at least reasonably possible that management’s judgment about the need for a valuation allowance for deferred tax assets could change in the near term.
Comparison of Financial Condition at March 31, 2017 and March 31, 2016
Assets. Total assets increased $121.6 million, or 31.0%, to $514.5 million at March 31, 2017 from $392.9 million at March 31, 2016. The increase is mostly attributable to $153.4 million in identifiable assets acquired in the Fraternity acquisition, along with $2.1 million in intangible assets that were created and $23.4 million in loan purchases, offset by $25.7 million in cash paid to fund the Fraternity acquisition.
Cash and Cash Equivalents. Cash and cash equivalents decreased by $38.1 million, or 56.5%, to $29.4 million at March 31, 2017 from $67.4 million at March 31, 2016. The decrease in cash is a result of the $25.7 million in cash paid in the Fraternity acquisition, approximately $50.6 million in investment purchases, and a $37.5 million increase in our legacy loan portfolio, partially offset by the $15.2 million in cash acquired in the Fraternity transaction along with an estimated $33.3 million in maturing, called or principal repayments within the investment portfolio and $29.5 million in principal reduction related to the acquired loans.
Certificates of Deposit Held as Investment. Certificates of deposit (“CDs”) declined $3.5 million from $4.0 million at March 31, 2016 to $499,000 at March 31, 2017. The decline resulted from $1.7 million in CDs that matured and another $1.7 million that were sold. The $1.7 million in CDs were sold at a loss of $2,000 and re-invested into a higher yielding security. The CDs held consist of individual amounts that are equal to or less than $250,000 and fully insured by the FDIC. The weighted average rate and term of the portfolio is 2.28% and 4.6 years, respectively.
Securities. Our investment portfolio consists primarily of investment grade securities including U.S. government agency and government-sponsored entity securities, securities issued by states, counties and municipalities, corporate bonds, and mortgage-backed securities. At March 31, 2017, all securities are classified as available for sale. While we usually intend to hold investment securities until maturity, this classification provides us the opportunity to divest of securities that may no longer meet our liquidity objectives.
Investment securities increased $31.9 million, or 45.3%, to $102.4 million at March 31, 2017, from $70.5 million at March 31, 2016. The increase is attributable to $17.6 million in securities acquired in the Fraternity acquisition, along with the purchase of $50.6 million in municipal and collateralized mortgage obligations and mortgage-backed securities. Purchases and acquisitions were partially offset by $10.0 million in agency and municipal securities that were called or matured and $18.6 million in monthly principal pay-downs associated with collateralized mortgage obligations and mortgage-backed securities issued by government sponsored enterprises (“GSEs”). There were $4.3 million in securities sold during fiscal 2017 at a gain of $24,000. The fair value of the investment portfolio decreased $2.2 million from an unrealized net loss position of $36,000 at March 31, 2016 to an unrealized net loss position of $2.2 million at March 31, 2017. The decrease in fair value of the investment portfolio is a result of the increase in interest rates that were realized during the year and more specifically in November 2016.
We evaluated securities with unrealized losses for an extended period of time and determined that these losses were temporary because, at this point in time, we have the ability to hold them until maturity. Currently, we have no intent to sell these securities. However, if market conditions or funding needs change, we may sell securities if needed. As the maturity date moves closer and/or interest rates decline, we expect that any unrealized losses for individual securities in the portfolio will decline or dissipate. As a result, we have not identified any portion of the unrecorded loss as being attributed to credit deterioration in the issuer of the security.
Loans. Excluding loans held for sale and loan origination fees and costs, gross loans receivable increased by $116.2 million, or 52.2%, to $339.0 million at March 31, 2017 from $222.8 million at March 31, 2016. Included in loans at March 31, 2017 is $108.8 million in loans associated with the Fraternity acquisition (included in the “acquired” loan column of the table below along with loans acquired from the Fairmount acquisition). The Company also purchased a portfolio of one-to-four family residential jumbo loans in the last quarter of fiscal 2017 totaling $23.4 million. Lastly, we had total new loan originations of $68.1 million during the year ended March 31, 2017. At March 31, 2017, total loans were 65.9% of total assets compared to 56.7% of total assets at March 31, 2016.
The following table details the composition of loans, excluding loans held for sale, and the related percentage mix and growth of total loans. In addition to the loans we hold in our portfolio, we had loans held for sale of $259,000 at March 31, 2016. We did not hold any loans for sale as of March 31, 2017.
| | | March 31, 2017 | | | March 31, 2016 | |
| | | | | | | | | | | | | | | Percent | | | | | | | | | | | | | | | Percent | |
| | | Legacy | | | Acquired | | | Total | | | of Total | | | Legacy | | | Acquired | | | Total | | | of Total | |
Real estate loans: | | | | | | | | | | | | | | | | | | | | | | | | | | | | | | | | |
One-to four-family: | | | | | | | | | | | | | | | | | | | | | | | | | | | | | | | | |
Residential | | $ | 67,126,677 | | | $ | 83,892,389 | | | $ | 151,019,066 | | | | 45 | % | | $ | 46,263,709 | | | $ | 23,036,569 | | | $ | 69,300,278 | | | | 31 | % |
Residential construction | | | 6,426,076 | | | | - | | | | 6,426,076 | | | | 2 | % | | | 4,304,189 | | | | 965,440 | | | | 5,269,629 | | | | 2 | % |
Investor | | | 6,742,469 | | | | 18,779,644 | | | | 25,522,113 | | | | 8 | % | | | 12,076,911 | | | | 15,783,008 | | | | 27,859,919 | | | | 13 | % |
Commercial | | | 92,665,689 | | | | 14,898,523 | | | | 107,564,212 | | | | 32 | % | | | 75,225,984 | | | | 2,889,219 | | | | 78,115,203 | | | | 35 | % |
Commercial construction | | | 1,881,541 | | | | 1,308,652 | | | | 3,190,193 | | | | 2 | % | | | 1,982,571 | | | | 1,274,148 | | | | 3,256,719 | | | | 2 | % |
Total real estate loans | | | 174,842,452 | | | | 118,879,208 | | | | 293,721,660 | | | | 87 | % | | | 139,853,364 | | | | 43,948,384 | | | | 183,801,748 | | | | 83 | % |
Commercial business | | | 19,518,029 | | | | 2,019,337 | | | | 21,537,366 | | | | 6 | % | | | 17,773,967 | | | | 2,621,625 | | | | 20,395,592 | | | | 9 | % |
Home equity loans | | | 13,278,229 | | | | 7,266,141 | | | | 20,544,370 | | | | 6 | % | | | 12,222,688 | | | | 2,168,073 | | | | 14,390,761 | | | | 6 | % |
Consumer | | | 2,258,836 | | | | 937,600 | | | | 3,196,436 | | | | 1 | % | | | 3,072,677 | | | | 1,106,434 | | | | 4,179,111 | | | | 2 | % |
Total loans | | $ | 209,897,546 | | | $ | 129,102,286 | | | $ | 338,999,832 | | | | 100 | % | | $ | 172,922,696 | | | $ | 49,844,516 | | | $ | 222,767,212 | | | | 100 | % |
Approximately $74.9 million, or 69%, of the $108.8 million in loans acquired in the Fraternity acquisition consisted of one-to-four family residential loans, while $9.2 million, or 8.5%, consisted of investor real estate loans. Investor real estate loans represent funds advanced to borrowers for the purchase or refinance of non-owner occupied one-to-four family properties. Investor real estate loans make up $18.8 million, or 14.5%, of the $129.1 million in acquired loans as of March 31, 2017. In addition, $14.2 million, or 13.1%, in commercial real estate loans and $7.4 million, or 6.8%, in home equity loans were also acquired from Fraternity.
During the third and fourth quarter of fiscal 2017, respectively, the Company sold a pool of performing and non-performing loans that primarily consisted of residential non-owner occupied investor loans. Both pools were obtained primarily through our Fairmount acquisition and had an aggregate contractual balance of $6.4 million and a book balance of $4.5 million prior to sale. These loans were identified as held for sale in each respective period and written down by $1.6 million to the lower of cost or fair value based upon the estimated sales price. After the necessary write-downs, these pools were subsequently sold with no material gain or loss. Management determined it was prudent to sell these loans, especially the non-performing investor loans, as the costs associated with these properties, including maintenance and water bills were accumulating and the borrowers did not have the funds to properly maintain the properties. In addition, the collateral values associated with these properties located in Baltimore City were deteriorating as evidenced by recent appraisals. Based upon an analysis, management estimated the cost associated with both pools, including legal, personnel time, appraisals, and other costs associated with foreclosure would be greater if the properties were not sold and the bank was forced to foreclose on each individual property. Finally, based upon the length of time it takes to foreclose on a property in Maryland, typically 1-3 years, the Company could potentially be carrying a non-earning asset for an extended period of time.
The Bank continues to focus on organic growth through origination of both commercial real estate and commercial business loans as these loans offer higher rates of return and shorter maturity periods than typical retail lending. The largest increase organically in loans during fiscal 2017, as shown in the previous table above under “legacy”, is a $17.4 million, or 23.2%, increase in commercial real estate loans from $75.2 million at March 31, 2016 to $92.7 million at March 31, 2017. Commercial business loans also increased $1.7 million, or 9.8%, to $19.5 million at March 31, 2017 from $17.8 million at March 31, 2016. A large part of the increase in commercial business loans occurred in the quarter ended December 31, 2016. In the last half of fiscal 2017, management has focused on diversifying the commercial loan portfolio and seeking more asset-based type lending relationships. The Bank continues to see the benefits of our commercial lending platform that was restructured in the first half of fiscal 2016, with new personnel and improved underwriting and monitoring procedures, from both an origination and credit quality perspective.
The Bank continues to originate traditional one-to-four family residential loans and sell them in the secondary market at a premium in order to manage interest rate risk in a rising rate environment. However, in the last half of fiscal 2017 we have begun to portfolio some of these loans due to the increase in normal attrition within this loan segment resulting from the acquisitions. We also purchased a $23.4 million residential jumbo loan portfolio in March 2017 which accounts for much of the increase in one-to-four family residential loans in fiscal 2017 under “legacy” loans. To supplement our residential loan portfolio, in fiscal 2015 the Company began to promote its one-to-four family residential construction lending program. During fiscal 2017, the Bank has originated roughly $15.9 million in residential construction loans. As a result, at March 31, 2017 we had $11.8 million in residential construction commitments, of which $6.0 million in funds have been advanced; compared to $7.9 million in residential construction commitments at March 31, 2016 of which $5.3 million in funds had been advanced. The construction period on residential homes is typically nine to twelve months, at which time Hamilton Bank is often repaid through permanent financing by a third party.
Bank-Owned Life Insurance. We invest in bank-owned life insurance (“BOLI”) to provide us with a funding source for our benefit plan obligations. BOLI also provides us noninterest income that is tax-exempt. Federal regulations generally limit our investment in BOLI to 25% of our Tier 1 capital plus our allowance for loan losses. At March 31, 2017, our investment in bank-owned life insurance was $18.3 million, an increase of $5.5 million from $12.7 million at March 31, 2016. The increase is attributable to $5.1 million in BOLI that was part of the Fraternity acquisition and the remaining difference is associated with the increase in the cash surrender value of the insurance policies.
Deposits. Total deposits (excluding premiums on acquired deposits) increased $98.4 million, or 31.4%, to $412.0 million at March 31, 2017 from $313.7 million at March 31, 2016, including $110.0 million in deposits assumed in the Fraternity acquisition. Approximately $22.4 million, or 20.4%, of the acquired deposits from Fraternity were core deposits, which we consider to be all deposits other than certificates of deposit. The Company continues to focus on changing its deposit mix to rely less on time deposits as a primary funding source and attract lower costing core deposits, including money market accounts. Money market accounts have increased the most with respect to core deposits based upon a money market promotion that was run from May through June 2016 and then started up again in December 2016. Including the Fraternity acquisition, core deposits have increased $45.8 million, or 38.6%, to $164.4 million at March 31, 2017 compared to $118.6 million at March 31, 2016. Core deposits account for 38.9% of total deposits at March 31, 2017.
The following table details the composition of deposits and the related percentage mix and growth of total deposits.
| | | March 31, 2107 | | | March 31, 2016 | | | Year-To-Date Growth | |
| | | | | | | Percent | | | | | | | Percent | | | | | | | Growth | |
| | | Total | | | of Total | | | Total | | | of Total | | | Amount | | | Percent | |
Savings | | $ | 44,614,415 | | | | 11 | % | | $ | 33,010,962 | | | | 11 | % | | $ | 11,603,454 | | | | 35 | % |
Noninterest-bearing checking | | | 30,401,454 | | | | 7 | % | | | 19,747,437 | | | | 6 | % | | | 10,654,018 | | | | 54 | % |
Interest-bearing checking | | | 26,415,189 | | | | 6 | % | | | 13,298,677 | | | | 4 | % | | | 13,116,512 | | | | 99 | % |
Money market accounts | | | 62,962,902 | | | | 15 | % | | | 52,576,567 | | | | 17 | % | | | 10,386,335 | | | | 20 | % |
Time deposits | | | 247,632,742 | | | | 60 | % | | | 195,031,411 | | | | 62 | % | | | 52,601,331 | | | | 27 | % |
| | | $ | 412,026,702 | | | | 100 | % | | $ | 313,665,054 | | | | 100 | % | | $ | 98,361,648 | | | | 31 | % |
Premium on deposits asssumed | | | 829,072 | | | | | | | | 328,597 | | | | | | | | 500,475 | | | | | |
Total deposits | | $ | 412,855,774 | | | | | | | $ | 313,993,651 | | | | | | | $ | 98,862,123 | | | | | |
As loan demand has increased over fiscal 2017, our strategy with respect to deposit balances has been to maintain our current certificate of deposit base through short-term certificate of deposit promotions, as we continue to focus on growing our core deposits at a faster pace.
Borrowings. Borrowings consist of both short and long-term advances from the Federal Home Loan Bank (FHLB) and a note payable associated with an automobile. At March 31, 2017 the Company had $35.5 million in FHLB borrowings outstanding compared to $14.5 million at March 31, 2016. The increase over fiscal 2017 is attributable to $15.0 million in FHLB advances assumed in the Fraternity acquisition, $5.0 million of which are coming due in fiscal 2018 and $10.0 million in fiscal 2019. These advances were originally longer-term borrowings and carried higher rates of interest varying from 3.4% to 4.3%. As a result of the higher stated rates, the Company recorded a discount of $794,000 when accounting for the borrowings at fair value upon acquisition. At March 31, 2017, the remaining discount is $410,000. The accretion of this discount will offset the higher stated rate of these borrowings. In addition to the acquired borrowings, the Company also entered into $11.5 million of new FHLB advances in the last quarter of fiscal 2017 to supplement funding of the $23.4 million in purchases of residential jumbo loan portfolios. Partially offsetting the increase in advances is $5.5 million in advances that matured over the past twelve months with an average stated interest rate of 0.58%.
At March 31, 2017, $11.0 million of the total advances are considered short-term and mature in less than one year, while the remaining $24.5 million in advances are considered long-term and mature in more than one year. Included in long-term advances is $11.6 million in advances that mature on a quarterly basis, however they are associated with several cash flow hedge transactions and will be continuously renewed over the expected life of the hedged transactions. The hedge transactions currently have an average life of 7.3 years. Excluding the advances associated with the hedge transactions, the longest outstanding borrowing is for $1.0 million and matures in October 2018.
The FHLB borrowings provide an alternative means to support the cash outflow needed to fund new loan originations in coordination with deposit growth. FHLB borrowings can provide a less expensive means to support cash outflow when compared to selling higher yielding investment securities. These obligations are secured by our residential and home equity loan portfolios. At March 31, 2017, we had the ability to borrow approximately $88.2 million in additional funds from the FHLB, subject to our pledging sufficient assets. These obligations will be repaid as our cash position strengthens.
Equity. Total equity decreased $1.8 million, or 2.8%, to $59.8 million at March 31, 2017 from $61.5 million at March 31, 2016. The change in equity is primarily attributable the $929,000 loss reported for fiscal 2017 along with a $1.4 million decline in accumulated other comprehensive loss associated with the decrease in the fair value of the investment portfolio. The fair value of the investment portfolio declined as a result of the increase in interest rates that occurred most significantly in November 2016. The decrease was partially offset by a $414,000 increase in additional paid in capital resulting from the expense derived from equity awards granted in prior periods and the allocation of 14,812 in common stock under the Employee Stock Ownership Program. Overall equity was not materially impacted by the acquisition of Fraternity due to the acquisition being an all cash transaction. The Company’s book value per common share was $17.53 at March 31, 2017 compared to $18.03 at March 31, 2016.
Comparison of Results of Operations for the Years Ended March 31, 2017 and March 31, 2016
General. Net loss was $929,000 or $(0.29) per basic and diluted common share for the fiscal year ended March 31, 2017 compared to a net loss of $93,000 or $(0.03) per basic and diluted common share for fiscal 2016, a period-over-period decline in operating results of $836,000. The increased net loss resulted primarily from a $3.0 million increase in the provision for loan loss, a $3.0 million increase in noninterest expense that was partially attributable to acquisition and acquisition related expenses, and a $500,000 decline in noninterest revenue, partially offset by a $4.4 million increase in net interest income and a $1.2 million decrease in tax expense.
Net Interest Income.Net interest income before provision for loan losses increased $4.4 million, or 46.6%, to $13.9 million for the year ended March 31, 2017 compared to $9.5 million for the year ended March 31, 2016. The increase in net interest income was due to a $5.4 million increase in interest revenue, partially offset by a $1.0 million increase in interest expense. The increase in interest revenue was due to an increase in the average balance of interest-earning assets, particularly higher yielding loans, as well as a slight increase in average yield on interest-earning assets. The average balance of interest-earning assets increased $143.2 million, or 45.6%, during the twelve months ended March 31, 2017 compared to the same period in fiscal 2016, while the average yield increased 6 basis points from 3.61% to 3.67% over that same period. The average balances increased primarily as a result of the acquisitions of Fairmount and Fraternity and to a lesser extent due to organic growth. The Fairmount acquisition occurred at the end of September 2015 and had less of an impact on the prior year period.
The increase in the average balance of interest-earning assets for the year ended March 31, 2017 was offset by a $151.9 million increase in the average balance of interest-bearing liabilities over that same period. The increase is attributable to both deposits and borrowings acquired in the Fairmount and Fraternity acquisitions, as well as management’s focus on increasing the deposit base and entering into new borrowings to fund loan growth. The average cost of interest-bearing liabilities for the comparative period declined 2 basis points from 0.72% for the twelve months ended March 31, 2016 to 0.70% for the twelve months ended March 31, 2017. Our net interest margin increased 2 basis points to 3.04% for the year ended March 31, 2017 from 3.02% for the year ended March 31, 2016.
Interest Revenue.Interest revenue increased $5.4 million, or 48.1% to $16.8 million for the year ended March 31, 2017, compared to $11.3 million for the year ended March 31, 2016, as a result of increases in interest and fees on loans, interest revenue earned on investment securities, and revenue from federal funds sold and other bank deposits.
Interest and fees on loans increased $5.2 million, or 53.8%, to $14.8 million for the twelve months ended March 31, 2017, compared to $9.6 million for the same period a year ago. The increase in interest and fees on loans is due to a $117.2 million increase in the average balance of net loans from $197.3 million to $314.5 million period-over-period. The increase in average loans is attributable to the loans acquired in both the Fairmount and Fraternity acquisitions, as well as our new commercial lending platform and staff that was put in place at the beginning of fiscal 2015. The Fairmount acquisition occurred near the end of September 2015 and had less of an impact on the prior year period. Partially offsetting the revenue derived from an increase in the average balance of loans is a 17 basis point decline in the average yield earned on loans from 4.89% for the year ended March 31, 2016 to 4.72% for the year ended March 31, 2017. The decline in yield is a result of the extended low interest rate environment and the competitive pressure relating to pricing.
Interest revenue on investment securities increased $159,000 to $1.7 million for the twelve months ended March 31, 2017 from $1.6 million for the twelve months ended March 31, 2016. The average balance of investment securities increased by $11.1 million, or 13.3%, to $94.4 million for the year ended March 31, 2017 from $83.3 million for the same period last year, while the average yield decreased 5 basis points to 1.84% from 1.89%, respectively. The largest increase in average investments was in mortgage-backed securities, which increased $9.0 million to $71.4 million for the twelve months ended March 31, 2017 from $62.4 million for the same period last year. The average balance of investment securities increased $2.0 million over that same period.
Interest Expense.Total interest expense increased $1.0 million, or 55.8%, to $2.9 million for the year ended March 31, 2017 compared to $1.8 million for the year ended March 31, 2016, due primarily to the increase in the average balances of both interest-bearing deposits and borrowings. The average balances of interest bearing deposits increased $137.7 million, or 56.1%, to $383.1 million for the twelve months ended March 31, 2017 from $245.5 million for the twelve months ended March 31, 2016. The average cost of deposits declined from 0.71% to 0.68% over those same periods, a 3-basis point decline. A significant portion of our time deposits have already re-priced in today’s low interest rate environment, as a result, the increase in interest expense is more attributable to an increase in average balances than it is to the change in interest rates.
For the year ended March 31, 2017, average interest-bearing deposit balances increased for all types of deposits when compared to the same period last year as a result of both the Fraternity and Fairmount acquisitions, as well as promotional efforts to raise funds for new loan growth. We remain focused on changing the mix of our deposit portfolio by maintaining our maturing certificates of deposits and growing lower cost core deposits, including savings, interest-bearing checking and money market accounts. The average balance of time deposits increased $87.7 million, or 50.9%, to $259.7 million for the twelve months ended March 31, 2017 compared to $172.1 million for the twelve months ended March 31, 2016. Over this same period, the average balance of core interest bearing deposits increased $50.0 million, or 68.1%, to $123.4 million for the twelve months ended March 31, 2017 compared to $73.4 million for the twelve months ended March 31, 2016. The growth in core deposits was primarily a result of the continued efforts by our cash management and financial service teams, as well as those core deposits assumed in the Fraternity and Fairmount acquisitions.
Non-interest bearing deposits allow us to fund growth in interest earning assets at minimal cost. As a result of the growth generated from the efforts of our cash management personnel, commercial loan officers working with commercial clients to move their deposit relationship to Hamilton Bank and the acquisitions of Fairmount and Fraternity, average non-interest bearing deposits increased $4.8 million, or 24.9%, to $24.1 million for the year ended March 31, 2017, compared to $19.3 million for the year ended March 31, 2016.
For the year ended March 31, 2017, the average interest-bearing borrowings were $26.1 million compared to an average balance of $11.9 million for the same period a year ago. The borrowings primarily consisted of advances from the Federal Home Loan Bank (“FHLB”). At March 31, 2017, the Bank had $35.5 million in outstanding advances from the FHLB, including $24.0 million in borrowings assumed through the Fairmount and Fraternity acquisitions. These borrowings carried an average rate of 1.04% for the year ended March 31, 2017. Borrowing from the FHLB in today’s low interest rate environment can be a more cost effective means to obtain funds if deposits are not growing compared to selling investment securities that are earning a higher yield.
Average Balances and Yields.The following table presents information regarding average balances of assets and liabilities, the total dollar amounts of interest revenue and interest expense from average interest-earning assets and average interest-bearing liabilities, respectively, and the resulting annualized average yields and costs. The yields and costs for the periods indicated are derived by dividing revenue or expense by the average balances of assets or liabilities, respectively, for the periods presented. For purposes of this table, average balances have been calculated using average daily balances. No tax-equivalent adjustments were made. Nonaccrual loans have been included in the table as loans carrying a zero yield.
| | | Year Ended March 31, | |
| | | (dollars in thousands) | |
| | | 2017 | | | 2016 | |
| | | Average | | | | | | | Yield/ | | | Average | | | | | | | Yield/ | |
| | | Balance | | | Interest | | | Cost | | | Balance | | | Interest | | | Cost | |
Interest-earning assets: | | | | | | | | | | | | | | | | | | | | | | | | |
Cash and cash equivalents | | $ | 48,207 | | | $ | 190 | | | | 0.39 | % | | $ | 33,285 | | | $ | 96 | | | | 0.29 | % |
Investment securities (1) | | | 22,953 | | | | 553 | | | | 2.41 | % | | | 20,924 | | | | 476 | | | | 2.27 | % |
Mortgage-backed securities | | | 71,448 | | | | 1,183 | | | | 1.66 | % | | | 62,415 | | | | 1,102 | | | | 1.77 | % |
Loans receivable, net (2) | | | 314,473 | | | | 14,836 | | | | 4.72 | % | | | 197,276 | | | | 9,644 | | | | 4.89 | % |
Total interest-earning assets | | | 457,081 | | | | 16,762 | | | | 3.67 | % | | | 313,900 | | | | 11,318 | | | | 3.61 | % |
Noninterest-earning assets | | | 40,634 | | | | | | | | | | | | 25,555 | | | | | | | | | |
Total assets | | $ | 497,715 | | | | | | | | | | | $ | 339,455 | | | | | | | | | |
| | | | | | | | | | | | | | | | | | | | | | | | | |
Interest-bearing liabilities: | | | | | | | | | | | | | | | | | | | | | | | | |
Certificates of deposit | | $ | 259,721 | | | $ | 2,305 | | | | 0.89 | % | | $ | 172,064 | | | $ | 1,652 | | | | 0.96 | % |
Money Market | | | 61,568 | | | | 225 | | | | 0.37 | % | | | 35,124 | | | | 61 | | | | 0.17 | % |
Statement savings | | | 43,527 | | | | 65 | | | | 0.15 | % | | | 25,843 | | | | 25 | | | | 0.10 | % |
NOW accounts | | | 18,333 | | | | 5 | | | | 0.03 | % | | | 12,447 | | | | 4 | | | | 0.03 | % |
Total interest-bearing deposits | | | 383,149 | | | | 2,600 | | | | 0.68 | % | | | 245,478 | | | | 1,742 | | | | 0.71 | % |
Borrowings | | | 26,090 | | | | 271 | | | | 1.04 | % | | | 11,867 | | | | 101 | | | | 0.85 | % |
Total interest-bearing liabilities | | | 409,239 | | | | 2,871 | | | | 0.70 | % | | | 257,345 | | | | 1,843 | | | | 0.72 | % |
| | | | | | | | | | | | | | | | | | | | | | | | | |
Noninterest-bearing liabilities and equity: | | | | | | | | | | | | | | | | | | | | | | | | |
Noninterest-bearing deposits | | | 24,078 | | | | | | | | | | | | 19,282 | | | | | | | | | |
Other noninterest-bearing liabilities | | | 5,425 | | | | | | | | | | | | 1,809 | | | | | | | | | |
Total liabilities | | | 438,742 | | | | | | | | | | | | 278,436 | | | | | | | | | |
Total shareholders’ equity | | | 58,973 | | | | | | | | | | | | 61,019 | | | | | | | | | |
Total liabilities and shareholders’ equity | | $ | 497,715 | | | | | | | | | | | $ | 339,455 | | | | | | | | | |
| | | | | | | | | | | | | | | | | | | | | | | | | |
Net interest income | | | | | | $ | 13,891 | | | | | | | | | | | $ | 9,475 | | | | | |
Net interest rate spread (3) | | | | | | | | | | | 2.97 | % | | | | | | | | | | | 2.89 | % |
Net interest-earning assets (4) | | $ | 47,842 | | | | | | | | | | | $ | 56,555 | | | | | | | | | |
Net interest margin (5) | | | | | | | | | | | 3.04 | % | | | | | | | | | | | 3.02 | % |
Average interest-earning assets to averageinterest-bearing liabilities | | | 111.69 | % | | | | | | | | | | | 121.98 | % | | | | | | | | |
(1) Includes U.S agency and treasury securities, municipal and corporate bonds and, to a much lesser extent, Federal Home Loan Bank equity securities.
(2) Loans on non-accrual status are included in average loans carrying a zero yield.
(3) Net interest rate spread represents the difference between the yield on average interest-earning assets and the cost of average interest-bearing libilities.
(4) Net interest-earning assets represents total interest-earning assets less total interest-bearing liabilities.
(5) Net interest margin represents net interest income divided by average total interest-earning assets.
Rate/Volume Analysis. The following table sets forth the effects of changing rates and volumes on our net interest income. The rate column shows the effects attributable to changes in rate (changes in rate multiplied by prior volume). The volume column shows the effects attributable to changes in volume (changes in volume multiplied by prior rate). The net column represents the sum of the prior columns. For purposes of this table, changes attributable to changes in both rate and volume that cannot be segregated have been allocated proportionately based on the changes due to rate and the changes due to volume.
| | | 2017 Compared to 2016 | |
| | | Increase (Decrease) Due to | |
| | | Volume | | | Rate | | | Net | |
| | | (In thousands) | |
Interest-earning assets: | | | | | | | | | | | | |
| | | | | | | | | | | | | |
Cash and cash equivalents | | $ | 43 | | | $ | 51 | | | $ | 94 | |
Investment securities | | | 46 | | | | 31 | | | | 77 | |
Mortgage-backed securities | | | 160 | | | | (79 | ) | | | 81 | |
Loans receivable | | | 5,731 | | | | (539 | ) | | | 5,192 | |
| | | | | | | | | | | | | |
Total interest-earning assets | | | 5,980 | | | | (536 | ) | | | 5,444 | |
| | | | | | | | | | | | | |
Interest-bearing liabilities: | | | | | | | | | | | | |
| | | | | | | | | | | | | |
Certificates of Deposit | | | 842 | | | | (189 | ) | | | 653 | |
Money Market | | | 45 | | | | 119 | | | | 164 | |
Statement savings | | | 18 | | | | 22 | | | | 40 | |
NOW accounts | | | 2 | | | | (1 | ) | | | 1 | |
Borrowings | | | 121 | | | | 49 | | | | 170 | |
| | | | | | | | | | | | | |
Total interest-bearing liabilities | | | 1,027 | | | | 1 | | | | 1,028 | |
| | | | | | | | | | | | | |
Change in net interest income | | $ | 4,953 | | | $ | (537 | ) | | $ | 4,416 | |
Provision for Loan Losses.We establish provisions for loan losses that are charged to operations in order to maintain the allowance for loan losses at a level believed, to the best of management’s knowledge, to cover all known and inherent losses in the portfolio both probable and reasonable to estimate at each reporting date. There was $3.4 million charged to the provision for loan losses for the fiscal year ending March 31, 2017 compared to a provision for loan losses of $440,000 for the fiscal year ending March 31, 2016. The Company recorded a higher provision during fiscal 2017 compared to fiscal 2016 due to (i) $1.1 million in charge-offs taken relating to one commercial real estate loan relationship, (ii) $1.6 million in charge-offs associated with a pool of acquired residential non-owner occupied investor loans that were packaged and sold during the last quarter of fiscal 2017, and (iii) approximately $170,000 in provisions resulting from two performing Trouble Debt Restructure (“TDR”) loans that continued to receive a lower risk adjusted rate of interest when their modified rate period expired. In addition to these specific items, the charge-off history with respect to commercial real estate loans increased as a result of the $1.1 million charge-off noted earlier, resulting in additional provisions to be specifically allocated against commercial real estate. The remaining provision for loan losses is related to organic loan growth. Management identified probable losses in the loan portfolio and recorded net charge-offs of $2.9 million for the twelve months ended March 31, 2017, compared to $428,000 for the twelve months ended March 31, 2016.
The allowance for loan losses was $2.2 million, or 94.5% of non-performing loans at March 31, 2017 compared to $1.7 million, or 33.7% of non-performing loans at March 31, 2016. The increase in the percentage is a result of the $2.7 million, or 54.0%, decrease in our non-performing loans as compared to the period ending March 31, 2016. Non-performing loans in fiscal 2017 were largely reduced by $1.1 million in charge-offs associated with one commercial real estate relationship that has been on non-accrual and the sale of a pool of loans that included $768,000 in non-performing loans.
During the year ended March 31, 2017, loan charge offs totaled $3.0 million with recoveries of $50,000, compared to $893,000 in charge offs and $465,000 in recoveries during the year ended March 31, 2016. As noted earlier, the majority of charge-offs were related to two specific events, including one commercial real estate relationship that resulted in $1.1 million in charge-offs and the sale of a pool of loans that resulted in $1.6 million in charge-offs. During fiscal 2016, the Company recorded a recovery of $237,000 relating to one non-performing commercial construction loan that was sold. Prior to that, the Company had charged-off $1.0 million relating to this loan. During fiscal year 2017 and into fiscal 2018, we expect that we will continue our emphasis in growing commercial real estate and commercial business loans,which have higher interest rates than one-to-four family mortgage loans, but are generally considered to bear higher risk than one-to four-family mortgage loans. Such growth could contribute to higher provisions going forward.
Noninterest Revenue.Noninterest revenue decreased $500,000, or 32.2%, to $1.1 million for the year ended March 31, 2017 compared to fiscal 2016. The following table outlines the changes in components of noninterest revenue for the twelve month periods.
| | | Years Ended 31, | | | | | | | | | |
| | | 2017 | | | 2016 | | | $ Change | | | % Change | |
Service charges | | $ | 420,234 | | | $ | 383,289 | | | $ | 36,945 | | | | 9.6 | |
Gain on sale of investment securities | | | 23,720 | | | | 271,559 | | | | (247,839 | ) | | | (91.3 | ) |
Gain on sale of loans held for sale | | | 23,087 | | | | 44,831 | | | | (21,744 | ) | | | (48.5 | ) |
Gain on sale of property and equipment | | | (5,046 | ) | | | 407,188 | | | | (412,234 | ) | | | (101.2 | ) |
Earnings on bank-owned life insurance | | | 485,400 | | | | 349,938 | | | | 135,462 | | | | 38.7 | |
Other fees and commissions | | | 107,154 | | | | 97,703 | | | | 9,451 | | | | 9.7 | |
| | | | | | | | | | | | | | | | | |
Total noninterest revenue | | $ | 1,054,549 | | | $ | 1,554,508 | | | $ | (499,959 | ) | | | (32.2 | ) |
Noninterest revenue decreased in large part due to a $407,000 gain on the sale of the Towson branch property in the fiscal 2016 period. The branch was closed in early May 2015. Similarly, the $5,000 loss for fiscal 2017 is primarily related to the sale of an unoccupied branch building that was obtained as part of the Company’s acquisition of Fairmount Bancorp in 2015. The unoccupied building was sold for $425,000 with net proceeds of $393,000, excluding closing costs, and a book balance of $405,000.
Service charges associated with retail deposit products increased during the twelve months ended March 31, 2017 compared to the same period a year ago because of the Fairmount and Fraternity acquisitions and management’s continued focus on growing core deposits, particularly checking accounts, which typically generate more service fee income. We continually review our fee structure on transactional accounts so that we may be more aligned with our market. Customers, however, have become more cost conscious of fees and better manage their deposit relationship with the Bank.
The increase in earnings on bank-owned life insurance (BOLI) is associated with $5.1 million in BOLI assumed by Hamilton in the Fraternity acquisition. The revenue earned from BOLI is generally exempt for tax purposes.
Other fees and commissions include loan fees charged to customers, merchant credit card fees, and other smaller fees. Loan fees for the twelve months ended March 31, 2017 totaled $100,000 compared to $71,000 for the same period a year ago. Loan fees include various charges to customers for loan applications, processing, and /or extensions. Merchant credit card fees represent a revenue sharing agreement the bank has with a credit card processing company for card services used by the Bank’s borrowers. Merchant credit card fees amounted to $25,000 for the twelve months ended March 31, 2017 compared to $19,000 for the comparable period a year ago. Partially offsetting these increases was a $35,000 charge taken in relation to our equity position in a company that handled the sale of our residential loans into the secondary market. This company has since ceased operations and the charge to non-interest revenue is the remaining equity position that we lost as a result. We have since brought the ability to sell into the secondary market in-house and are no longer reliant on a third party provider.
Offsetting the increases in noninterest revenue for the twelve months of fiscal 2017 was a decrease in gains on the sale of loans held for sale and gains from the sale of investment securities. Gain on sale of loans held for sale represents revenue earned on loans sold in the secondary market at a premium. We sell a majority of our newly originated one-to-four family residential mortgage loans with a maturity greater than 10 years to the secondary market with service released to assist in managing our interest rate risk in anticipation of rising interest rates. With regards to gains on the sale of investment securities, many of the investment securities we sold did not have large gains as a result of the increase in interest rates that was experienced in the second half of the year.
Noninterest Expense.Noninterest expense increased $3.0 million, or 29.0%, to $13.2 million for the year ended March 31, 2017 compared to $10.3 million for the year ended March 31, 2016. The following table outlines the changes in noninterest expense for those periods.
| | | Years Ended March 31, | | | | | | | | | |
| | | 2017 | | | 2016 | | | $ Change | | | % Change | |
Salaries and benefits | | $ | 6,756,044 | | | $ | 5,218,611 | | | $ | 1,537,433 | | | | 29.5 | |
Occupancy | | | 984,767 | | | | 779,325 | | | | 205,442 | | | | 26.4 | |
Advertising | | | 122,093 | | | | 138,791 | | | | (16,698 | ) | | | (12.0 | ) |
Furniture and equipment | | | 377,232 | | | | 318,218 | | | | 59,014 | | | | 18.5 | |
Data processing | | | 777,554 | | | | 585,825 | | | | 191,729 | | | | 32.7 | |
Legal services | | | 291,550 | | | | 162,917 | | | | 128,633 | | | | 79.0 | |
Other professional services | | | 1,046,450 | | | | 383,125 | | | | 663,325 | | | | 173.1 | |
Merger related expenses | | | 219,417 | | | | 899,606 | | | | (680,189 | ) | | | (75.6 | ) |
Branch consolidation expense | | | 494,977 | | | | - | | | | 494,977 | | | | N/A | |
Deposit insurance premiums | | | 318,132 | | | | 227,112 | | | | 91,020 | | | | 40.1 | |
Foreclosed real estate expense and losses | | | 7,468 | | | | 17,157 | | | | (9,689 | ) | | | (56.5 | ) |
Other operating | | | 1,841,144 | | | | 1,529,871 | | | | 311,273 | | | | 20.3 | |
| | | | | | | | | | | | | | | | | |
Total noninterest expense | | $ | 13,236,828 | | | $ | 10,260,558 | | | $ | 2,976,270 | | | | 29.0 | |
Overall noninterest expense is elevated for both of the periods shown as a result of acquisition related costs pertaining to the Fraternity acquisition and acquisition related expenses, including branch consolidation and non-compete agreement expenses in the current year, as well as acquisition related costs associated with Fairmount in the prior year period. The merger expenses include fees paid to attorneys, investment bankers and accountants, data conversion, as well as other related costs. Branch consolidation expense of $495,000 pertains to the closing of our Cockeysville branch office in May 2016 due to branch overlap from the Fraternity acquisition. A breakdown of the merger related expenses by fiscal year is shown in the following table.
| | | Fiscal Year Ending March 31, | |
| | | 2017 | | | 2016 | |
Legal | | $ | 55,500 | | | $ | 502,326 | |
Professional services | | | 157,567 | | | | 316,959 | |
Data processing | | | - | | | | 48,745 | |
Advertising | | | - | | | | 4,885 | |
Other | | | 6,350 | | | | 26,691 | |
Total meger related expenses | | $ | 219,417 | | | $ | 899,606 | |
In addition to acquisition related expenses, several other categories, including occupancy, furniture and equipment, deposit insurance, and data processing all increased as a result of the Bank operating as a larger institution. Certain costs are naturally inherited after acquiring another financial institution, including additional personnel, branch costs, additional equipment, increased FDIC insurance, and an increase in the core data base resulting from the addition of acquired customers.
The largest increase in noninterest expenses for the fiscal period-over-period was in salaries and benefits. The Company went from 61 full-time equivalent employees at March 31, 2016 to 74 full-time equivalent employees at March 31, 2017. The additional personnel are related to the retention of certain employees from the Fraternity acquisition and internal growth within our loan and back-office area. Also, for the twelve months ending March 31, 2017 and 2016, $317,000 and $316,000 in expense was recognized, respectively, relating to equity awards granted to officers under the Company’s 2013 Equity Incentive Plan. The equity awards provide for management to have a vested interest in the performance of the Company and share in the benefit of an increase in shareholder value. Similarly, other operating expenses for fiscal 2017 and 2016 includes $127,000 and $118,000, respectively, in expense associated with equity awards granted to Directors.
Legal expense for fiscal 2017 increased over the same period a year ago. This was due to some of the problem assets acquired in the Fairmount acquisition; particularly the non-owner occupied residential investor loans. Management has diligently been working through these problem assets and has engaged legal counsel to assist with the collection and foreclosure process, as well as consult on how to proceed with certain borrowers. During the quarters ending December 31, 2016 and March 31, 2017, we sold in each quarter, as part of a pool of loans, performing and non-performing loans relating to non-owner occupied residential investor loans. These loans were sold to reduce costs, including legal expenses, associated with these loans going forward.
Other professional services increased for the fiscal period on a period-over-period basis due to increased audit fees resulting from an increase in our asset size and the purchase accounting associated with our acquisitions. Also contributing to the increase are payments to the executives of Fraternity under non-compete agreements. The expense associated with these agreements is $860,000 and will be recognized over the two year contractual period of the agreements, including $532,000 that was recognized in fiscal 2017. In addition, we paid $80,000 in consulting fees over a six month period to the same Fraternity executives to assist in the retaining and transitioning of our newly acquired customer base. Payments under the consulting agreement ended in November 2016.
The increase in other operating expense consists of several items, including adjustments to the deferral of Director fees associated with loan origination costs, new costs associated with non-owner occupied residential investor loans acquired from Fairmount and the management of those properties, additional amortization expense associated with the core deposit intangible created in the Fraternity and Fairmount acquisitions, increased regulatory filing expenses, and other miscellaneous items such as telephone and dues and subscriptions.
Management actively explores ways to reduce costs and improve efficiency. We monitor our costs associated with daily operations and review existing vendor contracts for additional savings and/or seek alternative vendors. These actions, along with efficiencies achieved through the acquisitions of Fraternity and Fairmount, continue to improve our efficiency ratio.
Income Tax Expense.We recorded a tax benefit of $758,000 for the year ended March 31, 2017 after a pre-tax net loss of $1.7 million, compared to tax expense of $422,000 for the year ended March 31, 2016 after pre-tax net income of $329,000. The effective income tax rate was a negative 44.9% for the fiscal year ending March 31, 2017 due to the pre-tax net loss and tax-exempt income associated with bank-owned life insurance and certain municipal securities. The tax expense and corresponding effective tax rate for the fiscal year ending March 31, 2016 is higher than the pre-tax income due to certain non-deductible acquisition related expenses, offset by tax-exempt revenue. The respective acquisition related costs associated with each period are not tax deductible. We have used the actual effective tax rate method to calculate taxes for the fiscal year ending March 31, 2017.
At March 31, 2017, the Company reported a net deferred tax asset of $8.0 million compared to $2.4 million at March 31, 2016. The change is primarily due to an increase in the deferred tax of $3.8 million related to the net operating loss (NOL) carryforwards attributable to the current year net loss and NOLs acquired in the Fraternity acquisition. The NOL carryforward increased from $626,000 at March 31, 2016 to $4.4 million at March 31, 2017. The NOL carryforwards have a defined expiration date of 20 years from the date of creation.
In accordance with Accounting Standards Codification (ASC) 740,Accounting for Income Taxes, the Company continually assesses whether a deferred tax asset is more likely than not to be realized based on an evaluative process that considers all available positive and negative evidence. As part of this evaluative process, management considers the following sources of taxable income: 1.) the future reversals of taxable temporary differences; 2.) future taxable income exclusive of reversing temporary differences and carryforwards; 3.) taxable income in prior carryback years and; 4.) tax planning strategies. A deferred tax asset valuation allowance is established to reduce the net carrying amount of deferred tax assets if it is determined to be more likely than not that all or some portion of the deferred tax asset will not be realized. The Company has established a valuation allowance in the amount of $42,000 at March 31, 2017 and $21,000 at March 31, 2016 because the Company believes that a portion of the state operating loss carryforwards and state tax credit carryforwards will not be utilized.
In making a conclusion, management has evaluated all available positive and negative evidence impacting these sources of taxable income. The positive evidence that is most heavily relied upon is future taxable income exclusive of reversing temporary differences and carryforwards. Negative evidence considered included:
| | ● | A cumulative pretax loss for the past three years totaling $1.7 million. The cumulative loss was due to a $3.4 million provision for loan loss and $1.3 million in acquisition and acquisition related expenses in fiscal 2017, including $495,000 in branch consolidation expense and $581,000 in non-compete and consulting agreements with former executives of acquired institutions and |
| | ● | A high level of net charge-offs totaling $2.9 million for the year ending March 31, 2017. |
Higher levels of provision expense were the primary cause of the recent loss experience. We incurred $1.1 million in provision expense over fiscal 2017 relating to one specific commercial real estate relationship. There are litigation issues with respect to the property outside of our control that has reduced the value of the property, which the borrower is actively trying to market. We also recognized a provision expense of $1.6 million associated with a pool of acquired non-owner occupied residential real estate loans we sold in the fourth quarter. The decision to sell this loan pool was a strategic decision by management based upon the loan pool’s deteriorating financial condition and mounting tax bills. Management determined it was prudent to sell the loans as a pool instead of incurring the potential cost of foreclosure on each property going forward. As discussed in more detail below, we believe that our current loan portfolio and credit quality trends indicate that most of the losses resulting from the recent recession have been identified. Therefore, we assume that our level of credit losses will not continue at the same rate as in fiscal 2017.
The positive evidence that led us to conclude that the income tax benefits of our deferred tax assets would be realized included:
| | ● | Based on certain improving credit quality indicators, the credit quality issues that gave rise to the higher provision for loan loss have been dealt with accordingly. |
| | 1. | With respect to commercial real estate loans, the commercial real estate loan discussed under the negative evidence with a $1.1 million charge-off, is the only charge-off the Company has experienced in regards to commercial real estate loans in four years. This loan was underwritten prior to our current credit team which has been in place since early 2014. In addition, the fair value of this loan has been adjusted to a value that is less than its current appraised value due to current circumstances. |
| | 2. | The sale of the acquired non-owner occupied residential real estate (investor) loan pool was a strategic decision by management to limit costs going forward. The loans sold were primarily associated with the Fairmount acquisition. The remaining balance of investor loans acquired from Fairmount at March 31, 2017 is $13.5 million, of which $9.7 million, or 72% have come up for renewal and have been re-underwritten under Hamilton Bank’s underwriting standards. In addition, the Fairmount acquired loans have a remaining homogeneous credit market of roughly $1.2 million at March 31, 2017; approximately $1.1 million of which is attributable to the investor loan segment. |
| | ● | Overall asset quality of the loan portfolio has improved significantly compared to fiscal 2016 based upon the actions taken by management. Non-performing loans have declined 54% to $2.3 million from $5.1 million a year ago and comprise 0.7% of gross loans compared to 2.3% over the comparable period, an improvement of 70%. Included in the $2.3 million of non-performing loans is the $1.5 million commercial real estate loan that was written-down in fiscal 2017. The allowance for loan loss as a percentage of non-performing loans increased to 95% from 34% last year, an improvement of 180%. Based upon these metrics, charge-offs and resulting provisions should be manageable going forward. |
| | ● | The Company has projected future taxable income that will be sufficient to absorb the remaining deferred tax assets after the reversal of future taxable temporary differences. The taxable income forecasting process utilizes the forecasted pretax earnings and adjusts for book tax differences that will be exempt from taxation, primarily tax-exempt interest income and bank-owned life insurance, as well as temporary book-tax differences including the allowance for loan losses. The projections relied upon for this process is consistent with those used in the Company’s financial forecasting process. The acquisitions are fully completed and the benefits of those transactions will be fully realized beginning in fiscal 2018. |
| | ● | In conjunction with the acquisition of Fraternity Community Bancorp, Inc. in May 2016, the Company incurred $1.3 million in acquisition related expenses, including $495,000 in branch consolidation and $581,000 in non-compete and consulting agreements with former executives. These expenses are on-time expenses except for $305,000 in non-compete expense that is to be realized in fiscal 2018. |
| | ● | NOL carryforwards have lives of anywhere from 16-19 years, providing sufficient time to realize and utilize any deferred tax assets going forward. Other attributes related to the deferred tax asset are not subject to an expiration date. |
| | ● | Hamilton Bank is “well capitalized” under regulatory definitions, allowing management sufficient resources to continue to manage through the current economic conditions and return to profitability. |
Based on our analysis, there is more positive evidence than negative regarding the utilization of our deferred tax asset and the realization of our recorded deferred tax asset at March 31, 2017 and 2016.
Risk Management
Managing risk is an essential part of successfully operating a financial institution. We have a comprehensive Enterprise Risk Management (ERM) program in place that addresses risks within the Company. The ERM program and the associated risks are updated and reviewed quarterly and presented to the Risk Committeewhich has oversight of the program.Risks are rated compared to the Company’s risk appetite and action plans are developed by management for those risks outside of the board established parameters. Once the Risk Committee approves the ERM program, the ERM program is presented to the full board. Our most significant types of risk are economic risk, regulatory risk, and compliance risk.
Our three most prominent forms of economic risk are credit risk, interest rate risk and market risk. Our primary credit risk is the risk of defaults in our loan portfolio that result from the inability or unwillingness of borrowers to make contractually required payments. To a lesser extent, we also have credit risk related to the risk of defaults in our investment securities portfolio. Interest rate risk is the potential reduction of interest income as a result of changes in interest rates. Market risk arises from fluctuations in interest rates that may result in changes in the values of financial instruments, such as available-for-sale securities that are accounted for on a mark-to-market basis.
Regulatory and compliance risk involves our ability to effectively adapt to, and comply with, changes in the regulatory environment for financial institutions. We are subject to the regulations of various government agencies. These regulations may change significantly from period to period. We also undergo periodic examinations by regulatory agencies that may subject us to further changes with respect to asset valuations and classifications, amounts required for the allowance for loan losses, and operating restrictions resulting from the regulators’ judgment based on information available to them at the time of their examination.
Other risks that we face are operational risks, liquidity risk and reputation risk. Operational risks include risks related to fraud, processing errors, technology and disaster recovery. Liquidity risk is the possible inability to fund obligations to depositors, lenders or borrowers due to unforeseen circumstances. Reputation risk is the risk that negative publicity or press, whether true or not, could cause a decline in our customer base or revenue.
Credit Risk Management
Our strategy for credit risk management focuses on having well-defined credit policies and uniform underwriting criteria and providing prompt attention to potential problem loans. Our loan approval process is described in Item 1. “Business”, under the heading “Lending Activities—Loan Approval Procedures and Authority”.
During the end of fiscal 2014 and into fiscal 2015 we revised our commercial loan underwriting policies, implemented a new loan monitoring system and hired additional staff dedicated to ensuring that all required loan information and documentation is obtained at the time a loan is originated and that such information is updated as required by our underwriting policies. This loan monitoring system, which tracks loans originated by the Bank, as well as loan participations and purchased loans, is also integrated with our general ledger, which allows management to monitor loan payment history and changes in loan status on a real time basis. In addition, we have established a formal loan delinquency committee to address delinquent and non-performing loans and hired a special assets manager to oversee the problem credits. The reconfiguring of our lending platform was a result of the significant increase in delinquent and non-performing commercial real estate and commercial business loans we experienced at the end of fiscal 2012. We believe that the improvements that we have made to our commercial lending capabilities during fiscal 2014 and 2015 have allowed us to successfully implement our strategy of increasing our commercial lending operations.
Collection Procedures. When a residential mortgage borrower fails to make required payments on a loan, we take a number of steps to induce the borrower to cure the delinquency and restore the loan to current status. With respect to residential real estate loans, we generally send a written notice of non-payment to the borrower 15 days after a loan is first past due. When a loan reaches 60 days past due a “Notice of Intent” to foreclose letter is prepared and sent to the borrower. And finally, when a loan becomes 90 days past due, the loan is turned over to our attorneys to ensure that further collection activities are conducted in accordance with applicable laws and regulations. All residential mortgage loans past due 90 days are put on non-accrual and reported to the board of directors monthly. If our attorneys do not receive a response from the borrower, or if the terms of any payment plan established are not followed, then foreclosure proceedings will be implemented. Management submits an Asset Classification Report detailing risk ratings and changes to risk ratings to the board of directors on a monthly basis.
With respect to home equity loans and lines of credit, a complete listing of all delinquent accounts is given to senior management for evaluation on a monthly basis. The data center produces and sends late charge notifications to customers that alert customers of their payment status. If the account remains past due when the next late charge notice is produced, a collection letter is sent requiring delinquent accounts to be brought current within 10 days. Failure to comply or respond to collection efforts will result in the loan being turned over to our attorneys for collection.
Commercial loan officers are responsible for the prompt follow up with borrowers who become delinquent on commercial loans. Officers determine the cause of the delinquency and work with the borrower to institute a short-term plan to eliminate the delinquency. Commercial loans that become over 30 days delinquent are reported to the Chief Lending Officer for collection. If no reasonable plan to cure a delinquency over 60-90 days is reached, the Bank will initiate legal action, repossession, foreclosure, non-accrual or charge-off. When a commercial loan becomes 75 days delinquent, the Special Asset Officer is required to re-verify all documentation, including adequate insurance coverage. Commercial loans 90 days delinquent are generally placed on non-accrual and evaluated for impairment to determine if charge-off is necessary. All loans over 90 days delinquent are reported to the board of directors monthly. All charged-off loans and subsequent recoveries are reported in aggregate on a monthly basis to the appropriate members of senior management and the Board of Directors. Prior to the extension of non-accrual status beyond six months, a request for extension must be properly executed with appropriate approval signed by the Loan Committee. At the time the loan is placed in non-accrual, the accrued, but unpaid interest is reversed against the loan account in accordance with the Bank’s non-accrual policy. A loan may not be removed from non-accrual status until the loan is paid current or, under a modification agreement, an adequate period of time has passed in which the borrower has demonstrated the ability to make payments and their cash flow supports the payment going forward. At this point, management will determine whether or not to return the loan to accrual status.
Analysis of Nonperforming, Delinquent and Classified Assets.Loans are generally placed on nonaccrual status when they are 90 days past due based on the contractual terms of the loan. In all cases, loans are placed on nonaccrual status at an earlier date if collection of principal or interest is considered doubtful. All interest accrued but not collected for loans that are placed on nonaccrual status are reversed against interest revenue. The interest on nonaccrual loans is accounted for on the cash basis method, until the loans qualify for return to accrual status. Loans are returned to accrual status when all the principal and interest amounts contractually due are brought current and future payments are reasonably assured. For certain nonaccrual loans, interest payments received are applied to the principal balance of the loan.
Non-Performing Assets.The table below sets forth the amounts and categories of our non-performing assets at the dates indicated.
| | | At March 31, | |
| | | 2017 | | | 2016 | | | 2015 | | | 2014 | | | 2013 | |
| | | (Dollars in thousands) | |
Non-accrual loans: | | | | | | | | | | | | | | | | | | | | |
Real estate loans: | | | | | | | | | | | | | | | | | | | | |
Residential | | $ | 675 | | | $ | 775 | | | $ | 628 | | | $ | 284 | | | $ | 1,006 | |
Investor | | | 71 | | | | 675 | | | | 11 | | | | 159 | | | | 372 | |
Commercial construction | | | - | | | | - | | | | 1,375 | | | | 1,552 | | | | 1,003 | |
Commercial | | | 1,547 | | | | 2,717 | | | | - | | | | - | | | | 1,407 | |
Commercial business loans | | | - | | | | 122 | | | | 226 | | | | 2,041 | | | | 1,307 | |
Consumer loans: | | | | | | | | | | | | | | | | | | | | |
Home equity loans and lines of credit | | | 3 | | | | 49 | | | | 15 | | | | 204 | | | | 37 | |
Other consumer | | | 6 | | | | 4 | | | | - | | | | - | | | | - | |
| | | | | | | | | | | | | | | | | | | | | |
Total non-accrual loans | | | 2,302 | | | | 4,342 | | | | 2,255 | | | | 4,240 | | | | 5,132 | |
| | | | | | | | | | | | | | | | | | | | | |
Loans delinquent 90 days or greater and still accruing: | | | | | | | | | | | | | | | | | | | | |
Real estate loans: | | | | | | | | | | | | | | | | | | | | |
Residential | | | - | | | | - | | | | - | | | | - | | | | - | |
Investor | | | 21 | | | | 708 | | | | - | | | | - | | | | - | |
Commercial construction | | | - | | | | - | | | | - | | | | - | | | | - | |
Commercial | | | - | | | | - | | | | - | | | | 301 | | | | - | |
Commercial business loans | | | - | | | | - | | | | - | | | | 500 | | | | - | |
Consumer loans: | | | | | | | | | | | | | | | | | | | | |
Home equity loans and lines of credit | | | - | | | | - | | | | - | | | | - | | | | - | |
Other consumer | | | - | | | | - | | | | - | | | | - | | | | - | |
Total loans delinquent 90 days orgreater and still accruing | | | 21 | | | | 708 | | | | - | | | | 801 | | | | - | |
Total non-performing loans | | | 2,323 | | | | 5,050 | | | | 2,255 | | | | 5,041 | | | | 5,132 | |
| | | | | | | | | | | | | | | | | | | | | |
Other real estate owned and foreclosed assets: | | | | | | | | | | | | | | | | | | | | |
Real estate loans: | | | | | | | | | | | | | | | | | | | | |
Residential | | | 23 | | | | - | | | | 12 | | | | - | | | | - | |
Investor | | | 37 | | | | - | | | | - | | | | - | | | | - | |
Commercial construction | | | 443 | | | | 443 | | | | 443 | | | | 664 | | | | - | |
Commercial | | | - | | | | - | | | | - | | | | - | | | | 756 | |
Commercial business loans | | | - | | | | - | | | | - | | | | - | | | | - | |
Consumer loans: | | | | | | | | | | | | | | | | | | | | |
Home equity loans and lines of credit | | | - | | | | - | | | | - | | | | - | | | | - | |
Other consumer | | | - | | | | - | | | | - | | | | - | | | | - | |
Total foreclosed real estate | | | 503 | | | | 443 | | | | 455 | | | | 664 | | | | 756 | |
| | | | | | | | | | | | | | | | | | | | | |
Total non-performing assets | | | 2,826 | | | | 5,493 | | | | 2,710 | | | | 5,705 | | | | 5,888 | |
| | | | | | | | | | | | | | | | | | | | | |
Performing troubled debt restructurings | | | 1,906 | | | | 2,105 | | | | 5,339 | | | | 1,538 | | | | 1,458 | |
Total non-performing assets andperforming troubled debt restructurings | | $ | 4,732 | | | $ | 7,598 | | | $ | 8,049 | | | $ | 7,243 | | | $ | 7,346 | |
| | | | | | | | | | | | | | | | | | | | | |
Ratios: | | | | | | | | | | | | | | | | | | | | |
Non-performing loans to total loans | | | 0.69 | % | | | 2.27 | % | | | 1.41 | % | | | 3.48 | % | | | 3.18 | % |
Non-performing loans totaled $2.3 million at March 31, 2017 compared to $5.1 million at March 31, 2016, a decrease of $2.7 million. In fiscal 2016, overall non-performing loans increased $2.8 million over the prior year as a result of one commercial real estate relationship with a book value of $2.7 million that was placed on non-accrual and the non-performing loans that were acquired in the Fairmount transaction. The subsequent decrease in fiscal 2017 can attributed to the same commercial real estate relationship in which we charged off $1.1 million over the past twelve months and the sale of performing and non-performing residential non-owner occupied investor loans that were originally acquired in the Fairmount acquisition. Non-performing assets to total assets decreased 60.7% to 0.55% at March 31, 2017 compared to 1.40% at March 31, 2016 as a result of the commercial relationship and loan sales previously discussed. The graph below shows the change in non-accrual loans during fiscal 2017 on a month-by-month basis as a percentage of gross loans:
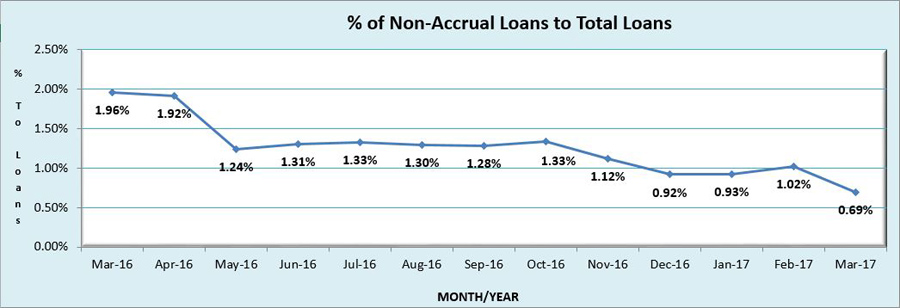 |
Non-performing commercial real estate loans totaled $1.5 million and consisted of two loans to the same borrower at March 31, 2017. Together these loans have a contractual principal balance of $3.4 million and a recorded investment balance of $1.5 million ($1.7 million charged-off life to date). The loan was placed on non-accrual in October 2015 due to deteriorating cash flow, a pending lawsuit, and the inability of the borrower to make the principal payment under an existing troubled debt restructuring (“TDR”) agreement. After being placed on non-accrual, the borrower continued to make the interest only payments through July 2016 at which time payments ceased. The Bank applied those funds as a principal reduction to the loans in accordance with our non-accrual policy. After payments ceased, the Bank obtained an updated appraisal and had the borrower list the property for sale by an independent broker. Upon receipt of the new appraisal, which provided different valuations based upon various sale scenarios, we wrote the loan down by $622,000 in December 2016 to the highest appraised value and then another write-down of $490,000 in March 2017 to the lowest valuation provided within the appraisal due to limited interest in the property. The borrower is currently changing sales broker and will be re-listing the property for sale.
There was no non-performing commercial business loans at March 31, 2017 compared to $122,000 at March 31, 2016. The balance at March 31, 2016 consisted of one commercial business loan that was partially guaranteed by the Small Business Administration (“SBA”). This loan had a contractual balance of $264,000 and a recorded investment balance of $122,000 at March 31, 2016. The loan was 50% guaranteed by the SBA. The borrower installed solar panel systems for both residential and commercial customers. Due to declining business and net losses, the borrower decided to close the business in January 2014. Collateral on the loan consisted of an investment property and the personal residence of the guarantor, along with the business assets of the company. This collateral was liquidated and applied against the principal of the loan. The Bank charged-off $131,000 in the prior periods or roughly its 50% portion of the contractual balance of the loan. The remaining principal loan balance at March 31, 2016 represented anticipated payment from the SBA based upon its 50% guarantee. In May 2017, the Bank did receive final payment from the SBA in regards to this loan and closed it out.
Part of the loan portfolio originally acquired in the Fairmount acquisition consisted of $17.3 million in one-to-four family non-owner occupied (“investor”) loans. At March 31, 2016, there were $1.4 million in investor loans that were classified as non-performing and all, except $28,000 pertain to loans acquired in the Fairmount transaction. Included in the $1.4 million of investor loans was $675,000 in loans that were on non-accrual. This balance was primarily associated with three different borrowers, each of which had multiple investor properties that were primarily located in Baltimore City. During fiscal 2017, two different groups of performing and non-performing investor loans, primarily associated with the three borrowers, were sold. The loan groups had a combined contractual balance of $6.5 million and a carrying value of $3.0 million. As a result of the loan sales, nonaccrual investor loans decreased from $675,000 at March 31, 2016 to $71,000 at March 31, 2017, of which $57,000 pertains to Fairmount acquired loans.
At March 31, 2017, there are six investor loans totaling $21,000 that are also classified as non-performing, but are 90 days past due and accruing as of March 31, 2017. These investor loans are paying as agreed under their contractual terms; however, they have reached maturity and are in the process of being renewed by the bank. Because they are past their contractual maturity date and the note requires full payment of principal at maturity, these loans are in default and classified as non-performing. Once these loans are extended or renewed, they will be returned to performing status. This balance is down from $708,000 a year ago.
At March 31, 2017, there is $675,000 in owner occupied, one-to-four family residential loans that are classified as non-performing loans, all of which are classified as non-accrual. Non-accrual loans consist of 20 loans in total, including 5 loans that comprise $486,000, or 72.0% of the outstanding balance. To date, the bank has charged-off $65,000 relating to the 20 loans that are classified as non-performing within this loan segment.
Gross interest income that would have been recorded during fiscal 2017 had our non-accruing loans been current in accordance with their original terms was $182,000.
Troubled Debt Restructurings (“TDR”).At March 31, 2017, Hamilton Bank had a total of $3.7 million in TDRs, including thirteen one-to-four family residential real estate loans totaling $1.6 million, two commercial real estate loans totaling $1.5 million, and one commercial business loan equaling $644,000. Nearly $1.3 million of the TDRs pertaining to one-to-four family residential real estate loans was comprised of two loans performing in accordance with their modified terms as of March 31, 2017. The remainder was comprised of eleven one-to-four family residential real estate loans, totaling $295,000, that were on non-accrual.
The two commercial real estate loans totaling $1.5 million became TDRs at the end of the second fiscal quarter of 2015 and are currently on non-accrual. These are the same loans discussed earlier under the commercial real estate non-performing loans. The loans were placed on non-accrual in October 2015 and $1.1 million in charge-offs were recorded during fiscal 2017.
The one commercial business loan that is a TDR totals $644,000 and is performing as agreed under its modified terms. This particular loan was on non-accrual when it was originally modified. The borrower has continued to make payments and the loan has been on accrual status now for over two years.
We had $4.9 million of TDRs at March 31, 2016, which included $1.6 million in one-to-four family residential real estate loans, including $1.5 million that were performing in accordance with their modified terms, the same two commercial real estate loans equaling $2.7 million, and two commercial business loans totaling $648,000, both of which were on performing as agreed upon based their modified terms.
Delinquent Loans.The following table sets forth certain information regarding delinquencies in our loan portfolio.
| | | 60 to 89 | | | 90 or More | | | | | |
| | | Days Delinquent | | | Days Delinquent | | | Total | |
| | | | Number | | | | Amount | | | | Number | | | | Amount | | | | Number | | | | Amount | |
| | | (Dollars in thousands) | |
At March 31, 2017: | | | | | | | | | | | | | | | | | | | | | | | | |
Real estate loans: | | | | | | | | | | | | | | | | | | | | | | | | |
Residential | | | 3 | | | $ | 81 | | | | 8 | | | $ | 336 | | | | 11 | | | $ | 417 | |
Investor | | | - | | | | - | | | | 16 | | | | 92 | | | | 16 | | | | 92 | |
Commerical construction | | | - | | | | - | | | | - | | | | - | | | | - | | | | - | |
Commercial | | | - | | | | - | | | | 2 | | | | 1,547 | | | | 2 | | | | 1,547 | |
Commercial business loans | | | - | | | | - | | | | - | | | | - | | | | - | | | | - | |
Consumer loans: | | | | | | | | | | | | | | | | | | | | | | | | |
Home equity loans and lines of credit | | | - | | | | - | | | | - | | | | - | | | | - | | | | - | |
Other consumer | | | - | | | | - | | | | 1 | | | | 5 | | | | 1 | | | | 5 | |
Total loans | | | 3 | | | $ | 81 | | | | 27 | | | $ | 1,980 | | | | 30 | | | $ | 2,061 | |
At March 31, 2016: | | | | | | | | | | | | | | | | | | | | | | | | |
Real estate loans: | | | | | | | | | | | | | | | | | | | | | | | | |
Residential | | | 3 | | | $ | 99 | | | | 10 | | | $ | 651 | | | | 13 | | | $ | 750 | |
Investor | | | - | | | | - | | | | 31 | | | | 1,217 | | | | 31 | | | | 1,217 | |
Commerical construction | | | - | | | | - | | | | - | | | | - | | | | - | | | | - | |
Commercial | | | - | | | | - | | | | 2 | | | | 2,717 | | | | 2 | | | | 2,717 | |
Commercial business loans | | | - | | | | - | | | | 1 | | | | 122 | | | | 1 | | | | 122 | |
Consumer loans: | | | | | | | | | | | | | | | | | | | | | | | | |
Home equity loans and lines of credit | | | - | | | | - | | | | 1 | | | | 43 | | | | 1 | | | | 43 | |
Other consumer | | | - | | | | - | | | | 1 | | | | 4 | | | | 1 | | | | 4 | |
Total loans | | | 3 | | | $ | 99 | | | | 46 | | | $ | 4,754 | | | | 49 | | | $ | 4,853 | |
At March 31, 2015: | | | | | | | | | | | | | | | | | | | | | | | | |
Real estate loans: | | | | | | | | | | | | | | | | | | | | | | | | |
Residential | | | 3 | | | $ | 159 | | | | 13 | | | $ | 476 | | | | 16 | | | $ | 635 | |
Investor | | | - | | | | - | | | | 1 | | | | 11 | | | | 1 | | | | 11 | |
Commerical construction | | | - | | | | - | | | | 1 | | | | 1,375 | | | | 1 | | | | 1,375 | |
Commercial | | | - | | | | - | | | | - | | | | - | | | | - | | | | - | |
Commercial business loans | | | 2 | | | | 734 | | | | 4 | | | | 226 | | | | 6 | | | | 960 | |
Consumer loans: | | | | | | | | | | | | | | | | | | | | | | | | |
Home equity loans and lines of credit | | | - | | | | - | | | | 1 | | | | 6 | | | | 1 | | | | 6 | |
Other consumer | | | - | | | | - | | | | - | | | | - | | | | - | | | | - | |
Total loans | | | 5 | | | $ | 893 | | | | 20 | | | $ | 2,094 | | | | 25 | | | $ | 2,987 | |
At March 31, 2014: | | | | | | | | | | | | | | | | | | | | | | | | |
Real estate loans: | | | | | | | | | | | | | | | | | | | | | | | | |
Residential | | | - | | | $ | - | | | | 16 | | | $ | 283 | | | | 16 | | | $ | 283 | |
Investor | | | - | | | | - | | | | 2 | | | | 159 | | | | 2 | | | | 159 | |
Commerical construction | | | 1 | | | | 1,242 | | | | - | | | | - | | | | 1 | | | | 1,242 | |
Commercial | | | - | | | | - | | | | 1 | | | | 301 | | | | 1 | | | | 301 | |
Commercial business loans | | | 2 | | | | 2,173 | | | | 5 | | | | 1,802 | | | | 7 | | | | 3,975 | |
Consumer loans: | | | | | | | | | | | | | | | | | | | | | | | | |
Home equity loans and lines of credit | | | - | | | | - | | | | 4 | | | | 205 | | | | 4 | | | | 205 | |
Other consumer | | | - | | | | - | | | | - | | | | - | | | | - | | | | - | |
Total loans | | | 3 | | | $ | 3,415 | | | | 28 | | | $ | 2,750 | | | | 31 | | | $ | 6,165 | |
At March 31, 2013: | | | | | | | | | | | | | | | | | | | | | | | | |
Real estate loans: | | | | | | | | | | | | | | | | | | | | | | | | |
Residential | | | 5 | | | $ | 179 | | | | 17 | | | $ | 999 | | | | 22 | | | $ | 1,178 | |
Investor | | | - | | | | - | | | | 5 | | | | 372 | | | | 5 | | | | 372 | |
Commerical construction | | | - | | | | - | | | | 1 | | | | 1,003 | | | | 1 | | | | 1,003 | |
Commercial | | | - | | | | - | | | | 1 | | | | 1,407 | | | | 1 | | | | 1,407 | |
Commercial business loans | | | - | | | | - | | | | 1 | | | | 319 | | | | 1 | | | | 319 | |
Consumer loans: | | | | | | | | | | | | | | | | | | | | | | | | |
Home equity loans and lines of credit | | | - | | | | - | | | | 1 | | | | 37 | | | | 1 | | | | 37 | |
Other consumer | | | - | | | | - | | | | - | | | | - | | | | - | | | | - | |
Total loans | | | 5 | | | $ | 179 | | | | 26 | | | $ | 4,137 | | | | 31 | | | $ | 4,316 | |
The decrease in loans 90 or more days delinquent for fiscal 2017 as compared to fiscal 2016 was due to decreases in residential real estate, residential investor loans and commercial real estate. See the discussion of non-performing loans above for additional information regarding loans that are 90 or more days delinquent for the period ended March 31, 2017.
Classified Assets.Federal regulations require that each insured financial institution classify its assets on a regular basis. In addition, in connection with examinations of insured institutions, federal examiners have authority to identify problem assets and, if appropriate, classify them. There are three classifications for problem assets: “substandard,” “doubtful” and “loss”. Each is defined as follows:
Substandard -A substandard loan is inadequately protected by the current sound worth and paying capacity of the obligor or of the collateral pledged, if any. Substandard loans have a well defined weakness, or weaknesses, that jeopardize the collection or liquidation of the debt. They are characterized by the distinct possibility that the Bank will sustain some loss if the deficiencies are not corrected. This will be the measurement for determining if a loan is impaired. Borrowers may exhibit recent or unexpected unprofitable operations, an inadequate debt service coverage ratio, or marginal liquidity and capitalization. These loans require more intense supervision by Bank management.
Doubtful- A doubtful loan has all the weaknesses inherent as a substandard loan with the added characteristic that the weaknesses make collection or liquidation in full, on the basis of currently existing facts, conditions, and values, highly questionable and improbable. A loan classified as doubtful exhibits loss potential. However, there is still sufficient reason to permit the loan to remain on the books. A doubtful classification could reflect the deterioration of the primary source of repayment and serious doubt exists as to the quality of the secondary source of repayment.
Doubtful classifications should be used only when a distinct and known possibility of loss exists. When identified, adequate loss should be recorded for the specific assets. The entire asset should not be classified as doubtful if a partial recovery is expected, such as liquidation of the collateral or the probability of a private mortgage insurance payment is likely.
Loss-Loans classified as loss are considered uncollectable and of such little value that their continuance as loans is unjustified. A loss classification does not mean a loan has absolutely no value; partial recoveries may be received in the future. When loans or portions of a loan are considered a loss, it will be the policy of the Bank to write-off the amount designated as a loss. Recoveries will be treated as additions to the allowance for loan losses.
Another category, designated “special mention”, may also be established and maintained for assets which do not currently expose an insured institution to a sufficient degree of risk to warrant classification as substandard, doubtful or loss. If a classified asset is deemed to be impaired with measurement of loss, the Bank will establish a charge-off of the loan pursuant to Accounting Standards Codification Topic 310, “Receivables.”
The following table sets forth information regarding classified assets and special mention assets at March 31, 2017, 2016 and 2015.
| | | At March 31, | |
| | | 2017 | | | 2016 | | | 2015 | |
| | | (In thousands) | |
Classification of Assets: | | | | | | | | | | | | |
Substandard | | $ | 3,447 | | | $ | 5,310 | | | $ | 6,782 | |
Doubtful | | | - | | | | - | | | | - | |
Loss | | | - | | | | - | | | | - | |
Total Adversely Classified Assets | | $ | 3,447 | | | $ | 5,310 | | | $ | 6,782 | |
Special Mention | | $ | 11,402 | | | $ | 11,969 | | | $ | 7,742 | |
The following graph shows both special mention and substandard loans, including unfunded commitments, as a percentage of gross loans throughout fiscal 2017:
At March 31, 2017, substandard assets consisted of three commercial real estate loans totaling $1.8 million, two of which are to the same borrower, and one commercial business loan totaling $141,000. At that same date, there were 19 residential mortgage loans totaling $1.3 million that were classified as substandard, along with nine non owner-occupied residential investor loans totaling $233,000. The majority of the investor loans were acquired in the Fairmount transaction. Finally, there were two loans totaling $9,000 that were home equity loans and two mobile home loans equaling $41,000 that were also classified as substandard.
At March 31, 2017, there are no loans classified as doubtful.
At March 31, 2017, special mention loans consisted of twelve one-to-four family mortgage loans totaling $3.2 million and eleven loans equaling $409,000 that are non owner-occupied residential investor loans. Also included in special mention loans are five commercial real estate loans totaling $7.6 million, two of which are to the same borrower equaling $3.1 million and no special mention commercial business loans.
Analysis and Determination of the Allowance for Loan Losses.We maintain the allowance through a provision for loan losses that we charge to income. We charge losses on loans against the allowance for loan losses when we believe the collection of loan principal is unlikely. Recoveries on loans charged-off are restored to the allowance for loan losses. The allowance for loan losses is maintained at a level believed, to the best of management’s knowledge, to cover all known and inherent losses in the portfolio that are both probable and reasonable to estimate at each reporting date. Consideration is given to historical losses in conjunction with a variety of other factors including, but not limited to, current economic conditions, delinquency statistics, geographic and industry concentrations, the adequacy of the underlying collateral, the financial strength of the borrower, results of internal loan reviews and other relevant factors. This evaluation is inherently subjective as it requires material estimates that may be susceptible to significant change. We evaluate our allowance for loan losses, at a minimum, on a quarterly basis. Management modified the analysis during the quarter ended September 30, 2016 by keeping our net charge-off history as a percentage of loans, as it pertains to each loan segment, constant across all risk ratings and altering our qualitative factors either up or down based upon the respective risk rating for each loan segment. The change in methodology did not have a material impact on the amount of the allowance for loan losses at September 30, 2016 as compared to the prior methodology. We make adjustments to the external factors in the calculation during the year as deemed fit. We will continue to monitor all items involved in the allowance calculation closely. Additional information on our methodology for calculating the allowance for loan losses is described in this Item 7 above under “—Critical Accounting Policies—Allowance for Loan Losses.”
In addition, the regulatory agencies, as an integral part of their examination and review process, periodically review our loan portfolios and the related allowance for loan losses. Regulatory agencies may require us to increase the allowance for loan losses based on their judgments of information available to them at the time of their examination, thereby adversely affecting our results of operations.
We recorded a provision for loan losses of $3.4 million for the year ended March 31, 2017 and a provision for loan losses of $440,000 for the year ended March 31, 2016. The allowance for loan losses was $2.2 million, or 0.65% of total loans, at March 31, 2017, compared to $1.7 million, or 0.76% of total loans, at March 31, 2016. The percentage of allowance for loan losses to total loans decreased because of the overall increase in loans from the Fraternity acquisition, partially offset by additional provisions associated with the amount of charge-offs experienced. Under purchase accounting guidelines, Fraternity’s loan portfolio was recorded on Hamilton’s books at fair value and does not require significant reserves under the allowance for loan losses, unless the loan portfolio performs worse than the fair values that were originally determined.
Our non-performing loans decreased by $2.7 million to $2.3 million at March 31, 2017 from $5.1 million at March 31, 2016. A large portion of the decrease is related to one commercial real estate relationship, with a book value of $1.5 million that was placed on non-accrual during fiscal 2016. During the year ended March 31, 2017, net loan charge-offs increased to $2.9 million, as a result of $1.1 million in charge-offs relating to one commercial real estate borrower and another $1.6 million in charge-offs associated with a group of investor loans that were re-classed as held-for-sale and subsequently sold. In fiscal 2016, we recorded net charge-offs of $428,000, including $893,000 in charge-offs and $465,000 in recoveries. During fiscal 2017, our allowance for loan losses of $2.2 million, increased $493,000 compared to the prior year. This increase is associated with the increase in charge-offs and organic loan growth. Charge-off history is a significant factor taken into consideration when calculating the allowance for loan losses.
The following graph shows the allowance for loan losses as a percentage of gross loans throughout fiscal 2017 on a month-by-month basis:
Analysis of Loan Loss Experience. The following table sets forth the analysis of the activity in the allowance for loan losses for the fiscal years indicated:
| | | At or For the Year Ended March 31, | |
| | | 2017 | | | 2016 | | | 2015 | | | 2014 | | | 2013 | |
| | | (Dollars in thousands) | |
Balance at beginning of year | | $ | 1,702 | | | $ | 1,690 | | | $ | 1,786 | | | $ | 2,071 | | | $ | 3,552 | |
Charge-offs: | | | | | | | | | | | | | | | | | | | | |
Real estate loans: | | | | | | | | | | | | | | | | | | | | |
Residential | | | 35 | | | | 70 | | | | 55 | | | | 75 | | | | 255 | |
Investor | | | 1,801 | | | | 222 | | | | 83 | | | | 131 | | | | - | |
Commercial construction | | | - | | | | - | | | | - | | | | 1,000 | | | | 337 | |
Commercial | | | 1,111 | | | | 568 | | | | - | | | | - | | | | 701 | |
Commercial business loans | | | 2 | | | | 11 | | | | 84 | | | | 1,059 | | | | 1,904 | |
Home equity loans and lines of credit | | | - | | | | 6 | | | | 101 | | | | 11 | | | | 5 | |
Other consumer | | | 4 | | | | 16 | | | | - | | | | - | | | | 9 | |
Total charge-offs | | | 2,953 | | | | 893 | | | | 323 | | | | 2,276 | | | | 3,211 | |
| | | | | | | | | | | | | | | | | | | | | |
Recoveries: | | | | | | | | | | | | | | | | | | | | |
Real estate loans: | | | | | | | | | | | | | | | | | | | | |
Residential | | | - | | | | 1 | | | | 4 | | | | 24 | | | | - | |
Investor | | | 12 | | | | 25 | | | | 1 | | | | - | | | | - | |
Commercial construction | | | - | | | | 237 | | | | - | | | | - | | | | - | |
Commercial | | | - | | | | - | | | | - | | | | 47 | | | | - | |
Commercial business loans | | | 29 | | | | 192 | | | | 48 | | | | 45 | | | | - | |
Home equity loans and lines of credit | | | - | | | | - | | | | 3 | | | | - | | | | - | |
Other consumer | | | 10 | | | | 10 | | | | 1 | | | | 1 | | | | - | |
Total recoveries | | | 51 | | | | 465 | | | | 57 | | | | 117 | | | | - | |
| | | | | | | | | | | | | | | | | | | | | |
Net loan charge-offs | | | (2,902 | ) | | | (428 | ) | | | (266 | ) | | | (2,159 | ) | | | (3,211 | ) |
Additions charged to operations | | | 3,395 | | | | 440 | | | | 170 | | | | 1,874 | | | | 1,730 | |
| | | | | | | | | | | | | | | | | | | | | |
Balance at end of year | | $ | 2,195 | | | $ | 1,702 | | | $ | 1,690 | | | $ | 1,786 | | | $ | 2,071 | |
| | | | | | | | | | | | | | | | | | | | | |
Total loans outstanding | | $ | 339,000 | | | $ | 222,767 | | | $ | 160,388 | | | $ | 144,819 | | | $ | 161,272 | |
Average net loans outstanding | | $ | 314,473 | | | $ | 197,276 | | | $ | 146,720 | | | $ | 153,019 | | | $ | 163,930 | |
Allowance for loan losses as a percentageof total loans at end of year | | | 0.65 | % | | | 0.76 | % | | | 1.05 | % | | | 1.23 | % | | | 1.28 | % |
Net loans charged-off as a percent ofaverage net loans outstanding | | | 0.92 | % | | | 0.22 | % | | | 0.18 | % | | | 1.41 | % | | | 1.96 | % |
Allowance for loan losses tonon-performing loans | | | 94.49 | % | | | 33.70 | % | | | 74.97 | % | | | 35.44 | % | | | 40.36 | % |
Allocation of Allowance for Loan Losses.The following table sets forth the allocation of allowance for loan losses by loan category at the dates indicated. The table also reflects each loan category as a percentage of total loans receivable. The allocation of the allowance by category is not necessarily indicative of future losses and does not restrict the use of the allowance to absorb losses in any category.
| | | At March 31, | |
| | | 2017 | | | 2016 | | | 2015 | |
| | | Amount | | | Percent of Allowance in Each Loan Category | | | Amount | | | Percent of Allowance in Each Loan Category | | | Amount | | | Percent of Allowance in Each Loan Category | |
| | | (Dollars in thousands) | |
Real estate loans: | | | | | | | | | | | | | | | | | | | | | | | | |
Residential | | $ | 554 | | | | 25.2 | % | | $ | 260 | | | | 15.3 | % | | $ | 319 | | | | 18.9 | % |
Investor | | | 35 | | | | 1.6 | | | | 168 | | | | 9.9 | | | | 114 | | | | 6.7 | |
Commercial construction | | | 9 | | | | 0.4 | | | | 42 | | | | 2.4 | | | | 68 | | | | 4.0 | |
Commercial | | | 1,376 | | | | 62.7 | | | | 902 | | | | 53.0 | | | | 586 | | | | 34.7 | |
Commercial business loans | | | 149 | | | | 6.8 | | | | 228 | | | | 13.4 | | | | 473 | | | | 28.0 | |
Home equity loans and lines of credit | | | 70 | | | | 3.2 | | | | 82 | | | | 4.8 | | | | 99 | | | | 5.8 | |
Other consumer | | | 2 | | | | 0.1 | | | | 20 | | | | 1.2 | | | | 1 | | | | 0.1 | |
Unallocated | | | - | | | | - | | | | - | | | | - | | | | 30 | | | | 1.8 | |
Total | | $ | 2,195 | | | | 100.0 | % | | $ | 1,702 | | | | 100.0 | % | | $ | 1,690 | | | | 100.0 | % |
| | | At March 31, | |
| | | 2014 | | | 2013 | |
| | | Amount | | | Percent of Allowance in Each Loan Category | | | Amount | | | Percent of Allowance in Each Loan Category | |
| | | (Dollars in thousands) | |
Real estate loans: | | | | | | | | | | | | | | | | |
Residential | | $ | 445 | | | | 39.8 | % | | $ | 315 | | | | 39.6 | % |
Investor | | | 83 | | | | 9.7 | | | | 57 | | | | 9.8 | |
Commercial construction | | | 61 | | | | 2.3 | | | | 417 | | | | 2.2 | |
Commercial | | | 576 | | | | 28.6 | | | | 613 | | | | 22.5 | |
Commercial business loans | | | 591 | | | | 10.8 | | | | 636 | | | | 16.7 | |
Home equity loans and lines of credit | | | 27 | | | | 8.0 | | | | 32 | | | | 8.5 | |
Other consumer | | | 3 | | | | 0.8 | | | | 1 | | | | 0.7 | |
Unallocated | | | - | | | | - | | | | - | | | | - | |
Total | | $ | 1,786 | | | | 100.0 | % | | $ | 2,071 | | | | 100.0 | % |
The percentage of the allowance for loan loss associated with real estate investor loans is only 1.6%, or $35,000, despite total charge-offs of $1.8 million during fiscal 2017 because a large portion of the investor charge-offs were associated with acquired loans from Fairmount. These loans, at acquisition, were not considered to have deteriorated credit quality and were accounted for in accordance with ASC Topic 310-20. Under ASC Topic 310-20, the difference between the loan’s principal balance at the time of purchase and the fair value is recognized as an adjustment of yield over the life of the loan. The fair value is comprised of two parts, including a credit mark used to measure credit quality and an interest rate mark to adjust the contractual rate to a current market rate. At March 31, 2017, the credit mark remaining with respect to the Fairmount portfolio was $1.2 million, of which $1.1 million is allocated towards the acquired real estate investor loans. This amount acts as a type of reserve and is analyzed in conjunction with the allowance for loan losses with respect to determining reserves that need to be set aside for a particular loan segment.
Market Risk Management
General. Our most significant form of market risk is interest rate risk because, as a financial institution, the majority of our assets and liabilities are sensitive to changes in interest rates. Therefore, a principal part of our operations is to manage interest rate risk and limit the exposure of our financial condition and results of operations to changes in market interest rates. Our Asset-Liability Management Committee (ALCO) is responsible for evaluating the interest rate risk inherent in our assets and liabilities, for determining the level of risk that is appropriate, given our business strategy, operating environment, capital, liquidity and performance objectives, and for managing this risk consistent with the policy and guidelines approved by our board of directors.
Historically, we have operated as a traditional thrift institution. A significant portion of our assets consist of longer-term, fixed-rate residential mortgage loans and securities, which we have funded primarily with time deposits. Since 2009, in an effort to improve our earnings and to decrease our exposure to interest rate risk, we have generally sold all newly originated residential mortgage loans with terms of over ten years into the secondary market and we have shifted our focus to originating commercial real estate and commercial business loans. Such loans generally have shorter maturities than one-to-four family residential mortgage loans. However, due to the recent acquisitions and increased volume, the normal run-off associated with our residential real estate loan portfolio has exceeded our new originations within this same loan segment. As a result, we have begun to portfolio some of our newly originated, longer-term residential real estate loans versus selling them in the secondary market to assist in slowing down the decline in this particular loan segment.
Net Interest Income Analysis.We analyze our sensitivity to changes in interest rates through our net interest income simulation model which is provided to us by an independent third party. Net interest income is the difference between the interest income we earn on our interest-earning assets, such as loans and securities, and the interest we pay on our interest-bearing liabilities, such as deposits and borrowings. We estimate what our net interest income would be for a one-year period based on current interest rates. We then calculate what the net interest income would be for the same period under different interest rate assumptions. We also estimate the impact over a five year time horizon. The following table shows the estimated impact on net interest income for the one-year period beginning March 31, 2017 resulting from potential changes in interest rates. These estimates require certain assumptions to be made, including loan and mortgage-related investment prepayment speeds, reinvestment rates, and deposit maturities and decay rates. These assumptions are inherently uncertain. As a result, no simulation model can precisely predict the impact of changes in interest rates on our net interest income. Although the net interest income table below provides an indication of our interest rate risk exposure at a particular point in time, such estimates are not intended to, and do not, provide a precise forecast of the effect of changes in market interest rates on our net interest income and will differ from actual results.
Rate Shift (1) | | Net Interest Income Year 1 Forecast | | | Year 1 Change from Level | |
| | | (Dollars in thousands) | | | | | |
| | | | | | | | | |
+400 | | $ | 13,235 | | | | (7.0 | ) % |
+300 | | $ | 13,701 | | | | (3.7 | ) % |
+200 | | $ | 14,094 | | | | (1.0 | ) % |
+100 | | $ | 14,205 | | | | (0.2 | ) % |
Level | | $ | 14,234 | | | | — | |
-100 | | $ | 13,679 | | | | (3.9 | ) % |
-200 | | $ | 13,296 | | | | (6.6 | ) % |
-300 | | $ | 13,227 | | | | (7.1 | ) % |
(1)The calculated changes assume an immediate shock of the static yield curve.
Economic Value of Equity Analysis.We also analyze the sensitivity of our financial condition to changes in interest rates through our economic value of equity model, which is also provided to us by the same independent third party as the net interest income analysis. This analysis measures the difference between predicted changes in the present value of our assets and predicted changes in the present value of our liabilities assuming various changes in current interest rates. As with the net interest income simulation model, the estimates of changes in the economic value of our equity require certain assumptions to be made. These assumptions include loan and mortgage-related investment prepayment speeds, reinvestment rates, and deposit maturities and decay rates. These assumptions are inherently uncertain and, as a result, we cannot precisely predict the impact of changes in interest rates on the economic value of our equity. Although our economic value of equity analysis provides an indication of our interest rate risk exposure at a particular point in time, such estimates are not intended to, and do not, provide a precise forecast of the effect of changes in market interest rates on the economic value of our equity and will differ from actual results.
Rate Shift (1) | | Economic Value of Equity | | | % Change In Equity from Level | |
| | | (Dollars in thousands) | | | | | |
| | | | | | | | | |
+400 | | $ | 28,066 | | | | (55.3 | ) % |
+300 | | $ | 37,799 | | | | (42.2 | ) % |
+200 | | $ | 49,353 | | | | (26.7 | ) % |
+100 | | $ | 60,394 | | | | (11.9 | ) % |
Level | | $ | 69,525 | | | | — | |
-100 | | $ | 74,740 | | | | 6.2 | % |
-200 | | $ | 79,027 | | | | 10.9 | % |
-300 | | $ | 87,540 | | | | 22.8 | % |
____________________
(1) The calculated changes assume an immediate shock of the static yield curve.
Liquidity and Capital Management
Liquidity describes our ability to meet the financial obligations that arise in the ordinary course of business. Liquidity is primarily needed to meet the borrowing and deposit withdrawal requirements of our customers and to fund current and planned expenditures. Our primary sources of funds are deposits, scheduled amortization and prepayments of loan principal and mortgage-backed securities, maturities and calls of investment securities and funds provided by our operations. In addition, we have the ability to borrow from the Federal Home Loan Bank of Atlanta (FHLB). At March 31, 2017, we had $35.6 million in borrowings from the FHLB and the capacity to borrow approximately $88.2 million more, subject to our pledging sufficient assets. Historically we have not used borrowings to fund our operations, and have not had any borrowings for several years until December 2014.
Hamilton Bank may also borrow up to $5.0 million from a correspondent bank under a secured federal funds line of credit, and $1.0 million under an unsecured line of credit. We would be required to pledge investment securities to draw upon the secured line of credit.
We normally carry balances with correspondent banks that exceed the federally insured limit. We currently conduct an annual review of each correspondent bank’s financial information, including the bank’s capital ratios, balance sheet, income statement and allowance for loan losses, to determine if the bank is financially stable.
Loan repayments and maturing securities are a relatively predictable source of funds. However, deposit flows, calls of securities and prepayments of loans and mortgage-backed securities are strongly influenced by interest rates, general and local economic conditions and competition in the marketplace. These factors reduce the predictability of these sources of funds.
Our primary investing activities are the origination of one-to-four family real estate loans, commercial real estate, commercial business, construction and consumer loans, and the purchase of securities. For the year ended March 31, 2017, loan originations (including original commitment amount) totaled $68.1 million, compared to $49.2 million for the year ended March 31, 2016. Purchases of investment and mortgage-backed securities totaled $50.6 million for the year ended March 31, 2017 and $8.0 million for the year ended March 31, 2016.
Total deposits, excluding those acquired in the Fraternity acquisition, decreased $9.7 million during the year ended March 31, 2017, while total deposits increased $39.0 million, excluding those acquired in the Fairmount acquisition, during the year ended March 31, 2016. During fiscal 2016 we received approximately $23 million in money market deposits from one customer that was expected to be held for a short period of time. Roughly $17 million of those funds have since left the Bank. Deposit flows are affected by the level of interest rates, the interest rates and products offered by competitors and other factors. In the second half of fiscal 2016, we made a conscious effort to grow and retain maturing certificates of deposits through various promotions to assist in funding organic loan growth. Certificates of deposit allowed us to lock in those funds for an extended period of time based upon current interest rates. This strategy changed from fiscal 2015 when we continued our on-going efforts to reduce our reliance on certificates of deposit as a funding source. At that time, we were allowing higher costing certificates of deposit to runoff at maturity, as we focused on increasing the level of core deposits. At March 31, 2017, certificates of deposit scheduled to mature within one year totaled $124.9 million. Whether we retain these deposits will be determined in part by the interest rates we are willing to pay on such deposits.
We are committed to maintaining a strong liquidity position. We monitor our liquidity position on a daily basis. We anticipate that we will have sufficient funds to meet our current funding commitments. Based on our deposit retention experience and current pricing strategy, we anticipate that a significant portion of maturing time deposits will be retained.
At March 31, 2017 and 2016, we exceeded all of the applicable regulatory capital requirements for the Bank, including a new requirement under Basel III to obtain a minimum common equity core (Tier 1) capital to risk-weighted assets ratio of 4.5%. To be classified as a well-capitalized bank, we must have a common equity core (Tier 1) capital to risk-weighted assets ratio of at least 6.5%. For the year ended March 31, 2017, our common equity to Tier 1 capital was $40.1 million, or 12.13%, of total risk-weighted assets compared to $44.5 million, or 19.06% of total risk-weighted assets for the year ended March 31, 2016.
Our core (Tier 1) capital was $40.1 million and $44.5 million, or 8.28% and 11.78% of adjusted total assets, at March 31, 2017 and 2016, respectively. In order to be classified as “well-capitalized” under federal banking regulations, we were required to have core capital of at least $24.2 million, or 5.0% of adjusted assets, as of March 31, 2017. To be classified as a well-capitalized bank, we must also have a ratio of total risk-based capital to risk-weighted assets of at least 10.0%, and a Tier 1 risk-based capital to risk-weighted assets of at least 8%. At March 31, 2017 and 2016, we had total risk-based capital ratios of 12.81% and 19.81%, respectively, and Tier 1 risk-based capital ratios of 12.13% and 19.06%, respectively. Our regulatory risk weighted capital ratios decreased during fiscal 2017 primarily as a result of our risk-weighted assets increasing due to the Fraternity acquisition and an increase in loans due to organic growth.
Off-Balance Sheet Arrangements and Aggregate Contractual Obligations
Commitments.As a financial services provider, we routinely are a party to various financial instruments with off-balance-sheet risks, such as commitments to extend credit and unused lines of credit. While these contractual obligations represent our future cash requirements, a significant portion of commitments to extend credit may expire without being drawn upon. Such commitments are subject to the same credit policies and approval process accorded to loans we make.
Contractual Obligations. In the ordinary course of our operations, we enter into certain contractual obligations. Such obligations include data processing services, operating leases for premises and equipment, agreements with respect to borrowed funds and deposit liabilities.
Recent Accounting Pronouncements
The information required by this item is included in Note 2 to the consolidated financial statements included in this annual report.
Effect of Inflation and Changing Prices
The consolidated financial statements and related consolidated financial data presented herein regarding Hamilton Bank have been prepared in accordance with accounting principles generally accepted in the United States of America, which generally require the measurement of financial position and operating results in terms of historical dollars, without considering changes in relative purchasing power over time due to inflation. Unlike most industrial companies, virtually all of Hamilton Bank’s assets and liabilities are monetary in nature. As a result, interest rates generally have a more significant impact on Hamilton Bank’s performance than does the effect of inflation. Interest rates do not necessarily move in the same direction or in the same magnitude as the prices of goods and services, because such prices are affected by inflation to a larger extent than interest rates.
ITEM7A. | QUANTITATIVE AND QUALITATIVE DISCLOSURES ABOUT MARKET RISK |
The information required by this item is incorporated herein by reference to Part II, Item 7, “Management’s Discussion and Analysis of Financial Condition and Results of Operation.”
ITEM8. | FINANCIAL STATEMENTS AND SUPPLEMENTARY DATA |
The Consolidated Financial Statements, including supplemental data, of Hamilton Bancorp, Inc. begin on page F-1 of this Annual Report.
ITEM9. | CHANGES IN AND DISAGREEMENTS WITH ACCOUNTANTS ON ACCOUNTING AND FINANCIAL DISCLOSURE |
None.
ITEM9A. | CONTROLS AND PROCEDURES |
Evaluation of Disclosure Controls and Procedures.
The Company’s President and Chief Executive Officer, its Chief Financial Officer, and other members of its senior management team have evaluated the effectiveness of the Company’s disclosure controls and procedures (as defined in Exchange Act Rules 13a-15(e) or 15d-15(e)), as of March 31, 2017. Based on such evaluation, the President and Chief Executive Officer and Chief Financial Officer have concluded that the Company’s disclosure controls and procedures, as of the end of the period covered by this report, were adequate and effective to provide reasonable assurance that information required to be disclosed by the Company, including Hamilton Bank, in reports that are filed or submitted under the Exchange Act, is recorded, processed, summarized and reported, within the time periods specified in the Commission’s rules and forms.
Managements Report and Changes in Internal Controls Over Financial Reporting.
There have been no changes in the Company’s internal control over financial reporting during the quarter ended March 31, 2017 that have materially affected, or are reasonably likely to materially affect, the Company’s internal control over financial reporting.
The management of the Company is responsible for establishing and maintaining adequate internal control over financial reporting. The internal control process has been designed under our supervision to provide reasonable assurance regarding the reliability of financial reporting and the preparation of the Company’s financial statements for external reporting purposes in accordance with accounting principles generally accepted in the United States of America.
Management conducted an assessment of the effectiveness of the Company’s internal control over financial reporting as of March 31, 2017, utilizing the framework established in Internal Control — Integrated Framework issued by the Committee of Sponsoring Organizations of the Treadway Commission (COSO) in 1992 and revised in 2013. Based on this assessment, management has determined that the Company’s internal control over financial reporting as of March 31, 2017 is effective.
Our internal control over financial reporting includes policies and procedures that pertain to the maintenance of records that accurately and fairly reflect, in reasonable detail, transactions and dispositions of assets; and provide reasonable assurances that: (1) transactions are recorded as necessary to permit preparation of financial statements in accordance with accounting principles generally accepted in the United States of America; (2) receipts and expenditures are being made only in accordance with authorizations of management and the directors of the Company; and (3) provide reasonable assurance regarding prevention or timely detection of unauthorized acquisition, use, or disposition of the Company’s assets that could have a material effect on the Company’s financial statements.
All internal control systems, no matter how well designed, have inherent limitations. Therefore, even those systems determined to be effective can provide only reasonable assurance with respect to financial statement preparation and presentation. Also, projections of any evaluation of effectiveness to future periods are subject to the risk that controls may become inadequate because of changes in conditions, or that the degree of compliance with the policies or procedures may deteriorate.
Management’s report on internal control was not subject to attestation by the Company’s registered public accounting firm in accordance with rules of the Securities and Exchange Commission.
Not applicable.
PARTIII
ITEM10. | DIRECTORS, EXECUTIVE OFFICERS AND CORPORATE GOVERNANCE |
Information relating to the directors and officers of the Company, information regarding compliance with Section 16(a) of the Exchange Act, information regarding any changes in procedures for stockholders to recommend director nominees, and information regarding the audit committee and audit committee financial expert is incorporated herein by reference to the Company’s Proxy Statement for the Annual Meeting of Stockholders to be held on August 21, 2017 (the “Proxy Statement”) under the captions “Proposal 1—Election of Directors,” “Executive Officers,” “Section 16(a) Beneficial Ownership Reporting Compliance,” “Nominating Committee Procedures—Procedures to be Followed by Stockholders,” “Corporate Governance and Board Matters—Committees of the Board of Directors” and “Corporate Governance and Board Matters—Committees of the Board of Directors.
The Company has adopted a code of ethics that applies to its principal executive officer, the principal financial officer and principal accounting officer. The Code of Ethics is posted on the Company’s Internet Web site.
ITEM11. | EXECUTIVE COMPENSATION |
Information regarding executive and director compensation is incorporated herein by reference to the Proxy Statement under the captions “Executive Officers—Executive Compensation” and “Director Compensation.”
ITEM12. | SECURITY OWNERSHIP OF CERTAIN BENEFICIAL OWNERS AND MANAGEMENT AND RELATED STOCKHOLDERS MATTERS |
| | (a) | Security Ownership of Certain Beneficial Owners |
Information required by this item is incorporated herein by reference to the section captioned “Stock Ownership—Stock Ownership of Certain Beneficial Owners” in the Proxy Statement.
| | (b) | Security Ownership of Management |
Information required by this item is incorporated herein by reference to the section captioned “Stock Ownership—Stock Ownership of Management” in the Proxy Statement.
Management of the Company knows of no arrangements, including any pledge by any person or securities of the Company, the operation of which may at a subsequent date result in a change in control of the registrant.
| | (d) | Equity Compensation Plan Information |
The following table sets forth information as of March 31, 2017 about Company common stock that may be issued upon the exercise of options under the Hamilton Bancorp, Inc. 2013 Equity Incentive Plan. The plan was approved by the Company’s stockholders.
Plan Category | | Number of securities to be issued upon the exercise of outstanding options, warrants and rights | | | Weighted-average exercise price of outstanding options, warrants and rights | | | Number of securities remaining available for future issuance under equity compensation plans (excluding securities reflected in the first column) | |
| | | | | | | | | | | | | |
Equity compensation plans approved by security holders | | 242,350 | | | | $13.84 | | | 178,920 | |
| | | | | | | | | | | | | |
Equity compensation plans not approved by security holders | | N/A | | | | N/A | | | N/A | |
| | | | | | | | | | | | | |
Total | | 242,350 | | | | $13.84 | | | 178,920 | |
ITEM13. | CERTAIN RELATIONSHIPS AND RELATED TRANSACTIONS, AND DIRECTOR INDEPENDENCE |
The information relating to certain relationships and related transactions and director independence is incorporated herein by reference to the Proxy Statement under the captions “Transactions with Related Persons” and “Proposal 1 — Election of Directors.”
ITEM14. | PRINCIPAL ACCOUNTING FEES AND SERVICES |
The information relating to the principal accounting fees and expenses is incorporated herein by reference to the Proxy Statement under the captions “Proposal 2—Ratification of Independent Registered Public Accounting Firm—Audit Fees” and “—Pre-Approval of Services by the Independent Registered Public Accounting Firm.”
PARTIV
ITEM15. | EXHIBITS AND FINANCIAL STATEMENT SCHEDULES |
| | (1) | | The financial statements required in response to this item are incorporated by reference from Item 8 of this report. |
| | | | |
| | (2) | | All financial statement schedules are omitted because they are not required or applicable, or the required information is shown in the consolidated financial statements or the notes thereto. |
| | | | |
| | (3) | | Exhibits |
| | | | |
| | 3.1 | | Articles of Incorporation of Hamilton Bancorp, Inc. (Incorporated by reference to Exhibit 3.1 to the Company’s Registration Statement on Form S-1 (File No. 333-182151), as amended, initially filed with the SEC on June 15, 2012). |
| | | | |
| | 3.2 | | Bylaws of Hamilton Bancorp, Inc. (Incorporated by reference to Exhibit 3.2 to the Company’s Registration Statement on Form S-1 (File No. 333-182151), as amended, initially filed with the SEC on June 15, 2012). |
| | | | |
| | 4 | | Form of Common Stock Certificate of Hamilton Bancorp, Inc. Bylaws of Hamilton Bancorp, Inc. (Incorporated by reference to Exhibit 4 to the Company’s Registration Statement on Form S-1 (File No. 333-182151), as amended, initially filed with the SEC on June 15, 2012). |
| | | | |
| | 10.1 | | Employment Agreement between Hamilton Bank and Robert A. DeAlmeida (Incorporated by reference to Exhibit 10.1 to the Company’s Form 8-K (File No. 001-35693) filed with the SEC on October 15, 2012). |
| | | | |
| | 10.2 | | Employment Agreement between Hamilton Bancorp, Inc. and Robert A. DeAlmeida (Incorporated by reference to Exhibit 10.2 to the Company’s Form 8-K (File No. 001-35693) filed with the SEC on October 15, 2012). |
| | | | |
| | 10.3 | | Change in Control Agreement of John P. Marzullo (Incorporated by reference to Exhibit 10.4 to the Company’s Form 8-K (File No. 001-35693) filed with the SEC on October 15, 2012). |
| | | | |
| | 10.4 | | Hamilton Bank Non-Qualified Supplemental Employee Stock Ownership Plan (Incorporated by reference to Exhibit 10.5 to the Company’s Form 8-K (File No. 001-35693) filed with the SEC on October 15, 2012). |
| | | | |
| | 10.5 | | Hamilton Bank Executive Split Dollar Agreement with Robert A. DeAlmeida (Incorporated by reference to Exhibit 10.6 to the Company’s Registration Statement on Form S-1 (File No. 333-182151), as amended, initially filed with the SEC on June 15, 2012). |
| | | | |
| | 10.6 | | Hamilton Bank Agreement for Deferred Compensation of Salaries (Incorporated by reference to Exhibit 10.8 to the Company’s Registration Statement on Form S-1 (File No. 333-182151), as amended, initially filed with the SEC on June 15, 2012). |
| | | | |
| | 10.7 | | Hamilton Bank Agreement for Deferred Compensation of Board Fees (Incorporated by reference to Exhibit 10.9 to the Company’s Registration Statement on Form S-1 (File No. 333-182151), as amended, initially filed with the SEC on June 15, 2012). |
| | | | |
| | 10.8 | | Hamilton Bancorp, Inc. 2013 Equity Incentive Plan (Incorporated by reference to Appendix A of the Proxy Statement for the 2013 Annual Meeting of Stockholders (File No. 1-35693), filed October 18, 2013). |
| | | | |
| | 10.9 | | Change in Control Agreement of Ellen R. Fish (Incorporated by reference to Exhibit 10.9 to the Company’s Annual Report on Form 10-K for the year ended March 31, 2014 (File No. 001-35693), filed with the SEC on June 26, 2015). |
| | | | |
| | 21.0 | | Subsidiaries of Registrant |
| | 23.0 | | Consent of Dixon Hughes Goodman, LLP |
| | | | |
| | 31.1 | | Rule 13a-14(a)/15d-14(a) Certification of Chief Executive Officer |
| | | | |
| | 31.2 | | Rule 13a-14(a)/15d-14(a) Certification of Chief Financial Officer |
| | | | |
| | 32.0 | | Section 1350 Certifications |
| | | | |
| | 101.0 | | The following materials from the Company’s Annual Report on Form 10-K for the year ended March 31, 2017, formatted in XBRL (Extensible Business Reporting Language): (i) Consolidated Statements of Financial Condition; (ii) Consolidated Statements of Operations; (iii) Consolidated Statements of Changes in Shareholders’ Equity; (iv) Consolidated Statements of Cash Flows; and (v) the Notes to the Consolidated Financial Statements. |
ITEM16. | Form 10-K Summary. |
None.
SIGNATURES
Pursuant to the requirements of Section 13 or 15(d) of the Securities Exchange Act of 1934, the Registrant has duly caused this report to be signed on its behalf by the undersigned, thereunto duly authorized.
| HAMILTON BANCORP, INC. | |
| | | |
| | | |
Date: June 29, 2017 | By:/s/ Robert A. DeAlmeida | |
| Robert A. DeAlmeida | |
| President and Chief Executive Officer | |
Pursuant to the requirements of the Securities Exchange Act of 1934, this report has been signed below by the following persons on behalf of the Registrant and in the capacities and on the dates indicated.
Signatures | | Title | | Date |
| | | | | |
| | | | | |
/s/ Robert A. DeAlmeida | | President and Chief Executive Officer | | June 29, 2017 |
| Robert A. DeAlmeida | | (Principal Executive Officer) | | |
| | | | | |
| | | | | |
/s/ John P. Marzullo | | Senior Vice President, Chief Financial | | June 29, 2017 |
| John P. Marzullo | | Officer and Treasurer (Principal Financial and Accounting Officer) | | |
| | | | | |
| | | | | |
/s/ Carol L. Coughlin | | Chairperson of the Board | | June 29, 2017 |
| Carol L. Coughlin | | | | |
| | | | | |
| | | | | |
/s/ Joseph J. Bouffard | | Director | | June 29, 2017 |
| Joseph J. Bouffard | | | | |
| | | | | |
| | | | | |
/s/ William E. Ballard | | Director | | June 29, 2017 |
| William E. Ballard | | | | |
| | | | | |
| | | | | |
/s/ Jenny G. Morgan | | Director | | June 29, 2017 |
| Jenny G. Morgan | | | | |
| | | | | |
| | | | | |
/s/ William W. Furr | | Director | | June 29, 2017 |
| William W. Furr | | | | |
| | | | | |
| | | | | |
/s/ Bobbi R. Macdonald | | Director | | June 29, 2017 |
| Bobbi R. Macdonald | | | | |
/s/ James R. Farnum, Jr. | | Director | | June 29, 2017 |
| James R. Farnum, Jr. | | | | |

Report of Independent Registered Accounting Firm
The Board of Directors and Shareholders
Hamilton Bancorp, Inc.
Towson, Maryland
We have audited the accompanying consolidated statements of financial condition of Hamilton Bancorp, Inc. and Subsidiary (the “Company”) as of March 31, 2017 and 2016 and the related consolidated statements of operations, comprehensive (loss) income, changes in shareholders’ equity, and cash flows for the years then ended. These consolidated financial statements are the responsibility of the Company’s management. Our responsibility is to express an opinion on these consolidated financial statements based on our audits.
We conducted our audits in accordance with the standards of the Public Company Accounting Oversight Board (United States). Those standards require that we plan and perform the audits to obtain reasonable assurance about whether the consolidated financial statements are free of material misstatement. The Company is not required to have, nor were we engaged to perform, an audit of its internal control over financial reporting. Our audits include consideration of internal control over financial reporting as a basis for designing audit procedures that are appropriate in the circumstances, but not for the purpose of expressing an opinion on the effectiveness of the Company’s internal control over financial reporting. Accordingly, we express no such opinion. An audit also includes examining, on a test basis, evidence supporting the amounts and disclosures in the consolidated financial statements, assessing the accounting principles used and significant estimates made by management, as well as evaluating the overall consolidated financial statement presentation. We believe that our audits provide a reasonable basis for our opinion.
In our opinion, the consolidated financial statements referred to above present fairly, in all material respects, the financial position of Hamilton Bancorp, Inc. and Subsidiary as of March 31, 2017 and 2016, and the results of their operations and their cash flows for the years then ended, in conformity with accounting principles generally accepted in the United States of America.
Baltimore, Maryland
June 29, 2017
HAMILTON BANCORP, INC. AND SUBSIDIARY
Consolidated Statements of Financial Condition
March 31, 2017 and March 31, 2016
| | | March 31, | | | March 31, | |
| | | 2017 | | | 2016 | |
| | | | | | | | | |
Assets |
Assets | | | | | | | | |
Cash and due from banks | | $ | 24,436,793 | | | $ | 47,101,688 | |
Federal funds sold | | | 4,917,128 | | | | 20,346,848 | |
Cash and cash equivalents | | | 29,353,921 | | | | 67,448,536 | |
Certificates of deposit held as investment | | | 499,280 | | | | 3,968,229 | |
Securities available for sale, at fair value | | | 102,429,128 | | | | 70,484,400 | |
Federal Home Loan Bank stock, at cost | | | 2,020,200 | | | | 1,042,500 | |
Loans held for sale | | | - | | | | 259,450 | |
Loans | | | 338,933,198 | | | | 221,859,056 | |
Allowance for loan losses | | | (2,194,815 | ) | | | (1,702,365 | ) |
Net loans and leases | | | 336,738,383 | | | | 220,156,691 | |
Premises and equipment, net | | | 3,674,280 | | | | 3,555,474 | |
Premises and equipment held for sale | | | 547,884 | | | | 405,000 | |
Foreclosed real estate | | | 503,094 | | | | 443,015 | |
Accrued interest receivable | | | 1,310,080 | | | | 948,166 | |
Bank-owned life insurance | | | 18,253,348 | | | | 12,709,908 | |
Deferred income taxes | | | 7,976,850 | | | | 2,353,141 | |
Income taxes refundable | | | - | | | | 228,920 | |
Goodwill and other intangible assets | | | 9,302,828 | | | | 7,386,111 | |
Other assets | | | 1,920,740 | | | | 1,527,014 | |
Total Assets | | $ | 514,530,016 | | | $ | 392,916,555 | |
| | | | | | | | | |
Liabilities and Shareholders' Equity |
Liabilities | | | | | | | | |
Noninterest-bearing deposits | | $ | 30,401,454 | | | $ | 19,747,437 | |
Interest-bearing deposits | | | 382,454,320 | | | | 294,246,214 | |
Total deposits | | | 412,855,774 | | | | 313,993,651 | |
Borrowings | | | 36,124,899 | | | | 14,805,237 | |
Advances by borrowers for taxes and insurance | | | 1,868,110 | | | | 1,079,794 | |
Other liabilities | | | 3,890,003 | | | | 1,493,290 | |
Total liabilities | | | 454,738,786 | | | | 331,371,972 | |
| | | | | | | | | |
Commitments and contingencies | | | - | | | | - | |
| | | | | | | | | |
Shareholders' Equity | | | | | | | | |
Common stock, $.01 par value, 100,000,000 shares authorized. Issued and outstanding:3,411,075 shares at March 31, 2017 and 3,413,646 shares at March 31, 2016 | | | 34,111 | | | | 34,136 | |
Additional paid in capital | | | 31,656,235 | | | | 31,242,731 | |
Retained earnings | | | 31,730,673 | | | | 32,659,455 | |
Unearned ESOP shares | | | (2,221,800 | ) | | | (2,369,920 | ) |
Accumulated other comprehensive loss | | | (1,407,989 | ) | | | (21,819 | ) |
Total shareholders' equity | | | 59,791,230 | | | | 61,544,583 | |
Total Liabilities and Shareholders' Equity | | $ | 514,530,016 | | | $ | 392,916,555 | |
The accompanying notes are an integral part of these consolidatedfinancial statements.
HAMILTON BANCORP, INC. AND SUBSIDIARY
Consolidated Statements ofOperations
Years Ended March 31, 2017 and 2016
| | | 2017 | | | 2016 | |
Interest revenue | | | | | | | | |
Loans, including fees | | $ | 14,834,648 | | | $ | 9,644,443 | |
U.S. treasuries, government agencies and FHLB stock | | | 214,441 | | | | 350,718 | |
Municipal and corporate bonds | | | 338,916 | | | | 124,863 | |
Mortgage-backed securities | | | 1,183,227 | | | | 1,102,062 | |
Federal funds sold and other bank deposits | | | 190,374 | | | | 96,433 | |
Total interest revenue | | | 16,761,606 | | | | 11,318,519 | |
| | | | | | | | | |
Interest expense | | | | | | | | |
Deposits | | | 2,599,901 | | | | 1,742,294 | |
Borrowed funds | | | 271,205 | | | | 101,100 | |
Total interest expense | | | 2,871,106 | | | | 1,843,394 | |
| | | | | | | | | |
Net interest income | | | 13,890,500 | | | | 9,475,125 | |
Provision for loan losses | | | 3,395,006 | | | | 440,000 | |
Net interest income after provision for loan losses | | | 10,495,494 | | | | 9,035,125 | |
| | | | | | | | | |
Noninterest revenue | | | | | | | | |
Service charges | | | 420,234 | | | | 383,289 | |
Gain on sale of investment securities and certificates of deposit | | | 23,720 | | | | 271,559 | |
Gain on sale of loans held for sale | | | 23,087 | | | | 44,831 | |
(Loss) gain on sale of property and equipment | | | (5,046 | ) | | | 407,188 | |
Earnings on bank-owned life insurance | | | 485,400 | | | | 349,938 | |
Other | | | 107,152 | | | | 97,703 | |
Total noninterest revenue | | | 1,054,547 | | | | 1,554,508 | |
| | | | | | | | | |
Noninterest expenses | | | | | | | | |
Salaries | | | 5,283,578 | | | | 4,073,546 | |
Employee benefits | | | 1,472,466 | | | | 1,145,065 | |
Occupancy | | | 984,767 | | | | 779,325 | |
Advertising | | | 122,093 | | | | 138,791 | |
Furniture and equipment | | | 377,232 | | | | 318,218 | |
Data processing | | | 777,554 | | | | 585,825 | |
Legal services | | | 291,550 | | | | 162,917 | |
Other professional services | | | 1,046,450 | | | | 383,125 | |
Merger related expenses | | | 219,417 | | | | 899,606 | |
Branch consolidation expense | | | 494,977 | | | | - | |
Deposit insurance premiums | | | 318,132 | | | | 227,112 | |
Foreclosed real estate expense and losses | | | 7,468 | | | | 17,157 | |
Other operating | | | 1,841,144 | | | | 1,529,871 | |
Total noninterest expense | | | 13,236,828 | | | | 10,260,558 | |
| | | | | | | | | |
(Loss) income before income taxes | | | (1,686,787 | ) | | | 329,075 | |
Income tax (benefit) expense | | | (758,005 | ) | | | 421,691 | |
Net loss | | $ | (928,782 | ) | | $ | (92,616 | ) |
| | | | | | | | | |
Net loss per common share: | | | | | | | | |
Basic | | $ | (0.29 | ) | | $ | (0.03 | ) |
Diluted | | $ | (0.29 | ) | | $ | (0.03 | ) |
The accompanying notes are an integral part of these consolidatedfinancial statements.
HAMILTON BANCORP, INC. AND SUBSIDIARY
Consolidated Statements ofComprehensive (Loss) Income
Years Ended March 31, 2017 and 2016
| | | 2017 | | | 2016 | |
| | | | | | | | | |
Net loss | | $ | (928,782 | ) | | $ | (92,616 | ) |
Other comprehensive income (loss): | | | | | | | | |
Unrealized (loss) gain on investment securities available for sale | | | (2,127,277 | ) | | | 733,117 | |
Reclassification adjustment for realized gain on investment securitiesavailable for sale included in net income | | | (23,720 | ) | | | (271,559 | ) |
Total unrealized (loss) gain on investment securities available for sale | | | (2,150,997 | ) | | | 461,558 | |
Unrealized loss on derivative transactions | | | (83,634 | ) | | | - | |
Income tax (benefit) expense relating to investment securitiesavailable for sale and derivative transactions | | | (848,461 | ) | | | 182,062 | |
Other comprehensive (loss) income | | | (1,386,170 | ) | | | 279,496 | |
| | | | | | | | | |
Total comprehensive (loss) income | | $ | (2,314,952 | ) | | $ | 186,880 | |
The accompanying notes are an integral part of these consolidatedfinancial statements.
HAMILTON BANCORP, INC. AND SUBSIDIARY
Consolidated Statements ofChanges in Shareholders’ Equity
Years Ended March 31, 2017 and 2016
| | | | | | | | | | | | | | | | | | | Accumulated | | | | | |
| | | | | | | Additional | | | | | | | Unearned | | | other | | | Total | |
| | | Common | | | paid-in | | | Retained | | | ESOP | | | comprehensive | | | shareholders' | |
| | | stock | | | capital | | | earnings | | | shares | | | loss | | | equity | |
| | | | | | | | | | | | | | | | | | | | | | | | | |
Balances at April 1, 2015 | | $ | 34,177 | | | $ | 30,832,815 | | | $ | 32,752,071 | | | $ | (2,518,040 | ) | | $ | (301,315 | ) | | $ | 60,799,708 | |
| | | | | | | | | | | | | | | | | | | | | | | | | |
Net loss | | | - | | | | - | | | | (92,616 | ) | | | - | | | | - | | | | (92,616 | ) |
Unrealized gain on available for salesecurities, net of tax effect of $182,062 | | | - | | | | - | | | | - | | | | - | | | | 279,496 | | | | 279,496 | |
Stock based compensation - options | | | - | | | | 209,209 | | | | - | | | | - | | | | - | | | | 209,209 | |
Restricted stock - compensation and activity | | | (41 | ) | | | 162,497 | | | | - | | | | - | | | | - | | | | 162,456 | |
ESOP shares allocated for release | | | - | | | | 38,210 | | | | - | | | | 148,120 | | | | - | | | | 186,330 | |
| | | | | | | | | | | | | | | | | | | | | | | | | |
Balances at March 31, 2016 | | $ | 34,136 | | | $ | 31,242,731 | | | $ | 32,659,455 | | | $ | (2,369,920 | ) | | $ | (21,819 | ) | | $ | 61,544,583 | |
| | | | | | | | | | | | | | | | | | | | | | | | | |
Net loss | | | - | | | | - | | | | (928,782 | ) | | | - | | | | - | | | | (928,782 | ) |
Unrealized loss on available for salesecurities, net of tax effect of $ (848,461) | | | - | | | | - | | | | - | | | | - | | | | (1,302,536 | ) | | | (1,302,536 | ) |
Unrealized loss on derivative transactions | | | - | | | | - | | | | - | | | | - | | | | (83,634 | ) | | | (83,634 | ) |
Stock based compensation - options | | | - | | | | 216,735 | | | | - | | | | - | | | | - | | | | 216,735 | |
Restricted stock - compensation and activity | | | (25 | ) | | | 158,649 | | | | - | | | | - | | | | - | | | | 158,624 | |
ESOP shares allocated for release | | | - | | | | 38,120 | | | | - | | | | 148,120 | | | | - | | | | 186,240 | |
| | | | | | | | | | | | | | | | | | | | | | | | | |
Balances at March 31, 2017 | | $ | 34,111 | | | $ | 31,656,235 | | | $ | 31,730,673 | | | $ | (2,221,800 | ) | | $ | (1,407,989 | ) | | $ | 59,791,230 | |
The accompanying notes are an integral part of these consolidatedfinancial statements.
HAMILTON BANCORP, INC. AND SUBSIDIARY
Consolidated Statements of Cash Flows
Years Ended March 31, 2017 and 2016
| | | 2017 | | | 2016 | |
| | | | | | | | | |
Cash flows from operating activities | | | | | | | | |
Interest received | | $ | 16,415,596 | | | $ | 11,704,151 | |
Fees and commissions received | | | 522,341 | | | | 817,522 | |
Interest paid | | | (4,004,880 | ) | | | (2,029,095 | ) |
Cash paid to suppliers and employees | | | (11,216,410 | ) | | | (9,259,922 | ) |
Origination of loans held for sale | | | (2,017,697 | ) | | | (3,969,775 | ) |
Proceeds from sale of loans held for sale | | | 2,300,234 | | | | 4,336,295 | |
Increase in deferred tax asset | | | (1,455,219 | ) | | | (204,030 | ) |
Net cash provided by operating activities | | | 543,965 | | | | 1,395,146 | |
| | | | | | | | | |
Cash flows from investing activities | | | | | | | | |
Acquisition, net of cash acquired | | | (10,508,813 | ) | | | (12,723,870 | ) |
Proceeds from sale of securities available for sale | | | 4,282,233 | | | | 19,228,337 | |
Proceeds from maturing and called securitiesavailable for sale, including principal pay downs | | | 28,963,565 | | | | 21,322,394 | |
Proceeds from sale of certificates of deposit held for investment | | | 1,730,273 | | | | - | |
Proceeds from maturing and called certificates of deposit | | | 1,724,000 | | | | 514,510 | |
Purchase of investment securities available for sale | | | (50,585,898 | ) | | | (8,020,125 | ) |
Redemption of Federal Home Loan Bank stock | | | 210,800 | | | | - | |
Purchase of Federal Home Loan Bank stock | | | (405,900 | ) | | | (3,800 | ) |
Loans made, net of principal repayments | | | (10,461,510 | ) | | | (8,018,865 | ) |
Purchase of premises and equipment | | | (273,669 | ) | | | (75,052 | ) |
Proceeds from sale of premises and equipment | | | 442,529 | | | | 463,839 | |
Proceeds from sale of foreclosed real estate | | | 60,258 | | | | 11,752 | |
Net cash (used) provided by investing activities | | | (34,822,132 | ) | | | 12,699,120 | |
| | | | | | | | | |
Cash flows from financing activities | | | | | | | | |
Net increase (decrease) inDeposits | | | (10,529,332 | ) | | | 38,312,626 | |
Advances by borrowers for taxes and insurance | | | 788,316 | | | | 460,766 | |
Proceeds from borrowings | | | 11,578,805 | | | | - | |
Payments of borrowings | | | (5,501,555 | ) | | | (2,000,000 | ) |
Interest rate swap on FHLB borrowings | | | (83,634 | ) | | | - | |
Issuance of restricted stock | | | 20 | | | | - | |
Redemption of restricted stock | | | (69,068 | ) | | | (63,010 | ) |
Net cash (used) provided by financing activities | | | (3,816,448 | ) | | | 36,710,382 | |
| | | | | | | | | |
Net (decrease) increase in cash and cash equivalents | | | (38,094,615 | ) | | | 50,804,648 | |
| | | | | | | | | |
Cash and cash equivalents at beginning of period | | | 67,448,536 | | | | 16,643,888 | |
| | | | | | | | | |
Cash and cash equivalents at end of period | | $ | 29,353,921 | | | $ | 67,448,536 | |
| | | | | | | | | |
Supplemental disclosures of cash flow information | | | | | | | | |
Total cash consideration paid for Fraternity acquisition | | $ | 25,704,871 | | | $ | - | |
Total cash consideration paid for Fairmount acquisition | | | - | | | | 14,192,370 | |
Less cash acquired | | | 15,196,058 | | | | 1,468,499 | |
Acquisition, net of cash acquired | | $ | 10,508,813 | | | $ | 12,723,871 | |
The accompanying notes are an integral part of these consolidatedfinancial statements.
HAMILTON BANCORP, INC. AND SUBSIDIARY
Consolidated Statements of Cash Flows
(Continued)
| | | 2017 | | | 2016 | |
| | | | | | | | | |
Reconciliation of net loss to net cash providedby operating activities | | | | | | | | |
Net loss | | $ | (928,782 | ) | | $ | (92,616 | ) |
Adjustments to reconcile net loss to net cash providedby operating activities | | | | | | | | |
Amortization of premiums on certificates of deposit | | | 12,949 | | | | 12,858 | |
Amortization of premiums on securities | | | 840,535 | | | | 387,268 | |
Gain on sale of investment securities and certificates of deposit | | | (23,720 | ) | | | (271,559 | ) |
Loss on sale of foreclosed real estate | | | 6,238 | | | | - | |
Loan discount accretion | | | (841,329 | ) | | | (9,807 | ) |
Deposit premium amortization | | | (597,655 | ) | | | (104,833 | ) |
Borrowing premium amortization | | | (551,125 | ) | | | (83,910 | ) |
Core deposit intangible asset amortization | | | 121,022 | | | | 62,573 | |
Premises and equipment depreciation and amortization | | | 334,210 | | | | 278,865 | |
Loss (gain) on sale of premises and equipment | | | 5,046 | | | | (407,188 | ) |
Stock based compensation | | | 444,406 | | | | 434,675 | |
Provision for loan losses | | | 3,395,006 | | | | 440,000 | |
ESOP shares allocated for release | | | 186,240 | | | | 186,330 | |
| Decrease (increase) in | | | | | | | | |
Accrued interest receivable | | | (361,914 | ) | | | (112,226 | ) |
Loans held for sale | | | 259,450 | | | | 321,689 | |
Cash surrender value of life insurance | | | (485,399 | ) | | | (349,939 | ) |
Income taxes refundable and deferred income taxes | | | (2,213,224 | ) | | | 217,660 | |
Other assets | | | 2,565,464 | | | | 377,626 | |
| Increase (decrease) in | | | | | | | | |
Accrued interest payable | | | 15,007 | | | | 3,042 | |
Deferred loan origination fees | | | 3,748 | | | | 36,074 | |
Other liabilities | | | (1,642,208 | ) | | | 68,564 | |
Net cash provided by operating activities | | $ | 543,965 | | | $ | 1,395,146 | |
| | | | | | | | | |
Noncash investing activity | | | | | | | | |
Real estate acquired through foreclosure | | $ | 126,575 | | | $ | - | |
The accompanying notes are an integral part of these consolidatedfinancial statements.
HAMILTON BANCORP, INC. AND SUBSIDIARY
Form 10-K
Notes to Consolidated Financial Statements
March 31, 2017
Note 1: Nature of Operations and Summary of Significant Accounting Policies
Nature of Operations
Hamilton Bancorp, Inc. (the “Company”) was incorporated on June 7, 2012 to serve as the stock holding company for Hamilton Bank (the “Bank”), a federally chartered savings bank. On October 10, 2012, the Bank converted from a mutual savings bank to a stock savings bank and became the wholly owned subsidiary of the Company. In connection with the conversion, the Company sold 3,703,000 shares of common stock at a price of $10.00 per share, through which the Company received proceeds of approximately $35,580,000, net of offering expenses of approximately $1,450,000. The Bank’s employee stock ownership plan (the “ESOP”) purchased 8.0% of the shares sold in the offering, or 296,240 common shares. The purchase of shares by the ESOP was funded by a loan from the Company. The company’s common stock began trading on the NASDAQ Capital Market under the trading symbol “HBK” on October 12, 2012.
In accordance with the Office of the Comptroller of the Currency (the “OCC”) regulations, upon the completion of the conversion, the Bank restricted retained earnings by establishing a liquidation account. The liquidation account will be maintained for the benefit of eligible account holders who continue to maintain their accounts at the Bank after conversion. The liquidation account will be reduced annually to the extent that eligible account holders have reduced their qualifying deposits. Subsequent increases will not restore an eligible account holder’s interest in the liquidation account. In the event of a complete liquidation of the Bank, and only in such event, each account holder will be entitled to receive a distribution from the liquidation account in an amount proportionate to the adjusted qualifying account balances then held. The Bank may not pay dividends if those dividends would reduce equity capital below the required liquidation account amount.
On May 13, 2016, the Company completed its acquisition of Fraternity Community Bancorp, Inc. (“Fraternity”) through the merger of Fraternity, the parent company of Fraternity Federal Savings and Loan, with and into the Company pursuant to the Agreement and Plan of Merger dated as of October 12, 2015, by and between the Company and Fraternity. As a result of the merger, each shareholder of Fraternity received a cash payment equal to nineteen dollars and twenty-five cents ($19.25) for each share of Fraternity common stock, or an aggregate of approximately $25.7 million. Immediately following the merger of Fraternity into the Company, Fraternity Federal Savings and Loan was merged with and into the Bank, with the Bank as the surviving entity.
On September 11, 2015, the Company completed its acquisition of Fairmount Bancorp, Inc. (“Fairmount Bancorp”) through the merger of Fairmount Bancorp, the parent company of Fairmount Bank, with and into the Company pursuant to the Agreement and Plan of Merger dates as of April 15, 2015, by and between the Company and Fairmount Bancorp. As a result of the merger, each shareholder of Fairmount Bancorp received a cash payment equal to thirty dollars ($30.00) for each share of Fairmount Bancorp common stock, or an aggregate of approximately $15.4 million. In connection with the merger, immediately thereafter Fairmount Bank was merged with and into the Bank, with the Bank as the surviving bank.
Hamilton Bancorp is a holding company that operates a community bank with seven branches in the Baltimore-metropolitan area. Its primary deposit products are certificates of deposit and demand, savings, NOW, and money market accounts. Its primary lending products consist of real estate mortgages, along with commercial and consumer loans.Hamilton Bancorp’s primary source of revenue is derived from loans to customers, who are predominately small and middle-market businesses and middle-income individuals.
HAMILTON BANCORP, INC AND SUBSIDIARY
Notes to Consolidated Financial Statements (Continued)
Summary of Significant Accounting Policies
The accounting and reporting policies of Hamilton Bancorp, Inc. and Subsidiary (“Hamilton”) conform to accounting principles generally accepted in the United States of America (“U.S. GAAP”) and to general practices in the banking industry. The more significant policies follow:
Principles of Consolidation. The accompanying consolidated financial statements include the accounts of the parent company and its wholly owned subsidiary, Hamilton Bank. All significant intercompany balances and transactions have been eliminated in consolidation.
Reclassifications. Certain prior year amounts have been reclassified to conform to current period classifications. The reclassifications had no effect on net loss, or the net change in cash and cash equivalents and are not material to previously issued financial statements.
Use of Estimates. The preparation of financial statements in conformity with U.S. GAAP requires management to make estimates and assumptions that affect the amounts reported in the financial statements and the accompanying notes. Actual results could differ significantly from those estimates. Material estimates that are particularly susceptible to significant change in the near term relate to the determination of the allowance for loan losses, deferred income tax valuation allowances, the fair value of investment securities and other than temporary impairment of investment securities.
Cash and Cash Equivalents. For purposes of reporting cash flows, cash and cash equivalents include cash on hand, amounts due from banks with original maturities of less than 90 days, brokerage money market accounts, and federal funds sold. Generally, federal funds are sold as overnight investments.
Investment Securities. Management determines the appropriate classification of investment securities at the time of purchase. Securities that may be sold before maturity are classified as available for sale and carried at fair value. Investment securities that management has the intent and ability to hold to maturity are classified as held to maturity and carried at amortized cost. All investment securities held by Hamilton at March 31, 2017 and 2016 are classified as available for sale.
Investment securities designated as available for sale are stated at estimated fair value based on quoted market prices. They represent those securities which management may sell as part of its asset/liability strategy or that may be sold in response to changing interest rates or liquidity needs. Changes in unrealized gains and losses, net of related deferred taxes, for available for sale securities are recorded in other comprehensive income. Realized gains (losses) on available for sale securities are included in noninterest revenue and, when applicable, are reported as a reclassification adjustment in other comprehensive income. Realized gains and losses on the sale of available for sale securities are recorded on the trade date and are determined by the specific identification method. The amortization of premiums and the accretion of discounts are recognized in interest revenue using methods approximating the interest method over the term of the security.
In estimating other-than-temporary impairment losses, management considers the length of time and the extent to which the fair value has been less than cost, the financial condition and near-term prospects of the issuer, and the intent and ability of the Bank to retain its investment in the issuer for a period of time sufficient to allow for any anticipated recovery in fair value.
Federal Home Loan Bank Stock.Federal Home Loan Bank of Atlanta (the “FHLB”) stock is an equity interest in the FHLB, which does not have a readily determinable fair value for purposes of generally accepted accounting principles, because its ownership is restricted and it lacks a market. FHLB stock is carried at cost, which approximates fair value and can be sold back only at par value of $100 per share and only to the FHLB or another member institution. As a member of the FHLB, the Bank is required to purchase stock based on its total assets. Additional stock is purchased and redeemed based on the outstanding FHLB advances to the Bank. As of March 31, 2017 and 2016, the Company owned shares totaling $2,020,200 and $1,042,500, respectively.
HAMILTON BANCORP, INC AND SUBSIDIARY
Notes to Consolidated Financial Statements (Continued)
Loans Held For Sale.Mortgage loans originated and intended for sale are carried at the lower of aggregate cost or estimated fair value. Fair value is determined based on outstanding investor commitments, or in the absence of such commitments, based on current investor yield requirements. Gains and losses on loan sales are determined by the specific-identification method.
Loans Receivable. The Bank makes mortgage, commercial, and consumer loans to customers. A substantial portion of the loan portfolio is represented by mortgage loans throughout the Baltimore metropolitan area. The ability of the Bank’s debtors to repay their loans is dependent upon the real estate and general economic conditions in this area.
Loans are reported at their outstanding unpaid principal balance adjusted for the allowance for loan loss, premiums on loans acquired, and/or any deferred fees or costs on originated loans. Interest revenue is accrued on the unpaid principal balance. Loan origination fees and the direct costs of underwriting and closing loans are recognized over the life of the related loan as an adjustment to yield using a method that approximates the interest method. Any differences that arise from prepayment will result in a recalculation of the effective yield.
Loans are generally placed on nonaccrual status when they are 90 days past due. Past due status is based on contractual terms of the loan. In all cases, loans are placed on nonaccrual status at an earlier date if the collection of principal or interest is considered doubtful. All interest accrued but not collected for loans that are placed on nonaccrual status are reversed against interest revenue. The interest on nonaccrual loans is accounted for on the cash basis method, until the loans qualify for return to accrual status. Loans are returned to accrual status when all the principal and interest amounts contractually due are brought current and, in management’s judgment, future payments are reasonably assured.
Loans are considered impaired when, based on current information, management considers it unlikely that collection of principal and interest payments will be made according to contractual terms. If collection of principal is evaluated as doubtful, all payments are applied to principal. Impaired loans are measured: (i) at the present value of expected cash flows discounted at the loan’s effective interest rate; (ii) at the observable market price; or (iii) at the fair value of the collateral if the loan is collateral dependent. If the measure of the impaired loan is less than the recorded investment in the loan, an impairment is recognized through an allocation of the allowance for loan losses and corresponding provision for loan losses. Generally, identified impairments are charged-off against the allowance for loan losses.
Troubled debt restructurings are loans for which Hamilton, for legal or economic reasons related to a debtor’s financial difficulties, has granted a concession to the debtor that it otherwise would not have considered. Concessions that result in the categorization of a loan as a troubled debt restructuring include:
| | ● | Reduction of the stated interest rate; |
| | ● | Extension of the maturity date or dates at a stated interest rate lower than the current market rate for new debt with similar risk; |
| | ● | Reduction of the face amount or maturity amount of the debt as stated in the instrument or other agreement; or |
| | ● | Reduction of accrued interest |
Accounting for Certain Loans or Debt Securities Acquired in a Transfer.The loans acquired from the Company’s acquisition of Fraternity on May 13, 2016 and Fairmount on September 11, 2015 (see Note 3 “Acquisitions”) were recorded at fair value at the acquisition date and no separate valuation allowance was established. The initial fair values were determined by management, with the assistance of an independent valuation specialist, based on estimated expected cash flows discounted at appropriate rates. The discount rates were based on market rates for new originations of comparable loans and did not include a separate factor for loan losses as that was included in the estimated cash flows.
HAMILTON BANCORP, INC AND SUBSIDIARY
Notes to Consolidated Financial Statements (Continued)
Accounting Standards Codification (“ASC”) Topic 310-30,Loans and Debt Securities Acquired with Deteriorated Credit Quality, applies to loans acquired in a transfer with evidence of deterioration of credit quality for which it is probable, at acquisition, that the investor will be unable to collect all contractually required payments receivable. If both conditions exist, the Company determines whether to account for each loan individually or whether such loans will be assembled into pools based on common risk characteristics such as credit score, loan type, and origination date.
The Company considered expected prepayments and estimated the total expected cash flows, which included undiscounted expected principal and interest. The excess of that amount over the fair value of the loan is referred to as accretable yield. Accretable yield is recognized as interest income on a constant yield basis over the expected life of the loan. The excess of the contractual cash flows over expected cash flows is referred to as nonaccretable difference and is not accreted into income. Over the life of the loan, the Company continues to estimate expected cash flows. Subsequent decreases in expected cash flows are recognized as impairments in the current period through the allowance for loan losses. Subsequent increases in cash flows to be collected are first used to reverse any existing valuation allowance and any remaining increase are recognized prospectively through an adjustment of the loan’s yield over its remaining life.
ASC Topic 310-20,Nonrefundable Fees and Other Costs, was applied to loans not considered to have deteriorated credit quality at acquisition. Under ASC Topic 310-20, the difference between the loan’s principal balance at the time of purchase and the fair value is recognized as an adjustment of yield over the life of the loan.
Allowance for Loan Losses. The allowance for loan losses represents an amount which, in management’s judgment, will be adequate to absorb probable future losses on existing loans. The allowance for loan losses is established, as loan losses are estimated to have occurred, through a provision for loan losses charged to earnings. Loan losses are charged against the allowance when management believes the uncollectability of a loan balance is confirmed. Recoveries on previously charged-off loans are credited to the allowance for loan losses.
The allowance for loan losses is increased by provisions charged to income and reduced by charge-offs, net of recoveries. Management’s periodic evaluation of the adequacy of the allowance is based on the Bank’s past loan loss experience, known and inherent risks in the loan portfolio, adverse situations that may affect the borrower’s ability to repay, estimated value of any underlying collateral and current economic conditions. The look back period for historical losses consists of using both a 36 month and 48 month look back period for net charge-offs. Both of these periods are used individually to develop a range in which the allowance for loan loss should be within.
Management considers a number of factors in estimating the required level of the allowance. These factors include: historical loss experience in the loan portfolios; the levels and trends in past-due and nonaccrual loans; the status of nonaccrual loans and other loans identified as having the potential for further deterioration; credit risk and industry concentrations; trends in loan volume; the effects of any changes in lending policies and procedures or underwriting standards; and a continuing evaluation of the economic environment. Management modified the analysis during the quarter ended September 30, 2016 by keeping our net charge-off history as a percentage of loans, as it pertains to each loan segment, constant across all risk ratings and altering our qualitative factors either up or down based upon the respective risk rating for each loan segment. The change in methodology did not have a material impact on the amount of the allowance for loan and lease losses at September 30, 2016, the date of the change, as compared to the prior methodology.
Bank-Owned Life Insurance (BOLI).The Bank purchased single premium life insurance policies on certain employees of the Bank. The net cash surrender value of those policies is included in the accompanying statement of financial position. Appreciation in the value of the insurance policies is recognized as noninterest revenue.
Premises and Equipment. Land is carried at cost. Buildings, land improvements, leasehold improvements, and furniture and equipment are stated at cost less accumulated depreciation and amortization. Depreciation is computed primarily by the straight-line method over the estimated useful lives of the assets. Leasehold improvements are amortized over the lesser of the lease term or the useful lives of the improvements. Maintenance and normal repairs are charged to noninterest expense as incurred, while additions and improvements to buildings and furniture and equipment are capitalized. Gains and losses on disposition of assets are reflected in earnings.
HAMILTON BANCORP, INC AND SUBSIDIARY
Notes to Consolidated Financial Statements (Continued)
Foreclosed Real Estate. Real estate acquired through foreclosure or other means is recorded at the lower of its carrying value or the fair value of the related real estate collateral less estimated selling costs. Losses in estimated fair value incurred at the time of acquisition of the property are charged to the allowance for loan losses. Subsequent reductions in the estimated fair value of the property are included in noninterest expense. Costs to maintain foreclosed real estate are expensed as incurred.
Goodwill and Other Intangible Assets. Goodwill represents the excess of the cost of an acquisition over the fair value of the net assets acquired. Intangible assets, consisting of core deposit intangibles, represent purchased assets that also lack physical substance but can be distinguished from goodwill because of contractual or other legal rights or because the asset may be sold or exchanged on its own or in combination with a related contract, asset, or liability. Core deposit intangibles are amortized on an accelerated basis over an eight-year period. Goodwill is not amortized but is evaluated on an annual basis to determine impairment, if any. Any impairment of goodwill would be recognized against income in the period of impairment.
DerivativeFinancial Instruments and Hedging Activities.Derivatives are initially recognized at fair value on the date a derivative contract is entered into and are subsequently re-measured at their fair value. The accounting for changes in the fair value of a derivative depends on the intended use of the derivative and the resulting designation. The Company documents at the inception of the transaction the relationship between hedging instruments and hedged items, as well as its risk management objective and strategy for undertaking various hedge transactions.
For derivatives qualifying as cash flow hedges, the Company also documents its assessment, both at hedge inception and on an ongoing basis, of whether the derivatives that are used in hedging transactions are highly effective in offsetting changes in fair values or cash flows of hedged items. The effective portion of changes in fair value of derivatives that are designated and qualify as cash flow hedges is recognized in the consolidated statement of comprehensive (loss) income. The gain or loss relating to the ineffective portion is recognized immediately in the consolidated statement of operations as a gain or loss. When a hedging instrument expires or is sold, or when a hedge no longer meets the criteria for hedge accounting, any cumulative gain or loss existing in equity at that time remains in equity and is recognized when the forecast transaction is ultimately recognized in the statement of operations. When a forecast transaction is no longer expected to occur, the cumulative gain or loss that was reported in equity is immediately transferred to the statement of operations as a gain or loss to income.
For derivative instruments designated as fair-value hedges, the change in fair value of the derivative is recognized in the consolidated statement of operations under the same heading as the change in fair value of the hedged item for the portion attributable to the hedged risk. For accounting purposes, if the derivative is highly effective, the change in fair values relating to the asset or liability and the hedged item will offset one another and result in no impact to overall income.
Gains (losses) on derivatives representing either hedge components excluded from the assessment of effectiveness or hedge ineffectiveness are recognized in earnings.
Off-Balance-Sheet Credit-Related Financial Instruments. In the ordinary course of business, the Bank enters into commitments to extend credit, including commitments under standby letters of credit. Such financial instruments are recorded when they are funded or otherwise required to be recognized.
Advertising Costs.Advertising costs are expensed as incurred and included in non-interest expenses.
Income Taxes. The provision for income taxes includes taxes payable for the current year and deferred income taxes. Deferred income taxes are provided for the temporary differences between financial and taxable income and other tax attributes, such as AMT credit carryovers. Deferred tax assets and liabilities are determined based on the difference between the financial statement and tax basis of assets and liabilities, using enacted tax rates in effect for the year in which the differences are expected to reverse. Deferred tax assets are reduced by a valuation allowance when, in the opinion of management, it is more likely than not that some portion of the deferred tax asset will not be realized. Deferred tax assets and liabilities are adjusted for the effects of changes in tax laws and rates on the date of enactment.
HAMILTON BANCORP, INC AND SUBSIDIARY
Notes to Consolidated Financial Statements (Continued)
Earnings Per Common Share. Basic earnings per share represents income available to common shareholders divided by the weighted-average number of common shares outstanding during the period. Diluted earnings per share includes additional common shares that would have been outstanding if dilutive potential common shares had been issued, as well as any adjustment to income that would result from the assumed issuance. Potential common shares relate to outstanding stock options, restricted stock, and warrants and are determined using the treasury stock method.
Stock Based Compensation.Compensation cost is recognized for stock options and restricted stock awards issued to employees and directors, based on the fair value of these awards at the date of grant. A Black-Scholes model is utilized to estimate the fair value of stock options, while the market price of the Company’s common stock at the date of grant is used for restricted stock awards. Compensation cost is recognizedover the required service period, generally defined as the vesting period. For awards with graded vesting, compensation cost is recognized on a straight-line basis over the requisite service period for the entire award.
Note 2: New Accounting Pronouncements
Recent Accounting Pronouncements
ASU No. 2016-15, Statement of Cash Flows (Topic 230): Classification of Certain Cash Receipts and Cash Payments. This update made the following changes that may affect the Company: (1) Debt Prepayment or Debt Extinguishment Costs: Cash payments for debt prepayment or debt extinguishment costs should be classified as cash flows for financing activities. (2) Proceeds from the settlement of Bank-Owned Life Insurance Policies: Cash proceeds received from the settlement of bank-owned life insurance policies should be classified as cash flows from investing activities. The cash payments for premiums on bank-owned policies may be classified as cash flows from investing activities, operating activities, or a combination of investing and operating activities. The amendments in this Update will be effective for public business entities for fiscal years beginning after December 15, 2017, and interim periods within those fiscal years. The Company does not expect the guidance to have a material impact on its financial statements.
ASU 2016-13, Financial Instruments – Credit Losses.The main objective of this update is to provide financial statement users with more decision-useful information about the expected credit losses on financial instruments and other commitments to extend credit held by a reporting entity at each reporting date. To achieve this objective, the guidance in this update replaces the incurred loss impairment methodology in current GAAP with a methodology that reflects expected credit losses and requires consideration of a broader range of reasonable and supportable information to inform credit loss estimates. The measurement of expected credit losses is based on relevant information about past events, including historical experience, current conditions, and reasonable and supportable forecasts that affect the collectability of the reported amount. An entity must use judgment in determining the relevant information and estimation methods that are appropriate in its circumstances. The guidance in this update is effective for fiscal years beginning after December 15, 2019 or earlier upon election, including interim periods within those fiscal years. The Company is currently evaluating this guidance to determine the impact on its consolidated financial statements.
ASU 2016-09, Improvements to Employee share-Based Payment Accounting (Topic 718).This ASU includes provisions intended to simplify various aspects related to how share-based payments are accounted for and presented in the financial statements. Some of the key provisions of this new ASU include: (1) companies will no longer record excess tax benefits and certain tax deficiencies in additional paid-in capital (“APIC”). Instead, they will record all excess tax benefits and tax deficiencies as income tax expense or benefit in the income statement, and APIC pools will be eliminated. The guidance also eliminates the requirement that excess tax benefits be realized before companies can recognize them. In addition, the guidance requires companies to present excess tax benefits as an operating activity on the statement of cash flows rather than as a financing activity; (2) increase the amount an employer can withhold to cover income taxes on awards and still qualify for the exception to liability classification for shares used to satisfy the employer’s statutory income tax withholding obligation. The new guidance will also require an employer to classify the cash paid to a tax authority when shares are withheld to satisfy its statutory income tax withholding obligation as a financing activity on its statement of cash flows (current guidance did not specify how these cash flows should be classified); and (3) permit companies to make an accounting policy election for the impact of forfeitures on the recognition of expense for share-based payment awards. Forfeitures can be estimated, as required today, or recognized when they occur. ASU No. 2016-09 became effective for fiscal years beginning after December 15, 2016, and was not material to the consolidated financial statements.
HAMILTON BANCORP, INC AND SUBSIDIARY
Notes to Consolidated Financial Statements (Continued)
ASU 2016-02,Leases (Topic 842).This ASU guidance requires lessees to recognize lease assets and lease liabilities related to certain operating leases on the balance sheet by lessees and disclose key information about leasing arrangements. This guidance is effective for fiscal years beginning after December 15, 2018 and interim periods within those fiscal years. The Company is currently evaluating this guidance to determine the impact on its consolidated financial statements.
ASU No. 2016-01,Financial Instruments – Recognition and Measurement of Financial Assets and Liabilities.This ASU requires equity investments to be measured at fair value with changes in fair value recognized in net income, excluding equity investments that are consolidated or accounted for under the equity method of accounting. The amendment allows equity investments without readily determinable fair values to be measured at cost minus impairment, with a qualitative assessment required to identify impairment. The amendment also requires public companies to use exit prices to measure the fair value of financial instruments purposes; requiring separate presentation of financial assets and financial liabilities by measurement category and form of financial asset on the balance sheet or the accompanying notes to the financial statement; it eliminates the disclosure requirements related to measurement assumptions for the fair value of instruments measured at amortized cost. In addition, for liabilities measured at fair value under the fair value option, to present in other comprehensive income changes in fair value due to changes in instrument specific credit risk. ASU No. 2016-01 is effective for fiscal years beginning after December 15, 2017 and interim periods within those fiscal years. The Company is currently evaluating the impact of adopting the new guidance on its consolidated financial statements.
ASU No. 2015-16,Business Combinations (Topic 805): Simplifying the Accounting for Measurement-Period
Adjustments.This update eliminates the requirement to retrospectively adjust the provisional amounts recognized at the acquisition date with a corresponding adjustment to goodwill. These adjustments are required when new information is obtained about facts and circumstances that existed as of the acquisition date that if known, would have affected the measurement of the amounts initially recognized or would have resulted in the recognition of additional assets or liabilities. The update also requires the nature of and reason for the business combination, to be disclosed in the consolidated financial statements. ASU 2015-16 became effective for fiscal years beginning after December 15, 2015, and was not material to the consolidated financial statements. All measurement period adjustments related to the acquisition of Fairmount and Fraternity were recorded in the period in which the adjustments were determined.
ASU 2014-09, Revenue from Contracts with Customers (Topic 606). ASU 2014-09 implements a common revenue standard that clarifies the principles for recognizing revenue. The core principle of ASU 2014-09 is that an entity should recognize revenue to depict the transfer of promised goods or services to customers in an amount that reflects the consideration to which the entity expects to be entitled in exchange for those goods or services. To achieve that core principle, an entity should apply the following steps: (i) identify the contract(s) with a customer, (ii) identify the performance obligations in the contract, (iii) determine the transaction price, (iv) allocate the transaction price to the performance obligations in the contract and (v) recognize revenue when (or as) the entity satisfies a performance obligation. The guidance in this update is effective for annual reporting periods beginning after December 15, 2017, including interim periods within that reporting period. Early adoption is permitted, but not before the original effective date of December 15, 2016. The Company is evaluating the guidance in this update but does not believe it will have a material impact on its consolidated financial statements.
Note 3: Acquisitions
Fraternity Community Bancorp, Inc.
On May 13, 2016, Hamilton Bancorp acquired Fraternity Community Bancorp, Inc. (“Fraternity”), the parent company of Fraternity Federal Savings and Loan. Under the terms of the Merger Agreement, shareholders of Fraternity received a cash payment equal to nineteen dollars and twenty-five cents ($19.25) for each share of Fraternity common stock. The total merger consideration was $25.7 million.
HAMILTON BANCORP, INC AND SUBSIDIARY
Notes to Consolidated Financial Statements (Continued)
In connection with the acquisition, Fraternity Federal Savings and Loan was merged with and into Hamilton Bank, with Hamilton Bank as the surviving bank. The results of the Fraternity acquisition are included with Hamilton’s results as of and from May 13, 2016.
As required by the acquisition method of accounting, we have adjusted the acquired assets and liabilities of Fraternity to their estimated fair value on the date of acquisition and added them to those of Hamilton Bancorp. Based on management’s preliminary valuation of the fair value of tangible and intangible assets acquired and liabilities assumed, which we have based on level 3 valuation estimates and assumptions that are subject to change, we have allocated the purchase price for Fraternity as follows:
| | | As recorded by | | | | | | | | | | |
| | | Fraternity Community | | | Fair Value | | | | As recorded by | |
| | | Bancorp, Inc. | | | Adjustments | | | | Hamilton Bancorp, Inc. | |
Identifiable assets: | | | | | | | | | | | | | |
Cash and cash equivalents | | $ | 15,196,058 | | | $ | - | | | | $ | 15,196,058 | |
Investment securities available for sale | | | 17,570,712 | | | | - | | | | | 17,570,712 | |
FHLB Bank Stock | | | 782,600 | | | | - | | | | | 782,600 | |
Loans | | | 108,872,041 | | | | (67,858 | ) | A | | | 108,804,183 | |
Allowance For Loan Loss | | | (1,550,000 | ) | | | 1,550,000 | | A | | | - | |
Premises and equipment | | | 691,095 | | | | 78,711 | | B | | | 769,806 | |
Bank-Owned Life Insurance | | | 5,058,041 | | | | - | | | | | 5,058,041 | |
Deferred income taxes | | | 2,743,481 | | | | (410,377 | ) | C | | | 2,333,104 | |
Other assets | | | 2,877,665 | | | | - | | | | | 2,877,665 | |
Total identifiable assets | | $ | 152,241,693 | | | $ | 1,150,476 | | | | $ | 153,392,169 | |
| | | | | | | | | | | | | | |
Identifiable liabilities: | | | | | | | | | | | | | |
Non-interest bearing deposits | | | 1,242,187 | | | | - | | | | | 1,242,187 | |
Interest bearing deposits | | | 107,648,792 | | | | 1,098,131 | | D | | | 108,746,923 | |
Borrowings | | | 15,000,000 | | | | 793,537 | | E | | | 15,793,537 | |
Other liabilities | | | 4,023,914 | | | | - | | | | | 4,023,914 | |
Total identifiable liabilities | | $ | 127,914,893 | | | $ | 1,891,668 | | | | $ | 129,806,561 | |
| | | | | | | | | | | | | | |
Net tangible assets acquired | | | 24,326,800 | | | | (741,192 | ) | | | | 23,585,608 | |
| | | | | | | | | | | | | | |
Definite lived intangible assets acquired | | | - | | | | 242,020 | | | | | 242,020 | |
Goodwill | | | - | | | | 1,877,243 | | | | | 1,877,243 | |
Net intangible assets acquired | | | - | | | | 2,119,263 | | | | | 2,119,263 | |
| | | | | | | | | | | | | | |
Total cash consideration | | $ | 24,326,800 | | | $ | 1,378,071 | | | | $ | 25,704,871 | |
Explanation of fair value adjustments:
| A | - | Adjustment reflects the fair value adjustments based on Hamilton Bancorp’s evaluation of the acquired loan portfolio andexcludes the allowance for losses recorded by Fraternity Community Bancorp, Inc. |
| B | - | Adjustment reflects the fair value adjustments based on Hamilton Bancorp’s evaluation of the acquired premises andequipment. |
| C | - | Adjustment to record deferred tax asset related to fair value adjustments at 39.45% income tax rate. |
| | D | - | Adjustment arises since the rates on interest-bearing deposits are higher than rates available on similar deposits as of the acquisition date. |
| | E | - | Adjustment reflects the fair value of Fraternity’s borrowings acquired on acquisition date. |
HAMILTON BANCORP, INC AND SUBSIDIARY
Notes to Consolidated Financial Statements (Continued)
Prior to the end of the measurement period, if information becomes available which indicates the purchase price allocations require adjustments, we will include such adjustments in the purchase price allocation retrospectively.
Of the total estimated purchase price, we have allocated $23.6 million to net tangible assets acquired and we have allocated $242,020 to the core deposit intangible which is a definite lived intangible asset. We have allocated the remaining purchase price to goodwill, which is deductible for income tax purposes. We will amortize the core deposit intangible on a straight-line basis over its estimated useful life of eight years. We will evaluate goodwill annually for impairment.
Pro forma Condensed Combined Financial Information. The following schedule includes consolidated statements of operations data for the unaudited pro forma results for the periods ended March 31, 2017 and 2016 as if the Fraternity acquisition had occurred as of the beginning of the periods presented.
| | | Twelve Months Ended March 31, | |
| | | 2017 | | | 2016 | |
Net interest income | | $ | 14,484,677 | | | $ | 14,385,630 | |
Other non-interest revenue | | | 1,076,971 | | | | 1,733,401 | |
Total revenue | | | 15,561,648 | | | | 16,119,031 | |
Provision expense | | | 3,395,006 | | | | 440,000 | |
Other non-interest expense | | | 12,378,437 | | | | 14,584,149 | |
(Loss) income before income taxes | | | (211,795 | ) | | | 1,094,882 | |
Income tax (benefit) expense | | | (239,925 | ) | | | 717,693 | |
Net income | | $ | 28,130 | | | $ | 377,189 | |
| | | | | | | | | |
Basic earnings per share | | $ | 0.01 | | | $ | 0.12 | |
Diluted earnings per share | | $ | 0.01 | | | $ | 0.12 | |
We have not included any provision for loan losses during the period for loans acquired from Fraternity. In accordance with accounting for business combinations, we included the credit losses evident in the loans in the determination of the fair value of loans at the date of acquisition and eliminated the allowance for loan losses maintained by Fraternity at acquisition date. Also excluded are an estimated $3.0 million in merger related expenses associated with completing the actual acquisition. This expense includes expenses incurred by both the buyer and the seller. For the twelve months ending March 31, 2016, acquisition costs of $510,000 associated with the acquisition of Fairmount are included in non-interest expense. For the twelve months ending March 31, 2017 there were no acquisition costs attributable to Fairmount because that acquisition had been completed at that time. The acquisition expenses are non-deductible and the reasoning for income tax expense being higher for fiscal 2016 relative to pre-tax income.
The revenue and expenses had Fraternity continued to exist as its own company from the acquisition date through March 31, 2017, is not disclosed because we felt this was not practical to do. The estimates in determining these amounts would not be based upon strong, identifiable information and difficult to extrapolate, as such we have elected not to disclose this information.
We have presented the pro forma financial information for illustrative purposes only and it is not necessarily indicative of the financial results of the combined companies had we actually completed the acquisition at the beginning of the periods presented, nor does it indicate future results for any other interim or full year period. Pro forma basic and diluted earnings per common share were calculated using Hamilton Bancorp’s actual weighted average shares outstanding for the periods presented, assuming the acquisition occurred at the beginning of the periods presented.
HAMILTON BANCORP, INC AND SUBSIDIARY
Notes to Consolidated Financial Statements (Continued)
The following table outlines the contractually required payments receivable, cash flows we expect to receive, non-accretable credit adjustments and the accretable yield for all Fraternity loans as of the acquisition date.
| | | Contractually | | | | | | | | | | | | | | | | | |
| | | Required | | | Non-Accretable | | | Cash Flows | | | | | | | Carrying Value | |
| | | Payments | | | Credit | | | Expected To Be | | | Accretable FMV | | | of Loans | |
| | | Receivable | | | Adjustments | | | Collected | | | Adjustments | | | Receivable | |
| | | | | | | | | | | | | | | | | | | | | |
Performing loans acquired | | $ | 107,474,993 | | | $ | - | | | $ | 107,474,993 | | | $ | 301,672 | | | $ | 107,776,665 | |
| | | | | | | | | | | | | | | | | | | | | |
Impaired loans acquired | | | 1,397,048 | | | | (314,484 | ) | | | 1,082,564 | | | | (55,046 | ) | | | 1,027,518 | |
| | | | | | | | | | | | | | | | | | | | | |
Total | | $ | 108,872,041 | | | $ | (314,484 | ) | | $ | 108,557,557 | | | $ | 246,626 | | | $ | 108,804,183 | |
At our acquisition of Fraternity, we recorded all loans acquired at the estimated fair value on the purchase date with no carryover of the related allowance for loan losses. On the acquisition date, we segregated the loan portfolio into two loan pools, performing and nonperforming loans, to be retained in our portfolio.
We had an independent third party determine the fair value of cash flows on $107,474,993 of performing loans. The valuation took into consideration the loans' underlying characteristics, including account types, remaining terms, annual interest rates, interest types, past delinquencies, timing of principal and interest payments, current market rates, loan to value ratios, loss exposures, and remaining balances. These performing loans were segregated into pools based on loan and payment type and in some cases, risk grade. The effect of this fair valuation process was a net accretable premium adjustment of $301,672 at acquisition.
We also individually evaluated 23 impaired loans totaling $1,397,048 to determine the fair value as of the May 13, 2016 measurement date. In determining the fair value for each individually evaluated impaired loan, we considered a number of factors including the remaining life of the acquired loans, estimated prepayments, estimated loss ratios, estimated value of the underlying collateral and net present value of cash flows we expect to receive, among others.
We established a credit risk related non-accretable difference of $314,484 relating to these acquired, credit impaired loans, reflected in the recorded net fair value. We further estimated the timing and amount of expected cash flows in excess of the estimated fair value and established an accretable discount adjustment of $55,046 at acquisition relating to these impaired loans.
Fairmount Bancorp, Inc.
On September 11, 2015, Hamilton Bancorp acquired Fairmount Bancorp, Inc. (“Fairmount”), the parent company of Fairmount Bank. Under the terms of the Merger Agreement, shareholders of Fairmount received a cash payment equal to thirty dollars ($30.00) for each share of Fairmount common stock. The total merger consideration was $14.2 million.
In connection with the acquisition, Fairmount Bank was merged with and into Hamilton Bank, with Hamilton Bank as the surviving bank. The results of the Fairmount acquisition are included with Hamilton’s results as of and from September 11, 2015.
HAMILTON BANCORP, INC AND SUBSIDIARY
Notes to Consolidated Financial Statements (Continued)
As required by the acquisition method of accounting, we have adjusted the acquired assets and liabilities of Fairmount to their estimated fair value on the date of acquisition and added them to those of Hamilton Bancorp. Based on management’s preliminary valuation of the fair value of tangible and intangible assets acquired and liabilities assumed, which we have based on level 3 valuation estimates and assumptions that are subject to change, we have allocated the preliminary purchase price for Fairmount as follows:
| | | As recorded by | | | Fair Value | | | | As recorded by | |
| | | Fairmount Bancorp, Inc. | | | Adjustments | | | | Hamilton Bancorp, Inc. | |
Identifiable assets: | | | | | | | | | | | | | |
Cash and cash equivalents | | $ | 1,468,499 | | | $ | - | | | | $ | 1,468,499 | |
Certificates of deposit | | | 4,467,825 | | | | 27,772 | | A | | | 4,495,597 | |
Investment securities available for sale | | | 9,729,405 | | | | - | | | | | 9,729,405 | |
Loans | | | 55,454,414 | | | | (1,876,502 | ) | B | | | 53,577,912 | |
Allowance For Loan Loss | | | (591,070 | ) | | | 591,070 | | B | | | - | |
Premises and equipment | | | 2,975,587 | | | | (726,997 | ) | C | | | 2,248,590 | |
Core Deposit Intangible | | | 22,802 | | | | (22,802 | ) | D | | | - | |
Deferred income taxes | | | 965,256 | | | | 596,675 | | E | | | 1,561,931 | |
Other assets | | | 1,031,755 | | | | - | | | | | 1,031,755 | |
Total identifiable assets | | $ | 75,524,473 | | | $ | (1,410,784 | ) | | | $ | 74,113,689 | |
| | | | | | | | | | | | | | |
Identifiable liabilities: | | | | | | | | | | | | | |
Non-interest bearing deposits | | | 909,669 | | | | - | | | | | 909,669 | |
Interest bearing deposits | | | 52,123,868 | | | | 433,429 | | F | | | 52,557,297 | |
Borrowings | | | 10,500,000 | | | | 389,147 | | G | | | 10,889,147 | |
Other liabilities | | | 120,351 | | | | - | | | | | 120,351 | |
Total identifiable liabilities | | $ | 63,653,888 | | | $ | 822,576 | | | | $ | 64,476,464 | |
| | | | | | | | | | | | | | |
Net tangible assets acquired | | | 11,870,585 | | | | (2,233,360 | ) | | | | 9,637,225 | |
| | | | | | | | | | | | | | |
Definite lived intangible assets acquired | | | - | | | | 542,540 | | | | | 542,540 | |
Goodwill | | | - | | | | 4,012,605 | | | | | 4,012,605 | |
Net intangible assets acquired | | | - | | | | 4,555,145 | | | | | 4,555,145 | |
| | | | | | | | | | | | | | |
Total cash consideration | | $ | 11,870,585 | | | $ | 2,321,785 | | | | $ | 14,192,370 | |
Explanation of fair value adjustments:
| A | - | Adjustment reflects marking the certificates of deposit portfolio to fair value as of the acquisition date. |
| B | - | Adjustment reflects the fair value adjustments based on Hamilton Bancorp’s evaluation of the acquired loan portfolio andexcludes the allowance for losses recorded by Fairmount Bancorp, Inc. |
| C | - | Adjustment reflects the fair value adjustments based on Hamilton Bancorp’s evaluation of the acquired premises andequipment. |
| | D | - | Adjustment reflects the elimination of core deposit intangible recorded by Fairmount Bancorp, Inc. from a prior acquisition. |
| | E | - | Adjustment to record deferred tax asset related to fair value adjustments at 39.45% income tax rate. |
| | F | - | Adjustment arises since the rates on interest-bearing deposits are higher than rates available on similar deposits as of the acquisition date. |
| | G | - | Adjustment reflects the fair value of Fairmount’s borrowings acquired on acquisition date. |
Prior to the end of the September 11, 2016 measurement period, if information became available which indicated the purchase price allocations require adjustments, we included such adjustments in the purchase price allocation retrospectively. During this measurement period, we made a net adjustment of $215,000 in the purchase price allocations. These adjustments included items relating to the valuation of loans, property and equipment, payables and deferred taxes.
Of the total estimated purchase price, we have allocated an estimate of $9.6 million to net tangible assets acquired and we have allocated approximately $543,000 to the core deposit intangible which is a definite lived intangible asset. We have allocated the remaining purchase price to goodwill, which is deductible for income tax purposes. We will amortize the core deposit intangible on a straight-line basis over its estimated useful life of eight years. We will evaluate goodwill annually for impairment.
HAMILTON BANCORP, INC AND SUBSIDIARY
Notes to Consolidated Financial Statements (Continued)
Pro forma Condensed Combined Financial Information. The following schedule includes consolidated statements of operations data for the unaudited pro forma results for the periods ended March 31, 2017 and 2016 as if the Fairmount acquisition had occurred as of the beginning of the periods presented.
| | | Twelve Months Ended March 31, | |
| | | 2017 | | | 2016 | |
Net interest income | | $ | 13,890,500 | | | $ | 10,948,521 | |
Other non-interest revenue | | | 1,054,547 | | | | 1,657,715 | |
Total revenue | | | 14,945,047 | | | | 12,606,236 | |
Provision expense | | | 3,395,006 | | | | 440,000 | |
Other non-interest expense | | | 13,236,828 | | | | 10,462,955 | |
(Loss) income before income taxes | | | (1,686,787 | ) | | | 1,703,281 | |
Income tax (benefit) expense | | | (758,005 | ) | | | 840,532 | |
Net (loss) income | | $ | (928,782 | ) | | $ | 862,749 | |
| | | | | | | | | |
Basic (loss) earnings per share | | $ | (0.29 | ) | | $ | 0.27 | |
Diluted (loss) earnings per share | | $ | (0.29 | ) | | $ | 0.27 | |
The pro forma condensed financial information in the table above for the periods ended March 31, 2017, includes the revenue and expenses associated with the acquisition of Fraternity Community Bancorp, Inc. on May 13, 2016 through the end of the period, including $1.1 million in acquisition related and branch consolidation expenses.
We have not included any provision for loan losses during the period for loans acquired from Fairmount. In accordance with accounting for business combinations, we included the credit losses evident in the loans in the determination of the fair value of loans at the date of acquisition and eliminated the allowance for loan losses maintained by Fairmount at acquisition date. Also excluded are an estimated $1.3 million in merger related expenses associated with completing the actual acquisition. This expense includes expenses incurred by both the buyer and the seller.
We have presented the pro forma financial information for illustrative purposes only and it is not necessarily indicative of the financial results of the combined companies had we actually completed the acquisition at the beginning of the periods presented, nor does it indicate future results for any other interim or full year period. Pro forma basic and diluted earnings per common share were calculated using Hamilton Bancorp’s actual weighted average shares outstanding for the periods presented, assuming the acquisition occurred at the beginning of the periods presented.
Fraternity and Fairmount acquisition expenses.In connection with the acquisition of Fraternity and Fairmount, the Company incurred merger related costs. These expenses were primarily related to legal, other professional services and system conversions. The following table details the expenses included in the consolidated statements of operations for the periods shown.
| | | Fiscal Year Ending March 31, | |
| | | 2017 | | | 2016 | |
Legal | | $ | 55,500 | | | $ | 502,326 | |
Professional services | | | 157,567 | | | | 316,959 | |
Data processing | | | - | | | | 48,745 | |
Advertising | | | - | | | | 4,885 | |
Other | | | 6,350 | | | | 26,691 | |
Total meger related expenses | | $ | 219,417 | | | $ | 899,606 | |
HAMILTON BANCORP, INC AND SUBSIDIARY
Notes to Consolidated Financial Statements (Continued)
In addition, included in other professional service expense in the Statement of Operations for the period ended March 31, 2017 is $532,000 relating to non-compete agreements and $80,000 in consulting expense that has been paid to former executives in the acquisitions. The non-compete agreements are for a term of one and two years for various former executives, while the consulting contract was for a six-month period that ended November 2016.
Note4: Earnings per Share
Basic earnings per share is computed by dividing net income available to common shareholders by the weighted average number of common shares outstanding for the period. Weighted average shares exclude unallocated ESOP shares. Diluted earnings per share reflects the potential dilution that could occur if securities or other contracts to issue common stock were exercised or converted into common stock or resulted in the issuance of common stock that then shared in the earnings of the entity.
Both the basic and diluted earnings per share for the years ended March 31, 2017 and 2016 are summarized below:
| | | Year Ended | | | Year Ended | |
| | | March 31, 2017 | | | March 31, 2016 | |
| | | | | | | | | |
Net loss | | $ | (928,782 | ) | | $ | (92,616 | ) |
Weighted average common shares outstanding - basic | | | 3,180,292 | | | | 3,169,181 | |
Weighted average common shares outstanding - diluted | | | N/A | | | | N/A | |
Loss per common share - basic and diluted | | $ | (0.29 | ) | | $ | (0.03 | ) |
| | | | | | | | | |
Anti-dilutive shares | | | 118,911 | | | | 91,425 | |
During the years ended March 31, 2017 and 2016, none of the common stock equivalents were dilutive due to the loss reported for each period.
Note 5: Cash and Due From Banks
Regulation D of the Federal Reserve Act requires that banks maintain reserve balances with the Federal Reserve Bank based principally on the type and amount of their deposits. During fiscal years 2017 and 2016, the Company maintained balances at the Federal Reserve (in addition to vault cash) to meet the reserve requirements, as well as balances to partially compensate for services. Additionally, the Company maintained balances with the Federal Home Loan Bank and other domestic correspondent financial institutions as partial compensation for services they provided to the Company. The Bank normally carries balances with other correspondent financial institutions that exceed the federally insured limit.
Note 6: Investment Securities Available for Sale
The amortized cost and fair value of securities at March 31, 2017 and 2016, is summarized as follows:
| | | | | | | Gross | | | Gross | | | | | |
| | | Amortized | | | unrealized | | | unrealized | | | Fair | |
March 31, 2017 | | cost | | | gains | | | losses | | | value | |
| | | | | | | | | | | | | | | | | |
U.S. government agencies | | $ | 3,525,373 | | | $ | 323 | | | $ | 13,393 | | | $ | 3,512,303 | |
Municipal bonds | | | 17,096,477 | | | | 21,858 | | | | 950,496 | | | | 16,167,839 | |
Corporate bonds | | | 2,000,000 | | | | - | | | | 83,478 | | | | 1,916,522 | |
Mortgage-backed securities | | | 81,994,305 | | | | 65,094 | | | | 1,226,935 | | | | 80,832,464 | |
| | | $ | 104,616,155 | | | $ | 87,275 | | | $ | 2,274,302 | | | $ | 102,429,128 | |
HAMILTON BANCORP, INC AND SUBSIDIARY
Notes to Consolidated Financial Statements (Continued)
| | | | | | | Gross | | | Gross | | | | | |
| | | Amortized | | | unrealized | | | unrealized | | | Fair | |
March 31, 2016 | | cost | | | gains | | | losses | | | value | |
| | | | | | | | | | | | | | | | | |
U.S. government agencies | | $ | 10,519,126 | | | $ | 20,622 | | | $ | 6,752 | | | $ | 10,532,996 | |
Municipal bonds | | | 4,061,599 | | | | 51,105 | | | | 140 | | | | 4,112,564 | |
Corporate bonds | | | 2,000,000 | | | | - | | | | 101,360 | | | | 1,898,640 | |
Mortgage-backed securities | | | 53,939,706 | | | | 300,731 | | | | 300,237 | | | | 53,940,200 | |
| | | $ | 70,520,431 | | | $ | 372,458 | | | $ | 408,489 | | | $ | 70,484,400 | |
Proceeds from sales of investment securities were $4,273,234 and $19,228,336 during the years ended March 31, 2017 and 2016, respectively, with gains of $35,441 and losses of $9,995 for the year ended March 31, 2017 and gains of $325,259 and losses of $53,700 for the year ended March 31, 2016. During fiscal 2017, we also sold certificates of deposits that were held as investments. Proceeds associated with those certificates of deposits were $2,228,273 with losses of $1,726.
As of March 31, 2017 and 2016, all mortgage-backed securities are backed by U.S. Government- Sponsored Enterprises (GSE), except one private label mortgage-backed security that was acquired in the Fraternity acquisition in May 2016 with a book value of $94,390 and fair value of $94,381 as of March 31, 2017.
As of March 31, 2017 and 2016, the Company had pledged one security to the Federal Reserve Bank with a book value of $744,186 and $2,000,000 and a fair value of $736,412 and $1,993,226, respectively.
The amortized cost and estimated fair value of debt securities by contractual maturity at March 31, 2017 and 2016 follow. Actual maturities may differ from contractual maturities because borrowers may have the right to call or prepay obligations.
| | | Available for Sale | |
| | | March 31, 2017 | | | March 31, 2016 | |
| | | Amortized | | | Fair | | | Amortized | | | Fair | |
| | | cost | | | value | | | cost | | | value | |
| | | | | | | | | | | | | | | | | |
Maturing | | | | | | | | | | | | | | | | |
Within one year | | $ | - | | | $ | - | | | $ | 731,217 | | | $ | 731,060 | |
Over one to five years | | | 4,234,642 | | | | 4,240,740 | | | | 3,268,217 | | | | 3,287,589 | |
Over five to ten years | | | 5,538,313 | | | | 5,404,810 | | | | 9,830,135 | | | | 9,751,610 | |
Over ten years | | | 12,848,895 | | | | 11,951,114 | | | | 2,751,156 | | | | 2,773,941 | |
Mortgage-backed, in monthlyinstallments | | | 81,994,305 | | | | 80,832,464 | | | | 53,939,706 | | | | 53,940,200 | |
| | | $ | 104,616,155 | | | $ | 102,429,128 | | | $ | 70,520,431 | | | $ | 70,484,400 | |
HAMILTON BANCORP, INC AND SUBSIDIARY
Notes to Consolidated Financial Statements (Continued)
The following table presents the Company's investments' gross unrealized losses and the corresponding fair values by investment category and length of time that the securities have been in a continuous unrealized loss position at March 31, 2017 and 2016.
| | | Less than 12 months | | | 12 months or longer | | | Total | |
| | | Gross unrealized | | | Fair | | | Gross unrealized | | | Fair | | | Gross unrealized | | | Fair | |
March 31, 2017 | | losses | | | value | | | losses | | | value | | | losses | | | value | |
| | | | | | | | | | | | | | | | | | | | | | | | | |
U.S. government agencies | | $ | 13,393 | | | $ | 3,256,964 | | | $ | - | | | $ | - | | | $ | 13,393 | | | $ | 3,256,964 | |
Municipal bonds | | | 950,496 | | | | 13,982,251 | | | | - | | | | - | | | | 950,496 | | | | 13,982,251 | |
Corporate bonds | | | - | | | | - | | | | 83,478 | | | | 1,916,522 | | | | 83,478 | | | | 1,916,522 | |
Mortgage-backed securities | | | 941,183 | | | | 66,953,532 | | | | 285,752 | | | | 7,016,746 | | | | 1,226,935 | | | | 73,970,278 | |
| | | $ | 1,905,072 | | | $ | 84,192,747 | | | $ | 369,230 | | | $ | 8,933,268 | | | $ | 2,274,302 | | | $ | 93,126,015 | |
| | | Less than 12 months | | | 12 months or longer | | | Total | |
| | | Gross unrealized | | | Fair | | | Gross unrealized | | | Fair | | | Gross unrealized | | | Fair | |
March 31, 2016 | | losses | | | value | | | losses | | | value | | | losses | | | value | |
| | | | | | | | | | | | | | | | | | | | | | | | | |
U.S. government agencies | | $ | 6,752 | | | $ | 2,244,157 | | | $ | - | | | $ | - | | | $ | 6,752 | | | $ | 2,244,157 | |
Municipal bonds | | | 140 | | | | 480,168 | | | | - | | | | - | | | | 140 | | | | 480,168 | |
Corporate bonds | | | - | | | | - | | | | 101,360 | | | | 1,898,640 | | | | 101,360 | | | | 1,898,640 | |
Mortgage-backed securities | | | 33,080 | | | | 4,367,962 | | | | 267,157 | | | | 20,274,037 | | | | 300,237 | | | | 24,641,999 | |
| | | $ | 39,972 | | | $ | 7,092,287 | | | $ | 368,517 | | | $ | 22,172,677 | | | $ | 408,489 | | | $ | 29,264,964 | |
The unrealized losses that exist are a result of market changes in interest rates since the original purchase. Management systematically evaluates investment securities for other-than-temporary declines in fair value on an annual basis from the date of purchase if the respective security is in a loss position. This analysis requires management to consider various factors, which include (1) duration and magnitude of the decline in value, (2) the financial condition of the issuer or issuers and (3) structure of the security.
An impairment loss is recognized in earnings if any of the following are true: (1) the Company intends to sell the debt security; (2) it is more likely than not that the Company will be required to sell the security before recovery of its amortized cost basis; or (3) the Company does not expect to recover the entire amortized cost basis of the security. In situations where the Company intends to sell or when it is more likely than not that the Company will be required to sell the security, the entire impairment loss must be recognized in earnings. In all other situations, only the portion of the impairment loss representing the credit loss must be recognized in earnings, with the remaining portion being recognized in shareholders’ equity as a component of other comprehensive income, net of deferred tax.
HAMILTON BANCORP, INC AND SUBSIDIARY
Notes to Consolidated Financial Statements (Continued)
Note 7: Loans Receivable and Allowance for Loan Losses
Loans receivable, excluding no loans held for sale at March 31, 2017 and $254,000 at March 31, 2016, consist of the following:
| | | March 31, 2017 | | | March 31, 2016 | |
| | | Legacy (1) | | | Acquired | | | Total Loans | | | % of Total | | | Legacy (1) | | | Acquired | | | Total Loans | | | % of Total | |
Real estate loans: | | | | | | | | | | | | | | | | | | | | | | | | | | | | | | | | |
One-to four-family: | | | | | | | | | | | | | | | | | | | | | | | | | | | | | | | | |
Residential (2) | | $ | 67,126,677 | | | $ | 83,892,389 | | | $ | 151,019,066 | | | | 44 | % | | $ | 46,263,709 | | | $ | 23,036,569 | | | $ | 69,300,278 | | | | 31 | % |
Residential construction | | | 6,426,076 | | | | - | | | | 6,426,076 | | | | 2 | % | | | 4,304,189 | | | | 965,440 | | | | 5,269,629 | | | | 2 | % |
Investor (3) | | | 6,742,469 | | | | 18,779,644 | | | | 25,522,113 | | | | 8 | % | | | 12,076,911 | | | | 15,783,008 | | | | 27,859,919 | | | | 13 | % |
Commercial | | | 92,665,689 | | | | 14,898,523 | | | | 107,564,212 | | | | 32 | % | | | 75,225,984 | | | | 2,889,219 | | | | 78,115,203 | | | | 35 | % |
Commercial construction | | | 1,881,541 | | | | 1,308,652 | | | | 3,190,193 | | | | 1 | % | | | 1,982,571 | | | | 1,274,148 | | | | 3,256,719 | | | | 2 | % |
Total real estate loans | | | 174,842,452 | | | | 118,879,208 | | | | 293,721,660 | | | | 87 | % | | | 139,853,364 | | | | 43,948,384 | | | | 183,801,748 | | | | 83 | % |
Commercial business | | | 19,518,029 | | | | 2,019,337 | | | | 21,537,366 | | | | 6 | % | | | 17,773,967 | | | | 2,621,625 | | | | 20,395,592 | | | | 9 | % |
Home equity loans | | | 13,278,229 | | | | 7,266,141 | | | | 20,544,370 | | | | 6 | % | | | 12,222,688 | | | | 2,168,073 | | | | 14,390,761 | | | | 6 | % |
Consumer | | | 2,258,836 | | | | 937,600 | | | | 3,196,436 | | | | 1 | % | | | 3,072,677 | | | | 1,106,434 | | | | 4,179,111 | | | | 2 | % |
Total Loans | | | 209,897,546 | | | | 129,102,286 | | | | 338,999,832 | | | | 100 | % | | | 172,922,696 | | | | 49,844,516 | | | | 222,767,212 | | | | 100 | % |
Net deferred loan origination fees and costs | | | (143,070 | ) | | | - | | | | (143,070 | ) | | | | | | | (139,321 | ) | | | - | | | | (139,321 | ) | | | | |
Loan premium (discount) | | | 619,846 | | | | (543,410 | ) | | | 76,436 | | | | | | | | 77,983 | | | | (846,818 | ) | | | (768,835 | ) | | | | |
| | | $ | 210,374,322 | | | $ | 128,558,876 | | | $ | 338,933,198 | | | | | | | $ | 172,861,358 | | | $ | 48,997,698 | | | $ | 221,859,056 | | | | | |
(1) | As a result of the acquisition of Fraternity Community Bancorp, Inc., the parent company of Fraternity Federal Savings and Loan, in May 2016 and Fairmount Bancorp, Inc., the parent company of Fairmount Bank, in September 2015, we have segmented the portfolio into two components, loans originated by Hamilton Bank "Legacy" and loans acquired from Fraternity Community Bancorp, Inc. and Fairmount Bancorp, Inc. "Acquired". |
(2) | "Legacy" one-to four-family residential real estate loans at March 31, 2017 includes $23.4 million of loans purchased in March 2017. |
(3) | "Investor" loans are residential mortgage loans secured by non-owner occupied one-to four-family properties. |
Residential lending is generally considered to involve less risk than other forms of lending, although payment experience on these loans is dependent on economic and market conditions in the Bank's lending area. Construction loan repayments are generally dependent on the related properties or the financial condition of its borrower or guarantor. Accordingly, repayment of such loans can be more susceptible to adverse conditions in the real estate market and the regional economy.
A substantial portion of the Bank's loan portfolio is real estate loans secured by residential and commercial real estate properties located in the Baltimore metropolitan area. Loans are extended only after evaluation of a customer's creditworthiness and other relevant factors on a case-by-case basis. The Bank generally does not lend more than 75% - 95% of the appraised value of a property, depending on the type of loan, and requires private mortgage insurance on residential mortgages with loan-to-value ratios in excess of 80%. In addition, the Bank generally obtains personal guarantees of repayment from borrowers and/or others for construction loans and disburses the proceeds of those and similar loans only as work progresses on the related projects.
Commercial business loans are made to provide funds for equipment and general corporate needs. Repayment of a loan primarily uses the funds obtained from the operation of the borrower’s business. Commercial loans also include lines of credit that are utilized to finance a borrower’s short-term credit needs and/or to finance a percentage of eligible receivables and inventory. The Company’s loan portfolio also includes a small portfolio of equipment leases, which consists of leases for essential commercial equipment used by small to medium sized businesses.
The home equity loans consist of both conforming loans and revolving lines of credit to consumers which are secured by residential real estate. These loans are typically secured with second mortgages on the homes. Consumer loans include share loans, installment loans and, to a lesser extent, personal lines of credit. Share loans represent loans that are collateralized by a certificate of deposit or other deposit product. Installment loans are used by customers to purchase primarily automobiles, but may be used to also purchase boats and recreational vehicles.
HAMILTON BANCORP, INC AND SUBSIDIARY
Notes to Consolidated Financial Statements (Continued)
The following tables detail activity in the allowance for loan losses by portfolio segment for the fiscal years ended March 31, 2017 and 2016. The allowance for loan losses allocated to each portfolio segment is not necessarily indicative of future losses in any particular portfolio segment and does not restrict the use of the allowance to absorb losses in other portfolio segments.
| | | March 31, 2017 | |
| | | Residential RealEstate | | | Investor RealEstate | | | Commercial Real Estate | | | Commercial Construction | | | Commercial Business | | | Home Equity | | | Consumer | | | Total | |
Allowance for credit losses: | | | | | | | | | | | | | | | | | | | | | | | | | | | | | | | | |
Beginning balance | | $ | 259,895 | | | $ | 168,132 | | | $ | 901,768 | | | $ | 42,377 | | | $ | 228,199 | | | $ | 82,012 | | | $ | 19,982 | | | $ | 1,702,365 | |
Charge-offs | | | (34,578 | ) | | | (1,801,438 | ) | | | (1,111,320 | ) | | | - | | | | (1,521 | ) | | | - | | | | (4,073 | ) | | | (2,952,930 | ) |
Recoveries | | | - | | | | 11,599 | | | | - | | | | - | | | | 29,257 | | | | - | | | | 9,518 | | | | 50,374 | |
Provision for credit losses | | | 328,222 | | | | 1,656,982 | | | | 1,585,446 | | | | (33,346 | ) | | | (106,474 | ) | | | (11,941 | ) | | | (23,883 | ) | | | 3,395,006 | |
Ending balance | | $ | 553,539 | | | $ | 35,275 | | | $ | 1,375,894 | | | $ | 9,031 | | | $ | 149,461 | | | $ | 70,071 | | | $ | 1,544 | | | $ | 2,194,815 | |
| | | | | | | | | | | | | | | | | | | | | | | | | | | | | | | | | |
Allowance allocated to: | | | | | | | | | | | | | | | | | | | | | | | | | | | | | | | | |
Legacy Loans: | | | | | | | | | | | | | | | | | | | | | | | | | | | | | | | | |
Individually evaluated for impairment | | $ | 284,177 | | | $ | - | | | $ | - | | | $ | - | | | $ | - | | | $ | - | | | $ | - | | | $ | 284,177 | |
Collectively evaluated for impairment | | | 269,362 | | | | 34,093 | | | | 1,375,894 | | | | 9,031 | | | | 149,461 | | | | 70,071 | | | | 1,544 | | | | 1,909,456 | |
| | | | | | | | | | | | | | | | | | | | | | | | | | | | | | | | | |
Acquired Loans: | | | | | | | | | | | | | | | | | | | | | | | | | | | | | | | | |
Individually evaluated for impairment | | $ | - | | | $ | 1,182 | | | $ | - | | | $ | - | | | $ | - | | | $ | - | | | $ | - | | | $ | 1,182 | |
Collectively evaluated for impairment | | | - | | | | - | | | | - | | | | - | | | | - | | | | - | | | | - | | | | - | |
| | | | | | | | | | | | | | | | | | | | | | | | | | | | | | | | | |
Loans: | | | | | | | | | | | | | | | | | | | | | | | | | | | | | | | | |
Legacy Loans: | | | | | | | | | | | | | | | | | | | | | | | | | | | | | | | | |
Individually evaluated for impairment | | $ | 1,762,417 | | | $ | 16,919 | | | $ | 1,546,812 | | | $ | - | | | $ | 753,375 | | | $ | 12,040 | | | $ | - | | | $ | 4,091,563 | |
Collectively evaluated for impairment | | | 71,790,336 | | | | 6,725,550 | | | | 91,118,877 | | | | 1,881,541 | | | | 18,764,654 | | | | 13,266,189 | | | | 2,258,836 | | | | 205,805,983 | |
Ending balance | | $ | 73,552,753 | | | $ | 6,742,469 | | | $ | 92,665,689 | | | $ | 1,881,541 | | | $ | 19,518,029 | | | $ | 13,278,229 | | | $ | 2,258,836 | | | $ | 209,897,546 | |
| | | | | | | | | | | | | | | | | | | | | | | | | | | | | | | | | |
Acquired Loans: | | | | | | | | | | | | | | | | | | | | | | | | | | | | | | | | |
individually evaluated for impairment | | $ | 1,133,646 | | | $ | 186,888 | | | $ | 204,844 | | | $ | - | | | $ | - | | | $ | - | | | $ | 40,107 | | | $ | 1,565,485 | |
collectively evaluated for impairment | | | 82,758,743 | | | | 18,592,756 | | | | 14,693,679 | | | | 1,308,652 | | | | 2,019,337 | | | | 7,266,141 | | | | 897,493 | | | | 127,536,801 | |
Ending balance | | $ | 83,892,389 | | | $ | 18,779,644 | | | $ | 14,898,523 | | | $ | 1,308,652 | | | $ | 2,019,337 | | | $ | 7,266,141 | | | $ | 937,600 | | | $ | 129,102,286 | |
HAMILTON BANCORP, INC AND SUBSIDIARY
Notes to Consolidated Financial Statements (Continued)
| | | March 31, 2016 | |
| | | Residential Real Estate | | | Investor Real Estate | | | Commercial Real Estate | | | Commercial Construction | | | Commercial Business | | | Home Equity | | | Consumer | | | Total | |
Allowance for credit losses: | | | | | | | | | | | | | | | | | | | | | | | | | | | | | | | | |
Beginning balance | | $ | 319,565 | | | $ | 114,005 | | | $ | 585,817 | | | $ | 67,835 | | | $ | 503,304 | | | $ | 98,983 | | | $ | 727 | | | $ | 1,690,236 | |
Charge-offs | | | (69,500 | ) | | | (222,238 | ) | | | (567,901 | ) | | | - | | | | (10,533 | ) | | | (6,000 | ) | | | (16,337 | ) | | | (892,509 | ) |
Recoveries | | | 848 | | | | 24,835 | | | | - | | | | 236,904 | | | | 192,336 | | | | - | | | | 9,715 | | | | 464,638 | |
Provision for credit losses | | | 8,982 | | | | 251,530 | | | | 883,852 | | | | (262,362 | ) | | | (456,908 | ) | | | (10,971 | ) | | | 25,877 | | | | 440,000 | |
Ending balance | | $ | 259,895 | | | $ | 168,132 | | | $ | 901,768 | | | $ | 42,377 | | | $ | 228,199 | | | $ | 82,012 | | | $ | 19,982 | | | $ | 1,702,365 | |
| | | | | | | | | | | | | | | | | | | | | | | | | | | | | | | | | |
Allowance allocated to: | | | | | | | | | | | | | | | | | | | | | | | | | | | | | | | | |
Legacy Loans: | | | | | | | | | | | | | | | | | | | | | | | | | | | | | | | | |
Individually evaluated for impairment | | $ | 59,571 | | | $ | - | | | $ | - | | | $ | - | | | $ | - | | | $ | - | | | $ | - | | | $ | 59,571 | |
Collectively evaluated for impairment | | | 200,324 | | | | 168,132 | | | | 901,768 | | | | 42,377 | | | | 228,199 | | | | 82,012 | | | | 19,982 | | | | 1,642,794 | |
| | | | | | | | | | | | | | | | | | | | | | | | | | | | | | | | | |
Acquired Loans: | | | | | | | | | | | | | | | | | | | | | | | | | | | | | | | | |
Individually evaluated for impairment | | $ | - | | | $ | - | | | $ | - | | | $ | - | | | $ | - | | | $ | - | | | $ | - | | | $ | - | |
Collectively evaluated for impairment | | | - | | | | - | | | | - | | | | - | | | | - | | | | - | | | | - | | | | - | |
| | | | | | | | | | | | | | | | | | | | | | | | | | | | | | | | | |
Loans: | | | | | | | | | | | | | | | | | | | | | | | | | | | | | | | | |
Legacy Loans: | | | | | | | | | | | | | | | | | | | | | | | | | | | | | | | | |
Individually evaluated for impairment | | $ | 1,891,602 | | | $ | 26,925 | | | $ | 2,717,144 | | | $ | - | | | $ | 1,279,233 | | | $ | 59,169 | | | $ | - | | | $ | 5,974,073 | |
Collectively evaluated for impairment | | | 48,676,296 | | | | 12,049,986 | | | | 72,508,840 | | | | 1,982,571 | | | | 16,494,734 | | | | 12,163,519 | | | | 3,072,677 | | | | 166,948,623 | |
Ending balance | | $ | 50,567,898 | | | $ | 12,076,911 | | | $ | 75,225,984 | | | $ | 1,982,571 | | | $ | 17,773,967 | | | $ | 12,222,688 | | | $ | 3,072,677 | | | $ | 172,922,696 | |
| | | | | | | | | | | | | | | | | | | | | | | | | | | | | | | | | |
Acquired Loans: | | | | | | | | | | | | | | | | | | | | | | | | | | | | | | | | |
individually evaluated for impairment | | $ | 412,934 | | | $ | 797,372 | | | $ | 211,239 | | | $ | - | | | $ | - | | | $ | - | | | $ | 42,488 | | | $ | 1,464,033 | |
collectively evaluated for impairment | | | 23,589,075 | | | | 14,985,636 | | | | 2,677,980 | | | | 1,274,148 | | | | 2,621,625 | | | | 2,168,073 | | | | 1,063,946 | | | | 48,380,483 | |
Ending balance | | $ | 24,002,009 | | | $ | 15,783,008 | | | $ | 2,889,219 | | | $ | 1,274,148 | | | $ | 2,621,625 | | | $ | 2,168,073 | | | $ | 1,106,434 | | | $ | 49,844,516 | |
HAMILTON BANCORP, INC AND SUBSIDIARY
Notes to Consolidated Financial Statements (Continued)
Past due loans, segregated by age and class of loans, as March 31, 2017 and 2016, were as follows:
| | | March 31, 2017 | | | March 31, 2016 | |
| | | Legacy | | | Acquired | | | Total | | | Legacy | | | Acquired | | | Total | |
Current | | $ | 207,328,184 | | | $ | 128,769,860 | | | $ | 336,098,044 | | | $ | 168,814,175 | | | $ | 48,317,673 | | | $ | 217,131,848 | |
Accruing past due loans: | | | | | | | | | | | | | | | | | | | | | | | | |
30-59 days past due: | | | | | | | | | | | | | | | | | | | | | | | | |
Real estate loans: | | | | | | | | | | | | | | | | | | | | | | | | |
Residential | | | 69,618 | | | | - | | | | 69,618 | | | | 468,887 | | | | - | | | | 468,887 | |
Investor | | | 320,971 | | | | - | | | | 320,971 | | | | - | | | | 42,800 | | | | 42,800 | |
Commercial | | | - | | | | - | | | | - | | | | - | | | | - | | | | - | |
Commercial construction | | | 113,603 | | | | - | | | | 113,603 | | | | - | | | | - | | | | - | |
Commercial business | | | - | | | | - | | | | - | | | | - | | | | - | | | | - | |
Home equity loans | | | - | | | | - | | | | - | | | | - | | | | - | | | | - | |
Consumer | | | - | | | | - | | | | - | | | | 20,753 | | | | - | | | | 20,753 | |
Total 30-59 days past due | | | 504,192 | | | | - | | | | 504,192 | | | | 489,640 | | | | 42,800 | | | | 532,440 | |
| | | | | | | | | | | | | | | | | | | | | | | | | |
60-89 days past due: | | | | | | | | | | | | | | | | | | | | | | | | |
Real estate loans: | | | | | | | | | | | | | | | | | | | | | | | | |
Residential | | | 74,631 | | | | - | | | | 74,631 | | | | 52,875 | | | | - | | | | 52,875 | |
Investor | | | - | | | | - | | | | - | | | | - | | | | - | | | | - | |
Commercial | | | - | | | | - | | | | - | | | | - | | | | - | | | | - | |
Commercial construction | | | - | | | | - | | | | - | | | | - | | | | - | | | | - | |
Commercial business | | | - | | | | - | | | | - | | | | - | | | | - | | | | - | |
Home equity loans | | | - | | | | - | | | | - | | | | - | | | | - | | | | - | |
Consumer | | | - | | | | - | | | | - | | | | - | | | | - | | | | - | |
Total 60-89 days past due | | | 74,631 | | | | - | | | | 74,631 | | | | 52,875 | | | | - | | | | 52,875 | |
| | | | | | | | | | | | | | | | | | | | | | | | | |
90 or more days past due: | | | | | | | | | | | | | | | | | | | | | | | | |
Real estate loans: | | | | | | | | | | | | | | | | | | | | | | | | |
Residential | | | - | | | | - | | | | - | | | | - | | | | - | | | | - | |
Investor | | | - | | | | 21,030 | | | | 21,030 | | | | 165,701 | | | | 542,236 | | | | 707,937 | |
Commercial | | | - | | | | - | | | | - | | | | - | | | | - | | | | - | |
Commercial construction | | | - | | | | - | | | | - | | | | - | | | | - | | | | - | |
Commercial business | | | - | | | | - | | | | - | | | | - | | | | - | | | | - | |
Home equity loans | | | - | | | | - | | | | - | | | | - | | | | - | | | | - | |
Consumer | | | - | | | | - | | | | - | | | | - | | | | - | | | | - | |
Total 90 or more days past due | | | - | | | | 21,030 | | | | 21,030 | | | | 165,701 | | | | 542,236 | | | | 707,937 | |
Total accruing past due loans | | | 578,823 | | | | 21,030 | | | | 599,853 | | | | 708,216 | | | | 585,036 | | | | 1,293,252 | |
| | | | | | | | | | | | | | | | | | | | | | | | | |
Non-accruing loans: | | | | | | | | | | | | | | | | | | | | | | | | |
Real estate loans: | | | | | | | | | | | | | | | | | | | | | | | | |
Residential | | | 426,354 | | | | 248,663 | | | | 675,017 | | | | 474,877 | | | | 300,301 | | | | 775,178 | |
Investor | | | 13,976 | | | | 57,131 | | | | 71,107 | | | | 37,062 | | | | 637,971 | | | | 675,033 | |
Commercial | | | 1,546,812 | | | | - | | | | 1,546,812 | | | | 2,717,144 | | | | - | | | | 2,717,144 | |
Commercial construction | | | - | | | | - | | | | - | | | | - | | | | - | | | | - | |
Commercial business | | | - | | | | - | | | | - | | | | 121,760 | | | | - | | | | 121,760 | |
Home equity loans | | | 3,397 | | | | - | | | | 3,397 | | | | 49,462 | | | | - | | | | 49,462 | |
Consumer | | | - | | | | 5,602 | | | | 5,602 | | | | - | | | | 3,535 | | | | 3,535 | |
Non-accruing loans: | | | 1,990,539 | | | | 311,396 | | | | 2,301,935 | | | | 3,400,305 | | | | 941,807 | | | | 4,342,112 | |
Total Loans | | $ | 209,897,546 | | | $ | 129,102,286 | | | $ | 338,999,832 | | | $ | 172,922,696 | | | $ | 49,844,516 | | | $ | 222,767,212 | |
| | | | | | | | | | | | | | | | | | | | | | | | | |
| | | | | | | | | | | | | | | | | | | | | | | | | |
Nonaccrual interest not accrued: | | | | | | | | | | | | | | | | | | | | | | | | |
Real estate loans: | | | | | | | | | | | | | | | | | | | | | | | | |
Residential | | $ | 6,460 | | | $ | 35,177 | | | $ | 41,637 | | | $ | 10,666 | | | $ | 32,572 | | | $ | 43,238 | |
Investor | | | 6,982 | | | | 23,293 | | | | 30,275 | | | | 7,828 | | | | 85,809 | | | | 93,637 | |
Commercial | | | 109,818 | | | | - | | | | 109,818 | | | | 47,646 | | | | - | | | | 47,646 | |
Commercial construction | | | - | | | | - | | | | - | | | | - | | | | - | | | | - | |
Commercial business | | | - | | | | - | | | | - | | | | - | | | | - | | | | - | |
Home equity loans | | | 66 | | | | - | | | | 66 | | | | 1,007 | | | | - | | | | 1,007 | |
Consumer | | | - | | | | 317 | | | | 317 | | | | - | | | | 178 | | | | 178 | |
Total nonaccrual interest not accrued | | $ | 123,326 | | | $ | 58,787 | | | $ | 182,113 | | | $ | 67,147 | | | $ | 118,559 | | | $ | 185,706 | |
HAMILTON BANCORP, INC AND SUBSIDIARY
Notes to Consolidated Financial Statements (Continued)
Impaired Loans as of March 31, 2017 and 2016 were as follows:
| | | Impaired Loans at March 31, 2017 | |
| | | Unpaid | | | | | | | | | | | | | | | | | |
| | | Contractual | | | | | | | | | | | Average | | | Interest | |
| | | Principal | | | Recorded | | | Related | | | Recorded | | | Income | |
Legacy: | | Balance | | | Investment | | | Allowance | | | Investment | | | Recognized | |
With no related allowance recorded: | | | | | | | | | | | | | | | | | | | | |
Real estate loans: | | | | | | | | | | | | | | | | | | | | |
Residential | | $ | 491,249 | | | $ | 360,590 | | | $ | - | | | $ | 373,618 | | | $ | 11,901 | |
Investor | | | 107,710 | | | | 16,919 | | | | | | | | 16,306 | | | | - | |
Commercial | | | 3,433,621 | | | | 1,546,812 | | | | - | | | | 2,485,299 | | | | 987 | |
Commercial construction | | | - | | | | - | | | | - | | | | - | | | | - | |
Commercial business | | | 1,177,632 | | | | 753,375 | | | | - | | | | 832,437 | | | | 107,063 | |
Home equity loans | | | 37,365 | | | | 12,040 | | | | - | | | | 14,102 | | | | 257 | |
Consumer | | | - | | | | - | | | | - | | | | - | | | | - | |
With an allowance recorded: | | | | | | | | | | | | | | | | | | | | |
Real estate loans: | | | | | | | | | | | | | | | | | | | | |
Residential | | | 1,432,212 | | | | 1,401,827 | | | | 284,177 | | | | 1,428,128 | | | | 54,121 | |
Investor | | | - | | | | - | | | | - | | | | - | | | | - | |
Commercial | | | - | | | | - | | | | - | | | | - | | | | - | |
Commercial construction | | | - | | | | - | | | | - | | | | - | | | | - | |
Commercial business | | | - | | | | - | | | | - | | | | - | | | | - | |
Home equity loans | | | - | | | | - | | | | - | | | | - | | | | - | |
Consumer | | | - | | | | - | | | | - | | | | - | | | | - | |
Total legacy impaired | | | 6,679,789 | | | | 4,091,563 | | | | 284,177 | | | | 5,149,890 | | | | 174,329 | |
| | | | | | | | | | | | | | | | | | | | | |
Acquired (1): | | | | | | | | | | | | | | | | | | | | |
With no related allowance recorded: | | | | | | | | | | | | | | | | | | | | |
Real estate loans: | | | | | | | | | | | | | | | | | | | | |
Residential | | | 1,320,985 | | | | 1,133,646 | | | | - | | | | 1,017,399 | | | | 51,442 | |
Investor | | | 503,920 | | | | 148,506 | | | | - | | | | 230,757 | | | | 12,229 | |
Commercial | | | 254,844 | | | | 204,844 | | | | - | | | | 208,057 | | | | 7,770 | |
Commercial construction | | | - | | | | - | | | | - | | | | - | | | | - | |
Commercial business | | | - | | | | - | | | | - | | | | - | | | | - | |
Home equity loans | | | - | | | | - | | | | - | | | | - | | | | - | |
Consumer | | | 88,276 | | | | 40,107 | | | | - | | | | 44,079 | | | | 6,049 | |
With an allowance recorded: | | | | | | | | | | | | | | | | | | | | |
Real estate loans: | | | | | | | | | | | | | | | | �� | | | | |
Residential | | | - | | | | - | | | | - | | | | - | | | | - | |
Investor | | | 66,446 | | | | 38,382 | | | | 1,182 | | | | 34,448 | | | | - | |
Commercial | | | - | | | | - | | | | - | | | | - | | | | - | |
Commercial construction | | | - | | | | - | | | | - | | | | - | | | | - | |
Commercial business | | | - | | | | - | | | | - | | | | - | | | | - | |
Home equity loans | | | - | | | | - | | | | - | | | | - | | | | - | |
Consumer | | | - | | | | - | | | | - | | | | - | | | | - | |
Total acquired impaired | | | 2,234,471 | | | | 1,565,485 | | | | 1,182 | | | | 1,534,740 | | | | 77,490 | |
Total impaired | | $ | 8,914,260 | | | $ | 5,657,048 | | | $ | 285,359 | | | $ | 6,684,630 | | | $ | 251,819 | |
(1) | Generally accepted accounting principles require that we record acquired loans at fair value at acquisition, which includes a discount for loans with credit impairment. These purchased credit impaired loans are not performing according to their contractual terms and meet the definition of an impaired loan. Although we do not accrue interest income at the contractual rate on these loans, we do recognize an accretable yield as interest income to the extent such yield is supported by cash flow analysis of the underlying loans. |
HAMILTON BANCORP, INC AND SUBSIDIARY
Notes to Consolidated Financial Statements (Continued)
| | | Impaired Loans at March 31, 2016 | |
| | | Unpaid | | | | | | | | | | | | | | | | | |
| | | Contractual | | | | | | | | | | | Average | | | Interest | |
| | | Principal | | | Recorded | | | Related | | | Recorded | | | Income | |
Legacy: | | Balance | | | Investment | | | Allowance | | | Investment | | | Recognized | |
With no related allowance recorded: | | | | | | | | | | | | | | | | | | | | |
Real estate loans: | | | | | | | | | | | | | | | | | | | | |
Residential | | $ | 690,915 | | | $ | 599,794 | | | $ | - | | | $ | 544,000 | | | $ | 7,857 | |
Investor | | | 119,822 | | | | 26,925 | | | | - | | | | 14,586 | | | | 2,437 | |
Commercial | | | 3,433,621 | | | | 2,717,144 | | | | - | | | | 3,298,855 | | | | 99,599 | |
Commercial construction | | | - | | | | - | | | | - | | | | - | | | | - | |
Commercial business | | | 1,884,258 | | | | 1,279,233 | | | | - | | | | 1,557,871 | | | | 147,101 | |
Home equity loans | | | 82,740 | | | | 59,169 | | | | - | | | | 18,817 | | | | 331 | |
Consumer | | | - | | | | - | | | | - | | | | - | | | | - | |
With an allowance recorded: | | | | | | | | | | | | | | | | | | | | |
Real estate loans: | | | | | | | | | | | | | | | | | | | | |
Residential | | | 1,306,083 | | | | 1,291,808 | | | | 59,571 | | | | 1,306,414 | | | | 53,204 | |
Investor | | | - | | | | - | | | | - | | | | - | | | | - | |
Commercial | | | - | | | | - | | | | - | | | | - | | | | - | |
Commercial construction | | | - | | | | - | | | | - | | | | - | | | | - | |
Commercial business | | | - | | | | - | | | | - | | | | - | | | | - | |
Home equity loans | | | - | | | | - | | | | - | | | | - | | | | - | |
Consumer | | | - | | | | - | | | | - | | | | - | | | | - | |
Total legacy impaired | | | 7,517,439 | | | | 5,974,073 | | | | 59,571 | | | | 6,740,543 | | | | 310,529 | |
| | | | | | | | | | | | | | | | | | | | | |
Acquired (1): | | | | | | | | | | | | | | | | | | | | |
With no related allowance recorded: | | | | | | | | | | | | | | | | | | | | |
Real estate loans: | | | | | | | | | | | | | | | | | | | | |
Residential | | | 549,388 | | | | 412,934 | | | | - | | | | 360,962 | | | | 15,891 | |
Investor | | | 1,894,614 | | | | 797,372 | | | | - | | | | 1,026,391 | | | | 70,696 | |
Commercial | | | 261,239 | | | | 211,239 | | | | - | | | | 212,806 | | | | 9,978 | |
Commercial construction | | | - | | | | - | | | | - | | | | - | | | | - | |
Commercial business | | | - | | | | - | | | | - | | | | - | | | | - | |
Home equity loans | | | - | | | | - | | | | - | | | | - | | | | - | |
Consumer | | | 72,358 | | | | 42,488 | | | | - | | | | 43,233 | | | | 7,086 | |
With an allowance recorded: | | | | | | | | | | | | | | | | | | | | |
Real estate loans: | | | | | | | | | | | | | | | | | | | | |
Residential | | | - | | | | - | | | | - | | | | - | | | | - | |
Investor | | | - | | | | - | | | | - | | | | - | | | | - | |
Commercial | | | - | | | | - | | | | - | | | | - | | | | - | |
Commercial construction | | | - | | | | - | | | | - | | | | - | | | | - | |
Commercial business | | | - | | | | - | | | | - | | | | - | | | | - | |
Home equity loans | | | - | | | | - | | | | - | | | | - | | | | - | |
Consumer | | | - | | | | - | | | | - | | | | - | | | | - | |
Total acquired impaired | | | 2,777,599 | | | | 1,464,033 | | | | - | | | | 1,643,392 | | | | 103,651 | |
Total impaired | | $ | 10,295,038 | | | $ | 7,438,106 | | | $ | 59,571 | | | $ | 8,383,935 | | | $ | 414,180 | |
(1) | Generally accepted accounting principles require that we record acquired loans at fair value at acquisition, which includes a discount for loans with credit impairment. These purchased credit impaired loans are not performing according to their contractual terms and meet the definition of an impaired loan. Although we do not accrue interest income at the contractual rate on these loans, we do recognize an accretable yield as interest income to the extent such yield is supported by cash flow analysis of the underlying loans. |
HAMILTON BANCORP, INC AND SUBSIDIARY
Notes to Consolidated Financial Statements (Continued)
The following table documents changes in the carrying amount of acquired impaired loans (Purchase Credit Impaired of “PCI”) for the years ended March 31, along with the outstanding balance at the end of the period:
| | | 2017 | | | 2016 | |
| | | | | | | | | |
Recorded investment at beginning of period | | $ | 919,729 | | | $ | - | |
Fair value of loans acquired during the year | | | 1,027,518 | | | | 980,943 | |
Accretion | | | 28,036 | | | | 25,937 | |
Reductions for payments | | | (633,348 | ) | | | (87,151 | ) |
Recorded investment at end of period | | $ | 1,341,935 | | | $ | 919,729 | |
Oustanding principal balance at end of period | | $ | 1,691,004 | | | $ | 1,260,429 | |
A summary of changes in the accretable yield for PCI loans for the years ended March 31, is as follows:
| | | 2017 | | | 2016 | |
| | | | | | | | | |
Accretable yield, beginning of period | | $ | 32,629 | | | $ | - | |
Addition from acquisition | | | 55,046 | | | | 59,142 | |
Accretion | | | (28,036 | ) | | | (25,937 | ) |
Reclassification from nonaccretable difference | | | - | | | | - | |
Other changes, net | | | - | | | | (576 | ) |
Accretable yield, end of period | | $ | 59,639 | | | $ | 32,629 | |
Impaired loans also include certain loans that have been modified in troubled debt restructurings (TDRs) where economic concessions have been granted to borrowers who have experienced or are expected to experience financial difficulties. These concessions typically result from the Bank's loss mitigation activities and could include reductions in the interest rate, payment extensions, forgiveness of principal, forbearance or other actions. Generally, nonaccrual loans that are modified and considered TDRs are classified as nonperforming at the time of restructure and may only be returned to performing status after considering the borrower's sustained repayment performance for a reasonable period, generally six months.
A summary of TDRs at March 31, 2017 and 2016 follows:
| | | Number of | | | | | | | | | | | | | |
March 31, 2017 | | contracts | | | Performing | | | Nonperforming | | | Total | |
Real estate loans: | | | | | | | | | | | | | | | | |
Residential | | | 13 | | | $ | 1,261,603 | | | $ | 294,968 | | | $ | 1,556,571 | |
Investor | | | - | | | | - | | | | - | | | | - | |
Commercial | | | 2 | | | | - | | | | 1,546,812 | | | | 1,546,812 | |
Commercial construction | | | - | | | | - | | | | - | | | | - | |
Commercial business | | | 1 | | | | 643,999 | | | | - | | | | 643,999 | |
Home equity loans | | | - | | | | - | | | | - | | | | - | |
Consumer | | | - | | | | - | | | | - | | | | - | |
| | | | 16 | | | $ | 1,905,602 | | | $ | 1,841,780 | | | $ | 3,747,382 | |
HAMILTON BANCORP, INC AND SUBSIDIARY
Notes to Consolidated Financial Statements (Continued)
| | | Number of | | | | | | | | | | | | | |
March 31, 2016 | | contracts | | | Performing | | | Nonperforming | | | Total | |
Real estate loans: | | | | | | | | | | | | | | | | |
Residential | | | 12 | | | $ | 1,457,552 | | | $ | 101,449 | | | $ | 1,559,001 | |
Investor | | | - | | | | - | | | | - | | | | - | |
Commercial | | | 2 | | | | - | | | | 2,717,144 | | | | 2,717,144 | |
Commercial construction | | | - | | | | - | | | | - | | | | - | |
Commercial business | | | 2 | | | | 647,654 | | | | - | | | | 647,654 | |
Home equity loans | | | - | | | | - | | | | - | | | | - | |
Consumer | | | - | | | | - | | | | - | | | | - | |
| | | | 16 | | | $ | 2,105,206 | | | $ | 2,818,593 | | | $ | 4,923,799 | |
The following table presents the number of contracts and the dollar amount of TDRs that were added during the years ended March 31, 2017 and 2016. The amount shown reflects the outstanding loan balance at the time of the modification.
| | | Loans Modified as a TDR for the fiscal year ended | |
| | | March 31, 2017 | | | March 31, 2016 | |
| | | Number of | | | Outstanding recorded | | | Number of | | | Outstanding recorded | |
Troubled Debt Restructurings | | contracts | | | investment | | | contracts | | | investment | |
| | | | | | | | | | | | | | | | | |
Real estate loans: | | | | | | | | | | | | | | | | |
Residential | | | 3 | | | $ | 97,401 | | | | 7 | | | $ | 147,578 | |
There are no TDRs outstanding that defaulted over the twelve month period ended March 31, 2017 and 2016. Earlier in fiscal 2017, there were 11 newly added TDR loans to one borrower for non-owner occupied residential real estate properties that had subsequently defaulted within twelve months. However, these loans have since been sold as part of a larger pool of loans in October 2016 and are no longer being reflected in the these financial statements. Payment default under a TDR is defined as any TDR that is 90 days or more past due following the time that the loan was modified or the inability of the TDR to make the required payment subsequent to the modification. There are no commitments to extend credit under existing TDRs as of March 31, 2017.
In calculating the allowance for loan losses, individual TDRs are evaluated for impairment. TDRs are evaluated for impairment based upon either the present value of cash flows or, if collateral dependent, the lower of cost or fair value of the underlying collateral. If it is determined that the cash flows or underlying collateral is less than the carrying amount of the loan, the difference in value will be charged-off through earnings, unless the TDR is performing, in which case a specific reserve may be set-up for that TDR.
Credit quality indicators
As part of the ongoing monitoring of the credit quality of the Bank's loan portfolio, management tracks certain credit quality indicators including trends related to the risk grade of loans, the level of classified loans, net charge offs, nonperforming loans, and the general economic conditions in the Bank's market.
HAMILTON BANCORP, INC AND SUBSIDIARY
Notes to Consolidated Financial Statements (Continued)
The Bank utilizes a risk grading matrix to assign a risk grade to each of its loans. A description of the general characteristics of loans characterized as watch list or classified is as follows:
Pass
A pass loan is considered of sufficient quality to preclude a special mention or an adverse rating. Pass assets generally are well protected by the current net worth and paying capacity of the obligor or by the value of the asset or underlying collateral.
Special Mention
A special mention loan has potential weaknesses that deserve management's close attention. If left uncorrected, these potential weaknesses may result in deterioration of the repayment prospects for the loan or in the Bank's credit position at some future date. Special mention loans are not adversely classified and do not expose the Bank to sufficient risk to warrant adverse classification.
Loans that would primarily fall into this notational category could have been previously classified adversely, but the deficiencies have since been corrected. Management should closely monitor recent payment history of the loan and value of the collateral.
Borrowers may exhibit poor liquidity and leverage positions resulting from generally negative cash flow or negative trends in earnings. Access to alternative financing may be limited to finance companies for business borrowers and may be unavailable for commercial real estate borrowers.
Substandard
A substandard loan is inadequately protected by the current sound worth and paying capacity of the obligor or of the collateral pledged, if any. Substandard loans have a well defined weakness, or weaknesses, that jeopardize the collection or liquidation of the debt. They are characterized by the distinct possibility that the Bank will sustain some loss if the deficiencies are not corrected. This will be the measurement for determining if a loan is impaired.
Borrowers may exhibit recent or unexpected unprofitable operations, an inadequate debt service coverage ratio, or marginal liquidity and capitalization. These loans require more intense supervision by Bank management.
Doubtful
A doubtful loan has all the weaknesses inherent as a substandard loan with the added characteristic that the weaknesses make collection or liquidation in full, on the basis of currently existing facts, conditions, and values, highly questionable and improbable. A loan classified as doubtful exhibits loss potential. However, there is still sufficient reason to permit the loan to remain on the books. A doubtful classification could reflect the deterioration of the primary source of repayment and serious doubt exists as to the quality of the secondary source of repayment.
Doubtful classifications should be used only when a distinct and known possibility of loss exists. When identified, adequate loss should be recorded for the specific assets. The entire asset should not be classified as doubtful if a partial recovery is expected, such as liquidation of the collateral or the probability of a private mortgage insurance payment is likely.
Loss
Loans classified as loss are considered uncollectable and of such little value that their continuance as loans is unjustified. A loss classification does not mean a loan has absolutely no value; partial recoveries may be received in the future. When loans or portions of a loan are considered a loss, it will be the policy of the Bank to write-off the amount designated as a loss. Recoveries will be treated as additions to the allowance for loan losses.
HAMILTON BANCORP, INC AND SUBSIDIARY
Notes to Consolidated Financial Statements (Continued)
The following tables present the March 31, 2017 and 2016 balances of classified loans based on the risk grade. Classified loans include Special Mention, Substandard, and Doubtful loans. The Bank had no loans classified as Doubtful or Loss as of March 31, 2017 or 2016.
| | | March 31, 2017 | | | March 31, 2016 | |
| | | LEGACY | | | ACQUIRED | | | TOTAL | | | LEGACY | | | ACQUIRED | | | TOTAL | |
Risk Rating: | | | | | | | | | | | | | | | | | | | | | | | | |
Rating - Pass: | | | | | | | | | | | | | | | | | | | | | | | | |
Real estate loans: | | | | | | | | | | | | | | | | | | | | | | | | |
Residential | | $ | 71,721,341 | | | $ | 81,228,457 | | | $ | 152,949,798 | | | $ | 48,271,948 | | | $ | 23,799,344 | | | $ | 72,071,292 | |
Investor | | | 6,728,493 | | | | 18,151,533 | | | | 24,880,026 | | | | 11,697,157 | | | | 14,240,219 | | | | 25,937,376 | |
Commercial | | | 84,789,748 | | | | 13,387,987 | | | | 98,177,735 | | | | 66,824,956 | | | | 2,677,980 | | | | 69,502,936 | |
Commercial construction | | | 1,881,541 | | | | 1,308,652 | | | | 3,190,193 | | | | 1,982,571 | | | | 1,274,148 | | | | 3,256,719 | |
Commercial Business | | | 19,376,763 | | | | 2,019,337 | | | | 21,396,100 | | | | 13,629,957 | | | | 2,621,625 | | | | 16,251,582 | |
Home Equity | | | 13,269,478 | | | | 7,133,164 | | | | 20,402,642 | | | | 12,163,519 | | | | 2,168,073 | | | | 14,331,592 | |
Consumer | | | 2,258,836 | | | | 896,022 | | | | 3,154,858 | | | | 3,072,677 | | | | 1,063,946 | | | | 4,136,623 | |
Total Pass | | | 200,026,200 | | | | 124,125,152 | | | | 324,151,352 | | | | 157,642,785 | | | | 47,845,335 | | | | 205,488,120 | |
| | | | | | | | | | | | | | | | | | | | | | | | | |
Rating - Special Mention: | | | | | | | | | | | | | | | | | | | | | | | | |
Real estate loans: | | | | | | | | | | | | | | | | | | | | | | | | |
Residential | | | 1,499,436 | | | | 1,724,987 | | | | 3,224,423 | | | | 1,920,315 | | | | - | | | | 1,920,315 | |
Investor | | | - | | | | 408,803 | | | | 408,803 | | | | 351,835 | | | | 535,148 | | | | 886,983 | |
Commercial | | | 6,329,129 | | | | 1,305,692 | | | | 7,634,821 | | | | 5,683,884 | | | | - | | | | 5,683,884 | |
Commercial construction | | | - | | | | - | | | | - | | | | - | | | | - | | | | - | |
Commercial Business | | | - | | | | - | | | | - | | | | 3,477,579 | | | | - | | | | 3,477,579 | |
Home Equity | | | - | | | | 132,977 | | | | 132,977 | | | | - | | | | - | | | | - | |
Consumer | | | - | | | | 788 | | | | 788 | | | | - | | | | - | | | | - | |
Total Special Mention | | | 7,828,565 | | | | 3,573,247 | | | | 11,401,812 | | | | 11,433,613 | | | | 535,148 | | | | 11,968,761 | |
| | | | | | | | | | | | | | | | | | | | | | | | | |
Rating - Substandard: | | | | | | | | | | | | | | | | | | | | | | | | |
Real estate loans: | | | | | | | | | | | | | | | | | | | | | | | | |
Residential | | | 331,976 | | | | 938,945 | | | | 1,270,921 | | | | 375,635 | | | | 306,345 | | | | 681,980 | |
Investor | | | 13,976 | | | | 219,308 | | | | 233,284 | | | | 27,919 | | | | 903,961 | | | | 931,880 | |
Commercial | | | 1,546,812 | | | | 204,844 | | | | 1,751,656 | | | | 2,717,144 | | | | 211,239 | | | | 2,928,383 | |
Commercial construction | | | - | | | | - | | | | - | | | | - | | | | - | | | | - | |
Commercial Business | | | 141,266 | | | | - | | | | 141,266 | | | | 666,431 | | | | - | | | | 666,431 | |
Home Equity | | | 8,751 | | | | - | | | | 8,751 | | | | 59,169 | | | | - | | | | 59,169 | |
Consumer | | | - | | | | 40,790 | | | | 40,790 | | | | - | | | | 42,488 | | | | 42,488 | |
Total - Substandard | | | 2,042,781 | | | | 1,403,887 | | | | 3,446,668 | | | | 3,846,298 | | | | 1,464,033 | | | | 5,310,331 | |
| | | | | | | | | | | | | | | | | | | | | | | | | |
Rating - Doubtful | | | - | | | | - | | | | - | | | | - | | | | - | | | | - | |
Rating - Loss | | | - | | | | - | | | | - | | | | - | | | | - | | | | - | |
TOTAL LOANS | | $ | 209,897,546 | | | $ | 129,102,286 | | | $ | 338,999,832 | | | $ | 172,922,696 | | | $ | 49,844,516 | | | $ | 222,767,212 | |
In the normal course of business, the Bank has various outstanding commitments and contingent liabilities that are not reflected in the accompanying financial statements. Loan commitments and lines of credit are agreements to lend to a customer as long as there is no violation of any condition to the contract. Mortgage loan commitments generally have fixed interest rates, fixed expiration dates, and may require payment of a fee. Other loan commitments generally have fixed interest rates. Lines of credit generally have variable interest rates. Such lines do not represent future cash requirements because it is unlikely that all customers will draw upon their lines in full at any time.
HAMILTON BANCORP, INC AND SUBSIDIARY
Notes to Consolidated Financial Statements (Continued)
The Bank’s maximum exposure to credit loss in the event of nonperformance by the customer is the contractual amount of the credit commitment. Loan commitments, lines of credit, and letters of credit are made on the same terms, including collateral, as outstanding loans. The Bank has established an off-balance sheet reserve for potential losses associated with any outstanding commitment or unused line of credit. The off balance sheet reserve is a percentage of the outstanding commitment or unused line of credit that is based upon a discounted charge-off history associated with each respective loan segment. The reserve at March 31, 2017 and 2016 totaled $55,000 and $42,000, respectively. At March 31, 2017, management is not aware of any accounting loss to be incurred by funding these loan commitments at this time.
The Bank had the following outstanding commitments and unused lines of credit as of March 31, 2017 and 2016:
| | | March 31, | | | March 31, | |
| | | 2017 | | | 2016 | |
| | | | | | | | | |
Unused commercial lines of credit | | $ | 10,733,345 | | | $ | 9,845,571 | |
Unused home equity lines of credit | | | 22,993,289 | | | | 16,004,725 | |
Unused consumer lines of credit | | | 1,110,155 | | | | 29,656 | |
Residential construction loan commitments | | | 8,047,156 | | | | 8,166,473 | |
Commercial construction loan commitments | | | 7,091,564 | | | | 1,384,932 | |
Home equity loan commitments | | | 84,000 | | | | 536,000 | |
Commercial loan commitments | | | 1,089,218 | | | | 411,500 | |
Standby letter of credit | | | 472,354 | | | | 273,981 | |
Note 8: Related Party Transactions
The officers and directors of the Bank enter into loan transactions with the Bank in the ordinary course of business. The terms of these transactions are similar to the terms provided to other borrowers entering into similar loan transactions. All related party loans are subject to review by management and the board of directors.
Activity in these loans during the years ended March 31, 2017 and 2016 was as follows:
| | | 2017 | | | 2016 | |
| | | | | | | | | |
Balance - Beginning of year | | $ | 381,948 | | | $ | 475,115 | |
New loans and lines of credit advances | | | 7,500 | | | | 23,800 | |
Principal repayments | | | (44,134 | ) | | | (116,967 | ) |
Balance - End of year | | $ | 345,314 | | | $ | 381,948 | |
As of March 31, 2017 and 2016, respectively, related parties had $7,500 and $23,000 of new loans and $6,150 of credit available under lines of credit. Deposits from officers and directors of the Bank totaled $1,122,872 and $1,009,456 at March 31, 2017 and 2016, respectively.
HAMILTON BANCORP, INC AND SUBSIDIARY
Notes to Consolidated Financial Statements (Continued)
Note 9: Premises and Equipment and Premises and Equipment Held For Sale
A summary of premises and equipment, excluding premises and equipment held for sale, and the related depreciation and amortization as of March 31, is as follows:
| | | Estimated Useful | | | | | | | | | |
| | | Life (in years) | | | 2017 | | | 2016 | |
| | | | | | | | | | | | | | | |
Land | | | | | | | | $ | 1,064,044 | | | $ | 1,064,046 | |
Office buildings and improvements | | | 3 | - | 39 | | | | 3,800,195 | | | | 3,535,769 | |
Furniture and equipment | | | 3 | - | 7 | | | | 2,602,749 | | | | 2,147,000 | |
Automobiles | | | | 5 | | | | | 43,505 | | | | 41,015 | |
Assets not in service | | | | | | | | | 30,900 | | | | 11,640 | |
| | | | | | | | | | 7,541,393 | | | | 6,799,470 | |
Accumulated depreciation and amortization | | | | | | | | | (3,867,113 | ) | | | (3,243,996 | ) |
Net premises and equipment | | | | | | | | $ | 3,674,280 | | | $ | 3,555,474 | |
| | | | | | | | | | | | | | | |
Depreciation and amortization expense | | | | | | | | $ | 334,210 | | | $ | 278,865 | |
The Bank closed its Towson branch in fiscal 2016 and relocated it to the administrative office, which is also located in Towson. A branch presence was needed at the administrative office to assist the lending area in servicing borrowers. This was also a means to reduce costs and make more efficient use of the Bank’s premises. The building and land was sold in June 2015 for $500,000 and the Bank recognized a gain of $407,188 on the sale.
In the acquisition of Fairmount, the Company acquired three lots and an unoccupied branch building that was not in operation at the time of acquisition. The Company sold the unoccupied branch building in fiscal 2017 with a book balance of $405,000 for $425,000 with net proceeds of $393,000, excluding closing costs.
In the acquisition of Fraternity, the Company acquired two branches and the main office located in Baltimore City that included both the administrative offices of Fraternity and a full-service branch. The main office was owned by the bank and the other two branches were under a lease agreement at the time of acquisition. One of the leased branches was in close proximity and serviced the same geographic area as one of Hamilton’s existing branches that was also leased. The acquired branch was in a better location, smaller in size, and less expensive to lease. As a result, management decided to close our existing branch in May 2016 and move our current customers to the newly acquired location. In closing the existing branch, we were unable to get out of the existing lease agreement. Consequently, in accordance with accounting guidelines, we immediately recognized the present value of the remaining lease payments under that lease, which amounted to $495,000.
We are currently performing an analysis with respect to selling the main office location acquired in the Fraternity acquisition. The building includes the former administrative offices of Fraternity as well as an operating branch. The administrative office space is not being utilized and we feel there can be additional cost savings by relocating the branch to a smaller space in the same geographic area. Based upon these circumstances, we are reporting the building and land on the balance sheet as “premises and equipment held for sale” at $547,884, the lower of cost or fair value.
HAMILTON BANCORP, INC AND SUBSIDIARY
Notes to Consolidated Financial Statements (Continued)
At March 31, 2017, the Bank had four operating leases that include two branches acquired from Fraternity, the closed branch discussed in the preceding paragraph, and the administrative office lease in Baltimore County. The administrative office lease was renewed under a five year option in December 2016. Each of the lease agreements have options to renew at the end of the lease term. Rental expense under the four leases for the years ended March 31, 2017 and 2016 was $1,002,477and $394,694, respectively. The minimum future rental commitment under the lease agreements is as follows:
Year ending March 31, | | Payments | |
2018 | | | 525,455 | |
2019 | | | 528,111 | |
2020 | | | 559,497 | |
2021 | | | 468,471 | |
2022 | | | 338,631 | |
Thereafter | | | 86,596 | |
| | | | | |
| | | $ | 2,506,761 | |
Note 10: Goodwill and Other Intangible Assets
The Company’s intangible assets (goodwill and core deposit intangible) at March 31, 2017 consists of assets recorded in December 2009 associated with the acquisition of a branch office in Pasadena, Maryland and the acquisition of Fairmount in September 2015 and the acquisition of Fraternity in May 2016. The goodwill is deductible for tax purposes. We evaluate goodwill and other intangible assets for impairment on an annual basis. The core deposit intangible asset is being amortized straight-line over a life of eight years.
The following table presents the changes in net book value of intangible assets for the years ended March 31, 2017 and 2016:
| | | | | | | Core deposit | |
| | | Goodwill | | | intangible | |
| | | | | | | | | |
Balance April 1, 2015 | | $ | 2,664,432 | | | $ | 138,333 | |
Additions (1) | | | 4,103,379 | | | | 542,540 | |
Amortization | | | - | | | | (62,573 | ) |
Balance March 31, 2016 | | | 6,767,811 | | | | 618,300 | |
Additions (2) | | | 1,877,243 | | | | 242,020 | |
Post acquisition adjustments | | | (81,524 | ) | | | - | |
Amortization | | | - | | | | (121,022 | ) |
| | | | | | | | | |
Balance March 31, 2017 | | $ | 8,563,530 | | | $ | 739,298 | |
(1) - Additions to intangible assets are related to the merger with Fairmount Bancorp, Inc.
(2) - Additions to intangible assets are related to the acquisition of Fraternity Community Bancorp, Inc.
The post acquisition adjustment to goodwill shown in the table above was recorded in the first quarter of fiscal 2017. The adjustment represents a $451,000 write-down of several owner-occupied residential investor loans to one borrower that were acquired in the Fairmount acquisition and recording of an increase to the deferred tax asset related to a $533,000 net operating loss (NOL) from Fairmount’s final tax return. With regards to the investor loans, information we were not aware of at the time of the acquisition became available during the quarter ended June 30, 2016. Had we known this information at the time of the acquisition, we would have deemed these loans as impaired and valued them accordingly.
HAMILTON BANCORP, INC AND SUBSIDIARY
Notes to Consolidated Financial Statements (Continued)
At March 31, 2017, future expected annual amortization associated with the core deposit intangible is as follows:
Year ending March 31, | | Amount | |
| | | | | |
2018 | | | 126,070 | |
2019 | | | 126,070 | |
2020 | | | 123,737 | |
2021 | | | 98,070 | |
2022 | | | 98,070 | |
2023 | | | 98,070 | |
2024 | | | 64,169 | |
2025 | | | 5,042 | |
| | | $ | 739,298 | |
Note 11: Derivative – Interest Rate Swap Agreements
The Company utilizes interest rate swap agreements as part of its asset liability management strategy to help manage its interest rate risk position. The notional amount of the interest rate swaps does not represent amounts exchanged by the parties. The amount exchanged is determined by reference to the notional amount and the other terms of the individual interest rate swap agreements. The Company posted $392,266 and $290,422 under collateral arrangements as of March 31, 2017 and 2016, respectively, to satisfy collateral requirements associated with the risk exposure associated with all interest rate swap agreements.
Interest Rate SWAPS Designated as Cash Flow Hedges
During fiscal 2017, the Company entered into several interest rate swaps that were designated as cash flow hedges. The interest rate swaps have notional amounts totaling $11.6 million as of March 31, 2017 and were designated as cash flow hedges of certain Federal Home Loan Bank advances. The purpose of the cash flow hedges is to match-fund longer-term assets with longer-term borrowings to reduce potential interest rate risk and cost by swapping a variable rate borrowing for a fixed rate borrowing. The cash flow hedges were determined to be fully effective during all periods presented. As such, no amount of ineffectiveness has been included in net (loss) income. Therefore, the aggregate fair value of the swaps is recorded in other assets (liabilities) with changes in fair value recorded in other comprehensive income (loss). The amount included in accumulated other comprehensive income (loss) would be reclassified to current earnings should the hedges no longer be considered effective. The Company expects the hedges to remain fully effective during the remaining terms of the hedge transaction.
Summary information about the interest-rate swaps designated as cash flow hedges as of year-end is as follows:
| | | Notional | | Effective | | | | Pay Fixed | | Receive |
Interest Rate Swap | | Amount | | Start Date | | Maturity Date | | Rate | | Floating Rate |
FHLB Advance Swap 1 | | $ | 1,850,000 | | March 9, 2017 | | March 9, 2022 | | | 2.24 | % | 3-Month LIBOR |
FHLB Advance Swap 2 | | | 1,850,000 | | March 9, 2017 | | March 9, 2024 | | | 2.41 | % | 3-Month LIBOR |
FHLB Advance Swap 3 | | | 1,850,000 | | March 9, 2017 | | March 9, 2027 | | | 2.57 | % | 3-Month LIBOR |
FHLB Advance Swap 4 | | | 2,000,000 | | March 29, 2017 | | March 29, 2022 | | | 2.08 | % | 3-Month LIBOR |
FHLB Advance Swap 5 | | | 2,000,000 | | March 29, 2017 | | March 29, 2024 | | | 2.24 | % | 3-Month LIBOR |
FHLB Advance Swap 6 | | | 2,000,000 | | March 29, 2017 | | March 29, 2027 | | | 2.40 | % | 3-Month LIBOR |
| | | $ | 11,550,000 | | | | | | | | | |
Interest expense recorded on these swap transactions totaled $4,800 and is reported as a component of interest expense on FHLB Advances.
HAMILTON BANCORP, INC AND SUBSIDIARY
Notes to Consolidated Financial Statements (Continued)
The following table reflects cash flow hedges included in the Consolidated Statements of Financial Condition as of March 31, 2017:
| | | 2017 | |
| | | Notional | | | | | |
| | | Amount | | | Fair Value | |
| | | | | | | | | |
Included in liabilities: | | | | | | | | |
Interest rate swaps relatedto FHLB Advances | | $ | 11,550,000 | | | $ | (83,634 | ) |
Interest Rate SWAPS Designated as Fair Value Hedges
The derivative position relates to a transaction in which the Bank entered into an interest rate swap with another financial institution using a fixed rate commercial real estate loan as an offset. The Bank agrees to pay the other financial institution a fixed interest rate on a notional amount based upon the commercial real estate loan and in return receive a variable interest rate on the same notional amount. This transaction allows the Bank to effectively convert a fixed rate loan to a variable rate. Because the terms of the swap with the other financial institution and the commercial real estate loan offset each other, with the only difference being credit risk associated with the loan, changes in the fair value of the underlying derivative contract and the commercial real estate loan are not materially different and do not significantly impact the Bank’s results of operations.
During the second quarter of fiscal 2016, the Company entered into the interest rate swap agreement with a $3.3 million notional amount to convert a fixed rate commercial real estate loan at 3.99% into a variable rate for a term of approximately 10 years. The notional amount of the interest rate swap and the offsetting commercial real estate loan were $3.2 million at March 31, 2017 and 2016. The derivative is designated as a fair value hedge.
Credit risk arises from the possible inability of counterparties to meet the terms of their contracts. The Bank’s exposure is limited to the replacement value of the contract rather than the notional amount, principal, or contract amount. There are provisions in the agreement with the counterparty that allow for certain unsecured credit exposure up to an agreed threshold. Exposures in excess of the agreed threshold are collateralized. In addition, the Bank minimizes credit risk through credit approvals, limits, and monitoring procedures.
The fair value hedge is summarized below:
| | | March 31, 2017 | | | March 31, 2016 | |
| | | Notional Amount | | | Principal Amount | | | Fair Value | | | Notional Amount | | | Principal Amount | | | Fair Value | |
Included in Loans and Leases: | | | | | | | | | | | | | | | | | | | | | | | | |
Commercial real estate loan | | $ | - | | | $ | 3,175,044 | | | $ | 3,201,691 | | | $ | - | | | $ | 3,254,906 | | | $ | 3,462,417 | |
| | | | | | | | | | | | | | | | | | | | | | | | | |
Included in Other Liabilities: | | | | | | | | | | | | | | | | | | | | | | | | |
Interest Rate Swap | | $ | 3,175,044 | | | | - | | | $ | 26,647 | | | $ | 3,254,906 | | | | - | | | $ | 207,511 | |
No gain or loss was recognized in earnings for the years ended March 31, 2017 and 2016 related to the interest rate swap due to the fact the gain or increase in the fair value of the commercial real estate was offset by the loss or decrease in the fair value of interest rate swap.
HAMILTON BANCORP, INC AND SUBSIDIARY
Notes to Consolidated Financial Statements (Continued)
Note 12: Deposits
The following table details the composition of deposits and the related percentage mix of total deposits, respectively:
| | | March 31, 2017 | | | March 31, 2016 | |
| | | Amount | | | % of Total | | | Amount | | | % of Total | |
Savings | | $ | 44,614,415 | | | | 11 | % | | $ | 33,010,962 | | | | 11 | % |
Noninterest-bearing checking | | | 30,401,454 | | | | 7 | % | | | 19,747,437 | | | | 6 | % |
Interest-bearing checking | | | 26,415,189 | | | | 6 | % | | | 13,298,677 | | | | 4 | % |
Money market accounts | | | 62,962,902 | | | | 15 | % | | | 52,576,567 | | | | 17 | % |
Time deposits | | | 247,632,742 | | | | 60 | % | | | 195,031,411 | | | | 62 | % |
| | | $ | 412,026,702 | | | | 100.0 | % | | $ | 313,665,054 | | | | 100 | % |
Premium on deposits asssumed | | | 829,072 | | | | | | | | 328,597 | | | | | |
Total deposits | | $ | 412,855,774 | | | | | | | $ | 313,993,651 | | | | | |
The aggregate amount oftime deposits in denominations of $250,000 or more is $21,594,387 and $16,921,658 at March 31, 2017 and 2016, respectively.
A schedule of maturity of time deposits at March 31, is as follows:
Maturity period | | 2017 | | | 2016 | |
| | | | | | | | | |
Within one year | | $ | 124,859,888 | | | $ | 105,643,954 | |
Over one year through two years | | | 61,925,008 | | | | 47,080,116 | |
Over two years through three years | | | 26,005,112 | | | | 20,359,501 | |
Over three years through four years | | | 17,427,002 | | | | 11,483,526 | |
Over four years through five years | | | 17,393,621 | | | | - | |
Greater than five years | | | 22,111 | | | | 10,464,315 | |
| | | $ | 247,632,742 | | | $ | 195,031,411 | |
Note 13: Federal Home Loan Bank Advances and Lines of Credit
The Bank may borrow up to $5,000,000 from a correspondent bank under a secured federal funds line of credit and $1,000,000 under an unsecured federal funds line of credit. The Bank would be required to pledge investment securities to draw upon the secured line of credit. There were no borrowings under these lines of credit at March 31, 2017 and 2016. The Bank also maintains a note payable on an automobile purchased during fiscal 2017. The original amount of the note was $28,805 with an interest rate of 1.95% for 36 months. The balance of the note at March 31, 2017 is $27,249.
HAMILTON BANCORP, INC AND SUBSIDIARY
Notes to Consolidated Financial Statements (Continued)
Borrowings primarily consist of advances from the Federal Home Loan Bank (FHLB). The Bank may borrow up to 25 percent of its assets under a line of credit agreement with the FHLB. Advances under the line of credit are secured by certain loans owned by the Bank. As of March 31, 2017 and 2016, the Bank had $88.2 million and $58.0 million, respectively, of available credit from the FHLB. Advances are limited by the balance of loans available for pledge. The amount of loans that were deemed eligible to pledge as collateral totaled $159.1 million at March 31, 2017 and $44.3 million at March 31, 2016. As a condition of obtaining the line of credit from the FHLB, the FHLB also requires the Bank purchase shares of capital stock in the FHLB. Information relating to borrowings at March 31, 2017 and 2016 is presented below.
| | | March 31, 2017 | | March 31, 2016 |
| | | Amount | | | Rate | | Maturity Date | | Amount | | | Rate | | Maturity Date |
FHLB advance (1) | | $ | 5,550,000 | | | | 0.94 | % | 6/9/2017 | | $ | 2,000,000 | | | | 0.43 | % | 6/3/2016 |
FHLB advance (2) | | | 6,000,000 | | | | 0.93 | % | 6/29/2017 | | | 2,000,000 | | | | 0.60 | % | 9/3/2016 |
FHLB advance | | | 1,000,000 | | | | 4.24 | % | 7/31/2017 | | | 1,500,000 | | | | 0.75 | % | 3/31/2017 |
FHLB advance | | | 5,000,000 | | | | 4.28 | % | 7/31/2017 | | | 1,000,000 | | | | 4.24 | % | 7/31/2017 |
FHLB advance | | | 1,000,000 | | | | 4.01 | % | 8/21/2017 | | | 1,000,000 | | | | 4.01 | % | 8/21/2017 |
FHLB advance | | | 1,000,000 | | | | 0.91 | % | 8/31/2017 | | | 1,000,000 | | | | 0.91 | % | 8/31/2017 |
FHLB advance | | | 1,500,000 | | | | 3.23 | % | 11/24/2017 | | | 1,500,000 | | | | 3.23 | % | 11/24/2017 |
FHLB advance | | | 1,500,000 | | | | 3.40 | % | 11/27/2017 | | | 1,500,000 | | | | 3.40 | % | 11/27/2017 |
FHLB advance | | | 1,000,000 | | | | 2.60 | % | 7/2/2018 | | | 1,000,000 | | | | 2.60 | % | 7/2/2018 |
FHLB advance | | | 1,000,000 | | | | 3.05 | % | 7/3/2018 | | | 1,000,000 | | | | 3.05 | % | 7/3/2018 |
FHLB advance | | | 5,000,000 | | | | 3.94 | % | 7/23/2018 | | | 1,000,000 | | | | 2.60 | % | 10/2/2018 |
FHLB advance | | | 5,000,000 | | | | 3.38 | % | 9/19/2018 | | | - | | | | | | |
FHLB advance | | | 1,000,000 | | | | 2.60 | % | 10/2/2018 | | | - | | | | | | |
Note payable - auto | | | 27,250 | | | | 1.95 | % | 2/17/2020 | | | - | | | | | | |
| | | | 35,577,250 | | | | | | | | | 14,500,000 | | | | | | |
Premium on borrowings assumed | | | 547,649 | | | | | | | | | 305,237 | | | | | | |
Total FHLB borrowings | | $ | 36,124,899 | | | | | | | | $ | 14,805,237 | | | | | | |
(1) - | FHLB Advance is tied to three derivative cash flow hedges in increments of $1.85 million each. The three individual cash flow hedges are for a term of five, seven and ten years, respectively and are tied to the 3-month LIBOR rate. In order for the cash flow hedges to remain effective, the corresponding FHLB Advance will have to be renewed every three months until the respective cash flow hedge matures. |
(2) - | FHLB Advance is tied to three derivative cash flow hedges in increments of $2.0 million each. The three individual cash flow hedges are for a term of five, seven and ten years, respectively and are tied to the 3-month LIBOR rate. In order for the cash flow hedges to remain effective, the corresponding FHLB Advance will have to be renewed every three months until the respective cash flow hedge matures. |
Note 14: Income Taxes
The provisions for income taxes for the years ended March 31, 2017 and 2016 consist of the following components:
| | | March 31, | |
| | | 2017 | | | 2016 | |
Current: | | | | | | | | |
Federal | | $ | (10,911 | ) | | $ | (19,684 | ) |
State | | | (5,193 | ) | | | (5,205 | ) |
Deferred income tax | | | | | | | | |
Federal | | | (610,084 | ) | | | 434,189 | |
State | | | (131,817 | ) | | | 12,391 | |
Total | | $ | (758,005 | ) | | $ | 421,691 | |
HAMILTON BANCORP, INC AND SUBSIDIARY
Notes to Consolidated Financial Statements (Continued)
A reconciliation of the provision for taxes on income from the statutory federal income tax rate to the effective income tax rates follows:
| | | March 31, | |
| | | 2017 | | | 2016 | |
| | | | | | | | | |
Tax at statutory federal income tax rate | | $ | (573,507 | ) | | $ | 111,886 | |
Tax effect of: | | | | | | | | |
Tax-exempt income | | | (260,637 | ) | | | (133,030 | ) |
State income taxes, net of federal impact | | | (90,427 | ) | | | 4,743 | |
Nondeductible expenses and other | | | 166,566 | | | | 438,092 | |
Income tax (benefit) expense | | $ | (758,005 | ) | | $ | 421,691 | |
The following is a summary of the tax effects of the temporary differences and tax attributes between financial and income tax accounting that give rise to deferred tax assets and deferred tax liabilities as of March 31:
Deferred tax assets: | | 2017 | | | 2016 | |
Allowance for loan losses | | $ | 887,510 | | | $ | 688,066 | |
Nonaccrual interest | | | 197,363 | | | | 194,900 | |
Deferred compensation | | | 822,939 | | | | 156,164 | |
Foreclosed real estate write down and holding costs | | | 221,010 | | | | 221,010 | |
Deferred loan costs | | | 42,285 | | | | 35,070 | |
Capital loss carryforward | | | 48,872 | | | | - | |
Charitable contribution carryforward | | | 42,098 | | | | 38,101 | |
Net operating loss carryforward | | | 4,414,529 | | | | 625,612 | |
Stock based payment awards | | | 80,833 | | | | 64,799 | |
Unrealized loss on investment securities available for sale | | | 862,673 | | | | 14,410 | |
AMT credit carryover | | | 225,294 | | | | 169,728 | |
Acquisition activity | | | 1,078,763 | | | | 969,105 | |
| | | | 8,924,169 | | | | 3,176,965 | |
Valuation allowance on deferred tax asset | | | (42,364 | ) | | | (21,218 | ) |
| | | | 8,881,805 | | | | 3,155,747 | |
| | | | | | | | | |
Deferred tax liabilities: | | | | | | | | |
FHLB stock dividends | | | 91,004 | | | | 67,245 | |
Goodwill and other intangible assets | | | 717,933 | | | | 588,727 | |
Accumulated depreciation | | | 65,193 | | | | 93,576 | |
Other | | | 30,825 | | | | 53,058 | |
| | | | 904,955 | | | | 802,606 | |
| | | | | | | | | |
Net deferred tax asset | | $ | 7,976,850 | | | $ | 2,353,141 | |
It is more likely than not that the Company will be able to realize the recorded net deferred income tax asset. This is based on projections of future taxable income. As of March 31, 2017 and 2016, the Company recorded a valuation allowance of $42,364 and $21,218, respectively, related to the holding company’s State of Maryland net operating loss carryforward. The Company has a federal net operating loss carryforward of $11.2 million as of March 31, 2017, which will expire within the period of the years ending March 31, 2030 through 2036. In addition, other tax attributes consisted of capital loss carryforwards of $123,900, charitable contribution carryforwards of $10,135, and AMT credit carryovers of $225,294 at March 31, 2017. Charitable contribution and AMT credit carryovers have a limited life of five years.
On May 13, 2016 we acquired Fraternity, which had federal NOL carryforwards of approximately $4.5 million at the date of acquisition that will expire between fiscal years ending March 31, 2030 and 2036. As a result of the change in ownership, the utilization of Fraternity’s NOL carryforwards is subject to limitations imposed by the Internal Revenue Code.
HAMILTON BANCORP, INC AND SUBSIDIARY
Notes to Consolidated Financial Statements (Continued)
The Company’s tax returns are subject to review and examination by federal and state taxing authorities. The Company’s tax returns are currently open to audit under the applicable statutes of limitations by the Internal Revenue Service for the years ended March 31, 2013 through March 31, 2017. The Company does not have any uncertain tax positions that are deemed material, and did not recognize any adjustments for unrecognized tax benefits.
Note 15: Regulatory Capital Ratios
Banks and bank holding companies are subject to various regulatory capital requirements administered by state and federal banking agencies. Capital adequacy guidelines and, additionally for banks, prompt corrective action regulations, involve quantitative measures of assets, liabilities, and certain off-balance-sheet items calculated under regulatory accounting practices. Capital amounts and classifications are also subject to qualitative judgments by regulators about components, risk weighting and other factors.
The Basel III Capital Rules became effective for Hamilton Bank on January 1, 2015 (subject to a phase-in period for certain provisions). Quantitative measures established by the Basel III Capital Rules to ensure capital adequacy require the maintenance of minimum amounts and ratios (set forth in the table below) of Common Equity Tier 1 capital, Tier 1 capital and Total capital (as defined in the regulations) to risk-weighted assets (as defined), and of Tier 1 capital to adjusted quarterly average assets (as defined).
In connection with the adoption of the Basel III Capital Rules, we elected to opt-out of the requirement to include accumulated other comprehensive income in Common Equity Tier 1. Common Equity Tier 1 for Hamilton Bank is reduced by goodwill and other intangible assets, net of associated deferred tax liabilities and subject to transition provisions.
Under the revised prompt corrective action requirements, as of January 1, 2015, insured depository institutions are required to meet the following in order to qualify as “well capitalized:” (1) a common equity Tier 1 risk-based capital ratio of 6.5%; (2) a Tier 1 risk-based capital ratio of 8%; (3) a total risk-based capital ratio of 10% and (4) a Tier 1 leverage ratio of 5%. As of March 31, 2017, the Bank met all capital adequacy requirements under the Basel III Capital Rules to be considered “well capitalized�� under prompt corrective action rules.
The implementation of the capital conservation buffer will begin on January 1, 2016 at the 0.625% level and be phased in over a four-year period (increasing by that amount on each subsequent January 1, until it reaches 2.5% on January 1, 2019). The Basel III Capital Rules also provide for a “countercyclical capital buffer” that is applicable to only certain covered institutions and does not have any current applicability to Hamilton Bank.
The aforementioned capital conservation buffer is designed to absorb losses during periods of economic stress. Banking institutions with a ratio of Common Equity Tier 1 capital to risk-weighted assets above the minimum but below the conservation buffer (or below the combined capital conservation buffer and countercyclical capital buffer, when the latter is applied) will face constraints on dividends, equity repurchases and compensation based on the amount of the shortfall.
HAMILTON BANCORP, INC AND SUBSIDIARY
Notes to Consolidated Financial Statements (Continued)
The following table presents actual and required capital ratios as of March 31, 2017 and March 31, 2016 for Hamilton Bank under the Basel III Capital Rules. The minimum required capital amounts presented include the minimum required capital levels as of January 1, 2017 based on the phase-in provisions of the Basel III Capital Rules and the minimum required capital levels as of January 1, 2019 when the Basel III Capital Rules have been fully phased-in. Capital levels required to be considered well capitalized are based upon prompt corrective action regulations, as amended to reflect the changes under the Basel III Capital Rules.
| | | | | | | | | | | Minimum Capital | | | Minimum Capital | | | To be well | |
| | | Actual | | | Required - Basel III | | | Required - Basel III | | | capitalized (1) | |
| | | | | | | | | | | Phase-In Schedule | | | Fully Phased-In | | | | | | | | | |
| | | Amount | | | Ratio | | | Amount | | | Ratio | | | Amount | | | Ratio | | | Amount | | | Ratio | |
| | | | | | | | | | | (dollars in thousands) | | | (dollars in thousands) | | | | | | | | | |
March 31, 2017 | | | | | | | | | | | | | | | | | | | | | | | | | | | | | | | | |
| | | | | | | | | | | | | | | | | | | | | | | | | | | | | | | | | |
Common equity tier 1 capital (to risk-weighted assets) | | | | | | | | | | | | | | | | | | | | | | | | | | | | | | | | |
Hamilton Bank | | $ | 40,084 | | | | 12.13 | % | | $ | 18,996 | | | | 5.750 | % | | $ | 23,126 | | | | 7.00 | % | | $ | 21,474 | | | | 6.50 | % |
Hamilton Bancorp | | | 48,318 | | | | 14.56 | % | | | 19,078 | | | | 5.750 | % | | | 23,225 | | | | 7.00 | % | | $ | 21,566 | | | | 6.50 | % |
Total risk-based capital (to risk-weighted assets) | | | | | | | | | | | | | | | | | | | | | | | | | | | | | | | | |
Hamilton Bank | | | 42,334 | | | | 12.81 | % | | | 30,559 | | | | 9.250 | % | | | 34,689 | | | | 10.50 | % | | | 33,037 | | | | 10.00 | % |
Hamilton Bancorp | | | 50,568 | | | | 15.24 | % | | | 30,690 | | | | 9.250 | % | | | 34,838 | | | | 10.50 | % | | | 33,179 | | | | 10.00 | % |
Tier 1 capital (to risk-weighted assets) | | | | | | | | | | | | | | | | | | | | | | | | | | | | | | | | |
Hamilton Bank | | | 40,084 | | | | 12.13 | % | | | 23,952 | | | | 7.250 | % | | | 28,081 | | | | 8.50 | % | | | 26,429 | | | | 8.00 | % |
Hamilton Bancorp | | | 48,318 | | | | 14.56 | % | | | 24,055 | | | | 7.250 | % | | | 28,202 | | | | 8.50 | % | | | 26,543 | | | | 8.00 | % |
Tier 1 capital (to adjusted total assets) | | | | | | | | | | | | | | | | | | | | | | | | | | | | | | | | |
Hamilton Bank | | | 40,084 | | | | 8.28 | % | | | 19,365 | | | | 4.000 | % | | | 19,365 | | | | 4.00 | % | | | 24,207 | | | | 5.00 | % |
Hamilton Bancorp | | | 48,318 | | | | 9.96 | % | | | 19,402 | | | | 4.000 | % | | | 19,402 | | | | 4.00 | % | | | 24,253 | | | | 5.00 | % |
| | | | | | | | | | | | | | | | | | | | | | | | | | | | | | | | | |
March 31, 2016 | | | | | | | | | | | | | | | | | | | | | | | | | | | | | | | | |
| | | | | | | | | | | | | | | | | | | | | | | | | | | | | | | | | |
Common equity tier 1 capital (to risk-weighted assets) | | | | | | | | | | | | | | | | | | | | | | | | | | | | | | | | |
Hamilton Bank | | $ | 44,518 | | | | 19.06 | % | | $ | 11,971 | | | | 5.125 | % | | $ | 16,350 | | | | 7.00 | % | | $ | 15,182 | | | | 6.50 | % |
Hamilton Bancorp | | | 54,459 | | | | 23.14 | % | | | 12,062 | | | | 5.125 | % | | | 16,475 | | | | 7.00 | % | | | 15,298 | | | | 6.50 | % |
Total risk-based capital (to risk-weighted assets) | | | | | | | | | | | | | | | | | | | | | | | | | | | | | | | | |
Hamilton Bank | | | 46,262 | | | | 19.81 | % | | | 20,146 | | | | 8.625 | % | | | 24,525 | | | | 10.50 | % | | | 23,357 | | | | 10.00 | % |
Hamilton Bancorp | | | 56,203 | | | | 23.88 | % | | | 20,299 | | | | 8.625 | % | | | 24,712 | | | | 10.50 | % | | | 23,535 | | | | 10.00 | % |
Tier 1 capital (to risk-weighted assets) | | | | | | | | | | | | | | | | | | | | | | | | | | | | | | | | |
Hamilton Bank | | | 44,518 | | | | 19.06 | % | | | 15,474 | | | | 6.625 | % | | | 19,854 | | | | 8.50 | % | | | 18,686 | | | | 8.00 | % |
Hamilton Bancorp | | | 54,459 | | | | 23.14 | % | | | 15,592 | | | | 6.625 | % | | | 20,005 | | | | 8.50 | % | | | 18,828 | | | | 8.00 | % |
Tier 1 capital (to adjusted total assets) | | | | | | | | | | | | | | | | | | | | | | | | | | | | | | | | |
Hamilton Bank | | | 44,518 | | | | 11.78 | % | | | 15,114 | | | | 4.000 | % | | | 15,114 | | | | 4.00 | % | | | 18,892 | | | | 5.00 | % |
Hamilton Bancorp | | | 54,459 | | | | 14.23 | % | | | 15,312 | | | | 4.000 | % | | | 15,312 | | | | 4.00 | % | | | 19,140 | | | | 5.00 | % |
(1) - Under prompt corrective action
Tier 1 capital consists oftotal shareholders’ equity less goodwill, intangible assets, and deferred tax net operating loss carryforwards. Total capital includes a limited amount of the allowance for loan losses and a portion of any unrealized gain on equity securities. In calculating risk-weighted assets, specified risk percentages are applied to each category of asset and off-balance-sheet items.
Failure to meet the capital requirements could affect, among other things, the Bank's ability to accept brokered deposits and may significantly affect the operations of the Bank. During the quarter ended December 31, 2016, the Company moved $3.0 million in cash down to the Bank as capital to increase the Bank’s lending capacity and enhance the Bank’s capital ratios after falling below the Bank’s self-imposed internal minimum capital level in the prior quarter.
In its regulatory report filed as of March 31, 2017, the Bank exceeded all regulatory capital requirements and was considered “well capitalized” under regulatory guidelines. Management is not aware of any events that would have caused this classification to change. Management has no plans that should change the classification of the capital adequacy.
Note 16: Defined Contribution Retirement Plan
The Bank offers a retirement plan qualifying under section 401(k) of the Internal Revenue Code to its employees. The Plan covers all full-time employees with one year of service who have reached 18 years of age. The Bank contributes three percent of each participant’s eligible compensation to the Plan. The Bank may make elective deferrals as well, upon Board of Directors approval. During the years ended March 31, 2017 and 2016, the Bank recorded expense of $145,082 and $120,862, respectively, related to the 401(k) Plan.
Note 17: Employee Stock Ownership Plan
In connection with the conversion to stock form in October 2012, the Company established an Employee Stock Ownership Plan (ESOP) for the exclusive benefit of eligible employees. Eligible employees include all employees over the age of 21that have completed 1,000 hours of service over a continuous twelve month period. The ESOP borrowed funds from the Company in the amount of $2,962,400, which was sufficient to purchase 296,240 shares or 8% of the Common Stock issued in the offering. The shares were acquired at a price of $10.00 per share.
HAMILTON BANCORP, INC AND SUBSIDIARY
Notes to Consolidated Financial Statements (Continued)
The loan is secured by the shares purchased with the loan proceeds and will be repaid by the ESOP over the 20-year term of the loan with funds from the Bank’s contributions to the ESOP and dividends paid on the stock, if any. The interest rate on the ESOP loan is an adjustable rate equal to the lowest prime rate, as published in theWall Street Journal. The interest rate will adjust annually and will be the prime rate on the first business day of the calendar year. The interest rate on the loan as of March 31, 2017 is 3.75%.
Shares purchased with the loan proceeds are held in a suspense account for allocation among participants as the loan is repaid. Contributions to the ESOP and shares released from the suspense account are allocated among participants in proportion to their annual salaried wages, relative to total salaried wages of all active participants. Participants will vest their accrued benefits under the employee stock ownership plan at a rate of 20% per year, such that the participants will be 100% vested upon completion of five years of credited service. Vesting is accelerated upon retirement, death, or disability of the participant, or a change in control of the Bank. Forfeitures will be reallocated to remaining plan participants. Benefits may be payable upon retirement, death, disability, separation of service, or termination of the ESOP.Participants may elect to receive benefits in cash in lieu of common stock.
The debt of the ESOP, in accordance with generally accepted accounting principles, is eliminated in consolidation and the shares pledged as collateral are reported as unearned ESOP shares in the consolidated balance sheet. Contributions to the ESOP shall be sufficient to pay principal and interest currently due under the loan agreement. As shares are committed to be released from collateral, the Company reports compensation expense equal to the fair market price of the shares as they are committed to be released from the unallocated suspense account to participants’ accounts. The shares allocated will then become outstanding shares for earnings per share computations. The ESOP compensation expense for the year ended March 31, 2017 and 2016 was $235,633 and $209,949, respectively.
A summary of ESOP shares at March 31, 2017 and 2016 is as follows:
| | | 2017 | | | 2016 | |
| | | | | | | | | |
Shares allocated to employees | | | 74,060 | | | | 59,248 | |
Unearned shares | | | 222,180 | | | | 236,992 | |
Total ESOP shares | | | 296,240 | | | | 296,240 | |
Fair value of unearned shares | | $ | 3,410,463 | | | $ | 3,154,364 | |
Note 18: Stock Based Compensation
In November 2013, the Company’s shareholders approved a new Equity Incentive Plan (the “2013 Equity Incentive Plan’’). The 2013 Equity Incentive Plan allows for up to 148,120 shares to be issued to employees, executive officers or Directors in the form of restricted stock, and up to 370,300 shares to be issued to employees, executive officers or Directors in the form of stock options. At March 31, 2017, there were 83,900 restricted stock awards issued and outstanding and 247,850 stock option awards granted under the 2013 Equity Incentive Plan.
Stock Options:
Under the above plan, the exercise price for stock options is the market price at date of grant. The maximum option term is ten years and the options granted shall vest in five equal annual installments of 20% with the first installment becoming exercisable on the first anniversary of the date of grant and succeeding installments on each anniversary thereafter. The Company plans to issue new shares to satisfy share option exercises. The total expense that has been incurred for the stock option plan was $216,735 and $209,209 for the years ended March 31, 2017 and 2016, respectively.
The fair value of each option award is estimated on the date of grant using a closed form option valuation (Black-Scholes) model that uses the assumptions noted in the table below. Expected volatilities are based on historical data. The Company uses historical data to estimate option exercise and post-vesting termination behavior. The expected term of options granted represents the period of time that options granted are expected to be outstanding, which takes into account that the options are not transferable. The risk-free interest rate for the expected term of the option is based on the U.S. Treasury rate equal to the expected term of the option in effect at the time of the grant.
HAMILTON BANCORP, INC AND SUBSIDIARY
Notes to Consolidated Financial Statements (Continued)
The fair value of options granted to date was determined using the following weighted-average assumptions as of grant date.
Grant Date | | Number of Options Granted | | | Risk Free Interest Rate | | | Expected Term (in years) | | | Expected Stock Price Volatility | | | Dividend Yield | | | Fair Value of Options Granted | |
February 3, 2014 | | | 225,150 | | | | 2.07 | % | | | 7.0 | | | | 27.30 | % | | | 0.00 | % | | $ | 4.65 | |
November 1, 2016 | | | 19,000 | | | | 1.61 | % | | | 7.0 | | | | 27.17 | % | | | 0.00 | % | | $ | 4.35 | |
February 3, 2017 | | | 3,700 | | | | 2.27 | % | | | 7.0 | | | | 27.26 | % | | | 0.00 | % | | $ | 5.18 | |
A summary of stock option activity for the year ended March 31, 2017 and 2016 is as follows:
March 31, 2017: | | Shares | | | Weighted Average Exercise Price | | | Weighted Average Remaining Contractual Term (in years) | |
Outstanding at April 1, 2016 | | | 219,650 | | | $ | 13.85 | | | | 7.8 | |
Granted | | | 22,700 | | | | 13.78 | | | | 10.0 | |
Exercised | | | - | | | | - | | | | - | |
Forfeited, exchanged or expired | | | - | | | | - | | | | - | |
Outstanding at March 31, 2017 | | | 242,350 | | | $ | 13.84 | | | | 7.1 | |
| | | | | | | | | | | | | |
Vested at March 31, 2017 | | | 131,790 | | | $ | 13.85 | | | | 6.8 | |
March 31, 2016: | | Shares | | | Weighted Average Exercise Price | | | Weighted Average Remaining Contractual Term (in years) | |
Outstanding at April 1, 2015 | | | 219,650 | | | $ | 13.85 | | | | 8.8 | |
Granted | | | - | | | | - | | | | - | |
Exercised | | | - | | | | - | | | | - | |
Forfeited, exchanged or expired | | | - | | | | - | | | | - | |
Outstanding at March 31, 2016 | | | 219,650 | | | $ | 13.85 | | | | 7.8 | |
| | | | | | | | | | | | | |
Vested at March 31, 2016 | | | 87,860 | | | $ | 13.85 | | | | 7.8 | |
As of March 31, 2017, there was $477,841 of total unrecognized compensation cost related to nonvested stock options granted under the Plan. The expense is expected to be recognized over a weighted-average period of 2.4 years. The intrinsic value of a stock option is the amount that the market value of the underlying stock exceeds the exercise price of the option. Based upon a fair market value of $15.35 at March 31, 2017, the options outstanding had an intrinsic value of $365,180.
Restricted Stock:
The specific terms of each restricted stock award are determined by the Compensation Committee at the date of the grant. Compensation expense is recognized over the vesting period of the awards based on the fair value of the stock at the grant date. Restricted stock awards granted shall vest in five equal annual installments of 20% with the first installment becoming vested on the first anniversary of the date of grant and succeeding installments on each anniversary thereafter.
HAMILTON BANCORP, INC AND SUBSIDIARY
Notes to Consolidated Financial Statements (Continued)
A summary of changes in the Company’s nonvested shares for the year is as follows:
| | | | | | | Weighted-Average | |
March 31, 2017: | | Shares | | | Fair Value | |
Nonvested shares at April 1, 2016 | | | 50,600 | | | $ | 13.76 | |
Granted | | | 2,000 | | | | 13.93 | |
Vested | | | (16,380 | ) | | | 13.78 | |
Forfeited | | | - | | | | - | |
Nonvested shares at March 31, 2017 | | | 36,220 | | | $ | 13.76 | |
| | | | | | | | | |
Fair Value of shares vested at March 31, 2017 | | $ | 731,888 | | | | | |
| | | | | | | Weighted-Average | |
March 31, 2016: | | Shares | | | Fair Value | |
Nonvested shares at April 1, 2015 | | | 66,500 | | | $ | 13.76 | |
Granted | | | 400 | | | | 14.00 | |
Vested | | | (16,300 | ) | | | 13.76 | |
Forfeited | | | - | | | | - | |
Nonvested shares at March 31, 2016 | | | 50,600 | | | $ | 13.76 | |
| | | | | | | | | |
Fair Value of shares vested at March 31, 2016 | | $ | 416,603 | | | | | |
The following table outlines the vesting schedule of the nonvested restricted stock awards as of March 31, 2017:
Year Ending | | Number of | |
March 31, | | Restricted Shares | |
2018 | | | 16,780 | |
2019 | | | 16,780 | |
2020 | | | 1,780 | |
2021 | | | 480 | |
2022 | | | 400 | |
| | | | 36,220 | |
The Company recorded restricted stock awards expense of $227,646 and $225,425 for the years ended March 31, 2017 and 2016, respectively. As of March 31, 2017, there was $456,721 of total unrecognized compensation expense related to nonvested shares granted under the 2013 stock incentive plan. The cost is expected to be recognized over a weighted-average period of 2.1 years.
Note 19: Fair Value Measurements
Generally accepted accounting principles define fair value, establish a framework for measuring fair value, and establish a hierarchy for determining fair value measurement.The hierarchy includes three levels and is based upon the valuation techniques used to measure assets and liabilities. The three levels are as follows:
Level 1: Valuation is based on quoted prices (unadjusted) for identical assets or liabilities in active markets;
HAMILTON BANCORP, INC AND SUBSIDIARY
Notes to Consolidated Financial Statements (Continued)
Level 2: Valuation is determined from quoted prices for similar assets and liabilities in active markets, quoted prices for identical or similar instruments in markets that are not active or by model-based techniques in which all significant inputs are observable in the market; and
Level 3: Valuation is derived from model-based techniques in which at least one significant input is unobservable and based on the Company’s own estimates about the assumptions that market participants would use to value the asset or liability.
The following is a description of the valuation methods used for instruments measured at fair value as well as the general classification of such instruments pursuant to the applicable valuation method.
Fair value measurements on a recurring basis
Securities available for sale – If quoted prices are available in an active market for identical assets, securities are classified within Level 1 of the hierarchy. If quoted market prices are not available, then fair values are estimated using pricing models, quoted prices of securities with similar characteristics or discounted cash flows. As of March 31, 2017 and 2016, the Bank has categorized its investment securities available for sale as follows:
| | | Level 1 | | | Level 2 | | | Level 3 | | | | | |
March 31, 2017 | | inputs | | | inputs | | | inputs | | | Total | |
| | | | | | | | | | | | | | | | | |
U.S. government agencies | | $ | - | | | $ | 3,512,303 | | | $ | - | | | $ | 3,512,303 | |
Municipal bonds | | | - | | | | 14,239,526 | | | | 1,928,313 | | | | 16,167,839 | |
Corporate bonds | | | | | | | 1,916,522 | | | | - | | | | 1,916,522 | |
Mortgage-backed securities | | | - | | | | 80,829,991 | | | | 2,473 | | | | 80,832,464 | |
Total investment securities available for sale | | $ | - | | | $ | 100,498,342 | | | $ | 1,930,786 | | | $ | 102,429,128 | |
| | | Level 1 | | | Level 2 | | | Level 3 | | | | | |
March 31, 2016 | | inputs | | | inputs | | | inputs | | | Total | |
| | | | | | | | | | | | | | | | | |
U.S. government agencies | | $ | - | | | $ | 10,532,996 | | | $ | - | | | $ | 10,532,996 | |
Municipal bonds | | | - | | | | 4,112,564 | | | | - | | | | 4,112,564 | |
Corporate bonds | | | | | | | - | | | | 1,898,640 | | | | 1,898,640 | |
Mortgage-backed securities | | | - | | | | 53,940,200 | | | | - | | | | 53,940,200 | |
Total investment securities available for sale | | $ | - | | | $ | 68,585,760 | | | $ | 1,898,640 | | | $ | 70,484,400 | |
During fiscal 2017, several municipal bonds and mortgage-backed security were moved from Level 2 input to Level 3 input. The quantitative unobservable input for these bonds was obtained based upon pricing from an independent third party. The securities were moved to Level 3 input because there was no active market for these securities to obtain a fair value. Conversely, in fiscal 2017 a corporate bond was moved from Level 3 input to Level 2 input as additional market data and inputs became available.
HAMILTON BANCORP, INC AND SUBSIDIARY
Notes to Consolidated Financial Statements (Continued)
Derivative – Interest rate swap agreement -Our methodology consists of a discounted cash flow model where all future floating cash flows are projected and both floating and fixed cash flows are discounted to the valuation date. The curve utilized for discounting and projecting is built by obtaining publicly available third party market quotes. As of March 31, 2017, the bank has categorized its interest rate swap and related loan as follows:
| | | Level 1 | | | Level 2 | | | Level 3 | | | | | |
March 31, 2017 | | inputs | | | inputs | | | inputs | | | Total | |
| | | | | | | | | | | | | | | | | |
Loans - Commercial real estate loan | | $ | - | | | $ | 3,201,691 | | | $ | - | | | $ | 3,201,691 | |
Derivative - Interest rate swap designated as fair value hedge | | | - | | | | (26,647 | ) | | | - | | | | (26,647 | ) |
Derivatives - Interest rate swaps designated as cash flow hedge | | | - | | | | (83,634 | ) | | | - | | | | (83,634 | ) |
| | | Level 1 | | | Level 2 | | | Level 3 | | | | | |
March 31, 2016 | | inputs | | | inputs | | | inputs | | | Total | |
| | | | | | | | | | | | | | | | | |
Loans - Commercial real estate loan | | $ | - | | | $ | 3,462,417 | | | $ | - | | | $ | 3,462,417 | |
Derivative - Interest rate swap designated as fair value hedge | | | - | | | | (207,511 | ) | | | - | | | | (207,511 | ) |
The following table presents the valuation and unobservable inputs for Level 3 assets measured at fair value on a recurring basis at December 31, 2017:
| | | | | | Valuation | | Unobservable | | Range of | |
Description | | Fair Value | | Methodology | | Inputs | | Inputs | |
| | | | | | | | | | | | | | |
Investment securities | | $ | 1,930,786 | | 3rd party valuation | | Discount to reflect current market conditions | | | 0.00% | - | 10.00% | |
The following table presents a reconciliation of the investments which are measured at fair value on a recurring basis using significant unobservable inputs (Level 3) for the periods presented:
| | | March 31, 2017 | | | March 31, 2016 | |
Balance, beginning of year | | $ | 1,898,640 | | | $ | - | |
| | | | | | | | | |
Transfers in: | | | | | | | | |
Municipal bonds | | | 1,928,313 | | | | - | |
Mortgage-backed securities | | | 2,473 | | | | - | |
Corporate bonds | | | - | | | | 1,898,640 | |
| | | | | | | | | |
Transfers out: | | | | | | | | |
Corporate bonds | | | 1,898,640 | | | | - | |
| | | | | | | | | |
Balance, end of year | | $ | 1,930,786 | | | $ | 1,898,640 | |
Fair value measurements on a nonrecurring basis
Impaired Loans - The Bank has measured impairment generally based on the fair value of the loan's collateral. Fair value is generally determined based upon independent appraisals of the properties, or discounted cash flows based upon the expected proceeds. These assets are included as Level 3 fair values. At March 31, 2017 and 2016, the fair values consist of loan balances of $5,657,048and $7,438,106 that have been written down by $285,359and $59,571, respectively, as a result of specific loan loss allowances.
Foreclosed real estate – The Bank's foreclosed real estate is measured at the lower of carrying value or fair value less estimated cost to sell. At March 31, 2017 and 2016, the fair value of foreclosed real estate was estimated to be $503,094 and $443,015, respectively. Fair value was determined based on offers and/or appraisals. Cost to sell the assets was based on standard market factors. The Company has categorized its foreclosed assets as Level 3.
HAMILTON BANCORP, INC AND SUBSIDIARY
Notes to Consolidated Financial Statements (Continued)
Premises and equipment held for sale – The Bank’s premises and equipment held for sale is measured at the fair value less estimated cost to sell. The assets in fiscal 2017 and 2016 were acquired in the acquisition of Fraternity and Fairmount, respectively. As of March 31, 2017 and 2016, the fair value of premises and equipment held for sale was estimated to be $547,884 and $405,000 accordingly. Fair value was determined based upon appraisals and the cost to sell these assets was determined using standard market factors. The Company has categorized its premises and equipment held for sale as Level 3.
Loans held for sale – The Bank’s loans held for sale are carried at the lower of aggregate cost or estimated fair value less costs to sell in the secondary market. Fair value of loans held for sale is based upon outstanding investor commitments or, in the absence of such commitments, based on current investor yield requirements or third party pricing models and are considered Level 2.
| | | Level 1 | | | Level 2 | | | Level 3 | | | | | |
| March 31, 2017 | | inputs | | | inputs | | | inputs | | | Total | |
| | | | | | | | | | | | | | | | | |
Impaired loans | | $ | - | | | $ | - | | | $ | 5,371,689 | | | $ | 5,371,689 | |
Foreclosed real estate | | | - | | | | - | | | | 503,094 | | | | 503,094 | |
Premises and equipment held for sale | | | - | | | | - | | | | 547,884 | | | | 547,884 | |
Loans held for sale | | | - | | | | - | | | | - | | | | - | |
| | | Level 1 | | | Level 2 | | | Level 3 | | | | | |
| March 31, 2016 | | inputs | | | inputs | | | inputs | | | Total | |
| | | | | | | | | | | | | | | | | |
Impaired loans | | $ | - | | | $ | - | | | $ | 7,378,535 | | | $ | 7,378,535 | |
Foreclosed real estate | | | - | | | | - | | | | 443,015 | | | | 443,015 | |
Premises and equipment held for sale | | | - | | | | - | | | | 405,000 | | | | 405,000 | |
Loans held for sale | | | - | | | | 266,176 | | | | - | | | | 266,176 | |
The following table presents the valuation and unobservable inputs for Level 3 assets measured at fair value on a nonrecurring basis at March 31, 2017:
| | | | | | Valuation | | Unobservable | | Range of | |
Description | | Fair Value | | Methodology | | Inputs | | Inputs | |
| | | | | | | | | | | | | | |
Impaired loans, net of allowance | | $ | 5,371,689 | | Appraised value | | Discount to reflect current market conditions | | | 0.00% | - | 25.00% | |
| | | | | | Discounted cash flows | | Discount rates | | | 2.63% | - | 7.25% | |
| | | | | | | | | | | | | | |
Foreclosed real estate | | $ | 503,094 | | Appraised value | | Discount to reflect current market conditions | | | 0.00% | - | 25.00% | |
| | | | | | | | | | | | | | |
Premises and equipment held for sale | | $ | 547,844 | | Appraised Value | | Discount to reflect current market conditions | | | 0.00% | - | 10.00% | |
HAMILTON BANCORP, INC AND SUBSIDIARY
Notes to Consolidated Financial Statements (Continued)
The following table summarizes changes in foreclosed real estate for the years ended March 31, 2017 and 2016, which is measured on a nonrecurring basis using significant unobservable, level 3, inputs:
| | | Year Ended March 31, | |
| | | 2017 | | | 2016 | |
Balance, March 31, 2016 | | $ | 443,015 | | | $ | 455,575 | |
Transfer to foreclosed real estate | | | 126,575 | | | | - | |
Foreclosed real estate acquired in acquisition | | | - | | | | 20,000 | |
Proceeds from sale of foreclosed real estate | | | (60,258 | ) | | | (31,752 | ) |
Loss on sale of foreclosed real estate | | | (6,238 | ) | | | (808 | ) |
Write down of foreclosed real estate | | | - | | | | - | |
Balance, March 31, 2017 | | $ | 503,094 | | | $ | 443,015 | |
The remaining financial assets and liabilities are not reported on the balance sheets at fair value on a recurring basis. The calculation of estimated fair values is based on market conditions at a specific point in time and may not reflect current or future fair values.
| | | March 31, 2017 | | | March 31, 2016 | |
| | | Carrying | | | Fair | | | Carrying | | | Fair | |
| | | amount | | | value | | | amount | | | value | |
Financial assets | | | | | | | | | | | | | | | | |
Level 1 inputs | | | | | | | | | | | | | | | | |
Cash and cash equivalents | | $ | 29,353,921 | | | $ | 29,353,921 | | | $ | 67,448,536 | | | $ | 67,448,536 | |
| | | | | | | | | | | | | | | | | |
Level 2 inputs | | | | | | | | | | | | | | | | |
Loans held for sale | | | - | | | | - | | | | 259,450 | | | | 266,176 | |
Federal Home Loan Bank stock | | | 2,020,200 | | | | 2,020,200 | | | | 1,042,500 | | | | 1,042,500 | |
Bank-owned life insurance | | | 18,253,348 | | | | 18,253,348 | | | | 12,709,908 | | | | 12,709,908 | |
| | | | | | | | | | | | | | | | | |
Level 3 inputs | | | | | | | | | | | | | | | | |
Certificates of deposit held as investment | | | 499,280 | | | | 505,641 | | | | 3,968,229 | | | | 3,911,474 | |
Loans receivable, net of unearned income | | | 335,678,292 | | | | 337,183,808 | | | | 218,604,150 | | | | 220,671,409 | |
| | | | | | | | | | | | | | | | | |
Financial liabilities | | | | | | | | | | | | | | | | |
Level 3 inputs | | | | | | | | | | | | | | | | |
Deposits | | | 412,855,774 | | | | 413,148,503 | | | | 313,993,651 | | | | 314,095,055 | |
Advance payments by borrowers fortaxes and insurance | | | 1,868,110 | | | | 1,868,110 | | | | 1,079,794 | | | | 1,079,794 | |
Borrowings | | | 36,124,899 | | | | 36,697,631 | | | | 14,805,237 | | | | 15,146,307 | |
The fair values of cash and cash equivalents and advances by borrowers for taxes and insurance are estimated to equal the carrying amount.
The fair value of loans held for sale is based on commitments from investors.
The fair values of Federal Home Loan Bank stock and bank-owned life insurance are estimated to equal carrying amounts, which are based on repurchase prices of the FHLB stock and the insurance company.
The fair value of fixed-rate loans is estimated to be the present value of scheduled payments discounted using interest rates currently in effect. The fair value of variable-rate loans, including loans with a demand feature, is estimated to equal the carrying amount. The valuation of loans is adjusted for estimated loan losses.
The fair value of certificates of deposit held as investments is estimated based on interest rates currently offered for certificates of deposit with similar remaining maturities.
HAMILTON BANCORP, INC AND SUBSIDIARY
Notes to Consolidated Financial Statements (Continued)
The fair value of interest-bearing checking, savings, and money market deposit accounts is equal to the carrying amount. The fair value of fixed-maturity time deposits is estimated based on interest rates currently offered for deposits of similar remaining maturities.
The fair value of borrowings is estimated based on interest rates currently offered for borrowings of similar remaining maturities.
The fair value of outstanding loan commitments and unused lines of credit are considered to be the same as the contractual amounts, and are not included in the table above. These commitments generate fees that approximate those currently charged to originate similar commitments.
Note 20: Condensed Financial Statements of Parent Company
Presented below are the condensed statements of financial condition as of March 31, 2017 and 2016, and the related condensed statements of operations and condensed statements of cash flows for Hamilton Bancorp, Inc. for the years ended March 31, 2017 and 2016.
Condensed Statements of Financial Condition | |
| | | | | | | | | |
| | | March 31, 2017 | | | March 31, 2016 | |
| | | | | | | | | |
Assets | | | | | | | | |
Cash and due from bank | | $ | 3,250,700 | | | $ | 5,725,430 | |
Investment securities available-for-sale | | | 2,016,730 | | | | 1,000,250 | |
Loans and leases, net of unearned income | | | 479,473 | | | | 632,786 | |
ESOP loan receivable | | | 2,332,992 | | | | 2,449,810 | |
Investment in bank subsidiary | | | 51,487,261 | | | | 51,548,080 | |
Other assets | | | 224,074 | | | | 214,581 | |
Total Assets | | $ | 59,791,230 | | | $ | 61,570,937 | |
| | | | | | | | | |
Liabilities | | $ | - | | | $ | 26,354 | |
| | | | | | | | | |
Shareholders' Equity | | | | | | | | |
Common stock | | | 34,111 | | | | 34,136 | |
Additional paid in capital | | | 31,656,235 | | | | 31,242,731 | |
Retained earnings | | | 31,730,673 | | | | 32,659,455 | |
Unearned ESOP shares | | | (2,221,800 | ) | | | (2,369,920 | ) |
Accumulated other comprehensive loss | | | (1,407,989 | ) | | | (21,819 | ) |
Total Shareholders' Equity | | | 59,791,230 | | | | 61,544,583 | |
Total Liabilities and Shareholders' Equity | | $ | 59,791,230 | | | $ | 61,570,937 | |
HAMILTON BANCORP, INC AND SUBSIDIARY
Notes to Consolidated Financial Statements (Continued)
| Condensed Statements of Operations | |
| | | | | | | |
| | | March 31, 2017 | | | March 31, 2016 | |
Interest revenue | | | | | | | | |
Interest on loans, including fees | | $ | 30,464 | | | $ | 16,086 | |
Interest on bank deposits | | | 5,307 | | | | 7,139 | |
Interest on investments | | | 18,932 | | | | 22,500 | |
Interest on ESOP loan | | | 87,710 | | | | 82,432 | |
Total interest revenue | | | 142,413 | | | | 128,157 | |
| | | | | | | | | |
Noninterest expenses | | | | | | | | |
Legal | | | 25,232 | | | | 48,866 | |
Other professional services | | | 587 | | | | 43,285 | |
Merger related expenses | | | 219,417 | | | | 891,378 | |
Other operating | | | 171,516 | | | | 232,680 | |
Total noninterest expenses | | | 416,752 | | | | 1,216,209 | |
| | | | | | | | | |
Loss before income tax benefit and equity in net loss of bank subsidiary | | | (274,339 | ) | | | (1,088,052 | ) |
Income tax benefit | | | (16,013 | ) | | | (66,869 | ) |
Loss before equity in net loss of bank subsidiary | | | (258,326 | ) | | | (1,021,183 | ) |
| | | | | | | | | |
Equity in net (loss) income of bank subsidiary | | | (670,456 | ) | | | 928,567 | |
| | | | | | | | | |
Net loss | | $ | (928,782 | ) | | $ | (92,616 | ) |
HAMILTON BANCORP, INC AND SUBSIDIARY
Notes to Consolidated Financial Statements (Continued)
| Condensed Statements of Cash Flows | |
| | | March 31, 2017 | | | March 31, 2016 | |
| | | | | | | | | |
Cash flows from operating activities: | | | | | | | | |
Net loss | | $ | (928,782 | ) | | $ | (92,616 | ) |
Adjustments to reconcile net loss to net cash used by operating activities: | | | | | | | | |
Equity in undistributed net (loss) income of subsidiary | | | 670,456 | | | | (928,567 | ) |
Amortization of premium on investment securities | | | 4,707 | | | | - | |
Increase in other assets | | | (9,593 | ) | | | (96,962 | ) |
Decrease in other liabilities | | | (23,976 | ) | | | (51,458 | ) |
| | | | | | | | | |
Net cash used by operating activities | | | (287,188 | ) | | | (1,169,603 | ) |
| | | | | | | | | |
Cash flows from investing activities: | | | | | | | | |
Acquistion, net of cash acquired | | | (22,430,749 | ) | | | (13,804,370 | ) |
Principal collected on ESOP loan | | | 116,819 | | | | 115,409 | |
Principal repayments on loans | | | 153,313 | | | | 23,146 | |
Proceeds from maturing and called certificates of deposit | | | - | | | | 264,510 | |
Proceeds from maturing and called securitiesavailable for sale, including principal pay downs | | | 1,000,000 | | | | - | |
Purchase of investment securities available-for-sale | | | (2,026,900 | ) | | | - | |
| | | | | | | | | |
Net cash used by investing activities | | | (23,187,517 | ) | | | (13,401,305 | ) |
| | | | | | | | | |
Cash flows from financing activities: | | | | | | | | |
Dividend from Bank subsidiary | | | 24,000,000 | | | | 10,000,000 | |
Dividend to Bank subsidiary | | | (3,000,000 | ) | | | - | |
Issuance of restricted stock | | | 20 | | | | - | |
Redemption of restricted stock | | | (45 | ) | | | - | |
| | | | | | | | | |
Net cash provided by financing activities | | | 20,999,975 | | | | 10,000,000 | |
| | | | | | | | | |
Net decrease in cash and cash equivalents | | | (2,474,730 | ) | | | (4,570,908 | ) |
Cash and cash equivalents at beginning of period | | | 5,725,430 | | | | 10,296,338 | |
Cash and cash equivalents at end of period | | $ | 3,250,700 | | | $ | 5,725,430 | |
F-51