UNITED STATES
SECURITIES AND EXCHANGE COMMISSION
Washington, D.C. 20549
FORM N-CSR
CERTIFIED SHAREHOLDER REPORT OF REGISTERED
MANAGEMENT INVESTMENT COMPANIES
Investment Company Act file number 811-22801
Franklin ETF Trust
(Exact name of registrant as specified in charter)
One Franklin Parkway
San Mateo, CA 94403-1906
(Address of principal executive offices) (Zip code)
Alison Baur
One Franklin Parkway
San Mateo, CA 94403-1096
(Name and address of agent for service)
Registrant’s telephone number, including area code: 650-312-2000
Date of fiscal year end: March 31
Date of reporting period: 03/31/2023
| Item 1. | Reports to Stockholders. |
| | (a) | The following is a copy of the report transmitted to shareholders pursuant to Rule30e-1 under the Investment Company Act of 1940, as amended (the “1940 Act”) (17 CFR 270.30e-1.) |
ANNUAL REPORT
FRANKLIN SHORT DURATION U.S. GOVERNMENT ETF
Formerly, Franklin Liberty Short Duration U.S. Government ETF
A Series of Franklin ETF Trust
March 31, 2023


Visit franklintempleton.com for fund
updates and documents, or to find helpful
financial planning tools.
| | | | | | | | |
| Not FDIC Insured | | | | | May Lose Value | | | | | No Bank Guarantee |
| | | | | | | | | | |
| | | | | | |
| franklintempleton.com | | Annual Report | | | | | | | | 1 |
ANNUAL REPORT
Franklin Short Duration U.S. Government ETF
Formerly, Franklin Liberty Short Duration U.S. Government ETF
This annual report for Franklin Short Duration U.S. Government ETF covers the fiscal year ended March 31, 2023.
Your Fund’s Goal and Main Investments
The Fund seeks to provide a high level of current income as is consistent with prudent investing, while seeking preservation of capital, by normally investing at least 80% of its net assets in securities issued or guaranteed by the U.S. government, its agencies or instrumentalities.1 The Fund currently targets an estimated portfolio duration of three years or less.
Performance Overview
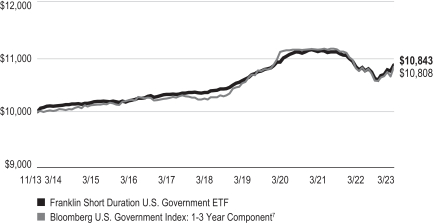
For the 12 months under review, the Fund posted cumulative total returns of +0.18% based on market price and +0.24% based on net asset value. In comparison, the Bloomberg U.S. Government Index: 1-3 Year Component, which includes U.S. dollar-denominated, fixed-rate, nominal U.S. Treasuries and U.S. agency debentures with at least one year up to, but not including, three years to final maturity, posted a +0.23% cumulative total return for the same period.2 You can find more of the Fund’s performance data in the Performance Summary beginning on page 4.
Performance data represent past performance, which does not guarantee future results. Investment return and principal value will fluctuate, and you may have a gain or loss when you sell your shares. Current performance may differ from figures shown. For most recent month-end performance, go to franklintempleton.com or call (800) 342-5236.
Economic and Market Overview
The U.S. bond market, as measured by the Bloomberg U.S. Aggregate Bond Index, posted a -4.78% total return for the 12-month period ended March 31, 2023.2 High inflation amid a strong labor market led to significantly tighter monetary policy, reducing the value of most bonds. While interest rates increased along the yield curve for all U.S. Treasury maturities, relatively large increases in shorter-term interest rates
| | | | |
| Portfolio Composition* | | | |
| |
| 3/31/23 | | | |
| |
| | | % of Total
Net Assets | |
MBS ARMs | | | 44.4% | |
MBS Fixed Rate | | | 25.1% | |
U.S. Treasuries | | | 31.0% | |
U.S. Agencies | | | 3.3% | |
Short-Term Investments & Other Net Assets | | | -3.8% | |
*Figures reflect certain derivatives held in the portfolio (or their underlying reference assets) and may not total 100% or may be negative due to rounding, use of any derivatives, unsettled trades or other factors.
led the yield curve to invert during the period as investors became increasingly concerned about the economic outlook.
In an effort to control inflation, the U.S. Federal Reserve (Fed) raised the federal funds target rate at each of its eight meetings during the period to end at a range of 4.75%–5.00%, a full 450 basis points higher than at the beginning of the period. The Fed noted in its March 2023 meeting that inflation remained elevated amid robust job growth and low unemployment. Despite its goal of 2% long-run inflation, the Fed softened its firm outlook on future rate hikes. Furthermore, the Fed indicated it would continue to reduce its U.S. Treasury (UST) and agency debt and mortgage-backed security holdings.
UST bonds, as measured by the Bloomberg U.S. Treasury Index, posted a -4.51% total return for the 12-month period.2 The 10-year UST yield, which moves inversely to price, increased sharply amid high inflation and the Fed’s tightening monetary stance. Mortgage-backed securities (MBS), as measured by the Bloomberg U.S. MBS Fixed Rate Index, posted a -4.85% total return for the period as mortgage rates rose to the highest level in over two decades and modest prepayment rates led to increasing interest-rate sensitivity.2
Corporate bond prices also declined, constrained by inflation, rising interest rates and concerns about the impact of
1. Some securities owned by the Fund, but not shares of the Fund, are guaranteed by the U.S. government, its agencies or instrumentalities as to timely payment of principal and interest. The Fund’s net asset value, trading price and yield are not guaranteed and will fluctuate with market conditions. Please see the Fund’s prospectus for the level of credit support offered by government agency or instrumentality issues.
2. Source: Morningstar. Treasuries, if held to maturity, offer a fixed rate of return and a fixed principal value; their interest payments and principal are guaranteed.
The index is unmanaged and includes reinvestment of any income or distributions. It does not reflect any fees, expenses or sales charges. One cannot invest directly in an index, and an index is not representative of the Fund’s portfolio.
See www.franklintempletondatasources.com for additional data provider information.
The dollar value, number of shares or principal amount, and names of all portfolio holdings are listed in the Fund’s Schedule of Investments (SOI). The SOI begins on page 9.
| | | | | | | | | | |
| | | | | | |
| 2 | | | | | | | | Annual Report | | franklintempleton.com |
FRANKLIN SHORT DURATION U.S. GOVERNMENT ETF
elevated interest rates on corporate borrowing costs and the wider economy. In this environment, high-yield corporate bonds, as represented by the Bloomberg U.S. Corporate High Yield Index, posted a -3.34% total return, while investment-grade corporate bonds, as represented by the Bloomberg U.S. Corporate Investment Grade Index, posted a -5.55% total return.2
Investment Strategy
Under normal market conditions, the Fund invests at least 80% of its net assets in securities issued or guaranteed by the U.S. government, its agencies, or instrumentalities. The Fund currently targets an estimated portfolio duration of three years or less. The Fund generally invests 50%–80% of its assets in mortgage securities issued or guaranteed by the U.S. government, its agencies, or instrumentalities, including adjustable-rate mortgage securities (ARMs) and collateralized mortgage obligations (CMOs). The Fund also invests in direct U.S. government obligations (such as Treasury bonds, bills and notes) and in securities issued or guaranteed by the U.S. government, its agencies or instrumentalities, including government-sponsored entities. All of the Fund’s principal investments are debt securities, including bonds, notes and debentures. To pursue its investment goal, the Fund may invest in certain interest rate-related derivatives, principally U.S. Treasury futures contracts and options on interest rate/bond futures. The use of these derivatives may allow the Fund to obtain net long or short exposures to selected interest rates or durations. These derivatives may be used to hedge risks associated with the Fund’s other portfolio investments and to manage the duration of the Fund’s portfolio. The Fund is an actively managed exchange-traded fund (ETF) that does not seek to replicate the performance of a specified index. The Fund may have a higher degree of portfolio turnover than funds that seek to replicate the performance of an index.
Manager’s Discussion
Over the previous 12 months, the U.S. economic story was one of inflation, Fed action, and volatility. Inflation became a large issue as the year-over-year change in the Consumer Price Index (CPI) pushed higher into the summer months, reaching 9.1% in June 2022, the highest level since 1981, before trending lower. The U.S. job market also showed strong resilience with a monthly average of 362,000 jobs created during the 12-month period under review. The unemployment rate fell to 3.4% in January 2023, the lowest level since 1969.
The Fed was slow to act on inflation and considered the rapid price increases to be “transitory.” The Fed capitulated and initiated a program of rapid rate increases at a pace not seen
since the 1980s. Over the period under review, the Fed raised its policy rate by a total of 4.50%, taking it to a restrictive level of 4.75%–5.00%. U.S. Treasury (UST) yields rose over the period, with the benchmark 10-year UST rising 113 basis points. March 2023 saw significant volatility across fixed income markets as turmoil in the global banking sector led to a strong risk-off shift in sentiment.
During the period, agency MBS spreads widened as the Fed continued to allow its holdings to roll off its balance sheet, forcing money managers to absorb most of the excess supply demanding higher spreads. Additionally, the vast majority of the MBS universe became unattractive for refinancing, slowing prepayment levels and extending duration.
The Fund’s yield curve exposure was the primary contributor to outperformance versus the benchmark. The Fund was positioned with less duration than the benchmark overall, especially on the two-year part of the curve. The Fund’s exposure to MBS was the largest negative contributor to performance as spreads widened. The Fund’s exposure to agency ARMs and agency CMOs also detracted from performance as spreads in the sectors widened in sympathy with MBS spreads.
The Fund invested in USTs, agency debentures, agency mortgage pass-through securities and other U.S. government-related bonds and cash investments. We looked for valuations we considered attractive within lower interest-rate risk government bond markets with a focus on high current income. We used UST futures and options on UST futures for duration and convexity management.
Thank you for your participation in Franklin Short Duration U.S. Government ETF. We look forward to serving your future investment needs.
Patrick Klein, Ph.D.
Paul Varunok
Neil Dhruv
Portfolio Management Team
The foregoing information reflects our analysis, opinions and portfolio holdings as of March 31, 2023, the end of the reporting period. The way we implement our main investment strategies and the resulting portfolio holdings may change depending on factors such as market and economic conditions. These opinions may not be relied upon as investment advice or an offer for a particular security. The information is not a complete analysis of every aspect of any market, country, industry, security or the Fund. Statements of fact are from sources considered reliable, but the investment manager makes no representation or warranty as to their completeness or accuracy. Although historical performance is no guarantee of future results, these insights may help you understand our investment management philosophy.
| | | | | | | | | | |
| | | | | | |
| franklintempleton.com | | Annual Report | | | | | | | | 3 |
FRANKLIN SHORT DURATION U.S. GOVERNMENT ETF
Performance Summary as of March 31, 2023
Total return reflects reinvestment of the Fund’s dividends and capital gain distributions, if any, and any unrealized gains or losses. Total returns do not include brokerage commissions that may be payable on secondary market transactions. The performance tables and graph do not reflect any taxes that a shareholder would pay on Fund dividends, capital gain distributions, if any, or any realized gains on the sale of Fund shares.
Net asset value or “NAV” is the value of one share of a fund as calculated in accordance with the standard formula for valuing fund shares. The price used to calculate market return (Market Price) is determined by using the midpoint between the highest bid and the lowest offer on the primary stock exchange on which shares of a fund are listed for trading, as of the time that such fund’s NAV is calculated. Since shares of the Fund did not trade in the secondary market until after the Fund’s inception, for the period from inception to the first day of secondary trading (11/6/13), the NAV of the Fund is used as a proxy for the Market Price to calculate market returns. Market and NAV returns assume that dividends and capital gain distributions have been reinvested at Market Price and NAV.
Your dividend income will vary depending on dividends or interest paid by securities in the Fund’s portfolio, adjusted for operating expenses. Capital gain distributions are net profits realized from the sale of portfolio securities.
Performance as of 3/31/231
| | | | | | | | | | | | | | | | |
| | |
| | | Cumulative Total Return2 | | | Average Annual Total Return2 | |
| | | Based on
NAV3 | | | Based on
market price4 | | | Based on
NAV3 | | | Based on
market price4 | |
1-Year | | | +0.24% | | | | +0.18% | | | | +0.24% | | | | +0.18% | |
5-Year | | | +4.78% | | | | +4.64% | | | | +0.94% | | | | +0.91% | |
Since Inception (11/4/13) | | | +8.42% | | | | +8.00% | | | | +0.86% | | | | +0.82% | |
| | | | |
| Distribution Rate5 | | 30-Day Standardized Yield6 | |
3.56% | | | 3.90% | |
Performance data represent past performance, which does not guarantee future results. Investment return and principal value will fluctuate, and you may have a gain or loss when you sell your shares. Current performance may differ from figures shown. For most recent month-end performance, go to franklintempleton.com or call (800) 342-5236.
See page 6 for Performance Summary footnotes
| | | | | | | | | | |
| | | | | | |
| 4 | | | | | | | | Annual Report | | franklintempleton.com |
FRANKLIN SHORT DURATION U.S. GOVERNMENT ETF
PERFORMANCE SUMMARY
Total Return Index Comparison for a Hypothetical $10,000 Investment1
Total return is calculated at net asset value and represents the change in value of an investment over the periods shown. It includes any Fund fees and expenses, and reinvested distributions. The unmanaged index includes reinvestment of any income or distributions. It differs from the Fund in composition and does not pay management fees or expenses. One cannot invest directly in an index.
11/4/13–3/31/23
See page 6 for Performance Summary footnotes
| | | | | | | | | | |
| | | | | | |
| franklintempleton.com | | Annual Report | | | | | | | | 5 |
FRANKLIN SHORT DURATION U.S. GOVERNMENT ETF
PERFORMANCE SUMMARY
Distributions (4/1/22–3/31/23)
|
|
Net Investment
Income |
$1.91452 |
Total Annual Operating Expenses8
All investments involve risks, including possible loss of principal. Interest rate movements, unscheduled mortgage prepayments and other risk factors will affect the Fund’s share price and yield. Bond prices, and thus a fund’s share price, generally move in the opposite direction of interest rates. Therefore, as the prices of bonds in the Fund adjust to a rise in interest rates, the Fund’s share price may decline. Changes in the financial strength of a bond issuer or in a bond’s credit rating may affect its value. Events such as the spread of deadly diseases, disasters, and financial, political or social disruptions, may heighten risks and adversely affect performance. The Fund’s prospectus also includes a discussion of the main investment risks.
ETFs trade like stocks, fluctuate in market value and may trade at prices above or below their net asset value. Brokerage commissions and ETF expenses will reduce returns.
1. Gross expenses are the Fund’s total annual operating expenses as of the Fund’s prospectus available at the time of publication. Net expenses are capped under a contractual agreement, which cannot be terminated prior to 7/31/23 without Board consent. Actual expenses may be higher and may impact portfolio returns.
2. Total return calculations represent the cumulative and average annual changes in value of an investment over the periods indicated. Return for less than one year, if any, has not been annualized.
3. Assumes reinvestment of distributions based on net asset value.
4. Assumes reinvestment of distributions based on market price.
5. Distribution rate is based on an annualization of the 23.8920 cent per share March dividend and the NAV of $90.45 per share on 3/31/23.
6. The Fund’s 30-day standardized yield is calculated over a trailing 30-day period using the yield to maturity on bonds and/or the dividends accrued on stocks. It may not equal the Fund’s actual income distribution rate, which reflects the Fund’s past dividends paid to shareholders.
7. Source: FactSet. The Bloomberg U.S. Government Index: 1-3 Year Component includes U.S. dollar-denominated, fixed-rate, nominal U.S. Treasuries and U.S. agency debentures (securities issued by U.S. government-owned or government-sponsored entities, and debt explicitly guaranteed by the U.S. government) with at least one year up to, but not including, three years to final maturity.
8. Figures are as stated in the Fund’s current prospectus and may differ from the expense ratios disclosed in the Your Fund’s Expenses and Financial Highlights sections in this report. In periods of market volatility, assets may decline significantly, causing total annual Fund operating expenses to become higher than the figures shown.
See www.franklintempletondatasources.com for additional data provider information.
| | | | | | | | | | |
| | | | | | |
| 6 | | | | | | | | Annual Report | | franklintempleton.com |
FRANKLIN SHORT DURATION U.S. GOVERNMENT ETF
Your Fund’s Expenses
As a Fund shareholder, you can incur two types of costs: (1) transaction costs, including brokerage commissions on purchases and sales of Fund shares; and (2) ongoing Fund costs, including management fees and other Fund expenses. All funds have ongoing costs, sometimes referred to as operating expenses. The table below shows ongoing costs of investing in the Fund and can help you understand these costs and compare them with those of other funds. The table assumes a $1,000 investment held for the six months indicated.
Actual Fund Expenses
The table below provides information about actual account values and actual expenses in the columns under the heading “Actual.” In these columns the Fund’s actual return, which includes the effect of Fund expenses, is used to calculate the “Ending Account Value.” You can estimate the expenses you paid during the period by following these steps (of course, your account value and expenses will differ from those in this illustration): Divide your account value by $1,000 (if your account had an $8,600 value, then $8,600 ÷ $1,000 = 8.6). Then multiply the result by the number in the row under the headings “Actual” and “Expenses Paid During Period” (if Actual Expenses Paid During Period were $7.50, then 8.6 x $7.50 = $64.50). In this illustration, the actual expenses paid this period are $64.50.
Hypothetical Example for Comparison with Other Funds
Under the heading “Hypothetical” in the table, information is provided about hypothetical account values and hypothetical expenses based on the Fund’s actual expense ratio and an assumed rate of return of 5% per year before expenses, which is not the Fund’s actual return. This information may not be used to estimate the actual ending account balance or expenses you paid for the period, but it can help you compare ongoing costs of investing in the Fund with those of other funds. To do so, compare this 5% hypothetical example with the 5% hypothetical examples that appear in the shareholder reports of other funds.
Please note that expenses shown in the table are meant to highlight ongoing costs and do not reflect any transactional costs. Therefore, information under the heading “Hypothetical” is useful in comparing ongoing costs only, and will not help you compare total costs of owning different funds. In addition, if transactional costs were included, your total costs would have been higher.
| | | | | | | | | | | | | | | | | | | | | | |
| | | | Actual (actual return after expenses) | | | Hypothetical (5% annual return before expenses) | | | | |
| | | | | |
Beginning
Account
Value 10/1/22 | | | Ending
Account
Value 3/31/23 | | | Expenses
Paid During
Period 10/1/22–3/31/231,2 | | | Ending
Account
Value 3/31/23 | | | Expenses
Paid During
Period 10/1/22–3/31/231,2 | | | Net Annualized
Expense Ratio2 | |
| | $1,000 | | | $ | 1,023.04 | | | $ | 1.21 | | | $ | 1,023.73 | | | $ | 1.21 | | | | 0.24 | % |
1. Expenses are equal to the annualized expense ratio for the six-month period as indicated above—in the far right column—multiplied by the simple average account value over the period indicated, and then multiplied by 182/365 to reflect the one-half year period.
2. Reflects expenses after fee waivers and expense reimbursements. Does not include acquired fund fees and expenses.
| | | | | | | | | | |
| | | | | | |
| franklintempleton.com | | Annual Report | | | | | | | | 7 |
FRANKLIN ETF TRUST
Financial Highlights
Franklin Short Duration U.S. Government ETF
| | | | | | | | | | | | | | | | | | | | |
| |
| | | Year Ended March 31, | |
| | | | | |
| | | 2023 | | | 2022 | | | 2021 | | | 2020 | | | 2019 | |
| | | | | |
Per share operating performance
(for a share outstanding throughout the year) | | | | | | | | | | | | | | | | | | | | |
| | | | | |
Net asset value, beginning of year | | $ | 92.17 | | | $ | 95.24 | | | $ | 94.84 | | | $ | 94.40 | | | $ | 95.18 | |
| | | | |
| | | | | |
| Income from investment operationsa: | | | | | | | | | | | | | | | | | | | | |
| | | | | |
Net investment incomeb | | | 1.65 | | | | 0.41 | | | | 0.79 | | | | 2.11 | | | | 1.95 | |
| | | | | |
Net realized and unrealized gains (losses) | | | (1.46 | ) | | | (2.72 | ) | | | 0.89 | | | | 0.85 | | | | (0.03 | ) |
| | | | |
| | | | | |
Total from investment operations | | | 0.19 | | | | (2.31 | ) | | | 1.68 | | | | 2.96 | | | | 1.92 | |
| | | | |
| | | | | |
| Less distributions from: | | | | | | | | | | | | | | | | | | | | |
| | | | | |
Net investment income | | | (1.91 | ) | | | (0.76 | ) | | | (1.28 | ) | | | (2.52 | ) | | | (2.70 | ) |
| | | | |
| | | | | |
Net asset value, end of year | | $ | 90.45 | | | $ | 92.17 | | | $ | 95.24 | | | $ | 94.84 | | | $ | 94.40 | |
| | | | |
| | | | | |
Total returnc | | | 0.24% | | | | (2.45)% | | | | 1.77% | | | | 3.18% | | | | 2.04% | |
| | | | | |
| Ratios to average net assets | | | | | | | | | | | | | | | | | | | | |
| | | | | |
Expenses before waiver and payments by affiliates | | | 0.25% | | | | 0.30% | | | | 0.37% | | | | 0.43% | | | | 0.44% | |
| | | | | |
Expenses net of waiver and payments by affiliates | | | 0.24% | | | | 0.25% | d | | | 0.24% | | | | 0.23% | | | | 0.25% | d |
| | | | | |
Net investment income | | | 1.82% | | | | 0.43% | | | | 0.82% | | | | 2.23% | | | | 2.06% | |
| | | | | |
| Supplemental data | | | | | | | | | | | | | | | | | | | | |
| | | | | |
Net assets, end of year (000’s) | | | $203,612 | | | | $359,566 | | | | $435,827 | | | | $187,395 | | | | $125,177 | |
| | | | | |
Portfolio turnover ratee | | | 196.59% | | | | 156.78% | | | | 210.16% | | | | 169.35% | | | | 104.49% | |
| | | | | |
Portfolio turnover rate excluding mortgage dollar rollse,f | | | 107.64% | | | | 84.03% | | | | 189.55% | | | | 105.08% | | | | 64.69% | |
aThe amount shown for a share outstanding throughout the period may not correlate with the Statement of Operations for the period due to the timing of sales and repurchases of creation unit Fund shares in relation to income earned, adjustments to interest income for the inflation index bonds, and/or fluctuating market value of the investments of the Fund.
bBased on average daily shares outstanding.
cTotal return is calculated assuming an initial investment made at the net asset value at the beginning of the period, reinvestment of all dividends and distributions at net asset value during the period, and redemption at net asset value on the last day of the period.
dBenefit of expense reduction rounds to less than 0.01%.
ePortfolio turnover rate includes portfolio transactions that are executed as a result of the Fund offering and redeeming Creation Units solely for cash (“Cash creations”).
fSee Note 1(d) regarding mortgage dollar rolls.
| | | | | | | | | | |
| | | | | | |
| 8 | | | | | | | | Annual Report | The accompanying notes are an integral part of these financial statements. | | franklintempleton.com |
FRANKLIN ETF TRUST
Schedule of Investments, March 31, 2023
Franklin Short Duration U.S. Government ETF
| | | | | | | | | | |
| | | |
| | | | | Principal Amount | | | Value | |
| | | U.S. Government and Agency Securities 34.3% | | | | | | |
| | Dragon 2012 LLC, secured bond, 1.972%, 3/12/24 | | $ | 9,477 | | | $ | 9,309 | |
| | Export-Import Bank of the U.S., | | | | | | | | |
| | senior secured note, 1.90%, 7/12/24 | | | 826,720 | | | | 809,488 | |
| | secured note, 2.628%, 11/12/26 | | | 1,037,982 | | | | 1,014,859 | |
| a | | KE Export Leasing LLC, 2013-A, secured note, FRN, 5.183%, (3-Month USD LIBOR + 0.23%), 2/28/25 | | | 355,772 | | | | 354,598 | |
| | MSN 41079 and 41084 Ltd., 1.631%, 12/14/24 | | | 797,292 | | | | 772,321 | |
| | Petroleos Mexicanos, 2.378%, 4/15/25 | | | 350,000 | | | | 340,734 | |
| | Reliance Industries Ltd., | | | | | | | | |
| | 2.512%, 1/15/26 | | | 562,500 | | | | 538,794 | |
| | senior secured note, 2.06%, 1/15/26 | | | 750,000 | | | | 713,588 | |
| | U.S. International Development Finance Corp., | | | | | | | | |
| | 2.12%, 3/20/24 | | | 366,667 | | | | 356,989 | |
| | 4.01%, 5/15/30 | | | 1,295,000 | | | | 1,281,584 | |
| | U.S. Treasury Note, | | | | | | | | |
| | 1.25%, 8/31/24 | | | 7,000,000 | | | | 6,704,824 | |
| | 1.75%, 6/30/24 | | | 5,300,000 | | | | 5,129,820 | |
| | 2.75%, 5/15/25 | | | 5,000,000 | | | | 4,870,215 | |
| | 3.00%, 6/30/24 | | | 23,000,000 | | | | 22,595,254 | |
| | 3.125%, 8/15/25 | | | 15,000,000 | | | | 14,722,559 | |
| | 4.50%, 11/15/25 | | | 9,000,000 | | | | 9,134,473 | |
| | Ulani MSN 37894, senior bond, 2.184%, 12/20/24 | | | 608,696 | | | | 592,319 | |
| | | | | | | | | | |
| | Total U.S. Government and Agency Securities (Cost $70,903,929) | | | | | | | 69,941,728 | |
| | | | | | | | | | |
| | | Mortgage-Backed Securities 69.5% | | | | | | |
| b | | Federal Home Loan Mortgage Corp. (FHLMC) Adjustable Rate 33.9% | | | | | | |
| | FHLMC, 2.82%, (12-Month USD LIBOR +/- MBS Margin), 4/01/34 | | | 3,252 | | | | 3,173 | |
| | FHLMC, 3.021%, (12-Month USD LIBOR +/- MBS Margin), 3/01/35 | | | 112,138 | | | | 110,133 | |
| | FHLMC, 3.213%, (12-Month USD LIBOR +/- MBS Margin), 4/01/37 | | | 22,227 | | | | 21,705 | |
| | FHLMC, 3.214%, (12-Month USD LIBOR +/- MBS Margin), 8/01/34 | | | 88,766 | | | | 88,907 | |
| | FHLMC, 3.29%, (12-Month USD LIBOR +/- MBS Margin), 9/01/36 | | | 11,206 | | | | 11,004 | |
| | FHLMC, 3.341%, (12-Month USD LIBOR +/- MBS Margin), 5/01/35 | | | 1,884 | | | | 1,844 | |
| | FHLMC, 3.452%, (12-Month USD LIBOR +/- MBS Margin), 5/01/36 | | | 8,387 | | | | 8,194 | |
| | FHLMC, 3.487%, (12-Month USD LIBOR +/- MBS Margin), 6/01/37 | | | 585 | | | | 572 | |
| | FHLMC, 3.513%, (12-Month USD LIBOR +/- MBS Margin), 2/01/36 | | | 25,983 | | | | 25,534 | |
| | FHLMC, 3.52%, (12-Month USD LIBOR +/- MBS Margin), 4/01/36 | | | 44,243 | | | | 44,379 | |
| | FHLMC, 3.591%, (12-Month USD LIBOR +/- MBS Margin), 10/01/36 | | | 8,195 | | | | 8,147 | |
| | FHLMC, 3.618%, (12-Month USD LIBOR +/- MBS Margin), 12/01/35 | | | 79,584 | | | | 78,363 | |
| | FHLMC, 3.636%, (12-Month USD LIBOR +/- MBS Margin), 1/01/42 | | | 52,153 | | | | 52,623 | |
| | FHLMC, 3.648%, (12-Month USD LIBOR +/- MBS Margin), 1/01/36 | | | 5,941 | | | | 5,986 | |
| | FHLMC, 3.668%, (12-Month USD LIBOR +/- MBS Margin), 11/01/42 | | | 271,245 | | | | 274,316 | |
| | FHLMC, 3.674%, (US 1 Year CMT T-Note +/- MBS Margin), 7/01/33 | | | 23,798 | | | | 24,102 | |
| | FHLMC, 3.709%, (US 1 Year CMT T-Note +/- MBS Margin), 6/01/34 | | | 15,637 | | | | 15,573 | |
| | FHLMC, 3.711%, (US 1 Year CMT T-Note +/- MBS Margin), 7/01/29 | | | 19,011 | | | | 18,700 | |
| | FHLMC, 3.736%, (12-Month USD LIBOR +/- MBS Margin), 9/01/35 | | | 78,932 | | | | 77,783 | |
| | FHLMC, 3.788%, (12-Month USD LIBOR +/- MBS Margin), 3/01/35 | | | 91,685 | | | | 91,469 | |
| | FHLMC, 3.828%, (12-Month USD LIBOR +/- MBS Margin), 3/01/35 | | | 26,198 | | | | 26,500 | |
| | FHLMC, 3.853%, (US 1 Year CMT T-Note +/- MBS Margin), 7/01/35 | | | 213,933 | | | | 218,082 | |
| | FHLMC, 3.853%, (12-Month USD LIBOR +/- MBS Margin), 9/01/37 | | | 369,972 | | | | 375,311 | |
| | FHLMC, 3.855%, (12-Month USD LIBOR +/- MBS Margin), 6/01/37 | | | 34,134 | | | | 33,710 | |
| | FHLMC, 3.861%, (12-Month USD LIBOR +/- MBS Margin), 5/01/35 | | | 141,086 | | | | 143,081 | |
| | FHLMC, 3.876%, (12-Month USD LIBOR +/- MBS Margin), 12/01/36 | | | 24,712 | | | | 24,965 | |
| | FHLMC, 3.877%, (12-Month USD LIBOR +/- MBS Margin), 5/01/42 | | | 344,835 | | | | 349,493 | |
| | FHLMC, 3.882%, (12-Month USD LIBOR +/- MBS Margin), 9/01/36 | | | 687 | | | | 686 | |
| | FHLMC, 3.913%, (12-Month USD LIBOR +/- MBS Margin), 7/01/43 | | | 1,007,664 | | | | 1,022,035 | |
| | FHLMC, 3.914%, (US 1 Year CMT T-Note +/- MBS Margin), 1/01/38 | | | 417,481 | | | | 424,773 | |
| | FHLMC, 3.927%, (US 1 Year CMT T-Note +/- MBS Margin), 9/01/36 | | | 934,199 | | | | 956,982 | |
| | FHLMC, 3.938%, (12-Month USD LIBOR +/- MBS Margin), 9/01/36 | | | 26,223 | | | | 26,653 | |
| | | | | | | | | | |
| | | | | | |
| franklintempleton.com | | Annual Report | | | | | | | | 9 |
FRANKLIN ETF TRUST
SCHEDULE OF INVESTMENTS
Franklin Short Duration U.S. Government ETF (continued)
| | | | | | | | | | |
| | | |
| | | | | Principal Amount | | | Value | |
| | | Mortgage-Backed Securities (continued) | | | | | | |
| b | | Federal Home Loan Mortgage Corp. (FHLMC) Adjustable Rate (continued) | | | | | | |
| | FHLMC, 3.942%, (12-Month USD LIBOR +/- MBS Margin), 1/01/37 | | $ | 6,422 | | | $ | 6,482 | |
| | FHLMC, 3.958%, (12-Month USD LIBOR +/- MBS Margin), 1/01/38 | | | 18,478 | | | | 18,225 | |
| | FHLMC, 3.966%, (US 1 Year CMT T-Note +/- MBS Margin), 11/01/36 | | | 8,015 | | | | 8,210 | |
| | FHLMC, 3.967%, (US 1 Year CMT T-Note +/- MBS Margin), 7/01/36 | | | 22,872 | | | | 23,485 | |
| | FHLMC, 3.975%, (US 1 Year CMT T-Note +/- MBS Margin), 8/01/33 | | | 15,426 | | | | 15,134 | |
| | FHLMC, 3.987%, (12-Month USD LIBOR +/- MBS Margin), 3/01/36 | | | 160,986 | | | | 162,795 | |
| | FHLMC, 3.997%, (12-Month USD LIBOR +/- MBS Margin), 7/01/35 | | | 4,637 | | | | 4,588 | |
| | FHLMC, 4.009%, (12-Month USD LIBOR +/- MBS Margin), 9/01/36 | | | 3,864 | | | | 3,836 | |
| | FHLMC, 4.028%, (US 1 Year CMT T-Note +/- MBS Margin), 3/01/35 | | | 8,006 | | | | 8,187 | |
| | FHLMC, 4.038%, (US 1 Year CMT T-Note +/- MBS Margin), 7/01/37 | | | 27,057 | | | | 27,241 | |
| | FHLMC, 4.05%, (US 1 Year CMT T-Note +/- MBS Margin), 9/01/27 | | | 50 | | | | 49 | |
| | FHLMC, 4.054%, (12-Month USD LIBOR +/- MBS Margin), 1/01/37 | | | 1,678 | | | | 1,653 | |
| | FHLMC, 4.061%, (6-Month USD LIBOR +/- MBS Margin), 1/01/26 | | | 63 | | | | 64 | |
| | FHLMC, 4.107%, (12-Month USD LIBOR +/- MBS Margin), 1/01/36 | | | 11,038 | | | | 10,883 | |
| | FHLMC, 4.111%, (12-Month USD LIBOR +/- MBS Margin), 8/01/36 | | | 1,172 | | | | 1,163 | |
| | FHLMC, 4.114%, (12-Month USD LIBOR +/- MBS Margin), 1/01/36 | | | 4,427 | | | | 4,377 | |
| | FHLMC, 4.119%, (US 1 Year CMT T-Note +/- MBS Margin), 6/01/37 | | | 53,649 | | | | 52,305 | |
| | FHLMC, 4.124%, (12-Month USD LIBOR +/- MBS Margin), 3/01/36 | | | 4,859 | | | | 4,794 | |
| | FHLMC, 4.155%, (US 1 Year CMT T-Note +/- MBS Margin), 9/01/29 | | | 79,992 | | | | 78,207 | |
| | FHLMC, 4.164%, (US 1 Year CMT T-Note +/- MBS Margin), 1/01/37 | | | 17,868 | | | | 17,517 | |
| | FHLMC, 4.174%, (US 1 Year CMT T-Note +/- MBS Margin), 1/01/35 | | | 5,624 | | | | 5,696 | |
| | FHLMC, 4.179%, (US 1 Year CMT T-Note +/- MBS Margin), 7/01/34 | | | 88,820 | | | | 90,987 | |
| | FHLMC, 4.182%, (US 1 Year CMT T-Note +/- MBS Margin), 5/01/36 | | | 715,792 | | | | 732,182 | |
| | FHLMC, 4.193%, (US 1 Year CMT T-Note +/- MBS Margin), 1/01/28 | | | 365 | | | | 360 | |
| | FHLMC, 4.217%, (6-Month USD LIBOR +/- MBS Margin), 9/01/30 | | | 654 | | | | 640 | |
| | FHLMC, 4.25%, (US 1 Year CMT T-Note +/- MBS Margin), 7/01/34 | | | 5,197 | | | | 5,125 | |
| | FHLMC, 4.32%, (US 1 Year CMT T-Note +/- MBS Margin), 9/01/33 | | | 2,242 | | | | 2,267 | |
| | FHLMC, 4.322%, (US 1 Year CMT T-Note +/- MBS Margin), 10/01/35 | | | 58,182 | | | | 59,602 | |
| | FHLMC, 4.334%, (US 1 Year CMT T-Note +/- MBS Margin), 1/01/29 | | | 2,236 | | | | 2,193 | |
| | FHLMC, 4.336%, (US 1 Year CMT T-Note +/- MBS Margin), 9/01/30 | | | 6 | | | | 6 | |
| | FHLMC, 4.339%, (US 1 Year CMT T-Note +/- MBS Margin), 4/01/29 | | | 166 | | | | 164 | |
| | FHLMC, 4.343%, (US 1 Year CMT T-Note +/- MBS Margin), 10/01/33 | | | 10,620 | | | | 10,773 | |
| | FHLMC, 4.344%, (US 1 Year CMT T-Note +/- MBS Margin), 10/01/33 | | | 59,875 | | | | 61,036 | |
| | FHLMC, 4.35%, (US 1 Year CMT T-Note +/- MBS Margin), 11/01/33 | | | 79,001 | | | | 80,476 | |
| | FHLMC, 4.367%, (US 1 Year CMT T-Note +/- MBS Margin), 10/01/38 | | | 50,738 | | | | 49,453 | |
| | FHLMC, 4.37%, (US 1 Year CMT T-Note +/- MBS Margin), 1/01/36 | | | 7,550 | | | | 7,739 | |
| | FHLMC, 4.375%, (US 1 Year CMT T-Note +/- MBS Margin), 11/01/33 | | | 12,369 | | | | 12,231 | |
| | FHLMC, 4.375%, (US 1 Year CMT T-Note +/- MBS Margin), 11/01/33 | | | 11,448 | | | | 11,467 | |
| | FHLMC, 4.375%, (US 1 Year CMT T-Note +/- MBS Margin), 11/01/34 | | | 21,765 | | | | 22,282 | |
| | FHLMC, 4.375%, (US 1 Year CMT T-Note +/- MBS Margin), 11/01/34 | | | 22,553 | | | | 23,099 | |
| | FHLMC, 4.386%, (US 1 Year CMT T-Note +/- MBS Margin), 12/01/35 | | | 143,032 | | | | 146,934 | |
| | FHLMC, 4.481%, (US 1 Year CMT T-Note +/- MBS Margin), 2/01/36 | | | 23,215 | | | | 23,703 | |
| | FHLMC, 4.484%, (US 1 Year CMT T-Note +/- MBS Margin), 2/01/35 | | | 16,807 | | | | 17,139 | |
| | FHLMC, 4.534%, (US 1 Year CMT T-Note +/- MBS Margin), 11/01/33 | | | 25,867 | | | | 25,646 | |
| | FHLMC, 4.726%, (SOFR +/- MBS Margin), 12/25/30 | | | 1,421,879 | | | | 1,396,316 | |
| | FHLMC, 4.756%, (SOFR +/- MBS Margin), 4/25/31 | | | 1,379,223 | | | | 1,365,556 | |
| | FHLMC, 4.766%, (US 1 Year CMT T-Note +/- MBS Margin), 10/01/29 | | | 3,274 | | | | 3,222 | |
| | FHLMC, 4.776%, (SOFR +/- MBS Margin), 1/25/29 | | | 808,253 | | | | 800,484 | |
| | FHLMC, 4.816%, (SOFR +/- MBS Margin), 1/25/29 | | | 3,000,000 | | | | 2,976,179 | |
| | FHLMC, 4.839%, (1-Month USD LIBOR +/- MBS Margin), 12/25/30 | | | 612,482 | | | | 604,174 | |
| | FHLMC, 4.859%, (1-Month USD LIBOR +/- MBS Margin), 2/25/25 | | | 174,248 | | | | 173,477 | |
| | FHLMC, 4.879%, (1-Month USD LIBOR +/- MBS Margin), 3/25/25 | | | 380,554 | | | | 378,952 | |
| | FHLMC, 4.889%, (1-Month USD LIBOR +/- MBS Margin), 3/25/28 | | | 80,375 | | | | 79,150 | |
| | FHLMC, 4.896%, (SOFR +/- MBS Margin), 5/25/29 | | | 3,000,000 | | | | 2,983,925 | |
| | FHLMC, 4.899%, (1-Month USD LIBOR +/- MBS Margin), 5/25/25 | | | 95,591 | | | | 95,196 | |
| | FHLMC, 4.909%, (1-Month USD LIBOR +/- MBS Margin), 1/25/28 | | | 386,954 | | | | 383,774 | |
| | FHLMC, 4.919%, (1-Month USD LIBOR +/- MBS Margin), 12/25/24 | | | 162,448 | | | | 161,867 | |
| | | | | | | | | | |
| | | | | | |
| 10 | | | | | | | | Annual Report | | franklintempleton.com |
FRANKLIN ETF TRUST
SCHEDULE OF INVESTMENTS
Franklin Short Duration U.S. Government ETF (continued)
| | | | | | | | | | |
| | | |
| | | | | Principal Amount | | | Value | |
| | | Mortgage-Backed Securities (continued) | | | | | | |
| b | | Federal Home Loan Mortgage Corp. (FHLMC) Adjustable Rate (continued) | | | | | | |
| | FHLMC, 4.929%, (1-Month USD LIBOR +/- MBS Margin), 12/25/30 | | $ | 1,731,317 | | | $ | 1,711,113 | |
| | FHLMC, 4.958%, (SOFR +/- MBS Margin), 2/25/32 | | | 1,806,852 | | | | 1,793,552 | |
| | FHLMC, 4.959%, (1-Month USD LIBOR +/- MBS Margin), 8/25/27 | | | 839,878 | | | | 835,567 | |
| | FHLMC, 4.959%, (1-Month USD LIBOR +/- MBS Margin), 6/25/28 | | | 276,545 | | | | 274,615 | |
| | FHLMC, 4.969%, (1-Month USD LIBOR +/- MBS Margin), 11/25/24 | | | 43,379 | | | | 43,292 | |
| | FHLMC, 4.969%, (1-Month USD LIBOR +/- MBS Margin), 7/25/30 | | | 2,060,782 | | | | 2,042,919 | |
| | FHLMC, 4.969%, (1-Month USD LIBOR +/- MBS Margin), 8/25/30 | | | 488,003 | | | | 482,984 | |
| | FHLMC, 4.969%, (1-Month USD LIBOR +/- MBS Margin), 11/25/30 | | | 748,805 | | | | 740,625 | |
| | FHLMC, 4.984%, (1-Month USD LIBOR +/- MBS Margin), 12/15/48 | | | 729,676 | | | | 713,348 | |
| | FHLMC, 4.989%, (1-Month USD LIBOR +/- MBS Margin), 9/25/30 | | | 1,707,796 | | | | 1,684,485 | |
| | FHLMC, 4.999%, (1-Month USD LIBOR +/- MBS Margin), 9/25/24 | | | 203,238 | | | | 202,928 | |
| | FHLMC, 4.999%, (1-Month USD LIBOR +/- MBS Margin), 9/25/30 | | | 787,039 | | | | 781,908 | |
| | FHLMC, 5.009%, (1-Month USD LIBOR +/- MBS Margin), 8/25/24 | | | 2,660 | | | | 2,657 | |
| | FHLMC, 5.009%, (1-Month USD LIBOR +/- MBS Margin), 11/25/27 | | | 136,468 | | | | 135,741 | |
| | FHLMC, 5.018%, (SOFR +/- MBS Margin), 4/25/32 | | | 3,000,000 | | | | 2,979,919 | |
| | FHLMC, 5.019%, (1-Month USD LIBOR +/- MBS Margin), 8/25/24 | | | 70,242 | | | | 70,148 | |
| | FHLMC, 5.019%, (1-Month USD LIBOR +/- MBS Margin), 8/25/30 | | | 2,255,388 | | | | 2,240,662 | |
| | FHLMC, 5.029%, (1-Month USD LIBOR +/- MBS Margin), 8/25/24 | | | 1,054,036 | | | | 1,052,725 | |
| | FHLMC, 5.029%, (1-Month USD LIBOR +/- MBS Margin), 6/25/27 | | | 616,447 | | | | 614,161 | |
| | FHLMC, 5.029%, (1-Month USD LIBOR +/- MBS Margin), 6/25/30 | | | 877,422 | | | | 871,942 | |
| | FHLMC, 5.039%, (1-Month USD LIBOR +/- MBS Margin), 5/25/24 | | | 347,714 | | | | 347,361 | |
| | FHLMC, 5.039%, (1-Month USD LIBOR +/- MBS Margin), 3/25/27 | | | 17,124 | | | | 16,990 | |
| | FHLMC, 5.039%, (1-Month USD LIBOR +/- MBS Margin), 6/25/30 | | | 1,107,723 | | | | 1,100,829 | |
| | FHLMC, 5.048%, (SOFR +/- MBS Margin), 6/25/32 | | | 3,000,000 | | | | 2,986,186 | |
| | FHLMC, 5.069%, (1-Month USD LIBOR +/- MBS Margin), 8/25/25 | | | 130,579 | | | | 130,330 | |
| | FHLMC, 5.084%, (1-Month USD LIBOR +/- MBS Margin), 12/15/39 | | | 148,825 | | | | 148,738 | |
| | FHLMC, 5.108%, (SOFR +/- MBS Margin), 6/25/32 | | | 3,000,000 | | | | 2,999,060 | |
| | FHLMC, 5.109%, (1-Month USD LIBOR +/- MBS Margin), 6/25/26 | | | 505,628 | | | | 504,122 | |
| | FHLMC, 5.109%, (1-Month USD LIBOR +/- MBS Margin), 5/25/29 | | | 1,241,098 | | | | 1,234,453 | |
| | FHLMC, 5.109%, (1-Month USD LIBOR +/- MBS Margin), 6/25/30 | | | 2,086,513 | | | | 2,073,774 | |
| | FHLMC, 5.134%, (1-Month USD LIBOR +/- MBS Margin), 10/15/40 | | | 1,200,413 | | | | 1,175,278 | |
| | FHLMC, 5.139%, (1-Month USD LIBOR +/- MBS Margin), 5/25/30 | | | 1,342,703 | | | | 1,335,438 | |
| | FHLMC, 5.149%, (1-Month USD LIBOR +/- MBS Margin), 4/25/26 | | | 922,220 | | | | 919,579 | |
| | FHLMC, 5.159%, (1-Month USD LIBOR +/- MBS Margin), 2/25/26 | | | 1,604,360 | | | | 1,600,539 | |
| | FHLMC, 5.159%, (1-Month USD LIBOR +/- MBS Margin), 7/25/26 | | | 1,369,745 | | | | 1,367,601 | |
| | FHLMC, 5.169%, (1-Month USD LIBOR +/- MBS Margin), 1/25/26 | | | 535,546 | | | | 534,417 | |
| | FHLMC, 5.169%, (1-Month USD LIBOR +/- MBS Margin), 10/25/26 | | | 2,046,230 | | | | 2,043,375 | |
| | FHLMC, 5.179%, (1-Month USD LIBOR +/- MBS Margin), 12/25/29 | | | 1,736,777 | | | | 1,733,433 | |
| | FHLMC, 5.189%, (1-Month USD LIBOR +/- MBS Margin), 7/25/29 | | | 899,277 | | | | 896,296 | |
| | FHLMC, 5.189%, (1-Month USD LIBOR +/- MBS Margin), 8/25/29 | | | 1,299,676 | | | | 1,295,324 | |
| | FHLMC, 5.189%, (1-Month USD LIBOR +/- MBS Margin), 9/25/29 | | | 707,662 | | | | 705,997 | |
| | FHLMC, 5.199%, (1-Month USD LIBOR +/- MBS Margin), 3/25/29 | | | 1,843,678 | | | | 1,837,811 | |
| | FHLMC, 5.209%, (1-Month USD LIBOR +/- MBS Margin), 12/25/28 | | | 1,516,792 | | | | 1,513,589 | |
| | FHLMC, 5.209%, (1-Month USD LIBOR +/- MBS Margin), 2/25/29 | | | 687,307 | | | | 685,159 | |
| | FHLMC, 5.229%, (1-Month USD LIBOR +/- MBS Margin), 11/25/28 | | | 752,756 | | | | 751,188 | |
| | FHLMC, 5.369%, (1-Month USD LIBOR +/- MBS Margin), 2/25/27 | | | 627,100 | | | | 629,630 | |
| | FHLMC, 5.456%, (US 1 Year CMT T-Note +/- MBS Margin), 8/01/24 | | | 234 | | | | 233 | |
| | FHLMC, 5.469%, (1-Month USD LIBOR +/- MBS Margin), 3/25/30 | | | 1,339,293 | | | | 1,341,368 | |
| | | | | | | | | | |
| | | | | | | | | 68,990,834 | |
| | | | | | | | | | |
| | | Federal Home Loan Mortgage Corp. (FHLMC) Fixed Rate 7.8% | | | | | | |
| | FHLMC, 0.75%, 5/25/44 | | | 1,771,405 | | | | 1,426,347 | |
| | FHLMC, 0.799%, 5/25/30 | | | 2,403,249 | | | | 2,095,838 | |
| | FHLMC, 0.826%, 2/25/31 | | | 850,822 | | | | 726,845 | |
| | FHLMC, 1.054%, 8/25/26 | | | 1,866,686 | | | | 1,758,283 | |
| | FHLMC, 2.00%, 2/25/50 | | | 970,819 | | | | 825,651 | |
| | FHLMC, 2.745%, 1/25/26 | | | 1,500,000 | | | | 1,436,571 | |
| | FHLMC, 2.995%, 12/25/25 | | | 1,500,000 | | | | 1,447,247 | |
| | | | | | | | | | |
| | | | | | |
| franklintempleton.com | | Annual Report | | | | | | | | 11 |
FRANKLIN ETF TRUST
SCHEDULE OF INVESTMENTS
Franklin Short Duration U.S. Government ETF (continued)
| | | | | | | | | | |
| | | |
| | | | | Principal Amount | | | Value | |
| | | Mortgage-Backed Securities (continued) | | | | | | |
| | | Federal Home Loan Mortgage Corp. (FHLMC) Fixed Rate (continued) | | | | | | |
| | FHLMC, 3.062%, 12/25/24 | | $ | 1,500,000 | | | $ | 1,458,707 | |
| | FHLMC, 3.458%, 8/25/23 | | | 1,807,070 | | | | 1,794,392 | |
| | FHLMC, 3.49%, 1/25/24 | | | 2,000,000 | | | | 1,974,184 | |
| | FHLMC, 3.50%, 6/01/26 | | | 140,529 | | | | 137,932 | |
| | FHLMC, 4.00%, 3/01/49 | | | 890,898 | | | | 866,707 | |
| | | | | | | | | | |
| | | | | | | | | 15,948,704 | |
| | | | | | | | | | |
| b | | Federal National Mortgage Association (FNMA) Adjustable Rate 8.4% | | | | | | |
| | FNMA, 2.426%, (6-Month USD LIBOR +/- MBS Margin), 9/01/33 | | | 552 | | | | 539 | |
| | FNMA, 2.541%, (12-Month USD LIBOR +/- MBS Margin), 3/01/34 | | | 57,649 | | | | 56,958 | |
| | FNMA, 2.746%, (12-Month USD LIBOR +/- MBS Margin), 5/01/35 | | | 17,588 | | | | 17,740 | |
| | FNMA, 2.802%, (US 1 Year CMT T-Note +/- MBS Margin), 2/01/25 | | | 1,312 | | | | 1,303 | |
| | FNMA, 2.845%, (6-Month USD LIBOR +/- MBS Margin), 11/01/33 | | | 268 | | | | 262 | |
| | FNMA, 2.969%, (12-Month USD LIBOR +/- MBS Margin), 3/01/35 | | | 1,370 | | | | 1,348 | |
| | FNMA, 3.14%, (12-Month USD LIBOR +/- MBS Margin), 5/01/35 | | | 56,974 | | | | 57,715 | |
| | FNMA, 3.186%, (12-Month USD LIBOR +/- MBS Margin), 3/01/35 | | | 3,147 | | | | 3,109 | |
| | FNMA, 3.191%, (12-Month USD LIBOR +/- MBS Margin), 10/01/34 | | | 2,826 | | | | 2,759 | |
| | FNMA, 3.268%, (6-Month USD LIBOR +/- MBS Margin), 11/01/33 | | | 4,169 | | | | 4,068 | |
| | FNMA, 3.284%, (6-Month USD LIBOR +/- MBS Margin), 5/01/32 | | | 1,115 | | | | 1,087 | |
| | FNMA, 3.302%, (6-Month USD LIBOR +/- MBS Margin), 11/01/35 | | | 3,274 | | | | 3,257 | |
| | FNMA, 3.32%, (6-Month USD LIBOR +/- MBS Margin), 11/01/35 | | | 4,941 | | | | 4,905 | |
| | FNMA, 3.348%, (US 1 Year CMT T-Note +/- MBS Margin), 6/01/35 | | | 18,094 | | | | 18,040 | |
| | FNMA, 3.415%, (US 1 Year CMT T-Note +/- MBS Margin), 5/01/33 | | | 20,041 | | | | 20,456 | |
| | FNMA, 3.415%, (12-Month USD LIBOR +/- MBS Margin), 6/01/36 | | | 16,183 | | | | 16,428 | |
| | FNMA, 3.422%, (6-Month USD LIBOR +/- MBS Margin), 1/01/25 | | | 385 | | | | 381 | |
| | FNMA, 3.488%, (US 1 Year CMT T-Note +/- MBS Margin), 5/01/33 | | | 9,650 | | | | 9,481 | |
| | FNMA, 3.496%, (US 1 Year CMT T-Note +/- MBS Margin), 5/01/36 | | | 8,780 | | | | 8,658 | |
| | FNMA, 3.497%, (12-Month USD LIBOR +/- MBS Margin), 6/01/35 | | | 31,810 | | | | 31,708 | |
| | FNMA, 3.515%, (12-Month USD LIBOR +/- MBS Margin), 7/01/36 | | | 25,664 | | | | 25,185 | |
| | FNMA, 3.52%, (6-Month USD LIBOR +/- MBS Margin), 11/01/34 | | | 14,656 | | | | 14,331 | |
| | FNMA, 3.532%, (US 1 Year CMT T-Note +/- MBS Margin), 5/01/36 | | | 16,253 | | | | 16,026 | |
| | FNMA, 3.585%, (US 1 Year CMT T-Note +/- MBS Margin), 8/01/39 | | | 2,533 | | | | 2,521 | |
| | FNMA, 3.601%, (11th District COF +/- MBS Margin), 10/01/27 | | | 77 | | | | 76 | |
| | FNMA, 3.601%, (12-Month USD LIBOR +/- MBS Margin), 11/01/36 | | | 18,297 | | | | 18,519 | |
| | FNMA, 3.615%, (12-Month USD LIBOR +/- MBS Margin), 10/01/35 | | | 3,083 | | | | 3,022 | |
| | FNMA, 3.623%, (12-Month USD LIBOR +/- MBS Margin), 10/01/34 | | | 17,574 | | | | 17,370 | |
| | FNMA, 3.644%, (6-Month USD LIBOR +/- MBS Margin), 4/01/36 | | | 1,514 | | | | 1,500 | |
| | FNMA, 3.648%, (12-Month USD LIBOR +/- MBS Margin), 2/01/36 | | | 15,143 | | | | 15,259 | |
| | FNMA, 3.655%, (6-Month USD LIBOR +/- MBS Margin), 4/01/36 | | | 4,011 | | | | 3,955 | |
| | FNMA, 3.662%, (6-Month USD LIBOR +/- MBS Margin), 11/01/35 | | | 258,341 | | | | 258,364 | |
| | FNMA, 3.664%, (12-Month USD LIBOR +/- MBS Margin), 11/01/35 | | | 125,521 | | | | 126,991 | |
| | FNMA, 3.69%, (US 1 Year CMT T-Note +/- MBS Margin), 3/01/38 | | | 3,102 | | | | 3,073 | |
| | FNMA, 3.694%, (6-Month USD LIBOR +/- MBS Margin), 8/01/33 | | | 2,645 | | | | 2,637 | |
| | FNMA, 3.695%, (12-Month USD LIBOR +/- MBS Margin), 1/01/35 | | | 34,685 | | | | 34,233 | |
| | FNMA, 3.717%, (12-Month USD LIBOR +/- MBS Margin), 7/01/35 | | | 4,492 | | | | 4,548 | |
| | FNMA, 3.725%, (6-Month USD LIBOR +/- MBS Margin), 6/01/34 | | | 68,446 | | | | 68,772 | |
| | FNMA, 3.746%, (US 1 Year CMT T-Note +/- MBS Margin), 4/01/34 | | | 26,007 | | | | 25,705 | |
| | FNMA, 3.749%, (12-Month USD LIBOR +/- MBS Margin), 12/01/33 | | | 857 | | | | 839 | |
| | FNMA, 3.755%, (12-Month USD LIBOR +/- MBS Margin), 4/01/40 | | | 170,449 | | | | 168,378 | |
| | FNMA, 3.76%, (11th District COF +/- MBS Margin), 8/01/29 | | | 4,636 | | | | 4,575 | |
| | FNMA, 3.761%, (12-Month USD LIBOR +/- MBS Margin), 1/01/38 | | | 55,416 | | | | 55,983 | |
| | FNMA, 3.762%, (12-Month USD LIBOR +/- MBS Margin), 11/01/36 | | | 77,735 | | | | 77,425 | |
| | FNMA, 3.763%, (12-Month USD LIBOR +/- MBS Margin), 8/01/37 | | | 52,539 | | | | 51,578 | |
| | FNMA, 3.77%, (12-Month USD LIBOR +/- MBS Margin), 5/01/38 | | | 730,887 | | | | 741,188 | |
| | FNMA, 3.773%, (12-Month USD LIBOR +/- MBS Margin), 4/01/44 | | | 1,256,919 | | | | 1,272,770 | |
| | FNMA, 3.78%, (12-Month USD LIBOR +/- MBS Margin), 5/01/37 | | | 100,462 | | | | 99,694 | |
| | FNMA, 3.81%, (12-Month USD LIBOR +/- MBS Margin), 7/01/42 | | | 1,116,422 | | | | 1,134,750 | |
| | FNMA, 3.812%, (12-Month USD LIBOR +/- MBS Margin), 9/01/35 | | | 81,831 | | | | 81,096 | |
| | | | | | | | | | |
| | | | | | |
| 12 | | | | | | | | Annual Report | | franklintempleton.com |
FRANKLIN ETF TRUST
SCHEDULE OF INVESTMENTS
Franklin Short Duration U.S. Government ETF (continued)
| | | | | | | | | | |
| | | |
| | | | | Principal Amount | | | Value | |
| | | Mortgage-Backed Securities (continued) | | | | | | |
| b | | Federal National Mortgage Association (FNMA) Adjustable Rate (continued) | | | | | | |
| | FNMA, 3.82%, (12-Month USD LIBOR +/- MBS Margin), 7/01/35 | | $ | 32,926 | | | $ | 32,386 | |
| | FNMA, 3.837%, (12-Month USD LIBOR +/- MBS Margin), 9/01/42 | | | 570,477 | | | | 579,652 | |
| | FNMA, 3.842%, (12-Month USD LIBOR +/- MBS Margin), 9/01/37 | | | 279,808 | | | | 283,808 | |
| | FNMA, 3.865%, (6-Month USD LIBOR +/- MBS Margin), 12/01/34 | | | 6,937 | | | | 6,787 | |
| | FNMA, 3.866%, (US 1 Year CMT T-Note +/- MBS Margin), 1/01/32 | | | 5,701 | | | | 5,676 | |
| | FNMA, 3.867%, (12-Month USD LIBOR +/- MBS Margin), 12/01/34 | | | 4,598 | | | | 4,642 | |
| | FNMA, 3.871%, (12-Month USD LIBOR +/- MBS Margin), 5/01/35 | | | 63,133 | | | | 64,264 | |
| | FNMA, 3.873%, (12-Month USD LIBOR +/- MBS Margin), 7/01/34 | | | 183 | | | | 180 | |
| | FNMA, 3.873%, (12-Month USD LIBOR +/- MBS Margin), 2/01/35 | | | 29,372 | | | | 28,724 | |
| | FNMA, 3.879%, (12-Month USD LIBOR +/- MBS Margin), 6/01/35 | | | 6,664 | | | | 6,664 | |
| | FNMA, 3.886%, (12-Month USD LIBOR +/- MBS Margin), 1/01/35 | | | 18,276 | | | | 18,397 | |
| | FNMA, 3.892%, (12-Month USD LIBOR +/- MBS Margin), 1/01/35 | | | 5,062 | | | | 4,953 | |
| | FNMA, 3.90%, (12-Month USD LIBOR +/- MBS Margin), 11/01/34 | | | 3,730 | | | | 3,761 | |
| | FNMA, 3.904%, (12-Month USD LIBOR +/- MBS Margin), 8/01/44 | | | 1,151,175 | | | | 1,170,732 | |
| | FNMA, 3.931%, (12-Month USD LIBOR +/- MBS Margin), 12/01/34 | | | 10,283 | | | | 10,148 | |
| | FNMA, 3.932%, (12-Month USD LIBOR +/- MBS Margin), 1/01/35 | | | 13,605 | | | | 13,721 | |
| | FNMA, 3.939%, (US 1 Year CMT T-Note +/- MBS Margin), 12/01/40 | | | 168,419 | | | | 172,505 | |
| | FNMA, 3.94%, (12-Month USD LIBOR +/- MBS Margin), 12/01/34 | | | 83,283 | | | | 82,204 | |
| | FNMA, 3.94%, (12-Month USD LIBOR +/- MBS Margin), 12/01/39 | | | 16,411 | | | | 16,618 | |
| | FNMA, 3.943%, (US 1 Year CMT T-Note +/- MBS Margin), 9/01/39 | | | 346 | | | | 339 | |
| | FNMA, 3.947%, (12-Month USD LIBOR +/- MBS Margin), 3/01/42 | | | 186,975 | | | | 189,203 | |
| | FNMA, 3.951%, (US 1 Year CMT T-Note +/- MBS Margin), 4/01/40 | | | 29,424 | | | | 29,770 | |
| | FNMA, 3.952%, (12-Month USD LIBOR +/- MBS Margin), 7/01/35 | | | 4,333 | | | | 4,250 | |
| | FNMA, 3.956%, (12-Month USD LIBOR +/- MBS Margin), 9/01/37 | | | 87,947 | | | | 89,290 | |
| | FNMA, 3.959%, (US 1 Year CMT T-Note +/- MBS Margin), 8/01/29 | | | 262 | | | | 259 | |
| | FNMA, 3.96%, (12-Month USD LIBOR +/- MBS Margin), 2/01/35 | | | 8,457 | | | | 8,546 | |
| | FNMA, 3.967%, (12-Month USD LIBOR +/- MBS Margin), 10/01/40 | | | 272,458 | | | | 277,904 | |
| | FNMA, 3.972%, (12-Month USD LIBOR +/- MBS Margin), 8/01/38 | | | 222,581 | | | | 225,653 | |
| | FNMA, 3.973%, (12-Month USD LIBOR +/- MBS Margin), 1/01/33 | | | 14,493 | | | | 14,216 | |
| | FNMA, 3.979%, (12-Month USD LIBOR +/- MBS Margin), 8/01/37 | | | 31,721 | | | | 32,330 | |
| | FNMA, 3.979%, (12-Month USD LIBOR +/- MBS Margin), 9/01/40 | | | 38,266 | | | | 39,183 | |
| | FNMA, 3.991%, (12-Month USD LIBOR +/- MBS Margin), 1/01/35 | | | 28,289 | | | | 27,965 | |
| | FNMA, 4.00%, (12-Month USD LIBOR +/- MBS Margin), 10/01/33 | | | 17,917 | | | | 17,577 | |
| | FNMA, 4.00%, (US 1 Year CMT T-Note +/- MBS Margin), 8/01/36 | | | 74,405 | | | | 76,218 | |
| | FNMA, 4.001%, (6-Month USD LIBOR +/- MBS Margin), 12/01/24 | | | 65 | | | | 64 | |
| | FNMA, 4.008%, (US 1 Year CMT T-Note +/- MBS Margin), 7/01/38 | | | 103,815 | | | | 102,172 | |
| | FNMA, 4.014%, (US 1 Year CMT T-Note +/- MBS Margin), 2/01/37 | | | 21,720 | | | | 21,280 | |
| | FNMA, 4.018%, (12-Month USD LIBOR +/- MBS Margin), 12/01/32 | | | 1,271 | | | | 1,245 | |
| | FNMA, 4.022%, (US 1 Year CMT T-Note +/- MBS Margin), 12/01/40 | | | 491,318 | | | | 502,299 | |
| | FNMA, 4.026%, (12-Month USD LIBOR +/- MBS Margin), 1/01/37 | | | 19,967 | | | | 19,548 | |
| | FNMA, 4.049%, (US 1 Year CMT T-Note +/- MBS Margin), 12/01/37 | | | 19,599 | | | | 20,068 | |
| | FNMA, 4.062%, (12-Month USD LIBOR +/- MBS Margin), 1/01/41 | | | 126,181 | | | | 128,233 | |
| | FNMA, 4.063%, (6-Month USD LIBOR +/- MBS Margin), 2/01/35 | | | 9,176 | | | | 8,936 | |
| | FNMA, 4.094%, (12-Month USD LIBOR +/- MBS Margin), 9/01/37 | | | 277 | | | | 274 | |
| | FNMA, 4.106%, (US 1 Year CMT T-Note +/- MBS Margin), 9/01/33 | | | 2,432 | | | | 2,395 | |
| | FNMA, 4.115%, (US 1 Year CMT T-Note +/- MBS Margin), 12/01/40 | | | 36,072 | | | | 36,526 | |
| | FNMA, 4.122%, (12-Month USD LIBOR +/- MBS Margin), 3/01/36 | | | 9,798 | | | | 9,686 | |
| | FNMA, 4.124%, (US 1 Year CMT T-Note +/- MBS Margin), 12/01/34 | | | 3,497 | | | | 3,482 | |
| | FNMA, 4.127%, (US 1 Year CMT T-Note +/- MBS Margin), 9/01/34 | | | 8,532 | | | | 8,396 | |
| | FNMA, 4.131%, (12-Month USD LIBOR +/- MBS Margin), 8/01/36 | | | 42,001 | | | | 41,411 | |
| | FNMA, 4.14%, (US 1 Year CMT T-Note +/- MBS Margin), 10/01/34 | | | 40,548 | | | | 41,522 | |
| | FNMA, 4.143%, (US 1 Year CMT T-Note +/- MBS Margin), 9/01/39 | | | 31,360 | | | | 32,056 | |
| | FNMA, 4.171%, (US 1 Year CMT T-Note +/- MBS Margin), 12/01/33 | | | 55,171 | | | | 54,267 | |
| | FNMA, 4.184%, (US 1 Year CMT T-Note +/- MBS Margin), 9/01/35 | | | 54,358 | | | | 54,995 | |
| | FNMA, 4.188%, (1 Year CMT +/- MBS Margin), 1/01/31 | | | 14,822 | | | | 14,519 | |
| | FNMA, 4.19%, (US 1 Year CMT T-Note +/- MBS Margin), 8/01/32 | | | 4,470 | | | | 4,413 | |
| | FNMA, 4.19%, (12-Month USD LIBOR +/- MBS Margin), 4/01/33 | | | 5,020 | | | | 4,914 | |
| | FNMA, 4.193%, (1 Year CMT +/- MBS Margin), 6/01/40 | | | 26,092 | | | | 26,334 | |
| | | | | | | | | | |
| | | | | | |
| franklintempleton.com | | Annual Report | | | | | | | | 13 |
FRANKLIN ETF TRUST
SCHEDULE OF INVESTMENTS
Franklin Short Duration U.S. Government ETF (continued)
| | | | | | | | | | |
| | | |
| | | | | Principal Amount | | | Value | |
| | | Mortgage-Backed Securities (continued) | | | | | | |
| b | | Federal National Mortgage Association (FNMA) Adjustable Rate (continued) | | | | | | |
| | FNMA, 4.193%, (1 Year CMT +/- MBS Margin), 11/01/40 | | $ | 7,828 | | | $ | 7,628 | |
| | FNMA, 4.195%, (12-Month USD LIBOR +/- MBS Margin), 12/01/35 | | | 17,281 | | | | 17,563 | |
| | FNMA, 4.21%, (12-Month USD LIBOR +/- MBS Margin), 3/01/35 | | | 32,851 | | | | 32,365 | |
| | FNMA, 4.23%, (12-Month USD LIBOR +/- MBS Margin), 8/01/35 | | | 2,954 | | | | 2,904 | |
| | FNMA, 4.242%, (US 1 Year CMT T-Note +/- MBS Margin), 7/01/35 | | | 17,461 | | | | 17,248 | |
| | FNMA, 4.252%, (11th District COF +/- MBS Margin), 8/01/28 | | | 12,142 | | | | 12,051 | |
| | FNMA, 4.268%, (US 1 Year CMT T-Note +/- MBS Margin), 3/01/25 | | | 355 | | | | 353 | |
| | FNMA, 4.28%, (US 1 Year CMT T-Note +/- MBS Margin), 1/01/33 | | | 7,663 | | | | 7,490 | |
| | FNMA, 4.298%, (US 1 Year CMT T-Note +/- MBS Margin), 11/01/34 | | | 11,774 | | | | 11,641 | |
| | FNMA, 4.30%, (US 1 Year CMT T-Note +/- MBS Margin), 8/01/28 | | | 173 | | | | 171 | |
| | FNMA, 4.305%, (US 1 Year CMT T-Note +/- MBS Margin), 6/01/32 | | | 241 | | | | 239 | |
| | FNMA, 4.319%, (US 1 Year CMT T-Note +/- MBS Margin), 12/01/34 | | | 35,278 | | | | 36,029 | |
| | FNMA, 4.356%, (US 1 Year CMT T-Note +/- MBS Margin), 9/01/35 | | | 54,427 | | | | 53,844 | |
| | FNMA, 4.376%, (US 1 Year CMT T-Note +/- MBS Margin), 7/01/33 | | | 464 | | | | 460 | |
| | FNMA, 4.398%, (US 1 Year CMT T-Note +/- MBS Margin), 10/01/34 | | | 10,551 | | | | 10,845 | |
| | FNMA, 4.399%, (6-Month USD LIBOR +/- MBS Margin), 4/01/36 | | | 2,359 | | | | 2,398 | |
| | FNMA, 4.407%, (US 1 Year CMT T-Note +/- MBS Margin), 10/01/33 | | | 1,427 | | | | 1,463 | |
| | FNMA, 4.424%, (US 1 Year CMT T-Note +/- MBS Margin), 2/01/35 | | | 20,753 | | | | 20,426 | |
| | FNMA, 4.468%, (1 Year CMT +/- MBS Margin), 11/01/35 | | | 10,635 | | | | 10,325 | |
| | FNMA, 4.514%, (1 Year CMT +/- MBS Margin), 11/01/35 | | | 14,725 | | | | 14,286 | |
| | FNMA, 4.525%, (US 1 Year CMT T-Note +/- MBS Margin), 7/01/28 | | | 630 | | | | 621 | |
| | FNMA, 4.562%, (US 1 Year CMT T-Note +/- MBS Margin), 1/01/28 | | | 563 | | | | 557 | |
| | FNMA, 4.595%, (1 Year CMT +/- MBS Margin), 11/01/35 | | | 9,902 | | | | 9,664 | |
| | FNMA, 4.611%, (US 1 Year CMT T-Note +/- MBS Margin), 5/01/35 | | | 8,258 | | | | 8,295 | |
| | FNMA, 4.613%, (1 Year CMT +/- MBS Margin), 11/01/35 | | | 10,623 | | | | 10,356 | |
| | FNMA, 4.621%, (1 Year CMT +/- MBS Margin), 10/01/35 | | | 67,271 | | | | 65,807 | |
| | FNMA, 4.669%, (1 Year CMT +/- MBS Margin), 11/01/35 | | | 92,374 | | | | 91,170 | |
| | FNMA, 4.692%, (12-Month USD LIBOR +/- MBS Margin), 3/01/36 | | | 13,102 | | | | 13,481 | |
| | FNMA, 4.708%, (US 1 Year CMT T-Note +/- MBS Margin), 12/01/30 | | | 1,492 | | | | 1,467 | |
| | FNMA, 4.72%, (1 Year CMT +/- MBS Margin), 11/01/35 | | | 37,627 | | | | 36,991 | |
| | FNMA, 4.733%, (1 Year CMT +/- MBS Margin), 11/01/35 | | | 17,056 | | | | 16,792 | |
| | FNMA, 4.755%, (1 Year CMT +/- MBS Margin), 11/01/35 | | | 29,297 | | | | 28,891 | |
| | FNMA, 4.766%, (1 Year CMT +/- MBS Margin), 11/01/35 | | | 17,483 | | | | 17,217 | |
| | FNMA, 4.805%, (6-Month USD LIBOR +/- MBS Margin), 3/01/36 | | | 1,669 | | | | 1,689 | |
| | FNMA, 4.837%, (1 Year CMT +/- MBS Margin), 10/01/35 | | | 188,480 | | | | 185,657 | |
| | FNMA, 4.839%, (1 Year CMT +/- MBS Margin), 11/01/35 | | | 72,064 | | | | 71,084 | |
| | FNMA, 4.879%, (6-Month USD LIBOR +/- MBS Margin), 3/01/28 | | | 1,002 | | | | 999 | |
| | FNMA, 4.902%, (6-Month USD LIBOR +/- MBS Margin), 1/01/35 | | | 1,688 | | | | 1,697 | |
| | FNMA, 4.982%, (1 Year CMT +/- MBS Margin), 10/01/36 | | | 27,657 | | | | 27,652 | |
| | FNMA, 5.027%, (1 Year CMT +/- MBS Margin), 9/01/36 | | | 17,713 | | | | 17,595 | |
| | FNMA, 5.033%, (6-Month USD LIBOR +/- MBS Margin), 5/01/36 | | | 9,435 | | | | 9,440 | |
| | FNMA, 5.049%, (1 Year CMT +/- MBS Margin), 5/01/36 | | | 30,771 | | | | 30,829 | |
| | FNMA, 5.05%, (6-Month USD LIBOR +/- MBS Margin), 5/01/33 | | | 5,669 | | | | 5,667 | |
| | FNMA, 5.05%, (6-Month USD LIBOR +/- MBS Margin), 5/01/35 | | | 932 | | | | 938 | |
| | FNMA, 5.07%, (6-Month USD LIBOR +/- MBS Margin), 2/01/36 | | | 183,761 | | | | 188,071 | |
| | FNMA, 5.106%, (6-Month USD LIBOR +/- MBS Margin), 6/01/35 | | | 6,162 | | | | 6,215 | |
| | FNMA, 5.195%, (1-Month USD LIBOR +/- MBS Margin), 10/25/58 | | | 1,375,807 | | | | 1,329,088 | |
| | FNMA, 5.245%, (6-Month USD LIBOR +/- MBS Margin), 3/01/34 | | | 4,047 | | | | 4,064 | |
| | FNMA, 5.245%, (1-Month USD LIBOR +/- MBS Margin), 5/25/40 | | | 426,142 | | | | 418,122 | |
| | FNMA, 5.245%, (1-Month USD LIBOR +/- MBS Margin), 9/25/46 | | | 879,988 | | | | 865,994 | |
| | FNMA, 5.245%, (1-Month USD LIBOR +/- MBS Margin), 10/25/46 | | | 766,226 | | | | 754,426 | |
| | FNMA, 5.295%, (1-Month USD LIBOR +/- MBS Margin), 10/25/41 | | | 1,622,745 | | | | 1,609,430 | |
| | FNMA, 5.295%, (1-Month USD LIBOR +/- MBS Margin), 7/25/49 | | | 1,678,179 | | | | 1,628,821 | |
| | FNMA, 5.402%, (6-Month USD LIBOR +/- MBS Margin), 11/01/33 | | | 1,585 | | | | 1,583 | |
| | FNMA, 5.416%, (6-Month USD LIBOR +/- MBS Margin), 3/01/35 | | | 52,604 | | | | 52,653 | |
| | FNMA, 5.454%, (6-Month USD LIBOR +/- MBS Margin), 7/01/35 | | | 4,088 | | | | 4,174 | |
| | FNMA, 5.512%, (6-Month USD LIBOR +/- MBS Margin), 2/01/33 | | | 51,811 | | | | 52,739 | |
| | | | | | | | | | |
| | | | | | |
| 14 | | | | | | | | Annual Report | | franklintempleton.com |
FRANKLIN ETF TRUST
SCHEDULE OF INVESTMENTS
Franklin Short Duration U.S. Government ETF (continued)
| | | | | | | | | | |
| | | |
| | | | | Principal Amount | | | Value | |
| | | Mortgage-Backed Securities (continued) | | | | | | |
| b | | Federal National Mortgage Association (FNMA) Adjustable Rate (continued) | | | | | | |
| | FNMA, 5.584%, (6-Month USD LIBOR +/- MBS Margin), 9/01/27 | | $ | 1,319 | | | $ | 1,317 | |
| | FNMA, 5.743%, (US 1 Year CMT T-Note +/- MBS Margin), 3/01/33 | | | 19,728 | | | | 19,679 | |
| | | | | | | | | | |
| | | | | | | | | 17,118,786 | |
| | | | | | | | | | |
| | | Federal National Mortgage Association (FNMA) Fixed Rate 17.1% | | | | | | |
| | FNMA, 0.785%, 7/25/30 | | | 2,914,329 | | | | 2,626,425 | |
| | FNMA, 1.75%, 1/25/43 | | | 1,045,745 | | | | 910,947 | |
| | FNMA, 3.00%, 10/25/45 | | | 1,081,540 | | | | 1,025,227 | |
| | FNMA, 3.50%, 9/01/25 | | | 15,885 | | | | 15,632 | |
| | FNMA, 3.50%, 10/01/25 | | | 152,023 | | | | 149,551 | |
| | FNMA, 3.50%, 3/01/26 | | | 135,994 | | | | 133,611 | |
| | FNMA, 3.50%, 8/01/26 | | | 27,861 | | | | 27,348 | |
| | FNMA, 3.50%, 8/01/26 | | | 13,879 | | | | 13,618 | |
| | FNMA, 3.50%, 10/01/26 | | | 895 | | | | 878 | |
| | FNMA, 3.50%, 10/01/26 | | | 1,416 | | | | 1,390 | |
| | FNMA, 3.50%, 10/01/26 | | | 4,507 | | | | 4,422 | |
| | FNMA, 3.50%, 1/01/27 | | | 7,198 | | | | 7,064 | |
| | FNMA, 3.50%, 1/01/27 | | | 179,060 | | | | 175,922 | |
| | FNMA, 3.50%, 1/01/27 | | | 3,427 | | | | 3,361 | |
| | FNMA, 3.50%, 4/01/27 | | | 53,204 | | | | 52,187 | |
| | FNMA, 3.50%, 7/01/27 | | | 193,731 | | | | 190,336 | |
| | FNMA, 3.50%, 5/01/31 | | | 53,119 | | | | 52,139 | |
| c | | FNMA, 5.00%, 4/15/53 | | | 9,239,000 | | | | 9,215,181 | |
| | FNMA, 5.50%, 3/01/53 | | | 10,066,440 | | | | 10,177,094 | |
| c | | FNMA, 5.50%, 4/15/53 | | | 5,957,000 | | | | 6,017,617 | |
| | FNMA, 6.00%, 4/01/53 | | | 1,980,000 | | | | 2,022,962 | |
| c | | FNMA, 6.00%, 4/15/53 | | | 2,000,000 | | | | 2,041,484 | |
| | | | | | | | | | |
| | | | | | | | | 34,864,396 | |
| | | | | | | | | | |
| b | | Government National Mortgage Association (GNMA) Adjustable Rate 2.1% | | | | | | |
| | GNMA, 5.061%, (1-Month USD LIBOR +/- MBS Margin), 4/20/37 | | | 1,359,604 | | | | 1,352,071 | |
| | GNMA, 5.091%, (1-Month USD LIBOR +/- MBS Margin), 6/20/41 | | | 1,820,513 | | | | 1,797,505 | |
| | GNMA, 5.328%, (1-Month USD LIBOR +/- MBS Margin), 1/16/40 | | | 1,027,154 | | | | 1,025,700 | |
| | | | | | | | | | |
| | | | | | | | | 4,175,276 | |
| | | | | | | | | | |
| | | Government National Mortgage Association (GNMA) Fixed Rate 0.2% | | | | | | |
| | GNMA, 2.50%, 9/20/27 | | | 318,000 | | | | 312,819 | |
| | | | | | | | | | |
| | Total Mortgage-Backed Securities (Cost $144,689,759) | | | | | | | 141,410,815 | |
| | | | | | | | | | |
| | Total Investments before Short Term Investments (Cost $215,593,688) | | | | | | | 211,352,543 | |
| | | | | | | | | | |
| | | |
| | | | | Shares | | | | |
| | | Short Term Investments (Cost $8,118,307) 4.0% | | | | | | |
| | Money Market Funds 4.0% | | | | | | | | |
| d,e | | Institutional Fiduciary Trust Money Market Portfolio, 4.37% | | | 8,118,307 | | | | 8,118,307 | |
| | | | | | | | | | |
| | Total Investments (Cost $223,711,995) 107.8% | | | | | | | 219,470,850 | |
| | Other Assets, less Liabilities (7.8)% | | | | | | | (15,858,877 | ) |
| | | | | | | | | | |
| | Net Assets 100.0% | | | | | | $ | 203,611,973 | |
| | | | | | | | | | |
aThe coupon rate shown represents the value inclusive of any caps or floors, if applicable, in effect at period end.
bAdjustable Rate Mortgage-Backed Security (ARM); the rate shown is the effective rate at period end. ARM rates are not based on a published reference rate and spread, but instead pass-through weighted average interest income inclusive of any caps or floors, if applicable, from the underlying mortgage loans pool in which the majority of mortgages pay interest based on the index shown at their designated reset dates plus a spread, less the applicable servicing and guaranty fee (MBS margin).
cSecurity purchased on a to-be-announced (TBA) basis. See Note 1(b).
dThe rate shown is the annualized seven-day effective yield at period end.
eSee Note 3(c) regarding investments in affiliated management investment companies.
| | | | | | | | | | |
| | | | | | |
| franklintempleton.com | | Annual Report | | | | | | | | 15 |
FRANKLIN ETF TRUST
SCHEDULE OF INVESTMENTS
Franklin Short Duration U.S. Government ETF (continued)
At March 31, 2023, the Fund had the following futures contracts outstanding. See Note 1(c).
| | | | | | | | | | | | | | | | | | | | |
| Futures Contracts | | | | | | | | | | | | | | | |
| | | | | |
| Description | | Type | | | Number of
Contracts | | | Notional
Value* | | | Expiration
Date | | | Value/Unrealized
Appreciation
(Depreciation) | |
| Interest Rate Contracts | | | | | | | | | | | | | | | |
U.S. Treasury 2 Yr. Note | | | Long | | | | 168 | | | $ | 34,684,125 | | | | 6/30/23 | | | $ | 350,861 | |
U.S. Treasury 10 Yr. Note | | | Short | | | | 88 | | | | 10,113,125 | | | | 6/21/23 | | | | (327,375 | ) |
U.S. Treasury 10 Yr. Ultra | | | Short | | | | 1 | | | | 121,141 | | | | 6/21/23 | | | | (4,509 | ) |
U.S. Treasury Long Bond | | | Short | | | | 24 | | | | 3,147,750 | | | | 6/21/23 | | | | (151,536 | ) |
| | | | | | | | | | | | | | | | | | | | |
Total Futures Contracts | | | $ | (132,559 | ) |
| | | | | | | | | | | | | | | | | | | | |
*As of period end.
See Note 7 regarding other derivative information.
See abbreviations on page 26.
| | | | | | | | | | |
| | | | | | |
| 16 | | | | | | | | Annual Report | The accompanying notes are an integral part of these financial statements. | | franklintempleton.com |
FRANKLIN ETF TRUST
FINANCIAL STATEMENTS
Statement of Assets and Liabilities
March 31, 2023
Franklin Short Duration U.S. Government ETF
| | | | |
| |
Assets: | | | | |
Investments in securities: | | | | |
Cost – Unaffiliated issuers | | $ | 215,593,688 | |
Cost – Non-controlled affiliates (Note 3c) | | | 8,118,307 | |
| | | | |
Value – Unaffiliated issuers | | $ | 211,352,543 | |
Value – Non-controlled affiliates (Note 3c) | | | 8,118,307 | |
Receivables: | | | | |
Investment securities sold | | | 79,309 | |
Interest | | | 807,278 | |
Deposits with broker for: | | | | |
Futures contracts | | | 341,701 | |
| | | | |
Total assets | | | 220,699,138 | |
| | | | |
Liabilities: | | | | |
Payables: | | | | |
Investment securities purchased | | | 17,007,746 | |
Management fees | | | 48,247 | |
Variation margin on futures contracts | | | 31,172 | |
| | | | |
Total liabilities | | | 17,087,165 | |
| | | | |
Net assets, at value | | $ | 203,611,973 | |
| | | | |
Net assets consist of: | | | | |
Paid-in capital | | $ | 231,953,327 | |
Total distributable earnings (loss) | | | (28,341,354 | ) |
| | | | |
Net assets, at value | | $ | 203,611,973 | |
| | | | |
Shares outstanding | | | 2,251,000 | |
| | | | |
Net asset value per share | | $ | 90.45 | |
| | | | |
| | | | | | | | | | |
| | | | | | |
| franklintempleton.com | | The accompanying notes are an integral part of these financial statements. | Annual Report | | | | | | | | 17 |
FRANKLIN ETF TRUST
FINANCIAL STATEMENTS
Statement of Operations
for the year ended March 31, 2023
Franklin Short Duration U.S. Government ETF
| | | | |
| |
Investment income: | | | | |
Dividends: | | | | |
Non-controlled affiliates (Note 3c) | | $ | 81,601 | |
Interest: | | | | |
Unaffiliated issuers: | | | | |
Paydown gain (loss) | | | (439,221 | ) |
Paid in casha | | | 5,790,341 | |
| | | | |
Total investment income | | | 5,432,721 | |
| | | | |
Expenses: | | | | |
Management fees (Note 3a) | | | 658,893 | |
| | | | |
Total expenses | | | 658,893 | |
| | | | |
Expense reductions (Note 4) | | | (15,879 | ) |
| | | | |
Net expenses | | | 643,014 | |
| | | | |
Net investment income | | | 4,789,707 | |
| | | | |
Realized and unrealized gains (losses): | | | | |
Net realized gain (loss) from: | | | | |
Investments: | | | | |
Unaffiliated issuers | | | (11,670,756 | ) |
Futures contracts | | | 2,554,888 | |
| | | | |
Net realized gain (loss) | | | (9,115,868 | ) |
| | | | |
Net change in unrealized appreciation (depreciation) on: | | | | |
Investments: | | | | |
Unaffiliated issuers | | | 4,025,262 | |
Futures contracts | | | (970,225 | ) |
| | | | |
Net change in unrealized appreciation (depreciation) | | | 3,055,037 | |
| | | | |
Net realized and unrealized gain (loss) | | | (6,060,831 | ) |
| | | | |
Net increase (decrease) in net assets resulting from operations | | $ | (1,271,124 | ) |
| | | | |
aIncludes amortization of premium and accretion.
| | | | | | | | | | |
| | | | | | |
| 18 | | | | | | | | Annual Report | The accompanying notes are an integral part of these financial statements. | | franklintempleton.com |
FRANKLIN ETF TRUST
FINANCIAL STATEMENTS
Statements of Changes in Net Assets
Franklin Short Duration U.S. Government ETF
| | | | | | | | |
| | | Year Ended March 31, | |
| | | 2023 | | | 2022 | |
Increase (decrease) in net assets: | | | | | | | | |
Operations: | | | | | | | | |
Net investment income | | $ | 4,789,707 | | | $ | 1,891,741 | |
Net realized gain (loss) | | | (9,115,868 | ) | | | (3,795,247 | ) |
Net change in unrealized appreciation (depreciation) | | | 3,055,037 | | | | (8,210,787 | ) |
| | | | |
Net increase (decrease) in net assets resulting from operations | | | (1,271,124 | ) | | | (10,114,293 | ) |
| | | | |
Distributions to shareholders (Note 1f) | | | (5,203,276 | ) | | | (3,570,598 | ) |
| | | | |
Capital share transactions (Note 2) | | | (149,479,794 | ) | | | (62,575,596 | ) |
| | | | |
Net increase (decrease) in net assets | | | (155,954,194 | ) | | | (76,260,487 | ) |
Net assets: | | | | | | | | |
Beginning of year | | | 359,566,167 | | | | 435,826,654 | |
| | | | |
End of year | | $ | 203,611,973 | | | $ | 359,566,167 | |
| | | | |
| | | | | | | | | | |
| | | | | | |
| franklintempleton.com | | The accompanying notes are an integral part of these financial statements. | Annual Report | | | | | | | | 19 |
FRANKLIN ETF TRUST
FRANKLIN SHORT DURATION U.S. GOVERNMENT ETF
Notes to Financial Statements
1. Organization and Significant Accounting Policies
Franklin ETF Trust (Trust) is registered under the Investment Company Act of 1940 (1940 Act) as an open-end management investment company, consisting of one fund, Franklin Short Duration U.S. Government ETF (Fund) and follows the accounting and reporting guidance in Financial Accounting Standards Board (FASB) Accounting Standards Codification Topic 946, Financial Services—Investment Companies (ASC 946) and applies the specialized accounting and reporting guidance in U.S. Generally Accepted Accounting Principles (U.S. GAAP), including, but not limited to, ASC 946. The Fund is an exchange traded fund (ETF) and is actively managed, thus it is not designed to track an index.
Effective August, 1, 2022, the Fund changed its name from Franklin Liberty Short Duration U.S. Government ETF to Franklin Short Duration U.S. Government ETF.
The following summarizes the Fund’s significant accounting policies.
a. Financial Instrument Valuation
The Fund’s investments in financial instruments are carried at fair value daily. Fair value is the price that would be received to sell an asset or paid to transfer a liability in an orderly transaction between market participants on the measurement date. The Fund calculates the net asset value (NAV) per share each business day as of 4 p.m. Eastern time or the regularly scheduled close of the New York Stock Exchange (NYSE), whichever is earlier. Under compliance policies and procedures approved by the Fund’s Board of Trustees (the Board), the Board has designated the Fund’s investment manager as the valuation designee and has responsibility for oversight of valuation. The investment manager is assisted by the Fund’s administrator in performing this responsibility, including leading the cross-functional Valuation Committee (VC). The Fund may utilize independent pricing services, quotations from securities and financial instrument dealers, and other market sources to determine fair value.
Debt securities generally trade in the over-the-counter market rather than on a securities exchange. The Fund’s pricing services use multiple valuation techniques to determine fair value. In instances where sufficient market activity exists, the pricing services may utilize a market-based approach through which quotes from market makers are used to determine fair value. In instances where sufficient market activity
may not exist or is limited, the pricing services also utilize proprietary valuation models which may consider market characteristics such as benchmark yield curves, credit spreads, estimated default rates, anticipated market interest rate volatility, coupon rates, anticipated timing of principal repayments, underlying collateral, and other unique security features in order to estimate the relevant cash flows, which are then discounted to calculate the fair value. Derivative financial instruments listed on an exchange are valued at the official closing price of the day.
Investments in open-end mutual funds are valued at the closing NAV.
The Fund has procedures to determine the fair value of financial instruments for which market prices are not reliable or readily available. Under these procedures, the Fund primarily employs a market-based approach which may use related or comparable assets or liabilities, recent transactions, market multiples, and other relevant information for the investment to determine the fair value of the investment. An income-based valuation approach may also be used in which the anticipated future cash flows of the investment are discounted to calculate fair value. Discounts may also be applied due to the nature or duration of any restrictions on the disposition of the investments. Due to the inherent uncertainty of valuations of such investments, the fair values may differ significantly from the values that would have been used had an active market existed.
b. Securities Purchased on a TBA Basis
The Fund purchases securities on a to-be-announced (TBA) basis, with payment and delivery scheduled for a future date. These transactions are subject to market fluctuations and are subject to the risk that the value at delivery may be more or less than the trade date purchase price.
c. Derivative Financial Instruments
The Fund invested in derivative financial instruments in order to manage risk or gain exposure to various other investments or markets. Derivatives are financial contracts based on an underlying or notional amount, require no initial investment or an initial net investment that is smaller than would normally be required to have a similar response to changes in market factors, and require or permit net settlement. Derivatives contain various risks including the potential inability of the counterparty to fulfill their obligations under the terms of the contract, the potential for an illiquid secondary market, and/or the potential for market movements which expose the Fund
| | | | | | | | | | |
| | | | | | |
| 20 | | | | | | | | Annual Report | | franklintempleton.com |
FRANKLIN ETF TRUST
NOTES TO FINANCIAL STATEMENTS
Franklin Short Duration U.S. Government ETF (continued)
to gains or losses in excess of the amounts shown in the Statement of Assets and Liabilities. Realized gain and loss and unrealized appreciation and depreciation on these contracts for the period are included in the Statement of Operations.
Collateral requirements differ by type of derivative. Collateral or initial margin requirements are set by the broker or exchange clearing house for exchange traded and centrally cleared derivatives. Initial margin deposited is held at the exchange and can be in the form of cash and/or securities.
The Fund entered into exchange traded futures contracts primarily to manage and/or gain exposure to interest rate risk. A futures contract is an agreement between the Fund and a counterparty to buy or sell an asset at a specified price on a future date. Required initial margins are pledged by the Fund, and the daily change in fair value is accounted for as variation margin payable or receivable in the Statement of Assets and Liabilities.
See Note 7 regarding other derivative information.
d. Mortgage Dollar Rolls
The Fund enters into mortgage dollar rolls, typically on a TBA basis. Mortgage dollar rolls are agreements between the Fund and a financial institution where the Fund sells (or buys) mortgage-backed securities for delivery on a specified date and simultaneously contracts to repurchase (or sell) substantially similar (same type, coupon, and maturity) securities at a future date and at a predetermined price. Gains or losses are realized on the initial sale, and the difference between the repurchase price and the sale price is recorded as an unrealized gain or loss to the Fund upon entering into the mortgage dollar roll. In addition, the Fund may invest the cash proceeds that are received from the initial sale. During the period between the sale and repurchase, the Fund is not entitled to principal and interest paid on the mortgage-backed securities. Transactions in mortgage dollar rolls are accounted for as purchases and sales and may result in an increase to the Fund’s portfolio turnover rate. The risks of mortgage dollar roll transactions include the potential inability of the counterparty to fulfill its obligations.
e. Income Taxes
It is the Fund’s policy to qualify as a regulated investment company under the Internal Revenue Code. The Fund intends to distribute to shareholders substantially all of its
taxable income and net realized gains to relieve it from federal income and excise taxes. As a result, no provision for U.S. federal income taxes is required.
The Fund may recognize an income tax liability related to its uncertain tax positions under U.S. GAAP when the uncertain tax position has a less than 50% probability that it will be sustained upon examination by the tax authorities based on its technical merits. As of March 31, 2023, the Fund has determined that no tax liability is required in its financial statements related to uncertain tax positions for any open tax years (or expected to be taken in future tax years). Open tax years are those that remain subject to examination and are based on the statute of limitations in each jurisdiction in which the Fund invests.
f. Security Transactions, Investment Income, Expenses and Distributions
Security transactions are accounted for on trade date. Realized gains and losses on security transactions are determined on a specific identification basis. Interest income and estimated expenses are accrued daily. Amortization of premium and accretion of discount on debt securities are included in interest income. Paydown gains and losses are recorded separately in the Statement of Operations. Dividend income is recorded on ex-dividend date. Distributions to shareholders are recorded on the ex-dividend date and are determined according to income tax regulations (tax basis). Distributable earnings determined on a tax basis may differ from earnings recorded in accordance with U.S. GAAP. These differences may be permanent or temporary. Permanent differences are reclassified among capital accounts to reflect their tax character. These reclassifications have no impact on net assets or the results of operations. Temporary differences are not reclassified, as they may reverse in subsequent periods.
Inflation-indexed bonds are adjusted for inflation through periodic increases or decreases in the security’s interest accruals, face amount, or principal redemption value, by amounts corresponding to the rate of inflation as measured by an index. Any increase or decrease in the face amount or principal redemption value will be included as inflation principal adjustments in the Statement of Operations.
g. Accounting Estimates
The preparation of financial statements in accordance with U.S. GAAP requires management to make estimates and
| | | | | | | | | | |
| | | | | | |
| franklintempleton.com | | Annual Report | | | | | | | | 21 |
FRANKLIN ETF TRUST
NOTES TO FINANCIAL STATEMENTS
Franklin Short Duration U.S. Government ETF (continued)
1. Organization and Significant Accounting Policies (continued)
g. Accounting Estimates (continued)
assumptions that affect the reported amounts of assets and liabilities at the date of the financial statements and the amounts of income and expenses during the reporting period. Actual results could differ from those estimates.
h. Guarantees and Indemnifications
Under the Fund’s organizational documents, its officers and trustees are indemnified by the Fund against certain liabilities
arising out of the performance of their duties to the Fund. Additionally, in the normal course of business, the Fund enters into contracts with service providers that contain general indemnification clauses. The Fund’s maximum exposure under these arrangements is unknown as this would involve future claims that may be made against the Trust that have not yet occurred. Currently, the Fund expects the risk of loss to be remote.
2. Shares of Beneficial Interest
Shares of the Fund are issued and redeemed at their respective NAV only in aggregations of a specified number of shares or multiples thereof (Creation Units). Only certain large institutional investors (Authorized Participants) may engage in creation or redemption transactions directly with the Fund. Once created, shares of the Fund generally trade in the secondary market in amounts less than one Creation Unit. The market price of the Fund’s shares will be based on the price in the secondary market which may be at, above or below the most recent NAV. Creation Units may be issued and redeemed for cash and/or in-kind. For the years ended March 31, 2023 and 2022, all Creations Unit transactions were made in cash.
Authorized participants pay a standard transaction fee to the shareholder servicing agent when purchasing or redeeming Creation Units of the Fund regardless of the number of Creation Units that are being created or redeemed on the same day by the Authorized Participant. The standard transaction fee is imposed to offset transfer and other transaction costs associated with the issuance and redemption of Creation Units and is not charged to or paid by the Fund.
In addition, for cash Creation Unit transactions, a variable fee for creation transactions and redemption transactions may be charged to the Authorized Participant to cover certain brokerage, tax, foreign exchange, execution, market impact and other costs and expenses related to the execution of trades. Variable fees, if any, are included in capital share transactions in the Statements of Changes in Net Assets.
At March 31, 2023, there were an unlimited number of shares authorized (without par value). Transactions in the Fund’s shares were as follows:
| | | | | | | | | | | | | | | | |
| | | Year Ended March 31, | |
| | |
| | | 2023 | | | 2022 | |
| | | | |
| | | Shares | | | Amount | | | Shares | | | Amount | |
Shares sold | | | 325,000 | | | $ | 29,461,533 | | | | 850,000 | | | $ | 80,571,449 | |
Shares redeemed | | | (1,975,000 | ) | | | (178,941,327 | ) | | | (1,525,000 | ) | | | (143,147,045 | ) |
| | | | |
Net increase (decrease) | | | (1,650,000 | ) | | $ | (149,479,794 | ) | | | (675,000 | ) | | $ | (62,575,596 | ) |
| | | | |
| | | | | | | | | | |
| | | | | | |
| 22 | | | | | | | | Annual Report | | franklintempleton.com |
FRANKLIN ETF TRUST
NOTES TO FINANCIAL STATEMENTS
Franklin Short Duration U.S. Government ETF (continued)
3. Transactions with Affiliates
Franklin Resources, Inc. is the holding company for various subsidiaries that together are referred to as Franklin Templeton. Certain officers and trustees of the Fund are also officers and/or directors of the following subsidiaries:
| | |
| |
| Subsidiary | | Affiliation |
Franklin Advisers, Inc. (Advisers) | | Investment manager |
Franklin Templeton Services, LLC (FT Services) | | Administrative manager |
Franklin Distributors, LLC (Distributors) | | Principal underwriter |
a. Management Fees
The Fund pays Advisers a unified management fee for managing the Fund’s assets, as approved by the Board. Pursuant to the investment management agreement with the Trust on behalf of the Fund effective October 1, 2021, Advisers reimburses the Fund for all acquired fund fees and expenses (such as those associated with the Fund’s investment in a Franklin Templeton money fund) and pays all of the ordinary operating expenses of the Fund, except for (i) the Fund’s management fee, (ii) payments under the Fund’s Rule 12b-1 plan (if any), (iii) brokerage expenses (including any costs incidental to transactions in portfolio securities or instruments), (iv) taxes, (v) interest (including borrowing costs and dividend expenses on securities sold short and overdraft charges), (vi) litigation expenses (including litigation to which the Trust or the Fund may be a party and indemnification of the Trustees and officers with respect thereto), and (vii) other non-routine or extraordinary expenses. The Fund pays 0.25% per year of the average daily net assets of the Fund.
b. Administrative Fees
Under an agreement with Advisers, FT Services provides administrative services to the Fund. The fee is paid by Advisers based on the Fund’s average daily net assets, and is not an additional expense of the Fund.
c. Investments in Affiliated Management Investment Companies
The Fund invests in one or more affiliated management investment companies. As defined in the 1940 Act, an investment is deemed to be a “Controlled Affiliate” of a fund when a fund owns, either directly or indirectly, 25% or more of the affiliated fund’s outstanding shares or has the power to exercise control over management or policies of such fund. The Fund does not invest for purposes of exercising a controlling influence over the management or policies. Management fees paid by the Fund are waived on assets invested in the affiliated management investment companies as noted in the Statement of Operations, in an amount not to exceed the management and administrative fees paid directly or indirectly by each affiliate. During the year ended March 31, 2023, the Fund held investments in affiliated management investment companies as follows:
| | | | | | | | | | | | | | | | | | | | | | | | | | | | | | | | |
| | | | | | | | |
| | | Value at
Beginning
of Year | | | Purchases | | | Sales | | | Realized
Gain (Loss) | | | Net Change in
Unrealized
Appreciation
(Depreciation) | | | Value at
End of
Year | | | Number
of Shares
Held at
End
of Year | | | Dividend
Income | |
| | | | | | | | |
| Non-Controlled Affiliates | | | | | | | | | | | | | | | | | | | | | | | | | | | | | | | | |
Institutional Fiduciary Trust Money Market Portfolio, 4.37% | | $ | 8,708,845 | | | $ | 222,055,841 | | | $ | (222,646,379 | ) | | $ | — | | | $ | — | | | $ | 8,118,307 | | | | 8,118,307 | | | $ | 81,601 | |
d. Other Affiliated Transactions
At March 31, 2023, Franklin Resources Inc. owned 0.1% of the Fund’s outstanding shares.
| | | | | | | | | | |
| | | | | | |
| franklintempleton.com | | Annual Report | | | | | | | | 23 |
FRANKLIN ETF TRUST
NOTES TO FINANCIAL STATEMENTS
Franklin Short Duration U.S. Government ETF (continued)
4. Expense Offset Arrangement
The Fund has entered into an arrangement with its custodian whereby credits realized as a result of uninvested cash balances are used to reduce a portion of the Fund’s custodian expenses. During the year March 31, 2023, the custodian fees were reduced as noted in the Statement of Operations.
5. Income Taxes
For tax purposes, capital losses may be carried over to offset future capital gains, if any. At March 31, 2023, the capital loss carryforwards were as follows:
| | | | |
| Capital loss carryforwards: | | | |
Short term | | $ | 14,565,669 | |
Long term | | | 9,919,716 | |
| | | | |
Total capital loss carryforwards | | $ | 24,485,385 | |
| | | | |
The tax character of distributions paid during the years ended March 31, 2023 and 2022 was as follows:
| | | | | | | | |
| |
| | | March 31, | |
| | |
| | | 2023 | | | 2022 | |
Distributions paid from ordinary income | | $ | 5,203,276 | | | $ | 3,570,598 | |
| | | | |
At March 31, 2023, the cost of investments, net unrealized appreciation (depreciation) and undistributed ordinary income for income tax purposes were as follows:
| | | | |
Cost of investments | | $ | 223,868,854 | |
| | | | |
Unrealized appreciation | | $ | 468,884 | |
Unrealized depreciation | | | (4,996,055 | ) |
| | | | |
Net unrealized appreciation (depreciation) | | $ | (4,527,171 | ) |
| | | | |
Distributable earnings – undistributed ordinary income | | $ | 671,202 | |
| | | | |
Differences between income and/or capital gains as determined on a book basis and a tax basis are primarily due to differing treatments of paydown losses and bond discounts and premiums.
6. Investment Transactions
Purchases and sales of investments (excluding short term securities) for the year ended March 31, 2023, aggregated $568,295,653 and $739,768,536, respectively.
7. Other Derivative Information
At March 31, 2023, the Fund’s investments in derivative contracts are reflected in the Statement of Assets and Liabilities as follows:
| | | | | | | | | | | | |
| | |
| | | Asset Derivatives | | | Liability Derivatives | |
| | | | |
Derivative Contracts
Not Accounted for as
Hedging Instruments | | Statement of Assets and
Liabilities Location | | Fair Value | | | Statement of Assets and
Liabilities Location | | Fair Value | |
| | | | |
Interest rate contracts | | Variation margin | | $ | 350,861 | a | | Variation margin | | $ | 483,420 | a |
aThis amount reflects the cumulative appreciation (depreciation) of futures contracts as reported in the Schedule of Investments. Only the variation margin receivable/payable at year end is separately reported within the Statement of Assets and Liabilities. Prior variation margin movements were recorded to cash upon receipt or payment.
| | | | | | | | | | |
| | | | | | |
| 24 | | | | | | | | Annual Report | | franklintempleton.com |
FRANKLIN ETF TRUST
NOTES TO FINANCIAL STATEMENTS
Franklin Short Duration U.S. Government ETF (continued)
For the year ended March 31, 2023, the effect of derivative contracts in the Fund’s Statement of Operations was as follows:
| | | | | | | | | | | | |
| | | | |
Derivative Contracts
Not Accounted for as
Hedging Instruments | | Statement of Operations Locations | | Net Realized
Gain (Loss) for the Year | | | Statement of Operations Locations | | Net Change in Unrealized Appreciation (Depreciation) for the Year | |
| | | | |
| | Net realized gain (loss) from: | | | | | | Net change in unrealized appreciation (depreciation) on: | | | | |
Interest rate contracts | | Futures contracts | | $ | 2,554,888 | | | Futures contracts | | $ | (970,225 | ) |
For the year ended March 31, 2023, the average month end notional amount of futures contracts represented $44,964,682.
See Note 1(c) regarding derivative financial instruments.
8. Fair Value Measurements
The Fund follows a fair value hierarchy that distinguishes between market data obtained from independent sources (observable inputs) and the Fund’s own market assumptions (unobservable inputs). These inputs are used in determining the value of the Fund’s financial instruments and are summarized in the following fair value hierarchy:
| | • | | Level 1 – quoted prices in active markets for identical financial instruments |
| | • | | Level 2 – other significant observable inputs (including quoted prices for similar financial instruments, interest rates, prepayment speed, credit risk, etc.) |
| | • | | Level 3 – significant unobservable inputs (including the Fund’s own assumptions in determining the fair value of financial instruments) |
The inputs levels are not necessarily an indication of the risk or liquidity associated with financial instruments at that level.
A summary of inputs used as of March 31, 2023, in valuing the Fund’s assets carried at fair value, is as follows:
| | | | | | | | | | | | | | | | |
| | | | |
| | | Level 1 | | | Level 2 | | | Level 3 | | | Total | |
| | | | |
| Assets: | | | | | | | | | | | | | | | | |
Investments in Securities: | | | | | | | | | | | | | | | | |
U.S. Government and Agency Securities | | $ | — | | | $ | 69,941,728 | | | $ | — | | | $ | 69,941,728 | |
Mortgage-Backed Securities | | | — | | | | 141,410,815 | | | | — | | | | 141,410,815 | |
Short Term Investments | | | 8,118,307 | | | | — | | | | — | | | | 8,118,307 | |
| | | | |
Total Investments in Securities | | $ | 8,118,307 | | | $ | 211,352,543 | | | $ | — | | | $ | 219,470,850 | |
| | | | |
Other Financial Instruments: | | | | | | | | | | | | | | | | |
Futures Contracts | | $ | 350,861 | | | $ | — | | | $ | — | | | $ | 350,861 | |
| | | | |
| | | | |
| Liabilities: | | | | | | | | | | | | | | | | |
Other Financial Instruments: | | | | | | | | | | | | | | | | |
Futures Contracts | | $ | 483,420 | | | $ | — | | | $ | — | | | $ | 483,420 | |
| | | | |
9. New Accounting Pronouncement
In March 2020, the FASB issued Accounting Standards Update (ASU) No. 2020-04, Reference Rate Reform (Topic 848)—Facilitation of the Effects of Reference Rate Reform on Financial Reporting. In January 2021 and December 2022, the FASB issued ASU No. 2021-01 and ASU No. 2022-06, with further amendments to Topic 848. The amendments in the ASUs provide optional temporary accounting recognition and financial reporting relief from the effect of certain types of contract modifications due to the planned discontinuation of the London Interbank Offered Rate (LIBOR) and other interbank-offered based reference rates as of the end of 2021 for certain LIBOR settings and 2023 for the remainder. The ASUs are effective for certain reference
| | | | | | | | | | |
| | | | | | |
| franklintempleton.com | | Annual Report | | | | | | | | 25 |
FRANKLIN ETF TRUST
NOTES TO FINANCIAL STATEMENTS
Franklin Short Duration U.S. Government ETF (continued)
9. New Accounting Pronouncement (continued)
rate-related contract modifications that occur during the period March 12, 2020 through December 31, 2024. Management has reviewed the requirements and believes the adoption of these ASUs will not have a material impact on the financial statements.
10. Subsequent Events
The Fund has evaluated subsequent events through the issuance of the financial statements and determined that no events have occurred that require disclosure.
Abbreviations
| | |
| Selected Portfolio |
| CMT | | Constant Maturity Treasury Index |
| COF | | Cost of Funds |
| FRN | | Floating Rate Note |
| LIBOR | | London InterBank Offered Rate |
| MBS | | Mortgage-Backed Security |
| SOFR | | Secured Overnight Financing Rate |
| USD | | United States Dollar |
| | | | | | | | | | |
| | | | | | |
| 26 | | | | | | | | Annual Report | | franklintempleton.com |
FRANKLIN ETF TRUST
Report of Independent Registered Public Accounting Firm
To the Board of Trustees of Franklin ETF Trust and Shareholders of Franklin Short Duration U.S. Government ETF
Opinion on the Financial Statements
We have audited the accompanying statement of assets and liabilities, including the schedule of investments, of Franklin Short Duration U.S. Government ETF (one of the funds constituting Franklin ETF Trust, referred to hereafter as the “Fund”) as of March 31, 2023, the related statement of operations for the year ended March 31, 2023, the statement of changes in net assets for each of the two years in the period ended March 31, 2023, including the related notes, and the financial highlights for each of the five years in the period ended March 31, 2023 (collectively referred to as the “financial statements”). In our opinion, the financial statements present fairly, in all material respects, the financial position of the Fund as of March 31, 2023, the results of its operations for the year then ended, the changes in its net assets for each of the two years in the period ended March 31, 2023 and the financial highlights for each of the five years in the period ended March 31, 2023 in conformity with accounting principles generally accepted in the United States of America.
Basis for Opinion
These financial statements are the responsibility of the Fund’s management. Our responsibility is to express an opinion on the Fund’s financial statements based on our audits. We are a public accounting firm registered with the Public Company Accounting Oversight Board (United States) (PCAOB) and are required to be independent with respect to the Fund in accordance with the U.S. federal securities laws and the applicable rules and regulations of the Securities and Exchange Commission and the PCAOB.
We conducted our audits of these financial statements in accordance with the standards of the PCAOB. Those standards require that we plan and perform the audit to obtain reasonable assurance about whether the financial statements are free of material misstatement, whether due to error or fraud.
Our audits included performing procedures to assess the risks of material misstatement of the financial statements, whether due to error or fraud, and performing procedures that respond to those risks. Such procedures included examining, on a test basis, evidence regarding the amounts and disclosures in the financial statements. Our audits also included evaluating the accounting principles used and significant estimates made by management, as well as evaluating the overall presentation of the financial statements. Our procedures included confirmation of securities owned as of March 31, 2023 by correspondence with the custodian, transfer agent and brokers; when replies were not received from brokers, we performed other auditing procedures. We believe that our audits provide a reasonable basis for our opinion.
PricewaterhouseCoopers LLP
San Francisco, California
May 18, 2023
We have served as the auditor of one or more investment companies in the Franklin Templeton funds since 1948.
| | | | | | | | | | |
| | | | | | |
| franklintempleton.com | | Annual Report | | | | | | | | 27 |
FRANKLIN ETF TRUST
Tax Information (unaudited)
Under section 871(k)(1)(C) of the Internal Revenue Code, the Fund hereby reports the maximum amount allowable but no less than $5,186,946 as interest related dividends for purposes of the tax imposed under Section 871(a)(1)(A) of the Internal Revenue Code for the fiscal year ended March 31, 2023.
| | | | | | | | | | |
| | | | | | |
| 28 | | | | | | | | Annual Report | | franklintempleton.com |
FRANKLIN ETF TRUST
Board Members and Officers
The name, year of birth and address of the officers and board members, as well as their affiliations, positions held with the Trust, principal occupations during at least the past five years and number of U.S. registered portfolios overseen in the Franklin Templeton/Legg Mason fund complex, are shown below. Generally, each board member serves until that person’s successor is elected and qualified.
Independent Board Members
| | | | | | | | |
| | | | |
Name, Year of Birth
and Address | | Position | | Length of
Time Served | | Number of Portfolios in
Fund Complex Overseen
by Board Member* | | Other Directorships Held During
at Least the Past 5 Years |
| | | | |
Rohit Bhagat (1964)
One Franklin Parkway
San Mateo, CA 94403-1906 | | Lead Independent Trustee and Trustee | | Since 2017 | | 59 | | AssetMark Financial Holdings, Inc. (investment solutions) (2018-present) and PhonePe (2020-present) (payment and financial services); formerly, Axis Bank (financial) (2013-2021), FlipKart Limited (2019-2020) (eCommerce company); CapFloat Financial Services Pvt., Ltd. (non-banking finance company) (2018) and Zentific Investment Management (hedge fund) (2015-2018). |
|
| Principal Occupation During at Least the Past 5 Years: |
| Managing Member, Mukt Capital, LLC (private investment firm) (2014-present); Advisor, Optimal Asset Management (investment technology and advisory services company) (2015-present); Chief Executive Officer and Director, FinTech Evolution Acquisition (eCommerce company) (February 2021-present); and formerly, Chairman, Asia Pacific, BlackRock (2009-2012); Global Chief Operating Officer, Barclays Global Investors (investment management) (2005-2009); and Senior Partner, The Boston Consulting Group (management consulting) (1992-2005). |
| | | | |
Deborah D. McWhinney (1955)
One Franklin Parkway
San Mateo, CA 94403-1906 | | Trustee | | Since 2020 | | 59 | | S&P Global, Inc. (financial information services) (2022-present), Borg Warner (automotive) (2018-present), LegalShield (consumer services) (2020-present); and formerly, IHS Markit (information services) (2015-2022), Fluor Corporation (construction and engineering) (2014-2020) and Focus Financial Partner, LLC (financial services) (2018-2020). |
|
| Principal Occupation During at Least the Past 5 Years: |
| Director of various companies; and formerly, Board Member, Lloyds Banking Group (2015-2018) (financial institution) and Fresenius Medical Group (2016-2018) (healthcare); Chief Executive Officer (2013-2014) and Chief Operating Officer (2011-2013), CitiGroup Global Enterprise Payments (financial services); and President, Citi’s Personal Banking and Wealth Management (2009-2011). |
| | | | |
Anantha K. Pradeep (1963)
One Franklin Parkway
San Mateo, CA 94403-1906 | | Trustee | | Since 2017 | | 59 | | None |
|
| Principal Occupation During at Least the Past 5 Years: |
| Chief Executive Officer, Smilable, Inc. (technology company) (2014-present); Chief Executive Officer, MachineVantage (technology company) (2018-present); Founder and Managing Partner, Consult Meridian, LLC (consulting company) (2009-present); and formerly, Founder, BoardVantage (board portal solutions provider delivering paperless process for boards and leadership) (2000-2002). |
| | | | | | | | | | |
| | | | | | |
| franklintempleton.com | | Annual Report | | | | | | | | 29 |
FRANKLIN ETF TRUST
Interested Board Members and Officers
| | | | | | | | |
| | | | |
Name, Year of Birth
and Address | | Position | | Length of
Time Served | | Number of Portfolios in
Fund Complex Overseen
by Board Member* | | Other Directorships Held During
at Least the Past 5 Years |
| | | | |
**Jennifer M. Johnson (1964)
One Franklin Parkway
San Mateo, CA 94403-1906 | | Trustee and Chairperson of the Board | | Since 2017 | | 70 | | None |
|
| Principal Occupation During at Least the Past 5 Years: |
| Chief Executive Officer, President and Director, Franklin Resources, Inc.; officer and/or director or trustee, of some of the other subsidiaries of Franklin Resources, Inc. and of certain funds in the Franklin Templeton/Legg Mason fund complex; and formerly, Chief Operating Officer and Executive Vice President, Franklin Resources, Inc. (1994-2015); Executive Vice President of Operations and Technology, Franklin Resources, Inc. (2005-2010); and Senior Vice President, Franklin Resources, Inc. (2003-2005). |
| | | | |
Alison E. Baur (1964)
One Franklin Parkway
San Mateo, CA 94403-1906 | | Vice President | | Since 2012 | | Not Applicable | | Not Applicable |
|
| Principal Occupation During at Least the Past 5 Years: |
| Deputy General Counsel, Franklin Templeton; and officer of some of the other subsidiaries of Franklin Resources, Inc. and of certain funds in the Franklin Templeton/Legg Mason fund complex. |
| | | | |
Steven J. Gray (1955)
One Franklin Parkway
San Mateo, CA 94403-1906 | | Vice President | | Since 2012 | | Not Applicable | | Not Applicable |
|
| Principal Occupation During at Least the Past 5 Years: |
| Senior Associate General Counsel, Franklin Templeton; Assistant Secretary, Franklin Distributors, LLC; and officer of certain funds in the Franklin Templeton/Legg Mason fund complex. |
| | | | |
Matthew T. Hinkle (1971)
One Franklin Parkway
San Mateo, CA 94403-1906 | | Chief Executive
Officer –
Finance and
Administration | | Since 2017 | | Not Applicable | | Not Applicable |
|
| Principal Occupation During at Least the Past 5 Years: |
| Senior Vice President, Franklin Templeton Services, LLC; officer of certain funds in the Franklin Templeton/Legg Mason fund complex; and formerly, Vice President, Global Tax (2012-April 2017) and Treasurer/Assistant Treasurer, Franklin Templeton (2009-2017). |
| | | | |
Fred Jensen (1963) 280 Park Avenue New York, NY 10017 | | Chief Compliance Officer | | Since 2021 | | Not Applicable | | Not Applicable |
|
| Principal Occupation During at Least the Past 5 Years: |
| Director – Global Compliance of Franklin Templeton; Managing Director of Legg Mason & Co.; Director of Compliance, Legg Mason Office of the Chief Compliance Officer; Chief Compliance Officer, Franklin Advisory Services, LLC; Compliance Officer, Franklin Advisers, Inc.; officer of certain funds in the Franklin Templeton/Legg Mason fund complex; formerly, Chief Compliance Officer of Legg Mason Global Asset Allocation; Chief Compliance Officer, Legg Mason Private Portfolio; Chief Compliance Officer to The Reserves Funds (investment adviser, funds and broker-dealer) and Ambac Financial Group (investment adviser, funds and broker-dealer). |
| | | | |
Susan Kerr (1949)
280 Park Avenue New York, NY 10017 | | Vice President – AML Compliance | | Since 2021 | | Not Applicable | | Not Applicable |
|
| Principal Occupation During at Least the Past 5 Years: |
| Senior Compliance Analyst, Franklin Templeton; Chief Anti-Money Laundering Compliance Officer, Legg Mason & Co., or its affiliates; Anti Money Laundering Compliance Officer; Senior Compliance Officer, LMIS; and officer of certain funds in the Franklin Templeton/Legg Mason fund complex |
| | | | | | | | | | |
| | | | | | |
| 30 | | | | | | | | Annual Report | | franklintempleton.com |
FRANKLIN ETF TRUST
Interested Board Members and Officers (continued)
| | | | | | | | |
| | | | |
Name, Year of Birth
and Address | | Position | | Length of
Time Served | | Number of Portfolios in
Fund Complex Overseen
by Board Member* | | Other Directorships Held During
at Least the Past 5 Years |
| | | | |
David Mann (1973) One Franklin Parkway San Mateo, CA 94403-1906 | | Vice President | | Since March 2023 | | Not Applicable | | Not Applicable |
|
| Principal Occupation During at Least the Past 5 Years: |
| Head of Global ETF Product and Capital Markets, Franklin Templeton; and officer of certain funds in the Franklin Templeton/Legg Mason fund complex. |
| | | | |
Todd Mathias (1983) One Franklin Parkway, San Mateo, Ca 94403-1906 | | Vice President | | Since March 2022 | | Not Applicable | | Not Applicable |
|
| Principal Occupation During at Least the Past 5 Years: |
| Head of US ETF Product Strategy, Franklin Templeton; and officer of certain funds in the Franklin Templeton/Legg Mason fund complex. |
| | | | |
Patrick O’Connor (1967)
One Franklin Parkway
San Mateo, CA 94403-1906 | | President and
Chief Executive
Officer –
Investment
Management | | Since 2017 | | Not Applicable | | Not Applicable |
|
| Principal Occupation During at Least the Past 5 Years: |
| President and Chief Investment Officer, Franklin Advisory Services, LLC; Senior Vice President, Franklin Advisers, Inc.; and officer of certain funds in the Franklin Templeton/Legg Mason fund complex. |
| | | | |
Vivek Pai (1970) 300 S.E. 2nd Street Fort Lauderdale, FL 33301-1923 | | Treasurer, Chief Financial Officer and Chief Accounting Officer | | Since 2019 | | Not Applicable | | Not Applicable |
|
| Principal Occupation During at Least the Past 5 Years: |
| Treasurer, U.S. Fund Administration & Reporting and officer of certain funds in the Franklin Templeton/Legg Mason fund complex. |
| | | | |
Navid J. Tofigh (1972)
One Franklin Parkway
San Mateo, CA 94403-1906 | | Vice President and Secretary | | Vice President since 2015 and Secretary since 2017 | | Not Applicable | | Not Applicable |
|
| Principal Occupation During at Least the Past 5 Years: |
| Senior Associate General Counsel, Franklin Templeton; and officer of certain funds in the Franklin Templeton/Legg Mason fund complex. |
| | | | |
Lori A. Weber (1964)
300 S.E. 2nd Street
Fort Lauderdale, FL 33301-1923 | | Vice President | | Vice President since 2011 and Secretary since 2013 | | Not Applicable | | Not Applicable |
|
| Principal Occupation During at Least the Past 5 Years: |
| Senior Associate General Counsel, Franklin Templeton; Assistant Secretary, Franklin Resources, Inc.; Vice President and Secretary, Templeton Investment Counsel, LLC; and officer of certain funds in the Franklin Templeton/Legg Mason fund complex. |
*We base the number of portfolios on each separate series of the U.S. registered investment companies within the Franklin Templeton/Legg Mason fund complex. These portfolios have a common investment manager or affiliated investment managers.
**Jennifer M. Johnson is considered to be an interested person of the Fund under the federal securities laws due to her position as an officer and director of Franklin Resources, Inc. (Resources), which is the parent company of the Fund’s investment manager and distributor.
Note 1: Officer information is current as of the date of this report. It is possible that after this date, information about officers may change.
| | | | | | | | | | |
| | | | | | |
| franklintempleton.com | | Annual Report | | | | | | | | 31 |
FRANKLIN ETF TRUST
The Sarbanes-Oxley Act of 2002 and Rules adopted by the Securities and Exchange Commission require the Fund to disclose whether the Fund’s Audit Committee includes at least one member who is an audit committee financial expert within the meaning of such Act and Rules. The Fund’s Board has determined that there is at least one such financial expert on the Audit Committee and has designated Rohit Bhagat and Deborah D. McWhinney as its audit committee financial experts. The Board believes that Mr. Bhagat and Ms. McWhinney qualify as such an expert in view of their extensive business background and experience, including extensive experience in the financial services industries. Mr. Bhagat has been a Member and Chairman of the Fund’s Audit Committee since 2017. Ms. McWhinney has been a member of the Fund Audit Committee since 2020. As a result of such background and experience, the Board believes that Mr. Bhagat and Ms. McWhinney have acquired an understanding of generally accepted accounting principles and financial statements, the general application of such principles in connection with the accounting estimates, accruals and reserves, and analyzing and evaluating financial statements that present a breadth and level of complexity of accounting issues generally comparable to those of the Fund, as well as an understanding of internal controls and procedures for financial reporting and an understanding of audit committee functions. Mr. Bhagat and Ms. McWhinney are independent Board members as that term is defined under the relevant Securities and Exchange Commission Rules and Releases.
The Statement of Additional Information (SAI) includes additional information about the board members and is available, without charge, upon request. Shareholders may call (800) DIAL BEN/342-5236 to request the SAI.
| | | | | | | | | | |
| | | | | | |
| 32 | | | | | | | | Annual Report | | franklintempleton.com |
FRANKLIN ETF TRUST
Shareholder Information
Proxy Voting Policies and Procedures
The Fund’s investment manager has established Proxy Voting Policies and Procedures (Policies) that the Fund uses to determine how to vote proxies relating to portfolio securities. Shareholders may view the Fund’s complete Policies online at franklintempleton.com. Alternatively, shareholders may request copies of the Policies free of charge by calling the Proxy Group collect at (954) 527-7678 or by sending a written request to: Franklin Templeton Companies, LLC, 300 S.E. 2nd Street, Fort Lauderdale, FL 33301, Attention: Proxy Group. Copies of the Fund’s proxy voting records are also made available online at franklintempleton.com and posted on the U.S. Securities and Exchange Commission’s website at sec.gov and reflect the most recent 12-month period ended June 30.
Quarterly Schedule of Investments
The Trust, on behalf of the Fund, files a complete schedule of investments with the U.S. Securities and Exchange Commission for the first and third quarters for each fiscal year as an exhibit to its report on Form N-PORT. Shareholders may view the filed Form N-PORT by visiting the Commission’s website at sec.gov. The filed form may also be viewed and copied at the Commission’s Public Reference Room in Washington, DC. Information regarding the operations of the Public Reference Room may be obtained by calling (800) SEC-0330.
Premium/Discount Information
Information about the differences between the daily market price on the secondary market for the shares of the Fund and the Fund’s net asset value may be found on the Fund’s website at franklintempleton.com.
| | | | | | | | | | |
| | | | | | |
| franklintempleton.com | | Annual Report | | | | | | | | 33 |
Authorized for distribution only when accompanied or preceded by a summary prospectus and/or prospectus. Investors should carefully consider a fund’s investment goals, risks, charges and expenses before investing. A prospectus contains this and other information; please read it carefully before investing.
To help ensure we provide you with quality service, all calls to and from our service areas are monitored and/or recorded.
| | | | | | |
 | | Annual Report Franklin Short Duration U.S. Government ETF | | |
| | | |
| | Investment Manager | | Distributor | | Investor Services |
| | Franklin Advisers, Inc. | | Franklin Distributors, LLC (800) DIAL BEN®/342-5236 franklintempleton.com | | Transfer Agent BNY Mellon (855) 231-1706 111 Sanders Creek Parkway East Syracuse, NY 13057 |
| © 2023 Franklin Templeton Investments. All rights reserved. | | | | FTSD A 05/23 |
(a) The Registrant has adopted a code of ethics that applies to its principal executive officers and principal financial and accounting officer.
(c) N/A
(d) N/A
(f) Pursuant to Item 13(a)(1), the Registrant is attaching as an exhibit a copy of its code of ethics that applies to its principal executive officers and principal financial and accounting officer.
| Item 3. | Audit Committee Financial Expert. |
(a)(1) The Registrant has an audit committee financial expert serving on its audit committee.
(2) The audit committee financial experts are Rohit Bhagat and Deborah D. McWhinney. They are “independent” as defined under the relevant Securities and Exchange Commission Rules and Releases.
| Item 4. | Principal Accountant Fees and Services. |
Audit Fees
(a) The aggregate fees paid to the principal accountant for professional services rendered by the principal accountant for the audit of the registrant’s annual financial statements or for services that are normally provided by the principal accountant in connection with statutory and regulatory filings or engagements were $25,260 for the fiscal year ended March 31, 2023 and $60,863 for the fiscal year ended March 31, 2022.
Audit-Related Fees
(b) There were no fees paid to the principal accountant for assurance and related services rendered by the principal accountant to the registrant that are reasonably related to the performance of the audit of the registrant’s financial statements and are not reported under paragraph (a) of Item 4.
There were no fees paid to the principal accountant for assurance and related services rendered by the principal accountant to the registrant’s investment adviser and any entity controlling, controlled by or under common control with the investment adviser that provides ongoing services to the registrant that are reasonably related to the performance of the audit of their financial statements.
Tax Fees
(c) There were no fees paid to the principal accountant for professional services rendered by the principal accountant to the registrant for tax compliance, tax advice and tax planning.
The aggregate fees paid to the principal accountant for professional services rendered by the principal accountant to the registrant’s investment adviser and any entity controlling, controlled by or under common control with the investment adviser that provides ongoing services to the registrant for tax compliance, tax advice and tax planning were $70,000 for the fiscal year ended March 31, 2023 and $0 for the fiscal year ended March 31, 2022. The services for which these fees were paid included global access to tax platform International Tax View.
All Other Fees
(d) There were no fees paid to the principal accountant for products and services rendered by the principal accountant to the registrant not reported in paragraphs (a)-(c) of Item 4 were $0 for the fiscal year ended March 31, 2023 and $172 for the fiscal year ended March 31, 2022. The services for which these fees were paid included review of materials provided to the fund Board in connection with the investment management contract renewal process.
The aggregate fees paid to the principal accountant for products and services rendered by the principal accountant to the registrant’s investment adviser and any entity controlling, controlled by or under common control with the investment adviser that provides ongoing services to the registrant not reported in paragraphs (a)-(c) of Item 4 were $75,711 for the fiscal year ended March 31, 2023 and $243,743 for the fiscal year ended March 31, 2022. The services for which these fees were paid included the professional fees in connection with SOC 1 Reports, professional services relating to the readiness assessment over Greenhouse Gas Emissions and Energy, professional fees in connection with determining the feasibility of a U.S. direct lending structure, fees in connection with license for employee development tool ProEdge and fees in connection with a license for accounting and business knowledge platform Viewpoint.
(e)(1) The registrant’s audit committee is directly responsible for approving the services to be provided by the auditors, including:
(i) pre-approval of all audit and audit related services;
(ii) pre-approval of all non-audit related services to be provided to the Fund by the auditors;
(iii) pre-approval of all non-audit related services to be provided to the registrant by the auditors to the registrant’s investment adviser or to any entity that controls, is controlled by or is under common control with the registrant’s investment adviser and that provides ongoing services to the registrant where the non-audit services relate directly to the operations or financial reporting of the registrant; and
(iv) establishment by the audit committee, if deemed necessary or appropriate, as an alternative to committee pre-approval of services to be provided by the auditors, as required by paragraphs (ii) and (iii) above, of policies and procedures to permit such services to be pre-approved by other means, such as through establishment of guidelines or by action of a designated member or members of the committee; provided the policies and procedures are detailed as to the particular service and the committee is informed of each service and such policies and procedures do not include delegation of audit committee responsibilities, as contemplated under the Securities Exchange Act of 1934, to management; subject, in the case of (ii) through (iv), to any waivers, exceptions or exemptions that may be available under applicable law or rules.
(e) (2) None of the services provided to the registrant described in paragraphs (b)-(d) of Item 4 were approved by the audit committee pursuant to paragraph (c)(7)(i)(C) of Rule 2-01 of regulation S-X.
(f) No disclosures are required by this Item 4(f).
(g) The aggregate non-audit fees paid to the principal accountant for services rendered by the principal accountant to the registrant and the registrant’s investment adviser and any entity controlling, controlled by or under common control with the investment adviser that provides ongoing services to the registrant were $145,711 for the fiscal year ended March 31, 2023 and $243,915 for the fiscal year ended March 31, 2022.
(h) The registrant’s audit committee of the board has considered whether the provision of non-audit services that were rendered to the registrant’s investment adviser (not including any sub-adviser whose role is primarily portfolio management and is subcontracted with or overseen by another investment adviser), and any entity controlling, controlled by, or under common control with the investment adviser that provides ongoing services to the registrant that were not pre-approved pursuant to paragraph (c)(7)(ii) of Rule 2-01 of Regulation S-X is compatible with maintaining the principal accountant’s independence.
(i) N/A
(j) N/A
| Item 5. | Audit Committee of Listed Registrants. |
Not Applicable.
Not applicable.
| Item 7. | Disclosure of Proxy Voting Policies and Procedures for Closed-End Management Investment Companies. |
Not applicable.
| Item 8. | Portfolio Managers of Closed-End Management Investment Companies. |
Not applicable.
| Item 9. | Purchases of Equity Securities by Closed-End Management Investment Company and Affiliated Purchasers. |
Not applicable.
| Item 10. | Submission of Matters to a Vote of Security Holders. |
There have been no changes to the procedures by which shareholders may recommend nominees to the Registrant’s Board of Trustees that would require disclosure herein.
| Item 11. | Controls and Procedures. |
| | (a) | Evaluation of Disclosure Controls and Procedures. The Registrant maintains disclosure controls and procedures that are designed to provide reasonable assurance that information required to be disclosed in the Registrant’s filings under the Securities Exchange Act of 1934, as amended, and the Investment Company Act of 1940 is recorded, processed, summarized and reported within the periods specified in the rules and forms of the Securities and Exchange Commission. Such information is accumulated and communicated to the Registrant’s management, including its principal executive officer and principal financial officer, as appropriate, to allow timely decisions regarding required disclosure. The Registrant’s management, including the principal executive officer and the principal financial officer, recognizes that any set of controls and procedures, no matter how well designed and operated, can provide only reasonable assurance of achieving the desired control objectives. |
Within 90 days prior to the filing date of this Shareholder Report on Form N-CSR, the Registrant had carried out an evaluation, under the supervision and with the participation of the Registrant’s management, including the Registrant’s principal executive officer and the Registrant’s principal financial officer, of the effectiveness of the design and operation of the Registrant’s disclosure controls and procedures. Based on such evaluation, the Registrant’s principal executive officer and principal financial officer concluded that the Registrant’s disclosure controls and procedures are effective.
| | (b) | Changes in Internal Controls. There have been no changes in the Registrant’s internal control over financial reporting that occurred during the period covered by this report that has materially affected, or is reasonably likely to materially affect the internal control over financial reporting. |
| Item 12. | Disclosure of Securities Lending Activities for Closed-End Management Investment Companies. |
Not applicable.
(a)(1) Code of Ethics
(a)(2) Certifications pursuant to Section 302 of the Sarbanes-Oxley Act of 2002 of Matthew T. Hinkle, Chief Executive Officer—Finance and Administration, and Vivek Pai, Chief Financial Officer and Chief Accounting Officer
(a)(2)(1) There were no written solicitations to purchase securities under Rule 23c-1 under the Act sent or given during the period covered by the report by or on behalf of the Registrant to 10 or more persons.
(a)(2)(2) There was no change in the Registrant’s independent public accountant during the period covered by the report.
(b) Certifications pursuant to Section 906 of the Sarbanes-Oxley Act of 2002 of Matthew T. Hinkle, Chief Executive Officer—Finance and Administration, and Vivek Pai, Chief Financial Officer and Chief Accounting Officer
SIGNATURES
Pursuant to the requirements of the Securities Exchange Act of 1934 and the Investment Company Act of 1940, the registrant has duly caused this report to be signed on its behalf by the undersigned, thereunto duly authorized.
| | |
| FRANKLIN TEMPLETON TRUST |
| |
| By | | /s/ Matthew T. Hinkle |
| | Matthew T. Hinkle |
| | Chief Executive Officer—Finance and Administration |
| | Date: 5/30/2023 |
Pursuant to the requirements of the Securities Exchange Act of 1934 and the Investment Company Act of 1940, this report has been signed below by the following persons on behalf of the registrant and in the capacities and on the dates indicated.
| | |
| By | | /s/ Matthew T. Hinkle |
| | Matthew T. Hinkle |
| | Chief Executive Officer—Finance and Administration |
| | Date: 5/30/2023 |
| |
| By | | /s/ Vivek Pai |
| | Vivek Pai |
| | Chief Financial Officer and Chief Accounting Officer |
| | Date: 5/30/2023 |