UNITED STATES
SECURITIES AND EXCHANGE COMMISSION
Washington, D.C. 20549
FORM N-CSR
CERTIFIED SHAREHOLDER REPORT OF REGISTERED MANAGEMENT INVESTMENT COMPANIES
Investment Company Act file number 811-22736
Columbia ETF Trust I
(Exact name of registrant as specified in charter)
290 Congress Street
Boston, MA 02210
(Address of principal executive offices) (Zip code)
Daniel J. Beckman
c/o Columbia Management Investment Advisers, LLC
290 Congress Street
Boston, MA 02210
Ryan C. Larrenaga, Esq.
c/o Columbia Management Investment Advisers, LLC
290 Congress Street
Boston, MA 02210
(Name and address of agent for service)
Registrant's telephone number, including area code: (800) 345-6611
Date of fiscal year end: Last Day of March
Date of reporting period: September 30, 2024
Form N-CSR is to be used by management investment companies to file reports with the Commission not later than 10 days after the transmission to stockholders of any report that is required to be transmitted to stockholders under Rule 30e-1 under the Investment Company Act of 1940 (17 CFR 270.30e-1). The Commission may use the information provided on Form N-CSR in its regulatory, disclosure review, inspection, and policymaking roles.
A registrant is required to disclose the information specified by Form N-CSR, and the Commission will make this information public. A registrant is not required to respond to the collection of information contained in Form N-CSR unless the Form displays a currently valid Office of Management and Budget ("OMB") control number. Please direct comments concerning the accuracy of the information collection burden estimate and any suggestions for reducing the burden to Secretary, Securities and Exchange Commission, 100 F Street, NE, Washington, DC 20549. The OMB has reviewed this collection of information under the clearance requirements of 44 U.S.C. § 3507.
Item 1. Reports to Stockholders.
Columbia Short Duration High Yield ETF
Semi-Annual Shareholder Report | September 30, 2024
This semi-annual shareholder report contains important information about Columbia Short Duration High Yield ETF (the Fund) for the period of September 5, 2024 to September 30, 2024. You can find additional information about the Fund at columbiathreadneedleus.com/resources/literature. You can also request this information by contacting us at 1-800-426-3750.
What were the Fund costs for the reporting period?
(Based on a hypothetical $10,000 investment)
| Fund | Cost of a $10,000 investment | Cost paid as a percentage of a $10,000 investment |
|---|
| Columbia Short Duration High Yield ETF | $3Footnote Reference(a) | 0.44%Footnote Reference(b) |
| Footnote | Description |
Footnote(a) | Based on operations from September 5, 2024 (commencement of operations) through the stated period end. Had the Fund been open the entire reporting period, expenses shown in the table above would have been higher. |
Footnote(b) | Annualized. |
| Fund net assets | $26,235,078 |
| Total number of portfolio holdings | 269 |
| Portfolio turnover for the reporting period | 0% |
Columbia Short Duration High Yield ETF | SSR338_00_(11/24) | 1
Graphical Representation of Fund Holdings
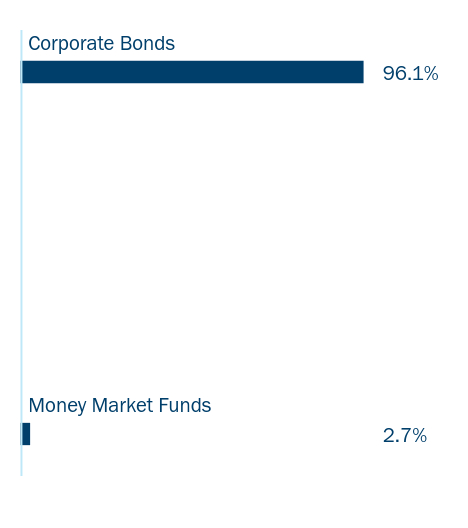
The tables below show the investment makeup of the Fund represented as a percentage of the Fund net assets. Derivatives are excluded from the tables unless otherwise noted. The Fund’s portfolio composition is subject to change.
| CCO Holdings LLC / CCO Holdings Capital Corp. 02/01/2028 5.000% | 1.3% |
| Clearway Energy Operating LLC 03/15/2028 4.750% | 1.1% |
| Trivium Packaging Finance BV 08/15/2026 5.500% | 1.0% |
| Six Flags Entertainment Corp. 04/15/2027 5.500% | 1.0% |
| Cloud Software Group, Inc. 03/31/2029 6.500% | 1.0% |
| Ziggo Bond Co. BV 01/15/2027 6.000% | 0.8% |
| Hudbay Minerals, Inc. 04/01/2026 4.500% | 0.8% |
| 1011778 BC ULC / New Red Finance, Inc. 01/15/2028 4.375% | 0.8% |
| Carnival Corp. 03/01/2027 5.750% | 0.8% |
| TransDigm, Inc. 03/01/2029 6.375% | 0.8% |
| Value | Value |
|---|
| Money Market Funds | 2.7% |
| Corporate Bonds | 96.1% |
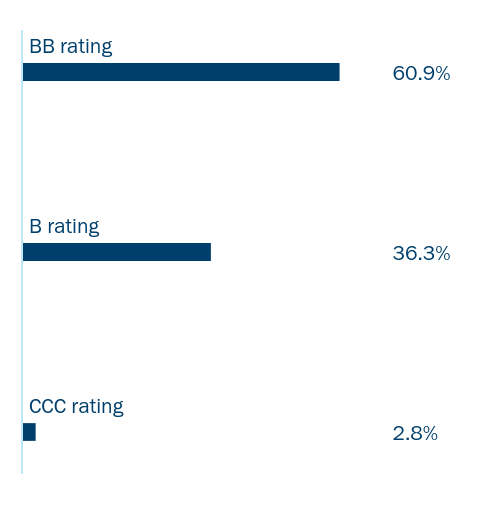
Credit Quality Allocation
| Value | Value |
|---|
| CCC rating | 2.8% |
| B rating | 36.3% |
| BB rating | 60.9% |
Bond ratings on Fund holdings are divided into categories ranging from highest to lowest credit quality, determined by using the middle rating of Moody’s Ratings, S&P and Fitch, after dropping the highest and lowest available ratings. When ratings are available from only two rating agencies, the lower rating is used. When a rating is available from only one rating agency, that rating is used. If a security is not rated by Moody's Ratings, S&P and Fitch, but has a rating by Kroll and/or DBRS, the same methodology is applied to those bonds that would otherwise be not rated. When a bond is not rated by any rating agency, it is designated as “Not rated.” Credit quality ratings assigned by a rating agency are subjective opinions, not statements of fact, and are subject to change, including daily.
Availability of Additional Information
For additional information about the Fund, including its prospectus, financial information, holdings, federal tax information and proxy voting information, visit the Fund’s website included at the beginning of this report or scan the QR code below.
Columbia Management Investment Advisers, LLC serves as the investment manager to the ETFs. The ETFs are distributed by ALPS Distributors, Inc., which is not affiliated with Columbia Management Investment Advisers, LLC, or its parent company, Ameriprise Financial, Inc.
Columbia Threadneedle Investments (Columbia Threadneedle) is the global brand name of the Columbia and Threadneedle group of companies.
© 2024 Columbia Management Investment Advisers, LLC.
Not FDIC or NCUA Insured • No Financial Institution Guarantee • May Lose Value
Columbia Short Duration High Yield ETF | SSR338_00_(11/24) | 2
Columbia U.S. High Yield ETF
Semi-Annual Shareholder Report | September 30, 2024
This semi-annual shareholder report contains important information about Columbia U.S. High Yield ETF (the Fund) for the period of September 5, 2024 to September 30, 2024. You can find additional information about the Fund at columbiathreadneedleus.com/resources/literature. You can also request this information by contacting us at 1-800-426-3750.
What were the Fund costs for the reporting period?
(Based on a hypothetical $10,000 investment)
| Fund | Cost of a $10,000 investment | Cost paid as a percentage of a $10,000 investment |
|---|
| Columbia U.S. High Yield ETF | $3Footnote Reference(a) | 0.46%Footnote Reference(b) |
| Footnote | Description |
Footnote(a) | Based on operations from September 5, 2024 (commencement of operations) through the stated period end. Had the Fund been open the entire reporting period, expenses shown in the table above would have been higher. |
Footnote(b) | Annualized. |
| Fund net assets | $26,298,159 |
| Total number of portfolio holdings | 427 |
| Portfolio turnover for the reporting period | 0% |
Columbia U.S. High Yield ETF | SSR339_00_(11/24) | 1
Graphical Representation of Fund Holdings
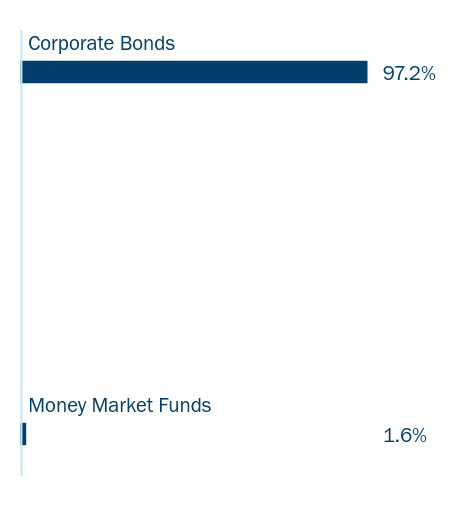
The tables below show the investment makeup of the Fund represented as a percentage of the Fund net assets. Derivatives are excluded from the tables unless otherwise noted. The Fund’s portfolio composition is subject to change.
| TransDigm, Inc. 03/01/2029 6.375% | 0.8% |
| CCO Holdings LLC / CCO Holdings Capital Corp. 02/01/2031 4.250% | 0.7% |
| Cloud Software Group, Inc. 09/30/2029 9.000% | 0.6% |
| Tenet Healthcare Corp. 11/01/2027 5.125% | 0.5% |
| Cloud Software Group, Inc. 03/31/2029 6.500% | 0.5% |
| CCO Holdings LLC / CCO Holdings Capital Corp. 01/15/2034 4.250% | 0.5% |
| CCO Holdings LLC / CCO Holdings Capital Corp. 05/01/2032 4.500% | 0.5% |
| Howard Midstream Energy Partners LLC 07/15/2028 8.875% | 0.4% |
| Starwood Property Trust, Inc. 04/01/2029 7.250% | 0.4% |
| Nexstar Media, Inc. 07/15/2027 5.625% | 0.4% |
| Value | Value |
|---|
| Money Market Funds | 1.6% |
| Corporate Bonds | 97.2% |
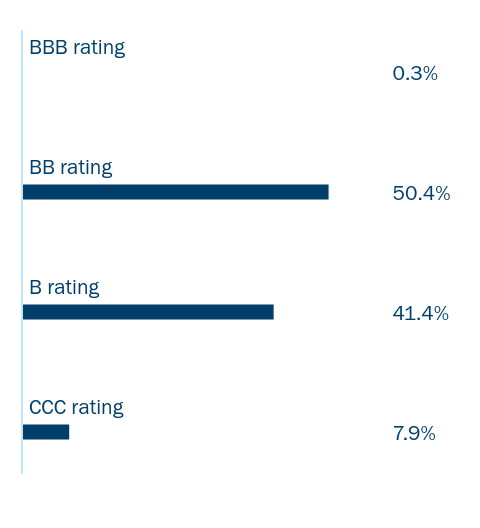
Credit Quality Allocation
| Value | Value |
|---|
| CCC rating | 7.9% |
| B rating | 41.4% |
| BB rating | 50.4% |
| BBB rating | 0.3% |
Bond ratings on Fund holdings are divided into categories ranging from highest to lowest credit quality, determined by using the middle rating of Moody’s Ratings, S&P and Fitch, after dropping the highest and lowest available ratings. When ratings are available from only two rating agencies, the lower rating is used. When a rating is available from only one rating agency, that rating is used. If a security is not rated by Moody's Ratings, S&P and Fitch, but has a rating by Kroll and/or DBRS, the same methodology is applied to those bonds that would otherwise be not rated. When a bond is not rated by any rating agency, it is designated as “Not rated.” Credit quality ratings assigned by a rating agency are subjective opinions, not statements of fact, and are subject to change, including daily.
Availability of Additional Information
For additional information about the Fund, including its prospectus, financial information, holdings, federal tax information and proxy voting information, visit the Fund’s website included at the beginning of this report or scan the QR code below.
Columbia Management Investment Advisers, LLC serves as the investment manager to the ETFs. The ETFs are distributed by ALPS Distributors, Inc., which is not affiliated with Columbia Management Investment Advisers, LLC, or its parent company, Ameriprise Financial, Inc.
Columbia Threadneedle Investments (Columbia Threadneedle) is the global brand name of the Columbia and Threadneedle group of companies.
© 2024 Columbia Management Investment Advisers, LLC.
Not FDIC or NCUA Insured • No Financial Institution Guarantee • May Lose Value
Columbia U.S. High Yield ETF | SSR339_00_(11/24) | 2
Item 2. Code of Ethics.
Not applicable.
Item 3. Audit Committee Financial Expert.
Not applicable.
Item 4. Principal Accountant Fees and Services.
Not applicable.
Item 5. Audit Committee of Listed Registrants.
Not applicable.
Item 6. Investments.
(a) The registrant’s “Schedule I – Investments in securities of unaffiliated issuers” (as set forth in 17 CFR 210.12-12) is included in Item 7 of this Form N-CSR.
(b) Not applicable.
Item 7. Financial Statements and Financial Highlights for Open-End Management Investment Companies.
Not
FDIC
or
NCUA
Insured
No
Financial
Institution
Guarantee
May
Lose
Value
Semiannual
Financial
Statements
and
Additional
Information
September
30,
2024
(Unaudited)
Columbia
Short
Duration
High
Yield
ETF
Columbia
U.S.
High
Yield
ETF
Portfolio
of
Investments
3
Statement
of
Assets
and
Liabilities
18
Statement
of
Operations
19
Statement
of
Changes
in
Net
Assets
20
Financial
Highlights
21
Notes
to
Financial
Statements
23
Approval
of
Investment
Management
Services
Agreement
29
PORTFOLIO
OF
INVESTMENTS
Columbia
Short
Duration
High
Yield
ETF
September
30,
2024
(Unaudited)
(Percentages
represent
value
of
investments
compared
to
net
assets)
Investments
in
Securities
The
accompanying
Notes
to
Financial
Statements
are
an
integral
part
of
this
statement.
Corporate
Bonds
96.1%
Issue
Description
Principal
Amount
($)
Value
($)
Aerospace
&
Defense
2.0%
TransDigm,
Inc.
4.625%,
01/15/29
75,000
72,498
4.875%,
05/01/29
34,000
33,102
5.500%,
11/15/27
50,000
49,832
6.375%,
03/01/29
(a)
200,000
206,276
6.750%,
08/15/28
(a)
150,000
154,530
Total
516,238
Airlines
2.6%
Air
Canada
3.875%,
08/15/26
(a)
200,000
194,775
American
Airlines,
Inc.
8.500%,
05/15/29
(a)
125,000
132,539
American
Airlines,
Inc./AAdvantage
Loyalty
IP
Ltd.
5.500%,
04/20/26
(a)
72,917
72,701
5.750%,
04/20/29
(a)
75,000
74,903
United
Airlines,
Inc.
4.375%,
04/15/26
(a)
100,000
98,493
4.625%,
04/15/29
(a)
125,000
120,774
Total
694,185
Automotive
1.5%
Clarios
Global
LP
/
Clarios
US
Finance
Co.
6.750%,
05/15/28
(a)
125,000
128,856
IHO
Verwaltungs
GmbH
4.750%,
09/15/26
(a),(b)
50,000
49,213
6.000%,
05/15/27
(a),(b)
75,000
73,733
ZF
North
America
Capital,
Inc.
4.750%,
04/29/25
(a)
50,000
49,588
6.875%,
04/14/28
(a)
100,000
101,044
Total
402,434
Brokerage/Asset
Managers/Exchanges
1.0%
AG
Issuer
LLC
6.250%,
03/01/28
(a)
142,000
139,240
AG
TTMT
Escrow
Issuer
LLC
8.625%,
09/30/27
(a)
78,000
79,920
Aretec
Group,
Inc.
7.500%,
04/01/29
(a)
40,000
38,006
Total
257,166
Building
Materials
3.9%
American
Builders
&
Contractors
Supply
Co.,
Inc.
3.875%,
11/15/29
(a)
75,000
70,130
4.000%,
01/15/28
(a)
75,000
72,187
Beacon
Roofing
Supply,
Inc.
4.125%,
05/15/29
(a)
125,000
117,802
4.500%,
11/15/26
(a)
125,000
123,133
Interface,
Inc.
5.500%,
12/01/28
(a)
75,000
73,658
James
Hardie
International
Finance
DAC
5.000%,
01/15/28
(a)
181,000
179,304
Standard
Industries,
Inc.
4.750%,
01/15/28
(a)
100,000
97,949
5.000%,
02/15/27
(a)
151,000
149,887
Summit
Materials
LLC
/
Summit
Materials
Finance
Corp.
5.250%,
01/15/29
(a)
100,000
99,064
White
Cap
Buyer
LLC
6.875%,
10/15/28
(a)
50,000
50,489
Total
1,033,603
Cable
and
Satellite
4.4%
CCO
Holdings
LLC
/
CCO
Holdings
Capital
Corp.
5.000%,
02/01/28
(a)
350,000
340,563
5.125%,
05/01/27
(a)
75,000
73,769
Corporate
Bonds
(continued)
Issue
Description
Principal
Amount
($)
Value
($)
5.375%,
06/01/29
(a)
125,000
120,401
Sirius
XM
Radio,
Inc.
3.125%,
09/01/26
(a)
125,000
120,831
4.000%,
07/15/28
(a)
50,000
47,169
5.000%,
08/01/27
(a)
150,000
147,788
Virgin
Media
Secured
Finance
PLC
5.500%,
05/15/29
(a)
100,000
95,880
Ziggo
Bond
Co.
BV
6.000%,
01/15/27
(a)
200,000
199,893
Total
1,146,294
Chemicals
3.8%
Axalta
Coating
Systems
LLC
/
Axalta
Coating
Systems
Dutch
Holding
B
BV
4.750%,
06/15/27
(a)
75,000
74,438
Element
Solutions,
Inc.
3.875%,
09/01/28
(a)
100,000
95,299
HB
Fuller
Co.
4.250%,
10/15/28
75,000
71,932
INEOS
Finance
PLC
6.750%,
05/15/28
(a)
75,000
75,848
7.500%,
04/15/29
(a)
50,000
52,264
Ineos
Quattro
Finance
2
PLC
9.625%,
03/15/29
(a)
100,000
107,000
Ingevity
Corp.
3.875%,
11/01/28
(a)
50,000
46,887
Olympus
Water
US
Holding
Corp.
4.250%,
10/01/28
(a)
100,000
95,446
9.750%,
11/15/28
(a)
125,000
133,489
SNF
Group
SACA
3.125%,
03/15/27
(a)
75,000
71,338
WR
Grace
Holdings
LLC
4.875%,
06/15/27
(a)
125,000
123,168
5.625%,
08/15/29
(a)
50,000
46,963
Total
994,072
Construction
Machinery
2.2%
H&E
Equipment
Services,
Inc.
3.875%,
12/15/28
(a)
150,000
140,756
Herc
Holdings,
Inc.
5.500%,
07/15/27
(a)
175,000
174,817
6.625%,
06/15/29
(a)
75,000
77,710
Ritchie
Bros
Holdings,
Inc.
6.750%,
03/15/28
(a)
175,000
181,025
Total
574,308
Consumer
Cyclical
Services
2.2%
APX
Group,
Inc.
6.750%,
02/15/27
(a)
50,000
50,137
Arches
Buyer,
Inc.
4.250%,
06/01/28
(a)
175,000
160,941
ASGN,
Inc.
4.625%,
05/15/28
(a)
100,000
97,184
Match
Group
Holdings
II
LLC
4.625%,
06/01/28
(a)
205,000
199,318
Prime
Security
Services
Borrower
LLC
/
Prime
Finance,
Inc.
6.250%,
01/15/28
(a)
75,000
75,012
Total
582,592
Consumer
Products
1.8%
Acushnet
Co.
7.375%,
10/15/28
(a)
50,000
52,732
CD&R
Smokey
Buyer,
Inc.
/
Radio
Systems
Corp.
9.500%,
10/15/29
(a)
74,000
74,046
Newell
Brands,
Inc.
4.875%,
06/01/25
50,000
49,721
PORTFOLIO
OF
INVESTMENTS
(continued)
Columbia
Short
Duration
High
Yield
ETF
September
30,
2024
(Unaudited)
The
accompanying
Notes
to
Financial
Statements
are
an
integral
part
of
this
statement.
Corporate
Bonds
(continued)
Issue
Description
Principal
Amount
($)
Value
($)
5.700%,
04/01/26
75,000
75,190
6.375%,
09/15/27
75,000
76,036
Prestige
Brands,
Inc.
5.125%,
01/15/28
(a)
100,000
99,109
Scotts
Miracle-Gro
Co.
(The)
5.250%,
12/15/26
50,000
49,769
Total
476,603
Diversified
Manufacturing
2.8%
Esab
Corp.
6.250%,
04/15/29
(a)
50,000
51,417
Gates
Corp.
6.875%,
07/01/29
(a)
98,000
101,531
Madison
IAQ
LLC
5.875%,
06/30/29
(a)
50,000
48,718
Resideo
Funding,
Inc.
4.000%,
09/01/29
(a)
75,000
70,636
TK
Elevator
Holdco
GmbH
7.625%,
07/15/28
(a)
50,000
50,309
TK
Elevator
US
Newco,
Inc.
5.250%,
07/15/27
(a)
125,000
123,710
Velocity
Vehicle
Group
LLC
8.000%,
06/01/29
(a)
50,000
52,044
WESCO
Distribution,
Inc.
6.375%,
03/15/29
(a)
150,000
155,019
7.250%,
06/15/28
(a)
74,000
75,764
Total
729,148
Electric
5.1%
Clearway
Energy
Operating
LLC
4.750%,
03/15/28
(a)
309,000
303,280
NextEra
Energy
Operating
Partners
LP
3.875%,
10/15/26
(a)
125,000
121,729
4.500%,
09/15/27
(a)
75,000
73,277
7.250%,
01/15/29
(a)
125,000
131,757
NRG
Energy
Inc.
3.375%,
02/15/29
(a)
75,000
69,933
NRG
Energy,
Inc.
5.750%,
01/15/28
125,000
125,917
Pattern
Energy
Operations
LP
/
Pattern
Energy
Operations,
Inc.
4.500%,
08/15/28
(a)
50,000
48,324
TerraForm
Power
Operating
LLC
4.750%,
01/15/30
(a)
25,000
23,915
5.000%,
01/31/28
(a)
150,000
148,455
Vistra
Operations
Co.
LLC
5.000%,
07/31/27
(a)
175,000
173,880
5.625%,
02/15/27
(a)
125,000
124,839
Total
1,345,306
Environmental
0.6%
Waste
Pro
USA
Inc
5.500%,
02/15/26
(a)
150,000
149,479
Finance
Companies
4.8%
GGAM
Finance
Ltd.
6.875%,
04/15/29
(a)
75,000
78,076
8.000%,
02/15/27
(a)
125,000
130,679
8.000%,
06/15/28
(a)
25,000
26,814
Navient
Corp.
6.750%,
06/25/25
116,000
116,745
6.750%,
06/15/26
50,000
51,128
OneMain
Finance
Corp.
3.500%,
01/15/27
50,000
47,780
3.875%,
09/15/28
90,000
83,475
7.125%,
03/15/26
100,000
102,162
Corporate
Bonds
(continued)
Issue
Description
Principal
Amount
($)
Value
($)
9.000%,
01/15/29
25,000
26,487
Provident
Funding
Associates
LP
/
PFG
Finance
Corp.
6.375%,
06/15/25
(a)
100,000
100,004
9.750%,
09/15/29
(a)
54,000
55,019
Rocket
Mortgage
LLC
/
Rocket
Mortgage
Co.-Issuer,
Inc.
2.875%,
10/15/26
(a)
200,000
192,059
3.625%,
03/01/29
(a)
75,000
70,567
United
Wholesale
Mortgage
LLC
5.500%,
11/15/25
(a)
25,000
25,018
5.750%,
06/15/27
(a)
150,000
149,130
Total
1,255,143
Food
and
Beverage
1.9%
Darling
Ingredients,
Inc.
5.250%,
04/15/27
(a)
126,000
125,341
Post
Holdings,
Inc.
5.500%,
12/15/29
(a)
50,000
49,643
5.625%,
01/15/28
(a)
100,000
100,863
Triton
Water
Holdings,
Inc.
6.250%,
04/01/29
(a)
63,000
62,909
US
Foods,
Inc.
4.750%,
02/15/29
(a)
50,000
48,789
6.875%,
09/15/28
(a)
100,000
104,250
Total
491,795
Foreign
Government
Obligations
1.1%
NOVA
Chemicals
Corp.
4.250%,
05/15/29
(a)
75,000
69,735
5.250%,
06/01/27
(a)
50,000
49,465
8.500%,
11/15/28
(a)
150,000
160,316
Total
279,516
Gaming
1.4%
Caesars
Entertainment,
Inc.
4.625%,
10/15/29
(a)
100,000
95,161
7.000%,
02/15/30
(a)
50,000
52,244
Churchill
Downs,
Inc.
5.500%,
04/01/27
(a)
125,000
124,536
Light
&
Wonder
International,
Inc.
7.000%,
05/15/28
(a)
100,000
100,768
Total
372,709
Health
Care
6.2%
Acadia
Healthcare
Co.,
Inc.
5.000%,
04/15/29
(a)
75,000
71,475
5.500%,
07/01/28
(a)
101,000
98,345
Avantor
Funding,
Inc.
4.625%,
07/15/28
(a)
125,000
122,218
Bausch
+
Lomb
Corp.
8.375%,
10/01/28
(a)
50,000
52,887
Catalent
Pharma
Solutions,
Inc.
3.125%,
02/15/29
(a)
50,000
49,133
Charles
River
Laboratories
International,
Inc.
4.250%,
05/01/28
(a)
75,000
72,880
CHS/Community
Health
Systems,
Inc.
5.625%,
03/15/27
(a)
150,000
147,530
Encompass
Health
Corp.
4.500%,
02/01/28
25,000
24,536
5.750%,
09/15/25
26,000
25,934
IQVIA,
Inc.
5.000%,
10/15/26
(a)
100,000
99,749
Medline
Borrower
LP
3.875%,
04/01/29
(a)
125,000
118,339
5.250%,
10/01/29
(a)
125,000
122,651
PORTFOLIO
OF
INVESTMENTS
(continued)
Columbia
Short
Duration
High
Yield
ETF
September
30,
2024
(Unaudited)
The
accompanying
Notes
to
Financial
Statements
are
an
integral
part
of
this
statement.
Corporate
Bonds
(continued)
Issue
Description
Principal
Amount
($)
Value
($)
Medline
Borrower
LP/Medline
Co.-Issuer,
Inc.
6.250%,
04/01/29
(a)
125,000
128,902
Select
Medical
Corp.
6.250%,
08/15/26
(a)
125,000
125,795
Teleflex,
Inc.
4.625%,
11/15/27
25,000
24,646
Tenet
Healthcare
Corp.
4.625%,
06/15/28
50,000
49,116
5.125%,
11/01/27
175,000
174,482
6.125%,
10/01/28
125,000
126,036
Total
1,634,654
Home
Construction
0.4%
Taylor
Morrison
Communities,
Inc.
5.750%,
01/15/28
(a)
100,000
101,675
Independent
Energy
3.5%
Civitas
Resources,
Inc.
8.375%,
07/01/28
(a)
132,000
137,951
CNX
Resources
Corp.
6.000%,
01/15/29
(a)
50,000
50,275
Hilcorp
Energy
I
LP
/
Hilcorp
Finance
Co.
5.750%,
02/01/29
(a)
50,000
48,681
6.250%,
11/01/28
(a)
150,000
149,847
Matador
Resources
Co.
6.875%,
04/15/28
(a)
155,000
157,553
Permian
Resources
Operating
LLC
5.375%,
01/15/26
(a)
26,000
25,902
5.875%,
07/01/29
(a)
41,000
41,051
8.000%,
04/15/27
(a)
125,000
128,696
SM
Energy
Co.
6.750%,
08/01/29
(a)
125,000
125,493
Southwestern
Energy
Co.
5.375%,
02/01/29
50,000
49,796
Total
915,245
Leisure
7.9%
Boyne
USA,
Inc.
4.750%,
05/15/29
(a)
125,000
120,381
Carnival
Corp.
5.750%,
03/01/27
(a)
200,000
202,610
6.000%,
05/01/29
(a)
175,000
177,102
7.625%,
03/01/26
(a)
30,000
30,299
Cedar
Fair
LP
/
Canada's
Wonderland
Co.
/
Magnum
Management
Corp.
/
Millennium
Op
5.375%,
04/15/27
125,000
124,543
6.500%,
10/01/28
100,000
101,287
Cinemark
USA,
Inc.
5.250%,
07/15/28
(a)
181,000
177,950
Live
Nation
Entertainment,
Inc.
4.750%,
10/15/27
(a)
150,000
147,965
5.625%,
03/15/26
(a)
18,000
17,964
NCL
Corp.
Ltd.
5.875%,
03/15/26
(a)
125,000
125,024
5.875%,
02/15/27
(a)
100,000
100,301
Royal
Caribbean
Cruises
Ltd.
4.250%,
07/01/26
(a)
100,000
98,842
5.500%,
04/01/28
(a)
100,000
101,256
5.500%,
08/31/26
(a)
100,000
100,981
Six
Flags
Entertainment
Corp.
5.500%,
04/15/27
(a)
275,000
273,177
Viking
Cruises
Ltd.
5.875%,
09/15/27
(a)
75,000
74,871
Corporate
Bonds
(continued)
Issue
Description
Principal
Amount
($)
Value
($)
7.000%,
02/15/29
(a)
100,000
101,239
Total
2,075,792
Lodging
0.7%
Hilton
Grand
Vacations
Borrower
Escrow
LLC
/
Hilton
Grand
Vacations
Borrower
Esc
5.000%,
06/01/29
(a)
50,000
47,501
Marriott
Ownership
Resorts
Inc.
4.500%,
06/15/29
(a)
50,000
47,010
Marriott
Ownership
Resorts,
Inc.
4.750%,
01/15/28
100,000
95,977
Total
190,488
Media
and
Entertainment
1.6%
Clear
Channel
Outdoor
Holdings,
Inc.
5.125%,
08/15/27
(a)
75,000
73,730
9.000%,
09/15/28
(a)
125,000
132,891
Outfront
Media
Capital
LLC
/
Outfront
Media
Capital
Corp.
4.250%,
01/15/29
(a)
50,000
47,622
5.000%,
08/15/27
(a)
75,000
74,516
Univision
Communications,
Inc.
6.625%,
06/01/27
(a)
50,000
50,152
8.000%,
08/15/28
(a)
50,000
51,136
Total
430,047
Metals
and
Mining
2.5%
Constellium
SE
3.750%,
04/15/29
(a)
75,000
70,051
5.625%,
06/15/28
(a)
125,000
124,871
Hudbay
Minerals,
Inc.
4.500%,
04/01/26
(a)
209,000
206,793
6.125%,
04/01/29
(a)
50,000
50,734
Kaiser
Aluminum
Corp.
4.625%,
03/01/28
(a)
75,000
72,608
Novelis
Corp.
3.250%,
11/15/26
(a)
50,000
48,322
4.750%,
01/30/30
(a)
75,000
72,616
Total
645,995
Midstream
5.4%
Antero
Midstream
Partners
LP
/
Antero
Midstream
Finance
Corp.
5.375%,
06/15/29
(a)
50,000
49,537
5.750%,
01/15/28
(a)
50,000
50,062
5.750%,
03/01/27
(a)
100,000
100,165
Delek
Logistics
Partners
LP
/
Delek
Logistics
Finance
Corp.
8.625%,
03/15/29
(a)
150,000
157,924
DT
Midstream,
Inc.
4.125%,
06/15/29
(a)
50,000
47,828
EQM
Midstream
Partners
LP
4.500%,
01/15/29
(a)
75,000
73,369
6.000%,
07/01/25
(a)
125,000
125,225
6.375%,
04/01/29
(a)
25,000
25,830
6.500%,
07/01/27
(a)
25,000
25,742
7.500%,
06/01/27
(a)
50,000
51,497
NuStar
Logistics
LP
5.625%,
04/28/27
50,000
50,216
5.750%,
10/01/25
75,000
75,048
6.000%,
06/01/26
25,000
25,167
Sunoco
LP
7.000%,
05/01/29
(a)
104,000
108,722
Sunoco
LP
/
Sunoco
Finance
Corp.
6.000%,
04/15/27
25,000
25,077
7.000%,
09/15/28
(a)
99,000
102,770
Venture
Global
Calcasieu
Pass
LLC
3.875%,
08/15/29
(a)
75,000
70,877
PORTFOLIO
OF
INVESTMENTS
(continued)
Columbia
Short
Duration
High
Yield
ETF
September
30,
2024
(Unaudited)
The
accompanying
Notes
to
Financial
Statements
are
an
integral
part
of
this
statement.
Corporate
Bonds
(continued)
Issue
Description
Principal
Amount
($)
Value
($)
Venture
Global
LNG,
Inc.
8.125%,
06/01/28
(a)
125,000
130,313
9.500%,
02/01/29
(a)
100,000
112,429
Total
1,407,798
Oil
Field
Services
1.3%
Archrock
Partners
LP
/
Archrock
Partners
Finance
Corp.
6.250%,
04/01/28
(a)
75,000
75,352
Kodiak
Gas
Services
LLC
7.250%,
02/15/29
(a)
75,000
77,650
Nabors
Industries,
Inc.
7.375%,
05/15/27
(a)
50,000
50,119
Transocean
Titan
Financing
Ltd.
8.375%,
02/01/28
(a)
50,000
51,511
USA
Compression
Partners
LP
/
USA
Compression
Finance
Corp
6.875%,
09/01/27
100,000
100,902
Total
355,534
Other
Industry
0.6%
Williams
Scotsman,
Inc.
4.625%,
08/15/28
(a)
111,000
107,924
6.625%,
06/15/29
(a)
50,000
51,512
Total
159,436
Other
REIT
2.4%
Ladder
Capital
Finance
Holdings
LLLP
/
Ladder
Capital
Finance
Corp.
4.250%,
02/01/27
(a)
125,000
121,860
4.750%,
06/15/29
(a)
50,000
48,859
5.250%,
10/01/25
(a)
100,000
99,775
Park
Intermediate
Holdings
LLC
/
PK
Domestic
Property
LLC
/
PK
Finance
Co.-Issuer
5.875%,
10/01/28
(a)
175,000
174,647
RHP
Hotel
Properties
LP
/
RHP
Finance
Corp.
7.250%,
07/15/28
(a)
100,000
104,661
RLJ
Lodging
Trust
LP
3.750%,
07/01/26
(a)
75,000
73,357
Total
623,159
Packaging
2.9%
Ardagh
Metal
Packaging
Finance
USA
LLC
/
Ardagh
Metal
Packaging
Finance
PLC
3.250%,
09/01/28
(a)
75,000
68,671
4.000%,
09/01/29
(a)
25,000
22,317
6.000%,
06/15/27
(a)
125,000
125,864
Berry
Global,
Inc.
4.500%,
02/15/26
(a)
100,000
98,730
Clydesdale
Acquisition
Holdings,
Inc.
6.625%,
04/15/29
(a)
50,000
50,495
Sealed
Air
Corp.
4.000%,
12/01/27
(a)
50,000
48,317
5.000%,
04/15/29
(a)
38,000
37,433
Sealed
Air
Corp./Sealed
Air
Corp.
US
6.125%,
02/01/28
(a)
50,000
50,850
Trivium
Packaging
Finance
BV
5.500%,
08/15/26
(a)
255,000
253,679
Total
756,356
Pharmaceuticals
0.2%
Organon
&
Co.
/
Organon
Foreign
Debt
Co.-Issuer
BV
4.125%,
04/30/28
(a)
50,000
48,058
Property
&
Casualty
2.5%
Alliant
Holdings
Intermediate
LLC
/
Alliant
Holdings
Co.-Issuer
4.250%,
10/15/27
(a)
50,000
47,886
6.750%,
10/15/27
(a)
100,000
99,651
6.750%,
04/15/28
(a)
199,000
202,188
Corporate
Bonds
(continued)
Issue
Description
Principal
Amount
($)
Value
($)
AmWINS
Group,
Inc.
6.375%,
02/15/29
(a)
125,000
127,992
AssuredPartners,
Inc.
5.625%,
01/15/29
(a)
50,000
48,182
BroadStreet
Partners,
Inc.
5.875%,
04/15/29
(a)
25,000
23,907
HUB
International
Ltd.
5.625%,
12/01/29
(a)
100,000
98,082
Total
647,888
Restaurants
1.3%
1011778
BC
ULC
/
New
Red
Finance,
Inc.
4.375%,
01/15/28
(a)
213,000
207,335
6.125%,
06/15/29
(a)
125,000
128,499
Total
335,834
Retailers
2.5%
Asbury
Automotive
Group,
Inc.
4.500%,
03/01/28
125,000
121,760
Bath
&
Body
Works,
Inc.
5.250%,
02/01/28
50,000
49,877
Group
1
Automotive,
Inc.
4.000%,
08/15/28
(a)
100,000
95,424
6.375%,
01/15/30
(a)
25,000
25,410
LCM
Investments
Holdings
II
LLC
4.875%,
05/01/29
(a)
50,000
48,035
Lithia
Motors
Inc.
3.875%,
06/01/29
(a)
25,000
23,339
Lithia
Motors,
Inc.
4.625%,
12/15/27
(a)
75,000
73,302
PetSmart,
Inc.
/
PetSmart
Finance
Corp.
4.750%,
02/15/28
(a)
125,000
119,834
7.750%,
02/15/29
(a)
100,000
98,643
Total
655,624
Technology
9.3%
Block,
Inc.
2.750%,
06/01/26
50,000
48,461
Camelot
Finance
SA
4.500%,
11/01/26
(a)
150,000
147,798
Central
Parent
LLC
/
CDK
Global
II
LLC
/
CDK
Financing
Co.,
Inc.
8.000%,
06/15/29
(a)
50,000
52,022
Central
Parent,
Inc.
/
CDK
Global,
Inc.
7.250%,
06/15/29
(a)
75,000
76,690
Clarivate
Science
Holdings
Corp.
4.875%,
07/01/29
(a)
50,000
48,119
Cloud
Software
Group,
Inc.
6.500%,
03/31/29
(a)
275,000
273,696
9.000%,
09/30/29
(a)
50,000
50,888
Entegris,
Inc.
3.625%,
05/01/29
(a)
75,000
70,117
4.375%,
04/15/28
(a)
125,000
120,672
Gen
Digital,
Inc.
6.750%,
09/30/27
(a)
75,000
77,093
HealthEquity,
Inc.
4.500%,
10/01/29
(a)
50,000
48,357
Helios
Software
Holdings,
Inc.
/
ION
Corporate
Solutions
Finance
Sarl
4.625%,
05/01/28
(a)
100,000
92,228
ION
Trading
Technologies
Sarl
5.750%,
05/15/28
(a)
75,000
70,118
Iron
Mountain,
Inc.
4.875%,
09/15/27
(a)
125,000
124,051
5.000%,
07/15/28
(a)
25,000
24,658
5.250%,
03/15/28
(a)
125,000
124,513
PORTFOLIO
OF
INVESTMENTS
(continued)
Columbia
Short
Duration
High
Yield
ETF
September
30,
2024
(Unaudited)
The
accompanying
Notes
to
Financial
Statements
are
an
integral
part
of
this
statement.
Notes
to
Portfolio
of
Investments
Corporate
Bonds
(continued)
Issue
Description
Principal
Amount
($)
Value
($)
7.000%,
02/15/29
(a)
125,000
130,212
NCR
Atleos
Corp.
9.500%,
04/01/29
(a)
125,000
137,615
NCR
Voyix
Corp.
5.000%,
10/01/28
(a)
130,000
127,551
Neptune
Bidco
US,
Inc.
9.290%,
04/15/29
(a)
50,000
48,949
Open
Text
Corp.
3.875%,
02/15/28
(a)
75,000
71,600
Seagate
HDD
Cayman
4.750%,
01/01/25
51,000
50,796
Shift4
Payments
LLC
/
Shift4
Payments
Finance
Sub,
Inc.
4.625%,
11/01/26
(a)
150,000
148,427
SS&C
Technologies,
Inc.
5.500%,
09/30/27
(a)
125,000
125,015
ZoomInfo
Technologies
LLC/ZoomInfo
Finance
Corp.
3.875%,
02/01/29
(a)
156,000
144,120
Total
2,433,766
Transportation
Services
0.4%
Avis
Budget
Car
Rental
LLC
/
Avis
Budget
Finance,
Inc.
4.750%,
04/01/28
(a)
25,000
23,482
5.375%,
03/01/29
(a)
50,000
46,746
5.750%,
07/15/27
(a)
50,000
49,758
Total
119,986
Wireless
0.3%
SBA
Communications
Corp.
3.875%,
02/15/27
75,000
73,072
Wirelines
1.1%
Frontier
Communications
Holdings
LLC
5.875%,
10/15/27
(a)
100,000
100,401
Iliad
Holding
SASU
6.500%,
10/15/26
(a)
125,000
126,295
7.000%,
10/15/28
(a)
75,000
76,339
Total
303,035
Total
Corporate
Bonds
(Cost
$25,085,138)
25,214,033
Money
Market
Funds
2.7%
Shares
Value
($)
Dreyfus
Treasury
Securities
Cash
Management,
Institutional
Shares
4.879%
(c)
716,662
716,662
Total
Money
Market
Funds
(Cost
$716,662)
716,662
Total
Investments
in
Securities
(Cost
$25,801,800)
25,930,695
Other
Assets
&
Liabilities,
Net
304,383
Net
Assets
26,235,078
(a)
Represents
privately
placed
and
other
securities
and
instruments
exempt
from
Securities
and
Exchange
Commission
registration
(collectively,
private
placements),
such
as
Section
4(a)(2)
and
Rule
144A
eligible
securities,
which
are
often
sold
only
to
qualified
institutional
buyers.
At
September
30,
2024,
the
total
value
of
these
securities
amounted
to
$22,765,530,
which
represents
86.78%
of
total
net
assets.
(b)
Payment-in-kind
security.
Interest
can
be
paid
by
issuing
additional
par
of
the
security
or
in
cash.
(c)
The
rate
shown
is
the
seven-day
current
annualized
yield
at
September
30,
2024.
PORTFOLIO
OF
INVESTMENTS
(continued)
Columbia
Short
Duration
High
Yield
ETF
September
30,
2024
(Unaudited)
The
accompanying
Notes
to
Financial
Statements
are
an
integral
part
of
this
statement.
Fair
Value
Measurements
The
Fund
categorizes
its
fair
value
measurements
according
to
a
three-level
hierarchy
that
maximizes
the
use
of
observable
inputs
and
minimizes
the
use
of
unobservable
inputs
by
prioritizing
that
the
most
observable
input
be
used
when
available.
Observable
inputs
are
those
that
market
participants
would
use
in
pricing
an
investment
based
on
market
data
obtained
from
sources
independent
of
the
reporting
entity.
Unobservable
inputs
are
those
that
reflect
the
Fund’s
assumptions
about
the
information
market
participants
would
use
in
pricing
an
investment.
An
investment’s
level
within
the
fair
value
hierarchy
is
based
on
the
lowest
level
of
any
input
that
is
deemed
significant
to
the
asset's
or
liability’s
fair
value
measurement.
The
input
levels
are
not
necessarily
an
indication
of
the
risk
or
liquidity
associated
with
investments
at
that
level.
For
example,
certain
U.S.
government
securities
are
generally
high
quality
and
liquid,
however,
they
are
reflected
as
Level
2
because
the
inputs
used
to
determine
fair
value
may
not
always
be
quoted
prices
in
an
active
market.
Fair
value
inputs
are
summarized
in
the
three
broad
levels
listed
below:
Level
1
—
Valuations
based
on
quoted
prices
for
investments
in
active
markets
that
the
Fund
has
the
ability
to
access
at
the
measurement
date.
Valuation
adjustments
are
not
applied
to
Level
1
investments.
Level
2
—
Valuations
based
on
other
significant
observable
inputs
(including
quoted
prices
for
similar
securities,
interest
rates,
prepayment
speeds,
credit
risks,
etc.).
Level
3
—
Valuations
based
on
significant
unobservable
inputs
(including
the
Fund’s
own
assumptions
and
judgment
in
determining
the
fair
value
of
investments).
Inputs
that
are
used
in
determining
fair
value
of
an
investment
may
include
price
information,
credit
data,
volatility
statistics,
and
other
factors.
These
inputs
can
be
either
observable
or
unobservable.
The
availability
of
observable
inputs
can
vary
between
investments,
and
is
affected
by
various
factors
such
as
the
type
of
investment,
and
the
volume
and
level
of
activity
for
that
investment
or
similar
investments
in
the
marketplace.
The
inputs
will
be
considered
by
the
Investment
Manager,
along
with
any
other
relevant
factors
in
the
calculation
of
an
investment’s
fair
value.
The
Fund
uses
prices
and
inputs
that
are
current
as
of
the
measurement
date,
which
may
include
periods
of
market
dislocations.
During
these
periods,
the
availability
of
prices
and
inputs
may
be
reduced
for
many
investments.
This
condition
could
cause
an
investment
to
be
reclassified
between
the
various
levels
within
the
hierarchy.
Investments
falling
into
the
Level
3
category
are
primarily
supported
by
quoted
prices
from
brokers
and
dealers
participating
in
the
market
for
those
investments.
However,
these
may
be
classified
as
Level
3
investments
due
to
lack
of
market
transparency
and
corroboration
to
support
these
quoted
prices.
Additionally,
valuation
models
may
be
used
as
the
pricing
source
for
any
remaining
investments
classified
as
Level
3.
These
models
may
rely
on
one
or
more
significant
unobservable
inputs
and/or
significant
assumptions
by
the
Investment
Manager.
Inputs
used
in
valuations
may
include,
but
are
not
limited
to,
financial
statement
analysis,
capital
account
balances,
discount
rates
and
estimated
cash
flows,
and
comparable
company
data.
The
Fund's
Board
of
Trustees
(the
Board)
has
designated
the
Investment
Manager,
through
its
Valuation
Committee
(the
Committee),
as
valuation
designee,
responsible
for
determining
the
fair
value
of
the
assets
of
the
Fund
for
which
market
quotations
are
not
readily
available
using
valuation
procedures
approved
by
the
Board.
The
Committee
consists
of
voting
and
non-voting
members
from
various
groups
within
the
Investment
Manager's
organization,
including
operations
and
accounting,
trading
and
investments,
compliance,
risk
management
and
legal.
The
Committee
meets
at
least
monthly
to
review
and
approve
valuation
matters,
which
may
include
a
description
of
specific
valuation
determinations,
data
regarding
pricing
information
received
from
approved
pricing
vendors
and
brokers
and
the
results
of
Board-approved
valuation
policies
and
procedures
(the
Policies).
The
Policies
address,
among
other
things,
instances
when
market
quotations
are
or
are
not
readily
available,
including
recommendations
of
third
party
pricing
vendors
and
a
determination
of
appropriate
pricing
methodologies;
events
that
require
specific
valuation
determinations
and
assessment
of
fair
value
techniques;
securities
with
a
potential
for
stale
pricing,
including
those
that
are
illiquid,
restricted,
or
in
default;
and
the
effectiveness
of
third-party
pricing
vendors,
including
periodic
reviews
of
vendors.
The
Committee
meets
more
frequently,
as
needed,
to
discuss
additional
valuation
matters,
which
may
include
the
need
to
review
back-testing
results,
review
time-
sensitive
information
or
approve
related
valuation
actions.
Representatives
of
Columbia
Management
Investment
Advisers,
LLC
report
to
the
Board
at
each
of
its
regularly
scheduled
meetings
to
discuss
valuation
matters
and
actions
during
the
period,
similar
to
those
described
earlier.
The
following
table
is
a
summary
of
the
inputs
used
to
value
the
Fund’s
investments
at
September
30,
2024:
Level
1
($)
Level
2
($)
Level
3
($)
Total
($)
Investments
in
Securities
Corporate
Bonds
–
25,214,033
–
25,214,033
Money
Market
Funds
716,662
–
–
716,662
Total
Investments
in
Securities
716,662
25,214,033
–
25,930,695
See
the
Portfolio
of
Investments
for
all
investment
classifications
not
indicated
in
the
table.
The
Fund’s
assets
assigned
to
the
Level
2
input
category
are
generally
valued
using
the
market
approach,
in
which
a
security's
value
is
determined
through
reference
to
prices
and
information
from
market
transactions
for
similar
or
identical
assets.
PORTFOLIO
OF
INVESTMENTS
Columbia
U.S.
High
Yield
ETF
September
30,
2024
(Unaudited)
(Percentages
represent
value
of
investments
compared
to
net
assets)
Investments
in
Securities
The
accompanying
Notes
to
Financial
Statements
are
an
integral
part
of
this
statement.
Corporate
Bonds
97.2%
Issue
Description
Principal
Amount
($)
Value
($)
Aerospace
&
Defense
3.3%
AAR
Escrow
Issuer
LLC
6.750%,
03/15/29
(a)
50,000
51,988
Bombardier,
Inc.
7.000%,
06/01/32
(a)
50,000
52,292
8.750%,
11/15/30
(a)
100,000
109,807
Spirit
Aerosystems
,
Inc.
4.600%,
06/15/28
50,000
47,759
9.750%,
11/15/30
(a)
50,000
55,772
TransDigm
,
Inc.
4.625%,
01/15/29
50,000
48,332
6.375%,
03/01/29
(a)
200,000
206,275
6.625%,
03/01/32
(a)
100,000
104,225
6.750%,
08/15/28
(a)
100,000
103,020
6.875%,
12/15/30
(a)
75,000
78,540
Total
858,010
Airlines
1.4%
Allegiant
Travel
Co.
7.250%,
08/15/27
(a)
50,000
49,448
American
Airlines,
Inc.
8.500%,
05/15/29
(a)
50,000
53,016
American
Airlines,
Inc./
AAdvantage
Loyalty
IP
Ltd.
5.500%,
04/20/26
(a)
29,167
29,080
5.750%,
04/20/29
(a)
100,000
99,870
Jetblue
Airways
Corp.
/
Jetblue
Loyalty
LP
9.875%,
09/20/31
(a)
50,000
52,665
United
Airlines,
Inc.
4.375%,
04/15/26
(a)
50,000
49,247
4.625%,
04/15/29
(a)
50,000
48,309
Total
381,635
Automotive
2.0%
Adient
Global
Holdings
Ltd.
7.000%,
04/15/28
(a)
50,000
51,516
8.250%,
04/15/31
(a)
50,000
53,079
Allison
Transmission,
Inc.
3.750%,
01/30/31
(a)
50,000
45,398
Clarios
Global
LP
/
Clarios
US
Finance
Co.
6.750%,
05/15/28
(a)
75,000
77,313
Garrett
Motion
Holdings,
Inc.
/
Garrett
LX
I
Sarl
7.750%,
05/31/32
(a)
50,000
51,206
Goodyear
Tire
&
Rubber
Co.
(The)
4.875%,
03/15/27
50,000
48,876
5.250%,
04/30/31
50,000
45,085
JB
Poindexter
&
Co.,
Inc.
8.750%,
12/15/31
(a)
50,000
52,940
Phinia
,
Inc.
6.750%,
04/15/29
(a)
50,000
51,708
Tenneco,
Inc.
8.000%,
11/17/28
(a)
50,000
46,200
Total
523,321
Banking
0.4%
Ally
Financial,
Inc.
6.700%,
02/14/33
50,000
51,245
Western
Alliance
Bancorp
3.000%,
(3M
U.S.
T-Bill
MMY
+
2.250%),
06/15/31
(b)
50,000
46,025
Total
97,270
Brokerage/Asset
Managers/Exchanges
1.3%
AG
Issuer
LLC
6.250%,
03/01/28
(a)
50,000
49,028
Corporate
Bonds
(continued)
Issue
Description
Principal
Amount
($)
Value
($)
Aretec
Group,
Inc.
10.000%,
08/15/30
(a)
50,000
53,272
Coinbase
Global,
Inc.
3.375%,
10/01/28
(a)
50,000
44,980
Compass
Group
Diversified
Holdings
LLC
5.250%,
04/15/29
(a)
50,000
48,560
Hunt
Cos.,
Inc.
5.250%,
04/15/29
(a)
50,000
48,358
StoneX
Group,
Inc.
7.875%,
03/01/31
(a)
50,000
53,260
Vfh
Parent
LLC
/
Valor
Co.-Issuer,
Inc.
7.500%,
06/15/31
(a)
50,000
52,500
Total
349,958
Building
Materials
2.5%
Builders
FirstSource
,
Inc.
4.250%,
02/01/32
(a)
50,000
46,199
6.375%,
03/01/34
(a)
50,000
51,933
Cornerstone
Building
Brands,
Inc.
9.500%,
08/15/29
(a)
100,000
102,747
Eco
Material
Technologies,
Inc.
7.875%,
01/31/27
(a)
50,000
50,516
Mohegan
Tribal
Gaming
Authority
8.000%,
02/01/26
(a)
50,000
49,454
Smyrna
Ready
Mix
Concrete
LLC
8.875%,
11/15/31
(a)
100,000
107,892
Specialty
Building
Products
Holdings
LLC
/
Sbp
Finance
Corp.
6.375%,
09/30/26
(a)
50,000
49,821
Standard
Building
Solutions,
Inc.
6.500%,
08/15/32
(a)
50,000
51,884
Standard
Industries,
Inc.
4.375%,
07/15/30
(a)
100,000
94,522
Summit
Materials
LLC
/
Summit
Materials
Finance
Corp.
7.250%,
01/15/31
(a)
50,000
52,975
Total
657,943
Cable
and
Satellite
5.2%
Cable
One,
Inc.
4.000%,
11/15/30
(a)
50,000
39,797
CCO
Holdings
LLC
/
CCO
Holdings
Capital
Corp.
4.250%,
02/01/31
(a)
200,000
176,641
4.250%,
01/15/34
(a)
150,000
123,173
4.500%,
08/15/30
(a)
100,000
90,520
4.500%,
05/01/32
150,000
129,649
4.750%,
03/01/30
(a)
100,000
91,874
5.000%,
02/01/28
(a)
100,000
97,304
5.125%,
05/01/27
(a)
100,000
98,359
Directv
Financing
LLC
8.875%,
02/01/30
(a)
50,000
50,372
Directv
Financing
LLC
/
Directv
Financing
Co.-Obligor,
Inc.
5.875%,
08/15/27
(a)
100,000
98,054
Sirius
XM
Radio,
Inc.
4.000%,
07/15/28
(a)
100,000
94,339
4.125%,
07/01/30
(a)
100,000
90,770
5.000%,
08/01/27
(a)
100,000
98,525
Viasat
,
Inc.
5.625%,
04/15/27
(a)
100,000
94,454
Total
1,373,831
Chemicals
2.9%
Chemours
Co.
(The)
4.625%,
11/15/29
(a)
50,000
44,764
Element
Solutions,
Inc.
3.875%,
09/01/28
(a)
100,000
95,299
PORTFOLIO
OF
INVESTMENTS
(continued)
Columbia
U.S.
High
Yield
ETF
September
30,
2024
(Unaudited)
The
accompanying
Notes
to
Financial
Statements
are
an
integral
part
of
this
statement.
Corporate
Bonds
(continued)
Issue
Description
Principal
Amount
($)
Value
($)
Ingevity
Corp.
3.875%,
11/01/28
(a)
50,000
46,887
Methanex
Corp.
5.125%,
10/15/27
50,000
49,460
Olin
Corp.
5.125%,
09/15/27
100,000
99,412
Olympus
Water
US
Holding
Corp.
9.750%,
11/15/28
(a)
100,000
106,791
Parkland
Corp.
4.625%,
05/01/30
(a)
75,000
70,766
Scih
Salt
Holdings,
Inc.
4.875%,
05/01/28
(a)
50,000
48,296
SK
Invictus
Internediate
II
Sarl
5.000%,
10/30/29
(a)
50,000
47,927
Tronox
,
Inc.
4.625%,
03/15/29
(a)
50,000
46,676
Windsor
Holdings
III
LLC
8.500%,
06/15/30
(a)
50,000
53,510
WR
Grace
Holdings
LLC
5.625%,
08/15/29
(a)
50,000
46,963
Total
756,751
Construction
Machinery
1.3%
EquipmentShare.Com,
Inc.
8.625%,
05/15/32
(a)
50,000
52,510
H&E
Equipment
Services,
Inc.
3.875%,
12/15/28
(a)
50,000
46,919
Herc
Holdings,
Inc.
5.500%,
07/15/27
(a)
50,000
49,948
6.625%,
06/15/29
(a)
50,000
51,807
Ritchie
Bros
Holdings,
Inc.
7.750%,
03/15/31
(a)
50,000
53,349
United
Rentals
North
America,
Inc.
5.250%,
01/15/30
50,000
50,035
6.125%,
03/15/34
(a)
50,000
51,661
Total
356,229
Consumer
Cyclical
Services
3.3%
Allied
Universal
Holdco
LLC
7.875%,
02/15/31
(a)
50,000
51,108
Allied
Universal
Holdco
LLC
/
Allied
Universal
Finance
Corp.
9.750%,
07/15/27
(a)
100,000
100,167
Allied
Universal
Holdco
LLC/Allied
Universal
Finance
Corp./Atlas
Luxco
4
Sarl
4.625%,
06/01/28
(a)
50,000
47,012
Apx
Group,
Inc.
5.750%,
07/15/29
(a)
50,000
49,497
Arches
Buyer
Inc.
6.125%,
12/01/28
(a)
50,000
42,851
Bcpe
Empire
Holdings,
Inc.
7.625%,
05/01/27
(a)
50,000
50,157
Garda
World
Security
Corp.
6.000%,
06/01/29
(a)
75,000
72,075
Geo
Group,
Inc.
(The)
10.250%,
04/15/31
50,000
53,367
Go
Daddy
Operating
Co.
LLC
/
GD
Finance
Co.,
Inc.
5.250%,
12/01/27
(a)
50,000
49,906
Match
Group
Holdings
II
LLC
4.625%,
06/01/28
(a)
50,000
48,614
Prime
Security
Services
Borrower
LLC
/
Prime
Finance,
Inc.
5.750%,
04/15/26
(a)
100,000
100,505
Service
Corp.
International
4.000%,
05/15/31
75,000
69,380
Corporate
Bonds
(continued)
Issue
Description
Principal
Amount
($)
Value
($)
Staples,
Inc.
10.750%,
09/01/29
(a)
100,000
97,067
Wash
Multifamily
Acquisition,
Inc.
5.750%,
04/15/26
(a)
50,000
49,759
Total
881,465
Consumer
Products
1.8%
Coty,
Inc./HFC
Prestige
Products,
Inc./HFC
Prestige
International
US
LLC
6.625%,
07/15/30
(a)
75,000
77,922
Edgewell
Personal
Care
Co.
5.500%,
06/01/28
(a)
50,000
49,687
Energizer
Holdings,
Inc.
4.375%,
03/31/29
(a)
75,000
71,040
Newell
Brands,
Inc.
6.375%,
09/15/27
50,000
50,690
6.625%,
09/15/29
100,000
101,215
Perrigo
Finance
Unlimited
Co.
4.900%,
06/15/30
50,000
48,709
Tempur
Sealy
International,
Inc.
3.875%,
10/15/31
(a)
75,000
66,808
Total
466,071
Diversified
Manufacturing
1.2%
Chart
Industries,
Inc.
7.500%,
01/01/30
(a)
50,000
52,719
EMRLD
Borrower
LP
/
Emerald
Co.-Issuer,
Inc.
6.625%,
12/15/30
(a)
100,000
103,102
Husky
Injection
Molding
Systems
Ltd.
/
Titan
Co.-Borrower
LLC
9.000%,
02/15/29
(a)
50,000
52,000
Madison
IAQ
LLC
5.875%,
06/30/29
(a)
50,000
48,718
WESCO
Distribution,
Inc.
6.625%,
03/15/32
(a)
50,000
52,057
Total
308,596
Electric
2.8%
Calpine
Corp.
4.625%,
02/01/29
(a)
100,000
96,576
5.125%,
03/15/28
(a)
50,000
49,272
Clearway
Energy
Operating
LLC
3.750%,
02/15/31
(a)
50,000
45,776
Lightning
Power
LLC
7.250%,
08/15/32
(a)
50,000
52,500
NextEra
Energy
Operating
Partners
LP
7.250%,
01/15/29
(a)
100,000
105,406
NRG
Energy
Inc.
3.375%,
02/15/29
(a)
50,000
46,622
NRG
Energy,
Inc.
3.625%,
02/15/31
(a)
50,000
45,335
PG&E
Corp.
5.000%,
07/01/28
50,000
49,593
TerraForm
Power
Operating
LLC
4.750%,
01/15/30
(a)
50,000
47,831
Vistra
Operations
Co.
LLC
4.375%,
05/01/29
(a)
100,000
96,826
6.875%,
04/15/32
(a)
100,000
105,271
Total
741,008
Environmental
0.4%
GFL
Environmental,
Inc.
4.750%,
06/15/29
(a)
50,000
48,741
6.750%,
01/15/31
(a)
50,000
52,465
Total
101,206
PORTFOLIO
OF
INVESTMENTS
(continued)
Columbia
U.S.
High
Yield
ETF
September
30,
2024
(Unaudited)
The
accompanying
Notes
to
Financial
Statements
are
an
integral
part
of
this
statement.
Corporate
Bonds
(continued)
Issue
Description
Principal
Amount
($)
Value
($)
Finance
Companies
4.2%
FirstCash
Inc
5.625%,
01/01/30
(a)
50,000
49,566
Fortress
Transportation
And
Infrastructure
Investors
LLC
7.000%,
06/15/32
(a)
50,000
52,480
7.875%,
12/01/30
(a)
50,000
53,886
Freedom
Mortgage
Corp.
12.000%,
10/01/28
(a)
100,000
109,311
12.250%,
10/01/30
(a)
50,000
56,012
Goeasy
Ltd.
7.625%,
07/01/29
(a)
50,000
51,811
Nationstar
Mortgage
Holdings,
Inc.
5.125%,
12/15/30
(a)
100,000
95,913
Navient
Corp.
4.875%,
03/15/28
50,000
48,344
9.375%,
07/25/30
50,000
55,472
OneMain
Finance
Corp.
3.500%,
01/15/27
50,000
47,780
3.875%,
09/15/28
50,000
46,375
7.875%,
03/15/30
50,000
52,296
Pennymac
Financial
Services,
Inc.
7.875%,
12/15/29
(a)
100,000
106,572
Rocket
Mortgage
LLC
/
Rocket
Mortgage
Co.-Issuer
Inc.
4.000%,
10/15/33
(a)
50,000
44,919
Rocket
Mortgage
LLC
/
Rocket
Mortgage
Co.-Issuer,
Inc.
3.875%,
03/01/31
(a)
50,000
46,054
Springleaf
Finance
Corp.
5.375%,
11/15/29
100,000
96,050
United
Wholesale
Mortgage
LLC
5.500%,
04/15/29
(a)
50,000
48,695
5.750%,
06/15/27
(a)
50,000
49,710
Total
1,111,246
Food
and
Beverage
2.8%
Aramark
Services,
Inc.
5.000%,
02/01/28
(a)
50,000
49,818
B&G
Foods,
Inc.
8.000%,
09/15/28
(a)
50,000
52,288
BellRing
Brands,
Inc.
7.000%,
03/15/30
(a)
50,000
52,295
Darling
Ingredients,
Inc.
6.000%,
06/15/30
(a)
50,000
50,461
Lamb
Weston
Holdings,
Inc.
4.375%,
01/31/32
(a)
50,000
46,364
Performance
Food
Group,
Inc.
4.250%,
08/01/29
(a)
50,000
47,529
5.500%,
10/15/27
(a)
50,000
49,833
Post
Holdings,
Inc.
4.500%,
09/15/31
(a)
50,000
46,745
4.625%,
04/15/30
(a)
50,000
47,823
5.500%,
12/15/29
(a)
100,000
99,286
Primo
Water
Holdings,
Inc.
4.375%,
04/30/29
(a)
50,000
47,927
Simmons
Foods,
Inc./Simmons
Prepared
Foods,
Inc./Simmons
Pet
Food,
Inc./Simmons
Feed
4.625%,
03/01/29
(a)
50,000
47,433
United
Natural
Foods,
Inc.
6.750%,
10/15/28
(a)
50,000
47,688
US
Foods,
Inc.
4.625%,
06/01/30
(a)
50,000
48,395
Total
733,885
Corporate
Bonds
(continued)
Issue
Description
Principal
Amount
($)
Value
($)
Gaming
3.2%
Affinity
Interactive
6.875%,
12/15/27
(a)
25,000
21,473
Boyd
Gaming
Corp.
4.750%,
06/15/31
(a)
50,000
47,717
Caesars
Entertainment,
Inc.
4.625%,
10/15/29
(a)
100,000
95,161
7.000%,
02/15/30
(a)
100,000
104,488
Churchill
Downs,
Inc.
5.500%,
04/01/27
(a)
50,000
49,814
5.750%,
04/01/30
(a)
50,000
50,062
Light
&
Wonder
International,
Inc.
7.250%,
11/15/29
(a)
50,000
51,728
MGM
Resorts
International
4.750%,
10/15/28
50,000
48,998
5.500%,
04/15/27
50,000
50,153
Midwest
Gaming
Borrower
LLC
/
Midwest
Gaming
Finance
Corp.
4.875%,
05/01/29
(a)
50,000
47,931
Molina
Healthcare,
Inc.
3.875%,
11/15/30
(a)
75,000
69,687
Scientific
Games
Holdings
LP/Scientific
Games
US
Finco
,
Inc.
6.625%,
03/01/30
(a)
50,000
49,645
Station
Casinos
LLC
4.625%,
12/01/31
(a)
50,000
46,409
Wynn
Las
Vegas
LLC
/
Wynn
Las
Vegas
Capital
Corp.
5.250%,
05/15/27
(a)
50,000
50,014
Wynn
Resorts
Finance
LLC
/
Wynn
Resorts
Capital
Corp.
5.125%,
10/01/29
(a)
50,000
49,383
Total
832,663
Health
Care
5.4%
AdaptHealth
LLC
5.125%,
03/01/30
(a)
50,000
46,801
Bausch
+
Lomb
Corp.
8.375%,
10/01/28
(a)
50,000
52,887
Catalent
Pharma
Solutions,
Inc.
5.000%,
07/15/27
(a)
50,000
49,759
CHS/Community
Health
Systems,
Inc.
5.250%,
05/15/30
(a)
50,000
46,001
5.625%,
03/15/27
(a)
50,000
49,177
6.000%,
01/15/29
(a)
50,000
48,523
6.875%,
04/15/29
(a)
50,000
45,284
10.875%,
01/15/32
(a)
50,000
55,110
DaVita,
Inc.
4.625%,
06/01/30
(a)
100,000
95,175
6.875%,
09/01/32
(a)
100,000
103,315
Encompass
Health
Corp.
4.750%,
02/01/30
50,000
48,862
Legacy
LifePoint
Health
LLC
4.375%,
02/15/27
(a)
50,000
49,026
LifePoint
Health,
Inc.
9.875%,
08/15/30
(a)
50,000
55,079
10.000%,
06/01/32
(a)
50,000
55,077
Medline
Borrower
LP
5.250%,
10/01/29
(a)
75,000
73,591
Prime
Healthcare
Services,
Inc.
9.375%,
09/01/29
(a)
50,000
51,526
Select
Medical
Corp.
6.250%,
08/15/26
(a)
50,000
50,318
Star
Parent,
Inc.
9.000%,
10/01/30
(a)
50,000
53,720
PORTFOLIO
OF
INVESTMENTS
(continued)
Columbia
U.S.
High
Yield
ETF
September
30,
2024
(Unaudited)
The
accompanying
Notes
to
Financial
Statements
are
an
integral
part
of
this
statement.
Corporate
Bonds
(continued)
Issue
Description
Principal
Amount
($)
Value
($)
Surgery
Center
Holdings,
Inc.
7.250%,
04/15/32
(a)
50,000
52,189
Tenet
Healthcare
Corp.
5.125%,
11/01/27
140,000
139,586
6.125%,
10/01/28
100,000
100,829
6.125%,
06/15/30
50,000
50,843
6.750%,
05/15/31
50,000
52,155
Total
1,424,833
Healthcare
Insurance
0.2%
Murphy
Oil
USA,
Inc.
3.750%,
02/15/31
(a)
50,000
45,051
Healthcare
REIT
0.1%
MPT
Operating
Partnership
LP
/
MPT
Finance
Corp.
4.625%,
08/01/29
50,000
40,253
Home
Construction
0.5%
Brookfield
Residential
Properties,
Inc.
/
Brookfield
Residential
US
LLC
4.875%,
02/15/30
(a)
50,000
47,058
Century
Communities,
Inc.
3.875%,
08/15/29
(a)
50,000
46,844
Mattamy
Group
Corp.
5.250%,
12/15/27
(a)
50,000
49,761
Total
143,663
Independent
Energy
4.8%
Baytex
Energy
Corp.
8.500%,
04/30/30
(a)
50,000
51,842
Chesapeake
Energy
Corp.
6.750%,
04/15/29
(a)
50,000
50,952
Civitas
Resources,
Inc.
8.375%,
07/01/28
(a)
50,000
52,254
8.750%,
07/01/31
(a)
50,000
53,000
CNX
Resources
Corp.
6.000%,
01/15/29
(a)
50,000
50,275
Crescent
Energy
Finance
LLC
7.625%,
04/01/32
(a)
50,000
50,148
Encino
Acquisition
Partners
Holdings
LLC
8.500%,
05/01/28
(a)
50,000
50,911
Hilcorp
Energy
I
LP
/
Hilcorp
Finance
Co.
6.000%,
04/15/30
(a)
50,000
48,717
6.250%,
04/15/32
(a)
50,000
48,688
6.875%,
05/15/34
(a)
50,000
49,875
Kraken
Oil
&
Gas
Partners
LLC
7.625%,
08/15/29
(a)
50,000
49,940
Matador
Resources
Co.
6.500%,
04/15/32
(a)
50,000
49,898
McAfee
Corp.
6.750%,
03/01/29
(a)
50,000
48,876
Meg
Energy
Corp.
5.875%,
02/01/29
(a)
50,000
48,912
Northern
Oil
And
Gas
Inc.
8.125%,
03/01/28
(a)
50,000
50,452
Permian
Resources
Operating
LLC
5.875%,
07/01/29
(a)
50,000
50,062
6.250%,
02/01/33
(a)
50,000
50,800
7.000%,
01/15/32
(a)
50,000
51,988
Range
Resources
Corp.
8.250%,
01/15/29
50,000
51,759
Saturn
Oil
&
Gas,
Inc.
9.625%,
06/15/29
(a)
50,000
49,412
SM
Energy
Co.
6.750%,
08/01/29
(a)
50,000
50,197
Corporate
Bonds
(continued)
Issue
Description
Principal
Amount
($)
Value
($)
Southwestern
Energy
Co.
5.375%,
02/01/29
50,000
49,796
5.375%,
03/15/30
50,000
49,837
Talos
Production,
Inc.
9.375%,
02/01/31
(a)
50,000
51,390
TNGR
Intermediate
Holdings
LLC
5.500%,
10/15/29
(a)
50,000
47,506
Total
1,257,487
Leisure
3.1%
Carnival
Corp.
5.750%,
03/01/27
(a)
100,000
101,305
6.000%,
05/01/29
(a)
100,000
101,201
Carnival
Holdings
Bermuda
Ltd.
10.375%,
05/01/28
(a)
100,000
107,933
Cinemark
USA,
Inc.
7.000%,
08/01/32
(a)
50,000
52,240
Live
Nation
Entertainment,
Inc.
4.750%,
10/15/27
(a)
50,000
49,322
NCL
Corp.
Ltd.
5.875%,
03/15/26
(a)
50,000
50,010
NCL
Finance
Ltd.
6.125%,
03/15/28
(a)
50,000
50,992
Royal
Caribbean
Cruises
Ltd.
6.000%,
02/01/33
(a)
100,000
102,519
SIX
Flags
Entertainment
Corp.
7.250%,
05/15/31
(a)
50,000
51,746
SIX
Flags
Entertainment
Corp.
/
SIX
Flags
Theme
Parks,
Inc.
6.625%,
05/01/32
(a)
50,000
51,771
Viking
Cruises
Ltd.
9.125%,
07/15/31
(a)
50,000
54,640
VOC
Escrow
Ltd.
5.000%,
02/15/28
(a)
50,000
49,380
Total
823,059
Life
Insurance
0.2%
Global
Atlantic
Fin
Co.
7.950%,
(US
5
Year
CMT
T-Note
+
3.608%),
10/15/54
(a),(b)
50,000
52,080
Lodging
0.5%
Hilton
Grand
Vacations
Borrower
Escrow
LLC
/
Hilton
Grand
Vacations
Borrower
Esc
4.875%,
07/01/31
(a)
50,000
45,420
6.625%,
01/15/32
(a)
50,000
50,657
Travel
+
Leisure
Co.
4.500%,
12/01/29
(a)
50,000
47,320
Total
143,397
Media
and
Entertainment
3.3%
AMC
Networks,
Inc.
4.250%,
02/15/29
50,000
36,147
Clear
Channel
Outdoor
Holdings,
Inc.
5.125%,
08/15/27
(a)
50,000
49,153
7.500%,
06/01/29
(a)
50,000
43,018
9.000%,
09/15/28
(a)
50,000
53,156
Gray
Television,
Inc.
10.500%,
07/15/29
(a)
50,000
52,279
Lamar
Media
Corp.
3.625%,
01/15/31
50,000
45,704
McGraw-Hill
Education,
Inc.
5.750%,
08/01/28
(a)
50,000
49,414
8.000%,
08/01/29
(a)
50,000
50,211
Nexstar
Media,
Inc.
5.625%,
07/15/27
(a)
100,000
99,070
PORTFOLIO
OF
INVESTMENTS
(continued)
Columbia
U.S.
High
Yield
ETF
September
30,
2024
(Unaudited)
The
accompanying
Notes
to
Financial
Statements
are
an
integral
part
of
this
statement.
Corporate
Bonds
(continued)
Issue
Description
Principal
Amount
($)
Value
($)
Outfront
Media
Capital
LLC
/
Outfront
Media
Capital
Corp.
4.625%,
03/15/30
(a)
50,000
47,555
Paramount
Global
6.375%,
(US
5
Year
CMT
T-Note
+
3.999%),
03/30/62
(b)
50,000
45,993
ROBLOX
Corp.
3.875%,
05/01/30
(a)
50,000
46,559
TEGNA,
Inc.
4.625%,
03/15/28
100,000
95,922
Univision
Communications,
Inc.
6.625%,
06/01/27
(a)
50,000
50,152
7.375%,
06/30/30
(a)
50,000
48,345
8.000%,
08/15/28
(a)
50,000
51,136
Total
863,814
Metals
and
Mining
1.5%
Alcoa
Nederland
Holding
BV
7.125%,
03/15/31
(a)
50,000
53,233
Arsenal
AIC
Parent
LLC
11.500%,
10/01/31
(a)
50,000
56,515
Cleveland-Cliffs,
Inc.
7.000%,
03/15/32
(a)
100,000
101,113
Compass
Minerals
International,
Inc.
6.750%,
12/01/27
(a)
50,000
49,762
Kaiser
Aluminum
Corp.
4.500%,
06/01/31
(a)
50,000
45,770
Novelis
Corp.
4.750%,
01/30/30
(a)
100,000
96,821
Total
403,214
Midstream
6.8%
AmeriGas
Partners
LP
/
Amerigas
Finance
Corp.
5.750%,
05/20/27
50,000
49,084
Antero
Midstream
Partners
LP
/
Antero
Midstream
Finance
Corp.
5.750%,
03/01/27
(a)
50,000
50,082
6.625%,
02/01/32
(a)
50,000
51,723
Blue
Racer
Midstream
LLC
/
Blue
Racer
Finance
Corp.
7.250%,
07/15/32
(a)
50,000
52,520
Buckeye
Partners
LP
6.875%,
07/01/29
(a)
50,000
51,244
Delek
Logistics
Partners
LP
/
Delek
Logistics
Finance
Corp.
8.625%,
03/15/29
(a)
50,000
52,641
EQM
Midstream
Partners
LP
4.750%,
01/15/31
(a)
50,000
48,427
6.375%,
04/01/29
(a)
50,000
51,660
Ferrellgas
LP
/
Ferrellgas
Finance
Corp.
5.375%,
04/01/26
(a)
50,000
49,880
5.875%,
04/01/29
(a)
50,000
46,784
Genesis
Energy
LP
/
Genesis
Energy
Finance
Corp.
8.000%,
01/15/27
50,000
51,102
8.250%,
01/15/29
50,000
51,752
Harvest
Midstream
I
LP
7.500%,
05/15/32
(a)
50,000
52,566
Hess
Midstream
Operations
LP
4.250%,
02/15/30
(a)
50,000
47,741
5.125%,
06/15/28
(a)
50,000
49,511
Howard
Midstream
Energy
Partners
LLC
8.875%,
07/15/28
(a)
100,000
106,105
ITT
Holdings
LLC
6.500%,
08/01/29
(a)
50,000
47,431
Kinetik
Holdings
LP
6.625%,
12/15/28
(a)
50,000
51,934
Corporate
Bonds
(continued)
Issue
Description
Principal
Amount
($)
Value
($)
New
Fortress
Energy,
Inc.
6.500%,
09/30/26
(a)
50,000
42,099
NGL
Energy
Operating
LLC
/
NGL
Energy
Finance
Corp.
8.125%,
02/15/29
(a)
50,000
51,269
8.375%,
02/15/32
(a)
50,000
51,531
Nustar
Logistics
LP
6.375%,
10/01/30
50,000
51,891
NuStar
Logistics
LP
6.000%,
06/01/26
50,000
50,334
Sunoco
LP
7.000%,
05/01/29
(a)
50,000
52,270
Sunoco
LP
/
Sunoco
Finance
Corp.
4.500%,
04/30/30
50,000
47,884
7.000%,
09/15/28
(a)
50,000
51,904
Tallgrass
Energy
Partners
LP
/
Tallgrass
Energy
Finance
Corp.
5.500%,
01/15/28
(a)
50,000
48,418
6.000%,
12/31/30
(a)
50,000
47,530
Venture
Global
LNG,
Inc.
8.125%,
06/01/28
(a)
100,000
104,250
9.500%,
02/01/29
(a)
100,000
112,429
9.875%,
02/01/32
(a)
100,000
111,127
Total
1,785,123
Oil
Field
Services
2.3%
Archrock
Partners
LP
/
Archrock
Partners
Finance
Corp.
6.625%,
09/01/32
(a)
50,000
51,332
Enerflex
Ltd.
9.000%,
10/15/27
(a)
50,000
51,846
Nabors
Industries,
Inc.
8.875%,
08/15/31
(a)
50,000
47,559
Noble
Finance
II
LLC
8.000%,
04/15/30
(a)
50,000
51,593
Transocean
Titan
Financing
Ltd.
8.375%,
02/01/28
(a)
50,000
51,511
Transocean,
Inc.
8.500%,
05/15/31
(a)
50,000
49,680
8.750%,
02/15/30
(a)
42,500
44,320
USA
Compression
Partners
LP
/
USA
Compression
Finance
Corp.
7.125%,
03/15/29
(a)
50,000
51,493
Valaris
Ltd.
8.375%,
04/30/30
(a)
50,000
51,509
Venture
Global
LNG,
Inc.
8.375%,
06/01/31
(a)
100,000
105,408
Weatherford
International
Ltd.
8.625%,
04/30/30
(a)
50,000
52,090
Total
608,341
Other
Financial
Institutions
1.4%
Credit
Acceptance
Corp.
9.250%,
12/15/28
(a)
50,000
53,511
Howard
Hughes
Corp.
(The)
4.125%,
02/01/29
(a)
50,000
46,669
5.375%,
08/01/28
(a)
50,000
49,276
Icahn
Enterprises
LP
/
Icahn
Enterprises
Finance
Corp.
6.250%,
05/15/26
50,000
49,598
9.750%,
01/15/29
(a)
50,000
51,879
Kennedy-Wilson,
Inc.
4.750%,
03/01/29
15,000
13,884
4.750%,
02/01/30
50,000
45,332
Nationstar
Mortgage
Holdings,
Inc.
5.500%,
08/15/28
(a)
50,000
49,535
Total
359,684
PORTFOLIO
OF
INVESTMENTS
(continued)
Columbia
U.S.
High
Yield
ETF
September
30,
2024
(Unaudited)
The
accompanying
Notes
to
Financial
Statements
are
an
integral
part
of
this
statement.
Corporate
Bonds
(continued)
Issue
Description
Principal
Amount
($)
Value
($)
Other
Industry
0.8%
Arcosa
,
Inc.
6.875%,
08/15/32
(a)
50,000
52,324
Brand
Industrial
Services,
Inc.
10.375%,
08/01/30
(a)
50,000
53,513
Hillenbrand,
Inc.
6.250%,
02/15/29
50,000
50,945
Williams
Scotsman,
Inc.
6.625%,
06/15/29
(a)
50,000
51,512
Total
208,294
Other
REIT
1.7%
Ladder
Capital
Finance
Holdings
LLLP
/
Ladder
Capital
Finance
Corp.
4.750%,
06/15/29
(a)
50,000
48,859
Park
Intermediate
Holdings
LLC
/
PK
Domestic
Property
LLC
/
PK
Finance
Co.-Issuer
4.875%,
05/15/29
(a)
50,000
48,410
Rhp
Hotel
Properties
LP
/
Rhp
Finance
Corp.
6.500%,
04/01/32
(a)
100,000
103,380
Rlj
Lodging
Trust
LP
4.000%,
09/15/29
(a)
50,000
46,011
Service
Properties
Trust
8.625%,
11/15/31
(a)
50,000
54,374
Starwood
Property
Trust,
Inc.
7.250%,
04/01/29
(a)
100,000
104,881
XHR
LP
4.875%,
06/01/29
(a)
50,000
47,927
Total
453,842
Packaging
1.8%
Ardagh
Metal
Packaging
Finance
USA
LLC
/
Ardagh
Metal
Packaging
Finance
PLC
3.250%,
09/01/28
(a)
50,000
45,781
4.000%,
09/01/29
(a)
50,000
44,634
Clydesdale
Acquisition
Holdings,
Inc.
6.625%,
04/15/29
(a)
50,000
50,496
8.750%,
04/15/30
(a)
50,000
50,820
Labl
,
Inc.
5.875%,
11/01/28
(a)
50,000
46,881
Mauser
Packaging
Solutions
Holding
Co.
7.875%,
04/15/27
(a)
75,000
77,562
9.250%,
04/15/27
(a)
50,000
51,297
Owens-Brockway
Glass
Container,
Inc.
7.250%,
05/15/31
(a)
50,000
51,312
Pactiv
Evergreen
Group
Issuer
LLC
/ Pactiv
Evergreen
Group
Issuer,
Inc.
4.375%,
10/15/28
(a)
50,000
47,910
Total
466,693
Paper
0.2%
Verde
Purchaser
LLC
10.500%,
11/30/30
(a)
50,000
54,298
Pharmaceuticals
1.0%
Elanco
Animal
Health,
Inc.
6.650%,
08/28/28
50,000
51,910
ENDO
Finance
Holdings,
Inc.
8.500%,
04/15/31
(a)
50,000
53,586
Organon
&
Co.
/
Organon
Foreign
Debt
Co.-Issuer
BV
4.125%,
04/30/28
(a)
50,000
48,058
5.125%,
04/30/31
(a)
50,000
47,053
7.875%,
05/15/34
(a)
50,000
52,972
Total
253,579
Property
&
Casualty
3.1%
Acrisure
LLC
/
Acrisure
Finance,
Inc.
4.250%,
02/15/29
(a)
50,000
47,298
Corporate
Bonds
(continued)
Issue
Description
Principal
Amount
($)
Value
($)
8.500%,
06/15/29
(a)
50,000
52,279
Alliant
Holdings
Intermediate
LLC
/
Alliant
Holdings
Co.-Issuer
6.750%,
10/15/27
(a)
50,000
49,825
6.750%,
04/15/28
(a)
50,000
50,801
7.000%,
01/15/31
(a)
50,000
51,393
Amwins
Group,
Inc.
4.875%,
06/30/29
(a)
50,000
47,995
AssuredPartners
,
Inc.
5.625%,
01/15/29
(a)
50,000
48,181
7.500%,
02/15/32
(a)
50,000
51,454
BroadStreet
Partners,
Inc.
5.875%,
04/15/29
(a)
50,000
47,815
HUB
International
Ltd.
7.250%,
06/15/30
(a)
100,000
104,257
7.375%,
01/31/32
(a)
50,000
51,678
Jones
Deslauriers
Insurance
Management,
Inc.
10.500%,
12/15/30
(a)
50,000
54,429
Liberty
Mutual
Group,
Inc.
4.125%,
(US
5
Year
CMT
T-Note
+
3.315%),
12/15/51
(a),(b)
50,000
47,387
Panther
Escrow
Issuer
LLC
7.125%,
06/01/31
(a)
100,000
104,840
Total
809,632
Railroads
0.4%
Genesee
&
Wyoming,
Inc.
6.250%,
04/15/32
(a)
50,000
51,454
Watco
Cos.
LLC
/
Watco
Finance
Corp.
7.125%,
08/01/32
(a)
50,000
52,129
Total
103,583
Refining
0.2%
PBF
Holding
Co.
LLC
/
PBF
Finance
Corp.
7.875%,
09/15/30
(a)
50,000
51,496
Restaurants
1.1%
1011778
BC
ULC
/
New
Red
Finance,
Inc.
4.000%,
10/15/30
(a)
100,000
92,199
6.125%,
06/15/29
(a)
50,000
51,400
Fertitta
Entertainment
LLC
/
Fertitta
Entertainment
Finance
Co.,
Inc.
6.750%,
01/15/30
(a)
50,000
46,511
Yum!
Brands,
Inc.
5.375%,
04/01/32
100,000
99,772
Total
289,882
Retail
REIT
0.2%
Brookfield
Property
REIT,
Inc.
/
BPR
Cumulus
LLC
/
BPR
Nimbus
LLC
/
Ggsi
Sellco
LLC
4.500%,
04/01/27
(a)
50,000
48,638
Retailers
4.6%
Asbury
Automotive
Group,
Inc.
5.000%,
02/15/32
(a)
50,000
47,386
Bath
&
Body
Works,
Inc.
6.875%,
11/01/35
75,000
78,223
Carvana
Co.
12.000%,
12/01/28
(a),(c)
50,000
52,436
13.000%,
06/01/30
(a),(c)
50,000
54,377
14.000%,
06/01/31
(a),(c)
50,000
58,897
Gap,
Inc.
(The)
3.875%,
10/01/31
(a)
50,000
43,704
Group
1
Automotive,
Inc.
6.375%,
01/15/30
(a)
50,000
50,821
Hanesbrands,
Inc.
9.000%,
02/15/31
(a)
50,000
53,979
PORTFOLIO
OF
INVESTMENTS
(continued)
Columbia
U.S.
High
Yield
ETF
September
30,
2024
(Unaudited)
The
accompanying
Notes
to
Financial
Statements
are
an
integral
part
of
this
statement.
Corporate
Bonds
(continued)
Issue
Description
Principal
Amount
($)
Value
($)
Lcm
Investments
Holdings
II
LLC
8.250%,
08/01/31
(a)
50,000
53,087
Lithia
Motors,
Inc.
4.375%,
01/15/31
(a)
50,000
46,580
Mavis
Tire
Express
Services
Topco
Corp.
6.500%,
05/15/29
(a)
50,000
48,040
Miter
Brands
Acquisition
Holdco,
Inc.
/
Miwd
Borrower
LLC
6.750%,
04/01/32
(a)
50,000
51,830
NCL
Corp.
Ltd.
8.125%,
01/15/29
(a)
50,000
53,409
Nordstrom
Inc
5.000%,
01/15/44
50,000
38,687
PetSmart,
Inc.
/
PetSmart
Finance
Corp.
4.750%,
02/15/28
(a)
50,000
47,934
7.750%,
02/15/29
(a)
50,000
49,321
Qvc
,
Inc.
4.750%,
02/15/27
50,000
45,493
Sonic
Automotive,
Inc.
4.875%,
11/15/31
(a)
50,000
46,183
Victoria's
Secret
&
Co.
4.625%,
07/15/29
(a)
50,000
44,138
Walgreens
Boots
Alliance,
Inc.
4.800%,
11/18/44
50,000
37,457
8.125%,
08/15/29
100,000
99,825
Wand
Newco
3,
Inc.
7.625%,
01/30/32
(a)
50,000
52,652
Wolverine
World
Wide,
Inc.
4.000%,
08/15/29
(a)
50,000
44,126
Total
1,198,585
Supermarkets
0.4%
Albertsons
Cos.,
Inc.
/
Safeway,
Inc.
/
New
Albertsons
LP
/
Albertsons
LLC
4.625%,
01/15/27
(a)
100,000
97,539
Technology
8.4%
Amentum
Escrow
Corp.
7.250%,
08/01/32
(a)
50,000
52,171
AthenaHealth
Group
Inc.
6.500%,
02/15/30
(a)
75,000
72,100
Block,
Inc.
6.500%,
05/15/32
(a)
50,000
52,078
Boost
Newco
Borrower
LLC
7.500%,
01/15/31
(a)
75,000
80,454
Capstone
Borrower,
Inc.
8.000%,
06/15/30
(a)
50,000
53,040
Central
Parent,
Inc.
/
CDK
Global,
Inc.
7.250%,
06/15/29
(a)
50,000
51,126
Cloud
Software
Group,
Inc.
6.500%,
03/31/29
(a)
150,000
149,289
8.250%,
06/30/32
(a)
100,000
104,531
9.000%,
09/30/29
(a)
150,000
152,665
Condor
Merger
Sub,
Inc.
7.375%,
02/15/30
(a)
50,000
48,785
Conduent
Business
Services
LLC
/
Conduent
State
&
Local
Solutions,
Inc.
6.000%,
11/01/29
(a)
50,000
48,169
Fortress
Intermediate
3,
Inc.
7.500%,
06/01/31
(a)
50,000
52,779
Gen
Digital,
Inc.
6.750%,
09/30/27
(a)
50,000
51,395
Helios
Software
Holdings,
Inc.
/
ION
Corporate
Solutions
Finance
Sarl
8.750%,
05/01/29
(a)
50,000
51,093
Corporate
Bonds
(continued)
Issue
Description
Principal
Amount
($)
Value
($)
Imola
Merger
Corp.
4.750%,
05/15/29
(a)
50,000
48,796
Iron
Mountain,
Inc.
4.500%,
02/15/31
(a)
100,000
94,919
4.875%,
09/15/29
(a)
50,000
48,960
5.000%,
07/15/28
(a)
50,000
49,316
5.250%,
03/15/28
(a)
100,000
99,611
7.000%,
02/15/29
(a)
50,000
52,085
NCR
Atleos
Corp.
9.500%,
04/01/29
(a)
50,000
55,046
NCR
Voyix
Corp.
5.125%,
04/15/29
(a)
15,000
14,435
Neptune
Bidco
US,
Inc.
9.290%,
04/15/29
(a)
75,000
73,423
Open
Text
Corp.
3.875%,
12/01/29
(a)
50,000
46,508
Open
Text
Holdings,
Inc.
4.125%,
02/15/30
(a)
50,000
46,942
Sabre
Glbl
Inc.
11.250%,
12/15/27
(a)
50,000
51,946
Seagate
HDD
Cayman
9.625%,
12/01/32
50,000
58,039
Sensata
Technologies,
Inc.
3.750%,
02/15/31
(a)
50,000
45,791
Shift4
Payments
LLC
/
Shift4
Payments
Finance
Sub,
Inc.
6.750%,
08/15/32
(a)
50,000
52,245
SS&C
Technologies,
Inc.
5.500%,
09/30/27
(a)
50,000
50,006
6.500%,
06/01/32
(a)
50,000
51,683
Twilio
,
Inc.
3.875%,
03/15/31
50,000
46,205
UKG,
Inc.
6.875%,
02/01/31
(a)
100,000
103,370
Western
Digital
Corp.
4.750%,
02/15/26
50,000
49,701
Xerox
Holdings
Corp.
8.875%,
11/30/29
(a)
50,000
46,492
Total
2,205,194
Transportation
Services
0.6%
Avis
Budget
Car
Rental
LLC
/
Avis
Budget
Finance,
Inc.
5.375%,
03/01/29
(a)
50,000
46,746
8.000%,
02/15/31
(a)
50,000
51,145
Rand
Parent
LLC
8.500%,
02/15/30
(a)
50,000
50,936
Total
148,827
Wirelines
2.6%
Consolidated
Communications,
Inc.
6.500%,
10/01/28
(a)
50,000
47,289
Frontier
Communications
Holdings
LLC
5.000%,
05/01/28
(a)
75,000
74,350
6.000%,
01/15/30
(a)
100,000
99,809
8.625%,
03/15/31
(a)
50,000
53,942
Level
3
Financing,
Inc.
10.500%,
04/15/29
(a)
50,000
54,712
10.750%,
12/15/30
(a)
50,000
54,922
11.000%,
11/15/29
(a)
100,000
110,856
Uniti
Group
LP
/
Uniti
Group
Finance,
Inc.
/
CSL
Capital
LLC
10.500%,
02/15/28
(a)
100,000
106,745
Windstream
Escrow
LLC
/
Windstream
Escrow
Finance
Corp.
7.750%,
08/15/28
(a)
50,000
50,022
PORTFOLIO
OF
INVESTMENTS
(continued)
Columbia
U.S.
High
Yield
ETF
September
30,
2024
(Unaudited)
The
accompanying
Notes
to
Financial
Statements
are
an
integral
part
of
this
statement.
Notes
to
Portfolio
of
Investments
Corporate
Bonds
(continued)
Issue
Description
Principal
Amount
($)
Value
($)
Zayo
Group
Holdings,
Inc.
4.000%,
03/01/27
(a)
50,000
44,634
Total
697,281
Total
Corporate
Bonds
(Cost
$25,395,034)
25,568,450
Money
Market
Funds
1.6%
Shares
Value
($)
Dreyfus
Treasury
Securities
Cash
Management,
Institutional
Shares
4.879%
(d)
413,923
413,922
Total
Money
Market
Funds
(Cost
$413,922)
413,922
Total
Investments
in
Securities
(Cost
$25,808,956)
25,982,372
Other
Assets
&
Liabilities,
Net
315,787
Net
Assets
26,298,159
(a)
Represents
privately
placed
and
other
securities
and
instruments
exempt
from
Securities
and
Exchange
Commission
registration
(collectively,
private
placements),
such
as
Section
4(a)(2)
and
Rule
144A
eligible
securities,
which
are
often
sold
only
to
qualified
institutional
buyers.
At
September
30,
2024,
the
total
value
of
these
securities
amounted
to
$22,259,346,
which
represents
84.64%
of
total
net
assets.
(b)
Variable
rate
security.
The
interest
rate
shown
was
the
current
rate
as
of
September
30,
2024.
(c)
Payment-in-kind
security.
Interest
can
be
paid
by
issuing
additional
par
of
the
security
or
in
cash.
(d)
The
rate
shown
is
the
seven-day
current
annualized
yield
at
September
30,
2024.
Fair
Value
Measurements
The
Fund
categorizes
its
fair
value
measurements
according
to
a
three-level
hierarchy
that
maximizes
the
use
of
observable
inputs
and
minimizes
the
use
of
unobservable
inputs
by
prioritizing
that
the
most
observable
input
be
used
when
available.
Observable
inputs
are
those
that
market
participants
would
use
in
pricing
an
investment
based
on
market
data
obtained
from
sources
independent
of
the
reporting
entity.
Unobservable
inputs
are
those
that
reflect
the
Fund’s
assumptions
about
the
information
market
participants
would
use
in
pricing
an
investment.
An
investment’s
level
within
the
fair
value
hierarchy
is
based
on
the
lowest
level
of
any
input
that
is
deemed
significant
to
the
asset's
or
liability’s
fair
value
measurement.
The
input
levels
are
not
necessarily
an
indication
of
the
risk
or
liquidity
associated
with
investments
at
that
level.
For
example,
certain
U.S.
government
securities
are
generally
high
quality
and
liquid,
however,
they
are
reflected
as
Level
2
because
the
inputs
used
to
determine
fair
value
may
not
always
be
quoted
prices
in
an
active
market.
Fair
value
inputs
are
summarized
in
the
three
broad
levels
listed
below:
Level
1
—
Valuations
based
on
quoted
prices
for
investments
in
active
markets
that
the
Fund
has
the
ability
to
access
at
the
measurement
date.
Valuation
adjustments
are
not
applied
to
Level
1
investments.
Level
2
—
Valuations
based
on
other
significant
observable
inputs
(including
quoted
prices
for
similar
securities,
interest
rates,
prepayment
speeds,
credit
risks,
etc.).
Level
3
—
Valuations
based
on
significant
unobservable
inputs
(including
the
Fund’s
own
assumptions
and
judgment
in
determining
the
fair
value
of
investments).
Inputs
that
are
used
in
determining
fair
value
of
an
investment
may
include
price
information,
credit
data,
volatility
statistics,
and
other
factors.
These
inputs
can
be
either
observable
or
unobservable.
The
availability
of
observable
inputs
can
vary
between
investments,
and
is
affected
by
various
factors
such
as
the
type
of
investment,
and
the
volume
and
level
of
activity
for
that
investment
or
similar
investments
in
the
marketplace.
The
inputs
will
be
considered
by
the
Investment
Manager,
along
with
any
other
relevant
factors
in
the
calculation
of
an
investment’s
fair
value.
The
Fund
uses
prices
and
inputs
that
are
current
as
of
the
measurement
date,
which
may
include
periods
of
market
dislocations.
During
these
periods,
the
availability
of
prices
and
inputs
may
be
reduced
for
many
investments.
This
condition
could
cause
an
investment
to
be
reclassified
between
the
various
levels
within
the
hierarchy.
Investments
falling
into
the
Level
3
category
are
primarily
supported
by
quoted
prices
from
brokers
and
dealers
participating
in
the
market
for
those
investments.
However,
these
may
be
classified
as
Level
3
investments
due
to
lack
of
market
transparency
and
corroboration
to
support
these
quoted
prices.
Additionally,
valuation
models
may
be
used
as
the
pricing
source
for
any
remaining
investments
classified
as
Level
3.
These
models
may
rely
on
one
or
more
significant
unobservable
inputs
and/or
significant
assumptions
by
the
Investment
Manager.
Inputs
used
in
valuations
may
include,
but
are
not
limited
to,
financial
statement
analysis,
capital
account
balances,
discount
rates
and
estimated
cash
flows,
and
comparable
company
data.
PORTFOLIO
OF
INVESTMENTS
(continued)
Columbia
U.S.
High
Yield
ETF
September
30,
2024
(Unaudited)
The
accompanying
Notes
to
Financial
Statements
are
an
integral
part
of
this
statement.
Fair
Value
Measurements
(continued)
The
Fund's
Board
of
Trustees
(the
Board)
has
designated
the
Investment
Manager,
through
its
Valuation
Committee
(the
Committee),
as
valuation
designee,
responsible
for
determining
the
fair
value
of
the
assets
of
the
Fund
for
which
market
quotations
are
not
readily
available
using
valuation
procedures
approved
by
the
Board.
The
Committee
consists
of
voting
and
non-voting
members
from
various
groups
within
the
Investment
Manager's
organization,
including
operations
and
accounting,
trading
and
investments,
compliance,
risk
management
and
legal.
The
Committee
meets
at
least
monthly
to
review
and
approve
valuation
matters,
which
may
include
a
description
of
specific
valuation
determinations,
data
regarding
pricing
information
received
from
approved
pricing
vendors
and
brokers
and
the
results
of
Board-approved
valuation
policies
and
procedures
(the
Policies).
The
Policies
address,
among
other
things,
instances
when
market
quotations
are
or
are
not
readily
available,
including
recommendations
of
third
party
pricing
vendors
and
a
determination
of
appropriate
pricing
methodologies;
events
that
require
specific
valuation
determinations
and
assessment
of
fair
value
techniques;
securities
with
a
potential
for
stale
pricing,
including
those
that
are
illiquid,
restricted,
or
in
default;
and
the
effectiveness
of
third-party
pricing
vendors,
including
periodic
reviews
of
vendors.
The
Committee
meets
more
frequently,
as
needed,
to
discuss
additional
valuation
matters,
which
may
include
the
need
to
review
back-testing
results,
review
time-
sensitive
information
or
approve
related
valuation
actions.
Representatives
of
Columbia
Management
Investment
Advisers,
LLC
report
to
the
Board
at
each
of
its
regularly
scheduled
meetings
to
discuss
valuation
matters
and
actions
during
the
period,
similar
to
those
described
earlier.
The
following
table
is
a
summary
of
the
inputs
used
to
value
the
Fund’s
investments
at
September
30,
2024:
Level
1
($)
Level
2
($)
Level
3
($)
Total
($)
Investments
in
Securities
Corporate
Bonds
–
25,568,450
–
25,568,450
Money
Market
Funds
413,922
–
–
413,922
Total
Investments
in
Securities
413,922
25,568,450
–
25,982,372
See
the
Portfolio
of
Investments
for
all
investment
classifications
not
indicated
in
the
table.
The
Fund’s
assets
assigned
to
the
Level
2
input
category
are
generally
valued
using
the
market
approach,
in
which
a
security's
value
is
determined
through
reference
to
prices
and
information
from
market
transactions
for
similar
or
identical
assets.
STATEMENT
OF
ASSETS
AND
LIABILITIES
September
30,
2024
(Unaudited)
The
accompanying
Notes
to
Financial
Statements
are
an
integral
part
of
this
statement.
Columbia
Short
Duration
High
Yield
ETF
Columbia
U.S.
High
Yield
ETF
Assets
Investments
in
securities,
at
value
Unaffiliated
issuers
(cost
$25,801,800
and
$25,808,956,
respectively)
$25,930,695
$25,982,372
Receivable
for:
Interest
384,285
430,933
Dividends
2,258
1,057
Total
assets
26,317,238
26,414,362
Liabilities
Payable
for:
Investments
purchased
74,114
107,818
Investment
management
fees
8,046
8,385
Total
liabilities
82,160
116,203
Net
assets
applicable
to
outstanding
capital
stock
$26,235,078
$26,298,159
Represented
by:
Paid-in
capital
$26,005,502
$26,009,716
Total
distributable
earnings
(loss)
229,576
288,443
Total
-
representing
net
assets
applicable
to
outstanding
capital
stock
$26,235,078
$26,298,159
Shares
outstanding
1,300,050
1,300,050
Net
asset
value
per
share
$20.18
$20.23
STATEMENT
OF
OPERATIONS
For
the
period
from
September
5,
2024
(commencement
of
operations)
through
September
30,
2024
(Unaudited)
The
accompanying
Notes
to
Financial
Statements
are
an
integral
part
of
this
statement.
Columbia
Short
Duration
High
Yield
ETF
Columbia
U.S.
High
Yield
ETF
Investment
Income:
Interest
$106,718
$121,159
Dividends
-
unaffiliated
issuers
2,258
1,057
Total
income
108,976
122,216
Expenses:
Investment
management
fees
8,046
8,385
Total
expenses
8,046
8,385
Net
Investment
Income
100,930
113,831
Realized
and
unrealized
gain
(loss)
-
net
Net
realized
gain
(loss)
on:
Investments
-
unaffiliated
issuers
(249)
1,196
Net
realized
gain
(loss)
(249)
1,196
Change
in
net
unrealized
appreciation
(depreciation)
on:
Investments
-
unaffiliated
issuers
128,895
173,416
Net
change
in
unrealized
appreciation
128,895
173,416
Net
realized
and
unrealized
gain
128,646
174,612
Net
Increase
in
net
assets
resulting
from
operations
$229,576
$288,443
STATEMENT
OF
CHANGES
IN
NET
ASSETS
The
accompanying
Notes
to
Financial
Statements
are
an
integral
part
of
this
statement.
Columbia
Short
Duration
High
Yield
ETF
Columbia
U.S.
High
Yield
ETF
Six
Months
Ended
September
30,
2024
(a)
(Unaudited)
Six
Months
Ended
September
30,
2024
(a)
(Unaudited)
Operations
Net
investment
income
$100,930
$113,831
Net
realized
gain
(loss)
(249)
1,196
Net
change
in
unrealized
appreciation
128,895
173,416
Net
increase
in
net
assets
resulting
from
operations
229,576
288,443
Shareholder
transactions
Proceeds
from
shares
sold
1,004,502
1,008,716
Net
increase
in
net
assets
resulting
from
shareholder
transactions
1,004,502
1,008,716
Increase
in
net
assets
1,234,078
1,297,159
Net
Assets:
Net
assets
beginning
of
period
25,001,000
(b)
25,001,000
(c)
Net
assets
at
end
of
period
$26,235,078
$26,298,159
Capital
stock
activity
Shares
outstanding,
beginning
of
period
1,250,050
1,250,050
Shares
sold
50,000
50,000
Shares
outstanding,
end
of
period
1,300,050
1,300,050
(a)
Based
on
operations
from
September
5,
2024
(commencement
of
operations)
through
the
stated
period
end.
(b)
Initial
cash
of
$1,000
was
contributed
on
August
28,
2024;
additional
cash
of
$820,784
and
securities
(including
accrued
income)
of
$24,179,216
were
contributed
on
September
4,
2024.
(c)
Initial
cash
of
$1,000
was
contributed
on
August
28,
2024;
additional
cash
of
$224,807
and
securities
(including
accrued
income)
of
$24,775,193
were
contributed
on
September
4,
2024.
FINANCIAL
HIGHLIGHTS
Columbia
Short
Duration
High
Yield
ETF
The
accompanying
Notes
to
Financial
Statements
are
an
integral
part
of
this
statement.
The
following
tables
are
intended
to
help
you
understand
each
Fund’s
financial
performance.
Per
share
net
investment
income
(loss)
amounts
are
calculated
based
on
average
shares
outstanding
during
the
period.
Total
return
assumes
reinvestment
of
all
dividends
and
distributions,
if
any.
Total
Return
at
NAV
is
calculated
assuming
an
initial
investment
made
at
the
net
asset
value
at
the
beginning
of
the
period,
reinvestment
of
all
dividends
and
distributions
at
net
asset
value
during
the
period
and
redemption
on
the
last
day
of
the
period.
Total
Return
at
Market
Price
is
calculated
assuming
an
initial
investment
made
at
the
market
price
at
the
beginning
of
the
period,
reinvestment
of
all
dividends
and
distributions
at
market
price
during
the
period
and
redemption
on
the
last
day
of
the
period.
The
total
return
would
have
been
lower
if
certain
expenses
had
not
been
reimbursed/waived
by
the
Investment
Manager.
Market
Price
returns
are
based
on
closing
prices
reported
by
the
Fund's
primary
listing
exchange
(typically
4
pm
ET
close).
These
returns
do
not
represent
the
returns
an
investor
would
receive
if
shares
were
traded
at
other
times.
Total
return
and
portfolio
turnover
are
not
annualized
for
periods
of
less
than
one
year.
The
ratios
of
expenses
and
net
investment
income
are
annualized
for
periods
of
less
than
one
year.
The
portfolio
turnover
rate
is
calculated
without
regard
to
purchase
and
sales
transactions
of
short-term
instruments,
certain
derivatives
and
in-kind
transactions,
if
any.
If
such
transactions
were
included,
the
Fund’s
portfolio
turnover
rate
may
be
higher.
Six
Months
Ended
September
30,
2024
(Unaudited)
(a)
Per
share
data
Net
asset
value,
beginning
of
period
$20.00
Income
(loss)
from
investment
operations:
Net
investment
income
0.08
Net
realized
and
unrealized
gain
0.10
Total
from
investment
operations
0.18
Net
asset
value,
end
of
period
$20.18
Total
Return
at
NAV
0.90%
Total
Return
at
Market
Price
1.00%
Ratios
to
average
net
assets:
Total
gross
expenses
(b)
0.44%
Total
net
expenses
(b)(c)
0.44%
Net
investment
income
5.52%
Supplemental
data
Net
assets,
end
of
period
(in
thousands)
$26,235
Portfolio
turnover
0%
(a)
The
Fund
commenced
operations
on
September
5,
2024.
Per
share
data
and
total
return
reflect
activity
from
that
date.
(b)
In
addition
to
the
fees
and
expenses
that
the
Fund
bears
directly,
the
Fund
indirectly
bears
a
pro
rata
share
of
the
fees
and
expenses
of
any
other
funds
in
which
it
invests.
Such
indirect
expenses
are
not
included
in
the
Fund’s
reported
expense
ratios.
(c)
Total
net
expenses
include
the
impact
of
certain
fee
waivers/expense
reimbursements
made
by
the
Investment
Manager
and
certain
of
its
affiliates,
if
applicable.
FINANCIAL
HIGHLIGHTS
Columbia
U.S.
High
Yield
ETF
The
accompanying
Notes
to
Financial
Statements
are
an
integral
part
of
this
statement.
Six
Months
Ended
September
30,
2024
(Unaudited)
(a)
Per
share
data
Net
asset
value,
beginning
of
period
$20.00
Income
(loss)
from
investment
operations:
Net
investment
income
0.09
Net
realized
and
unrealized
gain
0.14
Total
from
investment
operations
0.23
Net
asset
value,
end
of
period
$20.23
Total
Return
at
NAV
1.15%
Total
Return
at
Market
Price
1.15%
Ratios
to
average
net
assets:
Total
gross
expenses
(b)
0.46%
Total
net
expenses
(b)(c)
0.46%
Net
investment
income
6.24%
Supplemental
data
Net
assets,
end
of
period
(in
thousands)
$26,298
Portfolio
turnover
0%
(a)
The
Fund
commenced
operations
on
September
5,
2024.
Per
share
data
and
total
return
reflect
activity
from
that
date.
(b)
In
addition
to
the
fees
and
expenses
that
the
Fund
bears
directly,
the
Fund
indirectly
bears
a
pro
rata
share
of
the
fees
and
expenses
of
any
other
funds
in
which
it
invests.
Such
indirect
expenses
are
not
included
in
the
Fund’s
reported
expense
ratios.
(c)
Total
net
expenses
include
the
impact
of
certain
fee
waivers/expense
reimbursements
made
by
the
Investment
Manager
and
certain
of
its
affiliates,
if
applicable.
NOTES
TO
FINANCIAL
STATEMENTS
September
30,
2024
(Unaudited)
Note
1.
Organization
Columbia
ETF
Trust
I
(the
Trust)
is
registered
under
the
Investment
Company
Act
of
1940,
as
amended
(the
1940
Act),
as
an
open-end
management
investment
company
organized
as
a
Massachusetts
statutory
trust.
The
Trust
may
issue
an
unlimited
number
of
shares
(without
par
value).
Information
presented
in
these
financial
statements
pertains
to
the
following
series
of
the
Trust
(each,
a
Fund
and
collectively,
the
Funds):
Columbia
Short
Duration
High
Yield
ETF
and
Columbia
U.S.
High
Yield
ETF.
Each
Fund
is
non-
diversified.
On
August
28,
2024,
Columbia
Management
Investment
Advisers,
LLC
(the
Investment
Manager),
a
wholly-owned
subsidiary
of
Ameriprise
Financial,
Inc.
(Ameriprise
Financial),
invested
$1,000
of
cash
in
Columbia
Short
Duration
High
Yield
ETF,
which
represented
the
initial
capital
for
the
Fund
at
$20
per
share.
On
September
4,
2024,
Jane
Street
Capital
invested
$24,179,216
of
securities
(including
accrued
income)
and
$820,784
of
cash
in
the
Fund
at
$20
per
share.
Shares
of
the
Fund
were
first
offered
to
the
public
on
September
5,
2024.
On
August
28,
2024,
Columbia
Management
Investment
Advisers,
LLC
(the
Investment
Manager),
a
wholly-owned
subsidiary
of
Ameriprise
Financial,
Inc.
(Ameriprise
Financial),
invested
$1,000
of
cash
in
Columbia
U.S.
High
Yield
ETF,
which
represented
the
initial
capital
for
the
Fund
at
$20
per
share.
On
September
4,
2024,
Jane
Street
Capital
invested
$24,775,193
of
securities
(including
accrued
income)
and
$224,807
of
cash
in
the
Fund
at
$20
per
share.
Shares
of
the
Fund
were
first
offered
to
the
public
on
September
5,
2024.
These
financial
statements
cover
the
period
from
September
5,
2024
(commencement
of
operations)
through
September
30,
2024.
Fund
Shares
The
market
prices
of
each
Fund’s
shares
may
differ
to
some
degree
from
the
Fund’s
net
asset
value
(NAV).
Unlike
conventional
mutual
funds,
each
Fund
issues
and
redeems
shares
on
a
continuous
basis,
at
NAV,
only
in
a
large
specified
number
of
shares,
each
called
a
“Creation
Unit.”
A
Creation
Unit
consists
of
50,000
shares.
Creation
Units
are
issued
and
redeemed
generally
in-kind
for
a
basket
of
securities
and/or
for
cash.
Investors
such
as
market
makers,
large
investors
and
institutions
who
wish
to
deal
in
Creation
Units
directly
with
a
Fund
must
have
entered
into
an
authorized
participant
agreement
(Authorized
Participants)
with
the
Fund’s
principal
underwriter
and
the
transfer
agent,
or
purchase
through
a
dealer
that
has
entered
into
such
an
agreement.
Authorized
participants
may
purchase
or
redeem
Fund
shares
directly
from
the
Fund
only
in
Creation
Units.
The
Funds’
shares
are
also
listed
on
the
New
York
Stock
Exchange
for
which
investors
can
purchase
and
sell
shares
on
the
secondary
market
through
a
broker
at
market
prices
which
may
differ
from
the
NAV
of
the
Fund.
Note
2.
Summary
of
significant
accounting
policies
Basis
of
preparation
Each
Fund
is
an
investment
company
that
applies
the
accounting
and
reporting
guidance
in
the
Financial
Accounting
Standards
Board
(FASB)
Accounting
Standards
Codification
Topic
946,
Financial
Services
-
Investment
Companies
(ASC
946).
The
financial
statements
are
prepared
in
accordance
with
U.S.
generally
accepted
accounting
principles
(GAAP),
which
requires
management
to
make
certain
estimates
and
assumptions
that
affect
the
reported
amounts
of
assets
and
liabilities,
the
disclosure
of
contingent
assets
and
liabilities
at
the
date
of
the
financial
statements
and
the
reported
amounts
of
income
and
expenses
during
the
reporting
period.
Actual
results
could
differ
from
those
estimates.
The
following
is
a
summary
of
significant
accounting
policies
followed
by
the
Funds
in
the
preparation
of
their
financial
statements.
Security
valuation
Debt
securities
generally
are
valued
based
on
prices
obtained
from
pricing
services,
which
are
intended
to
reflect
market
transactions
for
normal,
institutional-size
trading
units
of
similar
securities.
The
services
may
use
various
pricing
techniques
that
take
into
account,
as
applicable,
factors
such
as
yield,
quality,
coupon
rate,
maturity,
type
of
issue,
NOTES
TO
FINANCIAL
STATEMENTS
(continued)
September
30,
2024
(Unaudited)
trading
characteristics
and
other
data,
as
well
as
approved
independent
broker-dealer
quotes.
Debt
securities
for
which
quotations
are
not
readily
available
or
not
believed
to
be
reflective
of
market
value
may
also
be
valued
based
upon
a
bid
quote
from
an
approved
independent
broker-dealer.
Debt
securities
maturing
in
60
days
or
less
are
valued
primarily
at
amortized
market
value,
unless
this
method
results
in
a
valuation
that
management
believes
does
not
approximate
fair
value.
Investments
in
open-end
investment
companies
(other
than
exchange-traded
funds
(ETFs)),
are
valued
at
the
latest
net
asset
value
reported
by
those
companies
as
of
the
valuation
time.
Investments
for
which
market
quotations
are
not
readily
available,
or
that
have
quotations
which
management
believes
are
not
reflective
of
market
value
or
reliable,
are
valued
at
fair
value
as
determined
in
good
faith
under
procedures
approved
by
the
Board
of
Trustees.
If
a
security
or
class
of
securities
(such
as
foreign
securities)
is
valued
at
fair
value,
such
value
is
likely
to
be
different
from
the
quoted
or
published
price
for
the
security,
if
available.
The
determination
of
fair
value
often
requires
significant
judgment.
To
determine
fair
value,
management
may
use
assumptions
including
but
not
limited
to
future
cash
flows
and
estimated
risk
premiums.
Multiple
inputs
from
various
sources
may
be
used
to
determine
fair
value.
GAAP
requires
disclosure
regarding
the
inputs
and
valuation
techniques
used
to
measure
fair
value
and
any
changes
in
valuation
inputs
or
techniques.
In
addition,
investments
shall
be
disclosed
by
major
category.
This
information
is
disclosed
following
the
Funds’
Portfolio
of
Investments.
Security
transactions
Security
transactions
are
accounted
for
on
the
trade
date.
Cost
is
determined
and
gains
(losses)
are
based
upon
the
specific
identification
method
for
both
financial
statement
and
federal
income
tax
purposes.
Income
recognition
Interest
income
is
recorded
on
an
accrual
basis.
Market
premiums
and
discounts,
including
original
issue
discounts,
are
amortized
and
accreted,
respectively,
over
the
expected
life
of
the
security
on
all
debt
securities,
unless
otherwise
noted.
The
Funds
may
place
a
debt
security
on
non-accrual
status
and
reduce
related
interest
income
when
it
becomes
probable
that
the
interest
will
not
be
collected
and
the
amount
of
uncollectible
interest
can
be
reasonably
estimated.
The
Funds
may
also
adjust
accrual
rates
when
it
becomes
probable
the
full
interest
will
not
be
collected
and
a
partial
payment
will
be
received.
A
defaulted
debt
security
is
removed
from
non-accrual
status
when
the
issuer
resumes
interest
payments
or
when
collectability
of
interest
is
reasonably
assured.
Dividend
income
is
recorded
on
the
ex-dividend
date.
The
value
of
additional
securities
received
as
an
income
payment
through
a
payment-in-kind,
if
any,
is
recorded
as
interest
income
and
increases
the
cost
basis
of
such
securities.
Expenses
General
expenses
of
the
Trust
are
allocated
to
the
Funds
based
upon
relative
net
assets
or
other
expense
allocation
methodologies
determined
by
the
nature
of
the
expense.
Expenses
directly
attributable
to
a
Fund
are
charged
to
that
Fund.
Determination
of
net
asset
value
The
net
asset
value
per
share
of
each
Fund
is
computed
by
dividing
the
value
of
the
net
assets
of
a
Fund
by
the
total
number
of
outstanding
shares
of
the
Fund,
rounded
to
the
nearest
cent,
at
the
close
of
regular
trading
(ordinarily
4:00
p.m.
Eastern
Time)
every
day
the
New
York
Stock
Exchange
is
open.
NOTES
TO
FINANCIAL
STATEMENTS
(continued)
September
30,
2024
(Unaudited)
Federal
income
tax
status
For
federal
income
tax
purposes,
each
Fund
is
treated
as
a
separate
entity.
The
Funds
intend
to
qualify
each
year
as
separate
regulated
investment
companies
under
Subchapter
M
of
the
Internal
Revenue
Code,
as
amended,
and
will
distribute
substantially
all
of
their
investment
company
taxable
income
and
net
capital
gain,
if
any,
for
their
tax
year,
and
as
such
will
not
be
subject
to
federal
income
taxes.
In
addition,
the
Funds
intend
to
distribute
in
each
calendar
year
substantially
all
of
their
ordinary
income,
capital
gain
net
income
and
certain
other
amounts,
if
any,
such
that
the
Funds
should
not
be
subject
to
federal
excise
tax.
Therefore,
no
federal
income
or
excise
tax
provisions
are
recorded.
Distributions
to
shareholders
Distributions
from
net
investment
income,
if
any,
are
declared
and
paid
monthly.
Net
realized
capital
gains,
if
any,
are
distributed
at
least
annually.
Income
distributions
and
capital
gain
distributions
are
determined
in
accordance
with
federal
income
tax
regulations,
which
may
differ
from
GAAP.
Guarantees
and
indemnifications
Under
the
Trust’s
organizational
documents
and,
in
some
cases,
by
contract,
its
officers
and
trustees
are
indemnified
against
certain
liabilities
arising
out
of
the
performance
of
their
duties
to
the
Trust
or
its
funds.
In
addition,
certain
of
the
Funds’
contracts
with
their
service
providers
contain
general
indemnification
clauses.
The
Funds’
maximum
exposure
under
these
arrangements
is
unknown
since
the
amount
of
any
future
claims
that
may
be
made
against
the
Funds
cannot
be
determined,
and
the
Funds
have
no
historical
basis
for
predicting
the
likelihood
of
any
such
claims.
Note
3.
Investment
management
fees
Under
an
Investment
Management
Services
Agreement,
Columbia
Management
Investment
Advisers,
LLC
(the
Investment
Manager),
a
wholly-owned
subsidiary
of
Ameriprise
Financial,
Inc.,
determines
which
securities
will
be
purchased,
held
or
sold.
The
investment
management
fee
is
a
unitary
fee
paid
monthly
to
the
Investment
Manager
at
an
annual
rate
based
on
each
Fund’s
average
daily
net
assets.
In
return
for
this
fee,
the
Investment
Manager
pays
the
operating
costs
and
expenses
of
each
Fund
other
than
the
following
expenses
(which
will
be
paid
by
the
Fund):
taxes;
interest
incurred
on
borrowing
by
the
Fund,
if
any,
brokerage
fees
and
commissions;
interest
and
fee
expense
related
to
the
Fund’s
participation
in
inverse
floater
structures
and
any
other
portfolio
transaction
expenses;
infrequent
and/or
unusual
expenses,
including
without
limitation
litigation
expenses;
distribution
and/or
service
fees;
expenses
incurred
in
connection
with
lending
securities;
and
any
other
expenses
approved
by
the
Board
of
Trustees.
The
investment
management
fee
is
an
annual
fee
that
is
equal
to
a
percentage
of
each
Fund’s
average
daily
net
assets
as
follows:
Compensation
of
Board
members
Members
of
the
Board
of
Trustees
who
are
not
officers
or
employees
of
the
Investment
Manager
or
Ameriprise
Financial
are
compensated
for
their
services
to
the
Funds.
Under
a
Deferred
Compensation
Plan
(the
Deferred
Plan),
these
members
of
the
Board
of
Trustees
may
elect
to
defer
payment
of
up
to
100%
of
their
compensation.
Deferred
amounts
are
treated
as
though
equivalent
dollar
amounts
had
been
invested
in
shares
of
certain
funds
managed
by
the
Investment
Manager.
Each
Fund’s
deferred
amount
is
adjusted
for
market
value
changes
and
it
is
distributed
in
accordance
with
the
Deferred
Plan
by
the
Investment
Manager.
The
expenses
of
the
compensation
of
the
members
of
the
Board
of
Trustees
that
are
allocated
to
the
Funds
are
payable
by
the
Investment
Manager.
Fund
Effective
investment
management
fee
rate
(%)
Columbia
Short
Duration
High
Yield
ETF
0.44
Columbia
U.S.
High
Yield
ETF
0.46
NOTES
TO
FINANCIAL
STATEMENTS
(continued)
September
30,
2024
(Unaudited)
Compensation
of
Chief
Compliance
Officer
The
Board
of
Trustees
has
appointed
a
Chief
Compliance
Officer
for
the
Funds
in
accordance
with
federal
securities
regulations.
A
portion
of
the
Chief
Compliance
Officer’s
total
compensation
is
allocated
to
the
Funds,
along
with
other
allocations
to
affiliated
registered
investment
companies
managed
by
the
Investment
Manager
and
its
affiliates,
based
on
relative
net
assets.
The
expenses
of
the
Chief
Compliance
Officer
allocated
to
the
Funds
are
payable
by
the
Investment
Manager.
Distribution
and
service
fees
ALPS
Distributors,
Inc.,
(the
Distributor)
serves
as
the
distributor
for
the
Funds.
The
Funds
have
adopted
a
distribution
and
service
plan
(the
Distribution
Plan).
Under
the
Distribution
Plan,
the
Funds
are
authorized
to
pay
distribution
and
service
fees
to
the
Distributor
and
other
firms
that
provide
distribution
and
shareholder
services
at
the
maximum
annual
rate
of
0.25%
of
average
daily
net
assets
of
each
Fund.
No
distribution
or
service
fees
are
currently
paid
by
the
Funds
or
have
been
approved
for
payment
by
the
Board
of
Trustees.
There
are
no
current
plans
to
impose
these
fees.
Note
4.
Federal
tax
information
The
timing
and
character
of
income
and
capital
gain
distributions
are
determined
in
accordance
with
income
tax
regulations,
which
may
differ
from
GAAP
because
of
temporary
or
permanent
book
to
tax
differences.
At
September
30,
2024,
the
approximate
cost
of
all
investments
for
federal
income
tax
purposes
and
the
aggregate
gross
approximate
unrealized
appreciation
and
depreciation
based
on
that
cost
was:
Tax
cost
of
investments
and
unrealized
appreciation/(depreciation)
may
also
include
timing
differences
that
do
not
constitute
adjustments
to
tax
basis.
Management
of
the
Funds
has
concluded
that
there
are
no
significant
uncertain
tax
positions
in
the
Funds
that
would
require
recognition
in
the
financial
statements.
However,
management’s
conclusion
may
be
subject
to
review
and
adjustment
at
a
later
date
based
on
factors
including,
but
not
limited
to,
new
tax
laws,
regulations,
and
administrative
interpretations
(including
relevant
court
decisions).
Generally,
the
Funds’
federal
tax
returns
for
the
prior
three
fiscal
years
remain
subject
to
examination
by
the
Internal
Revenue
Service.
Note
5.
Portfolio
information
The
cost
of
purchases
and
proceeds
from
sales
of
securities,
excluding
short-term
investments
and
in-kind
transactions,
for
the
six
months
ended
September
30,
2024,
were
as
follows:
The
amount
of
purchase
and
sale
activity
impacts
the
portfolio
turnover
rate
reported
in
the
Financial
Highlights.
Note
6.
In-kind
transactions
The
Funds
may
accept
in-kind
contributions
and
redemptions.
In-kind
contributions
are
accounted
for
at
the
fair
market
value
of
the
in-kind
securities
contributed
on
the
date
of
contribution.
For
the
six
months
ended
September
30,
2024,
the
cost
basis
of
securities
contributed
was
as
follows:
Fund
Tax
cost
($)
Gross
unrealized
appreciation
($)
Gross
unrealized
depreciation
($)
Net
unrealized
appreciation
(depreciation)
($)
Columbia
Short
Duration
High
Yield
ETF
25,801,800
142,841
(13,946)
128,895
Columbia
U.S.
High
Yield
ETF
25,808,956
207,521
(34,105)
173,416
Fund
Purchases
($)
Proceeds
from
sales
($)
Columbia
Short
Duration
High
Yield
ETF
401,537
-
Columbia
U.S.
High
Yield
ETF
104,405
85,910
NOTES
TO
FINANCIAL
STATEMENTS
(continued)
September
30,
2024
(Unaudited)
Proceeds
from
the
sales
of
securities
include
the
value
of
securities
delivered
through
an
in-kind
redemption
of
certain
Fund
shares.
Net
realized
gains
on
these
securities
are
not
taxable
to
remaining
shareholders
in
the
Funds.
For
the
six
months
ended
September
30,
2024,
the
Funds
did
not
have
in-kind
redemptions.
Note
7.
Significant
risks
Active
management
risk
Each
Fund
is
actively
managed
and
its
performance
therefore
will
reflect,
in
part,
the
ability
of
the
portfolio
managers
to
make
investment
decisions
that
seek
to
achieve
the
Fund’s
investment
objective.
Each
Fund
is
not
an
index
fund
(it
does
not
seek
to
track
the
performance
of
an
index),
nor
does
each
Fund
provide
daily
transparency
into
its
portfolio
holdings
like
most
other
ETFs.
Due
to
its
active
management,
each
Fund
could
underperform
its
benchmark
index
and/or
other
funds
with
similar
investment
objectives
and/or
strategies.
Active
trading
of
portfolio
and
Tracking
Basket
securities
may
result
in
added
expenses,
a
lower
return
and
increased
tax
liability,
including
relative
to
other
ETFs.
Credit
risk
Credit
risk
is
the
risk
that
the
value
of
debt
instruments
in
a
Fund’s
portfolio
may
decline
because
the
issuer
defaults
or
otherwise
becomes
unable
or
unwilling,
or
is
perceived
to
be
unable
or
unwilling,
to
honor
its
financial
obligations,
such
as
making
payments
to
the
Fund
when
due.
Credit
rating
agencies
assign
credit
ratings
to
certain
debt
instruments
to
indicate
their
credit
risk.
Lower-rated
or
unrated
debt
instruments
held
by
the
Funds
may
present
increased
credit
risk
as
compared
to
higher-rated
debt
instruments.
High-yield
investments
risk
Securities
and
other
debt
instruments
held
by
the
Funds
that
are
rated
below
investment
grade
(commonly
called
"high-
yield"
or
"junk"
bonds)
and
unrated
debt
instruments
of
comparable
quality
expose
the
Funds
to
a
greater
risk
of
loss
of
principal
and
income
than
a
fund
that
invests
solely
or
primarily
in
investment
grade
debt
instruments.
In
addition,
these
investments
have
greater
price
fluctuations,
are
less
liquid
and
are
more
likely
to
experience
a
default
than
higher-
rated
debt
instruments.
High-yield
debt
instruments
are
considered
to
be
predominantly
speculative
with
respect
to
the
issuer's
capacity
to
pay
interest
and
repay
principal.
Interest
rate
risk
Interest
rate
risk
is
the
risk
of
losses
attributable
to
changes
in
interest
rates.
In
general,
if
interest
rates
rise,
the
values
of
debt
instruments
tend
to
fall,
and
if
interest
rates
fall,
the
values
of
debt
instruments
tend
to
rise.
Changes
in
interest
rates
may
also
affect
the
liquidity
of
a
Fund’s
investments
in
debt
instruments.
In
general,
the
longer
the
maturity
or
duration
of
a
debt
instrument,
the
greater
its
sensitivity
to
changes
in
interest
rates.
Interest
rate
declines
also
may
increase
prepayments
of
debt
obligations,
which,
in
turn,
would
increase
prepayment
risk.
Similarly,
a
period
of
rising
interest
rates
may
negatively
impact
each
Fund’s
performance.
Actions
by
governments
and
central
banking
authorities
can
result
in
increases
or
decreases
in
interest
rates.
Higher
periods
of
inflation
could
lead
such
authorities
to
raise
interest
rates.
Increasing
interest
rates
may
negatively
affect
the
value
of
debt
securities
held
by
the
Funds,
resulting
in
a
negative
impact
on
the
Fund’s
performance
and
net
asset
value
per
share.
In
general,
the
longer
the
maturity
or
duration
of
a
debt
security,
the
greater
its
sensitivity
to
changes
in
interest
rates.
The
Funds
are
subject
to
the
risk
that
the
income
generated
by
its
investments
may
not
keep
pace
with
inflation.
Liquidity
risk
Liquidity
risk
is
the
risk
associated
with
a
lack
of
marketability
of
investments
which
may
make
it
difficult
to
sell
the
investment
at
a
desirable
time
or
price.
Changing
regulatory,
market
or
other
conditions
or
environments
(for
example,
the
interest
rate
or
credit
environments)
may
adversely
affect
the
liquidity
of
a
Fund's
investments.
The
Funds
may
have
to
accept
a
lower
selling
price
for
the
holding,
sell
other
investments,
or
forego
another,
more
appealing
investment
opportunity.
Generally,
the
less
liquid
the
market
at
the
time
a
Fund
sells
a
portfolio
investment,
the
greater
the
risk
of
loss
or
decline
of
value
to
the
Fund.
A
less
liquid
market
can
lead
to
an
increase
in
Fund
redemptions,
which
may
Funds
Contributions
($)
Columbia
Short
Duration
High
Yield
ETF
24,811,623
Columbia
U.S.
High
Yield
ETF
25,372,510
NOTES
TO
FINANCIAL
STATEMENTS
(continued)
September
30,
2024
(Unaudited)
negatively
impact
Fund
performance
and
net
asset
value
per
share,
including,
for
example,
if
a
Fund
is
forced
to
sell
securities
in
a
down
market.
Market
risk
The
Funds
may
incur
losses
due
to
declines
in
the
value
of
one
or
more
securities
in
which
they
invest.
These
declines
may
be
due
to
factors
affecting
a
particular
issuer,
or
the
result
of,
among
other
things,
political,
regulatory,
market,
economic
or
social
developments
affecting
the
relevant
market(s)
more
generally.
In
addition,
turbulence
in
financial
markets
and
reduced
liquidity
in
equity,
credit
and/or
fixed
income
markets
may
negatively
affect
many
issuers,
which
could
adversely
affect
the
Funds’
ability
to
price
or
value
hard-to-value
assets
in
thinly
traded
and
closed
markets
and
could
cause
significant
redemptions
and
operational
challenges.
Global
economies
and
financial
markets
are
increasingly
interconnected,
and
conditions
and
events
in
one
country,
region
or
financial
market
may
adversely
impact
issuers
in
a
different
country,
region
or
financial
market.
These
risks
may
be
magnified
if
certain
events
or
developments
adversely
interrupt
the
global
supply
chain;
in
these
and
other
circumstances,
such
risks
might
affect
companies
worldwide.
As
a
result,
local,
regional
or
global
events
such
as
terrorism,
war,
other
conflicts,
natural
disasters,
disease/virus
outbreaks
and
epidemics
or
other
public
health
issues,
recessions,
depressions
or
other
events
–
or
the
potential
for
such
events
–
could
have
a
significant
negative
impact
on
global
economic
and
market
conditions
and
could
result
in
increased
premiums
or
discounts
to
the
Funds’
net
asset
value.
Non-diversification
risk
A
non-diversified
fund
is
permitted
to
invest
a
greater
percentage
of
its
total
assets
in
fewer
issuers
than
a
diversified
fund.
This
increases
the
risk
that
a
change
in
the
value
of
any
one
investment
held
by
the
Funds
could
affect
the
overall
value
of
the
Funds
more
than
it
would
affect
that
of
a
diversified
fund
holding
a
greater
number
of
investments.
Accordingly,
the
Fund's
value
will
likely
be
more
volatile
than
the
value
of
a
more
diversified
fund.
Note
8.
Subsequent
events
Management
has
evaluated
the
events
and
transactions
that
have
occurred
through
the
date
the
financial
statements
were
issued
and
noted
no
items
requiring
adjustment
of
the
financial
statements
or
additional
disclosure.
Note
9.
Information
regarding
pending
and
settled
legal
proceedings
Ameriprise
Financial
and
certain
of
its
affiliates
are
involved
in
the
normal
course
of
business
in
legal
proceedings
which
include
regulatory
inquiries,
arbitration
and
litigation,
including
class
actions
concerning
matters
arising
in
connection
with
the
conduct
of
their
activities
as
part
of
a
diversified
financial
services
firm.
Ameriprise
Financial
believes
that
the
Funds
are
not
currently
the
subject
of,
and
that
neither
Ameriprise
Financial
nor
any
of
its
affiliates
are
the
subject
of,
any
pending
legal,
arbitration
or
regulatory
proceedings
that
are
likely
to
have
a
material
adverse
effect
on
the
Funds
or
the
ability
of
Ameriprise
Financial
or
its
affiliates
to
perform
under
their
contracts
with
the
Funds.
Ameriprise
Financial
is
required
to
make
quarterly
(10-Q),
annual
(10-K)
and,
as
necessary,
8-K
filings
with
the
Securities
and
Exchange
Commission
(SEC)
on
legal
and
regulatory
matters
that
relate
to
Ameriprise
Financial
and
its
affiliates.
Copies
of
these
filings
may
be
obtained
by
accessing
the
SEC
website
at
www.sec.gov.
There
can
be
no
assurance
that
these
matters,
or
the
adverse
publicity
associated
with
them,
will
not
result
in
increased
Fund
redemptions,
reduced
sale
of
Fund
shares
or
other
adverse
consequences
to
the
Funds.
Further,
although
we
believe
proceedings
are
not
likely
to
have
a
material
adverse
effect
on
the
Funds
or
the
ability
of
Ameriprise
Financial
or
its
affiliates
to
perform
under
their
contracts
with
the
Funds,
these
proceedings
are
subject
to
uncertainties
and,
as
such,
we
are
unable
to
estimate
the
possible
loss
or
range
of
loss
that
may
result.
An
adverse
outcome
in
one
or
more
of
these
proceedings
could
result
in
adverse
judgments,
settlements,
fines,
penalties
or
other
relief
that
could
have
a
material
adverse
effect
on
the
consolidated
financial
condition
or
results
of
operations
of
Ameriprise
Financial
or
one
or
more
of
its
affiliates
that
provide
services
to
the
Funds.
APPROVAL
OF
INVESTMENT
MANAGEMENT
SERVICES
AGREEMENT
(Unaudited)
Columbia
Management
Investment
Advisers,
LLC
(the
Investment
Manager,
and
together
with
its
domestic
and
global
affiliates,
Columbia
Threadneedle
Investments),
a
wholly-owned
subsidiary
of
Ameriprise
Financial,
Inc.
(Ameriprise
Financial),
serves
as
the
investment
manager
to
Columbia
Short
Duration
High
Yield
ETF
(the
Fund).
Under
an
investment
management
services
agreement
(the
IMS
Agreement),
the
Investment
Manager
provides
investment
advice
and
other
services
to
the
Fund
and
other
funds
in
the
Columbia
Fund
family
(collectively,
the
Columbia
Funds).
At
their
meeting
on
June
27,
2024,
the
Board
of
Trustees
(the
Board)
and
the
independent
Board
members
(the
Independent
Trustees)
of
Columbia
ETF
Trust
I
(the
Trust)
unanimously
approved,
for
an
initial
two-year
term,
the
IMS
Agreement
with
the
Investment
Manager
with
respect
to
the
Fund,
a
series
of
the
Trust.
As
detailed
below,
the
Board
and
the
Board’s
Investment
Review
Committee
met
to
review
and
discuss,
both
among
themselves
and
with
the
management
team
of
the
Investment
Manager,
materials
provided
by
the
Investment
Manager
before
determining
to
approve
the
IMS
Agreement.
In
connection
with
their
deliberations
regarding
the
proposed
IMS
Agreement,
the
Committee
and
the
Board
evaluated
materials
requested
from
the
Investment
Manager
regarding
the
Fund
and
the
IMS
Agreement,
and
discussed
these
materials
with
representatives
of
the
Investment
Manager
at
the
Committee
and
Board
meetings
held
in
April
and
June
2024.
The
Independent
Trustees
also
considered
the
discussion
relating
to
the
renewal
of
advisory
agreements
for
other
series
of
the
Trust
at
the
June
2024
Investment
Review
Committee,
Contracts
Committee
and
Board
meetings.
The
Committee
and
the
Board
also
consulted
with
the
Independent
Trustees’
independent
legal
counsel,
who
advised
on
various
matters
with
respect
to
the
Committee’s
and
the
Board’s
considerations
and
otherwise
assisted
the
Committee
and
the
Board
in
their
deliberations.
The
Board
considered
its
discussion
relating
to
the
renewal
of
advisory
agreements
with
respect
to
other
series
of
the
Trust
and,
in
that
connection,
the
discussion
by
independent
legal
counsel
of
the
factors
that
should
be
considered
in
determining
whether
to
approve
or
renew
an
investment
management
agreement.
The
Independent
Trustees
considered
such
information
as
they,
their
legal
counsel
or
the
Investment
Manager
believed
reasonably
necessary
to
evaluate
and
to
approve
the
IMS
Agreement.
Among
other
things,
the
information
and
factors
considered
included
the
following:
Information
on
the
Fund’s
proposed
management
fees
and
anticipated
total
expenses;
Terms
of
the
IMS
Agreement;
Descriptions
of
various
services
performed
by
the
Investment
Manager
under
the
IMS
Agreement,
including
portfolio
management
and
portfolio
trading
practices;
Information
regarding
the
resources
of
the
Investment
Manager,
including
information
regarding
senior
management,
portfolio
managers
and
other
personnel;
and
Information
regarding
the
capabilities
of
the
Investment
Manager
with
respect
to
compliance
monitoring
services.
Following
an
analysis
and
discussion
of
the
foregoing,
and
the
factors
identified
below,
the
Board,
including
all
of
the
Independent
Trustees,
approved
the
IMS
Agreement.
Nature,
extent
and
quality
of
services
provided
by
the
Investment
Manager
The
Board
analyzed
various
reports
and
presentations
it
had
received
detailing
the
services
performed
by
the
Investment
Manager,
as
well
as
its
history,
expertise,
resources
and
relative
capabilities,
and
the
qualifications
of
its
personnel.
The
Board
specifically
considered
the
many
developments
during
recent
years
concerning
the
services
provided
by
the
Investment
Manager
to
the
Columbia
Funds.
Among
other
things,
the
Board
noted
the
organization
and
depth
of
the
equity
and
credit
research
departments.
The
Board
further
observed
the
enhancements
to
the
investment
risk
management
department’s
processes,
systems
and
oversight,
over
the
past
several
years.
The
Board
also
took
into
account
the
broad
scope
of
services
provided
by
the
Investment
Manager
to
the
Fund,
including,
among
other
services,
APPROVAL
OF
INVESTMENT
MANAGEMENT
SERVICES
AGREEMENT
(continued)
(Unaudited)
investment,
risk
and
compliance
oversight.
The
Board
also
took
into
account
the
information
it
received
concerning
the
Investment
Manager's
ability
to
attract
and
retain
key
portfolio
management
personnel
and
that
it
has
sufficient
resources
to
provide
competitive
and
adequate
compensation
to
investment
personnel.
The
Board
also
considered
the
oversight
of
the
administrative
and
transfer
agency
services
to
be
provided
by
The
Bank
of
New
York
Mellon
(BNYM).
The
Board
observed
that
the
Investment
Manager
currently
oversees
the
relationship
with
BNYM,
as
BNYM
also
provides
administrative
and
transfer
agency
services
to
certain
existing
Funds
under
substantially
identical
agreements.
In
evaluating
the
quality
of
services
to
be
provided
under
the
IMS
Agreement,
the
Board
also
took
into
account
the
organization
and
strength
of
the
Fund’s
and
its
service
providers’
compliance
programs.
The
Board
also
reviewed
the
financial
condition
of
the
Investment
Manager
and
its
affiliates
and
each
entity’s
ability
to
carry
out
its
responsibilities
under
the
IMS
Agreement
and
the
Fund’s
other
service
agreements.
In
addition,
the
Board
discussed
the
acceptability
of
the
terms
of
the
IMS
Agreement,
including
the
relatively
broad
scope
of
services
required
to
be
performed,
as
well
as
each
of
the
other
proposed
agreements
and
plans
for
the
Fund.
The
Board
observed
that
the
proposed
agreements
and
plans
were
substantively
identical
to
the
form
of
existing
agreements
and
plans
with
respect
to
other
series
of
the
Trust
discussed
at
its
June
meeting.
The
Board
also
noted
the
wide
array
of
legal
and
compliance
services
provided
by
the
Investment
Manager
to
such
series.
After
reviewing
these
and
related
factors
(including
investment
performance
as
discussed
below),
the
Board
concluded,
within
the
context
of
their
overall
conclusions,
that
the
nature,
extent
and
quality
of
the
services
to
be
provided
to
the
Fund
under
the
IMS
Agreement
supported
the
approval
of
the
IMS
Agreement.
Investment
performance
Because
the
Fund
had
not
yet
commenced
operations,
the
Board
did
not
have
investment
performance
to
compare
to
the
returns
of
a
group
of
comparable
funds.
The
Board
noted
their
review
of
performance
records
of
other
existing
funds
that
are
managed
by
members
of
the
Fund’s
portfolio
management
team,
though
noting
that
none
of
the
existing
funds
had
a
substantively
similar
investment
strategy
to
that
proposed
for
the
Fund.
The
Board
also
considered
the
Investment
Manager’s
performance
and
reputation
generally,
the
Investment
Manager’s
historical
responsiveness
to
Board
concerns
about
performance,
and
the
Investment
Manager’s
willingness
to
take
steps
intended
to
improve
performance.
After
reviewing
these
and
related
factors,
the
Board
concluded,
within
the
context
of
their
overall
conclusions,
that
the
performance
of
the
Investment
Manager,
in
light
of
other
considerations,
supported
the
approval
of
the
IMS
Agreement.
Comparative
fees,
costs
of
services
provided
and
the
profits
realized
by
the
Investment
Manager
and
its
affiliates
from
their
relationships
with
the
Fund
The
Board
reviewed
comparative
fees
and
the
costs
of
services
to
be
provided
under
the
IMS
Agreement.
The
Board
considered
the
proposed
unitary
fee
structure
to
be
utilized
by
the
Fund,
observing
that
many
of
the
competitors
of
the
Fund
have
adopted
similar
unitary
fee
structures.
The
Board
accorded
particular
weight
to
the
notion
that
a
primary
objective
of
the
proposed
level
of
fees
is
to
achieve
a
rational
pricing
model
applied
consistently
across
the
various
product
lines
in
the
Fund
family,
while
assuring
that
the
overall
fees
for
each
Columbia
Fund
(with
certain
exceptions)
are
generally
in
line
with
the
current
"pricing
philosophy"
such
that
Fund
total
expense
ratios,
in
general,
approximate
or
are
lower
than
the
median
expense
ratios
of
funds
in
the
same
Lipper
comparison
universe.
The
Board
considered
that
the
proposed
unitary
management
fee
was
below
the
median
net
expense
ratio
of
peer
funds.
After
reviewing
these
and
related
factors,
the
Board
concluded,
within
the
context
of
their
overall
conclusions,
that
the
proposed
levels
of
management
fees
and
expenses
of
the
Fund,
in
light
of
other
considerations,
supported
the
approval
of
the
IMS
Agreement.
The
Board
took
into
account
the
indirect
economic
benefits
flowing
to
the
Investment
Manager
or
its
affiliates
in
connection
with
managing
the
Columbia
Funds,
such
as
the
enhanced
ability
to
offer
various
other
financial
products
to
Ameriprise
Financial
customers
and
overall
reputational
advantages.
They
noted
that
the
fees
to
be
paid
by
the
Fund
APPROVAL
OF
INVESTMENT
MANAGEMENT
SERVICES
AGREEMENT
(continued)
(Unaudited)
should
permit
the
Investment
Manager
to
offer
competitive
compensation
to
its
personnel,
make
necessary
investments
in
its
business
and
earn
an
appropriate
profit.
After
reviewing
these
and
related
factors,
the
Board
concluded,
within
the
context
of
their
overall
conclusions,
that
the
costs
of
services
to
be
provided
supported
the
approval
of
the
IMS
Agreement.
Economies
of
scale
The
Board
considered
that
the
proposed
IMS
Agreement
provides
for
a
unitary
fee
level
that
does
not
include
pre-
established
breakpoints,
and
management’s
observation
that
ETF
fee
structures
often
do
not
include
breakpoints
due
to
the
more
volatile
nature
of
their
inflows/outflows.
Conclusion
The
Board
reviewed
all
of
the
above
considerations
in
reaching
its
decision
to
approve
the
IMS
Agreement.
In
reaching
its
conclusions,
no
single
factor
was
determinative.
On
June
27,
2024,
the
Board,
including
all
of
the
Independent
Trustees,
determined
that
fees
payable
under
the
IMS
Agreement
were
fair
and
reasonable
in
light
of
the
extent
and
quality
of
services
provided
and
approved
the
IMS
Agreement.
APPROVAL
OF
INVESTMENT
MANAGEMENT
SERVICES
AGREEMENT
(continued)
(Unaudited)
Columbia
Management
Investment
Advisers,
LLC
(the
Investment
Manager,
and
together
with
its
domestic
and
global
affiliates,
Columbia
Threadneedle
Investments),
a
wholly-owned
subsidiary
of
Ameriprise
Financial,
Inc.
(Ameriprise
Financial),
serves
as
the
investment
manager
to
Columbia
U.S.
High
Yield
ETF
(the
Fund).
Under
an
investment
management
services
agreement
(the
IMS
Agreement),
the
Investment
Manager
provides
investment
advice
and
other
services
to
the
Fund
and
other
funds
in
the
Columbia
Fund
family
(collectively,
the
Columbia
Funds).
At
their
meeting
on
June
27,
2024,
the
Board
of
Trustees
(the
Board)
and
the
independent
Board
members
(the
Independent
Trustees)
of
Columbia
ETF
Trust
I
(the
Trust)
unanimously
approved,
for
an
initial
two-year
term,
the
IMS
Agreement
with
the
Investment
Manager
with
respect
to
the
Fund,
a
series
of
the
Trust.
As
detailed
below,
the
Board
and
the
Board’s
Investment
Review
Committee
met
to
review
and
discuss,
both
among
themselves
and
with
the
management
team
of
the
Investment
Manager,
materials
provided
by
the
Investment
Manager
before
determining
to
approve
the
IMS
Agreement.
In
connection
with
their
deliberations
regarding
the
proposed
IMS
Agreement,
the
Committee
and
the
Board
evaluated
materials
requested
from
the
Investment
Manager
regarding
the
Fund
and
the
IMS
Agreement,
and
discussed
these
materials
with
representatives
of
the
Investment
Manager
at
the
Committee
and
Board
meetings
held
in
April
and
June
2024.
The
Independent
Trustees
also
considered
the
discussion
relating
to
the
renewal
of
advisory
agreements
for
other
series
of
the
Trust
at
the
June
2024
Investment
Review
Committee,
Contracts
Committee
and
Board
meetings.
The
Committee
and
the
Board
also
consulted
with
the
Independent
Trustees’
independent
legal
counsel,
who
advised
on
various
matters
with
respect
to
the
Committee’s
and
the
Board’s
considerations
and
otherwise
assisted
the
Committee
and
the
Board
in
their
deliberations.
The
Board
considered
its
discussion
relating
to
the
renewal
of
advisory
agreements
with
respect
to
other
series
of
the
Trust
and,
in
that
connection,
the
discussion
by
independent
legal
counsel
of
the
factors
that
should
be
considered
in
determining
whether
to
approve
or
renew
an
investment
management
agreement.
The
Independent
Trustees
considered
such
information
as
they,
their
legal
counsel
or
the
Investment
Manager
believed
reasonably
necessary
to
evaluate
and
to
approve
the
IMS
Agreement.
Among
other
things,
the
information
and
factors
considered
included
the
following:
Information
on
the
Fund’s
proposed
management
fees
and
anticipated
total
expenses;
Terms
of
the
IMS
Agreement;
Descriptions
of
various
services
performed
by
the
Investment
Manager
under
the
IMS
Agreement,
including
portfolio
management
and
portfolio
trading
practices;
Information
regarding
the
resources
of
the
Investment
Manager,
including
information
regarding
senior
management,
portfolio
managers
and
other
personnel;
and
Information
regarding
the
capabilities
of
the
Investment
Manager
with
respect
to
compliance
monitoring
services.
Following
an
analysis
and
discussion
of
the
foregoing,
and
the
factors
identified
below,
the
Board,
including
all
of
the
Independent
Trustees,
approved
the
IMS
Agreement.
Nature,
extent
and
quality
of
services
provided
by
the
Investment
Manager
The
Board
analyzed
various
reports
and
presentations
it
had
received
detailing
the
services
performed
by
the
Investment
Manager,
as
well
as
its
history,
expertise,
resources
and
relative
capabilities,
and
the
qualifications
of
its
personnel.
The
Board
specifically
considered
the
many
developments
during
recent
years
concerning
the
services
provided
by
the
Investment
Manager
to
the
Columbia
Funds.
Among
other
things,
the
Board
noted
the
organization
and
depth
of
the
equity
and
credit
research
departments.
The
Board
further
observed
the
enhancements
to
the
investment
risk
management
department’s
processes,
systems
and
oversight,
over
the
past
several
years.
The
Board
also
took
into
account
the
broad
scope
of
services
provided
by
the
Investment
Manager
to
the
Fund,
including,
among
other
services,
APPROVAL
OF
INVESTMENT
MANAGEMENT
SERVICES
AGREEMENT
(continued)
(Unaudited)
investment,
risk
and
compliance
oversight.
The
Board
also
took
into
account
the
information
it
received
concerning
the
Investment
Manager's
ability
to
attract
and
retain
key
portfolio
management
personnel
and
that
it
has
sufficient
resources
to
provide
competitive
and
adequate
compensation
to
investment
personnel.
The
Board
also
considered
the
oversight
of
the
administrative
and
transfer
agency
services
to
be
provided
by
The
Bank
of
New
York
Mellon
(BNYM).
The
Board
observed
that
the
Investment
Manager
currently
oversees
the
relationship
with
BNYM,
as
BNYM
also
provides
administrative
and
transfer
agency
services
to
certain
existing
Funds
under
substantially
identical
agreements.
In
evaluating
the
quality
of
services
to
be
provided
under
the
IMS
Agreement,
the
Board
also
took
into
account
the
organization
and
strength
of
the
Fund’s
and
its
service
providers’
compliance
programs.
The
Board
also
reviewed
the
financial
condition
of
the
Investment
Manager
and
its
affiliates
and
each
entity’s
ability
to
carry
out
its
responsibilities
under
the
IMS
Agreement
and
the
Fund’s
other
service
agreements.
In
addition,
the
Board
discussed
the
acceptability
of
the
terms
of
the
IMS
Agreement,
including
the
relatively
broad
scope
of
services
required
to
be
performed,
as
well
as
each
of
the
other
proposed
agreements
and
plans
for
the
Fund.
The
Board
observed
that
the
proposed
agreements
and
plans
were
substantively
identical
to
the
form
of
existing
agreements
and
plans
with
respect
to
other
series
of
the
Trust
discussed
at
its
June
meeting.
The
Board
also
noted
the
wide
array
of
legal
and
compliance
services
provided
by
the
Investment
Manager
to
such
series.
After
reviewing
these
and
related
factors
(including
investment
performance
as
discussed
below),
the
Board
concluded,
within
the
context
of
their
overall
conclusions,
that
the
nature,
extent
and
quality
of
the
services
to
be
provided
to
the
Fund
under
the
IMS
Agreement
supported
the
approval
of
the
IMS
Agreement.
Investment
performance
Because
the
Fund
had
not
yet
commenced
operations,
the
Board
did
not
have
investment
performance
to
compare
to
the
returns
of
a
group
of
comparable
funds.
The
Board
noted
their
review
of
performance
records
of
other
existing
funds
that
are
managed
by
members
of
the
Fund’s
portfolio
management
team,
though
noting
that
none
of
the
existing
funds
had
a
substantively
similar
investment
strategy
to
that
proposed
for
the
Fund.
The
Board
also
considered
the
Investment
Manager’s
performance
and
reputation
generally,
the
Investment
Manager’s
historical
responsiveness
to
Board
concerns
about
performance,
and
the
Investment
Manager’s
willingness
to
take
steps
intended
to
improve
performance.
After
reviewing
these
and
related
factors,
the
Board
concluded,
within
the
context
of
their
overall
conclusions,
that
the
performance
of
the
Investment
Manager,
in
light
of
other
considerations,
supported
the
approval
of
the
IMS
Agreement.
Comparative
fees,
costs
of
services
provided
and
the
profits
realized
by
the
Investment
Manager
and
its
affiliates
from
their
relationships
with
the
Fund
The
Board
reviewed
comparative
fees
and
the
costs
of
services
to
be
provided
under
the
IMS
Agreement.
The
Board
considered
the
proposed
unitary
fee
structure
to
be
utilized
by
the
Fund,
observing
that
many
of
the
competitors
of
the
Fund
have
adopted
similar
unitary
fee
structures.
The
Board
accorded
particular
weight
to
the
notion
that
a
primary
objective
of
the
proposed
level
of
fees
is
to
achieve
a
rational
pricing
model
applied
consistently
across
the
various
product
lines
in
the
Fund
family,
while
assuring
that
the
overall
fees
for
each
Columbia
Fund
(with
certain
exceptions)
are
generally
in
line
with
the
current
"pricing
philosophy"
such
that
Fund
total
expense
ratios,
in
general,
approximate
or
are
lower
than
the
median
expense
ratios
of
funds
in
the
same
Lipper
comparison
universe.
The
Board
considered
that
the
proposed
unitary
management
fee
was
below
the
median
net
expense
ratio
of
peer
funds.
After
reviewing
these
and
related
factors,
the
Board
concluded,
within
the
context
of
their
overall
conclusions,
that
the
proposed
levels
of
management
fees
and
expenses
of
the
Fund,
in
light
of
other
considerations,
supported
the
approval
of
the
IMS
Agreement.
The
Board
took
into
account
the
indirect
economic
benefits
flowing
to
the
Investment
Manager
or
its
affiliates
in
connection
with
managing
the
Columbia
Funds,
such
as
the
enhanced
ability
to
offer
various
other
financial
products
to
Ameriprise
Financial
customers
and
overall
reputational
advantages.
They
noted
that
the
fees
to
be
paid
by
the
Fund
APPROVAL
OF
INVESTMENT
MANAGEMENT
SERVICES
AGREEMENT
(continued)
(Unaudited)
should
permit
the
Investment
Manager
to
offer
competitive
compensation
to
its
personnel,
make
necessary
investments
in
its
business
and
earn
an
appropriate
profit.
After
reviewing
these
and
related
factors,
the
Board
concluded,
within
the
context
of
their
overall
conclusions,
that
the
costs
of
services
to
be
provided
supported
the
approval
of
the
IMS
Agreement.
Economies
of
scale
The
Board
considered
that
the
proposed
IMS
Agreement
provides
for
a
unitary
fee
level
that
does
not
include
pre-
established
breakpoints,
and
management’s
observation
that
ETF
fee
structures
often
do
not
include
breakpoints
due
to
the
more
volatile
nature
of
their
inflows/outflows.
Conclusion
The
Board
reviewed
all
of
the
above
considerations
in
reaching
its
decision
to
approve
the
IMS
Agreement.
In
reaching
its
conclusions,
no
single
factor
was
determinative.
On
June
27,
2024,
the
Board,
including
all
of
the
Independent
Trustees,
determined
that
fees
payable
under
the
IMS
Agreement
were
fair
and
reasonable
in
light
of
the
extent
and
quality
of
services
provided
and
approved
the
IMS
Agreement.
Columbia
ETF
Trust
I
290
Congress
Street
Boston,
MA
02210
Investors
should
consider
the
investment
objectives,
risks,
charges
and
expenses
of
an
exchange-traded
fund
(ETF)
carefully
before
investing.
For
a
free
prospectus
and
summary
prospectus,
which
contains
this
and
other
important
information
about
the
ETFs,
visit
columbiathreadneedleus.com/etfs.
Read
the
prospectus
and
summary
prospectus
carefully
before
investing.
Columbia
Management
Investment
Advisers,
LLC
serves
as
the
investment
manager
to
the
ETFs.
The
ETFs
are
distributed
by
ALPS
Distributors,
Inc.
,
which
is
not
affiliated
with
Columbia
Management
Investment
Advisers,
LLC,
or
its
parent
company,
Ameriprise
Financial,
Inc.
©
2024
Columbia
Management
Investment
Advisers,
LLC.
columbiathreadneedleus.com/etfs
Item 8. Changes in and Disagreements with Accountants for Open-End Management Investment Companies.
Not applicable.
Item 9. Proxy Disclosures for Open-End Management Investment Companies.
Not applicable.
Item 10. Remuneration Paid to Directors, Officers, and Others of Open-End Management Investment Companies.
Not applicable.
Item 11. Statement Regarding Basis for Approval of Investment Advisory Contract.
Statement regarding basis for approval of Investment Advisory Contract is included in Item 7 of this Form N-CSR.
Item 12. Disclosure of Proxy Voting Policies and Procedures for Closed-End Management Investment Companies.
Not applicable.
Item 13. Portfolio Managers of Closed-End Management Investment Companies.
Not applicable.
Item 14. Purchases of Equity Securities by Closed-End Management Investment Company and Affiliated Purchasers.
Not applicable.
Item 15. Submission of Matters to a Vote of Security Holders.
There were no material changes to the procedures by which shareholders may recommend nominees to the registrant’s board of directors implemented since the registrant last provided disclosure as to such procedures in response to the requirements of Item 407(c)(2)(iv) of Regulation S-K or Item 15 of Form N- CSR.
Item 16. Controls and Procedures.
(a)The registrant’s principal executive officer and principal financial officer, based on their evaluation of the registrant’s disclosure controls and procedures as of a date within 90 days of the filing of this report, have concluded that such controls and procedures are adequately designed to ensure that information required to be disclosed by the registrant in Form N-CSR is accumulated and communicated to the registrant’s management, including the principal executive officer and principal financial officer, or persons
performing similar functions, as appropriate to allow timely decisions regarding required disclosure.
(b)There was no change in the registrant’s internal control over financial reporting that occurred during the period covered by this report that has materially affected, or is reasonably likely to materially affect, the registrant’s internal control over financial reporting.
Item 17. Disclosure of Securities Lending Activities for Closed-End Management Investment Companies.
SIGNATURES
Pursuant to the requirements of the Securities Exchange Act of 1934 and the Investment Company Act of 1940, the registrant has duly caused this report to be signed on its behalf by the undersigned, thereunto duly authorized.
(registrant) | Columbia ETF Trust I |
| |
By (Signature and Title) | /s/ Daniel J. Beckman |
| Daniel J. Beckman, President and Principal Executive Officer |
| |
Date | November 21, 2024 |
| |
| |
Pursuant to the requirements of the Securities Exchange Act of 1934 and the Investment Company Act of 1940, this report has been signed below by the following persons on behalf of the registrant and in the capacities and on the dates indicated.
By (Signature and Title) | /s/ Daniel J. Beckman |
| Daniel J. Beckman, President and Principal Executive Officer |
| |
Date | November 21, 2024 |
By (Signature and Title) | /s/ Michael G. Clarke |
| Michael G. Clarke, Chief Financial Officer, |
| Principal Financial Officer and Senior Vice President |
| |
Date | November 21, 2024 |
By (Signature and Title) | /s/ Marybeth Pilat |
| Marybeth Pilat, Treasurer, Chief Accounting |
| Officer and Principal Financial Officer |
| |
Date | November 21, 2024 |