Washington, D.C. 20549
GRUPO FINANCIERO SANTANDER MÉXICO, S.A.B. de C.V.
SANTANDER MEXICO FINANCIAL GROUP, S.A.B. de C.V.
01219 México, D.F.
Indicate by check mark whether the registrant files or will file annual reports under cover of Form 20-F or Form 40-F:
Indicate by check mark if the registrant is submitting the Form 6-K in paper as permitted by Regulation S-T Rule 101(b)(1):
Indicate by check mark if the registrant is submitting the Form 6-K in paper as permitted by Regulation S-T Rule 101(b)(7):
4Q.13 | EARNINGS RELEASE | 1
TABLE OF CONTENTS
| I. | CEO Message / Key Highlights for the Quarter |
| II. | Summary of 4Q13 Consolidated Results |
| III. | Analysis of 4Q13 Consolidated Results |
| IV. | Relevant Events & Representative Activities and Transactions |
| VI. | 4Q13 Earnings Call Dial-In Information |
| VIII. | Notes to the Financial Statements |
4Q.13 | EARNINGS RELEASE | 2
Grupo Financiero Santander Mexico Reports Fourth Quarter 2013 Net Income of Ps.6,134 Million
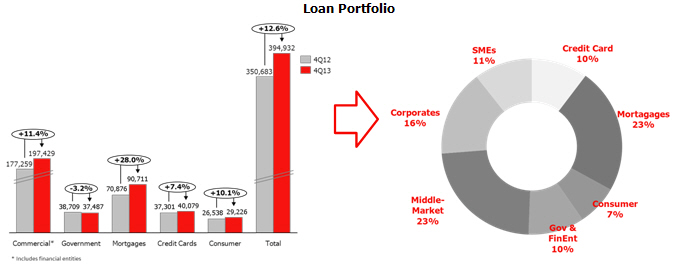
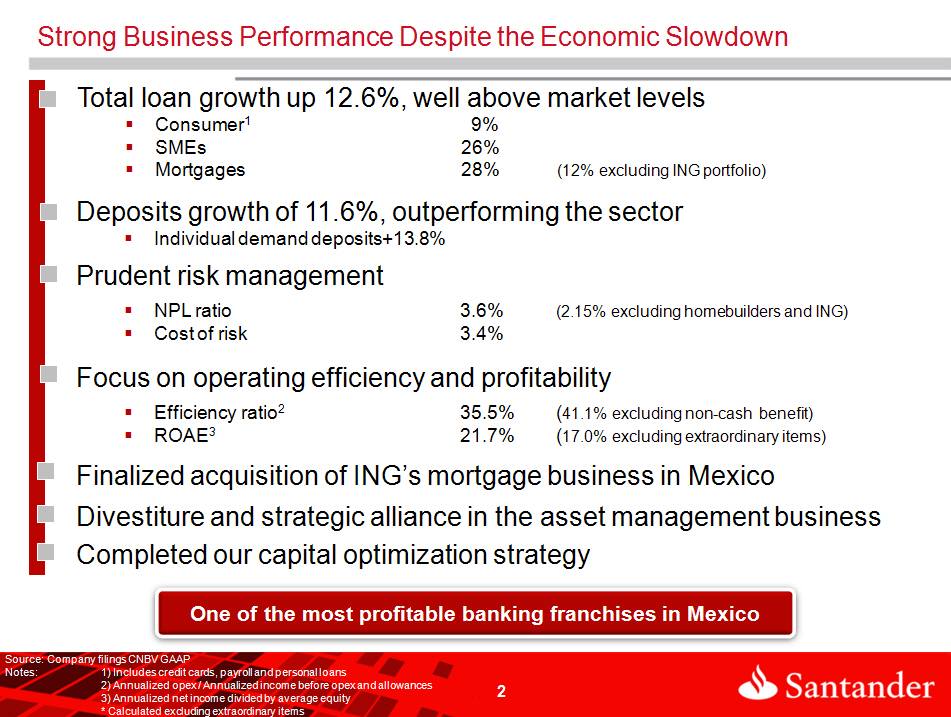
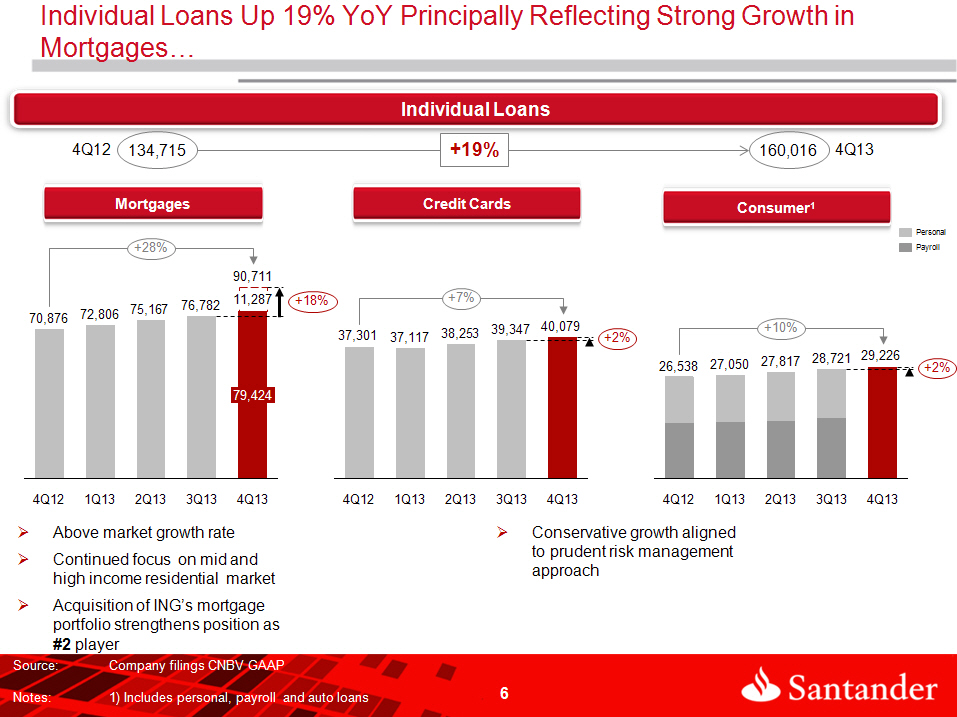
| - | Loan portfolio up 12.6% YoY with increases of 26.2% in SMEs, 7.4% in credit cards, 10.1% in consumer loans and 28.0% in mortgages including the acquistion of ING’s mortgage business (now Santander Vivienda). |
| - | Continued prudent risk management reflected in a NPL ratio of 2.2% (excluding homebuilders and ING portfolio) and cost of risk of 3.4% |
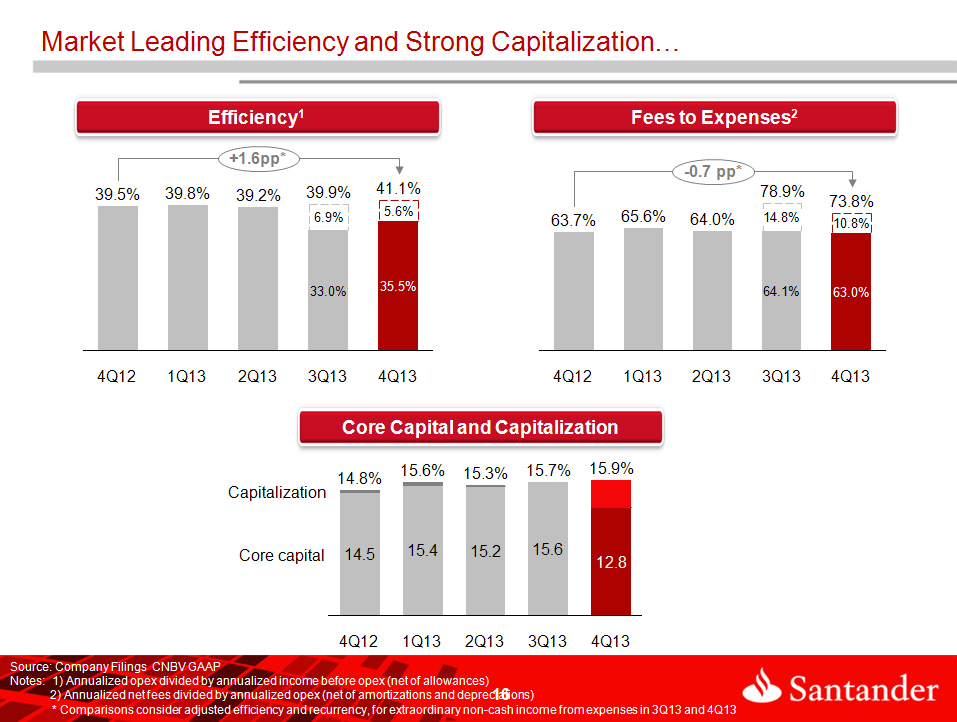
| - | Ongoing emphasis on operating efficiency resulted in a 41.1% efficiency ratio on a comparable basis |
Mexico City – January 30, 2014, Grupo Financiero Santander Mexico, S.A.B. de C.V., (NYSE: BSMX; BMV: SANMEX), (“Santander Mexico”), one of the leading financial groups in the Mexican financial system, today announced financial results for the three- and twelve-month periods ending December 31, 2013.
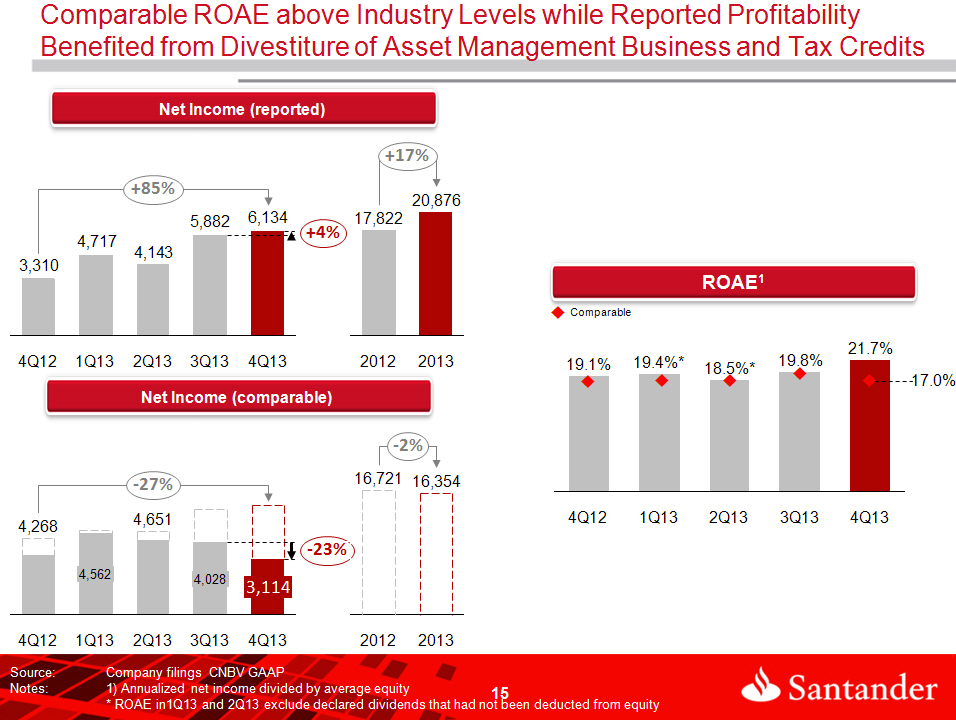
Comparable net income in 4Q13 decreased 27.0% YoY to Ps.3,114 million. Comparable 4Q13 results eliminate the following items: i) a Ps.1,927 million net gain after taxes resulting from the divestiture of the asset management business, ii) a Ps.1,074 million benefit from advanced tax credits, iii) an extraordinary net benefit of Ps.199 million before taxes related to the mandatory regulatory change in employee profit sharing (EPS) future payments occurred in 3Q13 and iv) branch expansion expenses before taxes of Ps.171 million. Additionally, comparable 4Q12 results reflect Ps.1,368 million before taxes adjusted downward which include: an adjustment to be consistent with the accounting methodology adopted in 2013 to normalize expenses throughout the year, certain provisions, write-offs and administrative and promotional expenses. Reported net income for the quarter was Ps.6,134 million, representing YoY and QoQ increases of 85.3% and 4.3%, respectively.
Marcos Martínez, Executive President and CEO, commented, "We reported a strong performance in loan and deposit growth this quarter, ahead of industry growth rates. This good performance came about even as we continue to face an environment of lower growth.”
“We expanded our total loan portfolio by 13% YoY this quarter, reflecting solid organic growth as well as the positive contribution from the November 2013 acquisition of ING’s mortgage business, which solidifies our number two ranking in this attractive segment of the market. | |  |
4Q.13 | EARNINGS RELEASE | 3
Among our core products, SME loans and mortgages grew YoY by 26% and 28%, respectively, well above the Mexican financial system growth rates during the period. Credit Cards and Consumer loans rose 7% and 10%, respectively, reflecting a conservative strategy to prioritize asset quality. Furthermore, we increased our deposit base by 12%, further supporting our liquidity profile.”
“Net interest income for the quarter increased 6.5% YoY, with net interest margin of 5.25%, reflecting core business growth and lower cost of funding. At the same time, we remained on track with our branch expansion plan opening a total of 37 new branches during this quarter, for a total of 90 branches since the start of this process while maintaining tight cost controls across the organization. In summary, against a backdrop of a challenging economic environment, we closed 2013 in a very solid position as one of the most efficient and profitable franchises in the country.”
“Also, several important events during the quarter improved our financial position. Among these, we divested our equity in the asset management business and entered into strategic agreements to continue to distribute these mutual funds to our clients. We also completed the optimization of our capital structure which has allowed us to reduce our cost of capital and increase return on equity, all while maintaining industry-leading capitalization levels, well above minimum regulatory capitalization requirements. As part of this strategy, we paid a Ps.16.9 billion, or U.S.$1.3 billion, cash dividend to our shareholders during the quarter. At the same time, in December 2013 we issued U.S.$1.3 billion in subordinated notes that comply with capital requirements under Basel III for Tier 2 capital, the first of their kind in Latin America.”
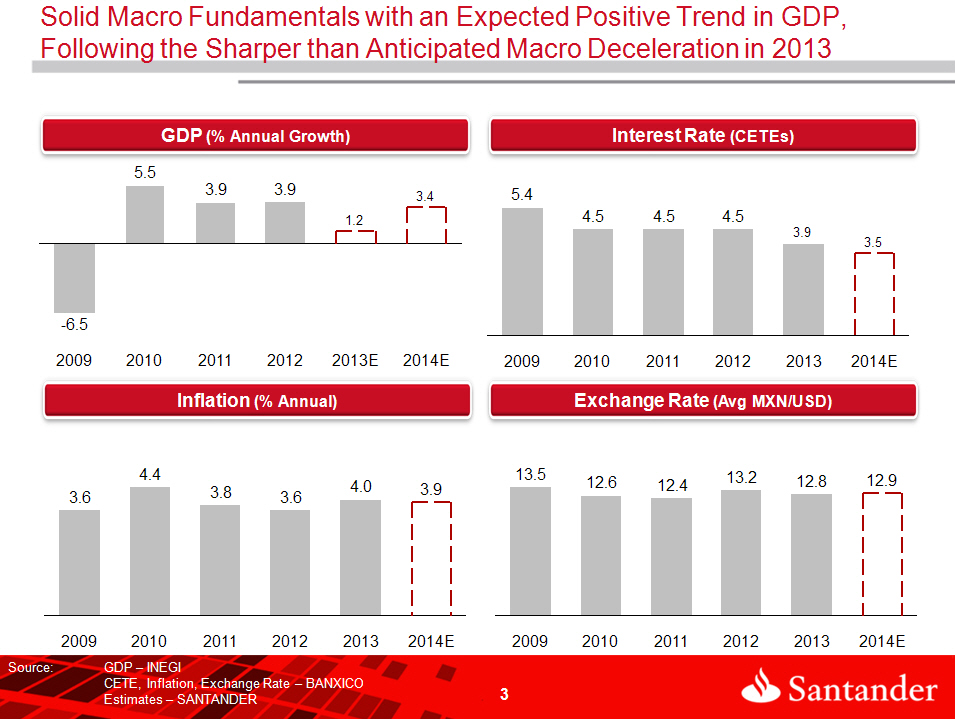
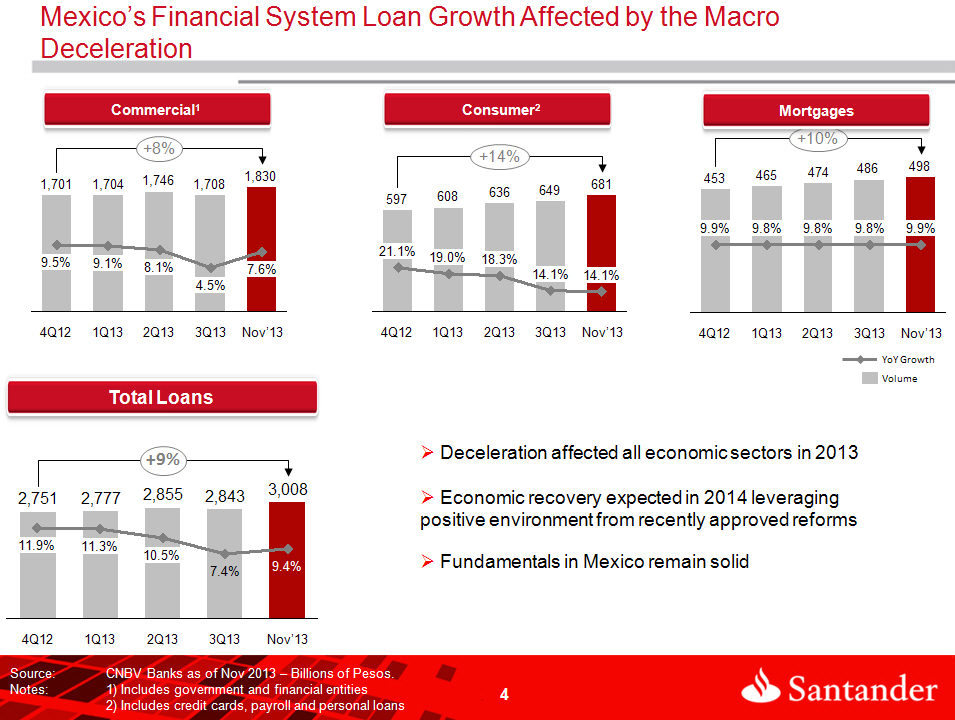
Mr. Martínez concluded, “Looking ahead, macro and financial sector fundamentals in Mexico remain strong, despite the sharper than anticipated economic slowdown last year. We expect to see a recovery in public and private investment in 2014, driven by public spending as well as the infrastructure spending program. The recent approval of the energy, labour, financial and fiscal reforms should enhance economic growth in the following years, positively impacting Mexico’s financial sector.”
4Q.13 | EARNINGS RELEASE | 4
SUMMARY OF FOURTH QUARTER 2013 CONSOLIDATED RESULTS
Net Income
| Santander Mexico reported net income of Ps.6,134 million in 4Q13, an increase of 85.3% YoY and 4.3% QoQ. Comparable 4Q13 results eliminate the following items: i) a Ps.1,927 million net gain after taxes resulting from the divestiture of the asset management business, ii) a Ps.1,074 million benefit from advanced tax credits, iii) an extraordinary net benefit of Ps.199 million before taxes related to the mandatory regulatory change in employee profit sharing (EPS) future payments occurred in 3Q13 and iv) branch expansion expenses before taxes of Ps.171 million. Additionally, comparable 4Q12 results reflect pre-tax expenses that were adjusted downward by Ps.1,368 million which include: the adjustment to be consistent with the accounting methodology adopted in 2013 to normalize expenses throughout the year, certain provisions, write-offs and incremental administrative and promotional expenses. Adjusted for the aforementioned items, comparable net income would have decreased 27.0% YoY to Ps.3,114 million in 4Q13. | | 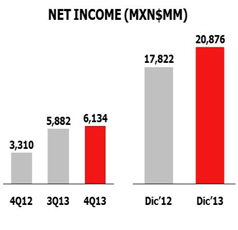 |
| | | |
Capitalization and ROAE Banco Santander (Mexico)’s preliminary capital ratio at period end 4Q13 was 15.9%, compared to 14.8% at period end 4Q12 and 15.7% at period end 3Q13. The 15.9% capital ratio was comprised of 12.8% Tier 1 and 3.1% Tier 2, as a result of our recent Basel III Tier 2 compliant subordinated notes issuance and the dividend payment.
4Q13 ROAE was 21.7%, versus 19.1% in 4Q12 and 19.8% in 3Q13. Excluding non-comparable items in 4Q13, and the ones reported in previous quarters, normalized ROAE for 4Q12 and 4Q13 would have been 17.9% and 17.0%, respectively. | |  |
| | | |
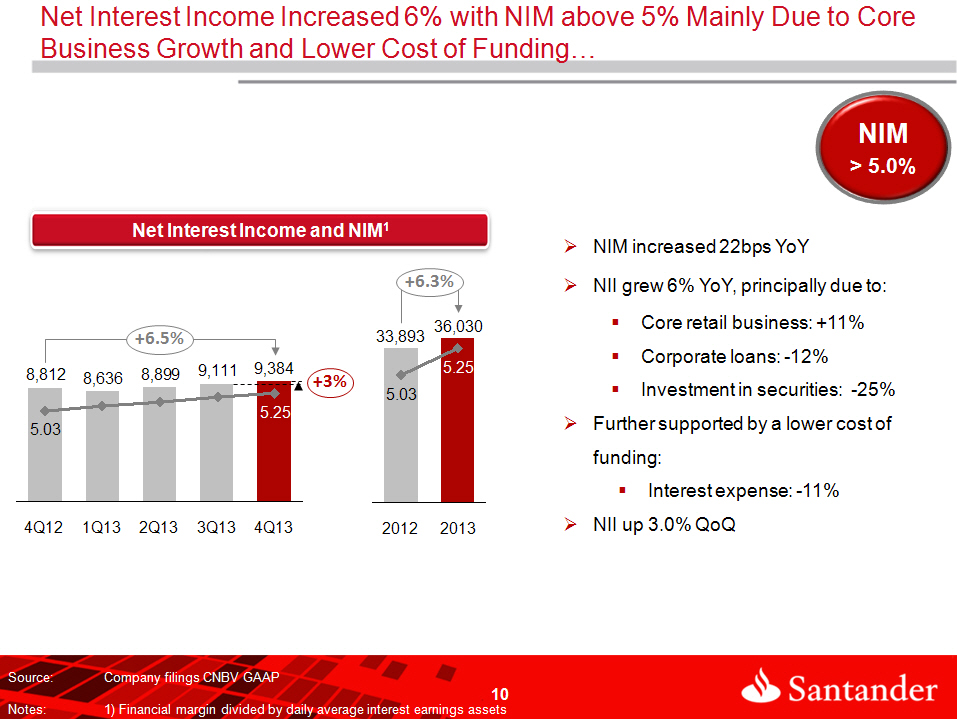
Net Interest Income Net interest income in 4Q13 increased YoY by 6.5%, or Ps.572 million, to Ps.9,384 million. On a sequential basis, net interest income increased 3.0%, or Ps.273 million, from Ps.9,111 million reported in 3Q13. Net interest margin ratio calculated with daily average interest-earning assets for 4Q13 was 5.25%, versus 5.18% in 3Q13, and 22 basis points (“bps”) higher than 4Q12. | | 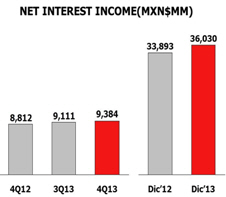 |
4Q.13 | EARNINGS RELEASE | 5
Interest income decreased 4.2%, or Ps.596 million, from Ps.14,259 million in 4Q12 to Ps.13,663 million in 4Q13. An increase of 3.5% or Ps.350 million in interest income from our loan portfolio was more than offset by YoY decreases of Ps.575 million or 21.7% in investment in securities, Ps.187 million or, 32.4% in funds available and Ps.172 million or 20.9% in sale and repurchase agreements.
Interest expense decreased 21.4%, or Ps.1,168 million, to Ps.4,279 million in 4Q13, primarily due to declines of Ps.1,016 million in interest expense on our sale and repurchase agreements and Ps.388 million in interest expense on term deposits, which were partially offset by a Ps.267 million increase in interest paid on our demand deposits.
Loan Portfolio Growth
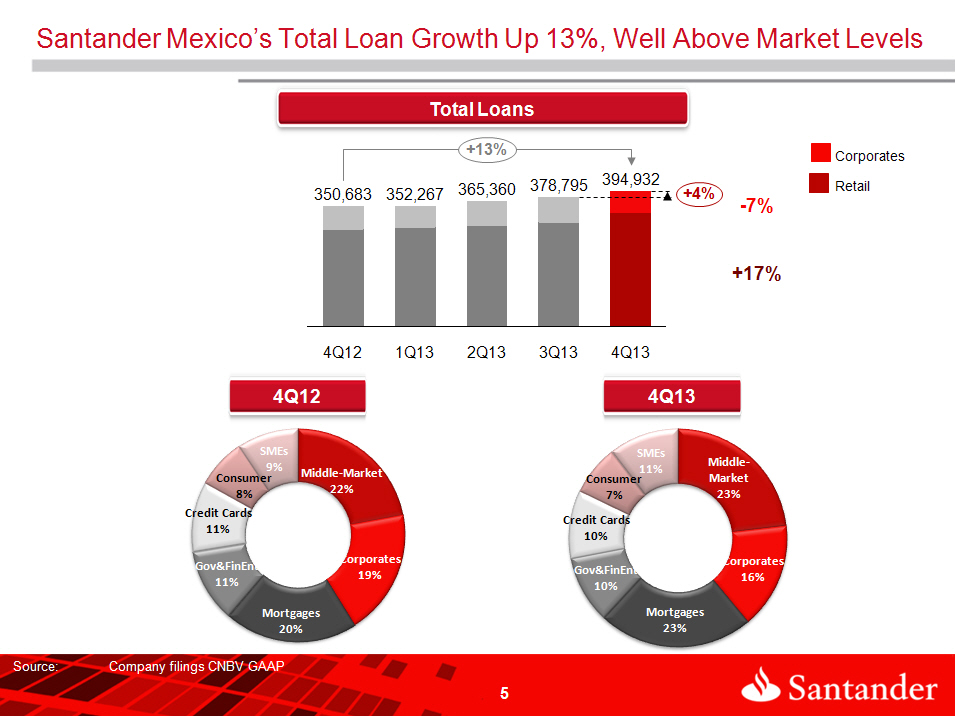
Santander Mexico’s total loan portfolio in 4Q13 increased YoY by 12.6%, or Ps.44,249 million, to Ps.394,932 million, and 4.3%, or Ps.16,137 million, on a sequential basis. This YoY increase reflects organic growth of 9.3% YoY, as well as the positive contribution from the November 2013 acquisition of ING’s mortgage business (now Santander Vivienda) which added Ps.11,694 million to Santander Mexico’s portfolio, of which Ps.11,287 million corresponds to mortgages and Ps.407 million to commercial loans.
In 4Q13, Santander Mexico’s loan portfolio expanded YoY across all core products, in both the individual and commercial loan segments. Individual loans were mainly driven by mortgages, while the growth of the consumer and credit cards loan portfolio reflected our prudent risk management policies given the economic slowdown during the year. Commercial loans continued to benefit from a significant YoY increase in the SMEs and middle-market loan portfolio, despite a temporary decline in certain revolving loans with a few large corporates.
Asset Quality
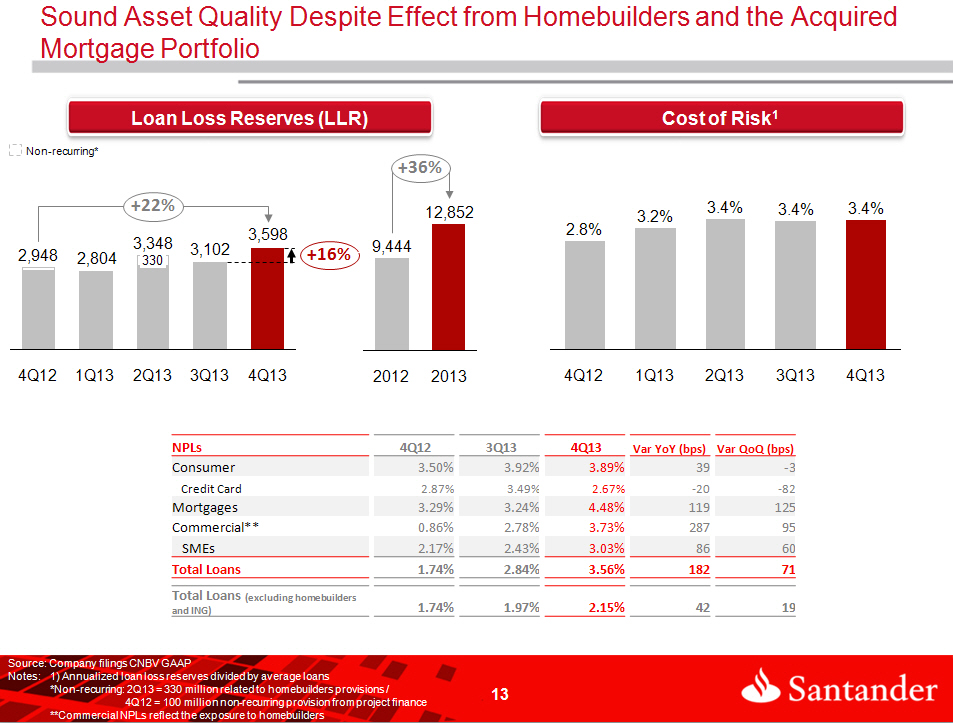
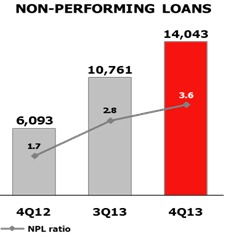
The NPL ratio in 4Q13 was 3.56%, a 182 bps increase from the 1.74% level reported in 4Q12 and 72 bps above the 2.84% achieved in 3Q13. The NPL ratio reported in 4Q13 continues to reflect our exposure to the homebuilders, with non-performing loans of Ps.4,265 million, as well as the effect from the recent acquisition of the ING mortgage portfolio (now Santander Vivienda), which had non-performing loans of Ps.1,527 million. Excluding the impact of the homebuilders and Santander Vivienda (before ING) portfolio, the NPL ratio for 4Q13 and 3Q13 would have been 2.15% and 1.97%, respectively. The current NPL ratio reflects loan portfolio growth combined with Santander Mexico’s stringent credit scoring model and ongoing monitoring of the quality of its loan portfolio.
NPLs in 4Q13 increased 130.5% to Ps.14,043 million, from Ps.6,093 million reported in 4Q12. On a sequential basis, NPLs increased 30.5%, from Ps.10,761 million reported in 3Q13. The 30.5% increase was mainly due to a Ps.1,672 million or 29.8%, increase in non-performing loans in the commercial portfolio, which at end of 4Q13 represented 51.8% of our total non-performing loans, principally driven by Santander Mexico’s exposure to the homebuilder sector. Additionally, the acquired ING portfolio added Ps.1,527 million to the total non-performing loans. Excluding the effect from these two portfolios, NPLs would have increased 35.4% YoY and 10.7% QoQ.
The coverage ratio for the quarter decreased to 115.5%, from 190.1% in 4Q12 and 146.6% in 3Q13.
4Q.13 | EARNINGS RELEASE | 6
Loans to Deposit Ratio
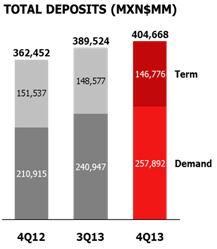
During 4Q13, deposits accounted for 55.7% of Santander Mexico’s total funding sources, and expanded 11.6% YoY and 3.9% sequentially. This deposit base provides stable, low-cost funding to support Santander Mexico’s continued growth.
The net loan to deposit ratio was 93.6% in 4Q13 unchanged from 4Q12 and 4bps higher than the corresponding figure of 93.2% in 3Q13.
Contribution to Net Income by Subsidiary
Reported net income in 4Q13 was Ps.6,134 million, representing a YoY increase of 85.3% and a sequential increase of 4.3%.
Adjusting for non-comparable items, normalized net income would have decreased 27.0% YoY to Ps.3,114 million.
Casa de Bolsa Santander, the brokerage business, reported net loss of Ps.44 million, compared with net income of Ps.53 million in 4Q12 and Ps.12 million in 3Q13.
The Holding and other subsidiaries reported net income of Ps.1,897 million in 4Q13, which mainly reflects the gain that resulted from the divestiture of the asset management businesss and compared with income of Ps.39 million in 4Q12 and Ps.28 million in 3Q13.
| Grupo Financiero Santander Mexico | | | | | | | | | |
| Earnings Contribution by Subsidiary | | | | | | | | | |
| Millions of Mexican Pesos | | | | | | | | | |
| | | | | | | | | | % Change |
| | 4Q13 | 3Q13 | | 4Q12 | | 2013 | 2012 | | YoY % |
Banking business1/ | 4,281 | 5,842 | | 3,218 | | 18,936 | 17,398 | | 8.8 |
| Brokerage | (44) | 12 | | 53 | | 110 | 269 | | (59.1) |
Holding and other subsidiaries2/ | 1,897 | 28 | | 39 | | 1,830 | 155 | | 1,080.6 |
| Net income attributable to Grupo Financiero Santander Mexico | 6,134 | 5,882 | | 3,310 | | 20,876 | 17,822 | | 17.1 |
| 1/ Includes Sofomers 2/ Asset management subsidiary and Holding. |
4Q.13 | EARNINGS RELEASE | 7
ANALYSIS OF FOURTH QUARTER 2013 CONSOLIDATED RESULTS
(Amounts expressed in millions of pesos, except where otherwise stated)
Net Income
| Grupo Financiero Santander Mexico | | | | | | |
| Income Statement | | | | | | |
| Millions of Mexican Pesos | | | | | % Change | | | % Change |
| | 4Q13 | 3Q13 | 4Q12 | | QoQ | YoY | 2013 | 2012 | 13/12 |
| | | | | | | | | | |
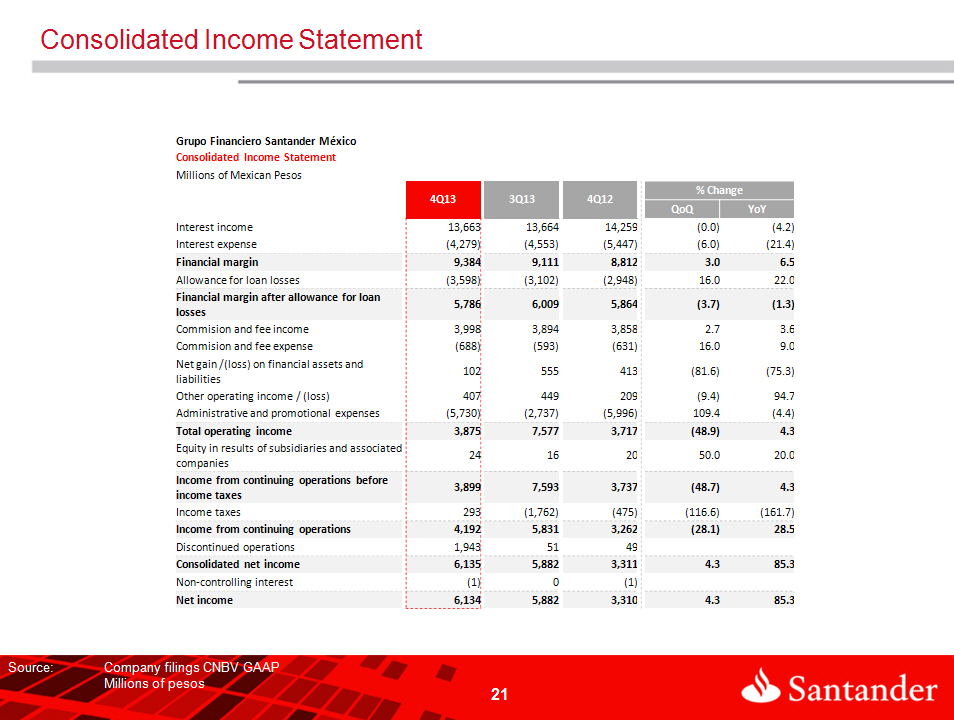
| Net interest income | 9,384 | 9,111 | 8,812 | | 3.0 | 6.5 | 36,030 | 33,893 | 6.3 |
| Provision for loan losses | (3,598) | (3,102) | (2,948) | | (16.0) | (22.0) | (12,852) | (9,444) | (36.1) |
| Net interest income after provisions for loan losses | 5,786 | 6,009 | 5,864 | | (3.7) | (1.3) | 23,178 | 24,449 | (5.2) |
| Commission and fee income, net | 3,310 | 3,301 | 3,227 | | 0.3 | 2.6 | 12,881 | 11,843 | 8.8 |
| Gains (losses) on financial assets and liabilities | 102 | 555 | 413 | | (81.6) | (75.3) | 3,014 | 2,189 | 37.7 |
| Other operating income (expenses) | 407 | 449 | 209 | | (9.4) | 94.7 | 1,726 | 3,043 | (43.3) |
| Administrative and promotional expenses | (5,730) | (2,737) | (5,996) | | (109.4) | 4.4 | (19,069) | (20,138) | 5.3 |
| Operating income | 3,875 | 7,577 | 3,717 | | (48.9) | 4.3 | 21,730 | 21,386 | 1.6 |
| Equity in results of associated companies | 24 | 16 | 20 | | 50.0 | 20.0 | 82 | 69 | 18.8 |
| Operating income before taxes | 3,899 | 7,593 | 3,737 | | (48.7) | 4.3 | 21,812 | 21,455 | 1.7 |
| Current and deferred income taxes | 293 | (1,762) | (475) | | 116.6 | 161.7 | (2,852) | (3,759) | 24.1 |
| Income from continuing operations | 4,192 | 5,831 | 3,262 | | (28.1) | 28.5 | 18,960 | 17,696 | 7.1 |
| Profit from discontinued operations, net | 1,943 | 51 | 49 | | 3,709.8 | 3,865.3 | 1,918 | 129 | 1,386.8 |
| Non-controlling interest | (1) | 0 | (1) | | 0.0 | 0.0 | (2) | (3) | 33.3 |
| Net income | 6,134 | 5,882 | 3,310 | | 4.3 | 85.3 | 20,876 | 17,822 | 17.1 |
During 4Q13, Santander Mexico reported net income of Ps.6,134 million, representing 85.3% and 4.3% YoY and sequential increases, respectively. These comparisons, however, are impacted by certain items.
Items that impacted net income during 4Q13 are:
| § | A Ps.1,927 million net gain after taxes resulting from the divestiture of the asset management business; |
| § | A Ps.1,074 million benefit from advanced tax credits; |
| § | A net regulatory benefit of Ps.199 million before taxes, to account for the mandatory regulatory change regarding employee profit sharing (EPS) future payments occurred in 3Q13; and |
| § | Incremental expenses of Ps.171 million before taxes related to the branch expansion. |
Additionally, 4Q12 was affected by the following pre-tax items:
| § | Ps.571 million downward adjustment to normalize expenses to make this line comparable with the methodology adopted in 2013 |
| § | Ps.245 million write-off of account receivables in connection with certain guarantees subject to conditions that were not met and that had originated in mortgage loans with FOVI. |
4Q.13 | EARNINGS RELEASE | 8
| § | Ps.225 million in marketing expenses for a corporate image campaign; |
| § | Ps.127 million in costs related to the opening of 15 branches during the quarter and frontloading of expenses for branch openings in 2013; |
| § | Ps.100 million provision derived from a project finance client; |
| § | Ps.60 million in expenses related to the Company’s IPO; and |
| § | Ps.40 million from the amortization of obsolete software. |
Excluding these items, comparable net income during 4Q13 would have decreased 27.0% and 22.7% YoY and QoQ, respectively.
| Grupo Financiero Santander Mexico | | | | | | | | |
| Net Income Adjustments | | | | | | | | |
| Million Pesos | | | | | | % Change | | % Change |
| | 4Q13 | 3Q13 | | 4Q12 | | YoY | | QoQ |
| Net income | 6,134 | 5,882 | | 3,310 | | 85.3 | | 4.3 |
| Net regulatory EPS effects on expenses | (199) | (2,803) | | | | | | |
| FOVI write-off | | | | 245 | | | | |
| Corporate image campaign | | | | 225 | | | | |
| Project finance provisions | | | | 100 | | | | |
| IPO related expenses | | | | 60 | | | | |
| Amortization of obsolete software | | | | 40 | | | | |
| Expenses regularization | | | | 571 | | | | |
| Branch expansion | 171 | 154 | | 127 | | | | |
| Adjusted net income (before taxes) | 6,106 | 3,233 | | 4,678 | | | | |
| Benefit from asset management divestiture | (1,927) | | | | | | | |
| Advance Tax Credits | (1,074) | | | | | | | |
| Taxes | 8 | 795 | | (410) | | | | |
| Adjusted net income | 3,114 | 4,028 | | 4,268 | | (27.0) | | (22.7) |
Net interest income for 4Q13 rose to Ps.9,384 million, representing a YoY increase of Ps.572 million, or 6.5% and a QoQ increase of Ps.273 million, or 3.0%.
Interest income decreased 4.2%, or Ps.596 million, YoY to Ps.13,663 million in 4Q13 from Ps.14,259 million in 4Q12. This was primarily driven by growth in the Bank’s business volume, which resulted in a Ps.350 million or 3.5% increase in interest income from the loan portfolio, which was more than offset by a YoY decrease of Ps.575 million, or 21.7%, in the investment securities, Ps.187 million or, 32.4% in funds available and Ps.172 million or 20.9% in sale and repurchase agreements. Interest expense decreased 21.4%, or Ps.1,168 million, reaching Ps.4,279 million in 4Q13 compared with Ps.5,447 million in 4Q12, mainly driven by declines of Ps.1,016 million in the interest expense on our sale and repurchase agreements and Ps.388 million on the term deposits, which were partially offset by a Ps.267 million increase in interest paid on our demand deposits.
Provisions for loan losses for the quarter were Ps.3,598 million, representing a YoY increase of Ps.650 million, or 22.0%, and a sequential increase of Ps.496 million, or 16.0%. The YoY and QoQ growth was partially driven by the introduction of the expected losses methodology for provisions in the commercial loan portfolio, as required by CNBV, which is more stringent and requires higher levels of provisioning, as well as the impact from the loss of a significant payroll portfolio, that resulted in a reduction in payroll accounts and increasing collection risk of previously granted payroll loans thus requiring higher provisions.
4Q.13 | EARNINGS RELEASE | 9
The NPL ratio in 4Q13 was 3.56%, a 182 bps increase from the 1.74% level reported in 4Q12 and 72 bps above the 2.84% achieved in 3Q13. The NPL ratio reported in 4Q13 continues to reflect our exposure to the homebuilders, with non-performing loans of Ps.4,265 million, as well as the effect from the recent acquisition of the ING mortgage portfolio (now Santander Vivienda), which had non-performing loans of Ps.1,527 million. Excluding the impact of the homebuilders and Santander Vivienda’s portfolio, the NPL ratio for 4Q13 and 3Q13 would have been 2.15% and 1.97%, respectively.
The coverage ratio for the quarter decreased to 115.5%, from 190.1% in 4Q12 and 146.6% in 3Q13.
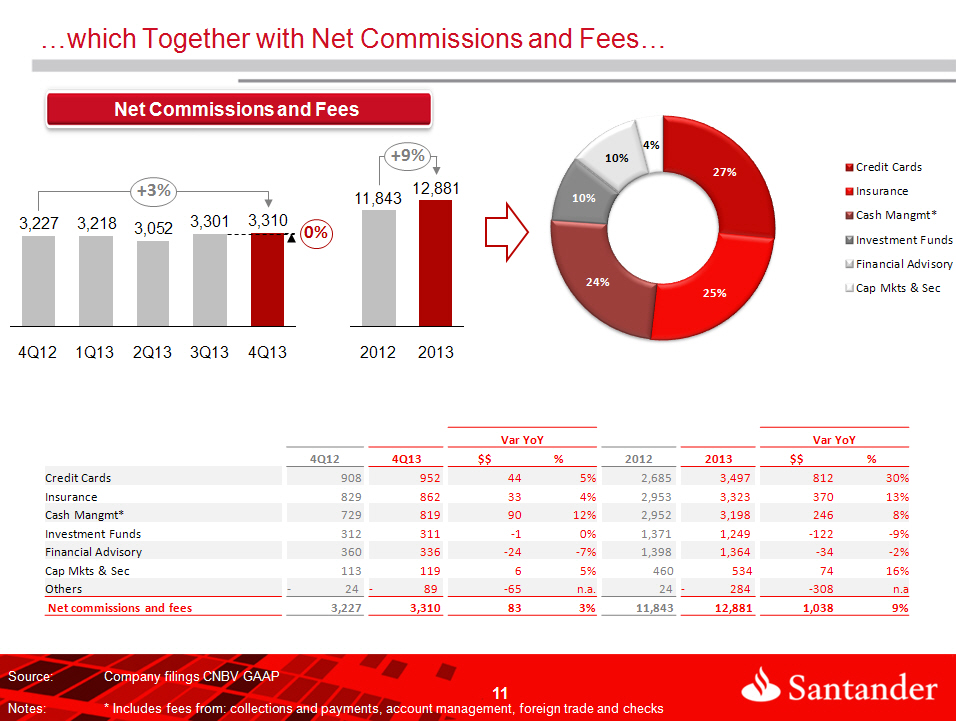
Net commissions and fee income for 4Q13 amounted to Ps.3,310 million, rising 2.6% YoY, and 0.3% sequentially. The YoY increase was mainly due to a positive performance in commissions from collections and payments, credit cards and insurance brokerage, which were up 15.7%, 4.8% and 4.0%, respectively.
During 4Q13, Santander Mexico reported a Ps.102 million net gain from financial assets and liabilities, compared with a gain of Ps.413 million in 4Q12 and a gain of Ps.555 million in 3Q13. Net gain on financial assets and liabilities in 4Q13 is mainly explained by valuation losses of Ps.648 million principally related to derivatives positions, which were more than offset by trading gains of Ps.750 million, also mainly related to derivatives.
Other operating income in 4Q13 totaled Ps.407 million, up from Ps.209 million in 4Q12, mainly due to a Ps.221 million or 50.2% increase in recoveries from the written-off portfolio. Sequentially, other income in 4Q13 decreased Ps.42 million from Ps.449 million in 3Q13.
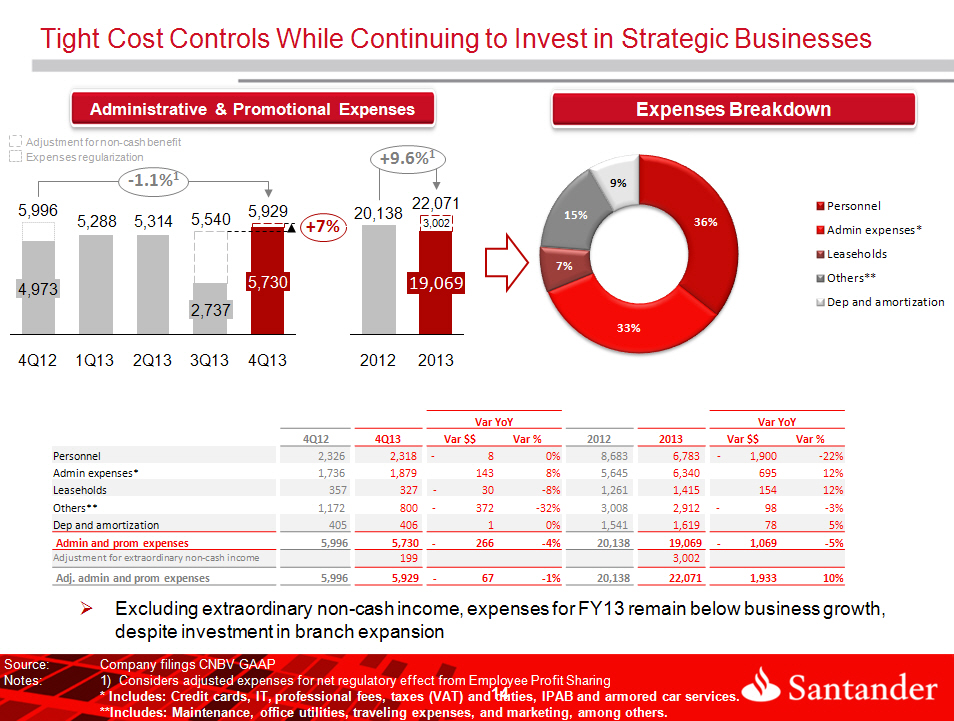
Administrative and promotional expenses in 4Q13 amounted to Ps.5,730 million, representing a YoY decline of 4.4%, or Ps.266 million. Expenses in 4Q13 reflect a net extraordinary pre-tax benefit of Ps.199 million related to the mandatory regulatory change in legal criteria regarding employee profit sharing future payments that occurred in 3Q13. Additionally, the adoption in 2013 of an internal initiative to normalize the booking of expenses throughout the year remained in place. Adjusting for the Ps.199 million extraordinary benefit in 4Q13 and the Ps.571 million adjustment in 4Q12 for the normalization in the booking of expenses, administrative and promotional expenses would have increased YoY by 9.3%, or Ps.504 million and QoQ by 7.0%, or Ps.389 million.
Operating income in 4Q13 totaled Ps.3,875 million. Excluding the Ps.199 million net extraordinary pre-tax benefit, operating income would have been Ps.3,676 million, representing a YoY decline of Ps.41 million, or 1.1% mainly due to lower trading gains as a result of capital market volatility.
Net income in 4Q13 amounted to Ps.6,134 million, an increase of 85.3% from 4Q12. On a sequential basis, net income increased 4.3%. Excluding the net impact of non-comparable items, normalized net income would have decreased 27.0% YoY.
Net income for FY13 amounted to Ps.20,876 million, an increase of 17.1%, or Ps.3,054 million, from the Ps.17,822 million reported in FY12. Excluding non-comparable items from 2012 and 2013, net income for FY13 would have been of Ps.16,354 million, a decrease of 2.2%, or Ps.367 million from the Ps.16,721 million reported in FY12.
These results mainly reflect the combined impact of the following increases:
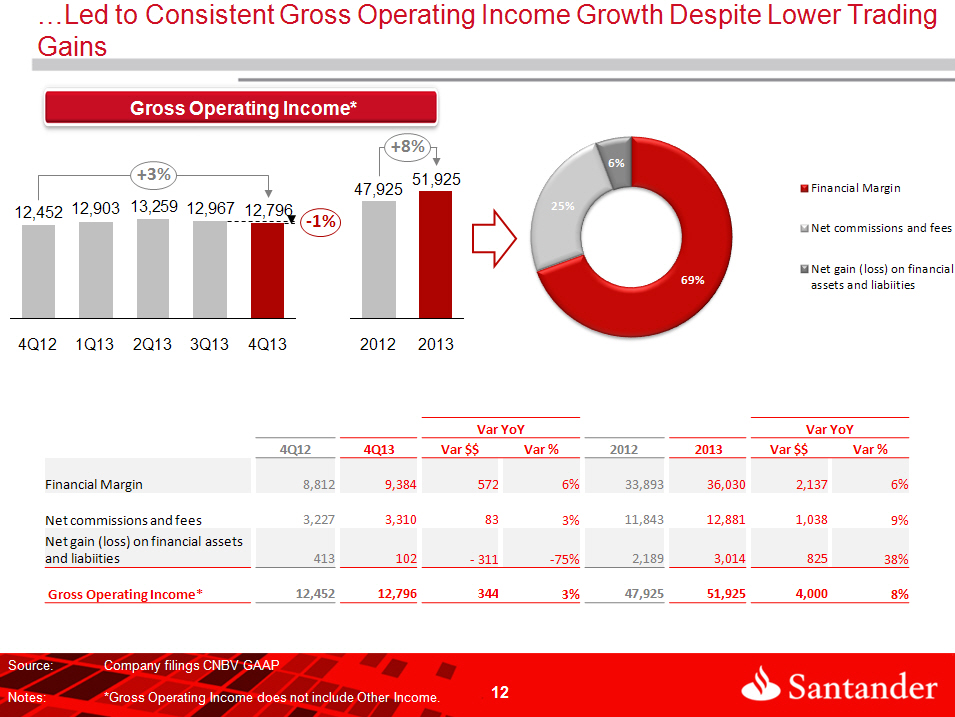
| | § | 6.3%, or Ps.2,137 million, in net interest income from Ps.33,893 million in FY12 to Ps.36,030 million in FY13, due to an increase in interest income from the loan portfolio, which was more than offset by a decrease in investment and securities and funds available, while interest expense declined. |
4Q.13 | EARNINGS RELEASE | 10
| | § | 8.8%, or Ps.1,038 million, in net commissions and fee income, from Ps.11,843 million in FY12 to Ps.12,881 million in FY13, principally due to increases in credit cards, insurance, and collections and payments; and |
| | § | 37.7%, or Ps.825 million, in net gains from financial assets and liabilities from Ps.2,189 million in FY12 to Ps.3,014 million in FY13; |
These positive results were further supported by:
| | § | Ps.1,069 million, or 5.3% decrease in administrative and promotional expenses from Ps.20,138 million in FY12 to Ps.19,069 million in FY13. The result in FY13 reflects a net extraordinary pre-tax benefit of Ps.3,002 million related to the mandatory regulatory change regarding employee profit sharing future payments that occurred in 3Q13. Excluding this non-comparable item, administrative and promotional expenses would have increased Ps.1,933 million or 9.6%, remaining below business growth, despite the ongoing investment in branch expansion; and |
| | § | Ps.907 million, or 24.1% decrease in current and deferred income taxes from Ps.3,759 million in FY12 to Ps. 2,852 million in FY13. This decrease resulted from a Ps.1,074 million benefit reported in 2013 from advanced tax credits. |
The aforementioned positive results were partially offset by:
| | § | Increase in provisions for loan losses of Ps.3,408 million, or 36.1%, mainly due to the growth in the loan portfolio and the introduction of the expected losses methodology for provisions in the commercial loan portfolio, as required by CNBV, which is more stringent and requires higher levels of provisioning; and |
| | § | Ps.1,317 million, or 43.3% decrease in other operating income from Ps.3,043 million in FY12 to Ps.1,726 million for FY13 mainly explained by the Ps.1,740 million non-recurring gain from the sale and leaseback of the 220 branches in 2Q12 which was partially offset by an increase of Ps.350 million, or 19.4% in the recoveries of loans previously charged-off. |
4Q.13 | EARNINGS RELEASE | 11
Net Interest Income
| Grupo Financiero Santander Mexico | | | | | | |
| Net Interest Income | | | | | | | | | |
| Millions of Mexican Pesos | | | | | % Change | | | | % Change |
| | 4Q13 | 3Q13 | 4Q12 | | QoQ | YoY | 2013 | 2012 | 13/12 |
| Funds Available | 390 | 435 | 577 | | (10.3) | (32.4) | 1,859 | 2,425 | (23.3) |
| Margin accounts | 84 | 96 | 96 | | (12.5) | (12.5) | 385 | 408 | (5.6) |
| Interest from investment in securities | 2,077 | 2,340 | 2,652 | | (11.2) | (21.7) | 9,078 | 12,036 | (24.6) |
| Loan portfolio – excluding credit cards | 7,816 | 7,677 | 7,647 | | 1.8 | 2.2 | 30,542 | 28,908 | 5.7 |
| Credit card loan portfolio | 2,443 | 2,362 | 2,321 | | 3.4 | 5.3 | 9,465 | 8,264 | 14.5 |
| Loan origination fees | 202 | 196 | 143 | | 3.1 | 41.3 | 805 | 625 | 28.8 |
| Sale and repurchase agreements | 651 | 558 | 823 | | 16.7 | (20.9) | 3,002 | 2,722 | 10.3 |
| Interest Income | 13,663 | 13,664 | 14,259 | | (0.0) | (4.2) | 55,136 | 55,388 | (0.5) |
| | | | | | | | | | |
| Average Earning Assets* | | | | | | | 686,224 | 673,176 | |
| | | | | | | | | | |
| Customer deposits – Demand deposits | (775) | (816) | (508) | | 5.0 | (52.6) | (2,878) | (2,165) | (32.9) |
| Customer deposits – Time deposits | (1,130) | (1,303) | (1,518) | | 13.3 | 25.6 | (5,323) | (5,630) | 5.5 |
| Credit instruments issued | (313) | (326) | (402) | | 4.0 | 22.1 | (1,445) | (1,298) | (11.3) |
| Interbank loans | (289) | (172) | (242) | | (68.0) | (19.4) | (803) | (791) | (1.5) |
| Subordinated Capital Notes | (11) | 0 | 0 | | 0.0 | 0.0 | (11) | 0 | 0.0 |
| Sale and repurchase agreements | (1,761) | (1,936) | (2,777) | | 9.0 | 36.6 | (8,646) | (11,611) | 25.5 |
| Interest Expense | (4,279) | (4,553) | (5,447) | | 6.0 | 21.4 | (19,106) | (21,495) | 11.1 |
| | | | | | | | | | |
| Net Interest Income | 9,384 | 9,111 | 8,812 | | 3.0 | 6.5 | 36,030 | 33,893 | 6.3 |
| *Includes Funds Available, Margin Accounts, Investment in securities, Loan portfolio and Sale and repurchase agreements |
Net interest income in 4Q13 amounted to Ps.9,384 million, representing a QoQ increase of Ps.273 million, or 3.0%, and a YoY increase of Ps.572 million, or 6.5%.
Net interest margin ratio calculated with daily average interest-earning assets for 4Q13 was 5.25%, versus 5.18% in 3Q13, and 22 bps higher than 4Q12.
The YoY increase in net interest income for the quarter is explained by the combined effect of a Ps.596 million decrease in interest income, from Ps.14,259 million in 4Q12 to Ps.13,663 million in 4Q13, more than offset by a Ps.1,168 million decrease in interest expense, from Ps.5,447 million in 4Q12 to Ps.4,279 million in 4Q13. This is mainly explained by a decrease in average-earning assets of Ps.738 million, along with a decline in the average interest rate by 34 bps; combined with a decline in the average interest-bearing liabilities of Ps.8,545 million with a 74 bps lower average cost.
The sequential increase in net interest income resulted mainly from the Ps.1 million slight decrease in interest income, from Ps.13,664 million in 3Q13 to Ps.13,663 million in 4Q13, which was more than offset by a Ps.274 million decrease in interest expense, from Ps.4,553 million in 3Q13 to Ps.4,279 million in 4Q13. This is explained
4Q.13 | EARNINGS RELEASE | 12
by a increase of Ps.13,395 million in average interest-earning assets and a 16 bps decrease in the average interest income rate, combined with a increase of Ps.14,975 million in interest-bearing liabilities and a decline of 26 bps in the average interest rate paid.
Interest Income
Interest income declined YoY by 4.2%, or Ps.596 million, from Ps.14,259 million in 4Q12 to Ps.13,663 million in 4Q13, principally due to a decline of Ps.575 million in interest income on our investment in securities portfolio, together with decreases of Ps.187 million and Ps.172 million on our funds available and sales and repurchase agreements, respectively. These decreases were partially offset by a Ps.350 million increase in the recurring loan portfolio.
On a sequential basis, interest income remained unchanged; reflecting declines of Ps.263 million in interest from investment in securities and Ps.45 million on funds available, while interest income on the loan portfolio increased Ps.226 million.
The average interest rate on interest-earning assets declined in 4Q13 to 8.08%, representing a 34 bps decrease from 8.42% in 4Q12 and a 16 bps decrease from 8.24% in 3Q13.
4Q13 average interest-earning assets grew QoQ by Ps.13,395 million, or 2.0%, mainly driven by the following increases: Ps.20,475 million in the average volume of the loan portfolio including credit cards; Ps.19,017 million in debtors under sale and repurchase agreements; and Ps.1,390 million in margin accounts. These increases were partially affected by decreases of Ps.19,723 million in the investments in securities portfolio and Ps.7,764 million in funds available.
The breakdown of interest income for 4Q13 is as follows: loan portfolio, which is considered the main source of recurring income, accounts for 76.6%; investment in securities 15.2%; and other items 8.2%.
The evolution of the loan portfolio continues to show a steady positive trend, underscored by diversification across segments and growth in all core businesses, despite the economic slowdown in Mexico observed during 2013
4Q.13 | EARNINGS RELEASE | 13
Loan Portfolio
The total loan portfolio rose YoY by 12.6%, or Ps.44,249 million, to Ps.394,932 million in 4Q13. On a sequential basis, the total loan portfolio increased 4.3%, or Ps.16,137 million. This YoY increase reflects organic growth of 9.3%, as well as the positive contribution from the November 2013 acquisition of ING’s mortgage business (now Santander Vivienda) which added Ps.11,694 million to Santander Mexico’s portfolio, of which Ps.11,287 million corresponds to mortgages and Ps.407 million to commercial loans. In this context, strategic segments, specifically SMEs and mortgages, grew above market, while the credit card and consumer segment reflected our prudent risk management policies given the economic slowdown during the year.
| Grupo Financiero Santander Mexico | | | | | | | |
| Loan Portfolio Breakdown | | | | | | | | |
| Millions of Mexican Pesos | 4Q13 | % | | 3Q13 | % | | 4Q12 | % |
| | | | | | | | | |
| Commercial | 190,149 | 48.1% | | 198,343 | 52.4% | | 175,736 | 50.1% |
| Government | 37,487 | 9.5% | | 29,994 | 7.9% | | 38,709 | 11.0% |
| Consumer | 66,609 | 16.9% | | 65,400 | 17.3% | | 61,604 | 17.6% |
| Credit cards | 39,009 | 9.9% | | 37,975 | 10.0% | | 36,230 | 10.3% |
| Other consumer | 27,600 | 7.0% | | 27,424 | 7.2% | | 25,374 | 7.2% |
| Mortgages | 86,644 | 21.9% | | 74,297 | 19.6% | | 68,542 | 19.5% |
| Total Performing Loan | 380,889 | 96.4% | | 368,033 | 97.2% | | 344,590 | 98.3% |
| | | | | | | | | |
| Commercial | 7,280 | 1.8% | | 5,608 | 1.5% | | 1,523 | 0.4% |
| Government | 0 | 0.0% | | 0 | 0.0% | | 0 | 0.0% |
| Consumer | 2,696 | 0.7% | | 2,668 | 0.7% | | 2,236 | 0.6% |
| Credit cards | 1,071 | 0.3% | | 1,372 | 0.4% | | 1,071 | 0.3% |
| Other consumer | 1,626 | 0.4% | | 1,296 | 0.3% | | 1,165 | 0.3% |
| Mortgages | 4,067 | 1.0% | | 2,485 | 0.7% | | 2,334 | 0.7% |
| Total Non-Performing Loan | 14,043 | 3.6% | | 10,761 | 2.8% | | 6,093 | 1.7% |
| | | | | | | | | |
| Total Loan Portfolio | 394,932 | 100.0% | | 378,794 | 100.0% | | 350,683 | 100.0% |
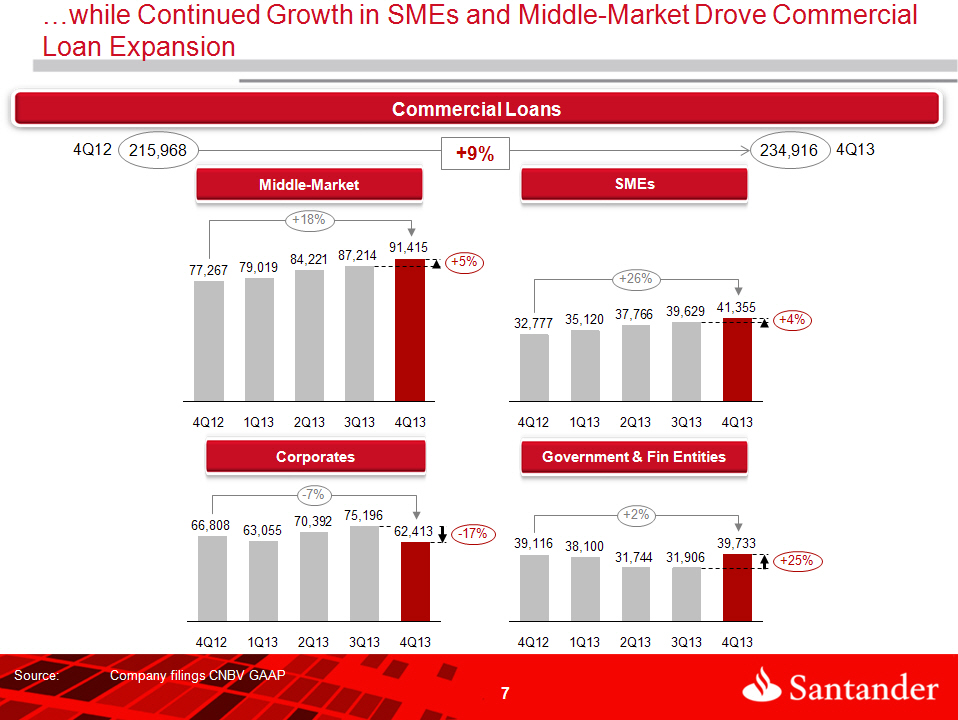
The Commercial Portfolio is comprised of loans to business and commercial entities, as well as loans to government entities and financial institutions, and represents 59.5% of the total loan portfolio. Excluding loans to government entities, the commercial loan portfolio accounted for 50.0% of the total loan portfolio. As of 4Q13, commercial loans increased 8.8% YoY, principally reflecting the 26.2% and 18.3% increases in SMEs and the middle market segment, respectively, while loans to corporates decreased 6.6%. On a sequential basis, the commercial loan portfolio increased 0.4%, principally reflecting the 17.0% decline in the corporates portfolio, while middle-market and SMEs continue to perform well with increases of 4.8% and 4.4%, respectively.
The Individual Loan Portfolio comprised of mortgages, consumer and credit card loans, represents 40.5% of the total loan portfolio. Credit card, consumer and mortgage loans represent 10.1%, 7.4%, and 23.0% of the total loan portfolio, respectively, and increased YoY by 7.4%, 10.1%, and 28.0%, respectively. Our mortgage loan strategy focuses on targeting the middle income and residential segments, and was further supported this quarter with the acquisition of the ING Hipotecaria’s mortgage business (now Santander Vivienda). Consumer loans increased 1.8% sequentially, with a 1.9% increase in credit card loans, while the rest of the consumer loan portfolio grew 1.8%, reflecting a conservative pace aligned to our prudent risk management policies given the economic slowdown during the year.
4Q.13 | EARNINGS RELEASE | 14
Interest Expense
Interest expense decreased 21.4%, or Ps.1,168 million, to Ps.4,279 million in 4Q13, from Ps.5,447 million in 4Q12, mainly driven by decreases of Ps.1,016 million in interest expense on sale and repurchase agreements and Ps.388 million on term deposits, which more than offset the increase of Ps.267 million in interest paid on demand deposits.
On a sequential basis, interest expense decreased Ps.274 million, mainly reflecting a lower average volume of time deposits. Average interest-bearing liabilities increased Ps.14,975 million, or 2.6%, mainly explained by a Ps.15,574 million increase in demand deposits and a Ps.6,019 million increase in bank and other loans, which were partially offset by a Ps.9,850 million decrease in term deposits.
The average interest rate on interest-bearing liabilities declined to 2.89% in 4Q13, or 74 bps from 3.63% in 4Q12, and by 27 bps from 3.16% in 3Q13.
The Ps.4,279 million in interest expenses paid in 4Q13 is broken down as follows: sale and repurchase agreements 41.2%, time deposits 26.4%, demand deposits 18.1%, credit instruments issued 7.3% and interbank loans 6.8% and subordinated debentures 0.2%.
Total deposits at the end of 4Q13 amounted to Ps.404,668 million, representing increases of 11.6% YoY and 3.9% QoQ. Santander Mexico continues to implement its strategy of enhancing customer service in accordance with the needs of each segment. Additionally, the introduction of campaigns for SMEs and middle-market segments, as well as of new investment products targeted to middle and high-income clients, largely contributed to this performance. As of 4Q13, demand deposits reached Ps.257,892 million, an increase of 22.3% YoY and 7.0% sequentially. Total time deposits reached Ps.146,776 million, a decrease of 3.1% YoY and 1.2% QoQ.
Interest expense on demand deposits amounted to Ps.775 million during 4Q13, representing a YoY increase of 52.6% and a sequential decrease of 5.0%. The YoY increase in 4Q13 was mainly driven by a higher average balance in demand deposits, combined with a 17 bps increase in the average interest rate paid.
Interest paid on time deposits declined 25.6% YoY to Ps.1,130 million. On a sequential basis, interest paid on time deposits decreased 13.3%. The YoY decrease reflects a decrease in average volume together with a 81 bps decrease in average interest rate paid.
4Q.13 | EARNINGS RELEASE | 15
Asset Quality
Non-performing loans (NPL) at the end of 4Q13 increased YoY by Ps.7,950 million, or 130.5%, to Ps.14,043 million, and QoQ by 30.5%, or Ps.3,282 million. The breakdown of the non-performing loan portfolio is as follows: commercial loans 51.8%, consumer loans 19.2%, and mortgage loans 29.0%.
The YoY increase in non-performing loans primarily reflects growth of the loan portfolio, particularly the higher participation of consumer loans, credit card loans, mortgage loans and SMEs loans in the overall mix. On a sequential basis, commercial and mortgage loans reported the highest increase in non-performing loans, reflecting the exposure to the homebuilder sector and the recent acquisition of ING’s mortgage portfolio (now Santander Vivienda).
| Grupo Financiero Santander Mexico | | | | | |
| Asset Quality | | | | | | |
| | | | | | | |
| Millions of Mexican Pesos | | | | | Change % |
| | 4Q13 | 3Q13 | 4Q12 | | QoQ | YoY |
| Total Loans | 394,932 | 378,795 | 350,683 | | 4.26 | 12.62 |
| Performing Loans | 380,889 | 368,034 | 344,590 | | 3.49 | 10.53 |
| Non-performing Loans | 14,043 | 10,761 | 6,093 | | 30.50 | 130.48 |
| | | | | | | |
| Allowance for loan losses | (16,222) | (15,779) | (11,580) | | 2.81 | 40.09 |
| | | | | | | |
| Non-performing loan ratio | 3.56% | 2.84% | 1.74% | | 71bps | 182bps |
| Coverage ratio | 115.5 | 146.6 | 190.1 | | (3,111)bps | (7,454)bps |
The NPL ratio in 4Q13 was 3.56%, a 182 bps increase from the 1.74% level reported in 4Q12 and 72 bps above the 2.84% achieved in 3Q13. The NPL ratio reported in 4Q13 continues to reflect our exposure to the homebuilders, with non-performing loans of Ps.4,265 million, as well as the effect from the recent acquisition of the ING mortgage portfolio (now Santander Vivienda), which had non-performing loans of Ps.1,527 million. Excluding the impact of the homebuilders and the ING portfolio, the NPL ratio for 4Q13 and 3Q13 would have been 2.15% and 1.97%, respectively. However, this NPL ratio levels continue to show Santander Mexico’s stringent credit scoring model and ongoing monitoring of the quality of its loan portfolio, which allows to adjust the origination policies according to the performance of the portfolio.
The coverage ratio for the quarter decreased to 115.5%, from 190.1% in 4Q12 and 146.6% in 3Q13.
4Q.13 | EARNINGS RELEASE | 16
During 4Q13, provisions for loan losses amounted to Ps.3,598 million, which represented increases of Ps.650 million, or 22.0%, YoY and Ps.496 million, or 16.0%, on a sequential basis. The YoY and QoQ growth was partially driven by the introduction of the expected losses methodology for provisions in the commercial loan portfolio, as required by CNBV, which is more stringent and requires higher levels of provisioning, as well as the impact from the loss of a significant payroll portfolio, that resulted in a reduction in payroll accounts and increasing collection risk of previously granted payroll loans thus requiring higher provisions.
4Q.13 | EARNINGS RELEASE | 17
Commission and Fee Income (Net)
| Grupo Financiero Santander Mexico | | | | | | |
| Net Commission and Fee Income | | | | | | |
| Millions of Mexican Pesos | | | | | | | | | |
| | | | | | % Change | | | % Change |
| Commission and fee income | 4Q13 | 3Q13 | 4Q12 | | QoQ | YoY | 2013 | 2012 | 13/12 |
| Credit and debit cards | 1,225 | 1,129 | 1,194 | | 8.5 | 2.6 | 4,463 | 4,010 | 11.3 |
| Cash management | 198 | 199 | 181 | | (0.5) | 9.4 | 746 | 707 | 5.5 |
| Collection and payment services | 405 | 402 | 350 | | 0.7 | 15.7 | 1,597 | 1,433 | 11.4 |
| Investment fund management | 323 | 334 | 328 | | (3.3) | (1.5) | 1,310 | 1,433 | (8.6) |
| Insurance | 897 | 882 | 856 | | 1.7 | 4.8 | 3,437 | 3,049 | 12.7 |
| Capital markets and securities activities | 181 | 173 | 153 | | 4.6 | 18.3 | 710 | 621 | 14.3 |
| Checks | 83 | 76 | 91 | | 9.2 | (8.8) | 323 | 356 | (9.3) |
| Foreign trade | 142 | 131 | 130 | | 8.4 | 9.2 | 572 | 527 | 8.5 |
| Financial advisory services | 340 | 391 | 369 | | (13.0) | (7.9) | 1,463 | 1,442 | 1.5 |
| Other commissions and fees | 204 | 177 | 206 | | 15.3 | (1.0) | 743 | 790 | (5.9) |
| Total | 3,998 | 3,894 | 3,858 | | 2.7 | 3.6 | 15,364 | 14,368 | 6.9 |
| | | | | | | | | | |
| Commission and fee expense | | | | | | | | | |
| Credit and debit cards | (273) | (247) | (286) | | (10.5) | 4.5 | (966) | (1,325) | 27.1 |
| Investment fund management | (12) | (16) | (16) | | 25.0 | 25.0 | (61) | (62) | 1.6 |
| Insurance | (35) | (26) | (27) | | (34.6) | (29.6) | (114) | (96) | (18.8) |
| Capital markets and securities activities | (62) | (20) | (40) | | (210.0) | (55.0) | (176) | (161) | (9.3) |
| Checks | (9) | (8) | (10) | | (12.5) | 10.0 | (33) | (37) | 10.8 |
| Foreign trade | 0 | 0 | (13) | | 0.0 | 100.0 | (7) | (34) | 79.4 |
| Financial advisory services | (4) | (8) | (9) | | 50.0 | 55.6 | (99) | (44) | (125.0) |
| Other commissions and fees | (293) | (268) | (230) | | (9.3) | (27.4) | (1,027) | (766) | (34.1) |
| Total | (688) | (593) | (631) | | (16.0) | (9.0) | (2,483) | (2,525) | 1.7 |
| | | | | | | | | | |
| Commission and Fee Income, net | 3,310 | 3,301 | 3,227 | | 0.3 | 2.6 | 12,881 | 11,843 | 8.8 |
In 4Q13, net commission and fee income totaled Ps.3,310 million, representing a YoY increase of 2.6%, or Ps.83 million. This improvement principally reflects the following YoY increases: 15.7%, or Ps.55 million, in collections and payments services; 4.8%, or Ps.44 million, in credit and debit cards fees; and 4.0%, or Ps.33 million in insurance brokerage fees.
Compared to 3Q13, net commission and fee income increased 0.3%, or Ps.9 million, mainly reflecting the following sequential increases: 7.9%, or Ps.70 million in credit and debit cards fees; and 0.7%, or Ps.6 million in insurance brokerage fees.
For FY13, net commission and fee income increased 8.8% YoY, or Ps.1,038 million, to Ps.12,881 million.
4Q.13 | EARNINGS RELEASE | 18
Net gain (loss) on financial assets and liabilities
| Grupo Financiero Santander Mexico | | | | | | |
| Net gain (loss) on financial assets and liabilities | | | | | | |
| Millions of Mexican Pesos | | | | | % Change | | | % Change |
| | 4Q13 | 3Q13 | 4Q12 | | QoQ | YoY | 2013 | 2012 | 13/12 |
| Valuation | | | | | | | | | |
| Foreign currencies | (2) | (187) | 6 | | 98.9 | (133.3) | (36) | (75) | 52.0 |
| Derivatives | (701) | 865 | (993) | | (181.0) | 29.4 | (4,084) | (997) | (309.6) |
| Shares | 102 | 66 | 342 | | 54.5 | (70.2) | (483) | 451 | (207.1) |
| Debt instruments | (47) | 37 | (900) | | (227.0) | 94.8 | 383 | 126 | 204.0 |
| Subtotal | (648) | 781 | (1,545) | | (183.0) | 58.1 | (4,220) | (495) | (752.5) |
| | | | | | | | | | |
| Trading | | | | | | | | | |
| Foreign currencies | (446) | 110 | (435) | | (505.5) | (2.5) | (58) | 94 | (161.7) |
| Derivatives | 1,001 | (262) | 1,294 | | 482.1 | (22.6) | 7,845 | 983 | 698.1 |
| Shares | 304 | 15 | 307 | | 1,926.7 | (1.0) | 199 | 1,028 | (80.6) |
| Debt instruments | (109) | (89) | 792 | | (22.5) | (113.8) | (752) | 579 | (229.9) |
| Subtotal | 750 | (226) | 1,958 | | 431.9 | (61.7) | 7,234 | 2,684 | 169.5 |
| | | | | | | | | | |
| Total | 102 | 555 | 413 | | (82) | (75) | 3,014 | 2,189 | 37.7 |
In 4Q13, Santander Mexico recorded a net gain on financial assets and liabilities of Ps.102 million, compared with a net gain of Ps.413 million in 4Q12 and a net gain of Ps.555 million in 3Q13. The net gain on financial assets and liabilities in 4Q13 is mainly explained by a valuation loss of Ps.648 million principally related to derivatives and debt instruments, which were more than offset by Ps.750 million in trading gains, principally related to derivatives and shares instruments.
The Ps.648 million loss in valuation in 4Q13, was principally driven by derivatives and debt instruments, which reported negative results of Ps.701 million and Ps.47 million, respectively. These losses were, partially offset by gains in shares instruments, which amounted to Ps.102 million.
The Ps.750 million trading gain, was mainly explained by gains in derivatives and shares instruments of Ps.1,001 million and Ps.304 million, respectively. These gains were partially offset by losses of Ps.446 million in foreign currencies and Ps.109 million in debt instruments.
4Q.13 | EARNINGS RELEASE | 19
Other Operating Income (Expense)
| Grupo Financiero Santander Mexico | | | | | | |
| Other Operating Income (Expense) | | | | | | |
| Millions of Mexican Pesos | | | | | % Change | | | % Change |
| | 4Q13 | 3Q13 | 4Q12 | | QoQ | YoY | 2013 | 2012 | 13/12 |
| Recoveries of loans previously charged-off | 661 | 493 | 440 | | 34.1 | 50.2 | 2,155 | 1,805 | 19.4 |
| Income from sale of fixed assets | 2 | 3 | 8 | | (33.3) | (75.0) | 5 | 1,740 | (99.7) |
| Allowance for loan losses released | 0 | 0 | 0 | | 0.0 | 0.0 | 0 | 378 | (100.0) |
| Cancellation of liabilities and reserves | 61 | 80 | 46 | | (23.8) | 32.6 | 292 | 201 | 45.3 |
| Interest on personnel loans | 29 | 30 | 33 | | (3.3) | (12.1) | 122 | 123 | (0.8) |
| Foreclosed assets reserve | (29) | 4 | (13) | | (825.0) | (123.1) | (38) | (42) | 9.5 |
| Profit from sale of foreclosed assets | 50 | 44 | 35 | | 13.6 | 42.9 | 162 | 147 | 10.2 |
| Technical advisory services | 24 | 18 | 45 | | 33.3 | (46.7) | 93 | 190 | (51.1) |
| Portfolio recovery legal expenses and costs | (163) | (116) | (180) | | (40.5) | 9.4 | (507) | (611) | 17.0 |
| Write-offs and bankruptcies | (231) | (108) | (206) | | (113.9) | (12.1) | (621) | (805) | 22.9 |
| Provision for legal and tax contingencies | (60) | (57) | (74) | | (5.3) | 18.9 | (145) | (272) | 46.7 |
| IPAB (indemnity) provisions and payments | (1) | (2) | (2) | | 50.0 | 50.0 | (9) | (37) | 75.7 |
| Other | 64 | 60 | 77 | | 6.7 | (16.9) | 217 | 226 | (4.0) |
| | | | | | | | | | |
| Other Operating Income (Expense) | 407 | 449 | 209 | | (9.4) | 94.7 | 1,726 | 3,043 | (43.3) |
In 4Q13, other operating income increased to Ps.407 million from Ps.209 million in 4Q12, mainly due to a Ps.221 million or 50.2% increase in recoveries from the written-off portfolio. Sequentially, other income in 4Q13 decreased Ps.42 million from Ps.449 million in 3Q13.
For FY13, other net operating income decreased to Ps.1,726 million, compared with Ps.3,043 million in FY12. This decline is mainly explained by the Ps.1,740 million non-recurring gain from the sale and leaseback of the 220 branches which was reported in 2Q12 and the release of allowances for loan losses in 1Q12 for Ps.378 million.
4Q.13 | EARNINGS RELEASE | 20
Administrative and Promotional Expenses
Administrative and promotional expenses consist of personnel costs such as payroll and benefits, promotion and advertising expenses, and other general expenses. Personnel expenses consist mainly of salaries, social security contributions, bonuses and our long-term incentive plan for our executives. Other general expenses mainly consist of: expenses related to technology and systems, administrative services, which are mainly services outsourced in the areas of information technology, taxes and duties, professional fees, contributions to IPAB, rental of properties and hardware, advertising and communication, surveillance and cash courier services and expenses related to maintenance, conservation and repair, among others.
| Grupo Financiero Santander Mexico | | | | | | |
| Administrative and Promotional Expenses | | | | | | |
| Millions of Mexican Pesos | | | | | % Change | | | % Change |
| | 4Q13 | 3Q13 | 4Q12 | | QoQ | YoY | 2013 | 2012 | 13/12 |
| Salaries and employee benefits | 2,318 | (277) | 2,326 | | 936.8 | (0.3) | 6,783 | 8,683 | (21.9) |
| Credit card operation | 54 | 65 | 79 | | (16.9) | (31.6) | 260 | 256 | 1.6 |
| Professional fees | 227 | 113 | 239 | | 100.9 | (5.0) | 501 | 598 | (16.2) |
| Leasehold | 327 | 369 | 357 | | (11.4) | (8.4) | 1,415 | 1,261 | 12.2 |
| Promotional and advertising expenses | 208 | 144 | 337 | | 44.4 | (38.3) | 589 | 662 | (11.0) |
| Taxes and duties | 395 | 307 | 407 | | 28.7 | (2.9) | 1,236 | 1,080 | 14.4 |
| Technology services (IT) | 633 | 521 | 467 | | 21.5 | 35.5 | 2,194 | 1,803 | 21.7 |
| Depreciation and amortization | 406 | 404 | 405 | | 0.5 | 0.2 | 1,619 | 1,541 | 5.1 |
| Contributions to bank savings protection system (IPAB) | 415 | 397 | 355 | | 4.5 | 16.9 | 1,544 | 1,342 | 15.1 |
| Cash protection | 155 | 155 | 189 | | 0.0 | (18.0) | 605 | 566 | 6.9 |
| Other services and expenses | 592 | 539 | 835 | | 9.8 | (29.1) | 2,323 | 2,348 | (1.1) |
| | | | | | | | | | |
| Total Administrative and Promotional Expenses | 5,730 | 2,737 | 5,996 | | 109.4 | (4.4) | 19,069 | 20,140 | (5.3) |
Administrative and promotional expenses in 4Q13 amounted to Ps.5,730 million. Expenses in 4Q13 reflect a net extraordinary pre-tax benefit of Ps.199 million related to the mandatory regulatory change in legal criteria regarding employee profit sharing future payments that occurred in 3Q13. Administrative and promotional expenses declined by 4.4% YoY, or Ps.266 million. Additionally, the adoption in 2013 of an internal initiative to normalize the booking of expenses throughout the year remained in place. Adjusting for the Ps.199 million extraordinary benefit in 4Q13 and the Ps.571 million adjustment in 4Q12 for the normalization in the booking in expenses, administrative and promotional expenses would have increased by 9.3% YoY, or Ps.504 million.
On a sequential basis, excluding the aforementioned net benefit from both quarters, administrative and promotional expenses increased 7.0%, principally due to the following increases: Ps.114 million in professional fees, Ps.112 million in technology services, Ps.88 million in tax and duties and Ps.64 million in promotional and advertising expenses. These increases were partially offset by the following decreases: a Ps.42 million decrease in leaseholds and Ps.11 million decrease in credit card operation.
4Q.13 | EARNINGS RELEASE | 21
Excluding the aforementioned items, which affected expenses in 3Q13 and 4Q13, the efficiency ratio for 4Q13 was 41.1%, which compares to 39.5% in 4Q12 and 39.9% in 3Q13, while the recurrence ratio was 63.0%, below the 63.7% reported in 4Q12 and the 64.1% 3Q13.
Reported efficiency and recurrence in 4Q13 were 35.5% and 73.8%, respectively.
For FY13, administrative and promotional expenses decreased 5.3% to Ps.19,069 million compared with FY12. Excluding the net extraordinary pre-tax benefit of Ps.3,002 million related to the mandatory regulatory change in legal criteria regarding employee profit sharing future payments, FY13 administrative and promotional expenses would have increased 9.6%, or Ps.1,933 million to Ps.22,071 million compared with FY12. This increase is mainly explained by higher: personnel expenses, leaseholds, technology and tax and duties.
Current and Deferred Taxes
Current and deferred income taxes in 4Q13 recorded a Ps.293 million tax credit compared to a Ps.475 million expense in 4Q12, and a Ps.1,762 expense million reported in 3Q13. The tax credit reported in 4Q13 resulted from a Ps.1,074 million benefit accounted in 2013 from advanced tax credits.
For FY13, current and deferred income taxes amounted to Ps.2,852 million, a decrease of Ps.907 million, or 24.1% from Ps.3,759 in FY12. The effective tax rate in FY13 was 13.1%; excluding the benefit from the Ps.1,074 million from advance tax credits, the tax rate would have been approximately 18.0%.
4Q.13 | EARNINGS RELEASE | 22
Capitalization and ROAE
| Banco Santander Mexico | | | | | |
| Capitalization | | | | | |
| Millions of Mexican Pesos | 4Q13 | | 3Q13 | | 4Q12 |
| Tier 1 | 69,409 | | 81,439 | | 74,618 |
| Tier 2 | 17,122 | | 225 | | 1,579 |
| Total Capital | 86,531 | | 81,664 | | 76,197 |
| | | | | | |
| Risk-Weighted Assets | | | | | |
| Credit Risk | 347,027 | | 338,493 | | 320,268 |
| Credit, Market, and Operational Risk | 543,725 | | 520,638 | | 515,583 |
| | | | | | |
| Credit Risk Ratios: | | | | | |
| Tier 1 (%) | 20.0 | | 24.1 | | 23.3 |
| Tier 2(%) | 4.9 | | 0.0 | | 0.5 |
| Capitalization Ratio (%) | 24.9 | | 24.1 | | 23.8 |
| | | | | | |
| Total Capital Ratios: | | | | | |
| Tier 1(%) | 12.8 | | 15.6 | | 14.5 |
| Tier 2 (%) | 3.1 | | 0.0 | | 0.3 |
| Capitalization Ratio (%) | 15.9 | | 15.7 | | 14.8 |
Banco Santander (Mexico)’s preliminary capital ratio at period end 4Q13 was 15.9%, compared to 14.8% at period end 4Q12 and 15.7% at period end 3Q13.
The 15.9% capital ratio is comprised of 12.8% Tier 1 and 3.1% Tier 2, as a result of our recent Basel III Tier 2 compliant subordinated notes issuance and the dividend payment.
As of November 2013, Banco Santander Mexico is classified within Category 1 in accordance with Article 134bis of the Mexican Banking Law, and remains in this category as per the preliminary results dated December 2013, which is the most recent available analysis.
4Q13 ROAE was 21.7%, versus 19.1% in 4Q12 and 19.8% in 3Q13. Excluding non-comparable items in 4Q13, and the ones reported in previous quarters, normalized ROAE for 4Q12 and 4Q13 would have been 17.9% and 17.0%, respectively.
4Q.13 | EARNINGS RELEASE | 23
RELEVANT EVENTS & REPRESENTATIVE ACTIVITIES AND TRANSACTIONS
Inclusion of Santander Mexico in the IPC Sustainability Index
On January 15, 2014, the Mexican Stock Exchange announced the list of issuers that will make up the new sample of the IPC Sustainability Index, which will be effective starting February 1, 2014, and until January 31, 2015. Among the 70 issuers qualified, Santander Mexico was among the 28 issuers that exceeded the domestic average qualification level of environment, social responsibility and corporate governance, and that also met the criteria of percentage of floating shares, market value float and minimums liquidity requirements.
Santander Mexico announced that Banco Santander Mexico, its principal subsidiary completed the issuance of U.S.$1.3 billion Basel III compliant tier 2 subordinated capital notes
On December 18, 2013, Grupo Financiero Santander Mexico announced that its principal subsidiary, Banco Santander Mexico priced U.S.$1,300,000,000 aggregate principal amount of 5.95% Basel III compliant Tier 2 Subordinated Capital Notes due 2024 (the “Notes”). Santander Mexico’s parent, Banco Santander Spain, purchased U.S.$975,000,000 or 75% of the aggregate principal amount of the Notes.
Santander Mexico announced the approval of its capital optimization program
On December 13, 2013, an Ordinary and Extraordinary General Shareholders Meeting was held, at which, among other items, Santander Mexico approved: i) advancing payment to its shareholders of the cash dividend from retained earnings in the amount of Ps.4,900 million, or Ps.0.72 per share, previously approved at its Shareholders’ Meeting held on August 20, 2013, to December 27, 2013 from the original date of February 25, 2014; and ii) payment of a cash dividend from retained earnings to its shareholders in the total amount of Ps.12,000 million, or approximately Ps.1.77 per share, to be paid on December 27, 2013. Separately, an Ordinary and Extraordinary General Shareholders Meeting of its subsidiary Banco Santander (Mexico), S.A. Institución de Banca Multiple, Grupo Financiero Santander Mexico was held, at which the Bank authorized the issuance of subordinated notes that comply with capital requirements under Basel III for Tier 2 capital in an aggregate amount of approximately U.S.$1,000 million, subject to market conditions and regulatory approvals.
As a result, on December 27, 2013 Santander Mexico paid its shareholders a total dividend of Ps.16,900 million (approximately U.S.$1,300 million based on an exchange rate of 13.0). In 2014 and subsequently thereafter, the Company expects to continue its practice of paying annual dividends equivalent to 50% of its retained earnings, although dividend payments will ultimately be subject to annual earnings and shareholders’ resolutions.
On December 13, 2013, separately an Ordinary and Extraordinary General Shareholders Meeting was held, at which the Bank authorized the issuance of subordinated notes that comply with capital requirements under Basel III for Tier 2 capital in an aggregate amount of approximately U.S.$1,000 million, subject to market conditions and regulatory approvals.
4Q.13 | EARNINGS RELEASE | 24
Sale of Grupo Financiero Santander Mexico’s shares in the capital of Gestión Santander
On December 05, 2013, Grupo Financiero Santander Mexico announced that, upon receipt of the required regulatory approvals and authorizations, it sold its share ownership in Gestión Santander, S.A. de C.V., Sociedad Operadora de Sociedades de Inversión, Grupo Financiero Santander Mexico (“Gestión Santander”), in accordance with the previously disclosed May 2013 agreement with its parent company, Banco Santander, S.A., to grow its parent company’s asset management division.
As a result of this transaction, Warburg Pincus and General Atlantic indirectly hold 50% of the equity of Gestión Santander and the remaining 50% is indirectly hold by Banco Santander Spain. The transaction was valued at Ps.3,179 million, which implied a net capital gain for Santander Mexico of Ps.1,927 million. The valuation was determined to be at a market price by an independent expert.
This transaction resulted in the divestiture of Gestión Santander from Santander Mexico. Additionally, the Company entered into exclusive, long-term distribution agreements so that Banco Santander (Mexico) S.A., Santander Mexico as well as Casa de Bolsa Santander, S.A. de C.V., Grupo Financiero Santander Mexico, can continue to offer mutual funds managed by Gestión Santander to its customers following the divestiture.
Santander Mexico launched Access Card, a credit card that provides SME entrepreneurs with several important value-added benefits
On December 3, 2013, Santander Mexico launched the first credit card in Mexico designed especially for entrepreneurs who run small businesses. In partnership with Visa, this new card solves two of the main problems in this segment: the need for short-term financing of recurring expenses and the need to separate personal costs from business costs.
Access is the first Platinum credit card for SMEs and Entrepreneurs in Mexico, and its main objective is to support the segment’s financing and development. Banco Santander México has defined SMEs as a core strategic business and has positioned itself as the leading financial institution in that segment.
Acquisition of ING Group’s mortgage business in Mexico
On November 29, 2013, Grupo Financiero Santander Mexico completed the acquisition of the equity stock of ING Hipotecaria, S.A. de C.V., Sociedad Financiera de Objeto Múltiple, Entidad No Regulada (“ING Hipotecaria”), a subsidiary of ING Group (“ING”), as announced on June 14, 2013.
Upon receipt of all required regulatory approvals and authorizations for the acquisition, Banco Santander Mexico purchased ING Hipotecaria for Ps.541.4 million (approximately US$41.4 million) in cash.
Organizational Changes
With the aim of strengthening the exchange of global best practices and having the best governing body, for many years our Group has maintained an active policy of international mobility. In this context, the following organizational changes has occurred:
4Q.13 | EARNINGS RELEASE | 25
Juan Moreno, who for the past three years held the position of Vice President of Commercial Banking at Santander Mexico, has been appointed as new Head of Commercial Banking at Banco Santander Brazil. During this period, his leadership has been decisive in building the best commercial banking franchise in Mexico.
We have initiated a new stage in the consolidation of our commercial business franchise, now under the leadership of Javier Hidalgo as Vice Chairman of Commercial Banking. Prior to joining Santander Mexico, he was Deputy General Director (director general adjunto) of Banco Santander responsible for individual banking in the new Commercial Banking division. He joined Santander Group in January 1992, where he has held several positions in the areas of Global Corporate Banking, Commercial Banking in Spain and in the American Division, where he was responsible for the development of new business for corporates and institutions, and was also country head in Puerto Rico.
Jose Carlos Avila, who had a distinguished career for eleven years as Deputy General Director of Credit, has taken new responsibilities in Santander Spain in Corporate Risk Management Division.
Roberto d'Empaire Muskus has been designated as Deputy General Director of Credit and who incorporates to Santander Mexico. He developed his banking career in his native Venezuela and most recently in the General Risk Direction, where he held the position of Commercial Risk Director, in addition to being a member of the Board of Banco Santander de Negocios Colombia.
Outstanding transactions
The following are the outstanding transactions of Santander Mexico as underwriter during this quarter:
Second Debt Issuance of CFE (Comisión Federal de Electricidad), the issuance amounted to Ps.10,000 million under a dual-tranche modality with maturity terms of 5 and 10 years at a ten-year fixed rate.
Debt Issuance of Cultiba Santander México acted as joint underwriter of Cultiba’s 5-year, Ps.1,200 million debt issuance in the local market.
Tenth Debt Issuance of GDF (Gobierno del Distrito Federal), the issuance amounted to Ps.2,126 million with a maturity term of 10 years in the local market.
Second Debt Issuance of PEMEX The issuance amounted to Ps.9,600 million under a dual-tranche modality with maturity terms of 5 and 10 years in the local market.
Debt Issuance of Fibra Uno The issuance amounted to Ps.8,500 million and was issued under a multi-tranche modality with maturity terms of 5.5, 10 and 15 years.
Debt Issuance of Oaxaca’s State Government the issuance amounted to Ps.1,200 with maturity term of 15-year, and a AAA Local Scale rating.
Initial Public Offering of Grupo LALA Santander participated as Local Joint Bookrunner in Grupo LALA’s S.A.B. de C.V., Initial Public Offering (IPO) for Ps.1,124 million at Ps.27.50 per share, and which was allocated as follows: 57% in the international markets and 43% in the local market.
4Q.13 | EARNINGS RELEASE | 26
AWARDS & RECOGNITION
"Best Bank in Mexico 2013" by Latin Finance
On November 10, 2013, the prestigious Latin Finance magazine awarded Banco Santander as “Best Bank in Mexico,” which follows on another similar award granted by Euromoney in June 2013.
Santander’s Private Banking Recognized by The Banker and Private Banker International
On November 7, 2013, The Banker and Private Banker International magazines recognized Santander’s Private Banking as “The Best Private Bank in Latin America”. Additionally, The Banker has recognized Santander Mexico’s private banking units with the title of “Highly Commented” under the category of “Best Private Bank 2013”.
Santander’s Client Service Ombudsman Department Receives 2013 CSR Best Practices Award
On October 23, 2013. Santander México’s Client Service Ombudsman Department was recognized for Best Practices in Corporate Social Responsibility (CSR) for 2013 in the category of “Business Ethics,” as granted by the Mexican Center for Philanthropy (Cemefi), the Alliance for Social Responsibility in Mexico (AliaRSE) and the Network SumaRSE.
4Q.13 | EARNINGS RELEASE | 27
RATING CONFIRMATION BY STANDARD AND POOR’S, MOODY’S and FITCH RATINGS
On December 20, 2013 Standard and Poor's revised the Long Term Global rating for local and foreign currency and upgraded it from "BBB" to "BBB+", while the Short Term rating remains in "A-2".
December 17, 2013 Moody’s affirmed Banco Santander (Mexico)'s ratings with stable outlook. Long Tem Global rating remains in "Baa1" and "P-2" in short term.
CREDIT RATINGS
| Banco Santander Mexico | | | | | |
| Ratings | | | | | |
| | Standard & Poor´s | | Moody´s | | Fitch Ratings |
| Global Scale | | | | | |
| Foreign Currency | | | | | |
| Long Term | BBB+ | | Baa1 | | BBB+ |
| Short Term | A-2 | | P-2 | | F2 |
| | | | | | |
| Local Currency | | | | | |
| Long Term | BBB+ | | A3 | | BBB+ |
| Short Term | A-2 | | P-2 | | F2 |
| | | | | | |
| National Scale | | | | | |
| Long Term | mxAAA | | Aaa.mx | | AAA(mex) |
| Short Term | mxA-1+ | | Mx-1 | | F1+(mex) |
| | | | | | |
| Autonomous Credit Profile (SACP) | bbb+ | | - | | - |
| Rating viability (VR) | - | | - | | bbb+ |
| Support | - | | - | | 2 |
| Financial Strength | - | | C- | | - |
| Standalone BCA | - | | baa1 | | - |
| Outlook | Stable | | Stable | | Stable |
| | | | | | |
| Last publication: | 20-Dec-13 | | 17-Dec-13 | | 28-May-13 |
| | | | | | |
| Brokerage - Casa de Bolsa Santander | |
| Ratings | | | | |
| | Moody´s | | Fitch Ratings | |
| Global Scale | | | | |
| National Scale | | | | |
| Long Term | A3 | | _ | |
| Short Term | Prime-2 | | _ | |
| | | | | |
| National Scale | | | | |
| Long Term | Aaa.mx | | AAA(mex) | |
| Short Term | Mx-1 | | F1+(mex) | |
| | | | | |
| Outlook | Stable | | Stable | |
| | | | | |
| Last publication: | 17-Dec-13 | | 28-May-13 | |
4Q.13 | EARNINGS RELEASE | 28
4Q13 EARNINGS CALL DIAL-IN INFORMATION
| Date: | Friday, January 31, 2014 |
| Time: | 10 AM (MCT); 11 AM (US ET) |
| | |
| Dial-in Numbers: | 1-888-740-6137 US & Canada; 1-913-312-1507 International & Mexico |
| | |
| Access Code: | 3531096 |
| | |
| Webcast: | https://viavid.webcasts.com/starthere.jsp?ei=1028405 |
| | |
| Replay: | Starting Friday, January 31, 2014 at 2 PM US ET, and ending on Friday, February 7, 2014 at 11:59pm US ET |
| | |
| | Dial-in number: 1-877-870-5176 US & Canada; 1-858-384-5517 International & Mexico |
| | |
| | Access Code: 3531096 |
ANALYST COVERAGE
Actinver, Bank of America Merrill Lynch, Barclays, BBVA Bancomer, Citi, Credit Suisse, Deutsche Bank, EVA Dimensions, GBM, Goldman Sachs, HSBC, Independent Research, Interacciones, JP Morgan, Morgan Stanley, Morningstar, Nau Securities, RBC, Scotiabank, UBS and Vector.
Santander Mexico is covered by the aforementioned analysts. Please note that any opinions, estimates or forecasts regarding the performance of Santander Mexico issued by these analysts reflect their own views, and therefore do not represent the opinions, estimates or forecasts of Santander Mexico or its management. Although Santander Mexico may refer to or distribute such statements, this does not imply that Santander Mexico agrees with or endorses any information, conclusions or recommendations included therein.
DEFINITION OF RATIOS
ROAE: Annualized net income divided by average equity (Average of 4Q13, 4Q12)
EFFICIENCY: Annualized administrative and promotional expenses divided by annualized gross operating income (before administrative and promotional expenses and net of allowances).
RECURRENCY: Annualized net fees divided by annualized administrative and promotional expenses (net of amortizations and depreciations).
NIM: Financial margin divided by daily average interest earnings assets.
4Q.13 | EARNINGS RELEASE | 29
ABOUT GRUPO FINANCIERO SANTANDER MEXICO, S.A.B. DE C.V. (NYSE: BSMX; BMV: SANMEX)
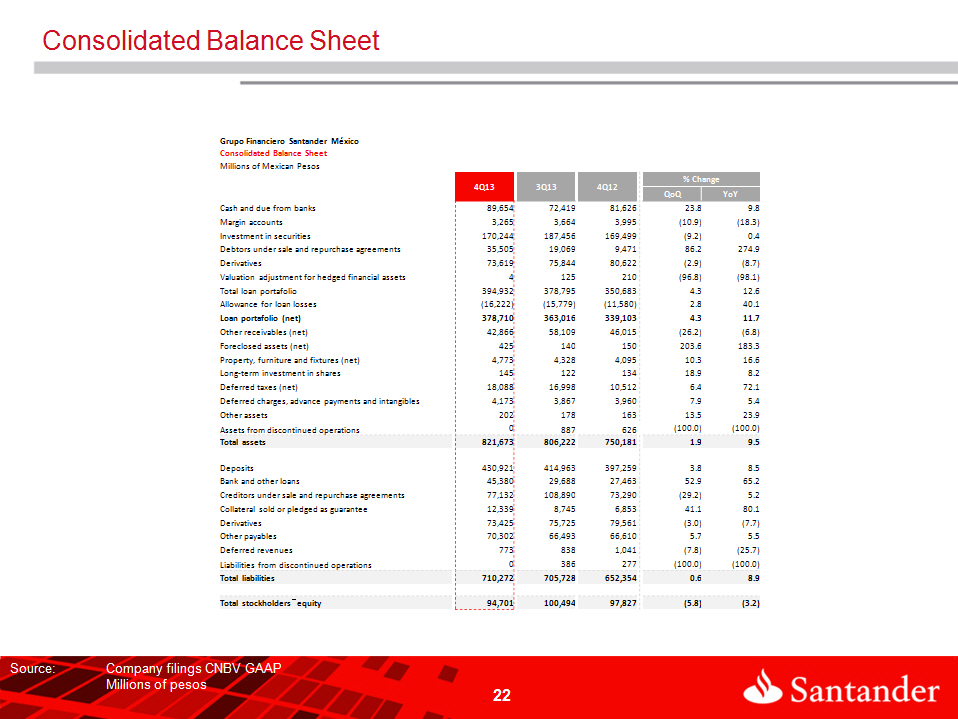
Grupo Financiero Santander Mexico, S.A.B. de C.V. (Santander Mexico), one of Mexico’s leading financial services holding companies, provides a wide range of financial and related services, including retail and commercial banking, securities brokerage, financial advisory and other related investment activities. Santander Mexico offers a multichannel financial services platform focused on mid- to high-income individuals and small- to medium-sized enterprises, while also providing integrated financial services to larger multinational companies in Mexico. As of December 31, 2013, Santander Mexico had total assets of Ps.821.8 billion under Mexican GAAP and more than 10.5 million customers. Headquartered in Mexico City, the Company operates 1,018 branches and 240 offices nationwide and has a total of 14,169 employees.
We, the undersigned under oath to tell the truth declare that, in the area of our corresponding functions, we prepared the information on Grupo Financiero Santander contained in this quarterly report, which to the best of our knowledge reasonably reflects its situation.
| MARCOS A. MARTINEZ GAVICA | | PEDRO JOSE MORENO CANTALEJO |
| Executive President and Chief Executive Officer | | Vice President of Administration and Finance |
| EMILIO DE EUSEBIO SAIZ | JESÚS GONZÁLEZ DEL REAL | JAVIER PLIEGO ALEGRÍA |
Deputy General Director of Intervention and Control Management | Executive Director – Controller | Executive Director of Internal Audit |
The financial information presented in this report has been obtained from the non-audited financial statements prepared in accordance with the General Nature Provisions applicable to Holding Corporations of Financial Groups which are subject to the supervision of the National Banking and Securities Commission on accounting procedures, published in the Federal Official Gazette on January 31, 2011. The exchange rate used to convert foreign currency transactions to pesos is Ps.13.0843.
INVESTOR RELATIONS CONTACT
Gerardo Freire Alvarado
+ 52 (55) 5269-1827 investor@santander.com.mx | www.santander.com.mx |
LEGAL DISCLAIMER
Grupo Financiero Santander Mexico cautions that this report may contain forward-looking statements within the meaning of the U.S. Private Securities Litigation Reform Act of 1995. These forward-looking statements may be found in various places throughout this report and include, without limitation, statements regarding our intent, belief, targets or current expectations in connection with: asset growth and sources of funding; growth of our fee-based business; expansion of our distribution network; our focus on strategic businesses; our compound annual growth rate; our risk, efficiency and profitability targets; financing plans; competition; impact of regulation; exposure to market risks including interest rate risk, foreign exchange risk and equity price risk; exposure to credit risks including credit default risk and settlement risk; projected capital expenditures; capitalization requirements and level of reserves; liquidity; trends affecting the economy generally; and trends affecting our financial condition and our results of operations. While these forward-looking statements represent our judgment and future expectations concerning the development of our business, a number of risks, uncertainties and other important factors could cause actual developments and results to differ materially from our expectations. These factors include, but are not limited to: changes in capital markets in general that may affect policies or attitudes towards lending to Mexico or Mexican companies; changes in economic conditions, in Mexico in particular, in the United States or globally; the monetary, foreign exchange and interest rate policies of the Mexican Central Bank (Banco de Mexico); inflation; deflation; unemployment; unanticipated turbulence in interest rates; movements in foreign exchange rates; movements in equity prices or
4Q.13 | EARNINGS RELEASE | 30

other rates or prices; changes in Mexican and foreign policies, legislation and regulations; changes in requirements to make contributions to, for the receipt of support from programs organized by or requiring deposits to be made or assessments observed or imposed by, the Mexican government; changes in taxes; competition, changes in competition and pricing environments; our inability to hedge certain risks economically; economic conditions that affect consumer spending and the ability of customers to comply with obligations; the adequacy of allowances for loans and other losses; increased default by borrowers; technological changes; changes in consumer spending and saving habits; increased costs; unanticipated increases in financing and other costs or the inability to obtain additional debt or equity financing on attractive terms; changes in, or failure to comply with, banking regulations; and certain other factors indicated in our annual report 20F. The risk factors and other key factors that we have indicated in our past and future filings and reports, including those with the U.S. Securities and Exchange Commission, could adversely affect our business and financial performance.
Note: The information contained in this report is not audited. Nevertheless, the consolidated accounts are prepared on the basis of the accounting principles and regulations prescribed by the Mexican National Banking and Securities Commission (Comisión Nacional Bancaria y de Valores) for credit institutions, as amended (Mexican Banking GAAP). All figures presented are in nominal terms. Historical figures are not adjusted for inflation.
4Q.13 | EARNINGS RELEASE | 31
Grupo Financiero Santander Mexico
| § | Consolidated Balance Sheet |
| § | Consolidated Statement of Income |
| § | Consolidated Statement of Changes in Stockholders’ Equity |
| § | Consolidated Statement of Cash Flows |
The information contained in this report and the financial statements of the Group’s subsidiaries may be consulted on the Internet website: www.santander.com.mx or through the following direct access:
http://www.santander.com.mx/ir/english/financial/quarterly.html
There is also information on Santander on the CNBV Website: www.cnbv.gob.mx
4Q.13 | EARNINGS RELEASE | 32
| Grupo Financiero Santander Mexico | | | | | | | | |
| Consolidated Balance Sheet | | | | | | | | | |
| Millions of Mexican Pesos | | | | | | | | | |
| | 2013 | | 2012 |
| | Dec | Sep | Jun | Mar | | Dec | Sep | Jun | Mar |
| Assets | | | | | | | | | |
| | | | | | | | | | |
| Cash and due from banks | 89,654 | 72,419 | 84,994 | 102,461 | | 81,626 | 74,579 | 77,019 | 60,747 |
| | | | | | | | | | |
| Margin accounts | 3,265 | 3,664 | 3,134 | 3,830 | | 3,995 | 3,817 | 4,534 | 4,187 |
| | | | | | | | | | |
| Investment in securities | 170,244 | 187,456 | 219,869 | 201,150 | | 169,499 | 202,014 | 262,863 | 269,588 |
| Trading securities | 103,503 | 127,070 | 160,761 | 158,619 | | 117,036 | 141,986 | 203,124 | 202,726 |
| Securities available for sale | 61,455 | 55,132 | 53,908 | 37,384 | | 47,373 | 54,996 | 54,764 | 61,944 |
| Securities held to maturity | 5,286 | 5,254 | 5,200 | 5,147 | | 5,090 | 5,032 | 4,975 | 4,918 |
| | | | | | | | | | |
| Debtors under sale and repurchase agreements | 35,505 | 19,069 | 8,906 | 21,148 | | 9,471 | 4,458 | 4,827 | 4,484 |
| | | | | | | | | | |
| Derivatives | 73,619 | 75,844 | 72,042 | 94,565 | | 80,622 | 89,391 | 87,859 | 71,993 |
| Trading purposes | 73,319 | 75,691 | 71,810 | 94,178 | | 80,322 | 88,947 | 87,288 | 71,278 |
| Hedging purposes | 300 | 153 | 232 | 387 | | 300 | 444 | 571 | 715 |
| | | | | | | | | | |
| Valuation adjustment for hedged financial assets | 4 | 125 | 64 | 246 | | 210 | 240 | 220 | 139 |
| | | | | | | | | | |
| Performing loan portfolio | | | | | | | | | |
| Commercial loans | 227,636 | 228,337 | 220,224 | 213,471 | | 214,445 | 211,685 | 212,492 | 198,276 |
| Commercial or business activity | 187,903 | 196,431 | 188,480 | 175,379 | | 175,329 | 175,945 | 176,332 | 163,630 |
| Financial entities loans | 2,246 | 1,912 | 779 | 451 | | 407 | 619 | 606 | 1,934 |
| Government entities loans | 37,487 | 29,994 | 30,965 | 37,641 | | 38,709 | 35,121 | 35,554 | 32,712 |
| Consumer loans | 66,609 | 65,400 | 63,464 | 61,906 | | 61,603 | 59,996 | 57,043 | 52,857 |
| Mortgage loans | 86,644 | 74,297 | 72,787 | 70,448 | | 68,542 | 66,172 | 64,417 | 62,559 |
| Total performing loan portfolio | 380,889 | 368,034 | 356,475 | 345,825 | | 344,590 | 337,853 | 333,952 | 313,692 |
| | | | | | | | | | |
| Nonperforming loan portfolio | | | | | | | | | |
| Commercial loans | 7,280 | 5,608 | 3,899 | 1,823 | | 1,523 | 1,402 | 1,313 | 1,135 |
| Commercial or business activity | 7,280 | 5,608 | 3,899 | 1,815 | | 1,523 | 1,402 | 1,313 | 1,135 |
| Government entities loans | 0 | 0 | 0 | 8 | | 0 | 0 | 0 | 0 |
| Consumer loans | 2,696 | 2,668 | 2,606 | 2,261 | | 2,236 | 2,053 | 1,709 | 1,255 |
| Mortgage loans | 4,067 | 2,485 | 2,380 | 2,358 | | 2,334 | 2,075 | 1,931 | 1,982 |
| Total nonperforming portfolio | 14,043 | 10,761 | 8,885 | 6,442 | | 6,093 | 5,530 | 4,953 | 4,372 |
| Total loan portfolio | 394,932 | 378,795 | 365,360 | 352,267 | | 350,683 | 343,383 | 338,905 | 318,064 |
| | | | | | | | | | |
| Allowance for loan losses | (16,222) | (15,779) | (15,989) | (11,954) | | (11,580) | (11,360) | (11,101) | (10,875) |
| Loan portfolio (net) | 378,710 | 363,016 | 349,371 | 340,313 | | 339,103 | 332,023 | 327,804 | 307,189 |
| | | | | | | | | | |
| Accrued income receivable from securitization transactions | 124 | 0 | 0 | 0 | | 0 | 0 | 0 | 0 |
| Other receivables (net) | 42,866 | 58,109 | 69,513 | 72,856 | | 46,015 | 47,367 | 55,845 | 46,888 |
| Foreclosed assets (net) | 425 | 140 | 126 | 136 | | 150 | 172 | 196 | 220 |
| Property, furniture and fixtures (net) | 4,773 | 4,328 | 4,113 | 4,058 | | 4,095 | 3,770 | 3,780 | 5,439 |
| Long-term investment in shares | 145 | 122 | 117 | 167 | | 134 | 115 | 101 | 157 |
| Deferred taxes (net) | 18,088 | 16,998 | 14,672 | 11,049 | | 10,512 | 9,087 | 8,424 | 8,183 |
| Deferred charges, advance payments and intangibles | 4,173 | 3,867 | 3,823 | 3,875 | | 3,960 | 3,690 | 3,792 | 4,146 |
| Other assets | 202 | 178 | 175 | 169 | | 163 | 264 | 196 | 170 |
| Discontinued operations | 0 | 887 | 745 | 712 | | 626 | 634 | 544 | 628 |
| | | | | | | | | | |
| Total assets | 821,797 | 806,222 | 831,664 | 856,735 | | 750,181 | 771,621 | 838,004 | 784,158 |
4Q.13 | EARNINGS RELEASE | 33
| Grupo Financiero Santander Mexico | | | | | | | | |
| Consolidated Balance Sheet | | | | | | | | | |
| Millions of Mexican Pesos | | | | | | | | | |
| | 2013 | | 2012 |
| | Dec | Sep | Jun | Mar | | Dec | Sep | Jun | Mar |
| Liabilities | | | | | | | | | |
| | | | | | | | | | |
| Deposits | 430,921 | 414,963 | 404,712 | 410,825 | | 397,259 | 358,606 | 352,753 | 346,605 |
| Demand deposits | 257,892 | 240,947 | 218,606 | 226,503 | | 210,915 | 194,351 | 204,606 | 187,787 |
| Time deposits – General Public | 120,160 | 129,344 | 130,599 | 124,871 | | 125,584 | 120,034 | 117,184 | 122,816 |
| Time deposits – Money market | 26,616 | 19,233 | 29,498 | 23,546 | | 25,953 | 21,904 | 9,085 | 14,507 |
| Credit instruments issued | 26,253 | 25,439 | 26,009 | 35,905 | | 34,807 | 22,317 | 21,878 | 21,495 |
| | | | | | | | | | |
| Bank and other loans | 45,380 | 29,688 | 27,086 | 31,094 | | 27,463 | 34,339 | 24,804 | 21,372 |
| Demand loans | 4,341 | 6,506 | 9,659 | 9,075 | | 8,240 | 5,916 | 6,851 | 5,949 |
| Short-term loans | 18,432 | 16,174 | 15,513 | 19,726 | | 16,767 | 26,092 | 15,704 | 13,278 |
| Long-term loans | 22,607 | 7,008 | 1,914 | 2,293 | | 2,456 | 2,331 | 2,249 | 2,145 |
| | | | | | | | | | |
| Creditors under sale and repurchase agreements | 77,132 | 108,890 | 127,376 | 116,299 | | 73,290 | 106,306 | 168,227 | 189,299 |
| Collateral sold or pledged as guarantee | 12,339 | 8,745 | 18,316 | 18,130 | | 6,853 | 17,972 | 18,766 | 14,104 |
| Securities loans | 12,339 | 8,745 | 18,316 | 18,130 | | 6,853 | 17,972 | 18,766 | 14,104 |
| | | | | | | | | | |
| Derivatives | 73,425 | 75,725 | 73,498 | 92,751 | | 79,561 | 86,611 | 87,959 | 70,290 |
| Trading purposes | 72,033 | 73,955 | 72,264 | 91,132 | | 77,939 | 85,207 | 86,232 | 69,264 |
| Hedging purposes | 1,392 | 1,770 | 1,234 | 1,619 | | 1,622 | 1,404 | 1,727 | 1,026 |
| | | | | | | | | | |
| Other payables | 70,302 | 66,493 | 77,766 | 83,789 | | 66,610 | 71,567 | 88,567 | 47,468 |
| Income taxes payable | 807 | 148 | 180 | 284 | | 440 | 720 | 335 | 841 |
| Employee profit sharing payable | 233 | 272 | 97 | 83 | | 169 | 115 | 81 | 61 |
| Creditors from settlement of transactions | 28,687 | 40,906 | 52,312 | 62,970 | | 38,604 | 47,308 | 52,492 | 24,013 |
| Creditors from collaterals received on cash | 4,944 | 4,781 | 4,215 | 6,158 | | 5,725 | 6,243 | 5,889 | 4,469 |
| Sundry creditors and other payables | 35,631 | 20,386 | 20,962 | 14,294 | | 21,672 | 17,181 | 29,770 | 18,084 |
| Subordinated Credit Notes | 16,824 | 0 | 0 | 0 | | 0 | 0 | 0 | 0 |
| Deferred revenues | 773 | 838 | 919 | 1,011 | | 1,041 | 1,091 | 1,096 | 1,385 |
| Discontinued operations | 0 | 386 | 294 | 317 | | 277 | 336 | 287 | 391 |
| Total liabilities | 727,096 | 705,728 | 729,967 | 754,216 | | 652,354 | 676,828 | 742,459 | 690,914 |
| | | | | | | | | | |
| Paid in capital | 48,128 | 47,908 | 47,881 | 47,776 | | 47,811 | 47,776 | 48,195 | 48,195 |
| Capital stock | 36,357 | 36,357 | 36,357 | 36,357 | | 36,357 | 36,357 | 36,357 | 36,357 |
| Share premium | 11,771 | 11,551 | 11,524 | 11,419 | | 11,454 | 11,419 | 11,838 | 11,838 |
| | | | | | | | | | |
| Other capital | 46,573 | 52,586 | 53,816 | 54,743 | | 50,016 | 47,017 | 47,350 | 45,049 |
| Capital reserves | 1,851 | 1,851 | 1,850 | 349 | | 349 | 349 | 349 | 108 |
| Retained earnings | 24,240 | 36,190 | 43,370 | 48,979 | | 31,068 | 31,038 | 35,311 | 38,541 |
| Result from valuation of securities available for sale, net | (427) | (99) | (215) | 762 | | 678 | 727 | 688 | 442 |
| Result from valuation of cash flow hedge instruments, net | 24 | (108) | (59) | (74) | | 90 | 382 | 690 | 932 |
| Net income | 20,876 | 14,742 | 8,860 | 4,717 | | 17,822 | 14,512 | 10,298 | 5,013 |
| Non-controlling interest | 9 | 10 | 10 | 10 | | 9 | 9 | 14 | 13 |
| Total stockholders´ equity | 94,701 | 100,494 | 101,697 | 102,519 | | 97,827 | 94,793 | 95,545 | 93,244 |
| Total liabilities and stockholders´ equity | 821,797 | 806,222 | 831,664 | 856,735 | | 750,181 | 771,621 | 838,004 | 784,158 |
4Q.13 | EARNINGS RELEASE | 34
| Grupo Financiero Santander Mexico | | | | | | | |
| Consolidated Balance Sheet | | | | | | | | |
| Millions of Mexican Pesos | | | | | | | | |
| | 2013 | | 2012 |
| | Dec | Sep | Jun | Mar | | Dec | Sep | Jun | Mar |
| | | | | | | | | | |
| Memorandum accounts | | | | | | | | | |
| | | | | | | | | | |
| FOR THIRD PARTIES | | | | | | | | | |
| | | | | | | | | | |
| Current client account | | | | | | | | | |
| Client Banks | 100 | 81 | 675 | 56 | | 74 | 74 | 261 | 147 |
| Liquidation of client transactions | 589 | (364) | (1,245) | (47) | | 116 | 350 | (2,030) | 35 |
| Client securities abroad | 0 | 1 | 1 | 1 | | 1 | 0 | 1 | 1 |
| | | | | | | | | | |
| Custody services | | | | | | | | | |
| Assets under custody | 267,977 | 255,157 | 579,068 | 290,289 | | 317,118 | 261,131 | 198,793 | 210,076 |
| Client securities abroad | 0 | 0 | 0 | 0 | | 1 | 0 | 0 | 1 |
| | | | | | | | | | |
| Transactions on behalf of third parties | | | | | | | | | |
| Sale and repurchase agreements | 58,432 | 55,615 | 71,235 | 38,874 | | 45,914 | 44,469 | 55,334 | 65,577 |
| Security loans on behalf of clients | 528 | 946 | 1,121 | 1,201 | | 1,256 | 1,457 | 1,826 | 2,182 |
| Collaterals received as guarantee on behalf of clients | 237,455 | 240,592 | 2,023 | 28,283 | | 29,504 | 19,013 | 15,690 | 19,542 |
| Acquisition of derivatives | 246,684 | 253,974 | 267,400 | 291,038 | | 289,248 | 294,269 | 308,411 | 308,379 |
| Sale of derivatives | 365,134 | 425,602 | 479,013 | 526,154 | | 570,945 | 579,263 | 603,162 | 656,451 |
| Total on behalf of third parties | 1,176,899 | 1,231,604 | 1,399,291 | 1,175,849 | | 1,254,177 | 1,200,026 | 1,181,448 | 1,262,391 |
| | | | | | | | | | |
| Proprietary record accounts: | | | | | | | | | |
| | | | | | | | | | |
| Contingent assets and liabilities | 34,500 | 33,485 | 33,237 | 30,265 | | 33,236 | 24,053 | 31,852 | 31,904 |
| | | | | | | | | | |
| Credit commitments | | | | | | | | | |
| Trusts | 133,101 | 125,762 | 123,172 | 127,435 | | 125,954 | 106,006 | 106,747 | 155,407 |
| Mandates | 274 | 1,627 | 1,612 | 1,596 | | 1,580 | 2,582 | 1,548 | 1,532 |
| | | | | | | | | | |
| Assets in custody or under administration | 3,543,470 | 3,682,981 | 4,006,969 | 3,567,360 | | 3,561,696 | 3,312,634 | 3,062,735 | 3,084,880 |
| | | | | | | | | | |
| Credit Commitments | 158,521 | 150,895 | 155,912 | 155,483 | | 133,744 | 160,790 | 203,362 | 157,565 |
| | | | | | | | | | |
| Collateral received | 99,277 | 73,667 | 60,377 | 154,943 | | 71,296 | 90,548 | 52,244 | 49,931 |
| Collateral received and sold or pledged as guarantee | 50,891 | 45,016 | 31,663 | 115,180 | | 53,788 | 66,877 | 26,708 | 29,027 |
| Uncollected interest earned on past due loan portfolio | 1,229 | 1,473 | 1,447 | 1,402 | | 1,808 | 794 | 1,092 | 985 |
| | | | | | | | | | |
| Other accounts | 511,659 | 518,961 | 501,926 | 484,324 | | 501,538 | 466,076 | 455,197 | 429,800 |
| | | | | | | | | | |
| Subtotal | 4,532,922 | 4,633,867 | 4,916,315 | 4,637,988 | | 4,484,640 | 4,230,360 | 3,941,485 | 3,941,031 |
| Total | 5,709,821 | 5,865,471 | 6,315,606 | 5,813,837 | | 5,738,817 | 5,430,386 | 5,122,933 | 5,203,422 |
4Q.13 | EARNINGS RELEASE | 35
These consolidated financial statements were approved by the Board of Directors and signed on its behalf by
| MARCOS A. MARTINEZ GAVICA | | PEDRO JOSE MORENO CANTALEJO |
| Executive President and Chief Executive Officer | | Vice President of Administration and Finance |
| EMILIO DE EUSEBIO SAIZ | JESÚS GONZÁLEZ DEL REAL | JAVIER PLIEGO ALEGRÍA |
| Deputy General Director of Intervention and Control Management | Executive Director - Controller | Executive Director of Internal Audit |
The accompanying notes are part of these consolidated financial statements
www.santander.com.mx
4Q.13 | EARNINGS RELEASE | 36
| Grupo Financiero Santander Mexico | | | | | | | | |
| Consolidated Statement of Income | | | | | | | | |
| Millions of Mexican Pesos | | | | | | | | | | | |
| | | | | | 2013 | | | | | | 2012 |
| | 12M | 4Q | 3Q | 2Q | 1Q | | 12M | 4Q | 3Q | 2Q | 1Q |
| | | | | | | | | | | | |
| Interest income | 55,136 | 13,663 | 13,664 | 14,201 | 13,608 | | 55,388 | 14,259 | 13,873 | 13,830 | 13,426 |
| Interest expense | (19,106) | (4,279) | (4,553) | (5,302) | (4,972) | | (21,495) | (5,447) | (5,291) | (5,436) | (5,321) |
| Financial margin | 36,030 | 9,384 | 9,111 | 8,899 | 8,636 | | 33,893 | 8,812 | 8,582 | 8,394 | 8,105 |
| | | | | | | | | | | | |
| Allowance for loan losses | (12,852) | (3,598) | (3,102) | (3,348) | (2,804) | | (9,444) | (2,948) | (2,534) | (1,994) | (1,968) |
| Financial margin after allowance for loan losses | 23,178 | 5,786 | 6,009 | 5,551 | 5,832 | | 24,449 | 5,864 | 6,048 | 6,400 | 6,137 |
| | | | | | | | | | | | |
| Commission and fee income | 15,364 | 3,998 | 3,894 | 3,650 | 3,822 | | 14,368 | 3,858 | 3,671 | 3,420 | 3,419 |
| Commission and fee expense | (2,483) | (688) | (593) | (598) | (604) | | (2,525) | (631) | (707) | (659) | (528) |
| Net gain on financial assets and liabilities | 3,014 | 102 | 555 | 1,308 | 1,049 | | 2,189 | 413 | 918 | 105 | 753 |
| Other operating income | 1,726 | 407 | 449 | 475 | 395 | | 3,043 | 209 | 112 | 2,029 | 693 |
| Administrative and promotional expenses | (19,069) | (5,730) | (2,737) | (5,314) | (5,288) | | (20,138) | (5,996) | (5,157) | (4,534) | (4,451) |
| Total operating income | 21,730 | 3,875 | 7,577 | 5,072 | 5,206 | | 21,386 | 3,717 | 4,885 | 6,761 | 6,023 |
| | | | | | | | | | | | |
| Equity in results of associated companies | 82 | 24 | 16 | 27 | 15 | | 69 | 20 | 15 | 17 | 17 |
| | | | | | | | | | | | |
| Income from continuing operations before income taxes | 21,812 | 3,899 | 7,593 | 5,099 | 5,221 | | 21,455 | 3,737 | 4,900 | 6,778 | 6,040 |
| | | | | | | | | | | | |
| Current income taxes | (4,897) | 139 | (1,030) | (2,938) | (1,068) | | (5,807) | (1,654) | (1,275) | (1,756) | (1,122) |
| Deferred income taxes | 2,045 | 154 | (732) | 2,107 | 516 | | 2,048 | 1,179 | 547 | 246 | 76 |
| | | | | | | | | | | | |
| Income from continuing operations | 18,960 | 4,192 | 5,831 | 4,268 | 4,669 | | 17,696 | 3,262 | 4,172 | 5,268 | 4,994 |
| | | | | | | | | | | | |
| Discontinued operations | 1,918 | 1,943 | 51 | (124) | 48 | | 129 | 49 | 42 | 19 | 19 |
| | | | | | | | | | | | |
| Consolidated net income | 20,878 | 6,135 | 5,882 | 4,144 | 4,717 | | 17,825 | 3,311 | 4,214 | 5,287 | 5,013 |
| | | | | | | | | | | | |
| Non-controlling interest | (2) | (1) | 0 | (1) | 0 | | (3) | (1) | 0 | (2) | 0 |
| | | | | | | | | | | | |
| Net income | 20,876 | 6,134 | 5,882 | 4,143 | 4,717 | | 17,822 | 3,310 | 4,214 | 5,285 | 5,013 |
4Q.13 | EARNINGS RELEASE | 37
These consolidated financial statements were approved by the Board of Directors and signed on its behalf by
| MARCOS A. MARTINEZ GAVICA | | PEDRO JOSE MORENO CANTALEJO |
| Executive President and Chief Executive Officer | | Vice President of Administration and Finance |
| EMILIO DE EUSEBIO SAIZ | JESÚS GONZÁLEZ DEL REAL | JAVIER PLIEGO ALEGRÍA |
| Deputy General Director of Intervention and Control Management | Executive Vice President of Accounting | Executive Director of Internal Audit |
The accompanying notes are part of these consolidated financial statements
www.santander.com.mx
4Q.13 | EARNINGS RELEASE | 38
| Grupo Financiero Santander Mexico | | | | | | | | | | | | |
| Consolidated Statements of Changes in Stockholders’ Equity | | | | | | | | | |
| From January 1 to December 31, 2013 | | | | | | | | | | | | |
| Millions of Mexican Pesos | | | | | | | | | | | | |
| | Paid-in Capital | | Other Capital | | | | |
| CONCEPT | Capital Stock | Additional Paid-In Capital | | Capital Reserves | Retained Earnings | Surplus (deficit) from valuation of securities available for sale | Surplus (Deficit) from the valuation of cash flow hedge securities | Cumulative effect from conversion | Net income (loss) | | Minority Interest | | Total stockholders' equity |
| | | | | | | | | | | | | | |
| BALANCE AS OF DECEMBER 31, 2012 | 36,357 | 11,454 | | 349 | 31,068 | 678 | 90 | 0 | 17,822 | | 9 | | 97,827 |
| MOVEMENTS INHERENT TO THE SHAREHOLDERS' DECISIONS | | | | | | | | | | | | | |
| Transfer of prior year’s net income | | | | 2 | 17,820 | | | | (17,822) | | | | 0 |
| Dividends declared | | | | | (20,850) | | | | | | | | (20,850) |
| TOTAL | 0 | 0 | | 2 | (3,030) | 0 | 0 | 0 | (17,822) | | 0 | | (20,850) |
| MOVEMENTS INHERENT TO THE RECOGNITION OF THE COMPREHENSIVE INCOME | | | | | | | | | | | | | |
| Result from valuation of available for sale securities, net | | | | | | (1,105) | | | | | | | (1,105) |
| Result from valuation of cash flow hedge instruments, net | | | | | | | (66) | | | | | | (66) |
| Reserve for purchase of treasury shares | | | | 1,500 | (1,500) | | | | | | | | 0 |
| Shares held by treasury | | 84 | | | 32 | | | | | | | | 116 |
| Recognition of cost in connection with share-based payments | | 233 | | | | | | | | | | | 233 |
| Recoveries of allowance for loan losses previously applied to retained earnings | | | | | 43 | | | | | | | | 43 |
| Initial cumulative effect of change in methodology for measuring allowance for loan with respect to commercial loan portfolio. | | | | | (2,412) | | | | | | | | (2,412) |
| Share of comprehensive income of associated companies accounted for by the equity method | | | | | 39 | | | | | | (2) | | 37 |
| Net Income | | | | | | | | | 20,876 | | 2 | | 20,878 |
| TOTAL | 0 | 317 | | 1,500 | (3,798) | (1,105) | (66) | 0 | 20,876 | | 0 | | 17,724 |
| BALANCE AS OF DECEMBER 31, 2013 | 36,357 | 11,771 | | 1,851 | 24,240 | (427) | 24 | 0 | 20,876 | | 9 | | 94,701 |
4Q.13 | EARNINGS RELEASE | 39
These consolidated financial statements were approved by the Board of Directors and signed on its behalf by
| MARCOS A. MARTINEZ GAVICA | | PEDRO JOSE MORENO CANTALEJO |
| Executive President and Chief Executive Officer | | Vice President of Administration and Finance |
| EMILIO DE EUSEBIO SAIZ | JESÚS GONZÁLEZ DEL REAL | JAVIER PLIEGO ALEGRÍA |
| Deputy General Director of Intervention and Control Management | Executive Vice President of Accounting | Executive Director of Internal Audit |
The accompanying notes are part of these consolidated financial statements
www.santander.com.mx
4Q.13 | EARNINGS RELEASE | 40
| Grupo Financiero Santander Mexico | | | |
| Consolidated Statement of Cash Flows | | | |
| From January 1 to December 31, 2013 | | | |
| Millions of Mexican Pesos | | | |
| | | | |
| OPERATING ACTIVITIES | | | |
| Net Result | | | 20,876 |
| Adjustments due to items not requiring resources | | | |
| Result from valuation related to investment or financing activities | (192) | | |
| Equity in results of subsidiaries and associated companies | (82) | | |
| Depreciation of properties, furniture and equipment | 649 | | |
| Amortization of intangible assets | 970 | | |
| Recognition of Capital payments | 233 | | |
| Income tax and employee profit sharing (current and deferred) | 2,852 | | |
| Deferred Employee Profit Sharing | (3,200) | | |
| Discontinued operations | (1,918) | | (688) |
| | | | 20,188 |
| CHANGES IN OPERATING ACCOUNTS | | | |
| Change in margin accounts | | | 730 |
| Change in Securities | | | (2,393) |
| Changes in Debit balances under repurchase and resale agreements (Reporto) | | | (26,033) |
| Changes in Derivatives (Asset) | | | 7,120 |
| Changes in Loans portfolio | | | (43,052) |
| Changes in accrued income receivable from securitization transactions | | | (124) |
| Changes in Foreclosed assets | | | (276) |
| Changes in Other operating assets | | | 5,231 |
| Changes in Savings | | | 33,662 |
| Changes in Interbank loans and from other entities | | | 17,917 |
| Changes in Credit balances under repurchase and sale agreements (Reporto) | | | 3,842 |
| Changes in sold or pledged guarantees | | | 5,486 |
| Changes in Derivatives (Liabilities)) | | | (6,137) |
| Changes in other operating liabilities | | | 6,400 |
| Income tax payments | | | (10,346) |
| Net resources generated by operating activities | | | 12,215 |
| | | | |
| INVESTING ACTIVITIES | | | |
| Purchases of properties, furniture and equipment | | | (1,322) |
| Collection of cash dividends | | | 68 |
| Purchases of intangible assets | | | (933) |
| Payment for price adjustment in charges for disposal of subsidiaries | | | (178) |
| Proceeds from disposal of other long-lived assets | | | 2,445 |
| Payments for acquisition of mortgage business | | | (509) |
| Net resources generated by investing activities | | | (429) |
| | | | |
| FINANCING ACTIVITIES | | | |
| Payment of dividends | | | (20,850) |
| Subordinated debentures | | | 16,824 |
| Recoveries of reserves applied to results from previous years | | | 43 |
| Net resources generated by financing activities | | | (3,983) |
| Net increase in funds available | | | 7,803 |
| Adjustments to cash flow due to exchange variations | | | 225 |
| Funds available at beginning of year | | | 81,626 |
| | | | |
| Funds available at the end of the year | | | 89,654 |
4Q.13 | EARNINGS RELEASE | 41
These consolidated financial statements were approved by the Board of Directors and signed on its behalf by
| MARCOS A. MARTINEZ GAVICA | | PEDRO JOSE MORENO CANTALEJO |
| Executive President and Chief Executive Officer | | Vice President of Administration and Finance |
| EMILIO DE EUSEBIO SAIZ | JESÚS GONZÁLEZ DEL REAL | JAVIER PLIEGO ALEGRÍA |
| Deputy General Director of Intervention and Control Management | Executive Vice President of Accounting | Executive Director of Internal Audit |
The accompanying notes are part of these consolidated financial statements
www.santander.com.mx
4Q.13 | EARNINGS RELEASE | 42
NOTES TO FINANCIAL STATEMENTS OF GRUPO FINANCIERO SANTANDER MEXICO
| § | Significant accounting policies |
| § | Balance sheet and Income statement by segment |
| § | Annex 1. Loan portfolio rating |
| § | Annex 2. Financial ratios according to CNBV |
| § | Notes to financial statements |
The information contained in this report and the financial statements of the Group’s subsidiaries may be consulted on the Internet website: www.santander.com.mx or through the following direct access:
http://www.santander.com.mx/ir/english/financial/quarterly.html
There is also information on Santander on the CNBV Website: www.cnbv.gob.mx
4Q.13 | EARNINGS RELEASE | 43
Significant accounting policies
The significant accounting policies applied by Santander Mexico (“Grupo Financiero Santander Mexico”, “Financial Group” or the “Group”) are in conformity with the accounting criteria established by the Commission in the General Provisions Applicable to Financial Groups, Credit Institutions, Brokerage House and Regulated Multiple Purpose Financing Entities (“the provisions”), in its circulars and in general and specific official mandates, which require that management make certain estimates and utilize certain assumptions to determine the valuation of items included in the consolidated financial statements and to make required disclosures. Although the actual results may differ, management believes that the estimates and assumptions utilized were appropriate under the circumstances.
Based on accounting criterion A-1 of the Commission, the accounting of the Financial Group shall be in conformity with Mexican Financial Reporting Standards as promulgated by the Mexican Board of Financial Reporting Standards (“CINIF”), except when the Commission believes that a specific regulation or accounting treatment should be applied on the basis that the institutions subject to its rules carry out specialized operations.
Changes in accounting policies
Changes in the Accounting Criteria of the Commission
Changes that occurred during 2012
In July 2012, the Federal Official Gazette published certain amendments to the accounting criteria applicable to credit institutions, which modify the accounting criteria used for trusts and the consolidation of special-purpose entities (EPE) and which define the specific standards used for the recognition, valuation, presentation and disclosure of trusts and EPE in the financial statements, as a means of generating transparent financial information comparable with that of other countries.
The changes are as follows:
| – | The valuation of the trust's net assets must be recognized in memorandum accounts according to the accounting criteria issued by the Commission, unless trusts request, obtain and maintain the registration of their securities with the National Securities Registry, in which case their net assets must be valued according to the accounting standards issued by the Commission for application to securities issuers and other market participants (International Financial Reporting Standards, or IFRS). |
| – | The description of the minimum conditions that must be fulfilled to demonstrate that an entity does not exercise control over an EPE thereby avoiding the consolidation thereof has been eliminated. |
| – | The financial statements of the consolidated EPE must be prepared according to the same accounting criterion; likewise, when involving operations of the same nature, the accounting policies applied by the consolidating entity must also be used. |
| – | When the EPE uses accounting criteria or policies other than those applicable to the consolidating entity, the financial statements of the EPE utilized for consolidation purposes must be consistent with those of the consolidating entity. |
Changes in the Financial Reporting Standards FRS issued by the Mexican Board of Financial Reporting Standards CINIF (Spanish acronym)
NIF B-8, Consolidated or Combined Financial Statements
NIF C-7, Investments in associated companies, joint businesses and other permanent investments
NIF C-21, Agreements with joint control
INIF 20, Accounting effects of the Fiscal Reform 2014
Improvements to the Financial Reporting Standards 2013
Some of the principal changes established in such provisions are as follows:
NIF B-8, Consolidated or Combined Financial Statements- Amends the definition of control. The existence of control over an entity is the basis for consolidation of the financial information. With this new definition and in accordance with the criteria of the revised standard, consolidation may be required of certain previously unconsolidated entities that are controlled by the Entity and, vice versa, the Entity may be required to deconsolidate previously consolidated entities over which the Entity has determined it does not exercise control. This NIF establishes that an entity exercises control when it has power to direct relevant activities and if it is exposed to or has rights to variable returns of another entity and has the ability to influence
4Q.13 | EARNINGS RELEASE | 44
such returns. This FRS furthermore establishes that there might be other contractual agreements that grant authority over the investee or, other factors as degree of involvement that might be indicators of the existence of authority. Additionally, the NIF introduces the concept of protective rights, which are defined as those rights that are designed to protect the non-controlling investor’s participation, while not granting power to such investor. The standard also incorporates the concepts of principal and agent, wherein the principal is the investor entitled to make decisions on its own behalf, while the agent’s role is limited to making decisions on behalf of the principal; consequently, the latter cannot be the party who exercises control. The NIF removes the term “special-purpose entity” and introduces the concept of a structured entity, which is an entity designed in such a way that voting or similar rights are not the determining factor for deciding who has control over it.
NIF C-7, Investments in associated companies, joint businesses and other permanent investments – Establishes that investments in joint businesses should be recognized by applying the equity method and that all the profit and loss effects derived from permanent investments in associated companies, joint businesses and others should be recognized in results under the heading of equity in results of other entities. Requires further disclosures designed to provide greater financial information on the associated companies and joint businesses and eliminates the term specific purpose entity (SPE).
NIF C-21, Agreements with joint control – It defines that a joint agreement is an agreement that regulates an activity over which two or more parties exercise joint control, as follows: 1) joint transaction, when the parties to the agreement have direct rights to the assets and obligations for the liabilities, relative to the agreement and 2) joint business, when the parties have the right to participate only in the residual value of the assets once the liabilities have been deducted. Establishes that the equity held in a joint business should be recognized as a permanent investment and valued by the equity method.
Improvements to NIF 2013 – The principal improvements that generate accounting changes which should be recognized retrospectively in years beginning as of January 1, 2013 are as follows:
FRS C-5, Early Payments, Newsletter C-9, Liability, provisions, assets and continent liabilities and commitments and Newsletter C-12, Financial instruments with the nature of a liability, capital or both – These provide that the amount of the obligation’s issuance expenses must be filed as a reduction of the corresponding liability and applied to results based on the effective interest method considering the periods when the obligations are outstanding.
FRS D-4, Taxes on profits –Acknowledges that taxes on profits (caused and differed) must be filed and classified based on the transaction or event from which such taxes arise, therefore must be acknowledged in the results of the period, except to the extent they arise from a transaction or event that is acknowledged in another integral result or directly in the item of shareholder’s equity.
Bulletin D-5, Leases- Stipulates that non-reimbursable lease payments should be deferred over the lease period and recognized in current earnings upon recognition of revenues and related expenses by the lessor and the lease, respectively.
Furthermore, Improvements to the NIF 2013 that do not generate accounting changes were issued; they mainly establish clearer definitions of terms.
FRS 20, Accounting effects of the Fiscal Reform 2014 –Defines the accounting acknowledgment of matters included in the fiscal reforms in effect in 2014 and that relate to taxes on profits and PTU. The Financial Group has assessed the effects that these fiscal reforms will have on their financial information and has disclosed such effects in Note 27.
The Financial Group had no material effects in the adoption of the new standards and interpretation in its.
Change in accounting policy applicable in 2013
Methodology to determine the preventive estimate for credit risks applicable to the commercial credit portfolio.
On June 24, 2013, the Commission issued rulings which modified the “General Provisions applicable to Credit Institutions”, whereby the methodology applicable to the classification of the commercial loan portfolio was modified in order to change the current model of creating allowance for loan losses based on the incurred loss model to an expected loss model wherein losses of the following 12 months are estimated with the credit information that best foresees them. Such modification entered into effect on the day following its publication.
4Q.13 | EARNINGS RELEASE | 45
The Commission stipulated the recognition in stockholders’ equity under the heading “Retained earnings” of the initial cumulative financial effect derived from the application of the new classification methodology for the commercial loan portfolio. The Commission stipulated two deadlines for the implementation of these new criteria. The first deadline is as of December 31, 2013 to determine and record the allowance for loan losses to commercial or business activity loan portfolio and the second deadline is as of June 30, 2014 for loan losses related to financial entities loan portfolio.
Santander México recognized the initial cumulative financial effect derived from the application of the new classification methodology for the commercial or business activity loan portfolio as of June 30, 2013. Santander México has not yet recognized the initial cumulative financial effect derived from the application of the new classification methodology for the financial entities loan portfolio.
The initial effect resulting from the change in the rating methodology of the commercial loan portfolio stipulated by the Commission originated an increased in the allowance for loan losses in the amount of Ps.3,445 million pesos which were reported in the balance sheet under the line item "Allowance for loan losses" with its corresponding debit in Stockholders' equity under the line item “Retained earnings” by this same amount.
In addition, and in accordance with provisions of MFRS D-4, Income Taxes, Santander México recognized the deferred tax resulting from the initial effect derived from the change in the rating methodology of the commercial loan portfolio. This was accounted for as an increase in the amount of Ps.1,034 million pesos in the line item "Deferred taxes and deferred profit sharing (net)" within the balance sheet asset side with its corresponding increase in the “Retained earnings” line item within the Stockholders' equity. The effect recognized in Stockholders equity under “Retained earnings” derived from the application of the change in rating methodology of the commercial loan portfolio amounted to $2,412 million, net of the related deferred tax.
As of June 30, 2013 (date of the initial application), the amount of the allowance for commercial loan portfolio calculated with the methodology based on an expected loss model amounts to $6,142 compared with $2,696 that would correspond to the amount of the allowance for loan losses for the commercial loan portfolio calculated with the methodology based on an incurred loss model.
Special accounting criteria applicable in 2013
Special accounting criteria applicable to credits subject to the support derived from the floods caused by hurricanes Ingrid and Manuel
By means of official document P065/2013 dated October 18, 2013, the Commission authorized the application of special accounting criteria to clients’ credits that have their addresses in the locations of the Mexican Republic declared in state of emergency or natural disaster by the Department of State (SEGOB Spanish acronym), by means of publication in the Official Journal of the Federation during the months of September and October of 2013, as well as those credits which payment source is located in such areas and that were classified in book value as in effect on the date of the event (September 13, 2013) established in the aforementioned declarations under the following terms:
| 1. | Those credits with a single payment of the principal upon expiration and periodical payment of interests, as well as the credits with a single payment of principal and interests upon expiration, that are renewed and restructured, shall not be deemed as in arrears under the terms of the provisions of Criteria B-6, Credit Portfolio (“Criteria B-6”), of the Commission. To that effect, it is required for the new expiration term, which might be granted to the borrower, does not exceed of three months from the date when it expired. |
The foregoing, provided these are credits that are filed as current portfolio on the date of the event pursuant to the provisions of Criteria B-6 and the corresponding renewal or restructuring proceedings end no later than 120 calendar days after the aforementioned date of the event.
| 2. | Credits with installment payments of principal and interests, that are subject matter of the restructuring or renewal, may be considered as in effect at the time such act is carried out, without applying the requirements provided in Criteria B-6. |
The foregoing, provided these are credits that are filed as current portfolio on the date of the event pursuant to the provisions of Criteria B-6 and the corresponding renewal or restructuring proceedings end no later than 120 calendar
4Q.13 | EARNINGS RELEASE | 46
days after the aforementioned date of the event, provided that the new expiration term, that if applicable is granted to the borrower, does not exceed of three months from the expiration date.
| 3. | The credits that from their commencement its nature is stated as revolving, that are restructured or renewed within 120 calendar days following the date of the event, shall not be deemed as in arrears under the terms of the provisions of Criteria B-6, such benefit may not exceed of three months from the expiration date. |
The foregoing provided these are credits which on the date of the event are filed as current portfolio pursuant to the provisions of Criteria B-6.
In connection with the credits mentioned in numbers 1, 2 and 3 above, these shall not be deemed as restructured pursuant to the provisions of Criteria B-6.
In order to support the affected clients, the Financial Group implemented a series of facilities for payment of payroll, credit card, Pymes and mortgage credits in effect. The clients that require support will not generate a report before the Credit Borough.
On December 31, 2013, the Financial Group received support requests from some of its borrowers and that were affected by the floods caused by hurricanes Ingrid and Manuel; the supports consisted in differing the expirations 60 days from the original terms. The credit portfolio balance that received these supports increased to $65.
The borrowers, who received the aforementioned supports, are up to date in their payments, both of principal as of interests.
New accounting rulings
During 2012 CINIF issued the following FRS, which shall enter into effect as of January 1, 2014, allowing its early application as follows:
FRS B-12 Compensation of financial assets and financial liabilities
FRS C-11 Shareholders’ equity
FRS C-12 Financial Instruments with liability and capital characteristics
FRS C-14 Transfer and discharge of financial assets
Improvement to FRS 2014
Some of the main changes established by these standards are:
FRS B-12 Compensation of financial assets and financial liabilities –Establishes the standards for the presentation and disclosure of the compensation of financial assets and liabilities, in the financial position statement, indicating that these only proceeds when: a) there is a legal right and obligation to collect or pay a compensation amount and b) the amount resulting from compensating the asset with the financial liability reflects the cash flows expected from the entity to settle two or more financial instruments. Likewise, it establishes that an entity must compensate only when the following two conditions are met: 1) there is a right legally enforceable and in effect to compensate the financial asset and financial liability on a compensated basis or of performing the financial asset and settling the financial liability simultaneously.
FRS C-11 Shareholders’’ Equity –The previous Newsletter C-11 established that in order for installments for future capital increases to be filed in the shareholders’ equity there must be “…a resolution in the partners’ or owners’ meeting to be applied for increases of capital stock in the future….”. This FRS requires in addition for the price per share to be issued for such installments to be fixes and that it is established that it cannot be reimbursed prior to capitalizing, to qualify as shareholders’ equity. In addition it generically indicates when a financial instrument meets the capital characteristics to be deemed as such, given that otherwise it would be a liability.
FRS C-12 Financial instruments with liability and capital characteristics –Establishes that the main characteristics for a financial instrument to qualify as a capital instrument is that the holder thereof is exposed to the entity’s risks and benefits, instead of having a right to collect a fix amount from the entity. The main change in the qualification of a redeemable capital instrument, such as a preferred share, consists in establishing that, as an exception, when certain conditions are met indicated in this standard, among it points out that the exercise of the redemption, can be enforced only until the liquidation
4Q.13 | EARNINGS RELEASE | 47
of the corporation, while there is no other unavoidable payment obligation in favor of the holder, the redeemable instrument is qualified as capital. The concept of subordination is incorporated, a crucial element to this standard, given that if a financial instrument has payment or reimbursement preference before other instruments it would qualify as liability, given the existing obligation to settle it. it is allowed to classify an instrument as capital with the option to issue a fix number of shares at a fix price provided in a currency other than the functional currency of the issuer, provided the option is held by all the owners of the same class of capital instruments, proportionally to their ownership.
FRS C-14 Transfer and discharge of financial assets –Establishes the standards pertaining to the accounting acknowledgment of transfers and discharge of financial assets other than cash and cash equivalents, such as collectable or negotiable financial instruments, as well as filing of financial statements of such transfers and relevant disclosures. For a transfer to be also qualified as discharge, there must be a full assignment of the risks and benefits of the financial asset.
The transferor of financial assets shall discharge it from its financial position statement until the time when it no longer has any future benefit or loss with respect thereof. conversely the receiver shall assume the risks inherent to such financial asset purchased and shall have an additional yield if the cash flows originated by the same are higher than those originally estimated or a loss, if the flows received were lower.
Improvements to FRS 2014 –The purpose of the Improvements to the Financial Reporting Standards 2014 (Improvements to FRS 2014) incorporate in the Financial Reporting Standards changes and statements in order to establish a more adequate regulation approach.
The Improvements to FRS are classified in those improvements that generate accounting changes in assessment, filing or disclosure of financial statements of the entities in those improvements that are amendments to the FRS to clarify the same, that help establish a more clear and comprehensive regulation approach; given that these are clarifications, they do not generate accounting changes to the entities’ financial statements.
The Improvements to the FRS that generate accounting changes are the following:
FRS C-5 Early payments –A paragraph was added to establish that when an entity purchases goods or services which payment is denominated in foreign currency and with respect to which early payments are made to the receipt thereof, the exchange fluctuations between its functional currency and the payment currency should not affect the amount acknowledged of the early payment.
Newsletter C-15 Detriment in the value of long term assets and their disposal –Newsletter C-15 is modified to indicate that the capitalization of losses due to detriment in the value of any asset is not allowed. It is also amended to establish that general balances of previous periods that present comparatives should not be restructured for the filing of assets and liability in connection with discontinued transactions, eliminating the actual difference in connection with the provisions of the International Financial Reporting Standard (IFRS) 5, Non-Current Assets Kept for Sale and Discontinued Transactions.
Improvements to FRS that do not generate accounting changes are the following:
Newsletter C-9 Liability, provisions, contingent assets and liabilities and commitments –The term “affiliate” is eliminated given that is not of international use, the term of common use currently is “related party”.
Newsletter C-15 Detriment in the value of long term assets and their disposal –The definition of the term appropriate discount rate that must be used to determine the value of required use in the detriment test is modified to clarify that such appropriate discount rated should be under real or nominal terms, depending on the financial hypothesis used in the cash flow projections.
On the date of issuance of the financial statements, the Financial Group is in the process of determining the effects of these new standards in their financial information.
4Q.13 | EARNINGS RELEASE | 48
| Grupo Financiero Santander Mexico | | | | | |
| Earnings per ordinary share and Earnings per diluted share | | | | | |
| (Millions of pesos, except shares and earnings per share) | | | | | | |
| | | | | | | | | | | | | | | | | | |
| | DECEMBER 2013 | | DECEMBER 2012 | | DECEMBER 2011 |
| | | | | | | | | | | | | | | | | | |
| | | | Shares | | Earnings | | | | Shares | | Earnings | | | | Shares | | Earnings |
| | Earnings | | -weighted- | | per share | | Earnings | | - weighted - | | per share | | Earnings | | - weighted - | | per share |
| | | | | | | | | | | | | | | | | | |
| | | | | | | | | | | | | | | | | | |
| Earnings per share | 20,876 | | 6,786,394,913 | | 3.08 | | 17,822 | | 6,786,394,913 | | 2.63 | | 10,940 | | 6,786,394,913 | | 1.61 |
| | | | | | | | | | | | | | | | | | |
| Treasury stock | | | (12,585,446) | | | | | | (3,588,407) | | | | | | | | |
| | | | | | | | | | | | | | | | | | |
| Diluted earnings per share | 20,876 | | 6,773,809,467 | | 3.08 | | 17,822 | | 6,782,806,506 | | 2.63 | | 10,940 | | 6,786,394,913 | | 1.61 |
| | | | | | | | | | | | | | | | | | |
| Plus (loss) less (profit): | | | | | | | | | | | | | | | | | |
| | | | | | | | | | | | | | | | | | |
| Discontinued operations | (1,918) | | | | | | (129) | | | | | | (474) | | | | |
| Continued fully diluted earnings per share | 18,958 | | 6,773,809,467 | | 2.80 | | 17,693 | | 6,782,806,506 | | 2.61 | | 10,466 | | 6,786,394,913 | | 1.54 |
4Q.13 | EARNINGS RELEASE | 49
| Grupo Financiero Santander Mexico | | | | | | | | | | |
| Consolidated Balance Sheet by Segment | | | | | | | | | | |
| Millions of Mexican Pesos | | | | | | | | | | | |
| | As of December 31, 2013 | | As of December 31, 2013 |
| | Retail Banking | | Wholesale Banking | | Corporate Activities | | Retail Banking | | Wholesale Banking | | Corporate Activities |
| Assets | | | | | | | | | | | |
| Cash and due from banks | 41,661 | | 36,636 | | 11,357 | | 41,915 | | 25,764 | | 13,947 |
| Margin Accounts | 0 | | 3,265 | | 0 | | 0 | | 3,995 | | 0 |
| Investment in securities | 0 | | 103,191 | | 67,053 | | 147 | | 116,879 | | 52,473 |
| Debtors under sale and repurchase agreements | 0 | | 35,505 | | 0 | | 0 | | 9,471 | | 0 |
| Derivatives | 0 | | 73,319 | | 300 | | 0 | | 80,323 | | 300 |
| Valuation adjustment for hedged financial assets | 0 | | 0 | | 4 | | 0 | | 0 | | 210 |
| Total loan portfolio | 304,239 | | 89,025 | | 1,668 | | 254,972 | | 94,091 | | 1,620 |
| Allowance for loan losses | (13,237) | | (2,963) | | (22) | | (11,019) | | (473) | | (88) |
| Loan Portfolio (net) | 291,002 | | 86,062 | | 1,646 | | 243,953 | | 93,618 | | 1,532 |
| Accrued income receivable from securitization transactions | 0 | | 0 | | 124 | | 0 | | 0 | | 0 |
| Other receivables (net) | 1,662 | | 29,587 | | 11,617 | | 2,001 | | 35,970 | | 8,044 |
| Foreclosed assets (net) | 12 | | 1 | | 412 | | 14 | | 1 | | 135 |
| Properties, furniture and fixtures (net) | 4,033 | | 680 | | 60 | | 3,460 | | 583 | | 52 |
| Long-term investments in shares | 0 | | 0 | | 145 | | 0 | | 0 | | 134 |
| Deferred charges, advance payments, intangibles assets | 0 | | 0 | | 18,088 | | 0 | | 0 | | 10,512 |
| Other assets | 1,666 | | 668 | | 2,041 | | 1,706 | | 670 | | 1,748 |
| Discontinued operations | 0 | | 0 | | 0 | | 0 | | 0 | | 627 |
| Total assets | 340,036 | | 368,914 | | 112,847 | | 293,196 | | 367,274 | | 89,714 |
| | | | | | | | | | | | |
| Liabilities | | | | | | | | | | | |
| Savings | 305,257 | | 53,816 | | 45,595 | | 263,728 | | 53,619 | | 45,105 |
| Credit instruments issued | 0 | | 485 | | 25,768 | | 0 | | 1,255 | | 33,552 |
| Bank and other loans | 18,421 | | 138 | | 26,821 | | 13,791 | | 205 | | 13,467 |
| Creditors under sale and repurchase agreements | 44,107 | | 24,817 | | 8,208 | | 10,659 | | 54,833 | | 7,799 |
| Collateral sold or pledged as guarantee | 0 | | 12,339 | | 0 | | 0 | | 6,853 | | 0 |
| Derivatives | 0 | | 72,033 | | 1,392 | | 0 | | 77,939 | | 1,624 |
| Other payables | 34,084 | | 34,109 | | 2,109 | | 22,114 | | 43,899 | | 597 |
| Subordinated debentures | 0 | | 0 | | 16,824 | | 0 | | 0 | | 0 |
| Deferred revenues | 773 | | 0 | | 0 | | 1,041 | | 0 | | 0 |
| Discontinued operations | 0 | | 0 | | 0 | | 0 | | 0 | | 277 |
| Total liabilities | 402,642 | | 197,737 | | 126,717 | | 311,333 | | 238,603 | | 102,421 |
| Total stockholders' equity | 42,132 | | 12,981 | | 39,588 | | 35,109 | | 13,346 | | 49,372 |
| Total liabilities and stockholders' equity | 444,774 | | 210,718 | | 166,305 | | 346,442 | | 251,949 | | 151,793 |
4Q.13 | EARNINGS RELEASE | 50
| Grupo Financiero Santander Mexico | | | | | | |
| Income Statement by Segment | | | | | | | |
| Millions of Mexican Pesos | | | | | | | |
| | 12M13 | | 12M12 |
| | Retail Banking | Global Wholesale Banking | Corporate Activities | | Retail Banking | Global Wholesale Banking | Corporate Activities |
| | | | | | | | |
| Financial margin | 29,874 | 3,643 | 2,514 | | 26,349 | 3,788 | 3,755 |
| Allowance for loan losses | (12,433) | (344) | (75) | | (9,212) | (163) | (70) |
| Financial margin after allowance for loan losses | 17,441 | 3,299 | 2,439 | | 17,137 | 3,625 | 3,685 |
| Commission and fee, net | 11,143 | 1,827 | (90) | | 10,213 | 1,716 | (86) |
| Net gain (loss) on financial assets and liabilities | 756 | 2,274 | (16) | | 653 | 1,614 | (78) |
| Other operating income (expense) | 1,559 | 19 | 149 | | 1,686 | 2 | 1,355 |
| Administrative and promotional expenses | (16,780) | (2,229) | (59) | | (18,139) | (2,007) | 8 |
| Total operating income | 14,119 | 5,190 | 2,423 | | 11,550 | 4,950 | 4,884 |
| Equity in results of associated companies | 0 | 0 | 80 | | (4) | 1 | 72 |
| Income from continuing operations before income taxes | 14,119 | 5,190 | 2,503 | | 11,546 | 4,951 | 4,956 |
Segment information has been prepared according to the classifications used in Grupo Santander at secondary level, based in the type of developed business:
Commercial Banking
It includes all the businesses pertaining to customer banking, under the following segments: Individual, Small and Medium-sized Enterprises (Pymes) Institutions, Local Corporate Banking (large enterprises), as well as the contributions of Mutual Funds businesses (after transfer of commissions to distributors).
Global Wholesale Banking
This area reflects the earnings from Global Corporate Banking, Investment Banking and Treasury.
Corporate Activities
It includes non-commercial assets and liabilities, the result from hedging positions, insurance business (net of commissions paid to Commercial Bank) and others. Even though Corporate Banking, by definition, belongs to Commercial Banking, it is separated herein in order to reflect the results from corporate customers.
4Q.13 | EARNINGS RELEASE | 51
Grupo Financiero Santander Mexico
Millions of Mexican Pesos
| | | Allowance for loan losses |
| Category | Loan Portfolio | Commercial | Consumer | Mortgages | Total |
| | | | | | |
| Risk "A" | 338,702 | 1,268 | 1,156 | 172 | 2,596 |
| Risk "A-1" | 262,507 | 818 | 161 | 119 | 1,098 |
| Risk "A-2" | 76,195 | 449 | 995 | 53 | 1,498 |
| Risk "B" | 45,265 | 496 | 2,025 | 82 | 2,603 |
| Risk "B-1" | 16,524 | 99 | 956 | 31 | 1,085 |
| Risk "B-2" | 11,103 | 72 | 397 | 28 | 498 |
| Risk "B-3" | 17,638 | 325 | 672 | 23 | 1,020 |
| Risk "C" | 19,696 | 376 | 1,435 | 288 | 2,099 |
| Risk "C-1" | 12,669 | 275 | 419 | 142 | 835 |
| Risk "C-2" | 7,027 | 101 | 1,017 | 146 | 1,264 |
| Risk "D" | 12,087 | 1,425 | 2,944 | 534 | 4,903 |
| Risk "E" | 6,586 | 2,632 | 505 | 774 | 3,911 |
| Total rated portfolio | 422,335 | 6,196 | 8,066 | 1,849 | 16,111 |
| | | | | | |
| Complementary provisions | | | | 111 |
| Total | | | | 16,222 |
| Notes: | |
| 1. | The figures used for grading and the creation of provisions correspond to the ones as of the last day of the month of the balance sheet as of December 31, 2013. |
| 2. | Loan Portfolio and the methodology are graded according the rules issued by CNBV. From August 2009, the Bank implemented the rules for grading revolving consumer credit card loans. From March 2011, the Bank implemented the rules for grading non-revolving consumer and mortgage loans. From September, 2011, the bank implemented new rules for grading loans to States and Municipalities. From June 2013, the bank implemented new rules for grading commercial loans |
| 3. | Allowance created in excess are explained by the following: The Bank maintains an additional allowance to the ones necessary pursuant to the loan portfolio grading process authorized by the Commission, in order to cover potential losses from mortgages portfolio, the valuation of assets determined in the Due Diligence and authorized by the Commission in Official Letter No. 601DGSIF"C"-38625, for an amount of Ps.20.6 million, as well as to cover the cost of Governmental Programs. |
4Q.13 | EARNINGS RELEASE | 52
| Annex 2 |
| Financial Ratios according to CNBV |
| Grupo Santander Mexico | | | | | | | |
| Percentages | | | | | | | |
| | | 4Q13 | 3Q13 | 4Q12 | | 12M13 | 12M12 |
| | | | | | | | |
| NPL ratio | | 3.6 | 2.8 | 1.7 | | 3.6 | 1.7 |
| | | | | | | | |
| Coverage ratio | | 115.5 | 146.6 | 190.1 | | 115.5 | 190.1 |
| | | | | | | | |
| Efficiency ratio | | 2.8 | 1.3 | 3.2 | | 2.3 | 2.6 |
| | | | | | | | |
| ROAE | | 25.2 | 23.3 | 13.8 | | 20.9 | 18.7 |
| | | | | | | | |
| ROAA | | 3.0 | 2.9 | 1.7 | | 2.5 | 2.3 |
| | | | | | | | |
| Capitalization Ratio: | | | | | | | |
| Credit Risk | | 20.0 | 24.1 | 23.3 | | 20.0 | 23.3 |
| Credit, Market and operations risk | | 4.9 | 0 | 0.5 | | 4.9 | 0.5 |
| | | | | | | | |
| Liquidity | | 90.7 | 96.6 | 104.3 | | 90.7 | 104.3 |
| | | | | | | | |
| NIM (Net Interest Margin) | | 3.3 | 3.3 | 3.4 | | 3.2 | 3.4 |
Note: ratios are prepared according to the general rules applicable to financial information of credit institutions, issued by the CNBV, according to Annex 34 of the CUB.
NPL RATIO = Balance of past due loans portfolio as of the end of the quarter / Balance of loans portfolio as of the end of the quarter.
COVERAGE RATIO= Balance of provision for loan losses as of the end of the quarter / Balance of past due loans portfolio as of the end of the quarter.
EFFICIENCY RATIO = Administration and promotion expenses of the quarter, annualized / Total Average Assets.
ROAE = Annualized quarterly net earnings/ Average stockholders’ equity.
ROAA = Annualized quarterly net earnings /Total average assets.
BREAKDOWN OF CAPITALIZATION RATIO: (1)=Net Capital/ Assets subject to credit risk. (2)=Net Capital / Assets subject to credit, market and operation risk.
LIQUIDITY = Current Assets/ Current Liabilities.
Where: Current Assets = Availabilities + securities for trade + securities available for sale.
Current liabilities= Demand deposits + bank loans and loans from other entities, payable on demand, + short term bank loans and loans from other entities.
NIM = Quarterly Net Interest Margin, adjusted by annualized credit risks, / Average interest-earning assets.
Where: Average interest-earning assets = availabilities, investments in securities, transactions with securities and derivatives and loan portfolio.
Notes:
Average = ((Balance of the corresponding quarter + balance of the previous quarter) / 2).
Annualized figures = (Flow of the corresponding quarter * 4).
4Q.13 | EARNINGS RELEASE | 53
Notes to financial statements
| Grupo Financiero Santander Mexico | |
| As of December 31, 2013 | |
| (Millions of pesos, except for number of shares) | |
| | |
| 1. Financial Instruments | |
| | |
| Financial instruments are constituted as follows: | |
| | Accounting Value |
| Trading Securities: | |
| Bank Securities | 2,660 |
| Government Securities | 93,574 |
| Private | 2,246 |
| Shares | 5,023 |
| | 103,503 |
| | |
| Securities available for sale: | |
| Bank Securities | 502 |
| Government Securities | 54,880 |
| Other | 6,073 |
| | 61,455 |
| | |
| Securities held until maturity: | |
| Government securities (Cetes especiales) | 5,286 |
| | 5,286 |
| | |
| Total Financial Instruments | 170,244 |
| 2. Sale and repurchase agreements | |
| The sale and repurchase agreements is constituted as follows: |
| | Net Balance |
| Debit Balances | |
| Bank Securities | 4,734 |
| Government Securities | 30,771 |
| Private Securities | 0 |
| Total | 35,505 |
| | |
| Credit balances | |
| Bank Securities | 904 |
| Government Securities | 73,512 |
| Private Securities | 2,716 |
| Total | 77,132 |
| | (41,627) |
4Q.13 | EARNINGS RELEASE | 54
| 3. Investment in securities different to government securities |
| | | | |
| The table below lists the investments in debt securities of a same issuer, with positions equal or greater than 5% of Tier 1 Capital of the Bank. |
| Issuer / Series | Maturity date | % Rate | Book Value |
| | | | |
| PEM0001 150716 | 16-jul-15 | 9.91% | 3,786 |
| PEMEX 020622 | 02-jun-22 | 8.25% | 827 |
| PEMEX 13-2 | 12-sep-24 | 7.19% | 2 |
| PEMEX 999999 | 28-sep-13 | 6.63% | 27 |
| PEMEX2 151215 | 15-dec-15 | 5.75% | 1,428 |
| PEMEX3 030519 | 03-may-19 | 8.00% | 460 |
| PEMEX3 210121 | 21-jan-21 | 5.50% | 405 |
| | | Total | 6,935 |
| Tier 1 Capital as of December, 2013 | 86,531 |
| 5 % of Tier 1 Capital | | | 4,327 |
| 4. Derivative Financial Instruments | | | |
| | | | |
| The nominal value of the different derivative financial instruments agreements for trading and hedging purposes, as of December 31, 2013, are as follows: |
| | | | |
TRADING Swaps | | | |
| Interest Rate | 3,311,245 | | |
| Foreign Exchange | 612,662 | | |
| | | | |
| Futures | Buy | | Sell |
| Interest Rate | 0 | | 319,444 |
| Foreign Exchange | 4,933 | | 0 |
| Index | 7,618 | | 3,756 |
| | | | |
| Forward Contracts | | | |
| Interest Rate | 0 | | 1,400 |
| Foreign Exchange | 204,006 | | 4,532 |
| Equity securities | 3,870 | | 11,571 |
| | | | |
| Options | Long | | Short |
| Interest Rate | 211,853 | | 214,684 |
| Foreign Exchange | 22,991 | | 22,738 |
| Indexes | 2,716 | | 414 |
| Equity securities | 857 | | 906 |
| Total for trading | 4,382,751 | | 579,445 |
| | | | |
| HEDGE | | | |
| Cash Flow | | | |
| Interest Rate Swaps | 2,725 | | |
| Cross Currency Swaps | 19,201 | | |
| Foreign Exchange Forwards | 7,235 | | |
4Q.13 | EARNINGS RELEASE | 55
| Fair Value | | | |
| Interest Rate Swaps | 9,370 | | |
| Cross Currency Swaps | 6,922 | | |
| Total for hedge | 45,453 | | |
| | | | |
| Total Financial Instruments | 4,428,204 | | 579,445 |
5. Current Loan Portfolio | | | | |
| The loan portfolio, by type of loan and currency, as of December 31, 2013, is constituted as follows: |
| | Amount |
| | Pesos | USD | UDIS | Total |
| | | | | |
| Commercial or business activities loans | 142,472 | 45,430 | 1 | 187,903 |
| Financial entities loans | 1,724 | 522 | 0 | 2,246 |
| Government entities loans | 23,722 | 13,765 | 0 | 37,487 |
| Commercial loans | 167,918 | 59,717 | 1 | 227,636 |
| Consumer loans | 66,609 | 0 | 0 | 66,609 |
| Mortgages | 84,485 | 864 | 1,295 | 86,644 |
| Total | 319,012 | 60,581 | 1,296 | 380,889 |
| 6. Past Due Loans |
| | Amount |
| | Pesos | USD | UDIS | Total |
| | | | | |
| Commercial or business activities loans | 7,238 | 42 | 0 | 7,280 |
| Government entities loans | 0 | 0 | 0 | 0 |
| Commercial loans | 7,238 | 42 | 0 | 7,280 |
| Past due consumer loans | 2,696 | 0 | 0 | 2,696 |
| Past due mortgage loans | 3,615 | 183 | 269 | 4,067 |
| Total | 13,549 | 225 | 269 | 14,043 |
| The analysis of movements in past due loans from January 1 to December 31, 2013, is as follows: |
| | | | | | |
| Balance as of December 31, 2012 | | | | | 6,093 |
| Acquisition of Santander Vivienda | | | | | 1,481 |
| | | | | | |
| Plus: Transfer from current loan portfolio to past due loans | | | 24,389 |
| | | | | | |
| Collections: | | | | | |
| Cash | | | (2,204) | | |
| Transfer to current loan portfolio | | (3,015) | | (5,219) |
| | | | | | |
| Restructured loans | | | | | (191) |
| | | | | | |
| Charges off | | | | | (12,511) |
| Balance as of December 31, 2013 | | | | | 14,043 |
4Q.13 | EARNINGS RELEASE | 56
| 7. Allowance for loan losses | | | | | | | |
| | | | | | | | |
| The movements in the provision for loan losses, from January 1 to December 31, 2013, are as follows: |
| | | | | | | | |
| Balance as of December 31, 2012 | | | | | | | 11,580 |
| | | | | | | | |
| Provisions for loan losses | | | | | | | 12,852 |
| Portfolio Reserves (Santander Vivienda) at fair value | | | | 981 |
| Recoveries credited in results from retained earnings | | | | (43) |
| Charge-offs | | | | | | | (12,511) |
| Provisions for loan losses recorded against shareholders’ equity | | | | 3,445 |
| Foreign exchange result | | | | | | | (82) |
| Balance as of December 31, 2013 | | | | | | | 16,222 |
| | | | | | | | |
The table below presents a summary of charge-offs by type of product as of December 31, 2013: |
| | | | | | | | |
| Product | Charge-offs | | Debit Relieves | | Total | | % |
| | | | | | | | |
| First Quarter | | | | | | | |
| Commercial Loans | 464 | | 6 | | 470 | | 20% |
| Mortgage loans* | 213 | | 3 | | 216 | | 9% |
| Credit card loans | 893 | | 36 | | 928 | | 39% |
| Consumer loans | 765 | | 20 | | 786 | | 33% |
| Total | 2,335 | | 65 | | 2,400 | | 100% |
| | | | | | | | |
| Second Quarter | | | | | | | |
| Commercial loans | 509 | | 11 | | 520 | | 19% |
| Mortgage loans* | 96 | | 4 | | 100 | | 4% |
| Credit card loans | 1,254 | | 30 | | 1,284 | | 47% |
| Consumer loans | 818 | | 13 | | 831 | | 30% |
| Total | 2,677 | | 58 | | 2,734 | | 100% |
| | | | | | | | |
| Third Quarter | | | | | | | |
| Commercial loans | 674 | | 12 | | 686 | | 21% |
| Mortgage loans* | 184 | | 5 | | 189 | | 6% |
| Credit card loans | 1,392 | | 30 | | 1,422 | | 43% |
| Consumer loans | 1,007 | | 12 | | 1,019 | | 31% |
| Total | 3,257 | | 60 | | 3,316 | | 100% |
| | | | | | | | |
| Fourth Quarter | | | | | | | |
| Commercial loans | 1,055 | | 21 | | 1,076 | | 27% |
| Mortgage loans* | 168 | | 8 | | 176 | | 4% |
| Credit card loans | 1,792 | | 31 | | 1,823 | | 45% |
| Consumer loans | 974 | | 11 | | 985 | | 24% |
| Total | 3,989 | | 72 | | 4,061 | | 100% |
4Q.13 | EARNINGS RELEASE | 57
| | | | | | | | |
| | | | | | | | |
| Accumulated 2013 | | | | | | | |
| Commercial loans | 2,702 | | 49 | | 2,751 | | 22% |
| Mortgage loans* | 661 | | 21 | | 681 | | 6% |
| Credit card loans | 5,330 | | 127 | | 5,457 | | 44% |
| Consumer loans | 3,565 | | 56 | | 3,621 | | 29% |
| Total | 12,258 | | 253 | | 12,511 | | 100% |
| | | | | | | | |
| *FOVI remainings included for Ps.508.4 | | | | | | | |
| | | | | | | | |
| Allowance for Loan Losses from the Commerce Fund | | | | |
| Pursuant to the Commission's authorization in Official Bulletin No. 601-I-DGSIF "C" - 38625 issued on March, 2001; as of December 31, 2013, there are Ps. 26 in allowances for loan losses from the commerce fund, which resulted from the restructuring process of Grupo Financiero Santander. As of December 31, 2012, such allowances totaled Ps. 55. |
| During the fourth quarter of 2013, the abovementioned allowances for loan losses had the following breakdown: |
| | | | | | | | |
| Mortgage and commercial loans charge-offs | | | | (29) |
| UDIs reserves actualization and foreign exchange results | | | | 0 |
| | | | | | | | (29) |
| | | | | | | | |
8. Problematic Loans
Loans portfolio was graded according to the general provisions issued by the National Banking and Exchange Commission. The management considers that problematic loans are the ones graded as “D” and “E”, due to their low possibility for the collection of the full amount of principal.
| 9. Programs of benefits to bank debtors with the support of the Federal Government. | |
| As of December 31, 2013, the accounts receivable from the federal government are $219, regarding the early termination of benefit programs granted to bank debtors. |
| Early termination of the support programs for debtors |
| On July 15, 2010, an Agreement for the early termination of the support programs for bank debtors (the “Agreement”) was entered into. The credit institutions considered to early terminate the following programs, which were created between years 1995- 1998, derived from restructuring of loans, as follows: |
1. Support Program for Mortgages Debtors (Support Program); |
2. Support Program for the Construction of Housing, in the stage of individual loans (Support Program), and |
3. Agreement on benefits for Mortgages Debtors (Discounts Program) |
The credit institutions reached an agreement with the Mexican Treasury Department (Secretaría de Hacienda y Crédito Público (SHCP)) and the Commission. The banks were represented by the Mexican Bank’s Association (Asociación de Bancos de Mexico, A.C. (ABM)) and it establishes that, for the correct application of the early termination agreement, the credit institutions are to be subject to the supervision and monitoring of the Commission, and they shall comply with all the comments and corrections made by such Commission and they shall deliver all the information requested by the Commission for the fulfillment of the agreement. |
| Restructured loans or loans in UDIs granted under the Support Programs for debtors, loans in Mexican pesos; loans in Mexican pesos with right to receive the benefits of the Discounts Program and, loans that, as of December 31, 2010, were current, as well as past due loans that as of the aforementioned date, had been restructured, and those loans that, in order to continue in effect, received a write-off or discount, whatever the amount, were subject to the scheme of early termination, provided that evidence of payments was delivered. |
4Q.13 | EARNINGS RELEASE | 58
| 10. Average Interest Rates paid on deposits |
| The average interest rates paid on deposits during December 2013, is as follow: |
| | Pesos | | USD |
| | | | |
| Average balance | 200,933 | | 21,769 |
| Interest | 772 | | 3 |
| Rate | 1.5030% | | 0.0592% |
11. Bank and other Loans | | | | | |
| As of December 30, 2013, banks and other loans are constituted as follows: | | |
| | | | Average | | |
| Liabilities | Amount | | Rate | | Maturity |
| | | | | | |
| Loans in Mexican pesos | | | | | |
| | | | | | |
| Bank of Mexico | 3,188 | | 3.20% | | 2 days |
| Call money | 5,505 | | 4.54% | | From 9 days to 4 years |
| Bank loans | 10,477 | | 8.00% | | From 30 years |
| Public fiduciary funds | 4,839 | | 3.49% | | From 1 days to 17 years |
| Government loans | 7,031 | | 6.18% | | From 1 day to 7 years |
| Total | 31,040 | | | | |
| Loans in foreign currency | | | | | |
| | | | | | |
| Foreign bank loans | 11,549 | | 0.92% | | From 7 days to 7 years |
| Mexican bank loans | 1,096 | | 0.36% | | 2 days |
| Call money | 1,308 | | 0.50% | | 6 days |
| Bank loans | 1 | | 1.00% | | 20 days |
| Public fiduciary funds | 233 | | 1.16% | | From 3 days to 5 years |
| Development bank loans | 113 | | 2.78% | | From 3 days to 3 years |
| Total | 14,301 | | | | |
| | | | | | |
| Total loans | 45,340 | | | | |
| Accrued interests | 39 | | | | |
| | | | | | |
| Total bank and other Loans | 45,380 | | | | |
| 12. Current and Deferred Taxes | | |
| | | |
| Current taxes as of December 31, 2013 | | |
| | | |
| Income taxes | 2,803 | |
| Deferred taxes | (2,115) | (1) |
| Total Bank | 688 | |
| Current and deferred taxes from other subsidiaries | 2,164 | |
| Total Financial Group | 2,852 | |
4Q.13 | EARNINGS RELEASE | 59
| | | |
| (1) Deferred taxes are broken down as follows: | | |
| | | |
| Global provision | (1,073) | |
| Fixed Assets | (318) | |
| Net effect from financial instruments | (1,380) | |
| Accrued liabilities | 955 | |
| Other | (299) | |
| Total Bank | (2,115) | |
| Allowance for loan losses of subsidiaries, net | (838) | |
| Others, subsidiaries | 178 | |
| Total deferred tax, Financial Group | (2,775) | |
| | | |
| As of December 31, 2013, Deferred Assets and Liabilities are registered at 100% |
| | | |
| Remainder of global provisions and allowance for loan losses | 9,935 | |
| Other concepts | 8,153 | |
| Total deferred tax (net) | 18,088 | |
| 13. | Share of employees in profits |
As of December 31, 2012, Santander México acknowledged the PTU I the net result pursuant to article 127, fraction III of the LFT.
The amount of the differed PTU recorded in the results as of December 31, 2013 within the entry of “Administrative and promotion expenses” amounts to Ps.3,200. Upon closing of the fiscal year there is a liability for an amount of Ps.233 for the current PTU pending payment.
As of December 31 2013, the differed PTU is comprised as follows:
| Asset per differed PTU: | | |
Allowance for loan losses deducting outstanding | 1,795 | |
| Personal property and equipment and differed charges | 654 | |
| Accrued liabilities | 346 | |
| Fiscal losses due to amortization of shares | 727 | |
| Commissions and interests early collected | 112 | |
| Property seized | 34 | |
| Capital gain on financial instruments | 93 | |
| Asset differed PTU | 3,761 | |
| | | |
| Liability for differed PTU (liability): | | |
| Labor obligations | (24) | |
| Derivative financial transactions of exchange rate | (107) | |
| Early payments | (44) | |
| Others | (19) | |
| Liability differed PTU | (194) | |
| | | |
| Minus - Constituted reserve | (329) | |
| | | |
| Differed PTU asset (net) | 3,238 | |
4Q.13 | EARNINGS RELEASE | 60
| 14. Other operating income | | |
| The main items that constitute the balance of Other Income (Expenses) account, as of December 31, 2013, are the following: | |
| | | |
| Concept: | | |
| Recoveries of loans previously charged-off | 2,155 | |
| Sales of fixed assets | 5 | |
| Write-offs of liabilities and reserves | 292 | |
| Result from foreclosed assets | 124 | |
| Interest on personnel loans | 122 | |
| Technical advisory services | 93 | |
| Expenses on collections | (507) | |
| Write-offs | (651) | |
| Provisions for legal and tax contingencies | (145) | |
| Other | 238 | |
| | 1,726 | |
| 15. Capitalization Ratio | | | |
| Banco Santander (Mexico), S.A. | | | |
Table I.1
Form for the disclosure of capital of paid-in capital without considering transiency in the application of adjustments in the regulation
| Reference | Capital Description | Capital |
| | Level 1 (CET 1) Ordinary capital: Instruments and reserves | |
| 1 | Ordinary shares that qualify for level 1 Common Capital plus corresponding premium | 34,798 |
| 2 | Earnings from previous fiscal years | 30,004 |
| 3 | Other elements of other comprehensive income (and other reserves) | 28,018 |
| 4 | Capital subject to gradual elimination of level 1 ordinary capital (only applicable for companies that are not lined to shares) | |
| 5 | Ordinary shares issued by subsidiaries held by third parties (amount allowed in level 1 ordinary capital) | |
| 6 | Level 1 ordinary capital before adjustments to regulation | 92,820 |
| | Level 1 Ordinary capital: adjustments to regulation | |
| 7 | Adjustments due to prudential valuation | |
| 8 | Commercial credit (net of its corresponding deferred profit taxes debited) | 1,735 |
| 9 | Other intangibles other than rights to mortgage rights (net of its corresponding deferred profit taxes debited) | 2,017 |
10 (conservative) | Deferred taxes to profit credited relying on future income excluding those that derive from temporary differences (net of deferred profit taxes debited) | 0 |
| 11 | Results of valuation of cash flow hedging instruments | 0 |
| 12 | Reserves to be constituted | 0 |
| 13 | Benefits over remnant of securitization transactions | 0 |
| 14 | Losses and gains caused for the changes in credit rating of liabilities assessed at a reasonable value | |
| 15 | Pension plan for defined benefits | 0 |
4Q.13 | EARNINGS RELEASE | 61
16 (conservative) | Investments in proprietary shares | 8 |
17 (conservative) | Reciprocal investments in ordinary capital | 0 |
18 (conservative) | Investments in capital of banks, financial institutions and insurance companies out of the reach of the regulation consolidation, net of short eligible positions, wherein the institution does not hold more than 10% of the issued capital (amount that exceeds the 10% threshold) | 43 |
19 (conservative) | Significant investments in ordinary shares of banks, financial institutions and insurance companies out of the scope of the regulation consolidation, nets of eligible short positions, wherein the institutions holds more than 10% of the issued capital (amount that exceeds the 10% threshold) | 0 |
20 (conservative) | Rights for mortgage services (amount exceeding the 10% threshold) | 0 |
| 21 | Deferred taxes to profit credited resulting from temporary differences (amount exceeding the 10% threshold, net of deferred taxes debited) | 1,768 |
| 22 | Amount exceeding the 15% threshold. | |
| 23 | of which: significant investments wherein the institution holds more than 10% of ordinary shares of financial institutions | |
| 24 | of which: rights for mortgage services | |
| 25 | of which: Taxes to profit Deferred credited deriving from temporary differences | |
| 26 | National regulation adjustments | 17,841 |
| A | of which: Other elements of wholesome profit (and other reserves) | 0 |
| B | of which: investments in subordinated debt | 0 |
| C | of which: profit or increase in the value of assets from the purchase of securitization positions (Originating Institutions) | 0 |
| D | of which: investments in multilateral entities | 0 |
| E | of which: investments in related corporations | 14,891 |
| F | of which: investments in risk capital | 0 |
| G | of which: investments in investment corporations | 0 |
| H | of which: Funding for the purchase of proprietary shares | 0 |
| I | of which: Transactions in breach of provisions | 0 |
| J | of which: Deferred charges and installments | 676 |
| K | of which: Positions in First Losses Schemes | 0 |
| L | of which: Worker's Deferred Profit Sharing | 0 |
| M | of which: Relevant Related Persons | 0 |
| N | of which: Pension plan for defined benefits | 0 |
| O | of witch: Adjustment for capital acknowledgment | 0 |
| P | of which: investments in Clearing Houses | 2,274 |
| 27 | Regulation adjustments that apply to level 1 common stock due to level 1 capital shortage and level 2 capital to cover deductions | 0 |
| 28 | Total regulation adjustments to level 1 Common Capital | 23,411 |
| 29 | Level 1 Common Capital (CET1) | 69,409 |
| | Level 1 additional capital: instruments | |
| 30 | Instruments directly issued that qualify as level 1 additional capital, plus premium | 0 |
| 31 | of which: Qualify as capital under the applicable accounting criteria | 0 |
| 32 | of which: Qualify as liability under the applicable accounting criteria | |
| 33 | Capital instruments directly issued subject to gradual elimination of level 1 additional capital | 0 |
4Q.13 | EARNINGS RELEASE | 62
| 34 | Instruments issued of level 1 additional capital and level 1 Common Capital instruments that are not included in line 5 issued by subsidiaries held by third parties (amount allowed at additional level 1) | 0 |
| 35 | of which: instruments issued by subsidiaries subject to gradual elimination | |
| 36 | Level 1 additional capital before regulation adjustments | 0 |
| | Level 1 additional capital: regulation adjustments | |
37 (conservative) | Investments in held instruments of level 1 additional capital | |
38 (conservative) | Investments in reciprocal shares in level 1 additional capital instruments. | |
39 (conservative) | Investments in capital of banks, financial institutions and insurance companies out of the scope of the regulation consolidation, net of short eligible positions, wherein the institution holds more than 10% of the issued capital | |
40 (conservative) | Significant investments in ordinary shares of banks, financial institutions and insurance companies out of the scope of the regulation consolidation, nets of eligible short positions, wherein the institutions holds more than 10% of the issued capital | |
| 41 | National regulation adjustments | 0 |
| 42 | Regulation adjustments that apply to level 1 common stock due to level 1 capital shortage and level 2 capital to cover deductions | |
| 43 | Total regulation adjustments to level 1 additional Common Capital | 0 |
| 44 | Level 1 additional capital (AT1) | 0 |
| 45 | Level 1 capital (T1 = CET1 + AT1) | 69,409 |
| | Level 2 capital: instruments and reserves | |
| 46 | Instruments directly issued that qualify as level 2 capital, plus premium | 16,891 |
| 47 | Capital instruments directly issued subject to gradual elimination of level 2 capital. | 0 |
| 48 | Level 2 capital instruments and level 1 Common Capital instruments and level 1 additional capital that has not been included in lines 5 or 34, which have been issued by subsidiaries held by third parties (amount allowed in level 2 completer capital) | 0 |
| 49 | of which: instruments issued by subsidiaries subject to gradual elimination | 0 |
| 50 | Reserves | 231 |
| 51 | Level 2 capital before regulation adjustments | 17,122 |
| | Level 2 capital : regulation adjustments | |
52 (conservative) | Investments in own instruments of level 2 capital | |
53 (conservative) | Reciprocal investments in level 2 capital instruments | |
54 (conservative) | Investments in capital of banks, financial institutions and insurance companies out of the scope of the regulation consolidation, net of short eligible positions, wherein the institution does not hold more than 10% of the issued capital (amount exceeding the 10% threshold) | |
55 (conservative) | Significant investments in ordinary shares of banks, financial institutions and insurance companies out of the scope of the regulation consolidation, nets of eligible short positions, wherein the institutions holds more than 10% of the issued capital | |
| 56 | National regulation adjustments | 0 |
| 57 | Total regulation adjustments to level 2 capital | 0 |
| 58 | Level 2 capital (T2) | 17,122 |
| 59 | Total stock (TC = T1 + T2) | 86,531 |
| 60 | Assets weighted by total risk | 543,725 |
4Q.13 | EARNINGS RELEASE | 63
| | Capital reasons and supplements | |
| 61 | Level 1 Common Capital (as percentage of assets weighted by total risks) | 12.77% |
| 62 | Level 1 Stock (as percentage of assets weighted by total risks) | 12.77% |
| 63 | Total capital (as percentage of assets weighted by total risks) | 15.91% |
| 64 | Institutional specific supplement (must at least consist of: the level 1 Common Capital requirement plus the capital maintenance cushion, plus the countercyclical cushion, plus G-SIB cushion; expressed as percentage of the assets weighted by total risks) | 7.00% |
| 65 | of which: Supplement of capital preservation | 2.50% |
| 66 | of which: Supplement of specific bank countercyclical | |
| 67 | of which: Supplement of systematically important global banks (G-SIB) | |
| 68 | Level 1 Common Capital available for hedging of supplements (as percentage of assets weighted by total risks) | 5.77% |
| | National minimums (if other than those of Basel 3) | |
| 69 | National minimum reason of CET1 (if different than the minimum established by Basilea 3) | |
| 70 | National minimum reason of T1 (if different than the minimum established by Basel 3) | |
| 71 | National minimum reason of TC (if different than the minimum established by Basel 3) | |
| | Amounts under the deduction thresholds (before weighting by risk) | |
| 72 | Non-significant investment in the capital of other financial institutions | |
| 73 | Significant investment in the capital of other financial institutions | |
| 74 | Rights for mortgage services (net of Deferred profit taxes debited) | |
| 75 | Deferred profit taxes credited derived from temporary differences (net of Deferred profit taxes debited) | 7,118 |
| | Applicable limits to the inclusion of reserves in level 2 capital | |
| 76 | Eligible reserves to be included in level 2 capital with respect to expositions subject to standardized methodology (prior application of limit) | 0 |
| 77 | Limit in the inclusion of level 2 capital provisions under standardized methodology | 0 |
| 78 | Eligible reserves for inclusion in level 2 capital with respect to expositions subject to internal rating methodology (prior to application of limit) | |
| 79 | Limit in the inclusion of reserves in level 2 capital under internal rating methodology | |
| | Capital instruments subject to gradual elimination (applicable only between January 1, 2018 and January 1, 2022) | |
| 80 | Current limit of CET1 instruments subject to gradual elimination | |
| 81 | Amount excluded from CET1 due to limit (excess over the limit after amortization and maturity periods) | |
| 82 | Current limit of AT1 instruments subject to gradual elimination | |
| 83 | Amount excluded from AT1 due to limit (excess over the limit after amortization and maturity periods) | |
| 84 | Current limit of T2 instruments subject to gradual elimination | |
| 85 | Amount excluded from T2 due to limit (excess over the limit after amortization and maturity periods) | |
4Q.13 | EARNINGS RELEASE | 64
Table I.2
Notes to the disclosure form of paid-in capital without considering transiency in the application of regulatory adjustments
| Reference | Description |
| 1 | Elements of capital contributed pursuant to fraction I item a) numbers 1) and 2) of Article 2 Bis 6 hereof |
| 2 | Results from previous fiscal years and their corresponding updates. |
| 3 | Capital reserves, net result, result per assessment of titles available for sale, accrued effect per conversion, result per assessment of cash flow hedging instruments and result per ownership of non-monetary assets. |
| 4 | Does not apply. The capital stock of credit institutions in Mexico is represented by representative certificates or shares. This concept only applies for entities where such capital is represented by representative certificates or shares. |
| 5 | Does not apply for the capitalization scope in Mexico which is on a non-consolidated basis. This concept will only apply for entities with a consolidated scope. |
| 6 | Sum of concepts 1 through 5. |
| 7 | Does not apply. In Mexico the use of internal models for calculating capital requirements per market risk is not allowed. |
| 8 | Commercial credit, net of owed differed profit taxes pursuant to the provisions of fraction I item n) of Article 2 Bis 6 hereof. |
| 9 | Intangibles, other than commercial credit, and if applicable to mortgage service rights, net of owed deferred profit taxes, pursuant to the provisions of fraction I item n) of Article 2 Bis 6 hereof. |
| 10* | Credited deferred profit taxes from losses and fiscal credits pursuant to the provisions of fraction I item p) of Article 2 Bis 6 hereof. |
| | This is a more conservative approach than the one established by the Basel Committee on Banking Supervision in its document "Basel III: Global legal framework for the reinforcement of banks and banking systems" published on June 2011, given that it does not allow to set off with owed differed profit taxes. |
| 11 | Result from assessment of cash flow hedging instruments corresponding to hedged entries that are not assessed at reasonable value. |
| 12* | Reserves pending constitution pursuant to the provisions of fraction I item k) of Article 2 Bis 6 hereof. |
| | This is a more conservative approach than the one established by the Basel Committee on Banking Supervision in its document "Basel III: Global legal framework for the reinforcement of banks and banking systems" published on June 2011, given that deducts from level 1 common stock the preventive reserves pending constitution, according to the provisions of Chapter V of the Second Title hereof, as well as those constituted charged to accounting accounts that are part of the result entries or shareholders' equity and not only the positive difference between the Aggregate Expected Losses minus the Aggregate Admissible Reserves, in the event the Institutions use methods based in internal qualifications in the determination of their capital requirements. |
| 13 | Benefits over the remnant in securitization transactions pursuant to the provisions of fraction I item c) of Article 2 Bis 6 hereof. |
| 14 | Does not apply |
| 15 | Investments made by the benefit pension fund defined corresponding to resources to which the Institution does not have unrestrictive or unlimited access. These investments are considered as net of the plan's liabilities and owed differed taxes to profit that correspond that have not been applied in any other regulatory adjustment. |
| 16* | The amount of the investment in any share acquired by the Institution: pursuant with the provisions of the Law according to the provisions of fraction I item d) of Article 2 Bis 6 hereof; through indexes |
4Q.13 | EARNINGS RELEASE | 65
| | This is a more conservative approach to the one established by the Basel Committee on Banking Supervision in its documents "Basel III: Global regulatory framework for the reinforcement of banks and banking systems" published on June 2011 given that the deduction |
| 17* | Investments, in capital of corporations, other than financial entities referred to by item f) of Article 2 Bis 6 hereof, that are in turn, directly or indirectly, shareholders of the institution itself, of the corporation |
| | This is a more conservative approach to the one established by the Basel Committee on Banking Supervision in its documents "Basel III: Global regulatory framework for the reinforcement of banks and banking systems" published on June 2011 given that the deduction for this concept is made in the level 1 common stock, irrespective of the capital level where it has been invested, and in addition because any type of entity is considered, not only financial entities. |
| 18* | Investments in shares, where the Institution owns up to 10% of the capital stock of the financial entities referred to by Articles 89 of the Law and 31 of the Law Regulating Financial Groups pursuant to the provisions of fraction I item f) of Article 2 Bis 6 hereof, including those investments made through investment corporations referred to by fraction I item i) of Article 2 Bis 6. The previous investments exclude those made in the capital of development and promotion multilateral organizations of an international nature that have a credit Qualification assigned by any of the issuer's Qualifying Institutions, equal or greater than long term Risk Degree 2. |
| | This is a more conservative approach to the one established by the Basel Committee on Banking Supervision in its documents "Basel III: Global regulatory framework for the reinforcement of banks and banking systems" published on June 2011 given that the deduction for this concept is made in level 1 common stock, irrespective of the capital level in which it is invested, and additionally because it is deducted from the aggregate amount registered of the investments. |
| 19* | Investments in shares, where the Institution owns up to 10% of the capital stock of the financial entities referred to by Articles 89 of the Law and 31 of the Law Regulating Financial Groups pursuant to the provisions of fraction I fraction f) of Article 2 Bis 6 hereof, including those investments made through investment corporations referred to by fraction I item i) of Article 2 Bis 6. The previous investments exclude those made in development and promotion multilateral organizations of an international nature that have a credit Qualification assigned by any of the issuer's Qualifying institutions, equal or greater than long term Risk Degree 2. |
| | This is a more conservative approach to the one established by the Basel Committee on Banking Supervision in its documents "Basel III: Global regulatory framework for the reinforcement of banks and banking systems" published on June 2011 given that the deduction for this concept is made from level 1 common stock, irrespective of the level of capital where it has been investment, and additionally because the aggregate amount registered of investments is deducted. |
| 20* | Mortgage service s rights shall be deducted from the aggregate amount registered in the event these rights exist. |
| | This is a more conservative approach to the one established by the Basel Committee on Banking Supervision in its documents "Basel III: Global regulatory framework for the reinforcement of banks and banking systems" published on June 2011 given that the aggregate amount registered of rights is deducted. |
| 21 | The amount of credited deferred profit taxes originating from temporary differences minus the corresponding owed differed profit taxes not considered to set-off other adjustments, exceeding 10% of the difference between the reference 6 and the sum of references 7 through 20. |
| 22 | Does not apply. Concepts were deducted from the aggregate capital. See notes of references 19, 20 and 21. |
| 23 | Does not apply. Concepts were deducted from the aggregate capital. See note of references 19. |
| 24 | Does not apply. Concepts were deducted from the aggregate capital. See note of reference 20. |
| 25 | Does not apply. Concepts were deducted from the aggregate capital. See note of reference 21. |
4Q.13 | EARNINGS RELEASE | 66
| 26 | National adjustments considered as the sum of the following concepts. |
| A. | The sum of the accrued effect for conversion and result for ownership of non-monetary assets considering the amount of each of these concepts with a sign different than the one considered to include them in reference 3, namely, if positive in this concept shall be entered as negatives and vice versa. |
| B. | Investments in subordinated debt instruments, pursuant to the provisions of fraction I item b) of Article 2 Bis 6 hereof. |
| C. | The amount resulting if on account of the purchase of securitization positions, the originating Institutions register a profit or increase in the value of their assets with respect to the assets previously registered in its balance, pursuant to the provisions of fraction I item c) of Article 2 Bis 6 hereof. |
| D. | Investments in capital of development or promotion multilateral organizations of an international nature pursuant to the provisions of fraction I item f) of Article 2 Bis 6 hereof, that have a credit Qualification assigned by any of the issuer's Qualifying Institutions, equal or better to long term Risk Degree 2. |
| E. | Investments in shares or corporations related to the Institution under the terms of Articles 73, 73 Bis and 73 Bis 1 of the Law, including the amount corresponding to investments in investment corporations and investments indices pursuant to the provisions of fraction I item g) of Article 2 Bis 6 hereof. |
| F. | Investments made by development banking institutions in risk capital, pursuant to the provisions of fraction I item h) of Article 2 Bis 6 hereof. |
| G. | Investments in shares, other than fix capital, in listed investment corporations wherein the Institutions holds more than 15 per cent of shareholder's equity of the aforementioned investment corporation, pursuant to fraction I item i) of Article 2 Bis 6, that have not been considered in the preceding references. |
| H. | Any type of contribution which resources are destined to the purchase of shares in the financial group's holding company, of the other financial entities that comprise the group to which the Institution belongs or of the financial affiliates of the latter pursuant to the provisions of fraction I item l) of Article 2 Bis 6 hereof. |
| I. | Transactions that infringe the provisions, pursuant to the provisions of fraction I item m) of Article 2 Bis 6 hereof. |
| J. | Differed charges and early payments, net of owed differed profit taxes, pursuant to the provisions of fraction I item n) of Article 2 Bis 6 hereof. |
| K. | Positions pertaining to the First Losses Scheme where the risk is preserved or credit protection is provided up to a certain limit of a position pursuant to fraction I item o) of Article 2 Bis 6. |
| L. | Worker's participation in credited differed profits pursuant to fraction I item p) of Article 2 Bis 6 hereof. |
| M. | The added amount of Transactions Subject to Credit Risk owed by Relevant Related Persons pursuant to fraction I item r) of Article 2 Bis 6 hereof. |
| N. | The difference between the investments made by the benefit pension funds defined pursuant to Article 2 Bis 8 minus reference 15. |
| O. | Adjustment for the acknowledgment of Net Capital pursuant to Article 2 Bis 9 hereof. The amount shown corresponds to the amount registered in box C1 of the form included in section II hereof. |
| P. | The investments or contributions, directly or indirectly, in the corporation's capital or in the trust estate or other type of similar figures that have the purpose to set off and liquidate Transactions executed in the stock market, except for such corporation's or trust's share in the former pursuant to item f) fraction I of Article 2 Bis 6. |
| 27 | Does not apply. There are no regulatory adjustments for additional level 1 capital nor for ancillary capital. All regulatory adjustments are made from the level 1 common stock. |
| 28 | Sum of lines 7 through 22, plus lines 26 and 27. |
| 29 | Line 6 minus line 28. |
4Q.13 | EARNINGS RELEASE | 67
| 30 | The amount corresponding to titles representing the capital stock (including its share sale premium) that had not been considered in basic capital 1 and Capital Instruments, that meet the conditions established in fraction II of Article 2 Bis 6 hereof. |
| 31 | Amount of line 30 qualified as capital under the applicable accounting standards. |
| 32 | Does not apply. Instruments directly issued that qualify as additional level 1 capital, plus its premium are registered for accounting purposes as capital. |
| 33 | Subordinated obligations computed as basic capital 2, pursuant to the provisions of Article Third Transitory of Resolution 50th that amends the general provisions applicable to Credit Institutions, (Resolution 50th) |
| 34 | Does not apply. See note to reference 5. |
| 35 | Does not apply. See note to reference 5. |
| 36 | Sum of lines 30, 33 and 34. |
| 37* | Does not apply. Deduction is made in aggregate level 1 common capital. |
| 38* | Does not apply. Deduction is made in aggregate level 1 common capital. |
| 39* | Does not apply. Deduction is made in aggregate level 1 common capital. |
| 40* | Does not apply. Deduction is made in aggregate level 1 common capital. |
| 41 | National adjustments considered: |
| | Adjustment for the acknowledgment of Net Capital pursuant to Article 2 Bis 9 hereof. The amount shown corresponds to the amount registered in box C2 of the form included in section II hereof. |
| 42 | Does not apply. There are no regulatory adjustments for ancillary capital. All regulatory adjustments are made from the level 1 common stock. |
| 43 | Sum of lines 37 through 42. |
| 44 | Line 36, minus line 43. |
| 45 | Line 29, plus line 44. |
| 46 | The amount corresponding to titles representing the capital stock (including its share sale premium) that had not been considered in basic capital 1 nor in basic capital 2 and Capital Instruments, that comply with Exhibit 1-S hereof pursuant to the provisions of Article 2 Bis 7 hereof. |
| 47 | Subordinated obligations computed as ancillary capital, pursuant to the provisions of Article Third Transitory, of Resolution 50th |
| 48 | Does not apply. See note to reference 5. |
| 49 | Does not apply. See note to reference 5. |
| 50 | Preventive estimations for credit risk up to a sum of 1.25% of the assets weighed by credit risk corresponding to the Transactions that use the Standard Method to calculate the capital requirement per credit risk; and the positive difference of the Aggregate Admissible Reserves minus the Aggregate Expected Losses, up to an amount that does not exceed of 0.6 per cent of the assets weighed by credit risk, corresponding to the Transactions wherein the method based in internal qualifications to calculate the capital requirements by credit risk is used, pursuant to fraction III of Article 2 Bis 7. |
| 51 | Sun of lines 46 through 48, plus line 50. |
| 52* | Does not apply. The deduction is made in aggregate of level 1 common stock. |
| 53* | Does not apply. The deduction is made in aggregate of level 1 common stock. |
| 54* | Does not apply. The deduction is made in aggregate of level 1 common stock. |
| 55* | Does not apply. The deduction is made in aggregate of level 1 common stock. |
| 56 | National adjustments considered: |
| | Adjustment for the acknowledgment of Net Capital pursuant to Article 2 Bis 9 hereof. The amount shown corresponds to the amount registered in box C4 of the form included in section II hereof. |
| 57 | Sum of lines 52 through 56. |
4Q.13 | EARNINGS RELEASE | 68
| 58 | Line 51, minus line 57. |
| 59 | Line 45, plus line 58. |
| 60 | Weighed Assets Subject to Total Risks. |
| 61 | Line 29 divided by line 60 (expressed as percentages) |
| 62 | Line 45, divided by line 60 (expressed as percentages) |
| 63 | Line 59 divided by line 60 (expressed as percentages) |
| 64 | Report 7% |
| 65 | Report 2.5% |
| 66 | Does not apply. There is no requirement that corresponds to the countercyclical supplement. |
| 67 | Does not apply. There is no requirement that corresponds to the supplement of systematically important global banks (G-SIB). |
| 68 | Line 61 minus 7% |
| 69 | Does not apply. The minimum is the same as established by the Basel Committee on Banking Supervision in its document "Basel III: Global regulatory framework for the reinforcement of banks and banking systems" published in June 2011. |
| 70 | Does not apply. The minimum is the same as established by the Basel Committee on Banking Supervision in its document "Basel III: Global regulatory framework for the reinforcement of banks and banking systems" published in June 2011. |
| 71 | Does not apply. The minimum is the same as established by the Basel Committee on Banking Supervision in its document "Basel III: Global regulatory framework for the reinforcement of banks and banking systems" published in June 2011. |
| 72 | Does not apply. The concept was deducted from the aggregate capital. See note of reference 18. |
| 73 | Does not apply. The concept was deducted from the aggregate capital. See note of reference 19. |
| 74 | Does not apply. The concept was deducted from the aggregate capital. See note of reference 20. |
| 75 | The amount, that does not exceed 10% of the difference between reference 6 and the sum of references 7 through 20, of the credited differed profit taxes resulting from temporary differences minus those corresponding to owed profit taxes not considered to set off other adjustments. |
| 76 | Preventive estimations for credit risk corresponding to the Transactions that use the Standard Method to calculate the capital requirement per credit risk. |
| 77 | 1.25% of weighed assets per credit risk, corresponding to Transactions wherein the Standard Method to calculate the capital requirement by credit risk. |
| 78 | Positive difference of the Aggregate Admissible Reserves minus the Aggregate Expected Losses corresponding to Transactions wherein the method based in internal qualifications to calculate the capital requirement by credit risk is used. |
| 79 | 0.6 per cent of the weighted assets by credit risk, corresponding to Transactions wherein the method based in internal qualifications to calculate the capital requirement by credit risk is used. |
| 80 | Does not apply. There are no instruments subject to transience that compute in level 1 common stock |
| 81 | Does not apply. There are no instruments subject to transience that compute in level 1 common stock |
| 82 | Balance of instruments computed as capital in the basic portion by December 31, 2012 for the corresponding balance limit therein. |
| 83 | Balance of instruments computed as capital in the basic portion by December 31, 2012 minus line 33. |
| 84 | Balance of instruments computed as capital in the complementary portion by December 31, 2012 for the corresponding balance limit therein. |
| 85 | Balance of instruments computed as capital in the basic portion by December 31, 2012 minus line 47. |
Note: * The aforementioned approach is more conservative than the one established by the Basel Committee on Banking Supervision in its document "Basel III: Global regulatory framework for the reinforcement of banks and banking systems" published in June 2011.
4Q.13 | EARNINGS RELEASE | 69
Table II.1
Impact in Net Capital due to the procedure provided by Article 2 Bis 9 of CUB
| Capital Concepts | Without adjustment due to capital acknowledgment | % APSRT | Adjustment due to capital acknowledgment | With adjustment due to capital acknowledgment | % APSRT |
| Basic Capital 1 | 69,409 | 12.77% | 0 | 69,409 | 12.77% |
| Basic Capital 2 | 0 | 0.00% | 0 | 0 | 0.00% |
| Basic Capital | 69,409 | 12.77% | 0 | 69,409 | 12.77% |
| Complementary Capital | 17,122 | 3.14% | 0 | 17,122 | 3.14% |
| Net Capital | 86,531 | 15.91% | 0 | 86,531 | 15.91% |
| Assets Weighted Subject to Total Risks (APSRT) | 543,725 | Not applicable | Not applicable | 543,725 | Not applicable |
| Capitalization Index | 15.91% | Not applicable | Not applicable | 15.91% | Not applicable |
| | Table III.1 | |
| | Net Capital Ratio of the balance sheet | |
| Reference of the balance sheet items | Balance sheet items | Amount shown in the balance sheet |
| | Assets | 806,811 |
| BG1 | Available | 89,587 |
| BG2 | Margin accounts | 2,632 |
| BG3 | investment in securities | 169,409 |
| BG4 | Repurchase debtors | 34,397 |
| BG5 | Securities loan | 0 |
| BG6 | Derivatives | 73,619 |
| BG7 | Valuation adjustments for financial assets hedging | 4 |
| BG8 | Total credit portfolio (net) | 353,926 |
| BG9 | Benefits to be received in securitization transactions | 0 |
| BG10 | Other accounts receivable (net) | 44,314 |
| BG11 | Assets awarded (net) | 155 |
| BG12 | Real property, furniture and equipment (net) | 4,747 |
| BG13 | Permanent investments | 17,327 |
| BG14 | Long term assets available for sale | 0 |
| BG15 | Deferred taxes and PTU (net) | 12,130 |
| BG16 | Other assets | 4,565 |
| | Liability | 713,991 |
| BG17 | Traditional savings | 430,736 |
| BG18 | Interbank loans and from other entities | 29,901 |
| BG19 | Repurchase creditors | 80,454 |
| BG20 | Securities loan | 0 |
| BG21 | Sold or pledged collaterals | 12,339 |
| BG22 | Derivatives | 73,425 |
4Q.13 | EARNINGS RELEASE | 70
| BG23 | Valuation adjustments for financial liability hedging | 0 |
| BG24 | Obligations in securitization transactions | 0 |
| BG25 | Other accounts payable | 69,756 |
| BG26 | Outstanding subordinated obligations | 16,891 |
| BG27 | Deferred taxes and PTU (net) | 0 |
| BG28 | Deferred credits and early collection | 491 |
| | Shareholders' Equity | 92,820 |
| BG29 | Paid-in capital | 34,798 |
| BG30 | Earned capital | 58,023 |
| | Accounts in order | 4,405,962 |
| BG31 | Guarantees granted | 0 |
| BG32 | Contingent assets and liabilities | 33,951 |
| BG33 | Credit compromises | 78,768 |
| BG34 | Property in trust or mandate | 131,218 |
| BG35 | Federal Government financial agent | |
| BG36 | Property under guardianship or receivership | 3,614,580 |
| BG37 | Collaterals received and sold or given in guarantee by the entity | 99,276 |
| BG38 | Collaterals received and sold or given in guarantee by the entity | 52,003 |
| BG39 | Investment banking transactions on account of third parties (net) | 0 |
| BG40 | Accrued interest not collected resulting from the expired credit portfolio | 952 |
| BG41 | Other registry accounts | 395,215 |
4Q.13 | EARNINGS RELEASE | 71
| Table III.2 |
| Regulatory concepts considered in the calculation of Net Capital components |
| Identifier | Regulatory concepts considered for the calculation of Net Capital components | | Reference of the format for the disclosure of capital integration of section I hereof | | Amount pursuant to the notes of the table Regulatory concepts considered for the calculation of Net Capital components | | Reference(s) of balance sheet item and amount related with the regulatory concept considered for the calculation of Net Capital derived from the aforementioned reference |
| | Asset | | | | | | |
| 1 | Commercial Credit | | 8 | | 1,735 | | BG16= 4,565 Minus: deferred charges and early payments 676; early payments that are computed as risk assets 100; intangibles 2,017; other assets are computed as risk assets 38 |
| 2 | Other Intangibles | | 9 | | 2,017 | | BG16= 4,565 Minus: deferred charges and early payments 676; early payments that are computed as risk assets 100; intangibles 1,735; other assets that are computed as risk assets 36 |
| 3 | Deferred profit tax (credited) from fiscal losses and credits | | 10 | | 0 | | |
| 4 | Benefits over remnant of securitization transactions | | 13 | | 0 | | |
| 5 | Investments of the pension plan for benefits defined without restrictive and unlimited access | | 15 | | 0 | | |
4Q.13 | EARNINGS RELEASE | 72
| 6 | Investment in shares of the institution | | 16 | | 8 | | BG3= 169,409 Minus: Reciprocal investments in common capital 43; securities investments computed as risk assets 169,359 |
| 7 | Reciprocal investments in common capital | | 17 | | 0 | | |
| 8 | Direct investments in the capita of financial organizations wherein the institution does not hold more than 10% of the issued capital stock | | 18 | | 0 | | |
| 9 | Indirect investment in capital of financial organizations wherein the institution does not hold more than 10% of the issued capital stock | | 18 | | 43 | | BG3 = 169,409 Minus: Investments in shares of the institution 8; Investments in securities risk assets computed as 169,359 |
| 10 | Direct investments in the capita of financial organizations wherein the institution holds more than 10% of the issued capital stock | | 19 | | 0 | | |
| 11 | Indirect investment in capital of financial organizations wherein the institution holds more than 10% of the issued capital stock | | 19 | | | | |
| 12 | Deferred profit tax (credited) from temporary differences | | 21 | | 1,768 | | BG15 = 12,130 Minus: Amount computed as active risk 10,362 |
| 13 | Reserves acknowledged as complementary capital | | 50 | | 231 | | BG 8= Credit Portfolio (gross) 354,102 |
| 14 | Investments in subordinated debt | | 26 - B | | 0 | | |
| 15 | Investments in multilateral entities | | 26 - D | | 0 | | BG13= 17,327 Minus: Permanent investments in subsidiaries 14,891: permanent investments in related 138; other investments that are computed as risk assets 24 |
4Q.13 | EARNINGS RELEASE | 73
| 16 | Investments in related companies | | 26 - E | | 14,891 | | BG13= 17,237 Minus: Permanent investments in clearing house 2,274; permanent investments in related 138;other investments that are computed as risk assets 24 |
| 17 | Investments in risk capital | | 26 - F | | 0 | | |
| 18 | Investments in investment corporations | | 26 - G | | 0 | | |
| 19 | Funding for the purchase of own shares | | 26 - H | | 0 | | |
| 20 | Deferred charges and installments | | 26 - J | | 676 | | BG16= 4,565 Minus: early payments that are computed as risk assets 38; intangibles 1,735; other assets that are computed as risk assets 38 |
| 21 | Worker's share in deferred profits (net) | | 26 - L | | 0 | | |
| 22 | Investments in pension plans for defined benefits | | 26 - N | | 0 | | |
| 23 | Investments in clearing houses | | 26 - P | | 2,274 | | BG13= 17,327 Minus: permanent investments in subsidiaries 14,891; permanent investments in related 138; other investments that are computed as risk assets 24 |
| | Liabilities | | | | | | |
| 24 | Deferred profit taxes (debited) related to a commercial credit | | 8 | | | | |
| 25 | Deferred profit taxes (debited) related to other intangibles | | 9 | | | | |
| 26 | Liabilities of the pension plan for defined benefits without restrictive and unlimited access | | 15 | | | | |
| 27 | Deferred profit taxes (debited) related to the pension plan for defined benefits | | 15 | | | | |
| 28 | Deferred profit taxes (debited) related to others other than the foregoing | | 21 | | | | |
4Q.13 | EARNINGS RELEASE | 74
| 29 | Subordinated obligations amount that meets with Exhibit 1-R | | 31 | | | | |
| 30 | Subordinated obligations subject to transitory computed as basic capital 2 | | 33 | | | | |
| 31 | Subordinated obligations amount that meets with Exhibit 1-S | | 46 | | | | |
| 32 | Subordinated obligations subject to transitory that compute as complementary capital | | 46 | | | | |
| 33 | Deferred profit tax (credited) related to deferred charges and installments | | 26 - J | | | | |
| | Shareholders' Equity | | | | | | |
| 34 | Paid-in capital that meets with Exhibit 1-Q | | 1 | | 34,798 | | BG29 |
| 35 | Result of previous years | | 2 | | 30,004 | | BG30= 58,023 Minus: other earned capital elements 28,018 |
| 36 | Result for valuation of cash flow hedging instruments of non-registered items with reasonable value | | 3 | | | | |
| 37 | Other elements of the capital earned other than the foregoing | | 3 | | 28,018 | | BG30= 58,023 Minus: Result of previous years 30,004 |
| 38 | Paid-in capital that meets with Exhibit 1-R | | 31 | | | | |
| 39 | Paid-in capital that meets with Exhibit 1-S | | 46 | | | | |
| 40 | Result for valuation of cash flow hedging instruments of non-registered items with reasonable value | | 03, 11 | | | | |
| 41 | Accrued effect due to conversion | | 3, 26 - A | | | | |
| 42 | Result for ownership of non-monetary assets | | 3, 26 - A | | | | |
| | Accounts in order | | | | | | |
| 43 | Positions in First Losses Schemes | | 26 - K | | | | |
| | Regulatory concepts not considered in the balance sheet | | | | | | |
| 44 | Reserves pending constitution | | 12 | | | | |
| 45 | Profit or increase of the value of assets for the purchase of securitization positions (Originating Institutions) | | 26 - C | | | | |
| 46 | Transactions that breach the provisions | | 26 - I | | | | |
| 47 | Transactions with Relevant Related Persons | | 26 - M | | | | |
| 48 | Adjustment for capital acknowledgment | | 26 - O, 41, 56 | | | | |
4Q.13 | EARNINGS RELEASE | 75
| Table III.3 |
| Notes to table III.2 "Regulatory concepts considered for the calculation of Net Capital components" |
| Identifier | | Description |
| 1 | | Commercial credit. |
| 2 | | Intangibles, without including commercial credit. |
| 3 | | Credited differed profit taxes originating from fiscal losses and credits. |
| 4 | | Benefits regarding the remnant of securitization transactions. |
| 5 | | Investments of pension plan for defined benefits without unrestrictive and unlimited access. |
| 6 | | Any share that the Institution acquires pursuant to the provisions of the Law, that have not been subtracted; considering those amounts acquired through investments in securities indexes and the amount corresponding to investments in investment corporations other than those provided by reference 18. |
| 7 | | Investments in shares in corporations other than financial entities referred to by item f) of fraction I of Article 2 Bis 6 hereof, that are in turn, directly or indirectly shareholders of the Institution itself, of the financial group's holding company, of the remaining financial entities that comprise the group to which the Institution belongs or financial affiliates of the latter, considering those investments corresponding to investment corporations other than those provided by reference 18. |
| 8 | | Direct investments in financial entities capital referred to by Article 89 of the Law and 31 of the Law Regulating Financial Groups, where the Institution owns more than 10% of the capital thereof. |
| 9 | | Direct investments in financial entities capital referred to by Article 89 of the Law and 31 of the Law Regulating Financial Groups, where the Institution owns more than 10% of the capital thereof. |
| 10 | | Direct investments in financial entities capital referred to by Article 89 of the Law and 31 of the Law Regulating Financial Groups, where the Institution owns more than 10% of the capital thereof. |
| 11 | | Indirect investments in financial entities capital referred to by Article 89 of the Law and 31 of the Law Regulating Financial Groups, where the Institution owns more than 10% of the capital thereof. |
| 12 | | Credited differed profit taxes originating from temporary differences. |
| 13 | | Preventive estimates for credit risk up to a sum of 1.25% of the weighted assets by credit risk, corresponding to Transactions wherein the Standard Method is used to calculate the capital requirement by credit risk; and the positive difference of the Aggregate Admissible Reserves minus the Aggregate the Expected Losses, up to an amount that does not exceed of 0.6 per cent of the weighted assets by credit risk, corresponding to Transactions where the method based in internal qualifications is used to calculate the capital requirement by credit risk. |
| 14 | | Investments in subordinated debt instruments, pursuant to the provisions of fraction I item b) of Article 2 Bis 6 hereof. |
| 15 | | Investments in development or promotion multilateral organizations of an international nature pursuant to the provisions of fraction I item f) of Article 2 Bis 6 hereof that have a credit Qualification assigned by any of the issuer's Qualifying Institutions, equal or greater than long term Risk Degree 2. |
| 16 | | Investments in shares of corporations related with the Institution under the terms of Articles 73, 73 Bis and 73 Bis 1 of the Law, including the amount corresponding to investments in investment corporations and investments in indices pursuant to the provisions of fraction I item g) of Article 2 Bis 6 hereof. |
| 17 | | Investments made in development banking institutions in risk capital, pursuant to the provisions of fraction I item h) of Article 2 Bis 6 hereof. |
| 18 | | Investments in shares, other than fix capital, of listed investment corporations, wherein the Institution holds more than 15 per cent of shareholders' equity of the aforementioned investment corporation, pursuant to fraction I item i) of Article 2 Bis 6, that have not been considered in the previous references. |
| 19 | | Any type of contributions which resources are destined to the purchase of shares of the financial group's holding company, of the other financial entities that comprise the group to which the Institution belongs or the latter's financial affiliates, pursuant to the provisions of fraction I item l) of Article 2 Bis 6 hereof. |
4Q.13 | EARNINGS RELEASE | 76
| 20 | | Differed charges and early payments. |
| 21 | | Workers' share in credited differed profits pursuant to fraction I item p) of Article 2 Bis 6 hereof. |
| 22 | | Investments of the pension plan for benefits defined that have to be deducted according with Article 2 Bis 8 hereof. |
| 23 | | Investments or contributions, directly or indirectly, in the corporation's capital or in trust estate or other type of similar figures that have the purpose of setting off and liquidating Transactions executed in the stock market, unless the share in such corporations or trusts in the former pursuant to item f) fraction I of Article 2 Bis 6. |
| 24 | | Owed differed taxes to profit originating from temporary differences related to commercial credit. |
| 25 | | Owed differed taxes to profit originated from temporary differences related to other intangibles (other than commercial credit). |
| 26 | | Liabilities of the pension plan for benefits defined related to investments of the pension plan for defined benefits. |
| 27 | | Owed differed taxes originated from temporary differences related to the pension plan for defined benefits. |
| 28 | | Owed differed profit taxes originated from temporary differences other than those of references 24, 25, 27 and 33 |
| 29 | | Amount of subordinated obligations that meet with Exhibit 1-R hereof. |
| 30 | | Amount of subordinated obligations subject to transience that are computed as basic capital 2. |
| 31 | | Amount of subordinated obligations that meet with Exhibit 1-S hereof. |
| 32 | | Amount of subordinated obligations subject to transience that compute as ancillary capital. |
| 33 | | Owed differed profit taxes originated from temporary differences related to differed charges and early payments. |
| 34 | | Amount of capital contributed that meets the provisions of Exhibit 1-Q hereof. |
| 35 | | Result of the previous fiscal years. |
| 36 | | Result for the assessment of cash flow hedging instruments from covered entries assessed at reasonable value. |
| 37 | | Net result and result for the assessment of titles available for sale. |
| 38 | | Amount of capital contributed that meets the provisions of Exhibit 1-R hereof. |
| 39 | | Amount of capital contributed that meets the provisions of Exhibit 1-S hereof. |
| 40 | | Result for the assessment of cash flow hedging instruments from covered entries assessed at capitalized cost. |
| 41 | | Accrued effect by conversion. |
| 42 | | Result for ownership of non-monetary assets. |
| 43 | | Positions related with the First Losses Scheme wherein risk is preserved or credit protection provided until certain limit of a position pursuant to fraction I item o) of Article 2 Bis 6. |
| 44 | | Reserves pending constitution pursuant to the provisions of fraction I item k) of Article 2 Bis 6 hereof. |
| 45 | | The amount resulting if on account of the purchase of securitization positions, the originating Institutions register a profit or an increase in the value of their assets with respect to assets previously registered in its balance, pursuant to the provisions of fraction I item c) of Article 2 Bis 6 hereof. |
| 46 | | Transactions that infringe the provisions, pursuant to the provisions of fraction I item m) of Article 2 Bis 6 hereof. |
| 47 | | The aggregate amount of Transactions Subject to Credit Risk owed by Relevant Related Persons pursuant to fraction I item r) of Article 2 Bis 6 hereof. |
| 48 | | Adjustment for the acknowledgment of Net Capital pursuant to Article 2 Bis 9 hereof. The amount shown corresponds to the amount registered in C5 of the form included in section II hereof. |
4Q.13 | EARNINGS RELEASE | 77
| Table IV.1 |
| Positions exposed to market risks per risk factor |
| Concept | Amount of equivalent positions | | Capital Requirement |
| Transactions in national currency with nominal rate | 95,349 | | 7,628 |
| Transactions with debt instruments in national currency with surtax and reviewable rate | 4,294 | | 343 |
| Transactions in national currency with real rate or denominated in UDIs | 7,936 | | 635 |
| Transactions in national currency with yield rate referred to the increase of the General Minimum Wage | 3,161 | | 253 |
| Positions in UDIs or with yield referred to INPC | 41 | | 3 |
| Positions in national currency with yield rate referred to the increase of the General Minimum Wage | 19 | | 2 |
| Transactions in foreign currency with nominal rate | 24,827 | | 1,986 |
| Positions in foreign currency or with yield indexed to the exchange rate | 1,556 | | 124 |
| Positions in shares or with yield indexed to the price of one share or set of shares | 1,564 | | 125 |
| Table IV.2 | | | |
| Assets weighted subject to credit risk by risk group | | | |
| Concept | Assets weighted by risk | | Capital Requirement |
| Group I (weighted to 0%) | 0 | | 0 |
| Group I (weighted to 10%) | 0 | | 0 |
| Group I (weighted to 20%) | 0 | | 0 |
| Group II (weighted to 0%) | 0 | | 0 |
| Group II (weighted to 10%) | 0 | | 0 |
| Group II (weighted to 20%) | 0 | | 0 |
| Group II (weighted to 50%) | 826 | | 66 |
| Group II (weighted to 100%) | 0 | | 0 |
| Group II (weighted to 120%) | 0 | | 0 |
| Group II (weighted to 150%) | 0 | | 0 |
| Group III (weighted to 2.5%) | 0 | | 0 |
| Group III (weighted to 10%) | 180 | | 14 |
| Group III (weighted to 11.5%) | 31 | | 2 |
| Group III (weighted to 20%) | 18,977 | | 1,518 |
| Group III (weighted to 23%) | 1,885 | | 151 |
| Group III (weighted to 50%) | 250 | | 20 |
| Group III (weighted to 57.5%) | 134 | | 11 |
| Group III (weighted to 100%) | 0 | | 0 |
| Group III (weighted to 115%) | 0 | | 0 |
| Group III (weighted to 120%) | 0 | | 0 |
| Group III (weighted to 138%) | 0 | | 0 |
4Q.13 | EARNINGS RELEASE | 78
| Group III (weighted to 150%) | 0 | | 0 |
| Group III (weighted to 172.5%) | 0 | | 0 |
| Group IV (weighted to 0%) | 0 | | 0 |
| Group IV (weighted to 20%) | 6,689 | | 535 |
| Group V (weighted to 10%) | 0 | | 0 |
| Group V (weighted to 20%) | 2,081 | | 166 |
| Group V (weighted to 50%) | 0 | | 0 |
| Group V (weighted to 115%) | 0 | | 0 |
| Group V (weighted to 150%) | 365 | | 29 |
| Group VI (weighted to 20%) | 0 | | 0 |
| Group VI (weighted to 50%) | 14,094 | | 1,128 |
| Group VI (weighted to 75%) | 6,664 | | 533 |
| Group VI (weighted to 100%) | 27,571 | | 2,206 |
| Group VI (weighted to 120%) | 0 | | 0 |
| Group VI (weighted to 150%) | 0 | | 0 |
| Group VI (weighted to 172.5%) | 0 | | 0 |
| Group VII-A (weighted to 10%) | 0 | | 0 |
| Group VII-A (weighted to 11.5%) | 0 | | 0 |
| Group VII-A (weighted to 20%) | 14,399 | | 1,152 |
| Group VII-A (weighted to 23%) | 2,881 | | 231 |
| Group VII-A (weighted to 50%) | 11,873 | | 950 |
| Group VII-A (weighted to 57.5%) | 0 | | 0 |
| Group VII-A (weighted to 100%) | 122,803 | | 9,824 |
| Group VII-A (weighted to 115%) | 13,244 | | 1,059 |
| Group VII-A (weighted to 120%) | 0 | | 0 |
| Group VII-A (weighted to 138%) | 0 | | 0 |
| Group VII-A (weighted to 150%) | 14 | | 1 |
| Group VII-A (weighted to 172.5%) | 0 | | 0 |
| Group VII-B (weighted to 0%) | 0 | | 0 |
| Group VII-B (weighted to 20%) | 0 | | 0 |
| Group VII-B (weighted to 23%) | 0 | | 0 |
| Group VII-B weighted to 50%) | 0 | | 0 |
| Group VII-B weighted to 57.5%) | 0 | | 0 |
| Group VII-B (weighted to 100%) | 10,181 | | 814 |
| Group VII-B (weighted to 115%) | 0 | | 0 |
| Group VII-B (weighted to 120%) | 0 | | 0 |
| Group VII-B (weighted to 138%) | 0 | | 0 |
| Group VII-B (weighted to 150%) | 0 | | 0 |
| Group VII-B (weighted to 172.5%) | 0 | | 0 |
| Group VIII (weighted to 125%) | 6,702 | | 536 |
| Group IX (weighted to 100%) | 55,143 | | 4,411 |
| Group IX (weighted to 115%) | 0 | | 0 |
4Q.13 | EARNINGS RELEASE | 79
| Group X (weighted to 1250%) | 306 | | 24 |
| Other Assets (weighted to 0%) | 0 | | 0 |
| Other Assets (weighted to 100%) | 29,735 | | 2,379 |
| Securitization with Risk Degree 1 (weighted at 20%) | 0 | | 0 |
| Securitization with Risk Degree 2 (weighted at 50%) | 0 | | 0 |
| Securitization with Risk Degree 3 (weighted at 100%) | 0 | | 0 |
| Securitization with Risk Degree 4 (weighted to 350%) | 0 | | 0 |
| Securitization with Risk Degree 4, 5, 6 or Non-qualified (weighted to 1250%) | 0 | | 0 |
| Re-securitization with Risk Degree 1 (weighted at 40%) | 0 | | 0 |
| Re-securitization with Risk Degree 1 (weighted at 100%) | 0 | | 0 |
| Re-securitization with Risk Degree 1 (weighted at 225%) | 0 | | 0 |
| Re-securitization with Risk Degree 1 (weighted at 650%) | 0 | | 0 |
| Re-securitization with Risk Degree 5, 6 or Not qualified (weighted at 1250%) | 0 | | 0 |
4Q.13 | EARNINGS RELEASE | 80
| Table IV.3 |
| Assets weighted subject to operational risk |
| Assets weighted by risk | Capital Requirement |
| 57,951 | 4,636 |
| | |
| | |
| Average of requirement by market and credit risk of the last 36 months | Average of annual positive net income of the last 36 months |
| 35,744 | 30,907 |
| Table V.1 |
| Main characteristics of titles that are part of the Net Capital |
| Reference | Characteristic | | Options |
| 1 | Issuer | | Banco Santander (Mexico), S. A. |
| 2 | ISIN, CUSIP or Bloomberg Identifier | | |
| 3 | Legal frame | | Securities Market Law |
| | Regulation treatment | | |
| 4 | Level of capital with transitory | | N.A |
| 5 | Level of capital without transitory | | Basic I |
| 6 | Instrument level | | Credit Institution without consolidating Subsidiaries |
| 7 | Instrument type | | Series F Shares |
| 8 | Amount acknowledge of regulatory capital | | $9,514,367,512.00 |
| 9 | Instrument's par value | | $0.10 |
| 9A | Instrument's currency | | Mexican Pesos |
| 10 | Accounting qualification | | Capital |
| 11 | Date of issuance | | N.A |
| 12 | Instrument´s term | | Perpetual |
| 13 | Date of expiration | | Without expiration |
| 14 | Early payment clause | | No |
| 15 | First date of early payment | | N.A |
| 15A | Regulatory or fiscal events | | No |
| 15B | Liquidation price of the early payment clause | | N.A |
| 16 | Subsequent early payment dates | | N.A |
| | Yields / Dividends | | |
| 17 | Type of yield/dividend | | Variable |
| 18 | Interest rate/dividend | | Variable |
| 19 | Cancellation of dividends clause | | No |
| 20 | Payment discretion | | Mandatory |
| 21 | Interest increase clause | | No |
| 22 | Yields/Dividends | | Not Accruable |
| 23 | Convertibility of the instrument | | N.A |
| 24 | Convertibility conditions | | N.A |
| 25 | Degree of convertibility | | N.A |
| 26 | Conversion rate | | N.A |
| 27 | Instrument convertibility rate | | N.A |
4Q.13 | EARNINGS RELEASE | 81
| 28 | Type of convertibility financial instrument | | N.A |
| 29 | Instrument issuer | | N.A |
| 30 | Write-down clause | | No |
| 31 | Conditions for write-down | | N.A |
| 32 | Degree of write-down | | N.A |
| 33 | Temporality of write-down | | N.A |
| 34 | Mechanism for temporary write down | | N.A |
| 35 | Subordination position in the event of liquidation | | Creditors in general |
| 36 | Breach characteristics | | No |
| 37 | Description of breach characteristics | | N.A |
| Table V.1.2 |
| Main characteristics of titles that are part of the Net Capital |
| Reference | Characteristic | | Options |
| 1 | Issuer | | Banco Santander (Mexico), S. A. |
| 2 | ISIN, CUSIP or Bloomberg Identifier | | MX00BS030007 |
| 3 | Legal frame | | Securities Market Law |
| | Regulation treatment | | |
| 4 | Level of capital with transitory | | N.A |
| 5 | Level of capital without transitory | | Basic I |
| 6 | Instrument level | | Credit Institution without consolidating Subsidiaries |
| 7 | Instrument type | | Series B Shares |
| 8 | Amount acknowledge of regulatory capital | | $1,833,249,750.00 |
| 9 | Instrument's par value | | $0.10 |
| 9A | Instrument's currency | | Mexican Pesos |
| 10 | Accounting qualification | | Capital |
| 11 | Date of issuance | | N.A |
| 12 | Instrument´s term | | Perpetual |
| 13 | Date of expiration | | Without expiration |
| 14 | Early payment clause | | No |
| 15 | First date of early payment | | N.A |
| 15A | Regulatory or fiscal events | | No |
| 15B | Liquidation price of the early payment clause | | N.A |
| 16 | Subsequent early payment dates | | N.A |
| | Yields / Dividends | | |
| 17 | Type of yield/dividend | | Variable |
| 18 | Interest rate/dividend | | Variable |
| 19 | Cancellation of dividends clause | | No |
| 20 | Payment discretion | | Mandatory |
| 21 | Interest increase clause | | No |
| 22 | Yields/Dividends | | Not Accruable |
| 23 | Convertibility of the instrument | | N.A |
| 24 | Convertibility conditions | | N.A |
4Q.13 | EARNINGS RELEASE | 82
| 25 | Degree of convertibility | | N.A |
| 26 | Conversion rate | | N.A |
| 27 | Instrument convertibility rate | | N.A |
| 28 | Type of convertibility financial instrument | | N.A |
| 29 | Instrument issuer | | N.A |
| 30 | Write-down clause | | No |
| 31 | Conditions for write-down | | N.A |
| 32 | Degree of write-down | | N.A |
| 33 | Temporality of write-down | | N.A |
| 34 | Mechanism for temporary write down | | N.A |
| 35 | Subordination position in the event of liquidation | | Creditors in general |
| 36 | Breach characteristics | | No |
| 37 | Description of breach characteristics | | N.A |
| Table V.2 |
| Assistance in filling in the information regarding the characteristics of the titles that are part of the Net Capital |
| Reference | Description |
| 1 | Credit institution that issues titles that are part of the Net Capital |
| 2 | Title identifier or code that is part of the Net Capital (ISIN, CUSIP or ID number of international value) |
| 3 | Legal framework with which the title must comply, as well as the laws to which it shall be subject. |
| 4 | Level of capital that corresponds to the title that shall be subject to transience established pursuant to Article Third Transitory, of Resolution 50th. |
| 5 | Level of capita that corresponds to the title that meets exhibit 1-Q, 1-R or 1-S hereof. |
| 6 | Level within the group to which the title is included. |
| 7 | Type of Capital Instrument or title representing the capital stock that is included as part of the Net Capital. In the event of titles subject to the transiency established pursuant to Article Third Transitory, established in Resolution 50th, refers to the subordinated obligations described on Article 64 of the Credit Institutions Act. |
| 8 | Amount of the Capital Instrument or title representing the capital stock, that is acknowledged in the Net Capital pursuant to Article 2 bis 6 hereof, in the event of reference 5 either Basic 1 or Basic 2; and pursuant to Article 2 bis 7 hereof in the event such reference is Ancillary. in any other event, it shall be the amount corresponding pursuant to the provisions of Article Third Transitory of Resolution 50th. |
| 9 | Title's par value in Mexican pesos. |
| 9A | Currency used to express the title's par value in Mexican pesos pursuant to international standard ISO 4217 |
| 10 | Accounting classification of the title that is part of the Net Capital. |
| 11 | Date of issuance of the title that is part of the Net Capital |
| 12 | Specify if the title has expiration or is at perpetuity |
| 13 | Expiration date of the title, without considering the dates of early payment. |
| 14 | Specify if the title includes a early payment clause by the issuer wherein the right to pay the title early is exercised with prior authorization from Banco de Mexico. |
| 15 | Date when the issuer may, for the first time, exercise the right to pay the title early prior authorization from Banco de Mexico. |
| 15A | Specify if the early payment clause considers regulatory or fiscal events. |
| 15B | Specify the liquidation price of the early payment clause. |
4Q.13 | EARNINGS RELEASE | 83
| 16 | Dates when the issuer may, subsequently to the one specified in reference 15, exercise the right of title early payment prior authorization from Banco de Mexico |
| 17 | Specify the type of yield/dividend that shall be held during the entire term of the title. |
| 18 | Interest rate or index referred to by the title's yield/dividend. |
| 19 | Specify if the title includes clauses that forbid payment of dividends to the holders of titles representing the capital stock when failing to perform payment of a coupon or dividend of any capital instrument. |
| 20 | issuer's discretionarily for payment of the title's interests or dividends. If the Institution at any time may cancel payment of yields or dividends it must be selected (entirely Optional); if it may only cancel in some situations (partially Optional) or if the credit institutions may not cancel payment (Mandatory) |
| 21 | Specify if in the title there is a clause that generates incentives that the issuer may early pay, as clauses of increase of interests known as "Step-Up". |
| 22 | Specify if yields or dividends of the title are accruable or not. |
| 23 | Specify if the title is convertible or not in ordinary shares of the multiple banking institutions or the Financial Group. |
| 24 | Conditions under which the title is convertible into ordinary shares of the multiple banking institution or Financial Group. |
| 25 | Specify if the title is wholly converted or only partially when it meets the contractual conditions to convert. |
| 26 | Amount per share considered for converting the title into ordinary shares of the multiple banking institution or the Financial Group into the currency on which such instrument was issued. |
| 27 | Specify if the conversion is mandatory or optional. |
| 28 | Type of shares into which the title is converted. |
| 29 | Issuer of the instrument into which the title is converted. |
| 30 | Specify if the title has the principal cancellation characteristics. |
| 31 | Conditions under which the title has a principal cancellation characteristics. |
| 32 | Specify if once the hypothesis of the value decrease clause occurs, the title decreases value in its aggregate or only partially. |
| 33 | Specify if once the hypothesis of the value decrease clause occurs, the instrument decreases value permanently or temporarily |
| 34 | Explain the temporary value decrease mechanism. |
| 35 | Most subordinated position to which the capital instrument is subordinated that corresponds to the type of instrument in liquidation. |
| 36 | Specify whether there is or not characteristics of the title that fails to meet with the conditions established in exhibits 1-Q, 1-R and 1-S hereof. |
| 37 | Specify the characteristics of the title that fail to meet the characteristics established in exhibits 1-Q, 1-R and 1-S hereof. |
The information relating to Annex 1-O Capitalization Ratio Santander Consumo and Santander Hipotecario is available on the website
www.santander.com.mx/ir
| 16. Risk Diversification |
| Pursuant to the general rules for risk diversification in the performance of borrowing and lending transactions applicable to credit institutions, published in the Federal official Gazette on April 30, 2003, the following information with respect to credit risk transactions as of December 31, 2013, is provided: |
| - At December 31, 2013 did not have financing granted to debtors or groups of individuals representing single common risk is greater the amount of core capital (the month immediately preceding the date that is reported) Bank. |
| - Loans granted to the three major debtors or groups of persons representing a common risk for a total amount of Ps.14,736 representing the 18.09% of the basic capital of the Bank. |
4Q.13 | EARNINGS RELEASE | 84
17. Internal and external Sources of Liquidity
Internal sources of liquidity in domestic and foreign currency come from the different savings products that Banco Santander México offers to clients; that is, the funds obtained from checking accounts and term deposits from customers.
With respect to external sources of liquidity, the institution has several alternatives to access debt and capital markets, i.e., Banco Santander México obtains resources through the issuance of debt securities, loans from other institutions, including the Central Bank and international institutions, as well as the issuance of subordinate debt and other capital securities.
The bank may obtain liquidity also via repurchase and resale agreements on securities (reportos) possessed by Banco Santander México. Also, the bank may obtain funds via the sale of assets.
18. Dividends Policy
Santander México performs the payment of dividends pursuant to the applicable legal, administrative, fiscal and accounting rules, based in the results obtained by the Institution. The Board of Directors proposes the payment of dividends at the Ordinary General Stockholders’ Meeting, which is the body that orders and approves the payment of dividends to the stockholders of the institution.
19. Treasury Policies
The activities of Santander México’s treasury are performed pursuant to the following:
| a) | In compliance with the provisions issued by the different authorities of the financial system for bank institutions, such as guidelines for lending and borrowing transactions, accounting rules, liquidity ratios, regulatory matching, capacity of the payment systems, etc. |
| b) | Internal limits for market, liquidity and credit risks, i.e., there are limits for the management of the assets and liabilities of the bank with respect to the market and liquidity risk derived from such management, as well as the limits regarding counterparty risk derived from the daily transactions. |
| c) | Compliance with the guidelines stipulated by national and international standard agreements regarding transactions performed in markets. |
| d) | Sound market practices. |
| e) | Strategies proposed in the banks internal committees. |
| | f) | Compliance with the operation procedures of the institution. |
| 20. Shareholding | | |
| | | |
| Subsidiaries | | % of interest |
| | | |
| Banco Santander (Mexico), S.A. | | 99.99% |
| Casa de Bolsa Santander, S.A. de C.V. | | 99.97% |
21. Internal Control
The activities of Santander México (“Grupo Financiero Santander Mexico”, “Financial Group” or the “Group”) are governed by a series of guidelines established by Banco Santander (España), the holding company of Santander México, whose head offices are located in the city of Madrid, and the Mexican laws.
For the compliance of the rules in effect, Santander México has developed and implemented an Internal Control Model (ICM) which includes the participation of the Board of Directors, the statutory advisor, the Audit Committee, the General Direction, the Internal Control Unit and the Regulatory Control Department.
4Q.13 | EARNINGS RELEASE | 85
The ICM is based in the identification and documentation of the main risks and the periodic assessment of the controls that are created to mitigate such risks. ICM guarantees, among other aspects, the design, establishment and updating of measures and controls that promote the compliance with the internal and external rules and the proper operation of the data processing systems.
The internal control system includes:
The implementation of an organizational structure has allowed the development and growth of the group. Such structure is constituted as follows:
CEO and General Direction
The following functions report to the CEO and General Direction:
| § | Vice-president of Finance and Administration: |
| | Ø | Deputy General Direction of Intervention and Management Control |
| | Ø | Deputy General Direction of Technology, Operations and Quality |
| | Ø | Deputy General of Human Resources, Organization and Costs |
| | Ø | Counsel for Legal Affairs |
| | Ø | Executive Direction of Competitive Strategy |
| | Ø | Executive Direction of Financial Management |
| | Ø | Executive Direction of Investor Relations |
| § | Vice-president of Commercial Banking: |
| | Ø | Deputy General Direction of Commercial Strategy |
| | Ø | Deputy General Direction of Companies and Institutions Banking |
| | Ø | Deputy General Direction of Particulars and Small Enterprises Banking |
| | Ø | Deputy General Direction of Payment Systems |
| | Ø | Deputy General Direction of Private Banking |
| | Ø | Executive Direction of Universities-Universia |
| | Ø | Executive Direction of Analysis and Commercial Planning |
| § | Deputy General Director of Credit |
| § | Deputy General Director of Wholesale Banking |
| § | Deputy General Director of Institutional Relations and Communications |
| § | Executive Direction of Internal Audit |
| § | Executive Direction of Advertising and Corporate Image |
| § | Executive Direction Corporate of Recoveries and Assets Restructuring |
The roles and responsibilities of each direction have been stipulated in order to optimize the performance of the activities of the group.
The Organization area related to the Executive Direction of Processes and Change Management, via manuals, circulars and bulletins, governs the activities of the group; likewise, the Regulatory Control Department has established a general Code of Conduct that every employee of the Bank has to follow.
The structure of the Group includes the constitution of a Board of Directors, which establishes the objectives, the policies and general procedures of Santander México, the appointment of directors and the constitution of committees that are to supervise the development of the activities of the Group.
The committees that supervise the development of the entities that constitute Santander México, created by the Board of Directors, are the following:
4Q.13 | EARNINGS RELEASE | 86
| § | Corporate Practices, Nominating and Compensation Committee |
| § | Integral Risk management Committee |
| § | Regulatory Compliance Committee |
| § | Communication and Control Committee |
The registration, control and storage of the daily activities of Santander México is carried out by systems mainly designed and focused on the banking and brokerage activity. the common platform for such purposes is known as ALTAIR and it is applied by all the entities in Latin America that are part of Banco Santander (España).
Loans portfolio and transactions of commercial banking of the group are controlled and registered at ALTAIR. Treasury activities are controlled and registered in computer platforms and the operations are centralized for its accounting registration in ALTAIR. Such platforms comply with the parameters stipulated by the National banking and Exchange Commission with respect to reliability and accuracy.
Santander México is regulated by the CNBV, and therefore, the financial statements are prepared according to the accounting practices stipulated by such Commission via the issue of accounting circulars, general official letters and particular official letters regarding the accounting registration of transactions. For such purposes, the accounting system of the institution has been structured with an accounts catalog stipulated by the Commission, and all the reports come from such system and comply with the applicable provisions.
Within the Group, there is an independent area of Internal Audit, whose mission is to oversee the compliance, efficacy and efficiency of the internal control systems of the Group, as well as the reliability and quality of the accounting information.
To achieve so, Internal Audit verifies that the risks inherent to the activity of Santander México are properly covered and the policies stipulated by the Direction, the applicable internal and external regulations and the procedures are observed.
The results of the activities of Internal Audit are reported on regular basis to the General Direction, the Audit Committee and the Board of Directors. Among other issues, the results of the audits performed to the different business units of the companies that constitute Santander México and the follow up of the recommendations provided to the different areas and/ or entities are informed.
Internal Audit has a quality system according to the requirements of the Directive UNE-EN ISO 9001:2008 and it is focused towards customer satisfaction under an approach of continuous improvement of procedures.
In summary, Internal Control of Santander México includes the continuous development, implementation and updating of an internal control model where all the areas of the group have an active role.
| 22. Accounting Differences between CNBV regulations in Mexico and the Circular issued by Bank of Spain |
| | | | |
| Earnings of Grupo Financiero Santander under CNBV regulations in Mexico | 20,876 | | |
| | | | |
| Temporary differences in classification and assessment of sale and repurchase agreements and investment securities | (24) | | (a) |
| Income and expenses from the Corporate Head Office | 36 | | (b) |
| Cancellation of recognition of deferred Employee Profit Sharing | (2,241) | | (c) |
| Other differences between CNBV regulations in Mexico and the Circular issued by Bank of Spain | (2,802) | | |
| Earnings of Grupo Financiero Santander under the regulations set forth in the Circular issued by the Bank of Spain | 15,845 | | |
4Q.13 | EARNINGS RELEASE | 87
| (a) | According to the local regulations, as of September 30, 2008, the market valuation of securities classified as trading securities was recognized in the income statement; for Spain, such securities are classified as available for sale and, pursuant to the Circular issued by Bank of Spain, its valuation is recognized in stockholders' equity until they mature or are sold. |
| (b) | Allocation of corporate income and expenses performed by the Corporate Head Office to its subsidiaries, pursuant to the rules and policies of Banco Santander España. |
| (c) | Deferred employee profit sharing is not applicable under accounting rules of Bank of Spain |
| 23. Transactions with Related Parties | |
| | |
| Assets | |
| Cash and due from banks | 67 |
| Derivatives | 19,999 |
| Loan Portfolio (net) | 3,188 |
| Other receivables | 5,460 |
| | |
| Liabilities | |
| Deposits | 780 |
| Credit instruments issued | 774 |
| Creditors under sale and repurchase agreements | 512 |
| Bank and other loans | 3,175 |
| Derivatives | 20,944 |
| Other payables | 231 |
| Creditors from settlement of transactions | 1,104 |
| Subordinated debentures | 12,766 |
| | |
| Income | |
| Interest | 121 |
| Commission and fee | 4,728 |
| Transactions with derivative financial instruments | 71,851 |
| | |
| Expenses | |
| Interests | 80 |
| Administrative expenses | 326 |
| Transactions with derivative financial instruments | 71,339 |
| Technology Services | 1,728 |
| 24. Interests on Loan portfolio |
| |
| As of December 31, 2013, the Income Statement includes in the item "Earnings from loans" Ps.40,007 million that correspond to interests from the loan portfolio of Banco Santander (Mexico), S.A., Santander Consumo, S.A. de C.V. SOFOMER, Santander Hipotecario, S.A. de C.V. SOFOMER and Santander Vivienda, S.A. de C.V. SOFOMER. |
25. Integral Risk Management
Risk management is considered by Santander Mexico (“Grupo Financiero Santander Mexico”, “Financial Group”or the “Group”) as a competitive element of strategic nature with the purpose of maximizing the value for the stockholder. This management is defined, from a conceptual and organizational sense, as a comprehensive management of the different risks (market risk, liquidity risk, credit risk, counterparty risk, operative risk, legal risk and technological risk) assumed by the institution for the development of its activities. The management of the risk inherent to transactions
4Q.13 | EARNINGS RELEASE | 88
is essential for understanding and determining the behavior of the financial condition of the institution and the creation of long-term value.
In order to comply with the provisions regarding the Comprehensive Risk management applicable to credit institutions, issued by the National Banking and Exchange Commission, the Board of Directors agreed to create the Comprehensive Risk Management Committee of the institution, to work pursuant to the rules set by such regulations. This Committee gathers every month and verifies that the transactions are according to the objectives, policies and procedures approved by the Board of Directors for the Comprehensive Risk Management.
The Comprehensive Risk management Committee delegates in the Comprehensive Risk Management Unit the responsibility for the implementation of procedures for the measure, administration and control of risks according to the applicable policies; such Unit has the faculty to authorize amounts greater than the stipulated limits and in such cases, the Board of Directors shall be informed on such deviations.
Market Risk
The Market Risk Management department of the Comprehensive Risk management Unit is responsible for recommending the policies on market risk management of the institution, and to establish the parameters for risk measuring, and to provide reports, analysis and assessments to the senior management, to the Comprehensive Risk management Committee and to the Board of Directors.
The market risk management is to identify, measure, monitor and control risks arising from fluctuations in interest rates, exchange rates, prices and other market risk factors in currency, money, capital and derivative markets that are exposed the positions that belong to the position.
The market risk measurement quantifies the potential variation in the value of the positions as a consequence of changes in the market risk factors.
Depending on the nature of the activities of each business unit, debt and capital instruments are registered as securities for trade, securities available for sale and or securities held to maturity. The main characteristic that identifies securities available for sale is their permanent nature and they are managed as an structural part of the balance sheet. The institution has established provisions that all securities available for sale must fulfill, as well as adequate controls for the compliance of such provisions.
Whenever significant risks are identified, they are measured and limits are allocated in order to assure an adequate control. Global measurement of risk is carried out via a combination of the methodology applied to Portfolios for Trade and to the management of Assets and Liabilities.
Portfolios for Trade
In order to measure the risk in a global approach, the methodology of Value at Risk (VaR) is used. VaR is defined as the statistical estimate of the potential loss of value of a given position, during certain period and at certain confidence level. VaR provides a universal measure of the level of exposure of the different risk portfolios; it allows the comparison of the risk level assumed in different securities and markets and expresses the level of each portfolio through a unique figure in economic units.
VaR is calculated via historical simulation, with a 521 working-days window (520 percentage changes) and a one-day horizon. The calculation is performed from a series of simulated gains and losses with 1% percentile at constant pesos and with pesos decreasing on an exponential basis, with a decrease factor that is reviewed on annual basis, the most conservative measure is the one to be reported. A confidence level of 99% is assumed.
Note that the historical simulation model is limiting to assume that the recent past represent the near future.
4Q.13 | EARNINGS RELEASE | 89
The Value at Risk as of December, 2013 (unaudited) amounted to:
| | Bank and Brokerage |
| | VaR (thousands of pesos) | % |
| Trading Desks | 69,042.60 | 0.08% |
| Market Making | 42,495.42 | 0.05% |
| Prop Trading | 49,438.69 | 0.06% |
| | | |
| Risk factor | 69,042.60 | 0.08% |
| Interest rate | 64,326.06 | 0.07% |
| Foreign exchange | 4,043.21 | 0.00% |
| Equity | 17,541.71 | 0.02% |
| | The Value at Risk for the average quarter of 2013 (unaudited) amounted to: |
| | Bank and Brokerage |
| | VaR (thousands of pesos) | % |
| Trading Desks | 63,146.66 | 0.08% |
| Market Making | 41,035.50 | 0.05% |
| Prop Trading | 41,244.77 | 0.05% |
| | | |
| Risk factor | 63,146.66 | 0.08% |
| Interest rate | 60,464.97 | 0.07% |
| Foreign exchange | 12,896.00 | 0.02% |
| Equity | 20,671.97 | 0.02% |
| | * % of VaR with respect to Net Capital |
Likewise, monthly simulations of gains or losses of portfolios are carried out by revaluating such portfolios under different scenarios (Stress Test). Such estimates are generated using two different methods:
| | § | Applying to risk factors the percentage changes observed in certain periods including relevant market turbulences. |
| | § | Applying to risk factors changes that depend on the volatility of each risk factor. |
On a monthly basis “back testing” is carried out to compare daily gains and losses that would have been observed is the same positions had been maintained, taking into account only the change in value at risk in order to be able to fine tune the models. Even though these reports are prepared on a monthly basis, they include daily tests.
Management of Assets and Liabilities
Commercial banking activities of the institution generate important balance sheet amounts. The Assets and Liabilities Committee (ALCO) is responsible for determining the guidelines for the management of financial margin risk, net worth value and liquidity that must be followed by the different commercial portfolios. Pursuant to this approach, the General Direction of Finances has the responsibility to execute the strategies defined by the Assets and Liabilities Committee in order to modify the risk profile of the commercial portfolio by following the corresponding policies. Compliance with information requirements for interest rate, Exchange rate and liquidity risks is fundamental.
4Q.13 | EARNINGS RELEASE | 90
As part of the financial management of the institutions, sensitivity to financial margin (NIM) and net worth value (MVE) of the different balance sheet items is analyzed in comparison to variations in interest rates. This sensitivity is derived from the difference between maturity dates of assets and liabilities and the dates interest rates are modified. The analysis is performed from the classification of each item sensitive to interest rate throughout time, according to their repayment, maturity or contractual modification of the applicable interest rate.
| | | | |
| | | | | | | | | |
| 80% | 79% | 88% | 82% | | 69% | 66% | 63% | 66% |
| 45% | 43% | 64% | 51% | | 5% | 1% | 83% | 30% |
Using simulation techniques, the predictable value of the financial margin and the net worth value are measured in different interest rate scenarios, and their sensitivity under extreme movement of such scenarios.
The Assets and Liabilities Committee adopts investment and hedging strategies in order to maintain such sensitivities within the target range.
Limits
Limits are used to control global risk of the financial group derived from each portfolio and books. The structure of limits is used to control exposures and to establish the total risk authorized to business units. These limits are established for VaR, Loss alert, maximum loss, equivalent volume of interest rate, delta equivalent in variable interest, open foreign currency positions, sensitivity of financial margin and sensitivity of net worth value.
Liquidity Risk
Liquidity risk is related to the ability of the institution to finance acquired commitments at reasonable market prices, as well as to fulfill business plans with stable financing sources. Risk factors may be external (liquidity crisis) and internal due to excessive concentration of maturities.
The institution carries out a coordinated management of maturities of assets and liabilities, and oversees the maximum timing difference profiles. This monitoring is based in the analysis of maturities of assets and liabilities, both contractual and managerial. Liquidity Risk is limited in terms of an accrued liquidity level during one month and in terms of a stipulated liquidity ratio.
| | Liquidity Ratio |
| Bank and Brokerage | | | | |
| Balance MXN GAP | 35% | 37% | 40% | 37% |
| Balance USD GAP | 11% | 15% | 17% | 14% |
Credit Risk
Management of credit risk of Grupo Financiero Santander is developed differently for the different segments of clients along the three phases of the credit process: acceptance, follow-up and recovery.
From a global perspective, management of credit risk in the institution is responsible for the identification, measurement, integration and assessment of the aggregated risk and the profitability according to such risk; with the purpose of oversee the levels of risk concentration and to adapt them to the limits and objectives previously established.
Risks receiving an individual treatment (risks with companies, institutions and financial entities) are identified and taken apart from those other risk that are managed in standardized manner (consumer and mortgages credits to individuals, loans to businesses and small enterprises)
Risks managed on individual basis are subject to a solvency or rating system with a related probability of failure that allows the measuring of the risk for each client and for each transaction from the beginning. The assessment of the client, after analyzing other relevant risk factors in different areas, is adjusted according to the special characteristics of the transaction (guarantee, term, etc.)
4Q.13 | EARNINGS RELEASE | 91
Standardized risks require, due to their special characteristics (great number of transactions for relatively low amounts), a different management that allows an efficient process and effective use of resources, so automated decision tools are used (expert and credit scoring systems).
Management of loans to companies is complemented, during the follow-up phase, with the so called “system of special monitoring” that determines the policy to be followed in the management of the risks with companies or groups rated within such category. Different situations of levels of monitoring are identified and generate different actions. A special monitoring grade is given in the case of alert signals, systematic reviews, or specific initiatives promoted by the Risks Department or Internal Audit.
Recovery Units constitute a critical element in the management of irregular risk, in order to minimize the final loss for the institution. These units are responsible for a specialized management of the risk from the moment they are classified as irregular risk loans (defaulting payment).
The institution has carried out a policy for the selective growth of risk and a strict treatment of late payments and the creation of the corresponding provisions, based in the prudent criteria defined by the Group.
Probability of Default and Expected Losses
Pursuant to the provisions on Comprehensive Risk Management included in the general regulations applicable to credit institutions, as part of the credit risk management, credit institutions must determine the probability of default. The system allows the calculation of the probability for the different loans portfolios.
| | a. | The probability of failure is for “No Retail” portfolios. It is determined via the fine tune of the ratings of clients in a given moment, based in the Monthly Default Rates observed during a period of five years. Such Default Rates are adjusted to an economic cycle of ten years. For “Retail” portfolios, the standard default probabilities set by the Basel Convention are used. |
| | b. | Once the probability of default is determined, the parameters of “severity of Loss” (LGD) and “Exposure at Default” (EAD) stipulated in Basel, are taken into consideration. |
Once the abovementioned factors are obtained, the Expected Loss (PE) is calculated as follows:
Expected Loss = Probability of Default x Severity of Loss x Exposure at Default
i.e.: PE = PD * LGD * EAD
Counterparty Risk
Included in the credit risk, there is a concept that, due to its characteristics, it requires a special management: the Counterparty Risk.
Counterparty Risk is the risk the Institution assumes with governmental entities, financial institutions, corporations, companies and individuals in their treasury activities and correspondent bank activities. The measurement and control of the Credit Risk in Financial Instruments, Counterparty Risk, is carried out by a special unit with an organizational structure independent from the business areas.
The control of Counterparty Risk is performed daily via the Interactive Risk Integrated System (IRIS), which informs the credit line available with any counterparty, in any product and any term.
For the control of the counterparty lines the Equivalent Credit Risk (REC) is used. REC is an estimate of the amount the institution may lose in current transactions with certain counterparty, if such counterparty commits a default in any moment until the maturity date of transactions. REC takes into account the Current Credit Exposure, which is defined as the cost to substitute the transaction at market value provided that this value is positive for the institution, and it is measured as the market value of the transaction (MtM). In addition, REC includes the Potential Credit Exposure or Potential Additional Risk (RPA), which represents the possible evolution of the current credit exposure until maturity, given the characteristics of the transaction and the possible variations in the market factors. The REC Gross considers definitions described above, without considering mitigating by netting or by mitigating collateral.
For the calculation of REC, mitigating factors of the counterparty credit risk are taken into consideration, such as collaterals, netting agreements, among other. The methodology continues to be effective.
In addition to the Counterparty Risk, there is the Settlement Risk, which is present in every transaction at its maturity date, when the possibility that the counterparty does not comply with its payment obligations arises, once the institution has complied with its obligations by issuing payment directions.
4Q.13 | EARNINGS RELEASE | 92
For the process of control for this risk, the Deputy General Direction of Financial Risks oversees on a daily basis the compliance with the limits on counterparty credit risks by product, term and other conditions stipulated in the authorization for financial markets. Likewise, it is the responsible for communicating on a daily bases, the limits, consumptions and any incurred deviation or excess.
On a monthly basis, a report is presented to the Comprehensive Risk Management Committee, and on quarterly basis, to the Board of Directors, with respect to the limits to Counterparty Risks, Issuer Risks and current consumptions, as well as incurred excesses and transactions with non-authorized customers. In addition, it informs the calculation of the Expected Loss for current transactions in financial markets at the closing of every month and different scenarios of stress of Expected Loss. All of the above according to the methodologies and assumptions approved by the Comprehensive Risk Management Committee.
Currently, we have approved lines of Counterparty Risks in Grupo Financiero Santander for the following segments: Mexican Sovereign Risk and Domestic Development Banking, Foreign Financial Institutions, Mexican Financial Institutions, Corporations, Companies Banking-SGC, Institutions Banking, Large Enterprises Unit, Project Finance.
Equivalent Net Credit Risk of the lines of Counterparty Risk and Issuer Risk of Grupo Financiero Santander as of the end of the 4Q.13, and the quarterly average Equivalent Net Credit Risk of the lines of Counterparty Risk and Issuer Risk of Grupo Financiero Santander for the 4Q.13:
| | Equivalent Net Credit Risk |
| Segment | End 4Q.13 | Average 4Q.13 |
| Sovereign Risk, Development Banking and Financial Institutions | 90.73% | 16,998.41 |
| Corporates | 8.66% | 1,667.26 |
| Companies | 0.61% | 114.77 |
| | | million USA dollars |
The equivalent credit risk lines maximum gross counterparty risk of Grupo Financiero Santander at the end of the 4Q.13, which corresponds to derivative transactions is distributed depending on the type of derivative:
| | Equivalent Gross Credit Risk |
| Type of Derivative | End 4Q.13 |
| Rate Derivatives | 19,563 |
| Exchange rate Derivatives | 18,282 |
| Bonds Derivatives | 5 |
| Equity Derivatives | 355 |
| TOTAL | 38,205 |
| | million USA dollars |
Note: In IRIS, the Equivalent Gross Credit Risk does not consider the mitigation by netting agreements and by collateral agreements with counterparties.
The Expected Loss of Grupo Financiero Santander at the end of the 4Q.13, and the quarterly average of the expected loss of the lines of Counterparty risk and issuer risk of the Institution, for the 4Q.13 are:
| | Expected Loss |
| Segment | End 4Q.13 | Average 4Q.13 |
| Sovereign Risk, Development Banking and Financial Institutions | 31.57% | 2.61 |
| Corporates | 59.56% | 5.62 |
| Companies | 8.86% | 0.82 |
| | million USA dollars |
The segments of Mexican Financial Institutions and Foreign Financial Institutions are very active counterparties with whom the institution has current positions of financial instruments with Counterparty Credit Risk. It is important to
4Q.13 | EARNINGS RELEASE | 93
mention that Equivalent Credit Risk is mitigated by netting agreements (ISDA-CMOF) and, in some cases, by collateral agreements (CSA-CGAR) or revaluation agreements with counterparties.
Respect to total collateral received for derivatives transactions at the end of the 4Q.13:
| Cash collateral | 93.84% |
| Collateral refer to bonds issued by the Mexican Federal Government | 6.16% |
Operating Risk
With respect to Operating Risk, and pursuant to the corporate methodology, the institution has established policies, procedures and methodologies for the identification, control, mitigation, monitoring and reporting of operating risks.
For the identification and classification of operating risks, different categories and business lines defined by national and internal regulating organisms are used. The methodology is based in the identification and documentation of the corresponding risks, controls and processes, and quantitative and qualitative tools are used, such as self-assessment questionnaires, development of historical data bases and Operating Risk indicators, etc. for their control, mitigation and reporting.
Legal Risk
Legal Risk is defined as the potential loss due to the failure to comply with the applicable legal and administrative regulations, the issue of administrative and judicial resolutions against the institution and the application of fines, with respect to the transactions carried out by the Institution.
Pursuant to the provisions regarding the Comprehensive Risk Management, the following activities are performed: a) Establishment of policies and procedures for analyzing the legal validity and the proper execution of the legal acts. b) estimates of the amount of potential losses derived from judicial or administrative orders against the Institution and the possible application of fines c) Analysis of the legal acts governed by a legal system different to the Mexican laws, d) communication to directors and employees on the legal and administrative regulations applicable to transactions and e) the performance, at least on annual basis, of internal legal audits.
Technological Risk
Technological risk is defined as the potential loss due to damages, discontinuation, alterations or failures derived from the use or dependence on hardware, software, systems, applications, networks and any other data channel distribution for the provision of banking services to the clients of the Institution.
The Institution has adopted a corporate model for the management of Technological Risks, integrated to the processes of service and support to computing areas in order to identify, oversee, control, mitigate and report the Computing Technology Risks the transaction is exposed to, with the aim of establishing control measures that decrease the probability of risks to occur.
4Q.13 | EARNINGS RELEASE | 0

Item 3
Grupo Financiero Santander Mexico,
S.A.B. de C.V.
Complementary information for the Fourth Quarter of 2013,
in compliance with the obligation of reporting transactions with derivative financial instruments.
4Q.13 | EARNINGS RELEASE | 1
III. Qualitative and Quantitative Information
i. Management of policies on the use of derivative financial instruments.
The policies of the Institution allow the use of derivative products for hedging and/ or trading purposes.
The main objectives of the transactions with these products are for hedging risks and maximization of profitability.
The Institution uses the following instruments:
Forwards
Futures
Options
Swaps
Swaptions
Depending of the portfolios, strategies to be implemented may be for hedging or trading purposes.
Trading markets:
Exchange-traded
Over the Counter
Eligible counterparties: domestic and foreign counterparties having internal approvals.
The appointment of calculation agents is carried out in the legal documents dully executed by the parties. For the valuation of the instruments, the prices published by authorized Suppliers of Prices are used.
The main terms or conditions of the agreements are based in international ISDA or the domestic standard agreement.
Specific policies on margins, collaterals and credit lines are detailed in the internal manuals of the Institution.
Comprehensive Risk Management
Risk management is considered by Grupo Financiero Santander as a competitive element of strategic nature with the purpose of maximizing the value for the stockholder. This management is defined, from a conceptual and organizational sense, as a comprehensive management of the different risks (market risk, liquidity risk, credit risk, counterparty risk, operative risk, legal risk and technological risk) assumed by the institution for the development of its activities. The management of the risk inherent to transactions is essential for understanding and determining the behavior of the financial condition of the institution and the creation of long-term value.
In order to comply with the provisions regarding the Comprehensive Risk Management applicable to credit institutions, issued by the National Banking and Exchange Commission, the Board of Directors agreed to create the Comprehensive Risk Management Committee of the institution, to work pursuant to the rules set by such regulations. This Committee gathers every month and verifies that the transactions are according to the objectives, policies and procedures approved by the Board of Directors for the Comprehensive Risk Management.
The Comprehensive Risk management Committee delegates in the Comprehensive Risk Management Unit the responsibility for the implementation of procedures for the measure, administration and control of risks according to
4Q.13 | EARNINGS RELEASE | 2
the applicable policies; such Unit has the faculty to authorize amounts greater than the stipulated limits and in such cases, the Board of Directors shall be informed on such deviations.
Market Risk
The Market Risk Management department of the Comprehensive Risk management Unit is responsible for recommending the policies on market risk management of the institution, and to establish the parameters for risk measuring, and to provide reports, analysis and assessments to the senior management, to the Comprehensive Risk Management Committee and to the Board of Directors.
Market risk management consists in identifying, measuring, monitoring and controlling risks arising from fluctuations in the interest rates, FX rates, market prices and other risk factors in money markets, capital markets and derivatives markets in which the institution is exposed by its position.
The market risk measurement quantifies the potential variation in the value of the positions as a consequence of changes in the market risk factors.
Depending on the nature of the activities of each business unit, debt and capital instruments are registered as securities for trade, securities available for sale and/or securities held to maturity. The main characteristic that identifies securities available for sale as such is their permanent nature and they are managed as a structural part of the balance sheet. The institution has established provisions that all securities available for sale must fulfill, as well as adequate controls for assuring the compliance of such provisions.
Whenever significant risks are identified, they are measured and limits are allocated in order to assure an adequate control. Global measurement of risk is carried out via a combination of the methodology applied to Portfolios for Trade and to the management of Assets and Liabilities.
Portfolios for Trade
In order to measure the risk in a global approach, the methodology of Value at Risk (VaR) is used. VaR is defined as the statistical estimate of the potential loss of value of a given position, during certain period and at certain confidence level. VaR provides a universal measure of the level of exposure of the different risk portfolios; it allows the comparison of the risk level assumed in different securities and markets and expresses the level of each portfolio through a unique figure in economic units.
VaR is calculated via historical simulation, with a 521 working-days window (520 percentage changes) and a one-day horizon. The calculation is performed from a series of simulated gains and losses with 1% percentile at constant pesos and with pesos decreasing on an exponential basis, with a decrease factor that is reviewed on annual basis, the most conservative measure is the one to be reported. A confidence level of 99% is assumed.
It is important to mention that a limitation of the historical simulation method is that the recent past will reproduce itself in the near-future.
Likewise, monthly simulations of gains or losses of portfolios are carried out by revaluating such portfolios under different scenarios (Stress Test). Such estimates are generated using two different methods:
| | § | Applying to risk factors the percentage changes observed in certain periods including relevant market turbulences. |
| | § | Applying to risk factors changes that depend on the volatility of each risk factor. |
On a monthly basis “back testing” is carried out to compare daily gains and losses that would have been observed is the same positions had been maintained, taking into account only the change in value at risk in order to be able to fine tune the models. Even though these reports are prepared on a monthly basis, they include daily tests.
4Q.13 | EARNINGS RELEASE | 3
Management of Assets and Liabilities
Commercial banking activities of the institution generate important balance sheet amounts. The Assets and Liabilities Committee (ALCO) is responsible for determining the guidelines for the management of financial margin risk, net worth value and liquidity that must be followed by the different commercial portfolios. Pursuant to this approach, the General Direction of Finances has the responsibility to execute the strategies defined by the Assets and Liabilities Committee in order to modify the risk profile of the commercial portfolio by following the corresponding policies. Compliance with information requirements for interest rate, Exchange rate and liquidity risks is fundamental.
As part of the financial management of the institutions, sensitivity to financial margin (NIM) and net worth value (MVE) of the different balance sheet items is analyzed in comparison to variations in interest rates. This sensitivity is derived from the difference between maturity dates of assets and liabilities and the dates interest rates are modified. The analysis is performed from the classification of each item sensitive to interest rate throughout time, according to their repayment, maturity or contractual modification of the applicable interest rate.
Using simulation techniques, the predictable value of the financial margin and the net worth value are measured in different interest rate scenarios, and their sensitivity under extreme movement of such scenarios. As of December 2013:
| MM MXN | Sensitivity 1% NIM | | Sensitivity 1% MVE |
| Bank and Brokerage | Total | Derivatives | Non Derivatives | | Total | Derivatives | Non Derivatives |
| Balance MXN GAP | 1,050 | 170 | 880 | | (2,205) | 985 | (3,190) |
| Balance USD GAP | 252 | (54) | 306 | | 1,364 | (526) | 1,890 |
The Assets and Liabilities Committee adopts investment and hedging strategies in order to maintain such sensitivities within the target range.
Limits
Limits are used to control global risk of the financial group derived from each portfolio and books. The structure of limits is used to control exposures and to establish the total risk authorized to business units. These limits are established for VaR, Loss alert, maximum loss, equivalent volume of interest rate, delta equivalent in variable interest, open foreign currency positions, sensitivity of financial margin and sensitivity of net worth value.
Liquidity Risk
Liquidity risk is related to the ability of the institution to finance acquired commitments at reasonable market prices, as well as to fulfill business plans with stable financing sources. Risk factors may be external (liquidity crisis) and internal due to excessive concentration of maturities.
The institution carries out a coordinated management of maturities of assets and liabilities, and oversees the maximum timing difference profiles. This monitoring is based in the analysis of maturities of assets and liabilities, both contractual and managerial. Liquidity Risk is limited in terms of an accrued liquidity level during one month and in terms of a stipulated liquidity ratio.
4Q.13 | EARNINGS RELEASE | 4
Liquidity Gap
The following table shows the liquidity GAP of different maturities as of December, 2013:
Millions of Pesos | | Total | | 1D | 1W | 1M | 3M | 6M | 9M | 1Y | 5Y | >5Y |
| | | | | | | | | | | | | |
| Structural GAP | | 75,391 | | 42,708 | 40,525 | (48,790) | (8,219) | 27,611 | 25,541 | 14,109 | (4,698) | (13,397) |
| Non Derivative | | 73,614 | | 42,676 | 40,456 | (48,294) | (8,447) | 26,801 | 25,839 | 13,678 | (4,602) | (14,493) |
| Derivatives | | 1,776 | | 32 | 69 | (495) | 229 | 810 | (299) | 431 | (97) | 1,096 |
Credit Risk
Management of credit risk of the Institution is developed differently for the different segments of clients along the three phases of the credit process: acceptance, follow-up and recovery.
From a global perspective, management of credit risk in the institution is responsible for the identification, measurement, integration and assessment of the aggregated risk and the profitability according to such risk; with the purpose of oversee the levels of risk concentration and to adapt them to the limits and objectives previously established.
Risks receiving an individual treatment (risks with companies, institutions and financial entities) are identified and taken apart from those other risk that are managed in standardized manner (consumer and mortgages credits to individuals, loans to businesses and small enterprises)
Risks managed on individual basis are subject to a specific solvency or rating system with a related probability of failure that allows the measuring of the risk for each client and for each transaction from the beginning. The assessment of the client, after analyzing other relevant risk factors in different areas, is adjusted according to the special characteristics of the transaction (guarantee, term, etc.,)
Standardized risks require, due to their special characteristics (great number of transactions for relatively low amounts), a different management that allows an efficient process and effective use of resources, so automated decision tools are used (expert and credit scoring systems).
Management of loans to companies is complemented, during the follow-up phase, with the so called “system of special monitoring” that determines the policy to be followed in the management of the risks with companies or groups rated within such category. Different situations of levels of monitoring are identified and generate different actions. A special monitoring grade is given in the case of alert signals, systematic reviews, or specific initiatives promoted by the Risks Department or Internal Audit.
Recovery Units constitute a critical element in the management of irregular risk, in order to minimize the final loss for the institution. These units are responsible for a specialized management of the risk from the moment they are classified as irregular risk loans (defaulting payment).
The institution has carried out a policy for the selective growth of risk and a strict treatment of late payments and the creation of the corresponding provisions, based in the prudent criteria defined by the Group.
Probability of Default and Expected Losses
Pursuant to the provisions on Comprehensive Risk Management included in the general regulations applicable to credit institutions, as part of the credit risk management, credit institutions must determine the probability of default. The system allows the calculation of the probability for the different loans portfolios:
| | a. | The probability of failure (PD) for “No Retail” portfolios is determined via the fine tune of the ratings of clients in a given moment, based in the Monthly Default Rates observed during a period of five years. Such |
4Q.13 | EARNINGS RELEASE | 5
| | Default Rates are adjusted to an economic cycle of ten years. For “Retail” portfolios, the standard default probabilities set by the Basel Convention are used. |
| | b. | Once the probability of default is determined, the parameters of “severity of Loss” (LGD) and “Exposure at Default” (EAD) stipulated in Basel, are taken into consideration. |
Once the abovementioned factors are obtained, the Expected Loss (PE) is calculated as follows:
Expected Loss = Probability of Default x Severity of Loss x Exposure at Default
i.e.: PE = PD * LGD * EAD
Counterparty Risk
Included in the credit risk, there is a concept that, due to its characteristics, it requires a special management: the Counterparty Risk.
Counterparty Risk is the risk the Institution assumes with governmental entities, financial institutions, corporations, companies and individuals in their treasury activities and correspondent bank activities. The measurement and control of the Credit Risk in Financial Instruments, Counterparty Risk, is carried out by a special unit with an organizational structure independent from the business areas.
The control of Counterparty Risk is performed daily via the Interactive Risk Integrated System (IRIS), which informs the credit line available with any counterparty, in any product of the financial markets as well as the maximum term approved.
For the control of the counterparty lines the Equivalent Credit Risk (REC) is used. REC is an estimate of the potential loss if the counterparty stops complying with its payment obligations. REC takes into account ratios per product for measuring the potential risk and includes the current exposure with each counterpart; in consequence, REC varies depending on the type of product and term of transaction.
Equivalent Credit Risk (REC) is defined as the amount the Bank may loss in transactions with active clients if such client does not comply with his/her obligations. A position measured via REC may be constituted by several individual transactions, in different products and different maturity dates, and the total REC for each transaction represents the global position with each counterpart.
Equivalent Credit Risk (REC) is an estimate of the amount the Institution may lose in current transactions with certain counterparty, if such counterparty commits a default in any moment until the maturity date of transactions. REC takes into account the Current Credit Exposure, which is defined as the cost to substitute the transaction at market value provided that this value is positive for the institution, and it is measured as the market value (mark to market) of the transaction (MtM).
In addition, REC includes the Potential Credit Exposure or Potential Additional Risk (RPA), which represents the possible evolution of the current credit exposure until maturity, given the characteristics of the transaction and the possible variations in the market factors. Gross Equivalent Credit Risk considers all the definitions previously described, excluding credit risk reduction because of netting or because of collateral agreements.
For the calculation of Net REC, mitigating factors of the counterparty credit risk are taken into consideration, such as collaterals, netting agreements, among other. The methodology continues to be effective.
In addition to the Counterparty Risk, there is the Settlement Risk, which is present in every transaction at its maturity date, when the possibility that the counterparty does not comply with its payment obligations arises, once the institution has complied with its obligations by issuing payment directions.
For the process of control for this risk, the Deputy General Direction of Financial Risks oversees on a daily basis the compliance with the limits on counterparty credit risks by product, term and other conditions stipulated in the authorization for financial markets. Likewise, it is the responsible for communicating on a daily bases, the limits, consumptions and any incurred deviation or excess.
4Q.13 | EARNINGS RELEASE | 6
On a monthly basis, a report is presented to the Comprehensive Risk management Committee, and on quarterly basis, to the Board of Directors, with respect to the limits to Counterparty Risks, Issuer Risks and current consumptions, as well as incurred excesses and transactions with non authorized customers. In addition, it informs the calculation of the Expected Loss for current transactions in financial markets at the closing of every month and different scenarios of stress of Expected Loss. All of the above according to the methodologies and assumptions approved by the Comprehensive Risk Management Committee.
Currently, we have approved lines of Counterparty Risks in Grupo Financiero Santander for the following segments: Mexican Sovereign Risk and Domestic Development Banking, Foreign Financial Institutions, Mexican Financial Institutions, Corporations, Companies Banking-SGC, Institutions Banking, Large Enterprises Unit, Project Finance.
Equivalent Net Credit Risk of the lines of Counterparty Risk and Issuer Risk of the Institution as of the end of the 4Q.13, and the quarterly average Equivalent Net Credit Risk of the lines of Counterparty Risk and Issuer Risk of the Institution for the 4Q.13:
| | Equivalent Net Credit Risk |
| Segment | End4Q.13 | Average4Q.13 |
| Sovereign Risk, Development Banking and Financial Institutions | 90.73% | 16,998.41 |
| Corporates | 8.66% | 1,667.26 |
| Companies | 0.61% | 114.77 |
| | | million USA dollars |
The equivalent credit risk lines maximum gross counterparty risk of the Institution at the end of the 4Q.13, which corresponds to derivative transactions is distributed depending on the type of derivative:
| | Equivalent Gross Credit Risk |
| Type of Derivative | End4Q.13 |
| Rate derivatives | 19,563 |
| Exchange rate derivatives | 18,282 |
| Bonds derivatives | 5 |
| Equity derivatives | 355 |
| TOTAL | 38,205 |
| | million USA dollars |
Note: In IRIS, the Equivalent Gross Credit Risk does not consider the mitigation by netting agreements and by collateral agreements with counterparties.
The Expected Loss of the Institution at the end of the 4Q.13, and the quarterly average of the expected loss of the lines of Counterparty risk and issuer risk of the Institution, for the 4Q.13 are:
| | Expected Loss |
| Segment | End4Q.13 | Average4Q.13 |
| Sovereign Risk, Development Banking and Financial Institutions | 31.57% | 2.61 |
| Corporates | 59.56% | 5.62 |
| Companies | 8.86% | 0.82 |
| | | million USA dollars |
The segments of Mexican Financial Institutions and Foreign Financial Institutions are very active counterparties with whom the institution has current positions of financial instruments with Counterparty Credit Risk. It is important to
4Q.13 | EARNINGS RELEASE | 7
mention that Equivalent Credit Risk is mitigated by netting agreements (ISDA-CMOF) and, in some cases, by collateral agreements (CSA-CGAR) or revaluation agreements with counterparties.
Respect to total collateral received for derivatives transactions at the end of the 4Q.13:
| Cash collateral | 93.84% |
| Collateral refer to bonds issued by the Mexican Federal Government | 6.16% |
4Q.13 | EARNINGS RELEASE | 8
Operating Risk
With respect to Operating Risk, and pursuant to the corporate methodology, the institution has established policies, procedures and methodologies for the identification, control, mitigation, monitoring and reporting of operating risks.
For the identification and classification of operating risks, different categories and business lines defined by national and internal regulating organisms are used. The methodology is based in the identification and documentation of the corresponding risks, controls and processes, and quantitative and qualitative tools are used, such as self-assessment questionnaires, development of historical data bases and Operating Risk indicators, etc. for their control, mitigation and reporting.
Legal Risk
Legal Risk is defined as the potential loss due to the failure to comply with the applicable legal and administrative regulations, the issue of administrative and judicial resolutions against the institution and the application of fines, with respect to the transactions carried out by the Institution.
Pursuant to the provisions regarding the Comprehensive Risk Management, the following activities are performed: a) Establishment of policies and procedures for analyzing the legal validity and the proper execution of the legal acts. b) estimates of the amount of potential losses derived from judicial or administrative orders against the Institution and the possible application of fines c) Analysis of the legal acts governed by a legal system different to the Mexican laws, d) communication to directors and employees on the legal and administrative regulations applicable to transactions and e) the performance, at least on annual basis, of internal legal audits.
Technological Risk
Technological risk is defined as the potential loss due to damages, discontinuation, alterations or failures derived from the use or dependence on hardware, software, systems, applications, networks and any other data channel distribution for the provision of banking services to the clients of the Institution.
The Institution has adopted a corporate model for the management of Technological Risks, integrated to the processes of service and support to computing areas in order to identify, oversee, control, mitigate and report the Computing Technology Risks the transaction is exposed to, with the aim of establishing control measures that decrease the probability of risks to occur.
Processes and levels of authorization
Pursuant to internal regulations, all the products and services traded by the Institution are approved by the Local Committee for New Products (CLNP) and by the Global Committee for New Products (CGNP). Those products or services that are modified or extended with respect to their original approval must be approved by the CLNP and, depending of their relevance, the CGNP must approve them too.
All areas taking part in the operation of the product or service, depending on the nature of such product or service, as well as the areas responsible for their accounting registration, legal formalization, fiscal treatment, risk assessment, etc. are present in the Committee. All approvals shall be unanimous as there are no authorizations approved by majority of votes. In addition to the Committee’s approval, there are products that require authorizations from local authorities, and therefore, the Committee’s approvals are subject to the authorizations issued by the competent authorities in each case.
Finally, all the approvals shall be authorized by the Comprehensive Risk Management Committee.
Independent Reviews
The Institution is subject to the monitoring and supervision of the National Bank and Exchange Commission, the Central Bank of Mexico and the Bank of Spain, and such monitoring and supervision is exercised via follow-up processes, inspection visits, information requests, delivery of documents and reports.
Likewise, periodic reviews are performed by Internal and External Auditors.
4Q.13 | EARNINGS RELEASE | 9
ii. General description of the valuation techniques
Derivative financial securities are valued at reasonable value, according to the accounting rules established in the Circular Letter for Credit Institutions issued by the National Banking and Exchange Commission, in Principle B-5 “Derivative Financial Instruments and hedging Transactions” and the provisions in Principle A-2 “Application of specific rules”, and the provisions in the specific rule included in Bulletin C-10 of the Financial Information Rules.
A. Methodology of Valuation
Valuation is made at the corresponding closing market price. Prices are provided by the supplier of prices.
| | b) | Over-the-Counter Markets |
| | i) | Derivative financial instruments with optionality. |
In the majority of the cases, a general form of the Black & Scholes model is used. Such model assumes that the underlying product follows a lognormal distribution. For exotic products or when payment depends on the trajectory of any market variable, Monte Carlo simulations are used. In this case, it is assumed that logarithms of the different variables follow a multi-varied normal distribution.
| | ii) | Derivative financial instruments with no optionality. |
The valuation technique is to obtain the present value of the estimated future flows.
In all cases, the Institution carries out the valuation of its positions and registers the corresponding value. In some cases, a different calculation agent is designated, and such calculation agent may be the counterparty or a third party.
In the performance of its commercial banking activities, the Institution has tried to cover the evolution of the financial margin of structured portfolios that are exposed to adverse movements in interest rates. The ALCO, the body responsible for the management of long-term assets and liabilities, has constituted the portfolio via which the Institution achieves such hedge.
An accounting hedge is defined as a transaction that complies with the following conditions:
a. A hedge relationship is designated and documented from the beginning in an individual file, where its objective and strategy is established.
b. The hedge is effective for the compensation of variations in the reasonable value or in the cash flows attributed to such risk, according to the risk management documented at the beginning.
The Management of the Institution performs derivative transactions for hedging purposes with swaps.
Derivatives for hedging purposes are valued at market value, and the effect is recognized depending on the type of accounting hedge, pursuant to the following:
a. In the case of fair value hedges, they are valued at market value for the risk covered, the primary position and the hedging derivative instrument, and the net effect is registered in the statement of income of the corresponding period.
b. In the case of cash flow hedges, the hedging derivative instrument is valued at market value. The effective portion of the hedge is registered in the comprehensive income account, within the stockholders’ equity, and the ineffective portion is registered in the statement of income.
4Q.13 | EARNINGS RELEASE | 10
The Institution ceases the recording of hedges at the maturity date of the derivative, or when such derivative is sold, cancelled or exercised; when the derivative does not reach a high efficiency in compensating the changes in the reasonable value or the cash flows of the covered item, or when the Institution decides to cancel the hedge.
It shall be fully evidenced that the hedge fulfills the objective for which derivatives were contracted for. This effectiveness requirement assumes that the hedge must comply with a maximum range of deviation with respect to the initial objective of 80% to 125%.
In order to demonstrate the efficacy of hedges, two tests are to be carried out:
| | a) | Forward-looking Test: it is demonstrated that, in the future, the hedge will be within the aforementioned range of deviation. |
| | b) | Retrospective Test: This test reviews if, in the past, from its initial date to now, the hedge has been maintained within the allowed range of deviation. |
In the cases of Fair Value Hedges and the Cash Flow Hedges, they are retrospective and forward-looking efficient and within the allowed maximum range of deviation.
B. Reference Variables
The most relevant reference variables are:
Exchange Rates
Interest Rates
Shares
Baskets of shares and stock indexes.
C. Frequency of valuation
Derivative financial instruments for trading and hedging purposes are valued on a daily basis.
iii. Management of internal and external sources of liquidity that may be used for the compliance of requirements related to derivative financial instruments.
Resources are obtained via the National and International Treasury departments.
iv. Changes in exposure to identified risks, contingencies and events, known or expected, in derivative financial instruments.
At the end of the third quarter of 2013, the Institution has no situation or contingency such as changes in the value of the underlying asset or the reference variables, that may cause the use of the derivative financial instruments to be different to their original intended use, a significant change in their scheme or the total or partial loss of the hedge, requiring the Issuer to assume new obligations, commitments or variations in its cash flow or affecting its liquidity (day trade calls), nor contingencies or events known or expected by the Management that may affect future reports.
During 4Q2013, the number or expired derivative financial instruments and closed positions was as follows (not audited):
4Q.13 | EARNINGS RELEASE | 11
| Description | | Maturities | | | Closed Positions | |
| Caps and Floors | | | 295 | | | | 5 | |
| Equity Forward | | | 2 | | | | 11 | |
| OTCEquity | | | 843 | | | | 2 | |
| OTCFx | | | 885 | | | | 15 | |
| Swaptions | | | 37 | | | | 0 | |
| Fx Forward | | | 1108 | | | | 105 | |
| IRS | | | 1050 | | | | 52 | |
| CCS | | | 33 | | | | 0 | |
The amount of day trade calls performed during the quarter was the necessary for covering contributions to organized markets and the requirements in collateral agreements.
During the 4Q2013, there were no defaults by counterparties.
IV. Sensitivity Analysis
i. Identification of Risks
Sensitivity measures of market risk associated with securities and derivative financial instruments are those that measure the change (sensitivity) of the market value of the financial instrument concerned, when changes in each of the risk factors associated with same occur.
The sensitivity of the value of a financial instrument when changes in market factors occur and is determined by the full instrument revaluation.
The sensitivities are detailed below according to each risk factor and associated historical consumption of the trading book.
The management strategy of the organization is integrated with security positions and derivatives. The latter are used largely to mitigate the market risk of the first. In view of the above, the sensitivities or exposures as described below are both types of instruments considered as a whole.
1. Sensitivity to risk factor “Equity (delta EQ)”
The EQ delta shows the change in the portfolio's value in relation to changes in the prices of equities.
The EQ delta calculated for the case of derivative financial instruments considered the relative change of 1% in the prices of the underlying assets in equities, in the case of equities, this considers the relative variation of 1% of market price title.
2. Sensitivity to risk factor “Foreign Exchange”, (delta FX)
The FX delta shows the change in the portfolio's value in relation to changes in asset prices exchange rate.
The FX delta calculated for the case of derivative financial instruments considered the relative change of 1% in the prices of the underlying assets of the exchange rate, In the case of currency positions, this considers the relative variation of 1%of the corresponding exchange rate.
3. Sensitivity to risk factor “Volatility” (VEGA)
4Q.13 | EARNINGS RELEASE | 12
Vega sensitivity is the measure resulting from changes in the volatility of the underlying asset(the reference asset). Vega risk is the risk that a change in the volatility of the underlying asset value, that results in a change in the marketvalue of the derivative.
The calculation of Vega sensitivity, considers the absolute change of 1%inthe volatility of the underlying asset value.
4. Sensitivity to risk factors “Interest Rate” (Rho)
This sensitivity quantifies the change in value of financial instruments for the trading portfolio in the face of a parallel increase in the interest rate curves of a basis point.
The table below presents the sensitivities described above corresponding to the position of the trading portfolio.
| | SENSITIVITY ANALYSIS |
| | (Data in Million MX$) | | |
| | | | | |
| | Total rate sensitivity | | | |
| | | MXP | OTHER CURRENCIES | |
| | Sens. a 1 Bp | -5.20 | 2.10 | |
| | | | | |
| | Vega Risk factor | | | |
| | | EQ | FX | IR |
| | Total | 6.34 | 1.04 | -7.00 |
| | | | | |
| | Delta Risk Factor (EQ and FX) | | | |
| | | EQ | FX | |
| | Total | 6.82 | -0.51 | |
| | | | | |
It is considered that the above sensitivity table reflects prudent management of the trading portfolio of the institution with respect to risk factors.
ii. Stress Test for Derivative Financial Instruments
The following are various stress test scenarios considering various scenarios calculated for the trading portfolio of the Institution.
| | · | Probable scenario: This scenario was defined based in the movements derived from a standard deviation, with respect to risk factors that have an influence over the valuation of financial instruments. Specifically: |
| | o | Risk factors of Interest Rate (“IR”), volatility (“Vol”) and rate of Exchange (“FX”) were incremented in a standard deviation. |
| | o | Risk factors with respect to stock market (EQ) were decreased in a standard deviation. |
| | · | Possible scenario: Under this scenario, as requested in the official letter, risk factors were modified in 25%. Specifically: |
4Q.13 | EARNINGS RELEASE | 13
| | o | Risk factors: IR, Vol and FX were multiplied by 1.25 that means, they were incremented in 25%. |
| | o | Risk factor EQ was multiplied by 0.75 that means, it was decreased in 25%. |
| | · | Remote scenario: under this scenario, as requested in the official letter, risk factors were modified in 50%. Specifically: |
| | o | Risk factors IR, Vol and FX are multiplied by 1.50, that is, they were incremented in 50%. |
| | o | Risk factor EQ was multiplied by 0.5, that is, it was decreased a 50%. |
iii. Effect in the Income Statement
The following table shows the possible income (loss) for the trading portfolio of the institution, in millions of pesos for each stress scenario:
| | Summary of Stress Test Analysis | |
| | Amounts in Million Mx$ | |
| | | | |
| | Risk Profile | Stress all factors | |
| | Probable scenario | (37) | |
| | Remote scenario | (2,462) | |
| | Possible scenario | (930) | |
| | | | |