UNITED STATES
SECURITIES AND EXCHANGE COMMISSION
Washington, D.C. 20549
FORM 6-K
REPORT OF FOREIGN PRIVATE ISSUER PURSUANT TO RULE 13a-16 OR 15d-16 UNDER THE SECURITIES EXCHANGE ACT OF 1934
For the month of April, 2015
Commission File Number: 001-35658
GRUPO FINANCIERO SANTANDER MÉXICO, S.A.B. de C.V.
(Exact Name of Registrant as Specified in Its Charter)
SANTANDER MEXICO FINANCIAL GROUP, S.A.B. de C.V.
(Translation of Registrant’s Name into English)
Avenida Prolongación Paseo de la Reforma 500
Colonia Lomas de Santa Fe
Delegación Álvaro Obregón
01219 México, D.F.
(Address of principal executive office)
Indicate by check mark whether the registrant files or will file annual reports under cover of Form 20-F or Form 40-F:
Indicate by check mark if the registrant is submitting the Form 6-K in paper as permitted by Regulation S-T Rule 101(b)(1):
Indicate by check mark if the registrant is submitting the Form 6-K in paper as permitted by Regulation S-T Rule 101(b)(7):
GRUPO FINANCIERO SANTANDER MÉXICO, S.A.B. de C.V.
TABLE OF CONTENTS
| ITEM | |
| 1. | First quarter 2015 earnings report of Grupo Financiero Santander México, S.A.B. de C.V. |
| 2 | First quarter 2015 earnings presentation of Grupo Financiero Santander México, S.A.B. de C.V. |
SIGNATURE
Pursuant to the requirements of the Securities Exchange Act of 1934, the registrant has duly caused this report to be signed on its behalf by the undersigned, thereunto duly authorized.
GRUPO FINANCIERO SANTANDER MÉXICO, S.A.B. de C.V. | |
| | |
| | |
| By: | /s/ Gerardo Manuel Freire Alvarado | |
| | Name: | Gerardo Manuel Freire Alvarado | |
| | Title: | Executive Director of Investor Relations | |
Date: April 28, 2015
Item 1
| | 1Q.15| EARNINGS RELEASE | 1 |
| | |  |
TABLE OF CONTENTS
| I. | CEO Message / Key Highlights for the Quarter |
| II. | Summary of 1Q15 Consolidated Results |
| III. | Analysis of 1Q15 Consolidated Results |
| IV. | Relevant Events & Representative Activities and Transactions |
| VI. | 1Q15 Earnings Call Dial-In Information |
| VIII. | Notes to the Financial Statements |
| | 1Q.15| EARNINGS RELEASE | 2 |
| | | |
Grupo Financiero Santander México Reports First Quarter 2015 Loan Portfolio Up 16.0% YoY and Net Income of Ps.3,215 Million
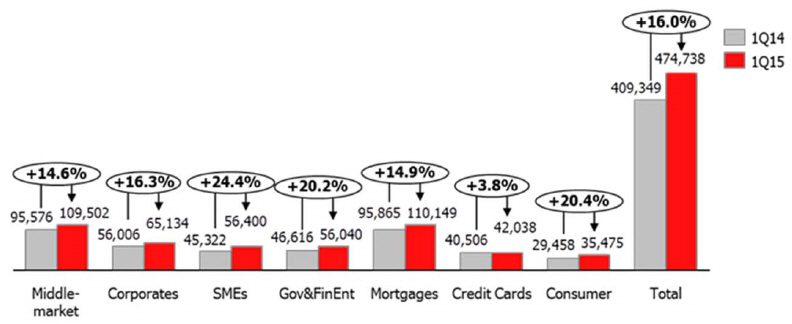
| - | Loan growth driven by YoY increases of 24.4% in SMEs, 14.6% in middle-market, 14.9% in mortgages, 20.4% in consumer loans and 3.8% in credit cards |
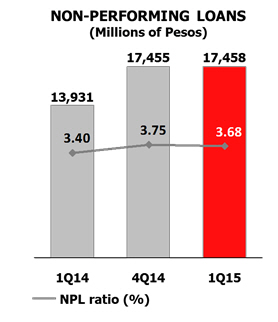
| - | Ongoing prudent risk management reflected in a NPL ratio of 3.68% (2.25% excluding homebuilders and Santander Vivienda portfolio) and a cost of risk of 3.1% |
Mexico City – April 28, 2015, Grupo Financiero Santander México, S.A.B. de C.V., (NYSE: BSMX; BMV: SANMEX), (“Santander México”), one of the leading financial groups in Mexico, today announced financial results for the three-month period ending March 31, 2015.
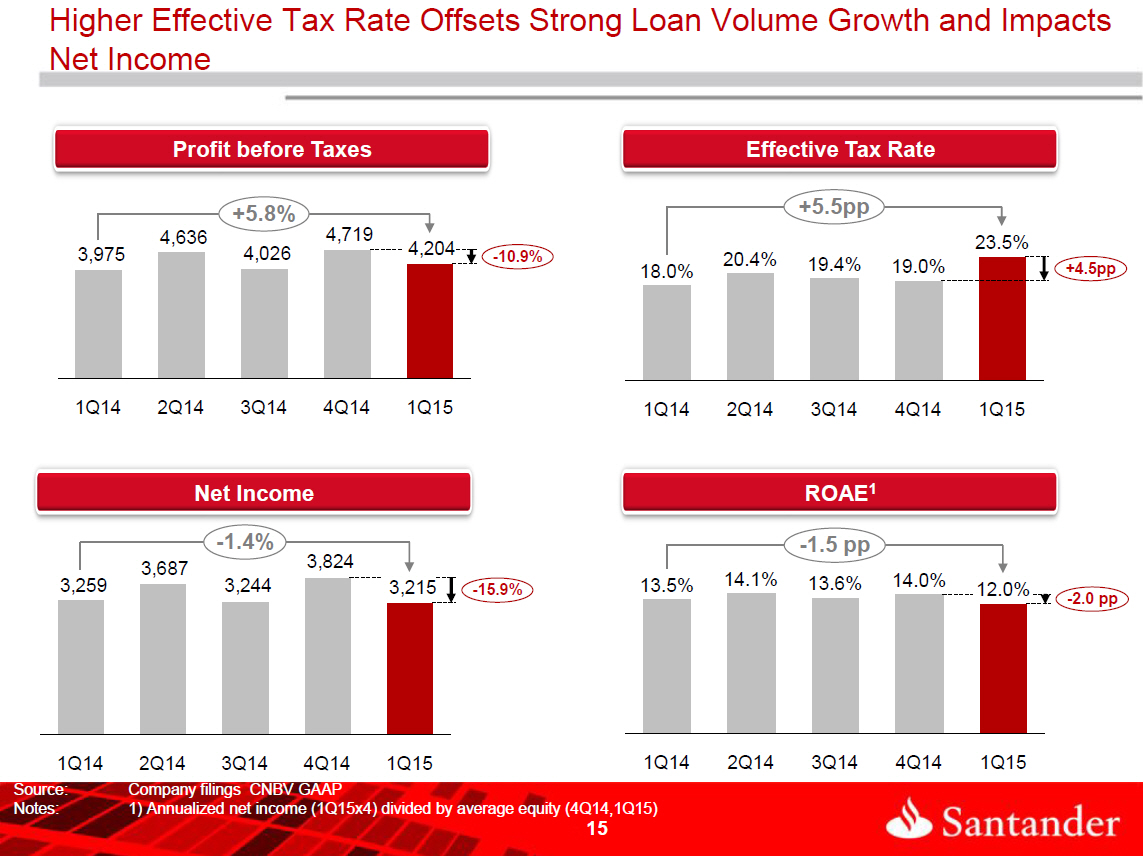
Santander México reported net income for the quarter of Ps.3,215 million, representing declines of 1.4% and 15.9% YoY and QoQ, respectively.
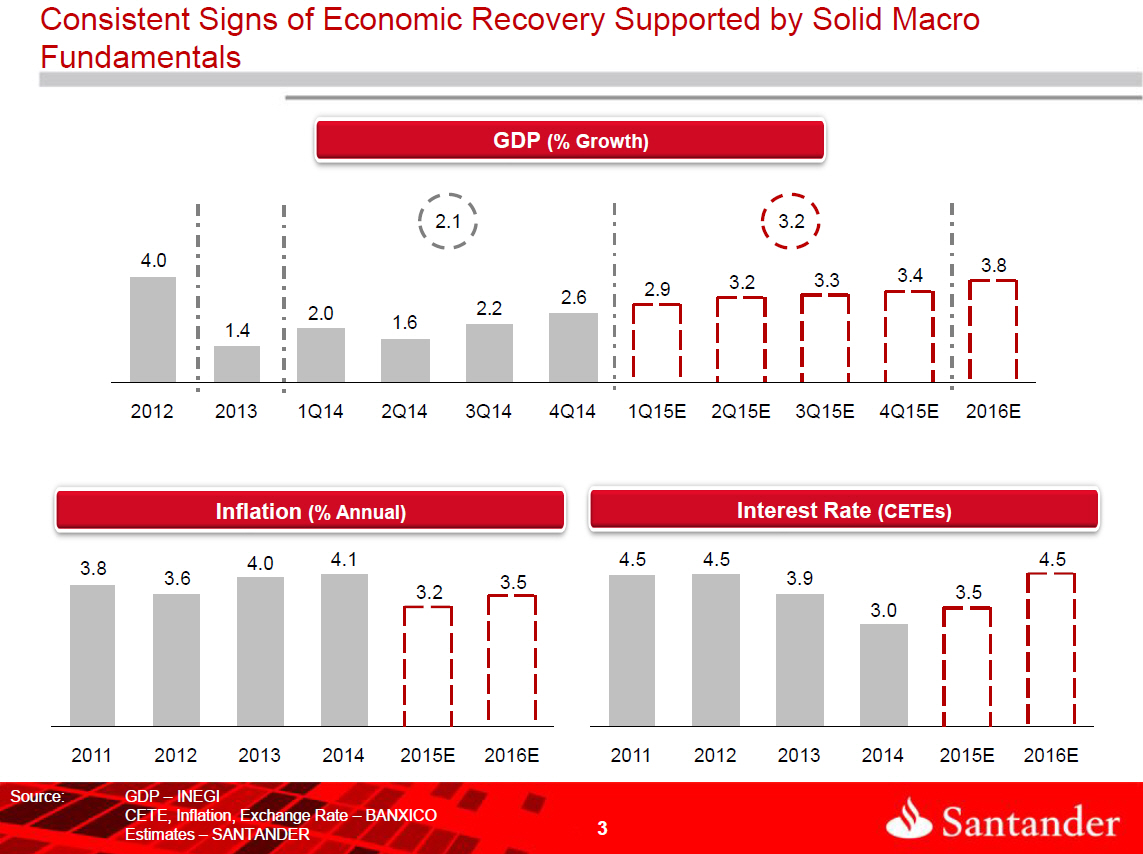
Marcos Martínez, Grupo Financiero Santander México’s Executive President and CEO, commented, “This was a good quarter; we continued to expand our loan portfolio leveraging the consistent signs of economic recovery, again beating system growth rates while further enhancing asset quality and maintaining a stringent focus on cost controls. Gross operating income reached a record high surpassing the Ps.14 billion mark.”
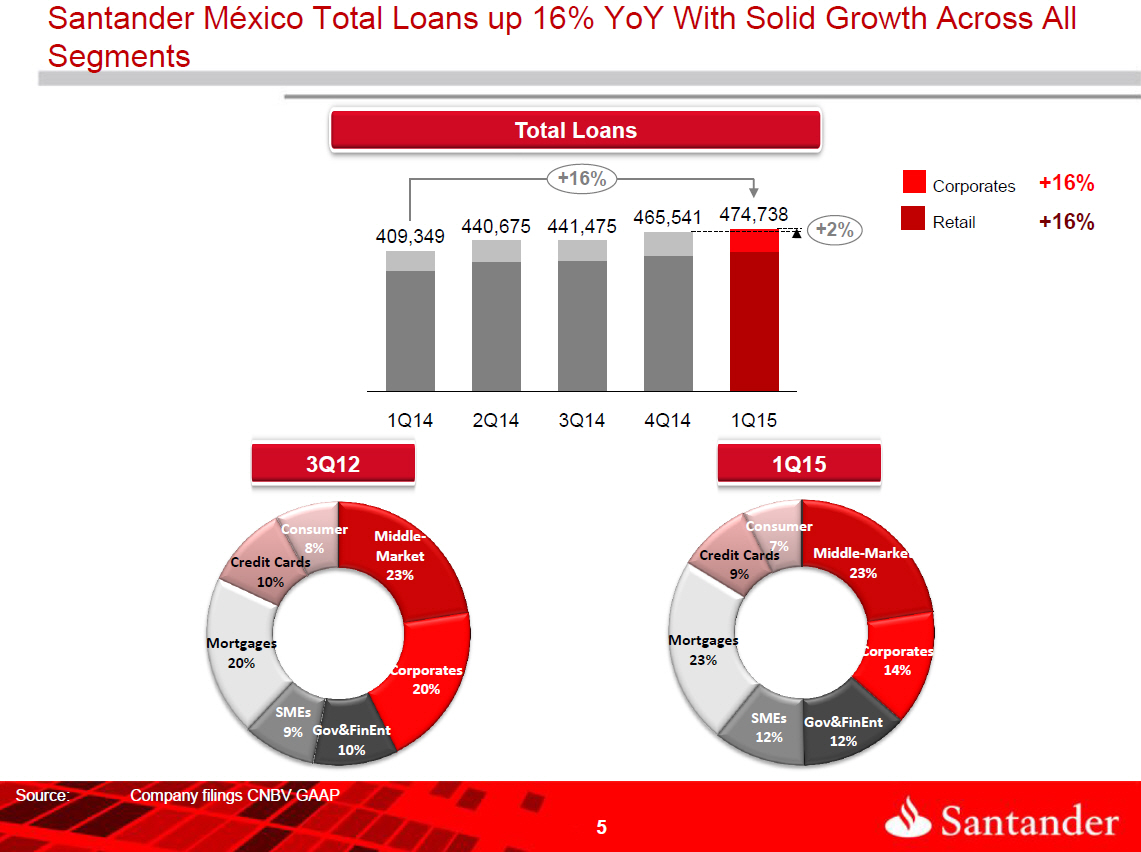
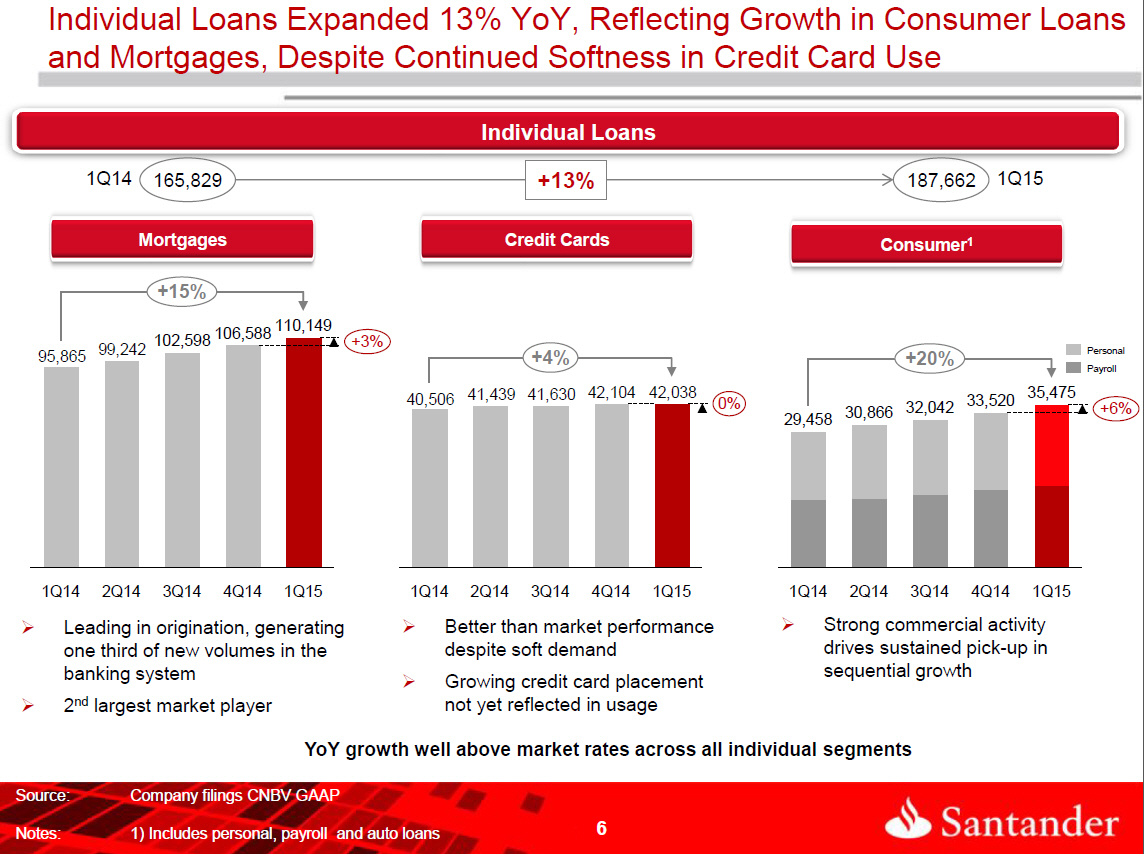
“Our continued focus on client service and attractive product offering allowed us to report a 16% YoY increase in our loan book achieving a positive performance across all segments. Most importantly, consumer loans – excluding credit cards – rose 21% YoY, more than doubling market growth. And while credit card use remains weak we expanded this product by 4% YoY, doubling system rates. Furthermore, we maintain our leadership position in the highly attractive SME market, increasing this portfolio up 24% year-on-year. Mortgage loans rose 15% YoY, remaining the leading mortgage originator in the country, with middle market loans also posting strong growth – up 15% year-on-year and doubling the market.” | 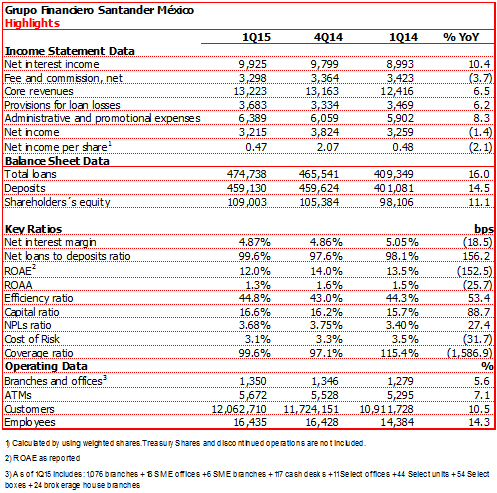 |
“Growth was achieved while lowering cost of risk by 19 bps QoQ and 32 bps YoY and increasing the coverage ratio to close to 100%. NPLs showed sequential improvements across most segments.”
| | 1Q.15| EARNINGS RELEASE | 3 |
| | | |
“While net income was impacted by a higher effective tax rate, costs related to our branch expansion and lower investment banking and credit card fees, gross operating income increased 8% year-on-year, above growth in expenses and loan loss reserves.”
“During the quarter we finalized the agreement to acquire a consumer loan portfolio of approximately Ps.3.2 billion from Scotiabank Inverlat S.A. as announced on November 2014. This acquisition became effective on April 2015 and added approximately 39,000 new clients.”
Mr. Martínez concluded, “Looking forward, we expect loan growth to remain strong based on our cautiously optimistic view of the recovery of the Mexican economy, particulary given the recent pick-up in consumer activity. Our results are also expected to benefit from increasing investment banking activity fees as external volatility subsides and the execution of large energy and infrastructure projects moves ahead. We are confident that our solid franchise, attractive product offering and a motivated team will allow us to continue contributing to the economic development of the country.”
| | 1Q.15| EARNINGS RELEASE | 4 |
| | | |
| SUMMARY OF FIRST QUARTER 2015 CONSOLIDATED RESULTS
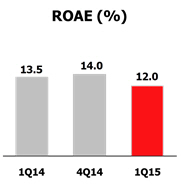
Net income Santander México reported net income of Ps.3,215 million in 1Q15, decreasing 1.4% and 15.9% YoY and QoQ, respectively. Capitalization and ROAE Banco Santander México’s preliminary capital ratio at period end 1Q15 was 16.6%, compared to 15.7% and 16.2% at period end 1Q14 and 4Q14, respectively. The 16.6% capital ratio was comprised of 13.2% Tier 1 and 3.4% Tier 2. | 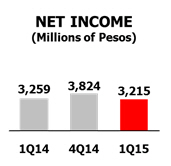 |
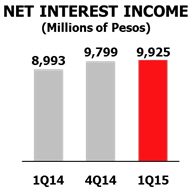
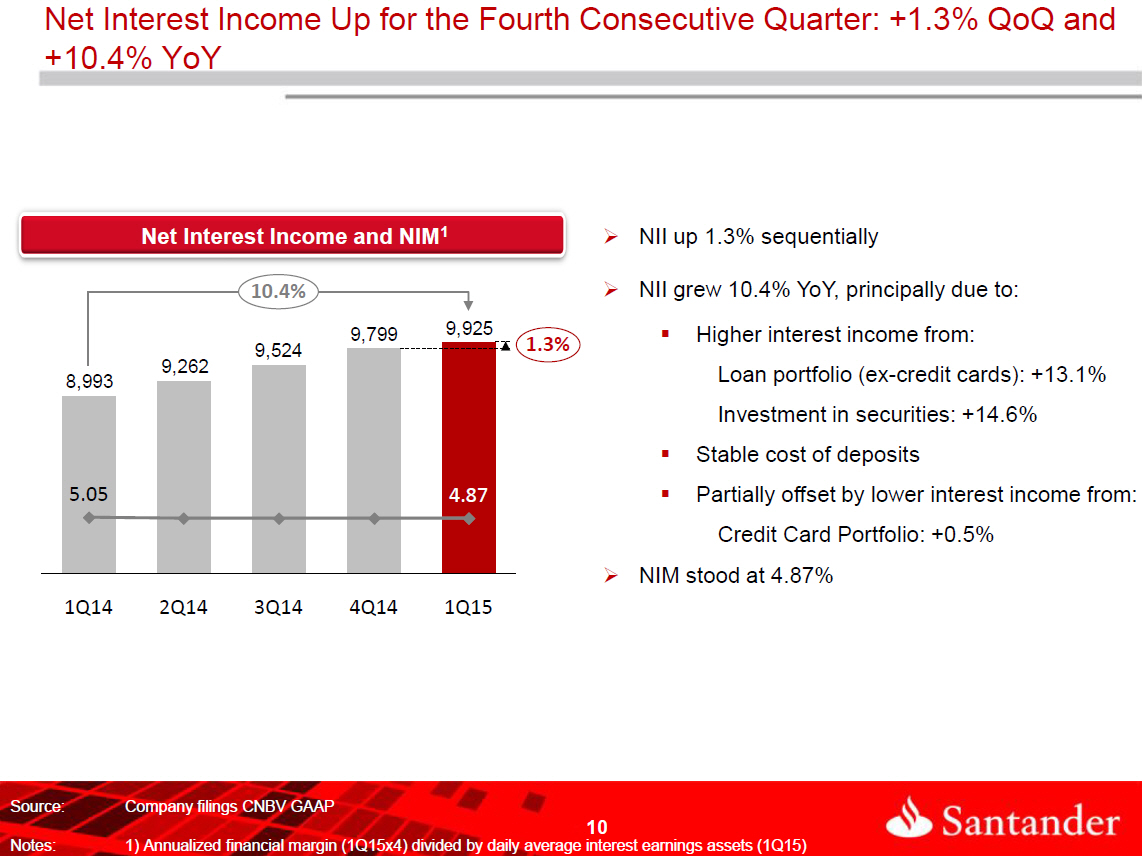
1Q15 reported ROAE was 12.0%, versus 13.5% in 1Q14 and 14.0% in 4Q14. Net interest income and NIM Net interest income in 1Q15 increased YoY by 10.4%, or Ps.932 million, to Ps.9,925 million. On a sequential basis, net interest income increased 1.3%, or Ps.126 million, from Ps.9,799 million reported in 4Q14.
Net interest margin ratio calculated with daily average interest-earning assets for 1Q15 was 4.87%, which compares with 5.05% and 4.86% in 1Q14 and 4Q14, respectively. Interest income increased 7.8%, or Ps.1,077 million, to Ps.14,821 million in 1Q15 from Ps.13,744 million in 1Q14. Increases of 9.5%, or Ps.1,004 million, in interest income from our loan portfolio and commissions on loan origination and Ps.279 million, or 14.6%, in investment in securities, were partially offset by YoY decreases in interest income of Ps.182 million, or 23.1%, from repurchase agreements and of Ps.21 million, or 5.9%, from funds available.
Interest expense increased YoY by 3.1%, or Ps.145 million, to Ps.4,896 million in 1Q15, primarily due to increases in interest expense of Ps.104 million on subordinated capital notes, Ps.61 million on bank and other loans, Ps.20 million on demand deposits and Ps.10 million on credit instruments issued. These increases were partially offset by declines in interest paid of Ps.37 million on repurchase agreeements and Ps.13 million on term deposits. | |
Santander México’s total loan portfolio in 1Q15 increased YoY by 16.0%, or Ps.65,389 million, to Ps.474,738 million, and by 2.0%, or Ps.9,197 million, on a sequential basis.
In 1Q15, Santander México’s loan portfolio expanded YoY across all products, in both the individual and commercial loan segments. Individual loan growth was mainly driven by mortgages and consumer loans, which were up 14.9% and 20.4%, respectively, while credit cards were up 3.8% still reflecting softness in credit card use. Growth in the consumer portfolio was mainly driven by personal loans together with payroll loans.
| | 1Q.15| EARNINGS RELEASE | 5 |
| | | |
Commercial loans continued to benefit from a significant YoY increase in the SMEs and middle-market loan portfolios, together with an increase in the government portfolio, which grew driven by loans granted to two of the state-owned energy companies with risk comparable to any other large corporate. Corporate loans, in turn, rose 16.3% YoY, up from the 4.7% YoY increase posted in 4Q14. This reflects several large loans granted during the quarter despite the syndication of one of the large loans that was granted last quarter.
Asset quality
The NPL ratio in 1Q15 was 3.68%, a 28 bps increase from the 3.40% posted in 1Q14 and 7 bps lower than the 3.75% reported in 4Q14. The NPL ratio showed an improvement across most segments. The NPL ratio for 1Q15 continues to reflect our exposure to the homebuilders, with non-performing loans of Ps.4,779 million, as well as the effect from Santander Vivienda’s non-performing portfolio (formerly ING), which as of 1Q15 amounted to Ps.2,319 million, out of a total portfolio of Ps.10,250 million. Excluding the impact of the homebuilders and Santander Vivienda’s portfolio, the NPL ratio for 1Q15 and 4Q14 would have been 2.25% and 2.33%, respectively. The current NPL ratio continues to reflect loan portfolio growth combined with Santander México’s stringent credit scoring model and ongoing monitoring of loan portfolio quality.
The coverage ratio for the quarter was 99.6%, a decrease from 115.4% in 1Q14 and an increase from 97.1% in 4Q14.
Loans to deposit ratio
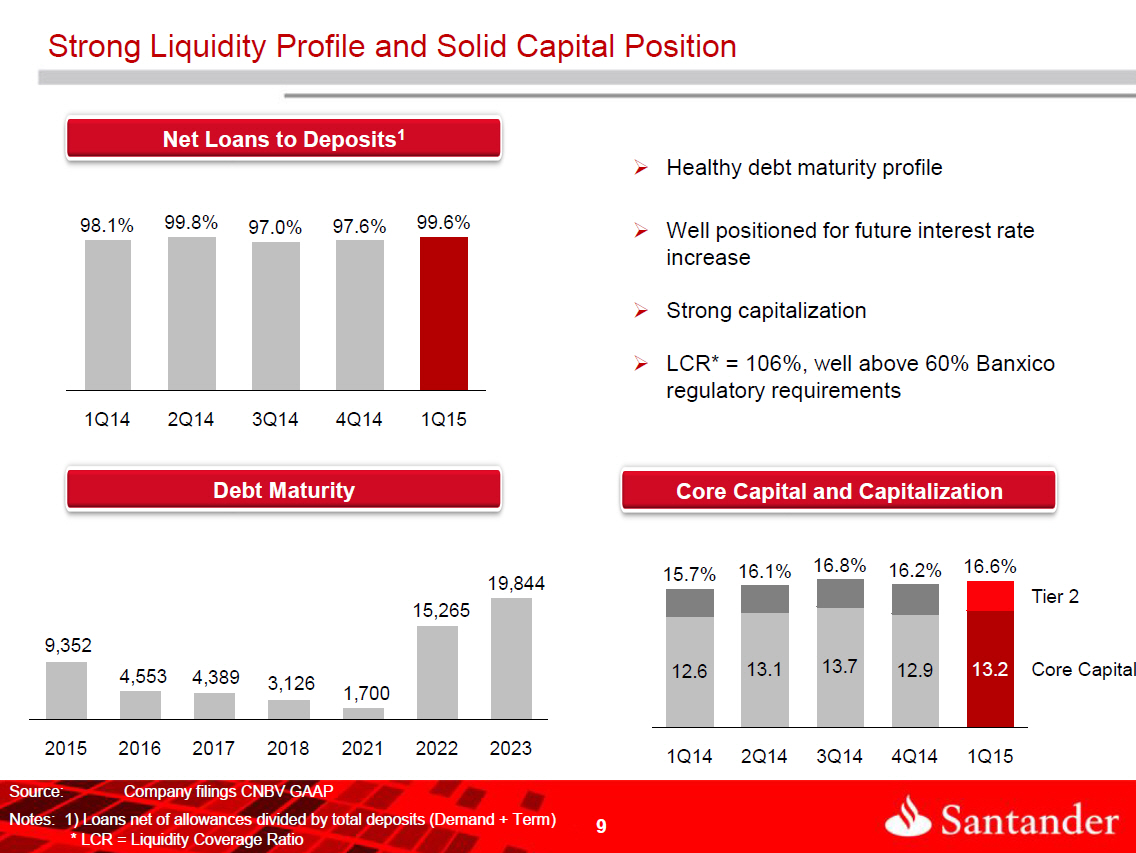
At 1Q15, deposits increased 14.5% YoY and remained flat sequentially; representing 48.0% of Santander México’s total funding sources. This deposit base provides stable, low-cost funding to support Santander México’s continued growth. The net loan to deposit ratio was 99.6% in 1Q15, compared with 97.6% in 4Q14 and 98.1% in 1Q14.
| | 1Q.15| EARNINGS RELEASE | 6 |
| | | |
Contribution to net income by subsidiary
Reported net income in 1Q15 was Ps.3,215 million, representing declines of 1.4% YoY and 15.9% sequentially.
Casa de Bolsa Santander, the brokerage business, reported a net loss of Ps.12 million in 1Q15, compared with net losses of Ps.42 million in 1Q14 Ps.2 million in 4Q14.
The Holding (Grupo Financiero) reported a net loss of Ps.16 million in 1Q15 compared with a net losses of Ps.18 million in 1Q14 and Ps.16 million in 4Q14.
| Grupo Financiero Santander México | | | | | | | | | | | | | |
| Earnings contribution by subsidiary | | | | | | | | | | | | | |
| Millions of Mexican Pesos | | | | | | | | | | | | | | | | | | | | | | | | |
| | | | | | | | | | | | % Variation | | | | | | | | | % Variation | |
| | | | 1Q15 | | | | 4Q14 | | | | 1Q14 | | | QoQ | | | YoY | | | | 3M15 | | | | 3M14 | | | | 15/14 | |
| | | | | | | | | | | | | | | | | | | | | | | | | | | | | | | |
Banking business1/ | | | 3,243 | | | | 3,842 | | | | 3,319 | | | | (15.6 | ) | | | (2.3 | ) | | | 3,243 | | | | 3,319 | | | | (2.3 | ) |
| Brokerage | | | (12 | ) | | | (2 | ) | | | (42 | ) | | | (500.0 | ) | | | 71.4 | | | | (12 | ) | | | (42 | ) | | | 71.4 | |
| Holding | | | (16 | ) | | | (16 | ) | | | (18 | ) | | | 0.0 | | | | 11.1 | | | | (16 | ) | | | (18 | ) | | | 11.1 | |
| Net income attributable to Grupo Financiero Santander México | | | 3,215 | | | | 3,824 | | | | 3,259 | | | | (15.9 | ) | | | (1.4 | ) | | | 3,215 | | | | 3,259 | | | | (1.4 | ) |
| 1/Includes sofomes | | | | | | | | | | | | | | | | | | | | | | | | | | | | | | | | |
| | 1Q.15| EARNINGS RELEASE | 7 |
| | | |
ANALYSIS OF FIRST QUARTER 2015 CONSOLIDATED RESULTS
(Amounts expressed in millions of pesos, except where otherwise stated)
Net income
| Grupo Financiero Santander México | |
| Income statement | |
| Millions of mexican pesos | | | | | | | | | | | % Variation | | | | | | | | | % Variation | |
| | | | 1Q15 | | | | 4Q14 | | | | 1Q14 | | | QoQ | | | YoY | | | | 3M15 | | | | 3M14 | | | | 15/14 | |
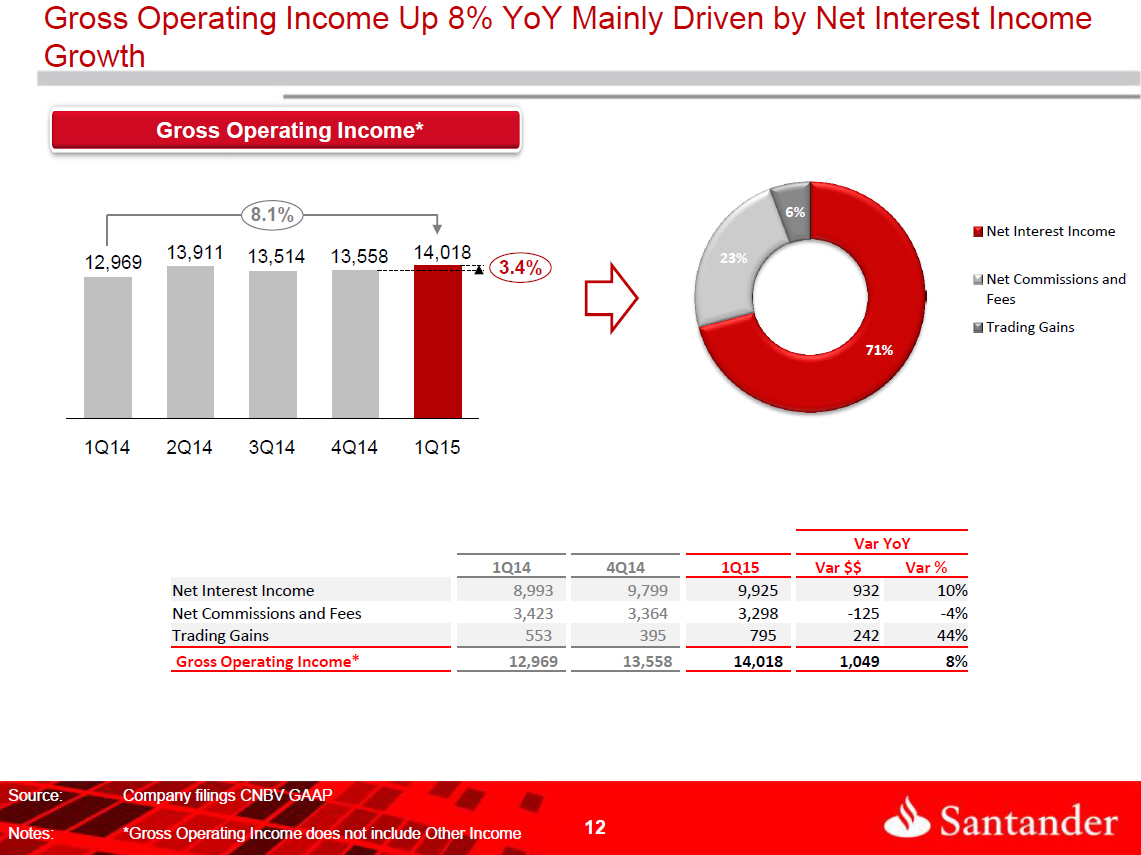
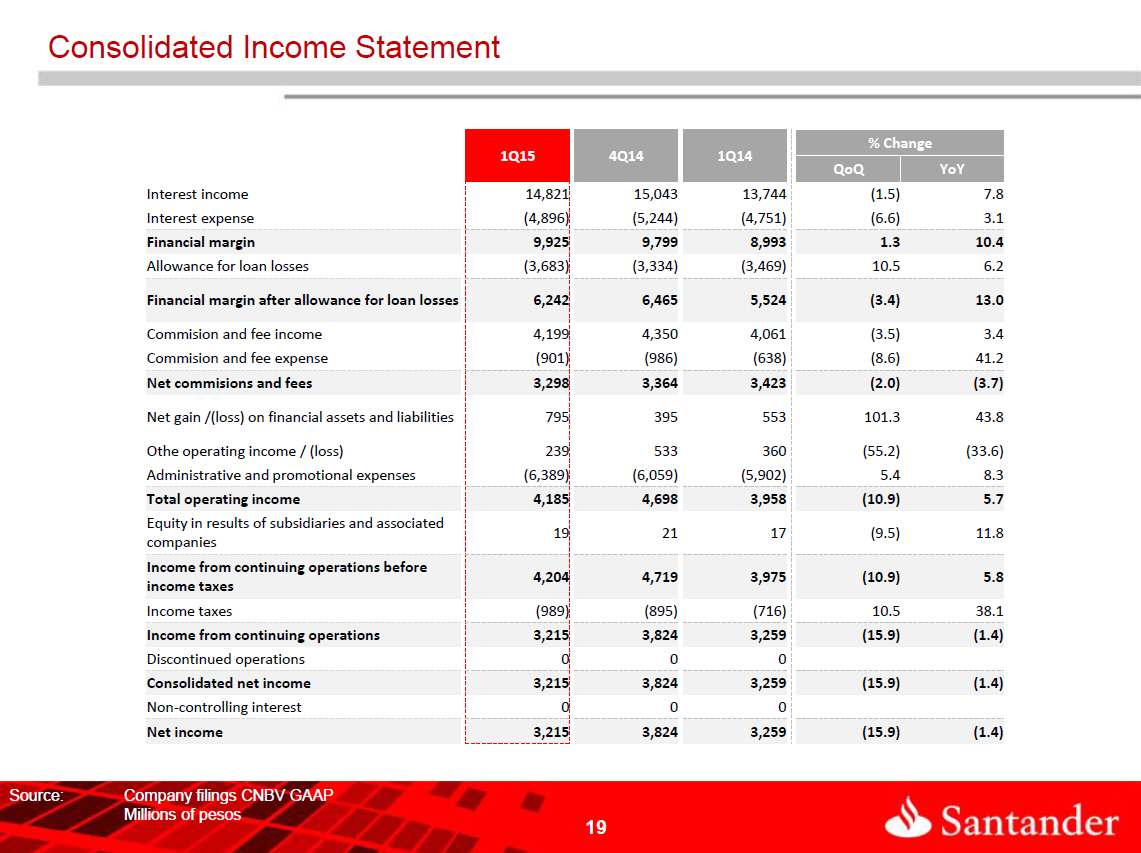
| Net interest income | | | 9,925 | | | | 9,799 | | | | 8,993 | | | | 1.3 | | | | 10.4 | | | | 9,925 | | | | 8,993 | | | | 10.4 | |
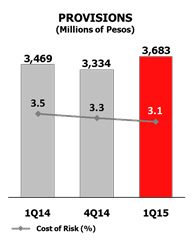
| Provisions for loan losses | | | (3,683 | ) | | | (3,334 | ) | | | (3,469 | ) | | | (10.5 | ) | | | (6.2 | ) | | | (3,683 | ) | | | (3,469 | ) | | | (6.2 | ) |
| Net interest income after provisions for loan losses | | | 6,242 | | | | 6,465 | | | | 5,524 | | | | (3.4 | ) | | | 13.0 | | | | 6,242 | | | | 5,524 | | | | 13.0 | |
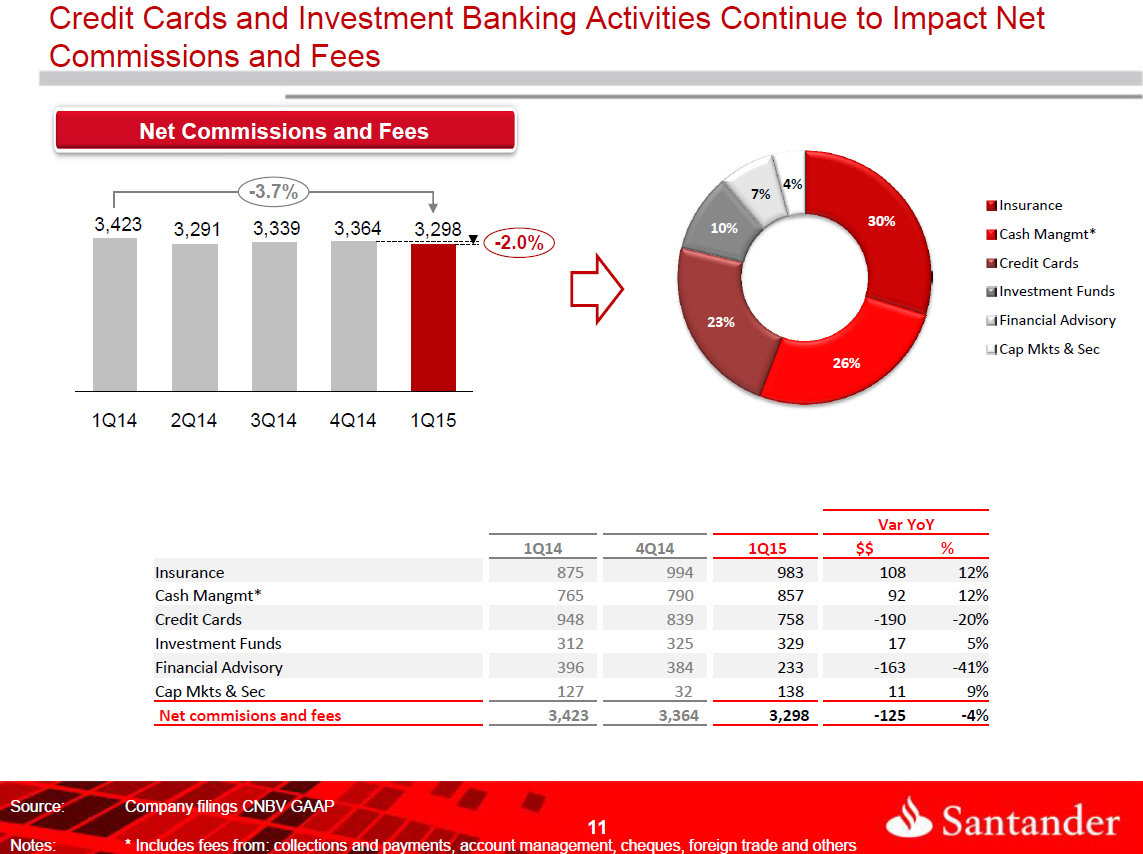
| Commission and fee income, net | | | 3,298 | | | | 3,364 | | | | 3,423 | | | | (2.0 | ) | | | (3.7 | ) | | | 3,298 | | | | 3,423 | | | | (3.7 | ) |
| Net gain (loss) on financial assets and liabilities | | | 795 | | | | 395 | | | | 553 | | | | 101.3 | | | | 43.8 | | | | 795 | | | | 553 | | | | 43.8 | |
| Other operating income | | | 239 | | | | 533 | | | | 360 | | | | (55.2 | ) | | | (33.6 | ) | | | 239 | | | | 360 | | | | (33.6 | ) |
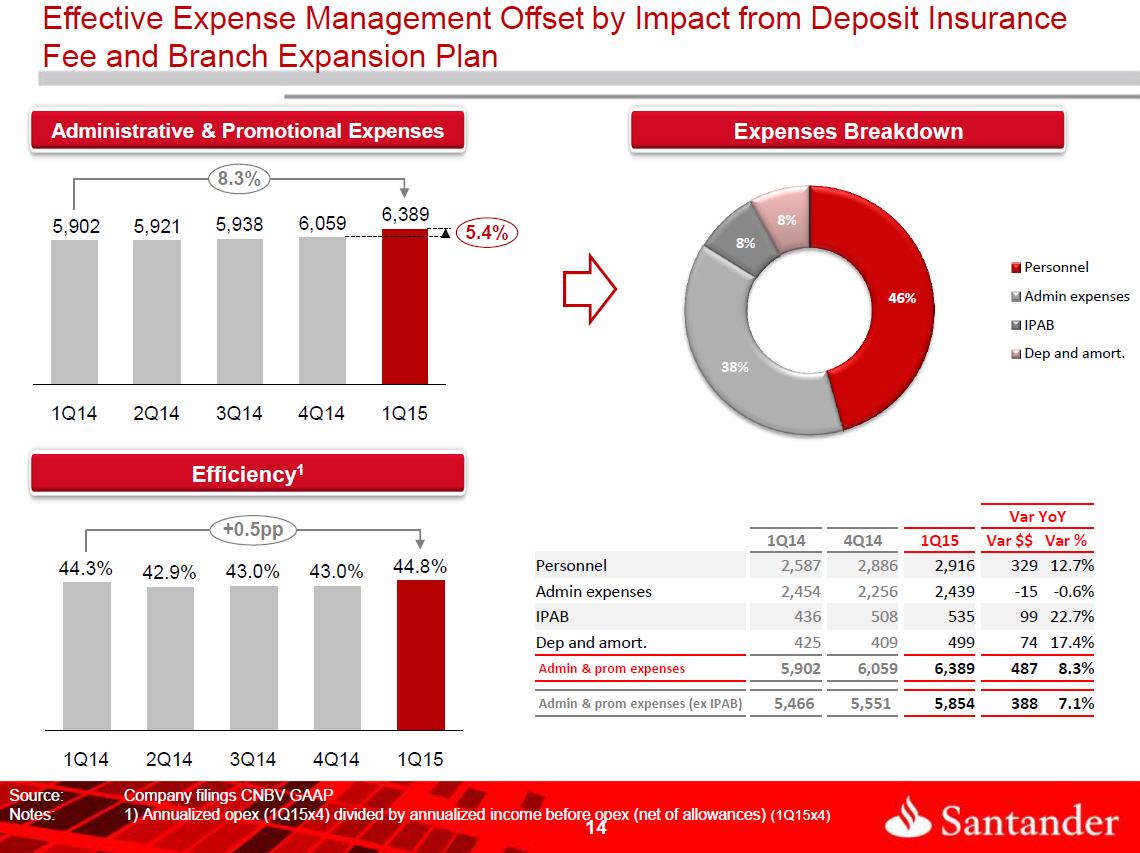
| Administrative and promotional expenses | | | (6,389 | ) | | | (6,059 | ) | | | (5,902 | ) | | | (5.4 | ) | | | (8.3 | ) | | | (6,389 | ) | | | (5,902 | ) | | | (8.3 | ) |
| Operating income | | | 4,185 | | | | 4,698 | | | | 3,958 | | | | (10.9 | ) | | | 5.7 | | | | 4,185 | | | | 3,958 | | | | 5.7 | |
| Equity in results of associated companies | | | 19 | | | | 21 | | | | 17 | | | | (9.5 | ) | | | 11.8 | | | | 19 | | | | 17 | | | | 11.8 | |
| Operating income before income taxes | | | 4,204 | | | | 4,719 | | | | 3,975 | | | | (10.9 | ) | | | 5.8 | | | | 4,204 | | | | 3,975 | | | | 5.8 | |
| Income taxes | | | (989 | ) | | | (895 | ) | | | (716 | ) | | | (10.5 | ) | | | (38.1 | ) | | | (989 | ) | | | (716 | ) | | | (38.1 | ) |
| Income from continuing operations | | | 3,215 | | | | 3,824 | | | | 3,259 | | | | (15.9 | ) | | | (1.4 | ) | | | 3,215 | | | | 3,259 | | | | (1.4 | ) |
| Net income | | | 3,215 | | | | 3,824 | | | | 3,259 | | | | (15.9 | ) | | | (1.4 | ) | | | 3,215 | | | | 3,259 | | | | (1.4 | ) |
| Effective tax rate (%) | | | 23.5 | | | | 19.0 | | | | 18.0 | | | | | | | | | | | | 23.5 | | | | 18.0 | | | | | |
During 1Q15, Santander México reported net income of Ps.3,215 million, representing decreases of 1.4% and 15.9% YoY and QoQ, respectively.
Net interest income in 1Q15 increased YoY by 10.4%, or Ps.932 million, to Ps.9,925 million. On a sequential basis, net interest income increased 1.3%, or Ps.126 million, from Ps.9,799 million reported in 4Q14.
Interest income increased 7.8%, or Ps.1,077 million, from Ps.13,744 million in 1Q14 to Ps.14,821 million in 1Q15. Increases of 9.5%, or Ps.1,004 million, in interest income from our loan portfolio and commissions on loan origination and Ps.279 million, or 14.6%, in investment in securities, were partially offset by YoY decreases in interest income of Ps.182 million, or 23.1%, in repurchase agreements and Ps.21 million, or 5.9%, in funds available.
Interest expense increased YoY by 3.1%, or Ps.145 million, to Ps.4,896 million in 1Q15, primarily due to increases in interest expense of Ps.104 million on subordinated capital notes, Ps.61 million on bank and other loans, Ps.20 million on demand deposits and and Ps.10 million on credit instruments issued. These increases were partially offset by declines in interest paid of Ps.37 million on repurchase agreeements and Ps.13 million on term deposits.
Provisions for loan losses for the quarter were Ps.3,683 million, representing increases of Ps.214 million, or 6.2%, YoY and Ps.349 million, or 10.5%, sequentially.
| | 1Q.15| EARNINGS RELEASE | 8 |
| | | |
The NPL ratio in 1Q15 was 3.68%, a 28 bps increase from the 3.40% level posted in 1Q14 and 7 bps lower from the 3.75% reported in 4Q14.
The coverage ratio for the quarter was 99.6%, a decrease from 115.4% in 1Q14 and an increase from 97.1% in 4Q14.
Net commissions and fee income for 1Q15 amounted to Ps.3,298 million, declining 3.7% YoY, and 2.0% sequentially.
During 1Q15, Santander México reported a Ps.795 million net gain from financial assets and liabilities, compared with gains of Ps.553 million in 1Q14 and Ps.395 million in 4Q14. The net gain on financial assets and liabilities in 1Q15 is mainly explained by valuation gains of Ps.6,384 million, mainly related to derivatives, which were partially offset by trading losses of Ps.5,589 million principally related to derivatives and foreign exchange instruments.
Other operating income in 1Q15 totaled Ps.239 million, down from Ps.360 million in 1Q14 and Ps.533 million in 4Q14, mainly due to lower profits form sale of foreclosed assets.
Administrative and promotional expenses in 1Q15 amounted to Ps.6,389 million, compared to Ps.5,902 million in 1Q14 and Ps.6,059 million in 4Q14, increasing 8.3% YoY and 5.4% QoQ.
Operating income in 1Q15 totaled Ps.4,185 million, representing a YoY increase of Ps.227 million, or 5.7%. On a sequential basis, operating income decreased by Ps.513 million, or 10.9%. This is mainly explained by lower income from commissions and fees as well as higher provisions and expenses, which were partially offset by increases in net interest income and gains from financial assets and liabilities.
| | 1Q.15| EARNINGS RELEASE | 9 |
| | | |
Loan portfolio and deposits
Loan portfolio
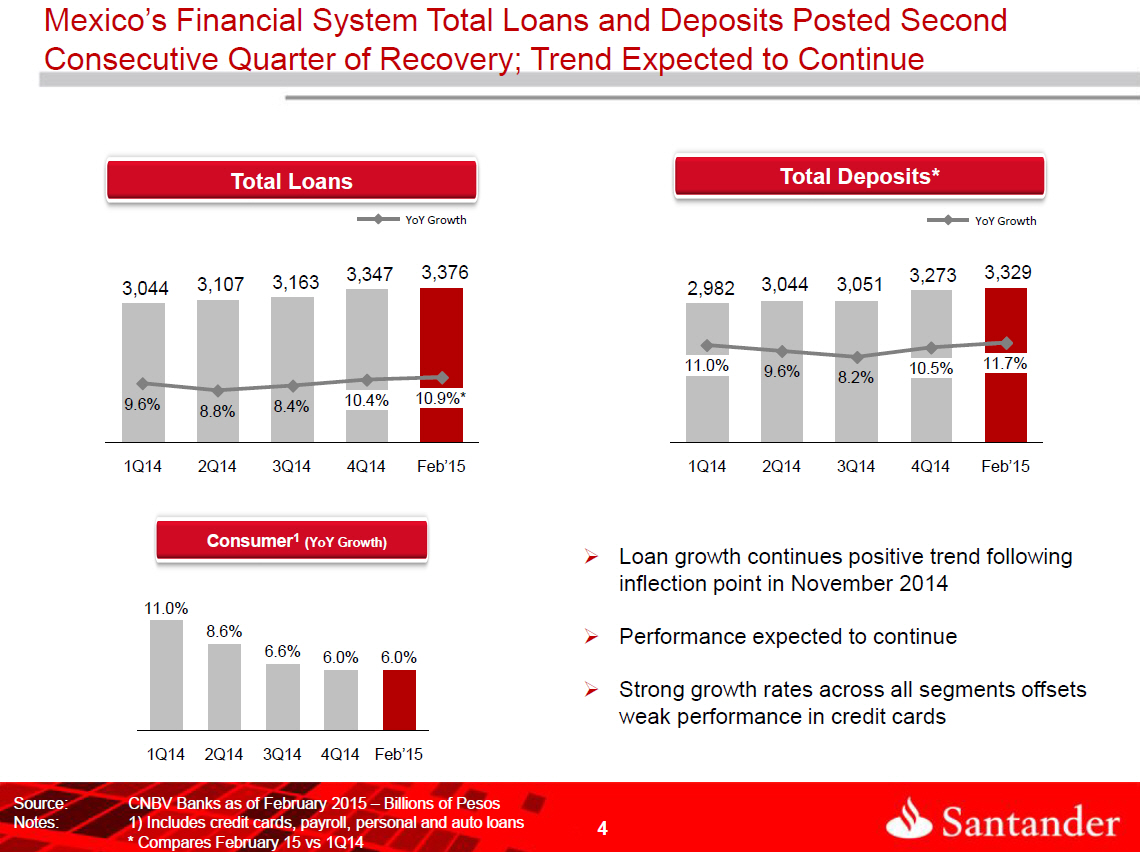
The evolution of the loan portfolio continues to show a positive trend, with diversification in all segments and growth accross all businesses, despite the slow economic recovery in Mexico.
Portfolio Breakdown
The total loan portfolio rose YoY by 16.0%, or Ps.65,389 million, to Ps.474,738 million in 1Q15. On a sequential basis, the total loan portfolio increased 2.0%, or Ps.9,197 million. In this context, all segments grew above market, with SMEs, middle-market, mortgages and showing the strongest performance, followed by corporates and consumer that also posted a healthy growth. Meanwhile, credit card growth exceeded market rates, despite the ongoing soft demand in this product.
| | 1Q.15| EARNINGS RELEASE | 10 |
| | | |
| Grupo Financiero Santander México | | | | | | | | | | | | | | | | |
| Loan portfolio breakdown | | | | | | | | | | | | | | | | | | |
| Millions of Mexican Pesos | | | 1Q15 | | | % | | | | 4Q14 | | | % | | | | 1Q14 | | | % | |
| Performing loans | | | | | | | | | | | | | | | | | | | | | |
| Comercial* | | | 277,921 | | | | 58.5 | % | | | 274,438 | | | | 59.0 | % | | | 236,610 | | | | 57.8 | % |
| Individuals | | | | | | | | | | | | | | | | | | | | | | | | |
| Consumer | | | 74,714 | | | | 15.7 | % | | | 72,459 | | | | 15.6 | % | | | 67,069 | | | | 16.4 | % |
| Credit cards | | | 40,444 | | | | 8.5 | % | | | 40,371 | | | | 8.7 | % | | | 39,211 | | | | 9.6 | % |
| Other consumer | | | 34,270 | | | | 7.2 | % | | | 32,088 | | | | 6.9 | % | | | 27,858 | | | | 6.8 | % |
| Mortgages | | | 104,645 | | | | 22.0 | % | | | 101,189 | | | | 21.7 | % | | | 91,739 | | | | 22.4 | % |
| Total | | | 457,280 | | | | 96.3 | % | | | 448,086 | | | | 96.3 | % | | | 395,418 | | | | 96.6 | % |
| | | | | | | | | | | | | | | | | | | | | | | | | |
| Non-performing loans | | | | | | | | | | | | | | | | | | | | | | | | |
| Commercial* | | | 9,155 | | | | 1.9 | % | | | 8,891 | | | | 1.9 | % | | | 6,910 | | | | 1.7 | % |
| Individuals | | | | | | | | | | | | | | | | | | | | | | | | |
| Consumer | | | 2,799 | | | | 0.6 | % | | | 3,165 | | | | 0.7 | % | | | 2,895 | | | | 0.7 | % |
| Credit cards | | | 1,594 | | | | 0.3 | % | | | 1,733 | | | | 0.4 | % | | | 1,295 | | | | 0.3 | % |
| Other consumer | | | 1,206 | | | | 0.3 | % | | | 1,432 | | | | 0.3 | % | | | 1,600 | | | | 0.4 | % |
| Mortgages | | | 5,504 | | | | 1.2 | % | | | 5,399 | | | | 1.2 | % | | | 4,126 | | | | 1.0 | % |
| Total | | | 17,458 | | | | 3.7 | % | | | 17,455 | | | | 3.7 | % | | | 13,931 | | | | 3.4 | % |
| | | | | | | | | | | | | | | | | | | | | | | | | |
| Total loan portfolio | | | | | | | | | | | | | | | | | | | | | | | | |
| Commercial* | | | 287,076 | | | | 60.5 | % | | | 283,329 | | | | 60.9 | % | | | 243,520 | | | | 59.5 | % |
| individuals | | | | | | | | | | | | | | | | | | | | | | | | |
| Consumer | | | 77,513 | | | | 16.3 | % | | | 75,624 | | | | 16.2 | % | | | 69,964 | | | | 17.1 | % |
| Credit cards | | | 42,038 | | | | 8.9 | % | | | 42,104 | | | | 9.0 | % | | | 40,506 | | | | 9.9 | % |
| Other consumer | | | 35,476 | | | | 7.5 | % | | | 33,520 | | | | 7.2 | % | | | 29,458 | | | | 7.2 | % |
| Mortgages | | | 110,149 | | | | 23.2 | % | | | 106,588 | | | | 22.9 | % | | | 95,865 | | | | 23.4 | % |
| Total | | | 474,738 | | | | 100.0 | % | | | 465,541 | | | | 100.0 | % | | | 409,349 | | | | 100.0 | % |
*Commercial loan portfolio includes: Corporates, Middle-market, SME´s , Financial entities and Goverment institutions
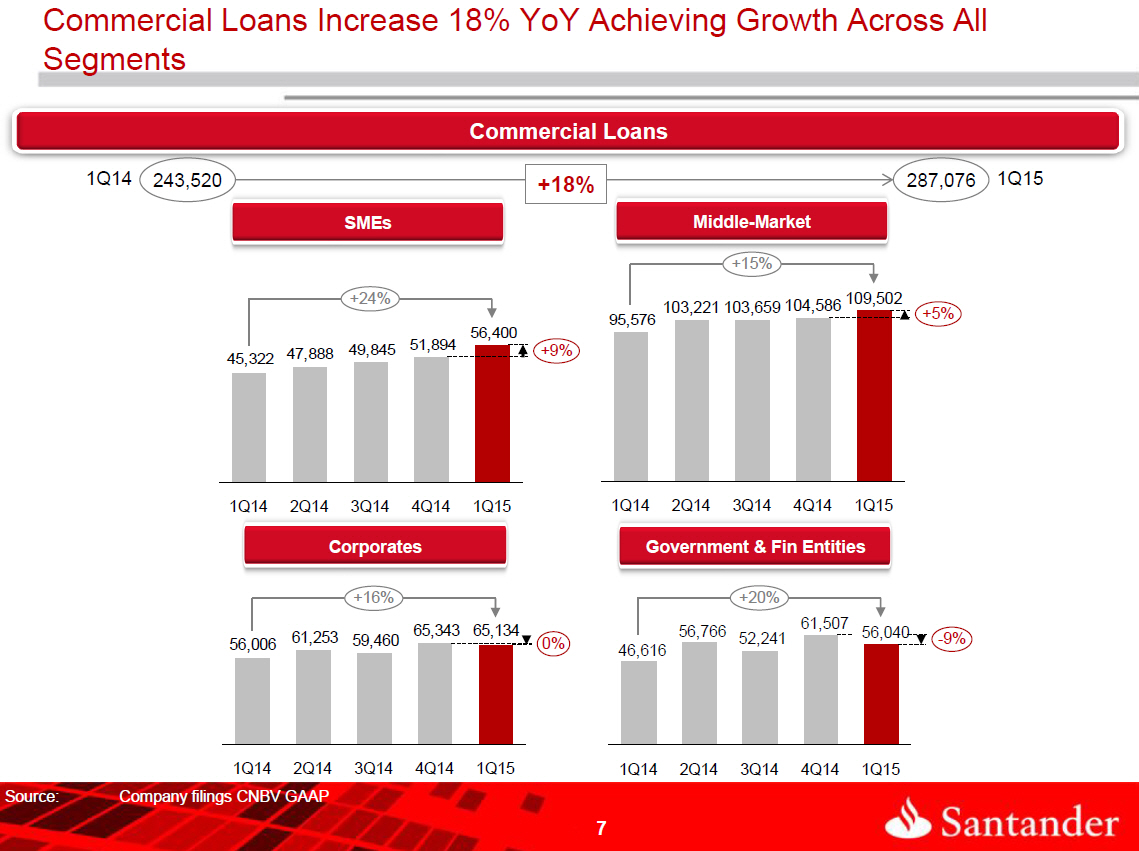
The Commercial loan portfolio is comprised of loans to business and commercial entities, as well as loans to government entities and financial institutions, and represented 60.5% of the total loan portfolio. Excluding loans to government entities, the commercial loan portfolio accounted for 49.8% of the total loan portfolio. As of 1Q15, commercial loans increased 17.9% YoY, principally reflecting the 24.4% and 14.6% increases in the SMEs and middle market segments, respectively, while loans to corporates increased 16.3%. This positive YoY performance was further supported by a 20.2% increase in government and financial entities loans, driven by loans granted to two of the state-owned energy companies with credit risk comparable to any other large corporate, despite pre-payments by one of the state-owned energy companies following strong loan demand in the last quarter of 2014.
On a sequential basis, the commercial loan portfolio increased 1.3%, principally reflecting continued growth in SMEs and middle-markets - up 8.7% and 4.7%, respectively. This was partially offset by an 8.9% decrease the government and financial entities portfolios while corporates remained relatively stable. In corporates, this quarter we syndicated one of the large loans granted in the fourth quarter of last year, but compensated that effect with new loan origination.
| | 1Q.15| EARNINGS RELEASE | 11 |
| | | |
The Individual loan portfolio comprised of mortgages, consumer and credit card loans, represented 39.5% of the total loan portfolio and increased 13.2% YoY. Credit cards, consumer and mortgage loans represented 8.9%, 7.5%, and 23.2% of the total loan portfolio, respectively, and increased YoY by 3.8%, 20.4%, and 14.9%, respectively. Consumer loans increased 2.5% sequentially, continuing to reflect a soft performance in credit card loans that results from lower credit card usage market-wide. The remainder of the consumer loan portfolio grew 5.8%, up from 4.6% last querter maintaining the pick-up observed last quarter. Despite soft consumer demand, especially in credit cards, Santander México has maintained above-market growth rates, principally reflecting our focus on innovation and strong commercial activity. We continue to penetrate the open market focusing on medium- and high-income individuals, while maintaining our credit scoring standards.
Asset quality
Non-performing loans (NPL) at the end of 1Q15 increased YoY by Ps.3,527 million, or 25.3%, to Ps.17,458 million, and remained flat QoQ. On a sequential basis, increases of Ps.264 million, or 3.0%, in commercial loans and Ps.105 million, or 1.9%, in mortgages were offset by a Ps.366 million, or 11.6%, decrease in consumer loans. The breakdown of the non-performing loan portfolio is as follows: commercial loans 52.4%, mortgage loans 31.5% and consumer loans 16.0%.
| Grupo Financiero Santander México | | | | | | | | | | | | | |
| Asset quality | | | | | | | | | | | | | | | |
| Millions of Mexican Pesos | | | | | | | | | | | | | | | |
| | | | | | | | | | | | % Variation | |
| | | | 1Q15 | | | | 4Q14 | | | | 1Q14 | | | QoQ | | | YoY | |
| Total loans | | | 474,738 | | | | 465,541 | | | | 409,349 | | | | 1.98 | | | | 15.97 | |
| Performing loans | | | 457,280 | | | | 448,086 | | | | 395,418 | | | | 2.05 | | | | 15.64 | |
| Non-performing loans | | | 17,458 | | | | 17,455 | | | | 13,931 | | | | 0.02 | | | | 25.32 | |
| | | | | | | | | | | | | | | | | | | | | |
| Allowance for loan losses | | | (17,382 | ) | | | (16,951 | ) | | | (16,081 | ) | | | 2.54 | | | | 8.09 | |
| | | | | | | | | | | | | | | | | | | | | |
| Non-performing loan ratio | | | 3.68 | % | | | 3.75 | % | | | 3.40 | % | | | (7 | )bp | | | 28 | bp |
| Coverage ratio | | | 99.6 | % | | | 97.1 | % | | | 115.4 | % | | | 250 | bp | | | (1,580 | ) bp |
| | 1Q.15| EARNINGS RELEASE | 12 |
| | | |
The NPL ratio in 1Q15 was 3.68%, a 28 bps increase from the 3.40% level posted in 1Q14 and 7 bps lower from the 3.75% reported in 4Q14. The NPL ratio showed an improvement across most segments in 1Q15. It also continues to reflect our exposure to the homebuilders, with non-performing loans of Ps.4,779 million, as well as the effect from Santander Vivienda’s non-performing portfolio (formerly ING), which as of 1Q15 amounted to Ps.2,319 million, out of a total portfolio of Ps.10,250 million. Excluding the impact of the homebuilders and Santander Vivienda’s portfolio, the NPL ratio for 1Q15 and 4Q14 would have been 2.25% and 2.33%, respectively. The current NPL ratio continues to reflect loan portfolio growth combined with Santander México’s stringent credit scoring model and ongoing monitoring of loan portfolio quality.
During 1Q15, provisions for loan losses amounted to Ps.3,683 million, which represented increases of Ps.214 million, or 6.2%, YoY and Ps.349 million, or 10.5%, on a sequential basis.
*Cost of risk is calculated using annualized cumulative provisions for loan losses for the period
| | 1Q.15| EARNINGS RELEASE | 13 |
| | | |
Cost of risk in 1Q15 stood at 3.13%, showing an impovement from the 3.45% and 3.32% reported in 1Q14 and 4Q14, respectively.
The coverage ratio for the quarter was 99.6%, a decrease from 115.4% in 1Q14 and an increase from 97.1% in 4Q14.
Total deposits
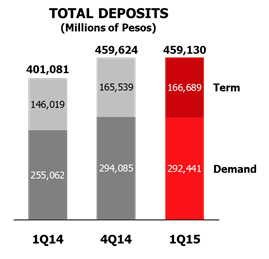
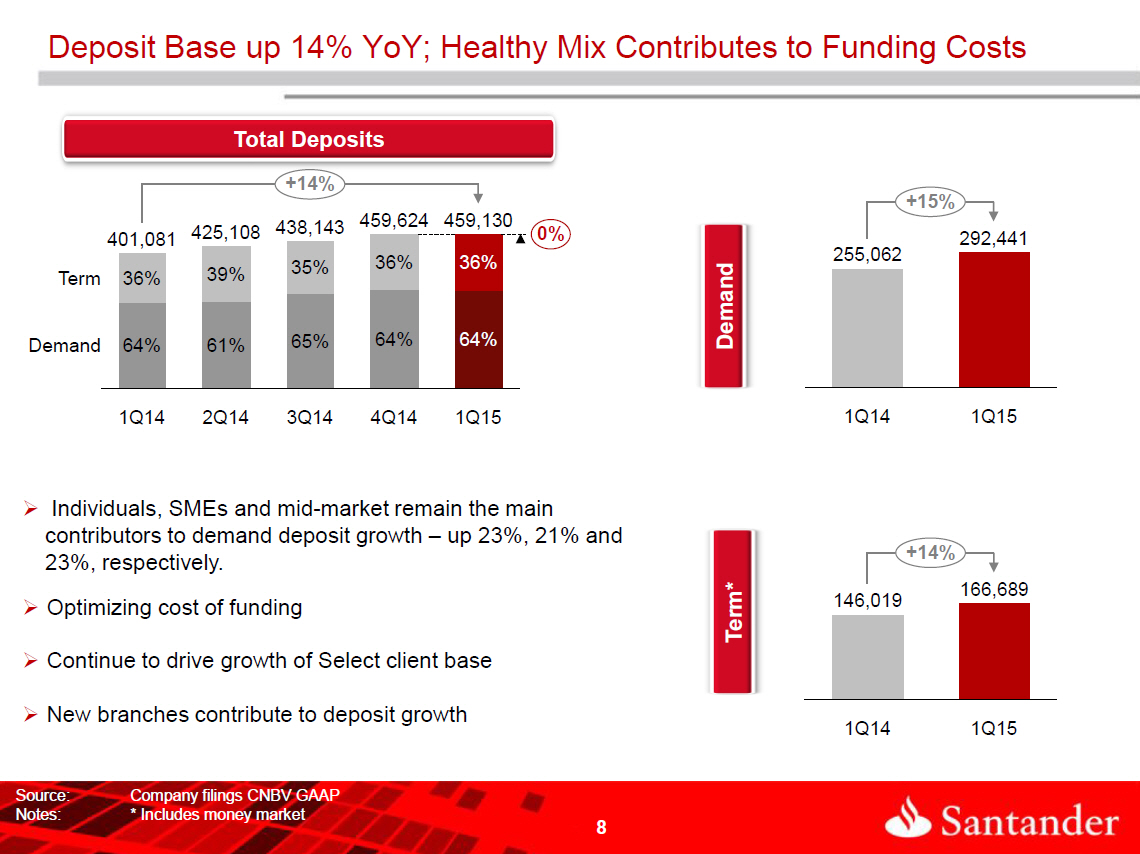
Total deposits at the end of 1Q15 amounted to Ps.459,130 million, representing an increase of 14.5% YoY and remaining seasonally flat sequentially. Santander México continues to implement its strategy of further enhancing customer service to meet the needs of each segment. Additionally, campaigns targeting the SMEs and middle-market segments, as well as of investment products targeted to middle- and high-income clients continue to contribute to this performance. As of 1Q15, demand deposits reached Ps.292,441 million, increasing 14.7% YoY and decreasing 0.6% sequentially. Total term deposits reached Ps.166,689 million, showing increases of 14.2% and 0.7% YoY and QoQ, respectively. This performance in deposits, contributed positively to cost of funding, while we continued to optimize term deposits cost.
Pursuant to Banxico's regulatory requirements, the average Liquidity Coverage Ratio (LCR) for 1Q15 was 106% (please refer to note 25 of this report).
| | 1Q.15| EARNINGS RELEASE | 14 |
| | | |
Net interest income
| Grupo Financiero Santander México | |
| Net interest income | |
| Millions of mexican pesos | | | | | | | | | | | % Variation | | | | | | | | | % Variation | |
| | | | 1Q15 | | | | 4Q14 | | | | 1Q14 | | | QoQ | | | YoY | | | | 3M15 | | | | 3M14 | | | | 15/14 | |
| Interest on funds available | | | 337 | | | | 351 | | | | 358 | | | | (4.0 | ) | | | (5.9 | ) | | | 337 | | | | 358 | | | | (5.9 | ) |
| Interest on margin accounts | | | 76 | | | | 65 | | | | 79 | | | | 16.9 | | | | (3.8 | ) | | | 76 | | | | 79 | | | | (3.8 | ) |
| Interest and yield on securities | | | 2,196 | | | | 2,523 | | | | 1,917 | | | | (13.0 | ) | | | 14.6 | | | | 2,196 | | | | 1,917 | | | | 14.6 | |
| Interest and yield on loan portfolio – excluding credit cards | | | 9,043 | | | | 8,677 | | | | 7,999 | | | | 4.2 | | | | 13.1 | | | | 9,043 | | | | 7,999 | | | | 13.1 | |
| Interest and yield on loan portfolio related to credit card transactions | | | 2,388 | | | | 2,443 | | | | 2,377 | | | | (2.3 | ) | | | 0.5 | | | | 2,388 | | | | 2,377 | | | | 0.5 | |
| Commissions collected on loan originations | | | 175 | | | | 189 | | | | 226 | | | | (7.4 | ) | | | (22.6 | ) | | | 175 | | | | 226 | | | | (22.6 | ) |
| Interest and premium on sale and repurchase agreements and securities loans | | | 606 | | | | 795 | | | | 788 | | | | (23.8 | ) | | | (23.1 | ) | | | 606 | | | | 788 | | | | (23.1 | ) |
| Interest income | | | 14,821 | | | | 15,043 | | | | 13,744 | | | | (1.5 | ) | | | 7.8 | | | | 14,821 | | | | 13,744 | | | | 7.8 | |
| | | | | | | | | | | | | | | | | | | | | | | | | | | | | | | | | |
| Daily average interest earning assets* | | | | | | | | | | | | | | | | | | | | | | | 816,029 | | | | 712,794 | | | | 14.5 | |
| | | | | | | | | | | | | | | | | | | | | | | | | | | | | | | | | |
| Interest from customer deposits – demand deposits | | | (755 | ) | | | (856 | ) | | | (735 | ) | | | 11.8 | | | | (2.7 | ) | | | (755 | ) | | | (735 | ) | | | (2.7 | ) |
| Interest from customer deposits – time deposits | | | (1,018 | ) | | | (1,064 | ) | | | (1,031 | ) | | | 4.3 | | | | 1.3 | | | | (1,018 | ) | | | (1,031 | ) | | | 1.3 | |
| Interest from credit instruments issued | | | (307 | ) | | | (293 | ) | | | (297 | ) | | | (4.8 | ) | | | (3.4 | ) | | | (307 | ) | | | (297 | ) | | | (3.4 | ) |
| Interest on bank and other loans | | | (525 | ) | | | (488 | ) | | | (464 | ) | | | (7.6 | ) | | | (13.1 | ) | | | (525 | ) | | | (464 | ) | | | (13.1 | ) |
| Interest on subordinated capital notes | | | (467 | ) | | | (475 | ) | | | (363 | ) | | | 1.7 | | | | (28.7 | ) | | | (467 | ) | | | (363 | ) | | | (28.7 | ) |
| Interest and premium on sale and repurchase agreements and securities loans | | | (1,824 | ) | | | (2,068 | ) | | | (1,861 | ) | | | 11.8 | | | | 2.0 | | | | (1,824 | ) | | | (1,861 | ) | | | 2.0 | |
| Interest expense | | | (4,896 | ) | | | (5,244 | ) | | | (4,751 | ) | | | 6.6 | | | | (3.1 | ) | | | (4,896 | ) | | | (4,751 | ) | | | (3.1 | ) |
| | | | | | | | | | | | | | | | | | | | | | | | | | | | | | | | | |
| Net interest income | | | 9,925 | | | | 9,799 | | | | 8,993 | | | | 1.3 | | | | 10.4 | | | | 9,925 | | | | 8,993 | | | | 10.4 | |
Net interest income in 1Q15 amounted to Ps.9,925 million, representing increases of Ps.932 million, or 10.4%, YoY and Ps.126 million, or 1.3% QoQ, from Ps.9,799 million.
Net interest margin calculated with daily average interest-earning assets for 1Q15 was 4.87%, which compares with 5.05% and 4.86% in 1Q14 and 4Q14, respectively.
The 10.4% YoY increase in net interest income for the quarter is explained by the combined effect of: a Ps.1,077 million increase in interest income, from Ps.13,744 million in 1Q14 to Ps.14,821 million in 1Q15, together with a Ps.145 million increase in interest expense, from Ps.4,751 million in 1Q14 to Ps.4,896 million in 1Q15. This is mainly explained by a Ps.103,235 million increase in average-earning assets together with a 45 bps decline in the average interest rate, combined with a Ps.113,699 million increase in average interest-bearing liabilities and a 38 bps lower average cost.
| | 1Q.15| EARNINGS RELEASE | 15 |
| | | |
The 1.3% sequential increase in net interest income resulted mainly from a Ps.222 million decrease in interest income, from Ps.15,043 million in 4Q14 to Ps.14,821 million in 1Q15, which was more than offset by a Ps.348 million decrease in interest expense, from Ps.5,244 million in 4Q14 to Ps.4,896 million in 1Q15. This is explained by a decrease of Ps.25,606 million in average interest-earning assets and a 27 bps increase in the average interest income rate, combined with a decrease of Ps.23,824 million in interest-bearing liabilities together with a decrease of 4 bps in the average interest rate paid.
Interest income
Interest income increased 7.8%, or Ps.1,077 million, from Ps.13,744 million in 1Q14 to Ps.14,821 million in 1Q15. This is explained by the following increases: i) 9.5%, or Ps.1,004 million, in interest income from our loan portfolio and commissions on loan origination and ii) 14.6%, or Ps.279 million in investment in securities. These increases were partially offset by decreases of: i) Ps.182 million, or 23.1%, in sale and repurchase agreements, ii) Ps.21 million, or 5.9%, in funds available and iii) Ps.3 million, or 3.8%, in margin accounts.
1Q15 average interest-earning assets grew YoY by Ps.103,235 million, or 14.5%, mainly driven by the following increases: i) Ps.69,619 million in the average volume of the loan portfolio, including credit cards; ii) Ps.28,564 million in the investments in securities portfolio; iii) Ps.6,799 million in margin accounts; and iv) Ps.6,732 million in funds available; which were partially offset by a decrease of Ps.8,479 million in sale and repurchase agreements.
On a sequential basis, interest income decreased by 1.5%, or Ps.222 million, mainly reflecting an increase of Ps.297 million, or 2.6%, in interest income from our loan portfolio and commissions on loan origination which was more than offset by decreases of: i) Ps.327 million, or 13.0%, on the investment in securities portfolio, ii) Ps.189 million, or 23.8%, in sale and repurchase agreements and iii) Ps.14 million, or 4.0%, in funds avialable.
1Q15 average interest-earning assets declined QoQ by Ps.25,606 million, or 3.0%, mainly driven by the following decreases: i) Ps.27,527 million in sale and repurchase agreements; ii) Ps.22,985 million in the investment in securities portfolio; and iii) Ps.354 million in funds available. These decreases were partially offset by increases of: i) Ps.20,309 million the average volume of the loan portfolio, including credit cards; and ii) Ps.4,951 million in margin accounts.
The average interest rate on interest-earning assets in 1Q15 stood at 7.26%, representing a decrease of 45 bps from 7.71% in 1Q14 and an increase of 27 bps from 6.99% in 4Q14.
The Ps.14,821 million in interest income for 1Q15 is broken down as follows: loan portfolio, which is the main source of recurring income, accounts for 78.3%; investment in securities 14.8%; and other items 6.9%.
| | 1Q.15| EARNINGS RELEASE | 16 |
| | | |
Interest expense
Interest expense rose YoY by 3.1%, or Ps.145 million, to Ps.4,896 million in 1Q15, primarily due to increases in interest expense of: i) Ps.104 million on subordinated capital notes, Ps.61 million on bank and other loans, Ps.20 million on demand deposits and Ps.10 million on credit instruments issued. These increases were partially offset by declines in interest paid of Ps.37 million on our sale and repurchase agreements and Ps.13 million on term deposits.
Average interest-bearing liabilities rose YoY by Ps.113,699 million, or 18.0%, mainly explained by the following increases: i) Ps.36,219 million in demand deposits; ii) Ps.32,813 million in term deposits; iii) Ps.18,714 million in sale and repurchase agreements; iv) Ps.18,603 million in bank and other loans; v) Ps.5,111 million in credit instruments issued; and vi) Ps.2,239 million in subordinated debentures.
On a sequential basis, interest expense decreased 6.6%, or Ps.348 million, to Ps.4,896 million in 1Q15, from Ps.5,244 million in 4Q14, mainly reflecting decreases in interest paid of: i) Ps.244 million on sale and repurchase agreements, ii) Ps.101 million on demand deposits, iii) Ps.46 million on term deposits and iv) Ps.8 million on subordinated debentures. These decreases were partially offset by increases of Ps.37 million and Ps.14 million in interest paid on bank and other loans and on credit instruments issued, respectively.
Sequentially, average interest-bearing liabilities decreased by Ps.23,824 million, or 3.1%, mainly explained by the following decreases: i) Ps.42,766 million in sale and repurchase agreements; and ii) Ps.6,785 million in demand deposits. This was partially offset by increases of: i) Ps.13,522 million in bank and other loans; ii) Ps.8,960 million in term deposits; iii) Ps.1,844 in credit instruments issued; and iv) Ps.1,401 million in subordinated debentures.
The average interest rate on interest-bearing liabilities decreased to 2.63% in 1Q15, or 38 bps, from 3.01% in 1Q14, and by 4 bps from 2.67% in 4Q14.
The Ps.4,896 million in interest expenses paid in 1Q15 is broken down as follows: sale and repurchase agreements 37.3%, term deposits 20.8%, demand deposits 15.4%, bank and other loans 10.7%, subordinated debentures 9.5% and credit instruments issued 6.3%.
Interest expense on demand deposits amounted to Ps.755 million during 1Q15, representing an increase of 2.7% YoY and an 11.8% sequential decline. The YoY variation was mainly driven by a 17.9% increase in the average balance of demand deposits, combined with a 19 bps decrease in the average interest rate paid. The QoQ decrease resulted from the combined effect of declines of 2.8% in the average balance and of 10 bps in the average interest rate paid.
Interest paid on time deposits declined 1.3% YoY to Ps.1,018 million. On a sequential basis, interest paid on time deposits decreased 4.3%. The YoY variation reflects an increase of 25.4% in the average volume of term deposits together with a 68 bps decline in the average interest rate paid. The QoQ decrease resulted from the combined effect of a 5.9% increase in the average balance, together with a 21 bps decline in the average interest rate paid.
| | 1Q.15| EARNINGS RELEASE | 17 |
| | | |
Commission and fee income
| Grupo Financiero Santander México | | | | | | | | | | | | | | | | | | | | | | |
| Commission and fee income | | | | | | | | | | | | | | | | | | | | | | | | |
| Millions of mexican pesos | | | | | | | | | | | % Variation | | | | | | % Variation | |
| Commission and fee income | | | 1Q15 | | | | 4Q14 | | | | 1Q14 | | | QoQ | | | YoY | | | | 3M15 | | | | 3M14 | | | | 15/14 | |
| Credit card | | | 1,207 | | | | 1,257 | | | | 1,153 | | | | (4.0 | ) | | | 4.7 | | | | 1,207 | | | | 1,153 | | | | 4.7 | |
| Account management | | | 222 | | | | 237 | | | | 188 | | | | (6.3 | ) | | | 18.1 | | | | 222 | | | | 188 | | | | 18.1 | |
| Collection services | | | 526 | | | | 455 | | | | 462 | | | | 15.6 | | | | 13.9 | | | | 526 | | | | 462 | | | | 13.9 | |
| Investment funds | | | 343 | | | | 341 | | | | 335 | | | | 0.6 | | | | 2.4 | | | | 343 | | | | 335 | | | | 2.4 | |
| Insurance | | | 985 | | | | 1,028 | | | | 902 | | | | (4.2 | ) | | | 9.2 | | | | 985 | | | | 902 | | | | 9.2 | |
| Purchase-sale of securities and money market transactions | | | 209 | | | | 187 | | | | 181 | | | | 11.8 | | | | 15.5 | | | | 209 | | | | 181 | | | | 15.5 | |
| Checks trading | | | 64 | | | | 78 | | | | 72 | | | | (17.9 | ) | | | (11.1 | ) | | | 64 | | | | 72 | | | | (11.1 | ) |
| Foreign trade | | | 203 | | | | 175 | | | | 170 | | | | 16.0 | | | | 19.4 | | | | 203 | | | | 170 | | | | 19.4 | |
| Financial advisory services | | | 235 | | | | 386 | | | | 399 | | | | (39.1 | ) | | | (41.1 | ) | | | 235 | | | | 399 | | | | (41.1 | ) |
| Other | | | 205 | | | | 206 | | | | 199 | | | | (0.5 | ) | | | 3.0 | | | | 205 | | | | 199 | | | | 3.0 | |
| Total | | | 4,199 | | | | 4,350 | | | | 4,061 | | | | (3.5 | ) | | | 3.4 | | | | 4,199 | | | | 4,061 | | | | 3.4 | |
| | | | | | | | | | | | | | | | | | | | | | | | | | | | | | | | | |
| Commission and fee expense | | | | | | | | | | | | | | | | | | | | | | | | | | | | | | | | |
| Credit card | | | (449 | ) | | | (418 | ) | | | (205 | ) | | | (7.4 | ) | | | (119.0 | ) | | | (449 | ) | | | (205 | ) | | | (119.0 | ) |
| Investment funds | | | (14 | ) | | | (16 | ) | | | (23 | ) | | | 12.5 | | | | 39.1 | | | | (14 | ) | | | (23 | ) | | | 39.1 | |
| Insurance | | | (2 | ) | | | (34 | ) | | | (27 | ) | | | 94.1 | | | | 92.6 | | | | (2 | ) | | | (27 | ) | | | 92.6 | |
| Purchase-sale of securities and money market transactions | | | (71 | ) | | | (155 | ) | | | (54 | ) | | | 54.2 | | | | (31.5 | ) | | | (71 | ) | | | (54 | ) | | | (31.5 | ) |
| Checks trading | | | (5 | ) | | | (9 | ) | | | (7 | ) | | | 44.4 | | | | 28.6 | | | | (5 | ) | | | (7 | ) | | | 28.6 | |
| Financial advisory services | | | (2 | ) | | | (2 | ) | | | (3 | ) | | | 0.0 | | | | 33.3 | | | | (2 | ) | | | (3 | ) | | | 33.3 | |
| Other | | | (358 | ) | | | (352 | ) | | | (319 | ) | | | (1.7 | ) | | | (12.2 | ) | | | (358 | ) | | | (319 | ) | | | (12.2 | ) |
| Total | | | (901 | ) | | | (986 | ) | | | (638 | ) | | | 8.6 | | | | (41.2 | ) | | | (901 | ) | | | (638 | ) | | | (41.2 | ) |
| | | | | | | | | | | | | | | | | | | | | | | | | | | | | | | | | |
| Commission and fee income, net | | | | | | | | | | | | | | | | | | | | | | | | | | | | | | | | |
| Credit card | | | 758 | | | | 839 | | | | 948 | | | | (9.7 | ) | | | (20.0 | ) | | | 758 | | | | 948 | | | | (20.0 | ) |
| Account management | | | 222 | | | | 237 | | | | 188 | | | | (6.3 | ) | | | 18.1 | | | | 222 | | | | 188 | | | | 18.1 | |
| Collection services | | | 526 | | | | 455 | | | | 462 | | | | 15.6 | | | | 13.9 | | | | 526 | | | | 462 | | | | 13.9 | |
| Investment funds | | | 329 | | | | 325 | | | | 312 | | | | 1.2 | | | | 5.4 | | | | 329 | | | | 312 | | | | 5.4 | |
| Insurance | | | 983 | | | | 994 | | | | 875 | | | | (1.1 | ) | | | 12.3 | | | | 983 | | | | 875 | | | | 12.3 | |
| Purchase-sale of securities and money market transactions | | | 138 | | | | 32 | | | | 127 | | | | 331.3 | | | | 8.7 | | | | 138 | | | | 127 | | | | 8.7 | |
Checks trading | | | 59 | | | | 69 | | | | 65 | | | | (14.5 | ) | | | (9.2 | ) | | | 59 | | | | 65 | | | | (9.2 | ) |
| Foreign trade | | | 203 | | | | 175 | | | | 170 | | | | 16.0 | | | | 19.4 | | | | 203 | | | | 170 | | | | 19.4 | |
| Financial advisory services | | | 233 | | | | 384 | | | | 396 | | | | (39.3 | ) | | | (41.2 | ) | | | 233 | | | | 396 | | | | (41.2 | ) |
| Other | | | (153 | ) | | | (146 | ) | | | (120 | ) | | | (4.8 | ) | | | (27.5 | ) | | | (153 | ) | | | (120 | ) | | | (27.5 | ) |
| | | | | | | | | | | | | | | | | | | | | | | | | | | | | | | | | |
| Total | | | 3,298 | | | | 3,364 | | | | 3,423 | | | | (2.0 | ) | | | (3.7 | ) | | | 3,298 | | | | 3,423 | | | | (3.7 | ) |
In 1Q15, net commission and fee income totaled Ps.3,298 million, representing a YoY decrease of 3.7%, or Ps.125 million. This principally reflects the following YoY increases: 12.3%, or Ps.108 million, in insurance brokerage fees; 13.9%, or Ps.64 million, in collection services; 19.4%, or Ps.33 million in foreign trade; 18.1%, or Ps.34 million in account management fees; 5.4%, or Ps.17 million in investment funds fees; and 8.7%, or Ps.11 million in capital markets and securities. These increases resulted from our strategy to sell insurance products together with other products such as consumer, mortgage and SME loans. Performance also benefited from increased sales through alternative channels such as ATMs and contact centers, as well as from our heightened focus on establishing integral relationships with our clients, which led to increased transactional activity.
| | 1Q.15| EARNINGS RELEASE | 18 |
| | | |
The above mentioned increases were partially offset by declines of 20.0%, or Ps.190 million, in credit card fees and 41.2%, or Ps.163 million, in financial advisory. These decreases mainly reflect: (i) costs incurred in new placements through telemarketers to reach out to the open market, which has allowed us to grow this portfolio above market levels; and (ii) the slower execution in the pipeline of large energy and infrastructure projects.
Compared to 4Q14, net commission and fee income decreased 2.0%, or Ps.66 million, mainly reflecting decreases of 39.3%, or Ps.151 million, in financial advisory fees and 9.7%, or Ps.81 million, in credit and debit card fees. This more than offset the following sequential increases: Ps.106 million in capital markets and securities fees after a very low 4Q14; 15.6%, or Ps.71 million, in collection and payment fees; and 16.0%, or Ps.28 million in foreign trade.
| | 1Q.15| EARNINGS RELEASE | 19 |
| | | |
Net gain (loss) on financial assets and liabilities
| Grupo Financiero Santander México |
| Net gain (loss) on financial assets and liabilities |
| Millions of mexican pesos | | | | | % Variation | | | | % Variation |
| | 1Q15 | 4Q14 | 1Q14 | | QoQ | YoY | | 3M15 | 3M14 | | 15/14 |
| Valuation | | | | | | | | | | | |
| Foreign exchange | 87 | (101) | 25 | | 186.1 | 248.0 | | 87 | 25 | | 248.0 |
| Derivatives | 6,638 | 3,331 | 1,491 | | 99.3 | 345.2 | | 6,638 | 1,491 | | 345.2 |
| Shares | 17 | (71) | (91) | | 123.9 | 118.7 | | 17 | (91) | | 118.7 |
| Debt instruments | (358) | (238) | 636 | | (50.4) | (156.3) | | (358) | 636 | | (156.3) |
| Valuation result | 6,384 | 2,921 | 2,061 | | 118.6 | 209.8 | | 6,384 | 2,061 | | 209.8 |
| | | | | | | | | | | | |
| Purchase / sale of securities | | | | | | | | | | | |
| Foreign exchange | (613) | (566) | 53 | | (8.3) | (1,256.6) | | (613) | 53 | | (1,256.6) |
| Derivatives | (5,393) | (2,044) | (1,162) | | (163.8) | (364.1) | | (5,393) | (1,162) | | (364.1) |
| Shares | (14) | (90) | (264) | | 84.4 | 94.7 | | (14) | (264) | | 94.7 |
| Debt instruments | 431 | 174 | (135) | | 147.7 | 419.3 | | 431 | (135) | | 419.3 |
| Purchase -sale result | (5,589) | (2,526) | (1,508) | | (121.3) | (270.6) | | (5,589) | (1,508) | | (270.6) |
| | | | | | | | | | | | |
| Total | 795 | 395 | 553 | | 101.3 | 43.8 | | 795 | 553 | | 43.8 |
In 1Q15, Santander México reported a Ps.795 million net gain from financial assets and liabilities, compared with gains of Ps.553 million in 1Q14 and Ps.395 million in 4Q14. The net gain on financial assets and liabilities in 1Q15 is mainly explained by valuation gains of Ps.6,384 million, mainly related to derivatives, which were partially offset by trading losses of Ps.5,589 million principally related to derivatives and foreign exchange instruments.
The Ps.6,384 million valuation gain, was mainly explained by valuation gains in derivatives of Ps.6,638 million, Ps.87 million in foreign exchange and of Ps.17 million in share instruments. This was partially offset by valuation losses of Ps.358 million in debt instruments.
The Ps.5,589 million trading loss in 1Q15, was principally driven by derivatives, foreign exchange and share instruments, which reported negative results of Ps.5,393 million, Ps.613 million and Ps.14 million, respectively. These losses were partially offset by a net trading gain of Ps.431 million in debt instruments.
| | 1Q.15| EARNINGS RELEASE | 20 |
| | | |
Other operating income
| Grupo Financiero Santander México |
| Other operating income |
| Millions of mexican pesos | | | | | % Variation | | | % Variation |
| | 1Q15 | 4Q14 | 1Q14 | | QoQ | YoY | 3M15 | 3M14 | 15/14 |
| | | | | | | | | | |
| Recovery of previously written-off loans | 446 | 733 | 482 | | (39.2) | (7.5) | 446 | 482 | (7.5) |
| Profit from the sale of real property | 0 | 5 | 2 | | (100.0) | (100.0) | 0 | 2 | (100.0) |
| Cancellation of liabilities and reserves | 106 | 60 | 53 | | 76.7 | 100.0 | 106 | 53 | 100.0 |
| Interest on personnel loans | 27 | 27 | 29 | | 0.0 | (6.9) | 27 | 29 | (6.9) |
| Allowance for losses on foreclosed assets | (11) | (7) | (19) | | (57.1) | 42.1 | (11) | (19) | 42.1 |
| Profit from sale of foreclosed assets | 58 | 72 | 222 | | (19.4) | (73.9) | 58 | 222 | (73.9) |
| Technical advisory services | 5 | 7 | 7 | | (28.6) | (28.6) | 5 | 7 | (28.6) |
| Portfolio recovery legal expenses and costs | (201) | (220) | (139) | | 8.6 | (44.6) | (201) | (139) | (44.6) |
| Write-offs and bankruptcies | (221) | (146) | (141) | | (51.4) | (56.7) | (221) | (141) | (56.7) |
| Provision for legal and tax contingencies | (52) | (62) | (54) | | 16.1 | 3.7 | (52) | (54) | 3.7 |
| IPAB ("Indemnity") provisions and payments | (1) | (1) | (2) | | 0.0 | 50.0 | (1) | (2) | 50.0 |
| Result on sale of loan portfolio | 46 | 6 | (116) | | 666.7 | 139.7 | 46 | (116) | 139.7 |
| Others | 37 | 59 | 36 | | (37.3) | 2.8 | 37 | 36 | 2.8 |
| | | | | | | | | | |
| Total | 239 | 533 | 360 | | (55.2) | (33.6) | 239 | 360 | (33.6) |
Other operating income in 1Q15 totaled Ps.239 million, down from Ps.360 million in 1Q14 and Ps.533 million in 4Q14. The YoY and QoQ decreases are mainly explained by lower profit from sale of foreclosed asset, as well as lower recoveries of previously written-off loans.
| | 1Q.15| EARNINGS RELEASE | 21 |
| | | |
Administrative and promotional expenses
Administrative and promotional expenses consist of personnel costs such as payroll and benefits, promotion and advertising expenses, and other general expenses. Personnel expenses consist mainly of salaries, social security contributions, bonuses and our long-term incentive plan for our executives. Other general expenses mainly consist of: expenses related to technology and systems, administrative services, which are mainly services outsourced in the areas of information technology, taxes and duties, professional fees, contributions to bank savings protection system (IPAB), rental of properties and hardware, advertising and communication, surveillance and cash courier services and expenses related to maintenance, conservation and repair, among others.
| Grupo Financiero Santander México | |
| Administrative and promotional expenses | |
| Millions of mexican pesos | | | | | | | | | | | % Variation | | | | | | | | | % Variation | |
| | | | 1Q15 | | | | 4Q14 | | | | 1Q14 | | | QoQ | | | YoY | | | | 3M15 | | | | 3M14 | | | | 15/14 | |
| Salaries and employee benefits | | | 2,916 | | | | 2,886 | | | | 2,587 | | | | 1.0 | | | | 12.7 | | | | 2,916 | | | | 2,587 | | | | 12.7 | |
| Credit card operation | | | 84 | | | | 77 | | | | 73 | | | | 9.1 | | | | 15.1 | | | | 84 | | | | 73 | | | | 15.1 | |
| Professional fees | | | 99 | | | | 166 | | | | 82 | | | | (40.4 | ) | | | 20.7 | | | | 99 | | | | 82 | | | | 20.7 | |
| Leasehold | | | 433 | | | | 393 | | | | 405 | | | | 10.2 | | | | 6.9 | | | | 433 | | | | 405 | | | | 6.9 | |
| Promotional and advertising expenses | | | 174 | | | | 162 | | | | 137 | | | | 7.4 | | | | 27.0 | | | | 174 | | | | 137 | | | | 27.0 | |
| Taxes and duties | | | 358 | | | | 167 | | | | 389 | | | | 114.4 | | | | (8.0 | ) | | | 358 | | | | 389 | | | | (8.0 | ) |
| Technology services (IT) | | | 582 | | | | 578 | | | | 617 | | | | 0.7 | | | | (5.7 | ) | | | 582 | | | | 617 | | | | (5.7 | ) |
| Depreciation and amortization | | | 499 | | | | 409 | | | | 425 | | | | 22.0 | | | | 17.4 | | | | 499 | | | | 425 | | | | 17.4 | |
| Contributions to bank savings protection system (IPAB) | | | 535 | | | | 508 | | | | 436 | | | | 5.3 | | | | 22.7 | | | | 535 | | | | 436 | | | | 22.7 | |
| Cash protection | | | 169 | | | | 109 | | | | 163 | | | | 55.0 | | | | 3.7 | | | | 169 | | | | 163 | | | | 3.7 | |
| Others | | | 540 | | | | 604 | | | | 588 | | | | (10.6 | ) | | | (8.2 | ) | | | 540 | | | | 588 | | | | (8.2 | ) |
| | | | | | | | | | | | | | | | | | | | | | | | | | | | | | | | | |
| Total | | | 6,389 | | | | 6,059 | | | | 5,902 | | | | 5.4 | | | | 8.3 | | | | 6,389 | | | | 5,902 | | | | 8.3 | |
Administrative and promotional expenses in 1Q15 amounted to Ps.6,389 million, compared to Ps.5,902 million in 1Q14 and Ps.6,059 million in 4Q14, increasing 8.3% YoY and 5.4% QoQ. The YoY increase was mainly driven by: Ps.329 million in salaries and employee benefits, Ps.99 million in contributions to bank savings protection system (IPAB), Ps.74 million in depreciation and amortization, Ps.37 million in promotional and advertising expenses and Ps.28 million in leaseholds. This was partially offset by decreases of: Ps.35 million in technology services and Ps.31 million in taxes and duties. The YoY increase in expenses mainly reflects our branch expansion plan, with a 14.7% increase in the average headcount during the period, as well as expenses to support business growth. Administrative expenses were flat as our efficient cost management is offsetting the incremental cost of the new branches.
Under Mexican accounting standards, expenses include the deposit insurance fee (or IPAB), this expense increased 22.7%, or Ps.99 million reflecting growtn of the deposit base and the subordinated debt.
On a sequential basis, administrative and promotional expenses increased 5.4%, or Ps.330 million, principally reflecting higher taxes and duties of Ps.191 million, depreciation and amortization expenses of Ps.90 million, cash protection expenses of Ps.60 million, leaseholds of Ps.40 million, salaries and employee benefits of Ps.30 million and contributions to bank savings protection system (IPAB) of Ps.27 million. These increases were partially offset by declines of: Ps.67 million in professional fees and Ps.64 million in other expenses.
Expenses reflect effective cost management that translates into an optimized operating structure which contributes to mitigate costs resulting from the investment in strategic businesses, new branches and inflation.
| | 1Q.15| EARNINGS RELEASE | 22 |
| | | |
The efficiency ratio for 1Q15 stood at 44.8%, which compares to 44.3% in 1Q14 and 43.0% reported in 4Q14, while the recurrence ratio was 56.0%, below the 62.5% reported in 1Q14 and the 60.6% in 4Q14.
The efficiency and recurrence ratios were impacted by weaker than anticipated activity in both credit cards and fee-related businesses.
Income Taxes
In 1Q15 Santander México reported a tax expense of Ps.989 million compared to tax expenses of Ps.716 million in 1Q14 and Ps.895 million in 4Q14.
The effective tax rate for the quarter was 23.5%, 550 basis points and 450 basis points higher compared to the 18.0% and 19.0% effective tax rates paid in 1Q14 and 4Q14, respectively.
| | 1Q.15| EARNINGS RELEASE | 23 |
| | | |
Capitalization and ROAE
| Banco Santander México | | | | | | | | | |
| Capitalization | | | | | | | | | |
| Millions of Mexican Pesos | | | 1Q15 | | | | 4Q14 | | | | 1Q14 | |
| Tier 1 | | | 79,292 | | | | 76,697 | | | | 71,832 | |
| Tier 2 | | | 20,231 | | | | 19,820 | | | | 17,312 | |
| Total capital | | | 99,523 | | | | 96,517 | | | | 89,144 | |
| | | | | | | | | | | | | |
| Risk-weighted assets | | | | | | | | | | | | |
| Credit risk | | | 410,557 | | | | 406,832 | | | | 373,170 | |
| Credit, market and operational risk | | | 601,085 | | | | 596,952 | | | | 568,833 | |
| | | | | | | | | | | | | |
| Credit risk ratios: | | | | | | | | | | | | |
| Tier 1 (%) | | | 19.3 | | | | 18.8 | | | | 19.3 | |
| Tier 2(%) | | | 4.9 | | | | 4.9 | | | | 4.6 | |
| Capitalization ratio (%) | | | 24.2 | | | | 23.7 | | | | 23.9 | |
| | | | | | | | | | | | | |
| Total capital ratios: | | | | | | | | | | | | |
| Tier 1(%) | | | 13.2 | | | | 12.9 | | | | 12.6 | |
| Tier 2 (%) | | | 3.4 | | | | 3.3 | | | | 3.1 | |
| Capitalization ratio (%) | | | 16.6 | | | | 16.2 | | | | 15.7 | |
Banco Santander Mexico’s preliminary capital ratio at period end 1Q15 was 16.6%, compared to 15.7% at period end 1Q14 and 16.2% at period end 4Q14. The 16.6% capital ratio was comprised of 13.2% Tier 1 and 3.4% Tier 2.
As of February 2015, Banco Santander México is classified within Category 1 in accordance with Article 134bis of the Mexican Banking Law, and remains in this category as per the preliminary results dated March 2015, which is the most recent available analysis.
1Q15 reported ROAE was 12.0%, versus 13.5% in 1Q14 and 14.0% in 4Q14.
| | 1Q.15| EARNINGS RELEASE | 24 |
| | | |
RELEVANT EVENTS & REPRESENTATIVE ACTIVITIES AND TRANSACTIONS
Relevant Events
Santander México signed agreement to acquire a consumer loan portfolio from Scotiabank Mexico.
On March 18, 2015 Santander México announced that after receiving the corresponding regulatory approvals, signed with Scotiabank an agreement to acquire a portion of its consumer loan portfolio. The acquisition will take effect in April 2015.
The final consumer loan portfolio subject to this acquisition consisted of approximately 39,200 loans amounting to a total of Ps.3,178.7 million.
This loan portfolio is expected to further expand Santander Mexico’s core portfolio and market share in the personal loans segment by approximately 230 basis points while maintaining credit quality standards.
Representative Transactions
Santander México acts as placement agent in the debt issuance of Fibra Uno
Santander Mexico participated as joint placement agent in the Ps.10,000 million debt issuance of Fibra Uno.
Santander México acts as placement agent in the debt issuance by Holcim Capital México
Santander México acted as placement agent in the Ps.1,700 million debt issuance by Holcim Capital México, S.A. de C.V. (HOLCIM 15).
Santander México acted as lead manager in a syndicated loan for Pemex
Santander México acted as lead manager in a US$5.25 million 5-year syndicated loan for Pemex. The line of credit includes two tranches; a long term loan and a revolving line of credit. Funds will be used to refinance and increase the ammount of the Company’s existing lines of credit.
Santander México leads the second follow on by Corporación Inmobiliaria Vesta
Santander México was the lead agent in the second follo won of Corporación Inmobiliaria Vesta, for a total ammount of Ps.3.355 million.
| | 1Q.15| EARNINGS RELEASE | 25 |
| | | |
AWARDS & RECOGNITIONS
Santander México Awarded "Deal of the Year" by Trade Finance Trade Magazine
Trade Finance magazine recognized Santander Mexico with two “Deal of the Year” awards – one in connection of the PDPF for Grupo Aeromexico and the other for the debt issuance by PEMEX backed by EXIM Bank U.
Santander México Awarded “Best Trade Finance Bank in Mexico 2015” by Global Finance Magazine
Global Finance Magazine recognized Santander Mexico as “Best Trade Finance Bank in Mexico 2015”.
Santander México Awarded by IJ Global Magazine
IJ Global Magazine recognized Santander Mexico with two awards in energy and infrastructure for the financing of the Los Ramones Sur gas pipeline and the debt issuances of Lipsa-Icasa.
SUSTAINABILITY AND SOCIAL RESPONSIBILITY
20 years of the Trust for The Children of Mexico
Santander Mexico, with the solidarity of its employees, is present in the Trust for the Children of Mexico, through their donations, fundraising collections, organizing volunteer activities and participating as sponsors in the calls for donations.
Santander Mexico participates in solidarity actions with Hospital Materno Infantil Cuajimalpa
On Friday, February 6, 2015, Santander Mexico with the solidarity of his employees, delivered to the “Clínica de la Amistad del Centro Médico ABC Santa Fe“ clinic donated supplies, including: diapers (7,452), bottled water (150 liters), powder milk (105 kg), nipples (183), baby food and juices, as well as various personal hygiene products.
Sustainable Partners UNICEF
During February 2015, Santander Mexico’s ATMs were enabled to receive donations from customers who voluntarily participated in this education fundraising campaign. A total of Ps.1.9 million were raised which will be used to:
| | · | Finance studies to assess the educational situation of Mexico. |
| | · | Detection of the most urgent needs. |
Improvement in the quality of intercultural and bilingual education in indigenous communities.
| | 1Q.15| EARNINGS RELEASE | 26 |
| | | |
CREDIT RATINGS
| Banco Santander México | | | | | | |
| Ratings | | | | | | |
| | | Moody´s | | | Fitch Ratings | |
| Global scale | | | | | | |
| Foreign currency | | | | | | |
| Long term | | | A3 | | | BBB+ | |
| Short term | | | P-2 | | | | F2 | |
| | | | | | | | | |
| Local currency | | | | | | | | |
| Long term | | | A3 | | | BBB+ | |
| Short term | | | P-2 | | | | F2 | |
| | | | | | | | | |
| National scale | | | | | | | | |
| Long term | | Aaa.mx | | | AAA(mex) | |
| Short term | | Mx-1 | | | F1+(mex) | |
| | | | | | | | | |
| Autonomous credit profile (SACP) | | | - | | | | - | |
| Rating viability (VR) | | | - | | | bbb+ | |
| Support | | | - | | | | 2 | |
| Financial strength | | | C- | | | | - | |
| Standalone BCA | | baa1 | | | | - | |
| Outlook | | Stable | | | Stable | |
| | | | | | | | | |
| Last publication: | | 20-Aug-14 | | | 23-May-14 | |
| | | | | | | | | |
| International Issuances | | | | | | | | |
| Tier 2 Subordinated Capital Notes due 2024 | | Baa3 | | | BB+ | |
| Long-term senior unsecured global notes due 2022 | | | A3 | | | BBB+ | |
Santander Vivienda (formerly ING Hipotecaria)
| | | Moody’s | | | Fitch Ratings | |
| National scale | | | | | | |
| Long Term | | | ---- | | | AAA (mex) | |
| | | | | | | | |
| Short Term | | | ---- | | | F1+ (mex) | |
| | | | | | | | |
| Notes HICOAM 07 | | | | | | | |
| | | | | | | | |
| Global Scale | | | | | | | |
| Local currency | | | | | | | |
| Long Term | | | A3 | | | | ---- | |
| | | | | | | | | |
| National scale | | | | | | | | |
| Long Term | | Aaa.mx | | | AAA(mex) | |
| | | | | | | | | |
| | 1Q.15| EARNINGS RELEASE | 27 |
| | | |
| Standalone BCA | | b1 | | | ---- |
| | | | | | |
| Outlook | | Stable | | | Stable |
| | | | | | |
| Last publication: | | 20-Aug-14 | | | 23-may-14 |
| Brokerage - Casa de Bolsa Santander | | | | |
| | | | | |
| Ratings | | | | |
| | | Moody´s | | Fitch Ratings |
| Global scale | | | | |
| National scale | | | | |
| Long term | | A3 | | _ |
| Short term | | Prime-2 | | _ |
| | | | | |
| National scale | | | | |
| Long term | | Aaa.mx | | AAA(mex) |
| Short term | | Mx-1 | | F1+(mex) |
| | | | | |
| Standalone BCA | | b1 | | ---- |
| Outlook | | Stable | | Stable |
| | | | | |
| Last publication: | | 17-Dec-13 | | 23-May-14 |
Note:
BFSR = Bank Financial Strength Rating
BCA = Baseline Credit Assessments
VR = Viability Ratings
SACP = Stand Alone Credit Profiles
| | 1Q.15| EARNINGS RELEASE | 28 |
| | | |
1Q15 EARNINGS CALL DIAL-IN INFORMATION
| Date: | Tuesday, April 28, 2015 |
| Time: | 09:00 AM (MCT); 10:00 AM (US ET) |
| Dial-in Numbers: | 1-888-715-1387 US & Canada; 1-913-312-1496 International & Mexico |
| Webcast: | https://viavid.webcasts.com/starthere.jsp?ei=1061113 |
| Replay: | Starting on Tuesday, April 28, 2015 at 1:00 pm US ET (12:00 pm MCT), and ending on Tuesday, May 5, 2015 at 11:59 pm US ET (10:59 pm MCT) |
Dial-in number: 1-877-870-5176 US & Canada; 1-858-384-5517 International & Mexico
ANALYST COVERAGE
Actinver, Bank of America Merrill Lynch, Barclays, BBVA Bancomer, Bradesco, Brasil Plural, Citi, Credit Suisse, Deutsche Bank, EVA Dimensions, Finamex , GBM, Goldman Sachs, HSBC, Independent Research, Interacciones, JP Morgan, Moneda, Monex Casa de Bolsa, Morgan Stanley, Morningstar, Nau Securities, Nomura, Scotiabank, Signum Research, UBS and Vector.
Santander México is covered by the aforementioned analysts. Please note that any opinions, estimates or forecasts regarding the performance of Santander México issued by these analysts reflect their own views, and therefore do not represent the opinions, estimates or forecasts of Santander México or its management. Although Santander México may refer to or distribute such statements, this does not imply that Santander México agrees with or endorses any information, conclusions or recommendations included therein.
DEFINITION OF RATIOS
ROAE: Annualized net income divided by average equity
EFFICIENCY: Annualized administrative and promotional expenses divided by annualized gross operating income (before administrative and promotional expenses and allowances).
RECURRENCY: Annualized net fees divided by annualized administrative and promotional expenses (net of amortizations and depreciations).
NIM: Financial margin divided by daily average interest earnings assets.
COST OF RISK: Annualized provisions for loan losses divided by average loan portfolio
Note:
| | · | Annualized figures consider 3M15x4 cumulative results |
| | · | Average figures are calculated using 4Q14 and 1Q15 |
| | 1Q.15| EARNINGS RELEASE | 29 |
| | | |
ABOUT GRUPO FINANCIERO SANTANDER MÉXICO, S.A.B. DE C.V. (NYSE: BSMX; BMV: SANMEX)
Grupo Financiero Santander México, S.A.B. de C.V. (Santander México), one of Mexico’s leading financial services holding companies, provides a wide range of financial and related services, including retail and commercial banking, securities brokerage, financial advisory and other related investment activities. Santander México offers a multichannel financial services platform focused on mid- to high-income individuals and small- to medium-sized enterprises, while also providing integrated financial services to larger multinational companies in Mexico. As of March 31, 2015, Santander México had total assets of Ps.1,066 billion under Mexican Banking GAAP and more than 12 million customers. Headquartered in Mexico City, the Company operates 1,076 branches and 274 offices nationwide and has a total of 16,435 employees.
We, the undersigned under oath to tell the truth declare that, in the area of our corresponding functions, we prepared the information on Grupo Financiero Santander contained in this quarterly report, which to the best of our knowledge reasonably reflects its situation.
| MARCOS A. MARTÍNEZ GAVICA | | PEDRO JOSÉ MORENO CANTALEJO |
| Executive President and Chief Executive Officer | | Vice President of Administration and Finance |
| EMILIO DE EUSEBIO SAIZ | JESÚS GONZÁLEZ DEL REAL | JUAN RAMÓN JIMÉNEZ LORENZO |
| Deputy General Director of Intervention and Control Management | Executive Director – Controller | Executive Director of Internal Audit |
The financial information presented in this report has been obtained from the non-audited financial statements prepared in accordance with the General Nature Provisions applicable to Holding Corporations of Financial Groups which are subject to the supervision of the National Banking and Securities Commission on accounting procedures, published in the Federal Official Gazette on January 31, 2011. The exchange rate used to convert foreign currency transactions to pesos is Ps.15.2647.
INVESTOR RELATIONS CONTACT
Héctor Chávez Lopez – Managing Director - IRO
+ 52 (55) 5269-1925
hchavez@santander.com.mx
Gerardo Freire Alvarado – Executive Director of Investor Relations
+ 52 (55) 5269-1827 / + 52 (55) 5269-1828
gfreire@santander.com.mx
Investor Relations Team
| investor@santander.com.mx | www.santander.com.mx |
LEGAL DISCLAIMER
Grupo Financiero Santander México cautions that this report may contain forward-looking statements within the meaning of the U.S. Private Securities Litigation Reform Act of 1995. These forward-looking statements may be found in various places throughout this report and include, without limitation, statements regarding our intent, belief, targets or current expectations in connection with: asset growth and sources of funding; growth of our fee-based business; expansion of our distribution network; our focus on strategic businesses; our compound annual growth rate; our risk, efficiency and profitability targets; financing plans; competition; impact of regulation; exposure to market risks including interest rate risk, foreign exchange risk and equity price risk; exposure to credit risks including credit default risk and settlement risk; projected capital expenditures; capitalization requirements and level of reserves; liquidity; trends affecting the economy generally; and trends affecting our financial condition and our results of operations. While these forward-looking statements represent our judgment and future expectations concerning the development of our business, a number of risks, uncertainties and other important factors could cause actual developments and
| | 1Q.15| EARNINGS RELEASE | 30 |
| | | |
results to differ materially from our expectations. These factors include, but are not limited to: changes in capital markets in general that may affect policies or attitudes towards lending to Mexico or Mexican companies; changes in economic conditions, in Mexico in particular, in the United States or globally; the monetary, foreign exchange and interest rate policies of the Mexican Central Bank (Banco de Mexico); inflation; deflation; unemployment; unanticipated turbulence in interest rates; movements in foreign exchange rates; movements in equity prices or other rates or prices; changes in Mexican and foreign policies, legislation and regulations; changes in requirements to make contributions to, for the receipt of support from programs organized by or requiring deposits to be made or assessments observed or imposed by, the Mexican government; changes in taxes; competition, changes in competition and pricing environments; our inability to hedge certain risks economically; economic conditions that affect consumer spending and the ability of customers to comply with obligations; the adequacy of allowances for loans and other losses; increased default by borrowers; technological changes; changes in consumer spending and saving habits; increased costs; unanticipated increases in financing and other costs or the inability to obtain additional debt or equity financing on attractive terms; changes in, or failure to comply with, banking regulations; and certain other factors indicated in our annual report20F. The risk factors and other key factors that we have indicated in our past and future filings and reports, including those with the U.S. Securities and Exchange Commission, could adversely affect our business and financial performance.
Note: The information contained in this report is not audited. Nevertheless, the consolidated accounts are prepared on the basis of the accounting principles and regulations prescribed by the Mexican National Banking and Securities Commission (Comisión Nacional Bancaria y de Valores) for credit institutions, as amended (Mexican Banking GAAP). All figures presented are in nominal terms. Historical figures are not adjusted for inflation.
| | 1Q.15| EARNINGS RELEASE | 31 |
| | | |
Grupo Financiero Santander México
| § | Consolidated Balance Sheet |
| § | Consolidated Statement of Income |
| § | Consolidated Statement of Changes in Stockholders’ Equity |
| § | Consolidated Statement of Cash Flows |
The information contained in this report and the financial statements of the Group’s subsidiaries may be consulted on the Internet website: www.santander.com.mx or through the following direct access:
http://www.santander.com.mx/ir/english/financial/quarterly.html
There is also information on Santander on the CNBV Website: www.cnbv.gob.mx
| | 1Q.15| EARNINGS RELEASE | 32 |
| | | |
| Grupo Financiero Santander México | | | | | | | | | | | | | | | |
| Consolidated balance sheet | | | | | | | | | | | | | | | |
| Millions of mexican pesos | | | | | | | | | | | | | | | |
| | | 2015 | | | | | | | | | | | | 2014 | |
| | | Mar | | | Dec | | | Sep | | | Jun | | | Mar | |
| Assets | | | | | | | | | | | | | | | |
| | | | | | | | | | | | | | | | |
| Funds available | | | 105,370 | | | | 101,198 | | | | 97,474 | | | | 91,384 | | | | 94,408 | |
| | | | | | | | | | | | | | | | | | | | | |
| Margin accounts | | | 2,844 | | | | 2,855 | | | | 3,203 | | | | 3,392 | | | | 2,894 | |
| | | | | | | | | | | | | | | | | | | | | |
| Investment in securities | | | 271,576 | | | | 203,455 | | | | 231,705 | | | | 219,044 | | | | 218,047 | |
| Trading securities | | | 198,638 | | | | 114,936 | | | | 156,247 | | | | 143,491 | | | | 149,772 | |
| Securities available for sale | | | 67,436 | | | | 83,057 | | | | 70,038 | | | | 70,175 | | | | 62,944 | |
| Securities held to maturity | | | 5,502 | | | | 5,462 | | | | 5,420 | | | | 5,378 | | | | 5,331 | |
| | | | | | | | | | | | | | | | | | | | | |
| Debtors under sale and repurchase agreements | | | 7,331 | | | | 5,186 | | | | 10,689 | | | | 10,471 | | | | 8,413 | |
| | | | | | | | | | | | | | | | | | | | | |
| Préstamo de Valores | | | 1 | | | | 0 | | | | 0 | | | | 0 | | | | 0 | |
| | | | | | | | | | | | | | | | | | | | | |
| Derivatives | | | 100,357 | | | | 97,284 | | | | 73,888 | | | | 88,209 | | | | 73,878 | |
| Trading purposes | | | 89,721 | | | | 92,544 | | | | 72,891 | | | | 87,566 | | | | 73,422 | |
| Hedging purposes | | | 10,636 | | | | 4,740 | | | | 997 | | | | 643 | | | | 456 | |
| | | | | | | | | | | | | | | | | | | | | |
| Valuation adjustment for hedged financial assets | | | 49 | | | | (44 | ) | | | (65 | ) | | | 85 | | | | 29 | |
| | | | | | | | | | | | | | | | | | | | | |
| Performing loan portfolio | | | | | | | | | | | | | | | | | | | | |
| Commercial loans | | | 277,921 | | | | 274,438 | | | | 256,496 | | | | 261,976 | | | | 236,610 | |
| Commercial or business activity | | | 221,884 | | | | 212,933 | | | | 204,255 | | | | 205,210 | | | | 189,995 | |
| Financial entities loans | | | 5,444 | | | | 5,580 | | | | 5,226 | | | | 5,901 | | | | 3,859 | |
| Government entities loans | | | 50,593 | | | | 55,925 | | | | 47,015 | | | | 50,865 | | | | 42,756 | |
| Consumer loans | | | 74,714 | | | | 72,459 | | | | 70,917 | | | | 69,372 | | | | 67,069 | |
| Mortgage loans | | | 104,645 | | | | 101,189 | | | | 97,698 | | | | 94,655 | | | | 91,739 | |
| Total performing loan portfolio | | | 457,280 | | | | 448,086 | | | | 425,111 | | | | 426,003 | | | | 395,418 | |
| | | | | | | | | | | | | | | | | | | | | |
| Non-performing loan portfolio | | | | | | | | | | | | | | | | | | | | |
| Commercial loans | | | 9,155 | | | | 8,891 | | | | 8,709 | | | | 7,152 | | | | 6,910 | |
| Commercial or business activity | | | 9,152 | | | | 8,889 | | | | 8,709 | | | | 7,152 | | | | 6,909 | |
| Financial entities loans | | | 0 | | | | 0 | | | | 0 | | | | 0 | | | | 1 | |
| Government entities loans | | | 3 | | | | 2 | | | | 0 | | | | 0 | | | | 0 | |
| Consumer loans | | | 2,799 | | | | 3,165 | | | | 2,755 | | | | 2,933 | | | | 2,895 | |
| Mortgage loans | | | 5,504 | | | | 5,399 | | | | 4,900 | | | | 4,587 | | | | 4,126 | |
| Total non-performing portfolio | | | 17,458 | | | | 17,455 | | | | 16,364 | | | | 14,672 | | | | 13,931 | |
| Total loan portfolio | | | 474,738 | | | | 465,541 | | | | 441,475 | | | | 440,675 | | | | 409,349 | |
| | | | | | | | | | | | | | | | | | | | | |
| Allowance for loan losses | | | (17,382 | ) | | | (16,951 | ) | | | (16,631 | ) | | | (16,397 | ) | | | (16,081 | ) |
| Loan portfolio (net) | | | 457,356 | | | | 448,590 | | | | 424,844 | | | | 424,278 | | | | 393,268 | |
| | | | | | | | | | | | | | | | | | | | | |
| Acrrued income receivable from securitization transactions | | | 128 | | | | 127 | | | | 127 | | | | 128 | | | | 127 | |
| Other receivables (net) | | | 93,035 | | | | 51,358 | | | | 62,458 | | | | 55,768 | | | | 51,343 | |
| Foreclosed assets (net) | | | 383 | | | | 358 | | | | 328 | | | | 357 | | | | 344 | |
| Property, furniture and fixtures (net) | | | 5,378 | | | | 5,268 | | | | 4,699 | | | | 4,664 | | | | 4,704 | |
| Long-term investment in shares | | | 172 | | | | 153 | | | | 135 | | | | 112 | | | | 162 | |
| Deferred taxes and deferred profit sharing (net) | | | 16,737 | | | | 16,819 | | | | 17,985 | | | | 17,953 | | | | 18,067 | |
| | | | | | | | | | | | | | | | | | | | | |
| Deferred charges, advance payments and intangibles | | | 5,180 | | | | 4,579 | | | | 3,850 | | | | 3,971 | | | | 4,085 | |
| Other | | | 200 | | | | 198 | | | | 203 | | | | 200 | | | | 206 | |
| | | | | | | | | | | | | | | | | | | | | |
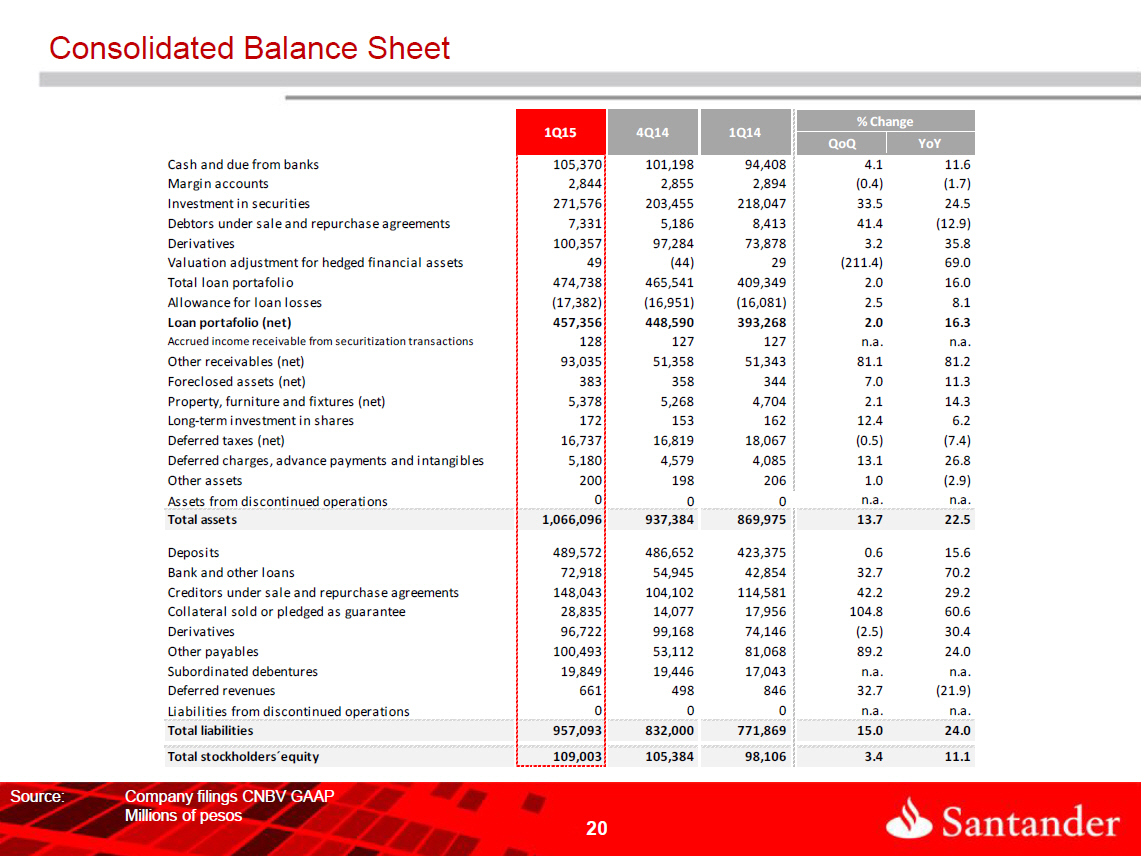
| Total assets | | | 1,066,097 | | | | 937,384 | | | | 931,523 | | | | 920,016 | | | | 869,975 | |
| | 1Q.15| EARNINGS RELEASE | 33 |
| | | |
| Grupo Financiero Santander México | | | | | | | | | | | | | | | |
| Consolidated balance sheet | | | | | | | | | | | | | | | |
| Millions of mexican pesos | | | | | | | | | | | | | | | |
| | | 2015 | | | | | | | | | | | | 2014 | |
| | | Mar | | | Dec | | | Sep | | | Jun | | | Mar | |
| Liabilities | | | | | | | | | | | | | | | |
| | | | | | | | | | | | | | | | |
| Deposits | | | 489,572 | | | | 486,652 | | | | 464,071 | | | | 447,680 | | | | 423,375 | |
| Demand deposits | | | 292,441 | | | | 294,085 | | | | 285,861 | | | | 259,046 | | | | 255,062 | |
| Time deposits – general public | | | 122,408 | | | | 133,706 | | | | 113,322 | | | | 120,592 | | | | 122,896 | |
| Time deposits – money market | | | 44,281 | | | | 31,833 | | | | 38,960 | | | | 45,470 | | | | 23,123 | |
| Credit instruments issued | | | 30,442 | | | | 27,028 | | | | 25,928 | | | | 22,572 | | | | 22,294 | |
| | | | | | | | | | | | | | | | | | | | | |
| Bank and other loans | | | 72,918 | | | | 54,945 | | | | 47,472 | | | | 42,492 | | | | 42,854 | |
| Demand loans | | | 23,625 | | | | 3,065 | | | | 5,453 | | | | 9,000 | | | | 7,014 | |
| Short-term loans | | | 25,157 | | | | 27,470 | | | | 20,561 | | | | 18,396 | | | | 17,537 | |
| Long-term loans | | | 24,136 | | | | 24,410 | | | | 21,458 | | | | 15,096 | | | | 18,303 | |
| | | | | | | | | | | | | | | | | | | | | |
| Creditors under sale and repurchase agreements | | | 148,043 | | | | 104,102 | | | | 118,054 | | | | 127,905 | | | | 114,581 | |
| | | | | | | | | | | | | | | | | | | | | |
| Securities Lending | | | 1 | | | | 0 | | | | 0 | | | | 0 | | | | 0 | |
| | | | | | | | | | | | | | | | | | | | | |
| Collateral sold or pledged as guarantee | | | 28,835 | | | | 14,077 | | | | 14,968 | | | | 9,654 | | | | 17,956 | |
| Securities loans | | | 28,835 | | | | 14,077 | | | | 14,968 | | | | 9,654 | | | | 17,956 | |
| | | | | | | | | | | | | | | | | | | | | |
| Derivatives | | | 96,722 | | | | 99,168 | | | | 76,404 | | | | 90,416 | | | | 74,146 | |
| Trading purposes | | | 91,732 | | | | 94,779 | | | | 74,654 | | | | 86,500 | | | | 71,705 | |
| Hedging purposes | | | 4,990 | | | | 4,389 | | | | 1,750 | | | | 3,916 | | | | 2,441 | |
| | | | | | | | | | | | | | | | | | | | | |
| Other payables | | | 100,493 | | | | 53,112 | | | | 87,405 | | | | 82,067 | | | | 81,068 | |
| Income taxes payable | | | 2 | | | | 10 | | | | 11 | | | | 13 | | | | 7 | |
| Employee profit sharing payable | | | 269 | | | | 221 | | | | 171 | | | | 130 | | | | 277 | |
| Creditors from settlement of transactions | | | 66,988 | | | | 24,516 | | | | 52,452 | | | | 45,139 | | | | 55,583 | |
| Payable for cash collateral received | | | 10,472 | | | | 6,033 | | | | 3,745 | | | | 3,941 | | | | 4,370 | |
| Sundry creditors and other payables | | | 22,762 | | | | 22,332 | | | | 31,026 | | | | 32,844 | | | | 20,831 | |
| | | | | | | | | | | | | | | | | | | | | |
| Subordinated credit notes | | | 19,849 | | | | 19,446 | | | | 17,456 | | | | 17,192 | | | | 17,043 | |
| | | | | | | | | | | | | | | | | | | | | |
| Deferred revenues and other advances | | | 661 | | | | 498 | | | | 589 | | | | 698 | | | | 846 | |
| | | | | | | | | | | | | | | | | | | | | |
| Total liabilities | | | 957,094 | | | | 832,000 | | | | 826,419 | | | | 818,104 | | | | 771,869 | |
| | | | | | | | | | | | | | | | | | | | | |
| Paid-in capital | | | 48,148 | | | | 48,140 | | | | 48,170 | | | | 48,170 | | | | 48,165 | |
| Capital stock | | | 36,357 | | | | 36,357 | | | | 36,357 | | | | 36,357 | | | | 36,357 | |
| Share premium | | | 11,791 | | | | 11,783 | | | | 11,813 | | | | 11,813 | | | | 11,808 | |
| | | | | | | | | | | | | | | | | | | | | |
| Other capital | | | 60,855 | | | | 57,244 | | | | 56,934 | | | | 53,742 | | | | 49,941 | |
| Capital reserves | | | 1,944 | | | | 1,944 | | | | 1,944 | | | | 1,944 | | | | 1,851 | |
| Retained earnings | | | 55,574 | | | | 41,553 | | | | 45,005 | | | | 44,990 | | | | 45,140 | |
| Result from valuation of available for sale securities, net | | | (543 | ) | | | (543 | ) | | | (225 | ) | | | 203 | | | | (422 | ) |
| Result from valuation of cash flow hedge instruments, net | | | 656 | | | | 266 | | | | 10 | | | | (350 | ) | | | 104 | |
| Net income | | | 3,215 | | | | 14,014 | | | | 10,190 | | | | 6,946 | | | | 3,259 | |
| Non-controlling interest | | | 9 | | | | 10 | | | | 10 | | | | 9 | | | | 9 | |
| Total stockholders´equity | | | 109,003 | | | | 105,384 | | | | 105,104 | | | | 101,912 | | | | 98,106 | |
| | | | | | | | | | | | | | | | | | | | | |
| Total liabilities and stockholders´ equity | | | 1,066,097 | | | | 937,384 | | | | 931,523 | | | | 920,016 | | | | 869,975 | |
| | 1Q.15| EARNINGS RELEASE | 34 |
| | | |
| Grupo Financiero Santander México | | | | | | | | | | | | | | | |
| Consolidated balance sheet | | | | | | | | | | | | | | | |
| Millions of mexican pesos | | | | | | | | | | | | | | | |
| | | | | | | | | | | | | | | | |
| | | 2015 | | | | | | | | | | | | 2014 | |
| | | Mar | | | Dec | | | Sep | | | Jun | | | Mar | |
| Memorandum accounts | | | | | | | | | | | | | | | |
| | | | | | | | | | | | | | | | |
| For third parties | | | | | | | | | | | | | | | |
| | | | | | | | | | | | | | | | |
| Current client account | | | | | | | | | | | | | | | |
| Client Banks | | | 60 | | | | 90 | | | | 66 | | | | 88 | | | | 86 | |
| Liquidation of client transactions | | | (278 | ) | | | 235 | | | | (109 | ) | | | (21 | ) | | | (323 | ) |
| Dividends on behalf of clients | | | 1 | | | | 1 | | | | 1 | | | | 1 | | | | 0 | |
| | | | | | | | | | | | | | | | | | | | | |
| Custody services | | | | | | | | | | | | | | | | | | | | |
| Assets under custody | | | 158,785 | | | | 128,035 | | | | 172,370 | | | | 262,330 | | | | 288,930 | |
| | | | | | | | | | | | | | | | | | | | | |
| Transactions on behalf of third parties | | | | | | | | | | | | | | | | | | | | |
| Sale and repurchase agreements | | | 34,440 | | | | 19,274 | | | | 40,202 | | | | 32,870 | | | | 57,553 | |
| Security loans on behalf of clients | | | 1,110 | | | | 994 | | | | 905 | | | | 918 | | | | 829 | |
| Collaterals received as guarantee on behalf of clients | | | 279,132 | | | | 267,097 | | | | 245,112 | | | | 235,791 | | | | 240,524 | |
| Acquisition of derivatives | | | 202,608 | | | | 218,711 | | | | 200,734 | | | | 226,708 | | | | 237,635 | |
| Sale of derivatives | | | 227,950 | | | | 244,042 | | | | 268,444 | | | | 288,587 | | | | 325,240 | |
| | | | | | | | | | | | | | | | | | | | | |
| Total on behalf of third parties | | | 903,808 | | | | 878,479 | | | | 927,725 | | | | 1,047,272 | | | | 1,150,474 | |
| | | | | | | | | | | | | | | | | | | | | |
| Proprietary record accounts | | | | | | | | | | | | | | | | | | | | |
| | | | | | | | | | | | | | | | | | | | | |
| Contingent assets and liabilities | | | 433 | | | | 492 | | | | 2,047 | | | | 326 | | | | 448 | |
| | | | | | | | | | | | | | | | | | | | | |
| Credit commitments | | | | | | | | | | | | | | | | | | | | |
| Trusts | | | 135,613 | | | | 135,497 | | | | 133,983 | | | | 135,503 | | | | 132,085 | |
| Mandates | | | 252 | | | | 247 | | | | 290 | | | | 277 | | | | 265 | |
| | | | | | | | | | | | | | | | | | | | | |
| Assets in custody or under administration | | | 3,359,287 | | | | 3,193,157 | | | | 3,406,089 | | | | 3,298,168 | | | | 3,757,406 | |
| | | | | | | | | | | | | | | | | | | | | |
| Credit commitments | | | 144,283 | | | | 132,353 | | | | 159,145 | | | | 153,560 | | | | 158,421 | |
| | | | | | | | | | | | | | | | | | | | | |
| Collateral received | | | 55,814 | | | | 51,680 | | | | 98,230 | | | | 56,094 | | | | 93,842 | |
| | | | | | | | | | | | | | | | | | | | | |
| Collateral received and sold or pledged as guarantee | | | 11,853 | | | | 26,794 | | | | 70,679 | | | | 33,660 | | | | 66,869 | |
| | | | | | | | | | | | | | | | | | | | | |
| Uncollected interest earned on past due loan portfolio | | | 2,675 | | | | 1,427 | | | | 1,708 | | | | 1,704 | | | | 2,078 | |
| | | | | | | | | | | | | | | | | | | | | |
| Other record accounts | | | 703,793 | | | | 690,975 | | | | 612,167 | | | | 606,796 | | | | 560,285 | |
| | | | | | | | | | | | | | | | | | | | | |
| | | | 4,414,003 | | | | 4,232,622 | | | | 4,484,338 | | | | 4,286,088 | | | | 4,771,699 | |
| | | | | | | | | | | | | | | | | | | | | |
| | | | 5,317,811 | | | | 5,111,101 | | | | 5,412,063 | | | | 5,333,360 | | | | 5,922,173 | |
| | 1Q.15| EARNINGS RELEASE | 35 |
| | | |
These consolidated financial statements were approved by the Board of Directors and signed on its behalf by
| MARCOS A. MARTÍNEZ GAVICA | | PEDRO JOSÉ MORENO CANTALEJO |
| Executive President and Chief Executive Officer | | Vice President of Administration and Finance |
| EMILIO DE EUSEBIO SAIZ | JESÚS GONZÁLEZ DEL REAL | JUAN RAMÓN JIMÉNEZ LORENZO |
| Deputy General Director of Intervention and Control Management | Executive Director - Controller | Executive Director of Internal Audit |
The accompanying notes are part of these consolidated financial statements
www.santander.com.mx
| | 1Q.15| EARNINGS RELEASE | 36 |
| | | |
| Grupo Financiero Santander México | | | | | | | | | | | | | | | | | | |
| Consolidated statement of income | | | | | | | | | | | | | | | | | | |
| Millions of mexican pesos | | | | | | | | | | | | | | | | | | |
| | | | | | | | | | | | | | | | | | | |
| | | 2015 | | | | | | | | | | | | | | | 2014 | |
| | | | 1 | Q | | | 12 | M | | | 4 | Q | | | 3 | Q | | | 2 | Q | | | 1 | Q |
| Interest income | | | 14,821 | | | | 57,857 | | | | 15,043 | | | | 14,527 | | | | 14,543 | | | | 13,744 | |
| Interest expense | | | (4,896 | ) | | | (20,279 | ) | | | (5,244 | ) | | | (5,003 | ) | | | (5,281 | ) | | | (4,751 | ) |
| Net interest income | | | 9,925 | | | | 37,578 | | | | 9,799 | | | | 9,524 | | | | 9,262 | | | | 8,993 | |
| | | | | | | | | | | | | | | | | | | | | | | | | |
| Provisions for loan losses | | | (3,683 | ) | | | (14,289 | ) | | | (3,334 | ) | | | (3,814 | ) | | | (3,672 | ) | | | (3,469 | ) |
| Net interest income after provisions for loan losses | | | 6,242 | | | | 23,289 | | | | 6,465 | | | | 5,710 | | | | 5,590 | | | | 5,524 | |
| | | | | | | | | | | | | | | | | | | | | | | | | |
| Commission and fee income | | | 4,199 | | | | 16,858 | | | | 4,350 | | | | 4,222 | | | | 4,225 | | | | 4,061 | |
| Commission and fee expense | | | (901 | ) | | | (3,441 | ) | | | (986 | ) | | | (883 | ) | | | (934 | ) | | | (638 | ) |
| Net gain (loss) on financial assets and liabilities | | | 795 | | | | 2,957 | | | | 395 | | | | 651 | | | | 1,358 | | | | 553 | |
| Other operating income | | | 239 | | | | 1,435 | | | | 533 | | | | 240 | | | | 302 | | | | 360 | |
| Administrative and promotional expenses | | | (6,389 | ) | | | (23,820 | ) | | | (6,059 | ) | | | (5,938 | ) | | | (5,921 | ) | | | (5,902 | ) |
| Operating income | | | 4,185 | | | | 17,278 | | | | 4,698 | | | | 4,002 | | | | 4,620 | | | | 3,958 | |
| | | | | | | | | | | | | | | | | | | | | | | | | |
| Equity in results of associated companies | | | 19 | | | | 78 | | | | 21 | | | | 24 | | | | 16 | | | | 17 | |
| | | | | | | | | | | | | | | | | | | | | | | | | |
| Operating income before income taxes | | | 4,204 | | | | 17,356 | | | | 4,719 | | | | 4,026 | | | | 4,636 | | | | 3,975 | |
| | | | | | | | | | | | | | | | | | | | | | | | | |
| Current income taxes | | | (987 | ) | | | (2,133 | ) | | | 71 | | | | (624 | ) | | | (818 | ) | | | (762 | ) |
| Deferred income taxes (net) | | | (2 | ) | | | (1,208 | ) | | | (966 | ) | | | (158 | ) | | | (130 | ) | | | 46 | |
| | | | | | | | | | | | | | | | | | | | | | | | | |
| Income from continuing operations | | | 3,215 | | | | 14,015 | | | | 3,824 | | | | 3,244 | | | | 3,688 | | | | 3,259 | |
| | | | | | | | | | | | | | | | | | | | | | | | | |
| Consolidated net income | | | 3,215 | | | | 14,015 | | | | 3,824 | | | | 3,244 | | | | 3,688 | | | | 3,259 | |
| | | | | | | | | | | | | | | | | | | | | | | | | |
| Non-controlling interest | | | 0 | | | | (1 | ) | | | 0 | | | | 0 | | | | (1 | ) | | | 0 | |
| Net income | | | 3,215 | | | | 14,014 | | | | 3,824 | | | | 3,244 | | | | 3,687 | | | | 3,259 | |
| | 1Q.15| EARNINGS RELEASE | 37 |
| | | |
These consolidated financial statements were approved by the Board of Directors and signed on its behalf by
| MARCOS A. MARTÍNEZ GAVICA | | PEDRO JOSÉ MORENO CANTALEJO |
| Executive President and Chief Executive Officer | | Vice President of Administration and Finance |
| EMILIO DE EUSEBIO SAIZ | JESÚS GONZÁLEZ DEL REAL | JUAN RAMÓN JIMÉNEZ LORENZO |
| Deputy General Director of Intervention and Control Management | Executive Vice President of Accounting | Executive Director of Internal Audit |
The accompanying notes are part of these consolidated financial statements
www.santander.com.mx
| | 1Q.15| EARNINGS RELEASE | 38 |
| | | |
| Grupo Financiero Santander México | | | |
| Consolidated statements of changes in stockholders’ equity | | |
| From January 1st to March 31, 2015 | | | | | | |
| Millions of mexican pesos | | | | | | |
| | | Paid-in capital | | Other capital | | | | |
| CONCEPT | | Capital stock | | Additional paid-in capital | | Capital reserves | | Retained earnings | | Result from valuation of securities available for sale, net | | Result from the valuation of cash flow hedge instruments | | Net income | | Non-controlling interest | | Total stockholders' equity |
| | | | | | | | | | | | | | | | | | | |
| BALANCE AS OF DECEMBER 31, 2014 | | 36,357 | | 11,783 | | 1,944 | | 41,553 | | (543) | | 266 | | 14,014 | | 10 | | 105,384 |
| MOVEMENTS INHERENT TO THE SHAREHOLDERS' DECISIONS | | | | | | | | | | | | | | | | | | |
| Transfer of prior year's net income | | | | | | | | 14,014 | | | | | | (14,014) | | | | 0 |
| TOTAL | | 0 | | 0 | | 0 | | 14,014 | | 0 | | 0 | | (14,014) | | 0 | | 0 |
MOVEMENTS INHERENT TO THE RECOGNITION OF THE COMPREHENSIVE INCOME | | | | | | | | | | | | | | | | |
| Result from valuation of cash flow hedge instruments, net | | | | | | | | | | | | 390 | | | | | | 390 |
| Recognition of share-based payments | | | | 33 | | | | | | | | | | | | | | 33 |
| Shares held by treasury | | | | (25) | | | | | | | | | | | | | | (25) |
Recoveries of allowance for loan losses previously applied to retained earnings | | | | | | | | 3 | | | | | | | | | | 3 |
Share of comprehensive income of associated companies accounted by the equity method | | | | | | 4 | | | | | | | | (1) | | 3 |
| Net income | | | | | | | | | | | | | | 3,215 | | | | 3,215 |
| | | | | | | | | | | | | | | | | | | |
| | | | | | | | | | | | | | | | | | | |
| TOTAL | | 0 | | 8 | | 0 | | 7 | | 0 | | 390 | | 3,215 | | (1) | | 3,619 |
| | | | | | | | | | | | | | | | | | | |
| BALANCE AS OF MARCH 31, 2015 | | 36,357 | | 11,791 | | 1,944 | | 55,574 | | (543) | | 656 | | 3,215 | | 9 | | 109,003 |
| | 1Q.15| EARNINGS RELEASE | 39 |
| | | |
These consolidated financial statements were approved by the Board of Directors and signed on its behalf by
| MARCOS A. MARTÍNEZ GAVICA | | PEDRO JOSÉ MORENO CANTALEJO |
| Executive President and Chief Executive Officer | | Vice President of Administration and Finance |
| EMILIO DE EUSEBIO SAIZ | JESÚS GONZÁLEZ DEL REAL | JUAN RAMÓN JIMÉNEZ LORENZO |
| Deputy General Director of Intervention and Control Management | Executive Vice President of Accounting | Executive Director of Internal Audit |
The accompanying notes are part of these consolidated financial statements
www.santander.com.mx
| | 1Q.15| EARNINGS RELEASE | 40 |
| | | |
| Grupo Financiero Santander México | | | | | | |
| Consolidated statement of cash flows | | | | | | |
| From January 1st to March 31, 2015 | | | | | | |
| Millions of mexican pesos | | | | | | |
| | | | | | | |
| OPERATING ACTIVITIES | | | | | | |
| Net income | | | | | | 3,215 | |
| Adjustment for line items that do not require cash flows | | | | | | | |
| Result from valuation associated with operating activities | | | (915 | ) | | | | |
| Equity in income of unconsolidated subsidiaries and associates | | | (19 | ) | | | | |
| Depreciation of property, furniture and fixtures | | | 211 | | | | | |
| Amortizations of intangible assets | | | 288 | | | | | |
| Recognition of share-based payments | | | 33 | | | | | |
| Current and deferred income taxes | | | 989 | | | | | |
| Deferred employee profit sharing | | | 1 | | | | 588 | |
| | | | | | | | 3,803 | |
| | | | | | | | | |
| OPERATING ACTIVITIES | | | | | | | | |
| Margin accounts | | | | | | | 11 | |
| Investment in securities | | | | | | | (68,164 | ) |
| Debtors under sale and repurchase agreements | | | | | | | (2,145 | ) |
| Derivatives-asset | | | | | | | (2,547 | ) |
| Loan portfolio-net | | | | | | | (8,767 | ) |
| Accrued income receivable from securitization transactions | | | | | | | (1 | ) |
| Foreclosed assets | | | | | | | (26 | ) |
| Other operating assets | | | | | | | (42,695 | ) |
| Deposits | | | | | | | 2,921 | |
| Bank and other loans | | | | | | | 17,973 | |
| Creditors under sale and repurchase agreements | | | | | | | 43,940 | |
| Collateral sold or pledged as guarantee | | | | | | | 14,758 | |
| Derivatives-liability | | | | | | | (2,446 | ) |
| Other operating liabilities | | | | | | | 47,544 | |
| Payments of income taxes | | | | | | | (417 | ) |
| | | | | | | | | |
| Net cash provided by (used in) operating activities | | | | | | | 3,742 | |
| | | | | | | | | |
| INVESTING ACTIVITIES | | | | | | | | |
| Proceeds from disposal of property, furniture and fixtures | | | | | | | 2 | |
| Payments for acquistion of property, furniture and fixtures | | | | | | | (322 | ) |
| Payments for acquisition of intangible assets | | | | | | | (548 | ) |
| | | | | | | | | |
| Net cash provided by (used in) investing activities | | | | | | | (868 | ) |
| | | | | | | | | |
| FINANCING ACTIVITIES | | | | | | | | |
| | | | | | | | | |
| Payments associated for purchase of treasury shares | | | | | | | (25 | ) |
| Recovery of reserves previously applied to retained earnings | | | | | | | 3 | |
| | | | | | | | | |
| Net cash used in financing activities | | | | | | | (22 | ) |
| | | | | | | | | |
| Net increase in cash and cash equivalents | | | | | | | 2,852 | |
| | | | | | | | | |
| Adjustment to cash flows for changes in exchange rate | | | | | | | 1,320 | |
| | | | | | | | | |
| Funds available at the beginning of the year | | | | | | | 101,198 | |
| | | | | | | | | |
| Funds available at the end of the year | | | | | | | 105,370 | |
| | 1Q.15| EARNINGS RELEASE | 41 |
| | | |
These consolidated financial statements were approved by the Board of Directors and signed on its behalf by
| MARCOS A. MARTÍNEZ GAVICA | | PEDRO JOSÉ MORENO CANTALEJO |
| Executive President and Chief Executive Officer | | Vice President of Administration and Finance |
| EMILIO DE EUSEBIO SAIZ | JESÚS GONZÁLEZ DEL REAL | JUAN RAMÓN JIMÉNEZ LORENZO |
| Deputy General Director of Intervention and Control Management | Executive Vice President of Accounting | Executive Director of Internal Audit |
The accompanying notes are part of these consolidated financial statements
www.santander.com.mx
| | 1Q.15| EARNINGS RELEASE | 42 |
| | | |
NOTES TO CONSOLIDATED FINANCIAL STATEMENTS OF GRUPO FINANCIERO SANTANDER MÉXICO
| § | Significant accounting policies |
| § | Consolidated balance sheet and consolidated income statement by segment |
| § | Annex 1. Loan portfolio rating |
| § | Annex 2. Financial ratios according to CNBV |
| § | Notes to consolidated financial statements |
The information contained in this report and the financial statements of the Group’s subsidiaries may be consulted on the Internet website: www.santander.com.mx or through the following direct access:
http://www.santander.com.mx/ir/english/financial/quarterly.html
There is also information on Santander on the CNBV Website: www.cnbv.gob.mx
| | 1Q.15| EARNINGS RELEASE | 43 |
| | | |
Significant accounting policies
The significant accounting policies applied by Santander Mexico are in conformity with the accounting criteria established by the Mexican National Banking and Securities Commission (CNBV or the Commission) in the General Provisions Applicable to Financial Groups, Credit Institutions, Brokerage House and Regulated Multiple Purpose Financing Entities (Provisions), in its circulars and in general and specific official mandates, which require that management make certain estimates and utilize certain assumptions to determine the valuation of items included in the consolidated financial statements and to make required disclosures. Although the actual results may differ, management believes that the estimates and assumptions utilized were appropriate under the circumstances.
Based on accounting criterion A-1 (Basic scheme of the set of accounting criteria applicable to credit institutions) of the Commission, the accounting of the Financial Group shall be in conformity with Mexican Financial Reporting Standards (MFRS) as promulgated by the Mexican Board of Financial Reporting Standards (CINIF), except when the Commission believes that a specific regulation or accounting treatment should be applied on the basis that the institutions its rules carry out specialized operations.
New accounting principles
Modifications in accounting criteria issued by the Commission
On May 19, 2014 several amendments to the accounting criteria for credit institutions were published in the Federal Official Gazette. These modifications reflect the constant updating of the accounting criteria issued by the Commission, and are also intended to achieve consistency with international accounting regulations. These modifications will be in effect as of June 1, 2015.
The most important changes are described below:
| | a. | Accounting Criterion C-5, Consolidation of special-purpose entities, is eliminated. |
| | b. | NIF C-21, Agreements with joint control, is added as part of the accounting criteria of the Commission due to the enactment of such standard by the CINIF. |
| | c. | For the consolidated financial statements, it is established that those special-purpose entities (“SPE”) created before January 1, 2009 in which control was maintained,will not be required to apply the provisions contained in NIF B-8, Consolidated or combined financial, in relation to their consolidation. |
| | d. | It is established that overdrafts on checking accounts of customers who do not have a credit line for such purposes, will be classified as overdue debts and at the same time as such classification an estimate must be established for the total amount of such overdraft at the time this occurs. |
| | e. | It is established that if the balance of foreign currencies to be received offset with foreign currencies to be delivered should reach a negative balance, such item must be presented under the heading of “Other accounts payable”. |
| | f. | It is established that if any item of restricted funds available should reach a negative balance, such item must be presented under the heading “Other accounts payable”. Previously, restricted funds available were not considered for such presentation. |
| | 1Q.15| EARNINGS RELEASE | 44 |
| | | |
| | g. | Credit consolidation – The integration into a single loan, two or more loans from the same entity to the same borrower. |
| | h. | The assumptions to consider that there is sustained payment of the credit are specified for credits with a single payment of principal at maturity: |
| | i. | It is clarified that the advance payments of restructured or renewed credits, different from those with a single payment of principal at maturity, regardless of whether the interest is paid periodically or at maturity, are not considered as sustained payments. |
| | j. | The extension of the credit term is incorporated as a restructuring operation. |
| | k. | It is established that commissions and charges different from those collected for granting the credit will be recognized in results of the year on the date that they are accrued and, if part or all of the consideration received for the collection of the respective commission or tariff is received in advance of the accrual of the respective income, such advance must be recognized as a liability under the heading “Deferred credits and advance collections”. |
| | l. | It is established that the immediately due and payable notes referred to in Accounting Criterion B-1, Funds available, will be reported as overdue portfolio when they were not collected within the deadlines established. |
| | m. | It is established that payments which were not fully settled under the terms originally agreed and present 90 or more days in arrears, of credits granted to individuals for remodeling or improvement of the home for nonprofit purposes which are backed by the savings of the borrower’s housing subaccount, will be considered as overdue portfolio. |
| | n. | The transfer to overdue portfolio of the credits referred to in the preceding point will be subject to the exceptional term of 180 or more days in arrears as of the date on which: |
| | i. | The credit resources are applied to the purpose for which they were granted, or |
| | ii. | The borrower begins a new employment relationship for which he has a new employer. |
| | o. | It will be considered that credits different from those with a single payment of principal at maturity or different from those granted under a line of credit which are restructured or renewed, without at least 80% of the original term of the credit having elapsed, remain valid, only when: |
| | i. | The borrower has paid the total amount of the interest accrued at the date of the renewal or restructuring; |
| | ii. | The borrower has paid the principal of the original amount of the credit which should have been paid at the date of the renewal or restructuring, and |
| | iii. | There was no extension of any grace period which might have been established in the original conditions of the credit. |
| | 1Q.15| EARNINGS RELEASE | 45 |
| | | |
| | p. | Current credits with partial periodic payments of principal and interest which are restructured or renewed on more than one occasion, may remain in the current portfolio if, apart from having elements to justify the payment capacity of the debtor, the borrower also fulfills the conditions established in the preceding point. |
| | q. | If different credits granted by the same institution to the same borrower are consolidated by means of restructuring or renewal, each of the consolidated credits must be analyzed as if they were restructured or renewed separately and, if as a result of such analysis it is concluded that one or more of such credits would have been transferred to overdue portfolio as a result of such restructuring or renewal, then the total balance of the consolidated credit must be transferred to overdue portfolio. |
| | r. | With regard to the issue of disclosures for the credit portfolio, new requirements are incorporated, as follows: |
| | i. | Composition of the restricted and unrestricted current and overdue portfolio for medium and residential portfolio, low-income housing and remodeling or improvement guaranteed by the housing subaccount. |
| | ii. | Identification by type of credit by term for the medium and residential portfolio, low-income housing portfolio and remodeling or improvement guaranteed by the housing subaccount. |
| | iii. | Total amount of home loans backed by the housing subaccount, itemized into current and overdue portfolio and specifying the percentage it represents of total home loans. |
| | iv. | Total accrued amount of the restructuring or renewal by type of credit, differentiating those originated in the year by now including a detail of those consolidated credits which as a result of a restructuring or renewal were transferred to overdue portfolio, and for restructured credits to which the criteria for transfer to overdue portfolio were not applied. |
| | s. | The treatment is added for securitization vehicles made and recognized prior to January 1, 2009, by establishing that it will not be necessary to reevaluate the transfer of financial assets recognized prior to such date. The principal effects that this exception might have on the financial statements must be disclosed, as well as the effects of the recognition of the adjustments for valuation of the benefits and of the asset or liability recognized for administration of transferred financial assets. |
| | t. | The definitions of “Agreement with joint control”, “Control”, “Joint control” are incorporated, and the definitions of “Associated party”, “Significant influence” and “Subsidiary” are modified in Accounting Criterion C-3, Related parties. |
| | u. | Related parties now include individuals or business entities which directly or indirectly, through one or more intermediaries, exert significant influence over the entity, are significantly influenced by the entity, or agreements with common control in which it participates are under significant common influence of the entity. |
| | v. | As an amendment to Accounting Criterion C-4, Information by segments, the purchase and sale of foreign currency is incorporated within the segment of treasury and investment banking operations. |
| | 1Q.15| EARNINGS RELEASE | 46 |
| | | |
Mexican Financial Reporting Standards (NIF) applicable to the Financial Group
During 2014 the following NIFs were issued with effect as of January 1, 2015:
Improvements to NIF 2015 –The following improvements, which result in accounting changes were issued and are effective January 1, 2015:
NIF B-8, Consolidated or Combined Financial Statements– Clarifies the criteria to be evaluated in order to identify an investment entity and indicates that given the nature of the primary activity of an investment entity, it may be difficult for such an entity to exercise control over the entities in which it has invested; therefore, an analysis should be carried out in order to conclude whether the entity exercises control over its investees.
NIF B-16, Financial Statements of Nonprofit Entities– NIF B-16 did not establish how to present other comprehensive income or loss (OCI) in the financial statements of nonprofit entities, for which reason the NIF includes guidance for such entities, but does not require that such amounts be presented separately from other revenues, costs and expenses in the statement of activities.
Bulletin C-9, Liabilities, Provisions, Contingent Assets and Liabilities and Commitments– Clarifies and modifies the accounting treatment for liabilities arising from customer advances denominated in foreign currency. When an entity receives advance collections for sales or services denominated in foreign currency, the changes in exchange rates between the functional currency and the transaction currency do not affect the amount of the advance collection. Accordingly, the balance of the Customer advances liability should not be modified as a result of such changes in exchange rates.
NIF B-13, Events Subsequent to the Date of the Financial Statements and Bulletin C-9, Liabilities, Provisions, Contingent Assets and Liabilities and Commitments –NIF B-13 includes in a footnote the disclosures in the financial statements of an entity when the latter are not prepared on a going concern basis in accordance with NIF A-7, Presentation and Disclosure. Such requirement was included as part of the regulatory text in the disclosure standards section of NIF B-13, and as part of Bulletin C-9 to disclose the contingencies arising from the fact that the entity is not operating on a going concern basis. Consequently, Circular 57 Sufficient Disclosure is repealed as a result of the Commercial Bankruptcy Law.
NIF B-15, Conversion of Foreign Currencies – The definition of foreign operations was modified to clarify that it should not only be understood as a legal entity or as a cash generating unit whose operations are based on or carried out in an economic environment or currency different from those of the reporting entity, but also to include legal entities or cash generating units which, in relation to the reporting entity (parent or holding company), that operate using a currency different from that of the reporting entity, even though it operates in the same country.
| a. | Effective as of January 1, 2016: |
NIF D-3, Employee Benefits
| b. | Effective as of January 1, 2018: |
NIF C-3, Accounts Receivable
NIF C-20, Financial Instruments Receivable
NIF C-9, Provisions, Contingencies and Commitments
NIF C-19, Financial Instruments Payable
| | 1Q.15| EARNINGS RELEASE | 47 |
| | | |
| Grupo Financiero Santander México | | | |
| Earnings per ordinary share and earnings per diluted share | | | |
| (Millions of Mexican pesos, except shares and earnings per share) | | | |
| | | MARCH 2015 | | | MARCH 2014 | | | MARCH 2013 | |
| | | | | | | | | | | | | | | | | | | | | | | | | | | | |
| | | Earnings | | | Shares -weighted- | | | Earnings per share | | | | | | Shares -weighted- | | | Earnings per share | | | | | | Shares -weighted- | | | Earnings per share | |
| | | Earnings | | | Earnings | |
| | | | | | | |
| | | | | | | | | | | | | | | | | | | | | | | | | | | | |
| Earnings per share | | | 3,215 | | | | 6,778,124,888 | | | | 0.47 | | | | 3,259 | | | | 6,774,977,516 | | | | 0.48 | | | | 4,717 | | | | 6,772,993,313 | | | | 0.70 | |
| | | | | | | | | | | | | | | | | | | | | | | | | | | | | | | | | | | | | |
| | | | | | | | | | | | | | | | | | | | | | | | | | | | | | | | | | | | | |
| Treasury shares | | | | | | | 8,270,025 | | | | | | | | | | | | 11,417,397 | | | | | | | | | | | | 13,401,600 | | | | | |
| | | | | | | | | | | | | | | | | | | | | | | | | | | | | | | | | | | | | |
| Diluited earnings per share | | | 3,215 | | | | 6,786,394,913 | | | | 0.47 | | | | 3,259 | | | | 6,786,394,913 | | | | 0.48 | | | | 4,717 | | | | 6,786,394,913 | | | | 0.70 | |
| | | | | | | | | | | | | | | | | | | | | | | | | | | | | | | | | | | | | |
| Plus loss / less (profit): | | | | | | | | | | | | | | | | | | | | | | | | | | | | | | | | | | | | |
| | | | | | | | | | | | | | | | | | | | | | | | | | | | | | | | | | | | | |
| Discontinued operations | | | | | | | | | | | | | | | | | | | | | | | | | | | (48 | ) | | | | | | | | |
| Continued fully diluted earnings per share | | | 3,215 | | | | 6,786,394,913 | | | | 0.47 | | | | 3,259 | | | | 6,786,394,913 | | | | 0.48 | | | | 4,669 | | | | 6,786,394,913 | | | | 0.69 | |
| | | | | | | | | | | | | | | | | | | | | | | | | | | | | | | | | | | | | |
| | | | | | | | | | | | | | | | | | | | | | | | | | | | | | | | | | | | | |
| | | | | | | | | | | | | | | | | | | | | | | | | | | | | | | | | | | | | |
| Balance outstanding shares as of March 31, 2015 | | | | 6,777,879,670 | | | | | | | | | | | | | | | | | | | | | | | | | | | | | |
| | 1Q.15| EARNINGS RELEASE | 48 |
| | | |
| Grupo Financiero Santander México | |
| Consolidated Balance Sheet by Segment | |
| Millions of Mexican Pesos | |
| | | As of March 31, 2015 | | As of March 31, 2014 |
| | | Retail Banking | | Wholesale Banking | | Corporate Activities | | Retail Banking | | Wholesale Banking | | Corporate Activities |
| Assets | | | | | | | | | | | | |
| Cash and due from banks | | 44,752 | | 23,563 | | 37,055 | | 39,091 | | 33,988 | | 21,329 |
| Margin Accounts | | 0 | | 2,844 | | 0 | | 0 | | 2,894 | | 0 |
| Investment in securities | | 0 | | 198,307 | | 73,269 | | 0 | | 149,621 | | 68,426 |
| Debtors under sale and repurchase agreements | | 0 | | 7,331 | | 0 | | 0 | | 8,413 | | 0 |
| Securities loan | | 0 | | 1 | | 0 | | 0 | | 0 | | 0 |
| Derivatives | | 0 | | 89,721 | | 10,636 | | 0 | | 73,422 | | 456 |
| Valuation adjustment for hedged financial assets | | 0 | | 0 | | 49 | | 0 | | 0 | | 29 |
| Total loan portfolio | | 370,496 | | 104,099 | | 143 | | 318,853 | | 90,231 | | 265 |
| Allowance for loan losses | | (13,195) | | (4,187) | | 0 | | (13,017) | | (3,064) | | 0 |
| Loan Portfolio (net) | | 357,301 | | 99,912 | | 143 | | 305,836 | | 87,167 | | 265 |
| Accrued income receivable from securitization transactions | | | | 128 | | | | | | 127 |
| Other receivables (net) | | 1,289 | | 78,478 | | 13,268 | | 1,697 | | 33,281 | | 16,365 |
| Foreclosed assets (net) | | 13 | | 1 | | 369 | | 12 | | 1 | | 331 |
| Properties, furniture and fixtures (net) | | 4,544 | | 766 | | 68 | | 3,974 | | 670 | | 60 |
| Long-term investments in shares | | 0 | | 0 | | 172 | | 0 | | 0 | | 162 |
| Deferred charges, advance payments, intangibles assets | | 0 | | 0 | | 16,737 | | 0 | | 0 | | 18,067 |
| Other assets | | 1,665 | | 809 | | 2,906 | | 1,667 | | 675 | | 1,949 |
| Discontinued operations | | 0 | | 0 | | 0 | | 0 | | 0 | | 0 |
| Total assets | | 409,564 | | 501,733 | | 154,800 | | 352,277 | | 390,132 | | 127,566 |
| | | | | | | | | | | | | |
| Liabilities | | | | | | | | | | | | |
| Deposits | | 347,430 | | 63,521 | | 48,179 | | 307,424 | | 50,321 | | 43,336 |
| Credit instruments issued | | 0 | | 8,089 | | 22,353 | | 0 | | 2,173 | | 20,121 |
| Bank and other loans | | 24,723 | | 71 | | 48,124 | | 16,693 | | 218 | | 25,943 |
| Creditors under sale and repurchase agreements | | 15,936 | | 132,107 | | 0 | | 35,430 | | 79,151 | | 0 |
| Securities loan | | 0 | | 1 | | 0 | | 0 | | 0 | | 0 |
| Collateral sold or pledged as guarantee | | 0 | | 28,835 | | 0 | | 0 | | 17,956 | | 0 |
| Derivatives | | 0 | | 91,732 | | 4,990 | | 0 | | 71,705 | | 2,441 |
| Other payables | | 21,273 | | 77,986 | | 1,234 | | 16,979 | | 60,439 | | 3,650 |
| Subordinated debentures | | | | | | 19,849 | | | | | | 17,043 |
| Deferred revenues | | 661 | | 0 | | 0 | | 846 | | 0 | | 0 |
| Total liabilities | | 410,023 | | 402,342 | | 144,729 | | 377,372 | | 281,963 | | 112,534 |
| Total stockholders' equity | | 45,079 | | 15,960 | | 47,964 | | 40,615 | | 14,960 | | 42,531 |
| Total liabilities and stockholders' equity | | 455,102 | | 418,302 | | 192,693 | | 417,987 | | 296,923 | | 155,065 |
| | 1Q.15| EARNINGS RELEASE | 49 |
| | | |
| Grupo Financiero Santander México |
| Income Statement by Segment |
| Millions of Mexican Pesos |
| | 3M15 | | 3M14 |
| | Retail Banking | Global Wholesale Banking | Corporate Activities | Retail Banking | Global Wholesale Banking | Corporate Activities |
| | | | | | | | |
| Net interest income | 8,736 | 858 | 331 | | 8,000 | 875 | 118 |
| Provisions for loan losses | (3,422) | (261) | 0 | | (3,332) | (137) | 0 |
| Net interest income after provisions for loan losses | 5,314 | 597 | 331 | | 4,668 | 738 | 118 |
| Commission and fee income (expense), net | 3,034 | 288 | (24) | | 3,055 | 400 | (32) |
| Net gain (loss) on financial assets and liabilities | 227 | 373 | 195 | | 220 | 196 | 137 |
| Other operating income (expense) | 306 | (3) | (64) | | 392 | 1 | (33) |
| Administrative and promotional expenses | (5,637) | (659) | (93) | | (5,239) | (609) | (54) |
| Operating income | 3,244 | 596 | 345 | | 3,096 | 726 | 136 |
| Equity in results of associated companies | 0 | 0 | 19 | | 0 | 0 | 17 |
Operating income before income taxes | 3,244 | 596 | 364 | | 3,096 | 726 | 153 |
Segment information has been prepared according to the classifications used in Grupo Santander México at secondary level, based in the type of developed business:
Commercial banking
It includes all the businesses pertaining to customer banking, under the following segments: Individual, Small and Medium-sized Enterprises (Pymes) Institutions, Local Corporate Banking (large enterprises), as well as the contributions of Mutual Funds businesses (after transfer of commissions to distributors).
Global wholesale banking
This area reflects the earnings from Global Corporate Banking, Investment Banking and Treasury.
Corporate activities
It includes non-commercial assets and liabilities, the result from hedging positions, insurance business (net of commissions paid to Commercial Bank) and others. Even though Corporate Banking, by definition, belongs to Commercial Banking, it is separated herein in order to reflect the results from corporate customers.
| | 1Q.15| EARNINGS RELEASE | 50 |
| | | |
| Annex 1 |
| Loan Portfolio Rating |
| | | | | |
| Grupo Financiero Santander México |
| As of March 31, 2015 | |
| Millions of Mexican Pesos | |
| | | | | Allowance for loan losses |
| Category | | Loan portfolio | | Commercial | | Consumer | | Mortgages | | Total |
| | | | | | | | | | | |
| Risk "A" | | 408,790 | | 1,449 | | 1,454 | | 219 | | 3,122 |
| Risk "A-1" | | 325,527 | | 1,012 | | 336 | | 133 | | 1,481 |
| Risk "A-2" | | 83,263 | | 437 | | 1,118 | | 86 | | 1,641 |
| Risk "B" | | 58,800 | | 572 | | 1,820 | | 181 | | 2,573 |
| Risk "B-1" | | 18,716 | | 113 | | 714 | | 51 | | 878 |
| Risk "B-2" | | 22,636 | | 171 | | 530 | | 91 | | 792 |
| Risk "B-3" | | 17,448 | | 288 | | 576 | | 39 | | 903 |
| Risk "C" | | 18,836 | | 450 | | 1,289 | | 271 | | 2,010 |
| Risk "C-1" | | 11,958 | | 298 | | 416 | | 128 | | 842 |
| Risk "C-2" | | 6,878 | | 152 | | 873 | | 143 | | 1,168 |
| Risk "D" | | 13,198 | | 1,502 | | 2,904 | | 865 | | 5,271 |
| Risk "E" | | 7,260 | | 3,615 | | 415 | | 229 | | 4,259 |
| Total rated portfolio | | 506,884 | | 7,588 | | 7,882 | | 1,765 | | 17,235 |
| | | | | | | | | | | |
| Provisions created | | | | | | | | 17,235 |
| Complementary provisions | | | | | | | | 147 |
| Total | | | | | | | | 17,382 |
| Notes: | |
| 1. | The figures used for grading and the creation of provisions correspond to the ones as of the last day of the month of the balance sheet as of March 31, 2014. |
| 2. | Loan Portfolio and the methodology are graded according the rules issued by CNBV. From August 2009, the Bank implemented the rules for grading revolving consumer credit card loans. From March 2011, the Bank implemented the rules for grading non-revolving consumer and mortgage loans. From September, 2011, the bank implemented new rules for grading loans to States and Municipalities. From June 2013, the bank implemented new rules for grading commercial loans. From June 2014, the bank implementes new rules for grading financial institutions loans. |
| 3. | Allowance created in excess are explained by the following: The Bank maintains an additional allowance to the ones necessary pursuant to the loan portfolio grading process authorized by the Commisssion, in order to cover potential losses from mortgages portfolio, the valuation of assets determined in the Due Diligence and authorized by the Commisssion in Official Letter No. 601DGSIF"C"-38625, for an amount of Ps.5.5 million, as well as to cover the cost of Governmental Programs. |
| | 1Q.15| EARNINGS RELEASE | 51 |
| | | |
| Banco Santander (México) | | | | | | | | | | | | | | | |
| Percentages | | | 1Q15 | | | | 4Q14 | | | | 1Q14 | | | | 2015 | | | | 2014 | |
| | | | | | | | | | | | | | | | | | | | | |
| Past Due Loans Ratio | | | 3.7 | | | | 3.7 | | | | 3.4 | | | | 3.7 | | | | 3.4 | |
| | | | | | | | | | | | | | | | | | | | | |
| Past Due Loans Coverage | | | 99.6 | | | | 97.1 | | | | 115.4 | | | | 99.6 | | | | 115.4 | |
| | | | | | | | | | | | | | | | | | | | | |
| Operative Efficiency | | | 2.6 | | | | 2.6 | | | | 2.8 | | | | 2.6 | | | | 2.8 | |
| | | | | | | | | | | | | | | | | | | | | |
| ROE | | | 12.0 | | | | 14.5 | | | | 13.5 | | | | 12.0 | | | | 13.5 | |
| | | | | | | | | | | | | | | | | | | | | |
| ROA | | | 1.3 | | | | 1.6 | | | | 1.6 | | | | 1.3 | | | | 1.5 | |
| | | | | | | | | | | | | | | | | | | | | |
| Capitalization Ratio | | | | | | | | | | | | | | | | | | | | |
| Credit Risk | | | 24.2 | | | | 23.7 | | | | 23.9 | | | | 24.2 | | | | 23.9 | |
| Credit, Market and operations risk | | | 16.6 | | | | 16.2 | | | | 15.7 | | | | 16.6 | | | | 15.7 | |
| | | | | | | | | | | | | | | | | | | | | |
| Liquidity | | | 108.9 | | | | 92.2 | | | | 109.8 | | | | 108.9 | | | | 109.8 | |
| | | | | | | | | | | | | | | | | | | | | |
| NIM (Net Interest Margin) | | | 2.8 | | | | 3.1 | | | | 3.0 | | | | 2.8 | | | | 3.0 | |
Note: ratios are prepared according to the general rules applicable to financial information of credit institutions, issued by the CNBV, according to Annex 34 of the CUB (Circular Única de Bancos).
NPL RATIO = Balance of past due loans portfolio as of the end of the quarter / Balance of loans portfolio as of the end of the quarter.
COVERAGE RATIO= Balance of provision for loan losses as of the end of the quarter / Balance of past due loans portfolio as of the end of the quarter.
EFFICIENCY RATIO = Administration and promotion expenses of the quarter, annualized / Total Average Assets.
ROAE = Annualized quarterly net earnings/ Average stockholders’ equity.
ROAA = Annualized quarterly net earnings /Total average assets.
BREAKDOWN OF CAPITALIZATION RATIO: (1)=Net Capital/ Assets subject to credit risk. (2)=Net Capital / Assets subject to credit, market and operation risk.
LIQUIDITY = Current Assets/ Current Liabilities.
Where: Current Assets = Availabilities + securities for trade + securities available for sale.
Current liabilities= Demand deposits + bank loans and loans from other entities, payable on demand, + short term bank loans and loans from other entities.
NIM = Quarterly Net Interest Margin, adjusted by annualized credit risks, / Average interest-earning assets.
Where: Average interest-earning assets = availabilities, investments in securities, transactions with securities and derivatives and loan portfolio.
Notes:
Average = ((Balance of the corresponding quarter + balance of the previous quarter) / 2).
| | 1Q.15| EARNINGS RELEASE | 52 |
| | | |
Annualized figures = (Flow of the corresponding quarter * 4).
| Grupo Financiero Santander México | | | |
| Notes to financial statements as of March 31, 2015 | | | |
| (Millions of pesos, except for number of shares) | | | |
| | | | |
| 1. Investment in securities | | | |
| | | | |
| Financial instruments are constituted as follows: | | | |
| | | Accounting value | |
| Trading Securities: | | | |
| Bank securities | | | 8,614 | |
| Government securities | | | 185,776 | |
| Private securities | | | 1,123 | |
| Shares | | | 3,125 | |
| | | | 198,638 | |
| | | | | |
| Securities available for sale: | | | | |
| Government securities | | | 61,932 | |
| Private securities | | | 5,476 | |
| Shares | | | 28 | |
| | | | 67,436 | |
| | | | | |
| Securities held until maturity: | | | | |
| Government securities (Special cetes) | | | 5,502 | |
| | | | 5,502 | |
| | | | | |
| Total | | | 271,576 | |
| 2. Sale and repurchase agreements | | | |
| The sale and repurchase agreements is constituted as follows: | |
| | | Net Balance | |
| Debit Balances | | | |
| Bank securities | | | 5,727 | |
| Government securities | | | 1,311 | |
| Private securities | | | 293 | |
| Total | | | 7,331 | |
| | | | | |
| Credit balances | | | | |
| Government securities | | | 147,188 | |
| Private securities | | | 855 | |
| Total | | | 148,043 | |
| | | | (140,712 | ) |
| 3. Investment in securities different to government securities |
| | | | |
| The table below lists the investments in debt securities of a same issuer, with positions equal or greater than 5% of Tier 1 Capital of the Bank. |
| | 1Q.15| EARNINGS RELEASE | 53 |
| | | |
| Issuer / Series | Maturity date | % Rate | Book value |
| | | | |
| PEM0001 150716 | 16-jul-15 | 9.91% | 1,335 |
| PEMEC29 200723 | 23-jul-20 | 3.50% | 456 |
| PEMEX 020622 | 02-jun-22 | 8.25% | 930 |
| PEMEX 10-2 | 27-ene-20 | 9.10% | 1,367 |
| PEMEX 13-2 | 12-sep-24 | 7.19% | 147 |
| PEMEX 240225 | 24-feb-25 | 5.50% | 313 |
| PEMEX3 030519 | 03-may-19 | 8.00% | 573 |
| PEMEX3 210121 | 21-ene-21 | 5.50% | 501 |
| | | | |
| | | Total | 5,622 |
| | | | |
| Tier 1 Capital as of March 31, 2015 | | 96,517 |
| 5 % of Tier 1 Capital | | | 4,826 |
| 4. Derivatives | | | | | | |
| | | | | | | |
| The nominal value of the different derivative financial instruments agreements for trading and hedging purposes, as of March 31, 2015, are as follows: | |
| | | | | | | |
Trading: Swaps | | | | | | |
| Interest rate | | | 3,790,282 | | | | |
| Cross currency | | | 610,293 | | | | |
| | | | | | | | |
| Futures | | Buy | | | Sell | |
| Interest rate | | | 20 | | | | 158,375 | |
| Foreign currency | | | 3,816 | | | | 4,030 | |
| Index | | | 8,486 | | | | 2,533 | |
| Equity | | | 2 | | | | 0 | |
| | | | | | | | | |
| Forward contracts | | | | | | | | |
| Foreign currency | | | 279,152 | | | | 10,241 | |
| Equity | | | 2,094 | | | | 10,923 | |
| | | | | | | | | |
| Options | | Long | | | Short | |
| Interest rate | | | 132,787 | | | | 165,366 | |
| Foreign currency | | | 46,368 | | | | 51,423 | |
| Index | | | 133,339 | | | | 129,598 | |
| Equity | | | 266 | | | | 2,057 | |
| Total trading derivatives | | | 5,006,905 | | | | 534,546 | |
| | | | | | | | | |
Hedging: Cash flow | | | | | | | | |
| Interest rate swaps | | | 2,050 | | | | | |
| Cross currency swaps | | | 41,254 | | | | | |
| Foreign exchange forwards | | | 52,084 | | | | | |
| | | | | | | | | |
| Fair value | | | | | | | | |
| Interest rate swaps | | | 3,669 | | | | | |
| Cross currency swaps | | | 6,335 | | | | | |
| Total hedging derivatives | | | 105,392 | | | | | |
| Total financial instruments | | | 5,112,297 | | | | | |
| | 1Q.15| EARNINGS RELEASE | 54 |
| | | |
| 5. Performing loan portfolio | | | | | | | | | | | | |
| The loan portfolio, by type of loan and currency, as of March 31, 2015, is constituted as follows: | |
| | | Amount |
| | | Pesos | | | USD | | | UDIS | | | Total | |
| | | | | | | | | | | | | |
| Commercial or business activity | | | 169,412 | | | | 52,471 | | | | 1 | | | | 221,884 | |
| Financial entities | | | 5,418 | | | | 26 | | | | 0 | | | | 5,444 | |
| Government entities | | | 34,429 | | | | 16,164 | | | | 0 | | | | 50,593 | |
| Commercial loans | | | 209,259 | | | | 68,661 | | | | 1 | | | | 277,921 | |
| Consumer loans | | | 74,714 | | | | 0 | | | | 0 | | | | 74,714 | |
| Mortgage loans | | | 99,501 | | | | 876 | | | | 4,268 | | | | 104,645 | |
| Total performing loan portfolio | | | 383,474 | | | | 69,537 | | | | 4,269 | | | | 457,280 | |
6. Non-performing loan portfolio
| | | Amount |
| | | Pesos | | | USD | | | UDIS | | | Total | |
| Commercial or business activity | | | 8,127 | | | | 1,025 | | | | 0 | | | | 9,152 | |
| Government entities | | | 3 | | | | 0 | | | | 0 | | | | 3 | |
| Commercial loans | | | 8,130 | | | | 1,025 | | | | 0 | | | | 9,155 | |
| Consumer loans | | | 2,799 | | | | 0 | | | | 0 | | | | 2,799 | |
| Mortgage loans | | | 3,859 | | | | 69 | | | | 1,576 | | | | 5,504 | |
| Total non-performing loan portfolio | | | 14,788 | | | | 1,094 | | | | 1,576 | | | | 17,458 | |
| | | | | | | | | | | | | | | | | |
| The analysis of movements in non-performing loans from January 1 to March 31, 2015, is as follows: | |
| | | | | | | |
| Balance as of December 31, 2014 | | | | | | 17,455 | |
| | | | | | | | |
| Transfer from performing loan portfolio to non-performing loan portfolio | | | | | | 5,478 | |
| | | | | | | | |
| Collections: | | | | | | | |
| Cash | | | (363 | ) | | | | |
| Transfer to performing loan portfolio | | | (1,118 | ) | | | (1,481 | ) |
| | | | | | | | | |
| Restructured loans | | | | | | | (980 | ) |
| | | | | | | | | |
| Write-offs | | | | | | | (3,284 | ) |
| Balance as of March 31, 2015 | | | | | | | 17,458 | |
| 7. Allowance for loan losses | | | | | | | |
| | | | | | | | |
| The movement in the allowance for loan losses, from January 1st. to March 31, 2015, is as follows: |
| | | | | | | | |
| | | | | | | | |
| Balance as of December 31, 2014 | 16,951 | | | | | | |
| | | | | | | | |
| | 1Q.15| EARNINGS RELEASE | 55 |
| | | |
| Allowance for loan losses | | | 3,683 | | | | | | | | | | |
| Recoveries credited in results from retained earnings | | | (3 | ) | | | | | | | | | |
| Write-offs | | | (3,284 | ) | | | | | | | | | |
| Foreign exchange result | | | 35 | | | | | | | | | | |
| Balance as of March 31, 2015 | | | 17,382 | | | | | | | | | | |
| | | | | | | | | | | | | | |
| The table below presents a summary of write-offs by type of product as of March 31, 2015: | |
| | | | | | | | | | | | | | |
| Product | | Charge-offs | | | Debit Relieves | | | Total | | | % | |
| | | | | | | | | | | | | | |
| First quarter | | | | | | | | | | | | | |
| Commercial loans | | | 783 | | | | 23 | | | | 806 | | | | 25 | % |
| Mortgage loans | | | 85 | | | | 48 | | | | 133 | | | | 4 | % |
| Credit card loans | | | 1,374 | | | | 25 | | | | 1,399 | | | | 43 | % |
| Consumer loans | | | 929 | | | | 17 | | | | 946 | | | | 29 | % |
| Total | | | 3,171 | | | | 113 | | | | 3,284 | | | | 100 | % |
| | | | | | | | | | | | | | | | | |
| Accumulated 2014 | | | | | | | | | | | | | | | | |
| Commercial loans | | | 783 | | | | 23 | | | | 806 | | | | 25 | % |
| Mortgage loans | | | 85 | | | | 48 | | | | 133 | | | | 4 | % |
| Credit card loans | | | 1,374 | | | | 25 | | | | 1,399 | | | | 43 | % |
| Consumer loans | | | 929 | | | | 17 | | | | 946 | | | | 29 | % |
| Total | | | 3,171 | | | | 113 | | | | 3,284 | | | | 100 | % |
| | | | | | | | | | | | | | | | | |
| Commerce Fund | | | | | | | | | | | | | | | | |
| | | | | | | | | | | | | | | | | |
| Pursuant to the CNBV's authorization in Official Bulletin No. 601-I-DGSIF "C" - 38625 issued on March, 2001; as of March 31, 2015, there are MX$9 million in allowances for loan losses from the commerce fund, which resulted from the reestructuring process of Grupo Financiero Serfin. As of December 31 2014, such allowances totaled Mx$10 million. | |
| During the first quarter of 2015, the abovementioned allowances for loan losses had the following breakdown: | |
| | | | | | | | | | | | | | | | | |
Mortgages and commercial loans write-offs | | | (1 | ) | | | | | | | | | | | | |
| Remeasurement of Udis reserves and foreign exchange effect | | | 0 | | | | | | | | | | | | | |
| | | | (1 | ) | | | | | | | | | | | | |
| | | | | | | | | | | | | | | | | |
| As part of the CNBV’s authorization for these reserves, in case there are loan portfolio recoveries from previously written-off loans, these recoveries will be recorded in the consolidated statement of income. During the first quarter of 2015, charges due to income statement due to recoveries of previously written-off loans amounted Mx $3 million. | |
| | 1Q.15| EARNINGS RELEASE | 56 |
| | | |
8. Problematic loans
Loans portfolio was graded according to the general provisions issued by the National Banking and Exchange Commission. The management considers that problematic loans are the ones graded as “D” and “E”, due to their low possibility for the collection of the full amount of principal.
| 9. Programs of benefits to bank debtors with the support of the Federal Government. | |
| As of March 31, 2015, the accounts receivable from the Federal Government are Mx$110 million, regarding the early termination of benefit programs granted to bank debtors. |
| Early termination of the support programs for debtors |
| On July 15, 2010, an Agreement for the early termination of the support programs for bank debtors (the “Agreement”) was entered into. The credit institutions considered to early terminate the following programs, which were created between years 1995- 1998, derived from restructuring of loans, as follows: |
| 1. Support Program for Mortgages Debtors (Support Program); |
| 2. Support Program for the Construction of Housing, in the stage of individual loans (Support Program), and |
| 3. Agreement on benefits for Mortgages Debtors (Discounts Program) |
The credit institutions reached an agreement with the Mexican Treasury Department (Secretaría de Hacienda y Crédito Público (SHCP)) and the CNBV. The banks were represented by the Mexican Bank’s Association (Asociación de Bancos de México, A.C. (ABM)) and it establishes that, for the correct application of the early termination agreement, the credit institutions are to be subject to the supervision and monitoring of the CNBV, and they shall comply with all the comments and corrections made by such CNBV and they shall deliver all the information requested by the CNBV for the fulfillment of the agreement. |
Restructured loans or loans in UDIs granted under the Support Programs for debtors, loans in Mexican pesos; loans in Mexican pesos with right to receive the benefits of the Discounts Program and, loans that, as of December 31, 2010, were current, as well as past due loans that as of the aforementioned date, had been restructured, and those loans that, in order to continue in effect, received a write-off or discount, whatever the amount, were subject to the scheme of early termination, provided that evidence of payments was delivered.
Breakdown of special CETES , of which Ps.3,469 correspond to the early extinction of debtor support programs:
| |
| | | Amount | |
| Government Securities | | | |
Special CETES of credit support programs for Mexican States and municipalities and additional benefits | | $ | 2,406 | |
| Special CETES for housing loan debtor suport programs | | | 3,469 | |
| | | | | |
| Total securities held to maturity (no reserve) | | | 5,875 | |
| | | | | |
| Minus- | | | | |
| Reserve for Special CETES | | | (373 | ) |
| | | | | |
| Total securities held to maturity , net | | $ | 5,502 | |
| | 1Q.15| EARNINGS RELEASE | 57 |
| | | |
| Issue | | | Trust | | | Securitie Number | | Due date | | Price (MXN) | | | Amount | |
| | | | | | | | | | | | | | | |
| B4-170713 | | | | 421-5 | | | | 9,155,840 | | 13-jul-17 | | | 91.97 | | | $ | 842 | |
| B4-170720 | | | | 424-6 | | | | 86,723 | | 20-jul-17 | | | 91.97 | | | | 8 | |
| B4-220707 | | | | 422-9 | | | | 12,762,386 | | 07-jul-22 | | | 91.97 | | | | 1,174 | |
| B4-270701 | | | | 423-2 | | | | 15,292,752 | | 01-jul-27 | | | 91.97 | | | | 1,406 | |
| B4-220804 | | | | 431-2 | | | | 440,294 | | 04-ago-22 | | | 84.21 | | | | 37 | |
| BC-220804 | | | | 431-2 | | | | 71,442 | | 04-ago-22 | | | 29.63 | | | | 2 | |
| | | | | | | | | | | | | | | | | | | |
| | | | | | | | | | | | | | | | | $ | 3,469 | |
| 10. Average interest rates paid on deposits |
| | | | |
| The average interest rates paid on deposits during March 2015, is as follow: |
| | | Pesos | | | USD | |
| | | | | | | |
| Average balance | | | 243,278 | | | | 30,506 | |
| Interest | | | 747 | | | | 8 | |
| Rate | | | 1.2287 | % | | | 0.1063 | % |
| 11. Bank and other loans | | | | | | | | |
| As of march 31, 2015, banks and other loans are constituted as follows: | | | |
| | | | | | Average | | | |
| Liabilities | | Amount | | | rate | | | Maturity |
| | | | | | | | | |
| Loans in mexican pesos | | | | | | | | |
| | | | | | | | | |
| Call money | | | 13,258 | | | | 2.95 | % | | To 1 day |
| Local bank loans | | | 5,500 | | | | 3.45 | % | | To 4 years |
| Public fiduciary funds | | | 5,059 | | | | 3.43 | % | | From 1 day to 16 years |
| Development banking institutions | | | 18,932 | | | | 5.90 | % | | From 1 day to 6 years |
| Total | | | 42,749 | | | | | | | |
| | | | | | | | | | | |
| Loans in foreign currency | | | | | | | | | | |
| | | | | | | | | | | |
| Foreign bank loans | | | 22,136 | | | | 0.80 | % | | From 1 day to 6 years |
| Call money | | | 7,602 | | | | 0.37 | % | | To 1 day |
| Public fiduciary funds | | | 232 | | | | 1.26 | % | | From 27 days to 3 years |
| Development banking institutions | | | 136 | | | | 5.11 | % | | From 1 day to 2 years |
| Total | | | 30,106 | | | | | | | |
| | | | | | | | | | | |
| Total loans | | | 72,855 | | | | | | | |
| Accrued interests | | | 63 | | | | | | | |
| | | | | | | | | | | |
| Total bank and other Loans | | | 72,918 | | | | | | | |
| 12. Current and deferred taxes | | | |
| | | | |
| Current taxes are composed as follows at March 31, 2015 | | | |
| | | | |
| Income taxes | | | (531 | ) |
| Deferred taxes | | | 8 | (1) |
| Total Bank | | | (523 | ) |
| | 1Q.15| EARNINGS RELEASE | 58 |
| | | |
| Current and deferred taxes from other subsidiaries | | | (466 | ) |
| Total Financial Group | | | (989 | ) |
| | | | | |
| (1) Deferred taxes are composed as follows: | | | | |
| | | | | |
| Global provision | | | (236 | ) |
| Fixed assets and deferred charges | | | 93 | |
| Net effect from valuation of financial instruments | | | 74 | |
| Accrued liabilities | | | (98 | ) |
| Others | | | (78 | ) |
| Total Bank | | | (245 | ) |
| Allowance for loan losses of subsidiaries, net | | | 26 | |
| Others, subsidiaries | | | (1,023 | ) |
| Deferred income tax (net), Financial Group | | | (1,242 | ) |
| | | | | |
| As of March 31, 2015, deferred assets and liabilities are registered at 100% | |
| | | | | |
| Remainder of global provisions and allowances for loan losses | | | 8,591 | |
| Other | | | 8,146 | |
| Total deferred income tax (net) | | | 16,737 | |
| | | | | |
| Deferred taxes registered in balance sheet accounts | | | 16,737 | |
| Deferred taxes registered in memorandum accounts | | | 0 | |
| 13. Employee profit sharing | | | |
| As of March 31, 2015, the deffered Employee profit sharing EPS is compromised as follows: | |
| | | | |
| Allowance for loan losses deducting outstanding | | | 1,842 | |
| Fixed assets and deferred charges | | | 676 | |
| Accrued liabilities | | | 425 | |
| Capital losses carryforward | | | 806 | |
| Commissions and interests early collected | | | 122 | |
| Foreclosed assets | | | 52 | |
| Net effect from valuation of financial instruments | | | (706 | ) |
| Deferred EPS asset: | | | 3,217 | |
| | | | | |
| | | | | |
| Net effect from valuation of financial instruments | | | 161 | |
| Labor provisions | | | 7 | |
| Advance prepayments | | | (58 | ) |
| Others | | | (42 | ) |
| Deferred EPS liability | | | 68 | |
| | | | | |
| Less – Reserve | | | (216 | ) |
| | | | | |
| Deferred EPS asset (net) | | | 3,069 | |
| 14. Capitalization Ratio | | | |
| Banco Santander (Mexico), S.A. | | | |
| | 1Q.15| EARNINGS RELEASE | 59 |
| | | |
Table I.1
Form for the disclosure of capital of paid-in capital without considering transiency in the application of adjustments in the regulation
| Reference | Capital Description | Capital |
| | Level 1 (CET 1) Ordinary capital: Instruments and reserves | |
| 1 | Ordinary shares that qualify for level 1 Common Capital plus corresponding premium | 34,798 |
| 2 | Earnings from previous fiscal years | 59,489 |
| 3 | Other elements of other comprehensive income (and other reserves) | 12,877 |
| 4 | Capital subject to gradual elimination of level 1 ordinary capital (only applicable for companies that are not lined to shares) | |
| 5 | Ordinary shares issued by subsidiaries held by third parties (amount allowed in level 1 ordinary capital) | |
| 6 | Level 1 ordinary capital before adjustments to regulation | 107,163 |
| | Level 1 Ordinary capital: adjustments to regulation | |
| 7 | Adjustments due to prudential valuation | |
| 8 | Commercial credit (net of its corresponding deferred profit taxes debited) | 1,735 |
| 9 | Other intangibles other than rights to mortgage rights (net of its corresponding deferred profit taxes debited) | 2,606 |
10 (conservative) | Deferred taxes to profit credited relying on future income excluding those that derive from temporary differences (net of deferred profit taxes debited) | 0 |
| 11 | Results of valuation of cash flow hedging instruments | 0 |
| 12 | Reserves to be constituted | 0 |
| 13 | Benefits over remnant of securitization transactions | 0 |
| 14 | Losses and gains caused for the changes in credit rating of liabilities assessed at a reasonable value | |
| 15 | Pension plan for defined benefits | 0 |
16 (conservative) | Investments in proprietary shares | 9 |
17 (conservative) | Reciprocal investments in ordinary capital | 0 |
18 (conservative) | Investments in capital of banks, financial institutions and insurance companies out of the reach of the regulation consolidation, net of short eligible positions, wherein the institution does not hold more than 10% of the issued capital (amount that exceeds the 10% threshold) | 42 |
19 (conservative) | Significant investments in ordinary shares of banks, financial institutions and insurance companies out of the scope of the regulation consolidation, nets of eligible short positions, wherein the institutions holds more than 10% of the issued capital (amount that exceeds the 10% threshold) | 0 |
20 (conservative) | Rights for mortgage services (amount exceeding the 10% threshold) | 0 |
| 21 | Deferred taxes to profit credited resulting from temporary differences (amount exceeding the 10% threshold, net of deferred taxes debited) | 419 |
| 22 | Amount exceeding the 15% threshold. | |
| 23 | of which: significant investments wherein the institution holds more than 10% of ordinary shares of financial institutions | |
| 24 | of which: rights for mortgage services | |
| 25 | of which: Taxes to profit Deferred credited deriving from temporary differences | |
| | 1Q.15| EARNINGS RELEASE | 60 |
| | | |
| 26 | National regulation adjustments | 23,060 |
| A | of which: Other elements of wholesome profit (and other reserves) | 0 |
| B | of which: investments in subordinated debt | 0 |
| C | of which: profit or increase in the value of assets from the purchase of securitization positions (Originating Institutions) | 0 |
| D | of which: investments in multilateral entities | 0 |
| E | of which: investments in related corporations | 20,620 |
| F | of which: investments in risk capital | 0 |
| G | of which: investments in investment corporations | 0 |
| H | of which: Funding for the purchase of proprietary shares | 0 |
| I | of which: Transactions in breach of provisions | 0 |
| J | of which: Deferred charges and installments | 585 |
| K | of which: Positions in First Losses Schemes | 0 |
| L | of which: Worker's Deferred Profit Sharing | 0 |
| M | of which: Relevant Related Persons | 0 |
| N | of which: Pension plan for defined benefits | 0 |
| O | of witch: Adjustment for capital acknowledgment | 0 |
| P | of which: investments in Clearing Houses | 1,855 |
| 27 | Regulation adjustments that apply to level 1 common stock due to level 1 capital shortage and level 2 capital to cover deductions | 0 |
| 28 | Total regulation adjustments to level 1 Common Capital | 27,871 |
| 29 | Level 1 Common Capital (CET1) | 79,292 |
| | Level 1 additional capital: instruments | |
| 30 | Instruments directly issued that qualify as level 1 additional capital, plus premium | 0 |
| 31 | of which: Qualify as capital under the applicable accounting criteria | 0 |
| 32 | of which: Qualify as liability under the applicable accounting criteria | |
| 33 | Capital instruments directly issued subject to gradual elimination of level 1 additional capital | 0 |
| 34 | Instruments issued of level 1 additional capital and level 1 Common Capital instruments that are not included in line 5 issued by subsidiaries held by third parties (amount allowed at additional level 1) | 0 |
| 35 | of which: instruments issued by subsidiaries subject to gradual elimination | |
| 36 | Level 1 additional capital before regulation adjustments | 0 |
| | Level 1 additional capital: regulation adjustments | |
37 (conservative) | Investments in held instruments of level 1 additional capital | |
38 (conservative) | Investments in reciprocal shares in level 1 additional capital instruments. | |
39 (conservative) | Investments in capital of banks, financial institutions and insurance companies out of the scope of the regulation consolidation, net of short eligible positions, wherein the institution holds more than 10% of the issued capital | |
40 (conservative) | Significant investments in ordinary shares of banks, financial institutions and insurance companies out of the scope of the regulation consolidation, nets of eligible short positions, wherein the institutions holds more than 10% of the issued capital | |
| 41 | National regulation adjustments | 0 |
| 42 | Regulation adjustments that apply to level 1 common stock due to level 1 capital shortage and level 2 capital to cover deductions | |
| 43 | Total regulation adjustments to level 1 additional Common Capital | 0 |
| | 1Q.15| EARNINGS RELEASE | 61 |
| | | |
| 44 | Level 1 additional capital (AT1) | 0 |
| 45 | Level 1 capital (T1 = CET1 + AT1) | 79,292 |
| | Level 2 capital: instruments and reserves | |
| 46 | Instruments directly issued that qualify as level 2 capital, plus premium | 19,908 |
| 47 | Capital instruments directly issued subject to gradual elimination of level 2 capital. | 0 |
| 48 | Level 2 capital instruments and level 1 Common Capital instruments and level 1 additional capital that has not been included in lines 5 or 34, which have been issued by subsidiaries held by third parties (amount allowed in level 2 completer capital) | 0 |
| 49 | of which: instruments issued by subsidiaries subject to gradual elimination | 0 |
| 50 | Reserves | 323 |
| 51 | Level 2 capital before regulation adjustments | 20,231 |
| | Level 2 capital : regulation adjustments | |
52 (conservative) | Investments in own instruments of level 2 capital | |
53 (conservative) | Reciprocal investments in level 2 capital instruments | |
54 (conservative) | Investments in capital of banks, financial institutions and insurance companies out of the scope of the regulation consolidation, net of short eligible positions, wherein the institution does not hold more than 10% of the issued capital (amount exceeding the 10% threshold) | |
55 (conservative) | Significant investments in ordinary shares of banks, financial institutions and insurance companies out of the scope of the regulation consolidation, nets of eligible short positions, wherein the institutions holds more than 10% of the issued capital | |
| 56 | National regulation adjustments | 0 |
| 57 | Total regulation adjustments to level 2 capital | 0 |
| 58 | Level 2 capital (T2) | 20,231 |
| 59 | Total stock (TC = T1 + T2) | 99,523 |
| 60 | Assets weighted by total risk | 601,085 |
| | Capital reasons and supplements | |
| 61 | Level 1 Common Capital (as percentage of assets weighted by total risks) | 13.19% |
| 62 | Level 1 Stock (as percentage of assets weighted by total risks) | 13.19% |
| 63 | Total capital (as percentage of assets weighted by total risks) | 16.56% |
| 64 | Institutional specific supplement (must at least consist of: the level 1 Common Capital requirement plus the capital maintenance cushion, plus the countercyclical cushion, plus G-SIB cushion; expressed as percentage of the assets weighted by total risks) | 7.00% |
| 65 | of which: Supplement of capital preservation | 2.50% |
| 66 | of which: Supplement of specific bank countercyclical | |
| 67 | of which: Supplement of systematically important global banks (G-SIB) | |
| 68 | Level 1 Common Capital available for hedging of supplements (as percentage of assets weighted by total risks) | 6.19% |
| | National minimums (if other than those of Basel 3) | |
| 69 | National minimum reason of CET1 (if different than the minimum established by Basilea 3) | |
| 70 | National minimum reason of T1 (if different than the minimum established by Basel 3) | |
| | 1Q.15| EARNINGS RELEASE | 62 |
| | | |
| 71 | National minimum reason of TC (if different than the minimum established by Basel 3) | |
| | Amounts under the deduction thresholds (before weighting by risk) | |
| 72 | Non-significant investment in the capital of other financial institutions | |
| 73 | Significant investment in the capital of other financial institutions | |
| 74 | Rights for mortgage services (net of Deferred profit taxes debited) | |
| 75 | Deferred profit taxes credited derived from temporary differences (net of Deferred profit taxes debited) | 7,971 |
| | Applicable limits to the inclusion of reserves in level 2 capital | |
| 76 | Eligible reserves to be included in level 2 capital with respect to expositions subject to standardized methodology (prior application of limit) | 0 |
| 77 | Limit in the inclusion of level 2 capital provisions under standardized methodology | 0 |
| 78 | Eligible reserves for inclusion in level 2 capital with respect to expositions subject to internal rating methodology (prior to application of limit) | |
| 79 | Limit in the inclusion of reserves in level 2 capital under internal rating methodology | |
| | Capital instruments subject to gradual elimination (applicable only between January 1, 2018 and January 1, 2022) | |
| 80 | Current limit of CET1 instruments subject to gradual elimination | |
| 81 | Amount excluded from CET1 due to limit (excess over the limit after amortization and maturity periods) | |
| 82 | Current limit of AT1 instruments subject to gradual elimination | |
| 83 | Amount excluded from AT1 due to limit (excess over the limit after amortization and maturity periods) | |
| 84 | Current limit of T2 instruments subject to gradual elimination | |
| 85 | Amount excluded from T2 due to limit (excess over the limit after amortization and maturity periods) | |
Table I.2
Notes to the disclosure form of paid-in capital without considering transiency in the application of regulatory adjustments
| Reference | Description |
| 1 | Elements of capital contributed pursuant to fraction I item a) numbers 1) and 2) of Article 2 Bis 6 hereof |
| 2 | Results from previous fiscal years and their corresponding updates. |
| 3 | Capital reserves, net result, result per assessment of titles available for sale, accrued effect per conversion, result per assessment of cash flow hedging instruments and result per ownership of non-monetary assets. |
| 4 | Does not apply. The capital stock of credit institutions in Mexico is represented by representative certificates or shares. This concept only applies for entities where such capital is represented by representative certificates or shares. |
| 5 | Does not apply for the capitalization scope in Mexico which is on a non-consolidated basis. This concept will only apply for entities with a consolidated scope. |
6 | Sum of concepts 1 through 5. |
| 7 | Does not apply. In Mexico the use of internal models for calculating capital requirements per market risk is not allowed. |
| 8 | Commercial credit, net of owed differed profit taxes pursuant to the provisions of fraction I item n) of Article 2 Bis 6 hereof. |
| | 1Q.15| EARNINGS RELEASE | 63 |
| | | |
| 9 | Intangibles, other than commercial credit, and if applicable to mortgage service rights, net of owed deferred profit taxes, pursuant to the provisions of fraction I item n) of Article 2 Bis 6 hereof. |
| 10* | Credited deferred profit taxes from losses and fiscal credits pursuant to the provisions of fraction I item p) of Article 2 Bis 6 hereof. |
| | This is a more conservative approach than the one established by the Basel Committee on Banking Supervision in its document "Basel III: Global legal framework for the reinforcement of banks and banking systems" published on June 2011, given that it does not allow to set off with owed differed profit taxes. |
| 11 | Result from assessment of cash flow hedging instruments corresponding to hedged entries that are not assessed at reasonable value. |
| 12* | Reserves pending constitution pursuant to the provisions of fraction I item k) of Article 2 Bis 6 hereof. |
| | This is a more conservative approach than the one established by the Basel Committee on Banking Supervision in its document "Basel III: Global legal framework for the reinforcement of banks and banking systems" published on June 2011, given that deducts from level 1 common stock the preventive reserves pending constitution, according to the provisions of Chapter V of the Second Title hereof, as well as those constituted charged to accounting accounts that are part of the result entries or shareholders' equity and not only the positive difference between the Aggregate Expected Losses minus the Aggregate Admissible Reserves, in the event the Institutions use methods based in internal qualifications in the determination of their capital requirements. |
| 13 | Benefits over the remnant in securitization transactions pursuant to the provisions of fraction I item c) of Article 2 Bis 6 hereof. |
| 14 | Does not apply |
| 15 | Investments made by the benefit pension fund defined corresponding to resources to which the Institution does not have unrestrictive or unlimited access. These investments are considered as net of the plan's liabilities and owed differed taxes to profit that correspond that have not been applied in any other regulatory adjustment. |
| 16* | The amount of the investment in any share acquired by the Institution: pursuant with the provisions of the Law according to the provisions of fraction I item d) of Article 2 Bis 6 hereof; through indexes |
| | This is a more conservative approach to the one established by the Basel Committee on Banking Supervision in its documents "Basel III: Global regulatory framework for the reinforcement of banks and banking systems" published on June 2011 given that the deduction |
| 17* | Investments, in capital of corporations, other than financial entities referred to by item f) of Article 2 Bis 6 hereof, that are in turn, directly or indirectly, shareholders of the institution itself, of the corporation |
| | This is a more conservative approach to the one established by the Basel Committee on Banking Supervision in its documents "Basel III: Global regulatory framework for the reinforcement of banks and banking systems" published on June 2011 given that the deduction for this concept is made in the level 1 common stock, irrespective of the capital level where it has been invested, and in addition because any type of entity is considered, not only financial entities. |
| 18* | Investments in shares, where the Institution owns up to 10% of the capital stock of the financial entities referred to by Articles 89 of the Law and 31 of the Law Regulating Financial Groups pursuant to the provisions of fraction I item f) of Article 2 Bis 6 hereof, including those investments made through investment corporations referred to by fraction I item i) of Article 2 Bis 6. The previous investments exclude those made in the capital of development and promotion multilateral organizations of an international nature that have a credit Qualification assigned by any of the issuer's Qualifying Institutions, equal or greater than long term Risk Degree 2. |
| | 1Q.15| EARNINGS RELEASE | 64 |
| | | |
| | This is a more conservative approach to the one established by the Basel Committee on Banking Supervision in its documents "Basel III: Global regulatory framework for the reinforcement of banks and banking systems" published on June 2011 given that the deduction for this concept is made in level 1 common stock, irrespective of the capital level in which it is invested, and additionally because it is deducted from the aggregate amount registered of the investments. |
| 19* | Investments in shares, where the Institution owns up to 10% of the capital stock of the financial entities referred to by Articles 89 of the Law and 31 of the Law Regulating Financial Groups pursuant to the provisions of fraction I fraction f) of Article 2 Bis 6 hereof, including those investments made through investment corporations referred to by fraction I item i) of Article 2 Bis 6. The previous investments exclude those made in development and promotion multilateral organizations of an international nature that have a credit Qualification assigned by any of the issuer's Qualifying institutions, equal or greater than long term Risk Degree 2. |
| | This is a more conservative approach to the one established by the Basel Committee on Banking Supervision in its documents "Basel III: Global regulatory framework for the reinforcement of banks and banking systems" published on June 2011 given that the deduction for this concept is made from level 1 common stock, irrespective of the level of capital where it has been investment, and additionally because the aggregate amount registered of investments is deducted. |
| 20* | Mortgage service s rights shall be deducted from the aggregate amount registered in the event these rights exist. |
| | This is a more conservative approach to the one established by the Basel Committee on Banking Supervision in its documents "Basel III: Global regulatory framework for the reinforcement of banks and banking systems" published on June 2011 given that the aggregate amount registered of rights is deducted. |
| 21 | The amount of credited deferred profit taxes originating from temporary differences minus the corresponding owed differed profit taxes not considered to set-off other adjustments, exceeding 10% of the difference between the reference 6 and the sum of references 7 through 20. |
| 22 | Does not apply. Concepts were deducted from the aggregate capital. See notes of references 19, 20 and 21. |
| 23 | Does not apply. Concepts were deducted from the aggregate capital. See note of references 19. |
| 24 | Does not apply. Concepts were deducted from the aggregate capital. See note of reference 20. |
| 25 | Does not apply. Concepts were deducted from the aggregate capital. See note of reference 21. |
| 26 | National adjustments considered as the sum of the following concepts. |
| A. | The sum of the accrued effect for conversion and result for ownership of non-monetary assets considering the amount of each of these concepts with a sign different than the one considered to include them in reference 3, namely, if positive in this concept shall be entered as negatives and vice versa. |
| B. | Investments in subordinated debt instruments, pursuant to the provisions of fraction I item b) of Article 2 Bis 6 hereof. |
| C. | The amount resulting if on account of the purchase of securitization positions, the originating Institutions register a profit or increase in the value of their assets with respect to the assets previously registered in its balance, pursuant to the provisions of fraction I item c) of Article 2 Bis 6 hereof. |
| D. | Investments in capital of development or promotion multilateral organizations of an international nature pursuant to the provisions of fraction I item f) of Article 2 Bis 6 hereof, that have a credit Qualification assigned by any of the issuer's Qualifying Institutions, equal or better to long term Risk Degree 2. |
| E. | Investments in shares or corporations related to the Institution under the terms of Articles 73, 73 Bis and 73 Bis 1 of the Law, including the amount corresponding to investments in investment corporations and investments indices pursuant to the provisions of fraction I item g) of Article 2 Bis 6 |
| | 1Q.15| EARNINGS RELEASE | 65 |
| | | |
| | hereof. |
| F. | Investments made by development banking institutions in risk capital, pursuant to the provisions of fraction I item h) of Article 2 Bis 6 hereof. |
| G. | Investments in shares, other than fix capital, in listed investment corporations wherein the Institutions holds more than 15 per cent of shareholder's equity of the aforementioned investment corporation, pursuant to fraction I item i) of Article 2 Bis 6, that have not been considered in the preceding references. |
| H. | Any type of contribution which resources are destined to the purchase of shares in the financial group's holding company, of the other financial entities that comprise the group to which the Institution belongs or of the financial affiliates of the latter pursuant to the provisions of fraction I item l) of Article 2 Bis 6 hereof. |
| I. | Transactions that infringe the provisions, pursuant to the provisions of fraction I item m) of Article 2 Bis 6 hereof. |
| J. | Differed charges and early payments, net of owed differed profit taxes, pursuant to the provisions of fraction I item n) of Article 2 Bis 6 hereof. |
| K. | Positions pertaining to the First Losses Scheme where the risk is preserved or credit protection is provided up to a certain limit of a position pursuant to fraction I item o) of Article 2 Bis 6. |
| L. | Worker's participation in credited differed profits pursuant to fraction I item p) of Article 2 Bis 6 hereof. |
| M. | The added amount of Transactions Subject to Credit Risk owed by Relevant Related Persons pursuant to fraction I item r) of Article 2 Bis 6 hereof. |
| N. | The difference between the investments made by the benefit pension funds defined pursuant to Article 2 Bis 8 minus reference 15. |
| O. | Adjustment for the acknowledgment of Net Capital pursuant to Article 2 Bis 9 hereof. The amount shown corresponds to the amount registered in box C1 of the form included in section II hereof. |
| P. | The investments or contributions, directly or indirectly, in the corporation's capital or in the trust estate or other type of similar figures that have the purpose to set off and liquidate Transactions executed in the stock market, except for such corporation's or trust's share in the former pursuant to item f) fraction I of Article 2 Bis 6. |
| 27 | Does not apply. There are no regulatory adjustments for additional level 1 capital nor for ancillary capital. All regulatory adjustments are made from the level 1 common stock. |
| 28 | Sum of lines 7 through 22, plus lines 26 and 27. |
| 29 | Line 6 minus line 28. |
| 30 | The amount corresponding to titles representing the capital stock (including its share sale premium) that had not been considered in basic capital 1 and Capital Instruments, that meet the conditions established in fraction II of Article 2 Bis 6 hereof. |
| 31 | Amount of line 30 qualified as capital under the applicable accounting standards. |
| 32 | Does not apply. Instruments directly issued that qualify as additional level 1 capital, plus its premium are registered for accounting purposes as capital. |
| 33 | Subordinated obligations computed as basic capital 2, pursuant to the provisions of Article Third Transitory of Resolution 50th that amends the general provisions applicable to Credit Institutions, (Resolution 50th) |
| 34 | Does not apply. See note to reference 5. |
| 35 | Does not apply. See note to reference 5. |
| 36 | Sum of lines 30, 33 and 34. |
| 37* | Does not apply. Deduction is made in aggregate level 1 common capital. |
| 38* | Does not apply. Deduction is made in aggregate level 1 common capital. |
| | 1Q.15| EARNINGS RELEASE | 66 |
| | | |
| 39* | Does not apply. Deduction is made in aggregate level 1 common capital. |
| 40* | Does not apply. Deduction is made in aggregate level 1 common capital. |
| 41 | National adjustments considered: |
| | Adjustment for the acknowledgment of Net Capital pursuant to Article 2 Bis 9 hereof. The amount shown corresponds to the amount registered in box C2 of the form included in section II hereof. |
| 42 | Does not apply. There are no regulatory adjustments for ancillary capital. All regulatory adjustments are made from the level 1 common stock. |
| 43 | Sum of lines 37 through 42. |
| 44 | Line 36, minus line 43. |
| 45 | Line 29, plus line 44. |
| 46 | The amount corresponding to titles representing the capital stock (including its share sale premium) that had not been considered in basic capital 1 nor in basic capital 2 and Capital Instruments, that comply with Exhibit 1-S hereof pursuant to the provisions of Article 2 Bis 7 hereof. |
| 47 | Subordinated obligations computed as ancillary capital, pursuant to the provisions of Article Third Transitory, of Resolution 50th |
| 48 | Does not apply. See note to reference 5. |
| 49 | Does not apply. See note to reference 5. |
| 50 | Preventive estimations for credit risk up to a sum of 1.25% of the assets weighed by credit risk corresponding to the Transactions that use the Standard Method to calculate the capital requirement per credit risk; and the positive difference of the Aggregate Admissible Reserves minus the Aggregate Expected Losses, up to an amount that does not exceed of 0.6 per cent of the assets weighed by credit risk, corresponding to the Transactions wherein the method based in internal qualifications to calculate the capital requirements by credit risk is used, pursuant to fraction III of Article 2 Bis 7. |
| 51 | Sun of lines 46 through 48, plus line 50. |
| 52* | Does not apply. The deduction is made in aggregate of level 1 common stock. |
| 53* | Does not apply. The deduction is made in aggregate of level 1 common stock. |
| 54* | Does not apply. The deduction is made in aggregate of level 1 common stock. |
| 55* | Does not apply. The deduction is made in aggregate of level 1 common stock. |
| 56 | National adjustments considered: |
| | Adjustment for the acknowledgment of Net Capital pursuant to Article 2 Bis 9 hereof. The amount shown corresponds to the amount registered in box C4 of the form included in section II hereof. |
| 57 | Sum of lines 52 through 56. |
| 58 | Line 51, minus line 57. |
| 59 | Line 45, plus line 58. |
| 60 | Weighed Assets Subject to Total Risks. |
| 61 | Line 29 divided by line 60 (expressed as percentages) |
| 62 | Line 45, divided by line 60 (expressed as percentages) |
| 63 | Line 59 divided by line 60 (expressed as percentages) |
| 64 | Report 7% |
| 65 | Report 2.5% |
| 66 | Does not apply. There is no requirement that corresponds to the countercyclical supplement. |
| 67 | Does not apply. There is no requirement that corresponds to the supplement of systematically important global banks (G-SIB). |
| 68 | Line 61 minus 7% |
| | 1Q.15| EARNINGS RELEASE | 67 |
| | | |
| 69 | Does not apply. The minimum is the same as established by the Basel Committee on Banking Supervision in its document "Basel III: Global regulatory framework for the reinforcement of banks and banking systems" published in June 2011. |
| 70 | Does not apply. The minimum is the same as established by the Basel Committee on Banking Supervision in its document "Basel III: Global regulatory framework for the reinforcement of banks and banking systems" published in June 2011. |
| 71 | Does not apply. The minimum is the same as established by the Basel Committee on Banking Supervision in its document "Basel III: Global regulatory framework for the reinforcement of banks and banking systems" published in June 2011. |
| 72 | Does not apply. The concept was deducted from the aggregate capital. See note of reference 18. |
| 73 | Does not apply. The concept was deducted from the aggregate capital. See note of reference 19. |
| 74 | Does not apply. The concept was deducted from the aggregate capital. See note of reference 20. |
| 75 | The amount, that does not exceed 10% of the difference between reference 6 and the sum of references 7 through 20, of the credited differed profit taxes resulting from temporary differences minus those corresponding to owed profit taxes not considered to set off other adjustments. |
| 76 | Preventive estimations for credit risk corresponding to the Transactions that use the Standard Method to calculate the capital requirement per credit risk. |
| 77 | 1.25% of weighed assets per credit risk, corresponding to Transactions wherein the Standard Method to calculate the capital requirement by credit risk. |
| 78 | Positive difference of the Aggregate Admissible Reserves minus the Aggregate Expected Losses corresponding to Transactions wherein the method based in internal qualifications to calculate the capital requirement by credit risk is used. |
| 79 | 0.6 per cent of the weighted assets by credit risk, corresponding to Transactions wherein the method based in internal qualifications to calculate the capital requirement by credit risk is used. |
| 80 | Does not apply. There are no instruments subject to transience that compute in level 1 common stock |
| 81 | Does not apply. There are no instruments subject to transience that compute in level 1 common stock |
| 82 | Balance of instruments computed as capital in the basic portion by December 31, 2012 for the corresponding balance limit therein. |
| 83 | Balance of instruments computed as capital in the basic portion by December 31, 2012 minus line 33. |
| 84 | Balance of instruments computed as capital in the complementary portion by December 31, 2012 for the corresponding balance limit therein. |
| 85 | Balance of instruments computed as capital in the basic portion by December 31, 2012 minus line 47. |
Note: * The aforementioned approach is more conservative than the one established by the Basel Committee on Banking Supervision in its document "Basel III: Global regulatory framework for the reinforcement of banks and banking systems" published in June 2011.
Table II.1
Impact in net capital due to the procedure provided by Article 2 Bis 9 of CUB
| Capital concepts | Without adjustment due to capital acknowledgment | % APSRT | Adjustment due to capital acknowledgment | With adjustment due to capital acknowledgment | % APSRT |
| Basic capital 1 | 79,292 | 13.19% | 0 | 79,292 | 13.19% |
| Basic capital 2 | 0 | 0.00% | 0 | 0 | 0.00% |
| Basic capital | 79,292 | 13.19% | 0 | 79,292 | 13.19% |
| Complementary capital | 20,231 | 3.37% | 0 | 20,231 | 3.37% |
| | 1Q.15| EARNINGS RELEASE | 68 |
| | | |
| Net capital | 99,523 | 16.56% | 0 | 99,523 | 16.56% |
| Assets weighted subject to total risks (APSRT) | 601,085 | Not aplicable | Not aplicable | 601,085 | Not aplicable |
| Capitalization index | 16.56% | Not aplicable | Not aplicable | 16.56% | Not aplicable |
| | Table III.1 | |
| | Net Capital Ratio of the balance sheet | |
| Reference of the balance sheet items | Balance sheet items | Amount shown in the balance sheet |
| | Assets | 1,049,178 |
| BG1 | Available | 105,316 |
| BG2 | Margin accounts | 2,148 |
| BG3 | investment in securities | 270,703 |
| BG4 | Repurchase debtors | 6,751 |
| BG5 | Securities loan | 1 |
| BG6 | Derivatives | 100,357 |
| BG7 | Valuation adjustments for financial assets hedging | 49 |
| BG8 | Total credit portfolio (net) | 423,415 |
| BG9 | Benefits to be received in securitization transactions | 0 |
| BG10 | Other accounts receivable (net) | 95,624 |
| BG11 | Assets awarded (net) | 95 |
| BG12 | Real property, furniture and equipment (net) | 5,361 |
| BG13 | Permanent investments | 22,664 |
| BG14 | Long term assets available for sale | 0 |
| BG15 | Deferred taxes and PTU (net) | 11,476 |
| BG16 | Other assets | 5,218 |
| | Liability | 942,015 |
| BG17 | Traditional savings | 491,322 |
| BG18 | Interbank loans and from other entities | 55,430 |
| BG19 | Repurchase creditors | 149,520 |
| BG20 | Securities loan | 1 |
| BG21 | Sold or pledged collaterals | 28,835 |
| BG22 | Derivatives | 96,722 |
| BG23 | Valuation adjustments for financial liability hedging | 0 |
| BG24 | Obligations in securitization transactions | 0 |
| BG25 | Other accounts payable | 99,742 |
| BG26 | Outstanding subordinated obligations | 19,849 |
| BG27 | Deferred taxes and PTU (net) | 0 |
| BG28 | Deferred credits and early collection | 595 |
| | Shareholders' Equity | 107,163 |
| BG29 | Paid-in capital | 34,798 |
| BG30 | Earned capital | 72,365 |
| | Accounts in order | 4,111,487 |
| | 1Q.15| EARNINGS RELEASE | 69 |
| | | |
| BG31 | Guarantees granted | 0 |
| BG32 | Contingent assets and liabilities | 12 |
| BG33 | Credit compromises | 70,882 |
| BG34 | Property in trust or mandate | 130,453 |
| BG35 | Federal Government financial agent | |
| BG36 | Property under guardianship or receivership | 3,281,551 |
| BG37 | Collaterals received and sold or given in guarantee by the entity | 55,813 |
| BG38 | Collaterals received and sold or given in guarantee by the entity | 12,433 |
| BG39 | Investment banking transactions on account of third parties (net) | 0 |
| BG40 | Accrued interest not collected resulting from the expired credit portfolio | 2,106 |
| BG41 | Other registry accounts | 558,236 |
| Table III.2 |
| Regulatory concepts considered in the calculation of Net Capital components |
| Identifier | Regulatory concepts considered for the calculation of Net Capital components | Reference of the format for the disclosure of capital integration of section I hereof | Amount pursuant to the notes of the table Regulatory concepts considered for the calculation of Net Capital components | Reference(s) of balance sheet item and amount related with the regulatory concept considered for the calculation of Net Capital derived from the aforementioned reference |
| | Asset | | | |
| 1 | Commercial Credit | 8 | 1,735 | BG16= 5,281 Minus: deferred charges and advance payments 585; intangible assets 2,606; other assets are computed as risk assets 36; Plus: intangibles that are reconized as liabilities 256 |
| | 1Q.15| EARNINGS RELEASE | 70 |
| | | |
| 2 | Other Intangibles | 9 | 2,606 | BG16= 5,218 Minus: deferred charges and advance payments 585; Intangibles 1,735; other assets that are computed as risk assets 36: Plus: Intangibles that are reconized as liabilities 256 |
| 3 | Deferred profit tax (credited) from fiscal losses and credits | 10 | 0 | |
| 4 | Benefits over remnant of securitization transactions | 13 | 0 | |
| 5 | Investments of the pension plan for benefits defined without restrictive and unlimited access | 15 | 0 | |
| 6 | Investment in shares of the institution | 16 | 9 | BG3= 270,703 Minus: Reciprocal investments in common capital of financial entities 42; Investments in securities computed as risk assets 270,652 |
| 7 | Reciprocal investments in common capital | 17 | 0 | |
| 8 | Direct investments in the capita of financial organizations wherein the institution does not hold more than 10% of the issued capital stock | 18 | 0 | |
| 9 | Indirect investment in capital of financial organizations wherein the institution does not hold more than 10% of the issued capital stock | 18 | 42 | BG3 = 270,703 Minus: Investment in own-equity securities 9; Investments in securities computed as risk assets 270,652 |
| 10 | Direct investments in the capita of financial organizations wherein the institution holds more than 10% of the issued capital stock | 19 | 0 | |
| 11 | Indirect investment in capital of financial organizations wherein the institution holds more than 10% of the issued capital stock | 19 | | |
| 12 | Deferred profit tax (credited) from temporary differences | 21 | 419 | BG15 =11,476 Minus: Amount computed as risk |
| | 1Q.15| EARNINGS RELEASE | 71 |
| | | |
| | | | | asset 11,057 |
| 13 | Reserves acknowledged as complementary capital | 50 | 323 | BG 8= Total loan portfolio 423,415 |
| 14 | Investments in subordinated debt | 26 - B | 0 | |
| 15 | Investments in multilateral entities | 26 - D | 0 | BG13= 22,664 Minus: Investments in subsidiaries 20,620; Investments in clearing houses 1,855 Investments in associated companies 165; Other investments that are computed as risk assets 24 |
| 16 | Investments in related companies | 26 - E | 20,620 | BG13= 22,664 Minus: Investments in clearing houses 1,855; Investments in associated companies 165; Other investments that are computed as risk assets 24 |
| 17 | Investments in risk capital | 26 - F | 0 | |
| 18 | Investments in investment corporations | 26 - G | 0 | |
| 19 | Funding for the purchase of own shares | 26 - H | 0 | |
| 20 | Deferred charges and installments | 26 - J | 585 | BG16= 5,218 Minus: Intangibles 1,735; other assets that are computed as risk assets 36; Intangibles 2,606 Plus: intangibles liabilities 256; |
| 21 | Worker's share in deferred profits (net) | 26 - L | 0 | |
| 22 | Investments in pension plans for defined benefits | 26 - N | 0 | |
| 23 | Investments in clearing houses | 26 - P | 1,855 | BG13= 22,664 Minus: Investments in subsidiaries |
| | 1Q.15| EARNINGS RELEASE | 72 |
| | | |
| | | | | 20,620; Investments in associated companies 165; other investments that are computed as risk assets 24 |
| | Liabilities | | | |
| 24 | Deferred profit taxes (debited) related to a commercial credit | 8 | | |
| 25 | Deferred profit taxes (debited) related to other intangibles | 9 | | |
| 26 | Liabilities of the pension plan for defined benefits without restrictive and unlimited access | 15 | | |
| 27 | Deferred profit taxes (debited) related to the pension plan for defined benefits | 15 | | |
| 28 | Deferred profit taxes (debited) related to others other than the foregoing | 21 | | |
| 29 | Subordinated obligations amount that meets with Exhibit 1-R | 31 | | |
| 30 | Subordinated obligations subject to transitory computed as basic capital 2 | 33 | | |
| 31 | Subordinated obligations amount that meets with Exhibit 1-S | 46 | | |
| 32 | Subordinated obligations subject to transitory that compute as complementary capital | 46 | | |
| 33 | Deferred profit tax (credited) related to deferred charges and installments | 26 - J | | |
| | Shareholders' Equity | | | |
| 34 | Paid-in capital that meets with Exhibit 1-Q | 1 | 34,798 | BG29 |
| 35 | Result of previous years | 2 | 59,489 | BG30= 72,365 Minus: other ítems of earned capital 12,877 |
| 36 | Result for valuation of cash flow hedging instruments of non-registered items with reasonable value | 3 | | |
| 37 | Other elements of the capital earned other than the foregoing | 3 | 12,877 | BG30= 72,365 Minus: Retained earnings 59,489 |
| 38 | Paid-in capital that meets with Exhibit 1-R | 31 | | |
| 39 | Paid-in capital that meets with Exhibit 1-S | 46 | 19,908 | BG26= 19,849 Plus: Other expenses amortization for bond issue 59 |
| | 1Q.15| EARNINGS RELEASE | 73 |
| | | |
| 40 | Result for valuation of cash flow hedging instruments of non-registered items with reasonable value | 03, 11 | | |
| 41 | Accrued effect due to conversion | 3, 26 - A | | |
| 42 | Result for ownership of non-monetary assets | 3, 26 - A | | |
| | Accounts in order | | | |
| 43 | Positions in First Losses Schemes | 26 - K | | |
| | Regulatory concepts not considered in the balance sheet | | | |
| 44 | Reserves pending constitution | 12 | | |
| 45 | Profit or increase of the value of assets for the purchase of securitization positions (Originating Institutions) | 26 - C | | |
| 46 | Transactions that breach the provisions | 26 - I | | |
| 47 | Transactions with Relevant Related Persons | 26 - M | | |
| 48 | Adjustment for capital acknowledgment | 26 - O, 41, 56 | 0 | |
| Table III.3 |
| Notes to table III.2 "Regulatory concepts considered for the calculation of Net Capital components" |
| Identifier | Description |
| 1 | Commercial credit. |
| 2 | Intangibles, without including commercial credit. |
| 3 | Credited differed profit taxes originating from fiscal losses and credits. |
| 4 | Benefits regarding the remnant of securitization transactions. |
| 5 | Investments of pension plan for defined benefits without unrestrictive and unlimited access. |
| 6 | Any share that the Institution acquires pursuant to the provisions of the Law, that have not been subtracted; considering those amounts acquired through investments in securities indexes and the amount corresponding to investments in investment corporations other than those provided by reference 18. |
| 7 | Investments in shares in corporations other than financial entities referred to by item f) of fraction I of Article 2 Bis 6 hereof, that are in turn, directly or indirectly shareholders of the Institution itself, of the financial group's holding company, of the remaining financial entities that comprise the group to which the Institution belongs or financial affiliates of the latter, considering those investments corresponding to investment corporations other than those provided by reference 18. |
| 8 | Direct investments in financial entities capital referred to by Article 89 of the Law and 31 of the Law Regulating Financial Groups, where the Institution owns more than 10% of the capital thereof. |
| 9 | Direct investments in financial entities capital referred to by Article 89 of the Law and 31 of the Law Regulating Financial Groups, where the Institution owns more than 10% of the capital thereof. |
| 10 | Direct investments in financial entities capital referred to by Article 89 of the Law and 31 of the Law Regulating Financial Groups, where the Institution owns more than 10% of the capital thereof. |
| 11 | Indirect investments in financial entities capital referred to by Article 89 of the Law and 31 of the Law Regulating Financial Groups, where the Institution owns more than 10% of the capital thereof. |
| 12 | Credited differed profit taxes originating from temporary differences. |
| | 1Q.15| EARNINGS RELEASE | 74 |
| | | |
| 13 | Preventive estimates for credit risk up to a sum of 1.25% of the weighted assets by credit risk, corresponding to Transactions wherein the Standard Method is used to calculate the capital requirement by credit risk; and the positive difference of the Aggregate Admissible Reserves minus the Aggregate the Expected Losses, up to an amount that does not exceed of 0.6 per cent of the weighted assets by credit risk, corresponding to Transactions where the method based in internal qualifications is used to calculate the capital requirement by credit risk. |
| 14 | Investments in subordinated debt instruments, pursuant to the provisions of fraction I item b) of Article 2 Bis 6 hereof. |
| 15 | Investments in development or promotion multilateral organizations of an international nature pursuant to the provisions of fraction I item f) of Article 2 Bis 6 hereof that have a credit Qualification assigned by any of the issuer's Qualifying Institutions, equal or greater than long term Risk Degree 2. |
| 16 | Investments in shares of corporations related with the Institution under the terms of Articles 73, 73 Bis and 73 Bis 1 of the Law, including the amount corresponding to investments in investment corporations and investments in indices pursuant to the provisions of fraction I item g) of Article 2 Bis 6 hereof. |
| 17 | Investments made in development banking institutions in risk capital, pursuant to the provisions of fraction I item h) of Article 2 Bis 6 hereof. |
| 18 | Investments in shares, other than fix capital, of listed investment corporations, wherein the Institution holds more than 15 per cent of shareholders' equity of the aforementioned investment corporation, pursuant to fraction I item i) of Article 2 Bis 6, that have not been considered in the previous references. |
| 19 | Any type of contributions which resources are destined to the purchase of shares of the financial group's holding company, of the other financial entities that comprise the group to which the Institution belongs or the latter's financial affiliates, pursuant to the provisions of fraction I item l) of Article 2 Bis 6 hereof. |
| 20 | Differed charges and early payments. |
| 21 | Workers' share in credited differed profits pursuant to fraction I item p) of Article 2 Bis 6 hereof. |
| 22 | Investments of the pension plan for benefits defined that have to be deducted according with Article 2 Bis 8 hereof. |
| 23 | Investments or contributions, directly or indirectly, in the corporation's capital or in trust estate or other type of similar figures that have the purpose of setting off and liquidating Transactions executed in the stock market, unless the share in such corporations or trusts in the former pursuant to item f) fraction I of Article 2 Bis 6. |
| 24 | Owed differed taxes to profit originating from temporary differences related to commercial credit. |
| 25 | Owed differed taxes to profit originated from temporary differences related to other intangibles (other than commercial credit). |
| 26 | Liabilities of the pension plan for benefits defined related to investments of the pension plan for defined benefits. |
| 27 | Owed differed taxes originated from temporary differences related to the pension plan for defined benefits. |
| 28 | Owed differed profit taxes originated from temporary differences other than those of references 24, 25, 27 and 33 |
| 29 | Amount of subordinated obligations that meet with Exhibit 1-R hereof. |
| 30 | Amount of subordinated obligations subject to transience that are computed as basic capital 2. |
| 31 | Amount of subordinated obligations that meet with Exhibit 1-S hereof. |
| 32 | Amount of subordinated obligations subject to transience that compute as ancillary capital. |
| 33 | Owed differed profit taxes originated from temporary differences related to differed charges and early payments. |
| 34 | Amount of capital contributed that meets the provisions of Exhibit 1-Q hereof. |
| | 1Q.15| EARNINGS RELEASE | 75 |
| | | |
| 35 | Result of the previous fiscal years. |
| 36 | Result for the assessment of cash flow hedging instruments from covered entries assessed at reasonable value. |
| 37 | Net result and result for the assessment of titles available for sale. |
| 38 | Amount of capital contributed that meets the provisions of Exhibit 1-R hereof. |
| 39 | Amount of capital contributed that meets the provisions of Exhibit 1-S hereof. |
| 40 | Result for the assessment of cash flow hedging instruments from covered entries assessed at capitalized cost. |
| 41 | Accrued effect by conversion. |
| 42 | Result for ownership of non-monetary assets. |
| 43 | Positions related with the First Losses Scheme wherein risk is preserved or credit protection provided until certain limit of a position pursuant to fraction I item o) of Article 2 Bis 6. |
| 44 | Reserves pending constitution pursuant to the provisions of fraction I item k) of Article 2 Bis 6 hereof. |
| 45 | The amount resulting if on account of the purchase of securitization positions, the originating Institutions register a profit or an increase in the value of their assets with respect to assets previously registered in its balance, pursuant to the provisions of fraction I item c) of Article 2 Bis 6 hereof. |
| 46 | Transactions that infringe the provisions, pursuant to the provisions of fraction I item m) of Article 2 Bis 6 hereof. |
| 47 | The aggregate amount of Transactions Subject to Credit Risk owed by Relevant Related Persons pursuant to fraction I item r) of Article 2 Bis 6 hereof. |
| 48 | Adjustment for the acknowledgment of Net Capital pursuant to Article 2 Bis 9 hereof. The amount shown corresponds to the amount registered in C5 of the form included in section II hereof. |
| Table IV.1 |
| Positions exposed to market risks per risk factor |
| Concept | Amount of equivalent positions | Capital Requirement |
| Transactions in national currency with nominal rate | 80,852 | 6,468 |
| Transactions with debt instruments in national currency with surtax and reviewable rate | 12,719 | 1,018 |
| Transactions in national currency with real rate or denominated in UDIs | 5,691 | 455 |
| Transactions in national currency with yield rate referred to the increase of the General Minimum Wage | 10,439 | 835 |
| Positions in UDIs or with yield referred to INPC | 39 | 3 |
| Positions in national currency with yield rate referred to the increase of the General Minimum Wage | 64 | 5 |
| Transactions in foreign currency with nominal rate | 12,174 | 974 |
| Positions in foreign currency or with yield indexed to the exchange rate | 6,576 | 526 |
| Positions in shares or with yield indexed to the price of one share or set of shares | 1,632 | 131 |
| Table IV.2 | | |
| Assets weighted subject to credit risk by risk group | |
| | 1Q.15| EARNINGS RELEASE | 76 |
| | | |
| Concept | Assets weighted by risk | Capital Requirement |
| Group I (weighted to 0%) | 0 | 0 |
| Group I (weighted to 10%) | 0 | 0 |
| Group I (weighted to 20%) | 0 | 0 |
| Group II (weighted to 0%) | 0 | 0 |
| Group II (weighted to 10%) | 0 | 0 |
| Group II (weighted to 20%) | 0 | 0 |
| Group II (weighted to 50%) | 10,623 | 850 |
| Group II (weighted to 100%) | 0 | 0 |
| Group II (weighted to 120%) | 0 | 0 |
| Group II (weighted to 150%) | 0 | 0 |
| Group III (weighted to 2.5%) | 0 | 0 |
| Group III (weighted to 10%) | 168 | 13 |
| Group III (weighted to 11.5%) | 7 | 1 |
| Group III (weighted to 20%) | 17,690 | 1,415 |
| Group III (weighted to 23%) | 1,282 | 103 |
| Group III (weighted to 50%) | 60 | 5 |
| Group III (weighted to 57.5%) | 325 | 26 |
| Group III (weighted to 100%) | 0 | 0 |
| Group III (weighted to 115%) | 0 | 0 |
| Group III (weighted to 120%) | 0 | 0 |
| Group III (weighted to 138%) | 0 | 0 |
| Group III (weighted to 150%) | 0 | 0 |
| Group III (weighted to 172.5%) | 0 | 0 |
| Group IV (weighted to 0%) | 0 | 0 |
| Group IV (weighted to 20%) | 7,928 | 634 |
| Group V (weighted to 10%) | 0 | 0 |
| Group V (weighted to 20%) | 2,062 | 165 |
| Group V (weighted to 50%) | 0 | 0 |
| Group V (weighted to 115%) | 0 | 0 |
| Group V (weighted to 150%) | 4,718 | 377 |
| Group VI (weighted to 20%) | 0 | 0 |
| Group VI (weighted to 50%) | 15,737 | 1,259 |
| Group VI (weighted to 75%) | 6,797 | 544 |
| Group VI (weighted to 100%) | 40,000 | 3,200 |
| Group VI (weighted to 120%) | 0 | 0 |
| Group VI (weighted to 150%) | 0 | 0 |
| Group VI (weighted to 172.5%) | 0 | 0 |
| Group VII-A (weighted to 10%) | 0 | 0 |
| Group VII-A (weighted to 11.5%) | 0 | 0 |
| Group VII-A (weighted to 20%) | 25,586 | 2,047 |
| Group VII-A (weighted to 23%) | 57 | 5 |
| | | |
| | 1Q.15| EARNINGS RELEASE | 77 |
| | | |
| Group VII-A (weighted to 50%) | 15,763 | 1,261 |
| Group VII-A (weighted to 57.5%) | 11,777 | 942 |
| Group VII-A (weighted to 100%) | 131,447 | 10,516 |
| Group VII-A (weighted to 115%) | 1,849 | 148 |
| Group VII-A (weighted to 120%) | 444 | 36 |
| Group VII-A (weighted to 138%) | 0 | 0 |
| Group VII-A (weighted to 150%) | 1,361 | 109 |
| Group VII-A (weighted to 172.5%) | 0 | 0 |
| Group VII-B (weighted to 0%) | 0 | 0 |
| Group VII-B (weighted to 20%) | 0 | 0 |
| Group VII-B (weighted to 23%) | 0 | 0 |
| Group VII-B weighted to 50%) | 0 | 0 |
| Group VII-B weighted to 57.5%) | 0 | 0 |
| Group VII-B (weighted to 100%) | 16,438 | 1,315 |
| Group VII-B (weighted to 115%) | 0 | 0 |
| Group VII-B (weighted to 120%) | 0 | 0 |
| Group VII-B (weighted to 138%) | 0 | 0 |
| Group VII-B (weighted to 150%) | 0 | 0 |
| Group VII-B (weighted to 172.5%) | 0 | 0 |
| Group VIII (weighted to 125%) | 7,707 | 617 |
| Group IX (weighted to 100%) | 55,303 | 4,424 |
| Group IX (weighted to 115%) | 0 | 0 |
| Group X (weighted to 1250%) | 301 | 24 |
| Other Assets (weighted to 0%) | 0 | 0 |
| Other Assets (weighted to 100%) | 35,127 | 2,810 |
| Securitization with Risk Degree 1 (weighted at 20%) | 0 | 0 |
| Securitization with Risk Degree 2 (weighted at 50%) | 0 | 0 |
| Securitization with Risk Degree 3 (weighted at 100%) | 0 | 0 |
| Securitization with Risk Degree 4 (weighted to 350%) | 0 | 0 |
| Securitization with Risk Degree 4, 5, 6 or Non-qualified (weighted to 1250%) | 0 | 0 |
| Re-securitization with Risk Degree 1 (weighted at 40%) | 0 | 0 |
| Re-securitization with Risk Degree 1 (weighted at 100%) | 0 | 0 |
| Re-securitization with Risk Degree 1 (weighted at 225%) | 0 | 0 |
| Re-securitization with Risk Degree 1 (weighted at 650%) | 0 | 0 |
| Re-securitization with Risk Degree 5, 6 or Not qualified (weighted at 1250%) | 0 | 0 |
| Table IV.3 |
| Assets weighted subject to operational risk |
| Assets weighted by risk | Capital Requirement |
| 60,342 | 4,827 |
| | |
| | 1Q.15| EARNINGS RELEASE | 78 |
| | | |
| | |
| Average of requirement by market and credit risk of the last 36 months | Average of annual positive net income of the last 36 months |
| 38,819 | 32,183 |
| Table V.1 |
| Main characteristics of titles that are part of the Net Capital |
| Reference | Characteristic | Options |
| 1 | Issuer | Banco Santander (Mexico), S. A. |
| 2 | ISIN, CUSIP or Bloomberg Identifier | |
| 3 | Legal frame | Securities Market Law |
| | Regulation treatment | |
| 4 | Level of capital with transitory | N.A |
| 5 | Level of capital without transitory | Basic I |
| 6 | Instrument level | Credit Institution without consolidating |
| 7 | Instrument type | Series F Shares |
| 8 | Amount acknowledge of regulatory capital | $9,514,367,512.00 |
| 9 | Instrument's par value | $0.10 |
| 9A | Instrument's currency | Mexican Pesos |
| 10 | Accounting qualification | Capital |
| 11 | Date of issuance | N.A |
| 12 | Instrument´s term | Perpetual |
| 13 | Date of expiration | Without expiration |
| 14 | Early payment clause | No |
| 15 | First date of early payment | N.A |
| 15A | Regulatory or fiscal events | No |
| 15B | Liquidation price of the early payment clause | N.A |
| 16 | Subsequent early payment dates | N.A |
| | Yields / Dividends | |
| 17 | Type of yield/dividend | Variable |
| 18 | Interest rate/dividend | Variable |
| 19 | Cancellation of dividends clause | No |
| 20 | Payment discretion | Mandatory |
| 21 | Interest increase clause | No |
| 22 | Yields/Dividends | Not Accruable |
| 23 | Convertibility of the instrument | N.A |
| 24 | Convertibility conditions | N.A |
| 25 | Degree of convertibility | N.A |
| 26 | Conversion rate | N.A |
| 27 | Instrument convertibility rate | N.A |
| 28 | Type of convertibility financial instrument | N.A |
| 29 | Instrument issuer | N.A |
| 30 | Write-down clause | No |
| 31 | Conditions for write-down | N.A |
| 32 | Degree of write-down | N.A |
| | | |
| | 1Q.15| EARNINGS RELEASE | 79 |
| | | |
| 33 | Temporality of write-down | N.A |
| 34 | Mechanism for temporary write down | N.A |
| 35 | Subordination position in the event of liquidation | Creditors in general |
| 36 | Breach characteristics | No |
| 37 | Description of breach characteristics | N.A |
| Table V.1.2 |
| Main characteristics of titles that are part of the Net Capital |
| Reference | Characteristic | Options |
| 1 | Issuer | Banco Santander (Mexico), S. A. |
| 2 | ISIN, CUSIP or Bloomberg Identifier | |
| 3 | Legal frame | Securities Market Law |
| | Regulation treatment | |
| 4 | Level of capital with transitory | N.A |
| 5 | Level of capital without transitory | Basic I |
| 6 | Instrument level | Credit Institution without consolidating |
| 7 | Instrument type | Series F Shares |
| 8 | Amount acknowledge of regulatory capital | $1,833,249,750.00 |
| 9 | Instrument's par value | $0.10 |
| 9A | Instrument's currency | Mexican Pesos |
| 10 | Accounting qualification | Capital |
| 11 | Date of issuance | N.A |
| 12 | Instrument´s term | Perpetual |
| 13 | Date of expiration | Without expiration |
| 14 | Early payment clause | No |
| 15 | First date of early payment | N.A |
| 15A | Regulatory or fiscal events | No |
| 15B | Liquidation price of the early payment clause | N.A |
| 16 | Subsequent early payment dates | N.A |
| | Yields / Dividends | |
| 17 | Type of yield/dividend | Variable |
| 18 | Interest rate/dividend | Variable |
| 19 | Cancellation of dividends clause | No |
| 20 | Payment discretion | Mandatory |
| 21 | Interest increase clause | No |
| 22 | Yields/Dividends | Not Accruable |
| 23 | Convertibility of the instrument | N.A |
| 24 | Convertibility conditions | N.A |
| 25 | Degree of convertibility | N.A |
| 26 | Conversion rate | N.A |
| 27 | Instrument convertibility rate | N.A |
| 28 | Type of convertibility financial instrument | N.A |
| 29 | Instrument issuer | N.A |
| 30 | Write-down clause | No |
| | | |
| | 1Q.15| EARNINGS RELEASE | 80 |
| | | |
| 31 | Conditions for write-down | N.A |
| 32 | Degree of write-down | N.A |
| 33 | Temporality of write-down | N.A |
| 34 | Mechanism for temporary write down | N.A |
| 35 | Subordination position in the event of liquidation | Creditors in general |
| 36 | Breach characteristics | No |
| 37 | Description of breach characteristics | N.A |
| Table V.1.3 |
| Main characteristics of titles that are part of the Net Capital |
| Reference | Characteristic | Options |
| 1 | Issuer | Banco Santander (México), S. A. |
| 2 | ISIN, CUSIP or Bloomberg Identifier | Reg S: USP1507SAD91 / 144A: US05969BAB99 |
| 3 | Legal frame | New York Law, in case that a "TRIGGER EVENT" takes to a "WRITE DOWN" or "Mexican Regulatory Event" which involves a suspention period and occurs based in mexican regulatory determination acordding with the mexican law. The ranking and Subordinated Notes would be determinated accordding to the mexican law |
| | Regulation treatment | |
| 4 | Level of capital with transitory | N.A |
| 5 | Level of capital without transitory | Complementary |
| 6 | Instrument level | Credit Institution without consolidating |
| 7 | Instrument type | 5.95% Tier 2 Subordinated Capital Notes due 2024 |
| 8 | Amount acknowledge of regulatory capital | $19,907,993,840.00 |
| 9 | Instrument's par value | $19,163,820,000.00 |
| 9A | Instrument's currency | USD |
| 10 | Accounting qualification | Subordinated credit notes |
| 11 | Date of issuance | 27/12/2013 |
| 12 | Instrument´s term | Maturity |
| 13 | Date of expiration | 30/01/2024 |
| 14 | Early payment clause | Yes ("Optional Redemption") |
| 15 | First date of early payment | 30/01/2019 (only date of call) |
| 15A | Regulatory or fiscal events | Yes ("Withholding Tax Redemption" y "Special Event Redemption" el cual incluye: "Capital Event" y "Tax Event") |
| 15B | Liquidation price of the early payment clause | accrued and unpaid interest |
| 16 | Subsequent early payment dates | N/A (only on the first date of early payment). |
| | Yields / Dividends | |
| 17 | Type of yield/dividend | Variable |
| 18 | Interest rate/dividend | 5.95% |
| | | |
| | 1Q.15| EARNINGS RELEASE | 81 |
| | | |
| 19 | Cancellation of dividends clause | N.A |
| 20 | Payment discretion | Mandatory |
| 21 | Interest increase clause | No |
| 22 | Yields/Dividends | Not Accruable |
| 23 | Convertibility of the instrument | No Convertible |
| 24 | Convertibility conditions | N.A |
| 25 | Degree of convertibility | N.A |
| 26 | Conversion rate | N.A |
| 27 | Instrument convertibility rate | N.A |
| 28 | Type of convertibility financial instrument | N.A |
| 29 | Instrument issuer | N.A |
| 30 | Write-down clause | Yes |
| 31 | Conditions for write-down | If a Trigger Event occurs the following write-downs shall be will deemed to have occurred if (i) the CNBV publishes a determination, in its official publication of capitalization levels for Mexican banks, that our Tier 1 Capital 1 Ratio (“Capital Básico 1”), as calculated pursuant to the applicable Mexican Capitalization Requirements, is equal to or below 4.5% (four point five percent), (ii) both (A) the CNBV notifies us that it has made a determination, pursuant to Article 29 Bis of the Mexican Banking Law, that a cause for revocation of our license has occurred resulting from (y) our non-compliance with corrective measures imposed by the CNBV pursuant to the Mexican Banking Law, or (z) our non-compliance with the capitalization requirements set forth in the Mexican Capitalization Requirements and (B) we have not cured such cause for revocation, by (a) complying with such corrective measures, or (b)(1) submitting a capital restoration plan to, and receiving approval of such plan by, the CNBV, (2) pledging to the Mexican governmental uthorities, to secure performance of such capital restoration plan, seventy five percent (75%) of the Issuer’s aggregate issued and outstanding shares and (3) not being classified in Class III, IV, or V, or (c) remedying any capital deficiency, in the case of (a), (b) and (c), on or before the 15th business day in Mexico following the date on which the CNBV notifies us of such determination; or (iii) the Financial Stability Committee, which is a committee formed by the CNBV, the Ministry of Finance and Public |
| | 1Q.15| EARNINGS RELEASE | 82 |
| | | |
| | | Credit, the Mexican Central Bank and the Mexican Savings Protection Agency, determines pursuant to Article 122 Bis of the Mexican Banking Law that financial assistance is required by us to avoid revocation of our license for our failure to comply with corrective measures, comply with capitalization requirements or to satisfy certain liabilities when due, as a means to maintain the solvency of the Mexican financial system or to avoid risks affecting the Mexican payments system and such determination is either made public or notified to us. |
| 32 | Degree of write-down | Parcial, until restore adequate capital levels |
| 33 | Temporality of write-down | Permanent |
| 34 | Mechanism for temporary write down | “Write-Down Amount” means an (i) amount that would be sufficient, together with any concurrent prorata write down of any other loss-absorbing instruments issued by us and then outstanding, to return our Capital Básico 1 to the levels of Capital Básico 1 required under Section IX, b), 2 of Annex 1-S of the General Rules Applicable to Mexican Banks (currently 7% (seven percent)), or (ii) if any Write-Down of the Current Principal Amount, together with any concurrent pro rata write down of any other lossabsorbing instruments issued by us and then outstanding, would be insufficient to return our Capital Básico 1 to the levels of Capital Básico 1 required under Section IX, b), 2 of Annex 1-S of the General Rules Applicable to Mexican Banks (currently 7% (seven percent)), the amount necessary to reduce the Current Principal Amount of each outstanding Note to zero. |
| 35 | Subordination position in the event of liquidation | The Notes constitute subordinated indebtedness, and (i) will be subordinate and junior in right of payment and in liquidation to all of our present and future senior indebtedness, (ii) will rank pari passu with all other unsecured subordinated preferred indebtedness and (iii) will be senior to subordinated non-preferred indebtedness and all classes of our equity or capital stock. |
| 36 | Breach characteristics | N.A |
| 37 | Description of breach characteristics | N.A |
| | 1Q.15| EARNINGS RELEASE | 83 |
| | | |
| Assistance in filling in the information regarding the characteristics of the titles that are part of the Net Capital |
| Reference | Description |
| 1 | Credit institution that issues titles that are part of the Net Capital |
| 2 | Title identifier or code that is part of the Net Capital (ISIN, CUSIP or ID number of international value) |
| 3 | Legal framework with which the title must comply, as well as the laws to which it shall be subject. |
| 4 | Level of capital that corresponds to the title that shall be subject to transience established pursuant to Article Third Transitory, of Resolution 50th. |
| 5 | Level of capita that corresponds to the title that meets exhibit 1-Q, 1-R or 1-S hereof. |
| 6 | Level within the group to which the title is included. |
| 7 | Type of Capital Instrument or title representing the capital stock that is included as part of the Net Capital. In the event of titles subject to the transiency established pursuant to Article Third Transitory, established in Resolution 50th, refers to the subordinated obligations described on Article 64 of the Credit Institutions Act. |
| 8 | Amount of the Capital Instrument or title representing the capital stock, that is acknowledged in the Net Capital pursuant to Article 2 bis 6 hereof, in the event of reference 5 either Basic 1 or Basic 2; and pursuant to Article 2 bis 7 hereof in the event such reference is Ancillary. in any other event, it shall be the amount corresponding pursuant to the provisions of Article Third Transitory of Resolution 50th. |
| 9 | Title's par value in Mexican pesos. |
| 9A | Currency used to express the title's par value in Mexican pesos pursuant to international standard ISO 4217 |
| 10 | Accounting classification of the title that is part of the Net Capital. |
| 11 | Date of issuance of the title that is part of the Net Capital |
| 12 | Specify if the title has expiration or is at perpetuity |
| 13 | Expiration date of the title, without considering the dates of early payment. |
| 14 | Specify if the title includes a early payment clause by the issuer wherein the right to pay the title early is exercised with prior authorization from Banco de Mexico. |
| 15 | Date when the issuer may, for the first time, exercise the right to pay the title early prior authorization from Banco de Mexico. |
| 15A | Specify if the early payment clause considers regulatory or fiscal events. |
| 15B | Specify the liquidation price of the early payment clause. |
| 16 | Dates when the issuer may, subsequently to the one specified in reference 15, exercise the right of title early payment prior authorization from Banco de Mexico |
| 17 | Specify the type of yield/dividend that shall be held during the entire term of the title. |
| 18 | Interest rate or index referred to by the title's yield/dividend. |
| 19 | Specify if the title includes clauses that forbid payment of dividends to the holders of titles representing the capital stock when failing to perform payment of a coupon or dividend of any capital instrument. |
| 20 | issuer's discretionarily for payment of the title's interests or dividends. If the Institution at any time may cancel payment of yields or dividends it must be selected (entirely Optional); if it may only cancel in some situations (partially Optional) or if the credit institutions may not cancel payment (Mandatory) |
| 21 | Specify if in the title there is a clause that generates incentives that the issuer may early pay, as clauses of increase of interests known as "Step-Up". |
| 22 | Specify if yields or dividends of the title are accruable or not. |
| | |
| | 1Q.15| EARNINGS RELEASE | 84 |
| | | |
| 23 | Specify if the title is convertible or not in ordinary shares of the multiple banking institutions or the Financial Group. |
| 24 | Conditions under which the title is convertible into ordinary shares of the multiple banking institution or Financial Group. |
| 25 | Specify if the title is wholly converted or only partially when it meets the contractual conditions to convert. |
| 26 | Amount per share considered for converting the title into ordinary shares of the multiple banking institution or the Financial Group into the currency on which such instrument was issued. |
| 27 | Specify if the conversion is mandatory or optional. |
| 28 | Type of shares into which the title is converted. |
| 29 | Issuer of the instrument into which the title is converted. |
| 30 | Specify if the title has the principal cancellation characteristics. |
| 31 | Conditions under which the title has a principal cancellation characteristics. |
| 32 | Specify if once the hypothesis of the value decrease clause occurs, the title decreases value in its aggregate or only partially. |
| 33 | Specify if once the hypothesis of the value decrease clause occurs, the instrument decreases value permanently or temporarily |
| 34 | Explain the temporary value decrease mechanism. |
| 35 | Most subordinated position to which the capital instrument is subordinated that corresponds to the type of instrument in liquidation. |
| 36 | Specify whether there is or not characteristics of the title that fails to meet with the conditions established in exhibits 1-Q, 1-R and 1-S hereof. |
| 37 | Specify the characteristics of the title that fail to meet the characteristics established in exhibits 1-Q, 1-R and 1-S hereof. |
The information relating to Anexx 1-O Capitalization Ratio Santander Consumo and Santander Hipotecario is available on the website
www.santander.com.mx/ir
| 15. Risk Diversification |
| Pursuant to the general rules for risk diversification in the performance of borrowing and lending transactions applicable to credit institutions, published in the Federal official Gazette on April 30, 2003, the following information with respect to credit risk transactions as of March 31, 2015, is provided: |
| - At March 31, 2015 did not have financing granted to debtors or groups of individuals representing single common risk is greater the amount of core capital (the month immediately preceding the date that is reported) Bank. |
| - Loans granted to the three major debtors or groups of persons representing a common risk for a total amount of $32,801 repreenting the 41.37% of the basic capital of the Bank. |
16. Internal and external Sources of Liquidity
Internal sources of liquidity in domestic and foreign currency come from the different savings products that Banco Santander México offers to clients; mainly checking accounts and time deposits.
With respect to external sources of liquidity, the Bank has several alternatives to access capital markets through the issuance of senior and subordinated debt as well as through the issuance other debt or capital instruments. The bank also obtains funding from other institutions including Banxico, commercial banks and other institutions.
The bank may also obtain liquidity via sale and repurchase agreements of securities (short-term repos) possessed by Banco Santander México. Additionally, the bank could obtain liquidity through the sale of assets.
17. Dividends Policy
| | 1Q.15| EARNINGS RELEASE | 85 |
| | | |
Santander México performs the payment of dividends pursuant to the applicable legal, administrative, fiscal and accounting rules, based in the results obtained by the Institution. The Board of Directors proposes the payment of dividends at the Ordinary General Stockholders’ Meeting, which is the body that orders and approves the payment of dividends to the stockholders of the institution.
18. Treasury Policies
The activities of Santander México’s treasury are performed pursuant to the following:
| a) | In compliance with the provisions issued by the different authorities of the financial system for bank institutions, such as guidelines for lending and borrowing transactions, accounting rules, liquidity ratios, regulatory matching, capacity of the payment systems, etc. |
| b) | Internal limits for market, liquidity and credit risks, i.e., there are limits for the management of the assets and liabilities of the bank with respect to the market and liquidity risk derived from such management, as well as the limits regarding counterparty risk derived from the daily transactions. |
| c) | Compliance with the guidelines stipulated by national and international standard agreements regarding transactions performed in markets. |
| d) | Sound market practices. |
| e) | Strategies proposed in the banks internal committees. |
| | f) | Compliance with the operation procedures of the institution. |
| 19. Shareholding | | |
| | | |
| Subsidiaries | | % of interest |
| | | |
| Banco Santander (México), S.A. | | 99.99% |
| Casa de Bolsa Santander, S.A. de C.V. | | 99.97% |
20. Internal Control
The activities of Santander México are governed by a series of guidelines established by Banco Santander (España), the holding company of Santander México, whose head offices are located in the city of Madrid, and the Mexican laws.
For the compliance of the rules in effect, Santander México has developed and implemented an Internal Control Model (ICM) which includes the participation of the Board of Directors, the statutory advisor, the Audit Committee, the Internal Audit Department, the General Direction, the Internal Control Unit and the Regulatory Control Department.
The ICM is based in the identification and documentation of the main risks and the periodic assessment of the controls that are created to mitigate such risks. ICM guarantees, among other aspects, the design, establishment and updating of measures and controls that promote the compliance with the internal and external rules and the proper operation of the data processing systems.
The internal control system includes:
The implementation of an organizational structure has allowed the development and growth of the group. Such structure is constituted as follows:
CEO and General Direction
The following functions report to the CEO and General Direction:
| § | Vice-president of Finance and Administration: |
| Ø | Deputy General Direction of Intervention and Management Control |
| | 1Q.15| EARNINGS RELEASE | 86 |
| | | |
| | Ø | Deputy General Direction of Technology, Operations and Quality |
| | Ø | Deputy General of Human Resources, Organization and Costs |
| | Ø | Deputy General Direction of Legal Affairs |
| | Ø | Counsel for Legal Affairs |
| | Ø | Executive Direction of Competitive Strategy |
| | Ø | Executive Direction of Financial Management |
| | Ø | Executive Direction of Investor Relations and Shareholders |
| | Ø | Executive Direction of Financial Strategy |
| § | Vice-president of Commercial Banking: |
| | Ø | Deputy General Direction of Commercial Strategy |
| | Ø | Deputy General Direction of Companies and Institutions Banking |
| | Ø | Deputy General Direction of Particulars and Small Enterprises Banking |
| | Ø | Deputy General Direction of Payment Systems |
| | Ø | Deputy General Direction of Private Banking |
| | Ø | Executive Direction of Universities-Universia |
| | Ø | Executive Direction of Analysis and Commercial Planning |
| | Ø | Executive Director of Deposits, Bank Savings Protection and Investment |
| § | Deputy General Director of Credit |
| § | Deputy General Director of Wholesale Banking |
| § | Deputy General Director of Institutional Relations and Communications |
| § | Executive Direction of Internal Audit |
| § | Executive Direction of Advertising and Corporate Image |
| § | Executive Direction Corporate of Recoveries and Assets Reestructuring |
The roles and responsibilities of each direction have been stipulated in order to optimize the performance of the activities of Santander México.
The Organization area related to the Executive Direction of Processes and Change Management, via manuals, circulars and bulletins, governs the activities of the group; likewise, the Regulatory Control Department has established a general Code of Conduct that every employee of Santander México has to follow.
The structure of Santander México includes the constitution of a Board of Directors, which establishes the objectives, the policies and general procedures of Santander México, the appointment of directors and the constitution of committees that are to supervise the development of the activities of Santander México.
The committees that supervise the development of the entities that constitute Santander México, created by the Board of Directors, are the following:
| § | Corporate Practices, Nominating and Compensation Committee |
| § | Integral Risk management Committee |
| § | Communication and Control Committee |
The registration, control and storage of the daily activities of Santander México are carried out by systems mainly designed and focused on the banking and brokerage activity. The common platform for such purposes is known as ALTAIR and it is applied by all the entities in Latin America that are part of Banco Santander (España).
Loans portfolio and transactions of commercial banking of the group are controlled and registered at ALTAIR. Treasury activities are controlled and registered in computer platforms and the operations are centralized for its
| | 1Q.15| EARNINGS RELEASE | 87 |
| | | |
accounting registration in ALTAIR. Such platforms comply with the parameters stipulated by the CNBV with respect to reliability and accuracy.
Santander México is regulated by the CNBV, and therefore, the financial statements are prepared according to the accounting practices stipulated by such Commission via the issue of accounting circulars, general official letters and particular official letters regarding the accounting registration of transactions. For such purposes, the accounting system of Santander México has been structured with an accounts catalog stipulated by the Commission, and all the reports come from such system and comply with the applicable provisions.
Within Santander México, there is an independent area of Internal Audit, whose mission is to oversee the compliance, efficacy and efficiency of the internal control systems of the Group, as well as the reliability and quality of the accounting information.
To achieve so, Internal Audit verifies that the risks inherent to the activity of Santander México are properly covered and the policies stipulated by the Direction, the applicable internal and external regulations and the procedures are observed.
The results of the activities of Internal Audit are reported on regular basis to the General Direction, the Audit Committee and the Board of Directors. Among other issues, the results of the audits performed to the different business units of the companies that constitute Santander México and the follow up of the recommendations provided to the different areas and/ or entities are informed.
Internal Audit has a quality system oriented to the client satisfaction focus on continuous process improvement, which has been subject to a successfull Quality Assurance Review (QAR) during 2013
In summary, Internal Control of Santander México includes the continuous development, implementation and updating of an internal control model where all the areas of the group have an active role.
During the quarter, there have been no changes to the internal controls and internal audit guidelines.
| 21. Accounting differences between CNBV regulations in Mexico and the Circular issued by Bank of Spain |
| | | | | |
| Earnings of Grupo Financiero Santander México under CNBV regulations in Mexico | | | 3,215 | | |
| | | | | | |
| Temporary differences in classification and assessment of sale and repurchase agreements and investment securities | | | 19 | | (a) |
| Income and expenses from the Headquarter | | | 97 | | (b) |
| Other differences between CNBV regulations in Mexico and the Circular issued by Bank of Spain | | | 295 | | |
| Earnings of Grupo Financiero Santander México under the regulations set forth in the Circular issued by the Bank of Spain | | | 3,626 | | |
| | | | | | |
| (a) | According to the local regulations, as of september 30, 2008, the market valuation of securities classified as trading securities was recognized in the income statement; for Spain, such securities are classified as available for sale and, pursuant to the Circular issued by Bank of Spain, its valuation is recognized in stockholders' equit until they mature or sold. |
| (b) | Allocation of corporate income and expenses performed by the Corporate Head Office to its subsidiaries, pursuant to the rules and policies of bank of Spain. |
| 22. Transactions with related parties | | | |
| | | | |
| Receivable | | | |
| Funds available | | | 50 | |
| Derivatives (asset) | | | 28,699 | |
| | 1Q.15| EARNINGS RELEASE | 88 |
| | | |
| Performing loan portfolio | | | 1,615 | |
| Other receivables, (net) | | | 14,550 | |
| | | | | |
| Payable | | | | |
| Demand deposits | | | 1,111 | |
| Credit instruments issued | | | 758 | |
| Creditors under sale and repurchase agreements | | | 1,807 | |
| Derivatives (liability) | | | 21,987 | |
| Other payables | | | 1,972 | |
| Creditors from settlement of transactions | | | 5,848 | |
| Subordinated debentures | | | 15,880 | |
| | | | | |
| Income | | | | |
| Interest | | | 31 | |
| Commissions and fee income | | | 1,258 | |
| Result from derivative financial instrument transactions | | | 32,917 | |
| | | | | |
| Expense | | | | |
| Interest | | | 242 | |
| Administrative expenses | | | 85 | |
| Result from derivative financial instrument transactions | | | 30,919 | |
| Technical assistance | | | 437 | |
| 23. Interests on loan portfolio |
| |
| As of March 31, 2015, the consolidated statement of i includes in the item "Interest income " Mx$11,431 million that correspond to interests from the loan portfolio of Banco Santander (Mexico), S.A., Santander Consumo, S.A. de C.V. SOFOM E.R., Santander Hipotecario, S.A. de C.V. SOFOM E.R. and Santander Vivienda, S.A. de C.V. SOFOM E.R. |
24. Integral Risk Management (unaudited) |
Risk management is considered by Grupo Financiero Santander as a competitive element of strategic nature with the purpose of maximizing the value for the stockholder. This management is defined, from a conceptual and organizational sense, as a comprehensive management of the different risks (market risk, liquidity risk, credit risk, counterparty risk, operative risk, legal risk and technological risk) assumed by Grupo Financiero Santander for the development of its activities. The management of the risk inherent to transactions is essential for understanding and determining the behavior of the financial condition of Grupo Financiero Santander and the creation of long-term value.
In order to comply with the provisions regarding the Comprehensive Risk management applicable to credit institutions, issued by the National Banking and Exchange Commission, the Board of Directors agreed to create the Comprehensive Risk Management Committee of Grupo Financiero Santander, to work pursuant to the rules set by such regulations. This Committee gathers every month and verifies that the transactions are according to the objectives, policies and procedures approved by the Board of Directors for the Comprehensive Risk Management.
The Comprehensive Risk management Committee delegates in the Comprehensive Risk Management Unit the responsibility for the implementation of procedures for the measure, administration and control of risks according to the applicable policies; such Unit has the faculty to authorize amounts greater than the stipulated limits and in such cases, the Board of Directors shall be informed on such deviations.
Market Risk
| | 1Q.15| EARNINGS RELEASE | 89 |
| | | |
The Market Risk Management department of the Comprehensive Risk management Unit is responsible for recommending the policies on market risk management of Grupo Financiero Santander, and to establish the parameters for risk measuring, and to provide reports, analysis and assessments to the senior management, to the Comprehensive Risk management Committee and to the Board of Directors.
The market risk management is to identify measure, monitor and control risks arising from fluctuations in interest rates, exchange rates, prices and other market risk factors in currency, money, capital and derivative markets that are exposed the positions that belong to Grupo Financiero Santander.
The market risk measurement quantifies the potential variation in the value of the positions as a consequence of changes in the market risk factors.
Depending on the nature of the activities of each business unit, debt and capital instruments are registered as securities for trade, securities available for sale and or securities held to maturity. The main characteristic that identifies securities available for sale is their permanent nature and they are managed as an structural part of the balance sheet. Grupo Financiero Santander has established provisions that all securities available for sale must fulfill, as well as adequate controls for the compliance of such provisions.
Whenever significant risks are identified, they are measured and limits are allocated in order to assure an adequate control. Global measurement of risk is carried out via a combination of the methodology applied to Portfolios for Trade and to the management of Assets and Liabilities.
Trading Books
In order to measure the risk in a global approach, the methodology of Value at Risk (“VaR”) is used. VaR is defined as the statistical estimate of the potential loss of value of a given position, during certain period and at certain confidence level. VaR provides a universal measure of the level of exposure of the different risk portfolios; it allows the comparison of the risk level assumed in different securities and markets and expresses the level of each portfolio through a unique figure in economic units.
VaR is calculated via historical simulation, with a 521 working-days window (520 percentage changes) and a one-day horizon. The calculation is performed from a series of simulated gains and losses with 1% percentile at constant pesos and with pesos decreasing on an exponential basis, with a decrease factor that is reviewed on annual basis, the most conservative measure is the one to be reported. A confidence level of 99% is assumed.
Note that the historical simulation model is limiting to assume that the recent past represent the near future.
The Value at Risk as of the end of first quarter of 2015 (unaudited) amounted to:
| | 1Q.15| EARNINGS RELEASE | 90 |
| | | |
| | Bank and Brokerage |
| | VaR (thousand of mexican pesos) | % |
| Trading Desks | 55,668.41 | 0.06% |
| Market Making | 52,379.21 | 0.05% |
| Prop Trading | 19,562.94 | 0.02% |
| | | |
| Risk factor | 55,668.41 | 0.06% |
| Interest rate | 52,608.75 | 0.05% |
| Foreign exchange | 7,181.45 | 0.01% |
| Equity | 21,826.57 | 0.02% |
| * % of VaR with respect to Net Capital | |
| The Value at Risk for the average the first quarter of 2015 (unaudited) amounted to: |
| | Bank and Brokerage |
| | VaR (thousand of mexican pesos) | % |
| Trading Desks | 58,362.48 | 0.06% |
| Market Making | 52,800.58 | 0.05% |
| Prop Trading | 20,816.58 | 0.02% |
| | | |
| | | |
| Risk factor | 58,362.48 | 0.06% |
| Interest rate | 50,092.54 | 0.05% |
| Foreign exchange | 9,408.05 | 0.01% |
| Equity | 24,396.15 | 0.02% |
| * % of VaR with respect to Net Capital | |
Likewise, monthly simulations of gains or losses of portfolios are carried out by revaluating such portfolios under different scenarios (Stress Test). Such estimates are generated using two different methods:
| | § | Applying to risk factors the percentage changes observed in certain periods including relevant market turbulences. |
| | § | Applying to risk factors changes that depend on the volatility of each risk factor. |
On a monthly basis “back testing” is carried out to compare daily gains and losses that would have been observed is the same positions had been maintained, taking into account only the change in value at risk in order to be able to fine tune the models. Even though these reports are prepared on a monthly basis, they include daily tests.
Assets and Liabilities Management
Commercial banking activities of Grupo Financiero Santander generate important balance sheet amounts. The Assets and Liabilities Committee (“ALCO”) is responsible for determining the guidelines for the management of financial margin risk, net worth value and liquidity that must be followed by the different commercial portfolios. Pursuant to this approach, the General Direction of Finances has the responsibility to execute the strategies defined by the Assets and Liabilities Committee in order to modify the risk profile of the commercial portfolio by
following the corresponding policies. Compliance with information requirements for interest rate, Exchange rate and liquidity risks is fundamental.
| | 1Q.15| EARNINGS RELEASE | 91 |
| | | |
As part of the financial management of Grupo Financiero Santander, sensitivity to Net Interest Income (“NIM”) and Market Value of Equity (“MVE”) of the different balance sheet items is analyzed in comparison to variations in interest rates. This sensitivity is derived from the difference between maturity dates of assets and liabilities and the dates interest rates are modified. The analysis is performed from the classification of each item sensitive to interest rate throughout time, according to their repayment, maturity or contractual modification of the applicable interest rate.
| | Sensitivity NIM | | Sensitivity MVE |
| Bank and Brokerage | Jan-15 | Feb-15 | Mar-15 | Average | | Jan-15 | Feb-15 | Mar-15 | Average |
| Balance MXN GAP | 81% | 83% | 76% | 80% | | 39% | 35% | 39% | 38% |
| Scenario | (100)bp | (100)bp | (100)bp | N/A | | +100bp | +100bp | +100bp | N/A |
| Balance USD GAP | 6% | 4% | 3% | 4% | | 5% | 22% | 22% | 16% |
| Scenario | (25)bp | -50bp | (25)bp | N/A | | (75)bp | (100)bp | (100)bp | N/A |
Using simulation techniques, the predictable change of the net interest income and the market value of equity are measured in different interest rate scenarios, and their sensitivity under extreme movement of such scenarios, as of the end of the first quarter of 2015:
| MM MXN | Sensitivity NIM | | Sensitivity MVE |
| Bank and Brokerage | Scenario | Total | Derivatives | Non Derivatives | | Scenario | Total | Derivatives | Non Derivatives |
| Balance MXN GAP | (100)bp | (1,134) | (137) | (997) | | +100bp | (2,219) | 1,063 | (3,281) |
| Balance USD GAP | (25)bp | (10) | 24 | (34) | | (100)bp | (117) | 1,345 | (1,462) |
The Assets and Liabilities Committee adopts investment and hedging strategies in order to maintain such sensitivities within the target range.
Limits
Limits are used to control global risk of the financial group derived from each portfolio and books. The structure of limits is used to control exposures and to establish the total risk authorized to business units. These limits are established for VaR, Loss alert, maximum loss, equivalent volume of interest rate, delta equivalent in equity, open foreign currency positions, sensitivity of net interest income and sensitivity of market value of equity.
Liquidity Risk
| | 1Q.15| EARNINGS RELEASE | 92 |
| | | |
Liquidity risk is related to the ability of Grupo Financiero Santander to finance acquired commitments at reasonable market prices, as well as to fulfill business plans with stable financing sources. Risk factors may be external (liquidity crisis) and internal due to excessive concentration of maturities.
Grupo Financiero Santander carries out a coordinated management of maturities of assets and liabilities, and oversees the maximum timing difference profiles. This monitoring is based in the analysis of maturities of assets and liabilities, both contractual and managerial. Grupo Financiero Santander realizes a control for the maintenance of a sufficient quantity of liquid assets to guarantee a horizon of survival during a minimum of days facing a scene of stress of liquidity without resorting to additional financing sources. The risk of Liquidity is limited in terms of a minimal period of days established for local, foreign and consolidated currencies. It is necessary to indicate that in the current quarter incidents have not been had in the metrics.
| Millions of Pesos | | Total | | 1D | 1W | 1M | 3M | 6M | 9M | 1Y | 5Y | >5Y |
| | | | | | | | | | | | | |
| Structural GAP | | 104,053 | | 36,826 | 129,144 | (60,735) | (14,242) | 33,039 | 31,575 | 8,247 | (82,775) | 22,972 |
| Non Derivative | | 100,704 | | 36,789 | 128,955 | (60,463) | (14,511) | 32,597 | 30,638 | 7,389 | (83,798) | 23,107 |
| Derivatives | | 3,349 | | 37 | 189 | (272) | 269 | 443 | 937 | 858 | 1,023 | (135) |
Management of credit risk of Grupo Financiero Santander is developed differently for the different segments of clients along the three phases of the credit process: acceptance, follow-up and recovery.
From a global perspective, management of credit risk in Grupo Financiero Santander is responsible for the identification, measurement, integration and assessment of the aggregated risk and the profitability according to such risk; with the purpose of oversee the levels of risk concentration and to adapt them to the limits and objectives previously established.
Risks managed on individual basis are based on expert analysis and complemented by a solvency or rating system with a related probability of failure that allows the measuring of the risk for each client and for each transaction from the beginning of the credit cycle.
Standardized risks require, due to their special characteristics (great number of transactions for relatively low amounts), a different management that allows an efficient process and effective use of resources. The management of these risks are based on and automated decision tools, complemented when needed by the expert judgement of analysts teams.
Risk management of loans to companies is additionally complemented, during the follow-up phase, with the so called “system of special monitoring” that determines the policy to be followed in the management of the risks with companies or groups rated within such category. Different situations or monitoring levels are identified thus deriving in different types of actions. A special monitoring grade is given in the case of alert signals, systematic reviews, or specific initiatives promoted by the Risks Department or Internal Audit.
Recovery Units constitute a critical element in the management of irregular risk, in order to minimize the final loss for Grupo Financiero Santander. These units are responsible for a specialized management of the risk from the moment they are classified as irregular risk loans (defaulting payment).
| | 1Q.15| EARNINGS RELEASE | 93 |
| | | |
Grupo Financiero Santander has carried out a policy for the selective growth of risk and a strict treatment of late payments and the creation of the corresponding provisions, based in the prudent criteria defined by the Group.
Probability of Default and Expected Losses
Pursuant to the provisions on Comprehensive Risk Management included in the general regulations applicable to credit institutions, as part of the credit risk management, credit institutions must determine the probability of default.
The system allows the calculation of the probability for the different loans portfolios.
a. The probability of default ("PD") for portfolios "Retail" and "No Retail" is determined through the calibration of ratings from customers in one or more specific times, which are chosen based on the stability presented against the latest known sample.
Subsequently, a dither of rating/scores is done on these grading samples. A default rate and an average of the calibration sample is estimated on each of the sections, which eventually adjusts the cycle using a historical period of 10 years.
b. Once the probability of default is determined, the parameters of “Severity of Loss” (“LGD”) and “Exposure at Default” (“EAD”) calculated with internal models, are taken into consideration.
For the calculation of the “LGD” recovery and expenditure movements from the time of default (more than 90 days overdue) are used and these movements are deducted or added to the credit amount with which the recovery period began to do this, seven-year historical data is used.
The calculation of the “EAD” is only used for revolving products and seven-year historical data is also used. To estimate the “EAD” the twelve-month balances prior to default are taken and compared against the credit balance at the time of entering default.
Once the abovementioned factors are obtained, the Expected Loss (“PE”) is calculated as follows:
Expected Loss = Probability of Default x Severity of Loss x Exposure at Default
i.e.: PE = PD * LGD * EAD
Counterparty Risk
Included in the credit risk, there is a concept that, due to its characteristics, it requires a special management: the Counterparty Risk.
Counterparty Risk is the risk Grupo Financiero Santander assumes with governmental entities, financial institutions, corporations, companies and individuals in their treasury activities and correspondent bank activities. The measurement and control of the Credit Risk in Financial Instruments, Counterparty Risk, is carried out by a special unit with an organizational structure independent from the business areas.
The control of Counterparty Risk is performed daily via the Interactive Risk Integrated System (“IRIS”), which informs the credit line available with any counterparty, in any product and any term.
For the control of the counterparty lines, the Equivalent Credit Risk (“REC”) is used. REC is an estimate of the amount Grupo Financiero Santander may lose in current transactions with certain counterparty,
| | 1Q.15| EARNINGS RELEASE | 94 |
| | | |
if such counterparty commits a default in any moment until the maturity date of transactions. REC takes into account the Current Credit Exposure, which is defined as the cost to substitute the transaction at market value provided that this value is positive for Grupo Financiero Santander, and it is measured as the market value of the transaction (“MtM”). In addition, REC includes the Potential Credit Exposure or Potential Additional Risk (“RPA”), which represents the possible evolution of the current credit exposure until maturity, given the characteristics of the transaction and the possible variations in the market factors. The REC Gross considers definitions described above, without considering mitigating by netting or by mitigating collateral.
For the calculation of REC, mitigating factors of the counterparty credit risk are taken into consideration, such as collaterals, netting agreements, among other. The methodology continues to be effective.
In addition to the Counterparty Risk, there is the Settlement Risk, which is present in every transaction at its maturity date, when the possibility that the counterparty does not comply with its payment obligations arises, once Grupo Financiero Santander has complied with its obligations by issuing payment directions.
For the process of control for this risk, the Deputy General Direction of Financial Risks oversees on a daily basis the compliance with the limits on counterparty credit risks by product, term and other conditions stipulated in the authorization for financial markets. Likewise, it is the responsible for communicating on a daily bases, the limits, consumptions and any incurred deviation or excess.
On a monthly basis, a report is presented to the Comprehensive Risk management Committee, and on quarterly basis, to the Board of Directors, with respect to the limits to Counterparty Risks, Issuer Risks and current consumptions, as well as incurred excesses and transactions with non authorized customers. In addition, it informs the calculation of the Expected Loss for current transactions in financial markets at the closing of every month and different scenarios of stress of Expected Loss. All of the above according to the methodologies and assumptions approved by the Comprehensive Risk Management Committee.
Currently, we have approved lines of Counterparty Risks in Grupo Financiero Santander for the following segments: Mexican Sovereign Risk and Domestic Development Banking, Foreign Financial Institutions, Mexican Financial Institutions, Corporations, Companies Banking-SGC, Institutional Banking, Large Enterprises Unit, Project Finance.
Equivalent Net Credit Risk of the lines of Counterparty Risk and Issuer Risk of Grupo Financiero Santander for the first quarter of 2015:
| | Equivalent Net Credit Risk (millions of american dollars) |
| Segment | jan-15 | feb-15 | mar-15 | average |
| Sovereign Risk, Development Banking and Financial Institutions | 17,052.66 | 18,658.41 | 19,212.35 | 18,307.81 |
| Corporates | 1,428.11 | 1,331.15 | 1,317.32 | 1,358.86 |
| Companies | 171.28 | 176.60 | 169.14 | 172.34 |
| | 1Q.15| EARNINGS RELEASE | 95 |
| | | |
The equivalent credit risk lines maximum gross counterparty risk of Grupo Financiero Santander as of the end of the first quarter of 2015, which corresponds to derivative transactions, is distributed depending on the type of derivative:
| | Equivalent Gross Credit Risk (millions of american dollars) |
| Type of Derivative | End of the first quarter of 2015 |
| Interest Rate Derivatives | 14,442 |
| Exchange Rate Derivatives | 19,041 |
| Bonds Derivatives | 259 |
| Equity Derivatives | 514 |
| Total | 34,257 |
The Expected Loss of Grupo Financiero Santander at the end of the first quarter of 2015, and the quarterly average of the expected loss of the lines of Counterparty risk and issuer risk of Grupo Financiero Santander, for the first quarter of 2015 are:
| | Expected Loss (millions of american dollars) |
| Segment | jan-15 | feb-15 | mar-15 | average |
| Sovereign Risk, Development Banking and Financial Institutions | 4.98 | 5.26 | 4.92 | 5.05 |
| Corporates | 3.86 | 3.67 | 3.49 | 3.67 |
| Companies | 1.15 | 1.20 | 1.14 | 1.16 |
The segments of Mexican Financial Institutions and Foreign Financial Institutions are very active counterparties with whom Grupo Financiero Santander has current positions of financial instruments with Counterparty Credit Risk. It is important to mention that Equivalent Credit Risk is mitigated by netting agreements (ISDA-CMOF) and, in some cases, by collateral agreements (CSA-CGAR) or revaluation agreements with counterparties.
Respect to total collateral received for derivatives transactions as of the end of the first quarter of 2015:
| Cash colateral | 62.27% |
| Collateral refer to bonds issued by the Mexican Federal Government | 37.73% |
| | 1Q.15| EARNINGS RELEASE | 96 |
| | | |
Legal Risk
Legal Risk is defined as the potential loss due to the failure to comply with the applicable legal and administrative regulations, the issue of administrative and judicial resolutions against Grupo Financiero Santander and the application of fines, with respect to the transactions carried out by Grupo Financiero Santander.
Pursuant to the provisions regarding the Comprehensive Risk Management, the following activities are performed: a) Establishment of policies and procedures for analyzing the legal validity and the proper execution of the legal acts. b) estimates of the amount of potential losses derived from judicial or administrative orders against Grupo Financiero Santander and the possible application of fines c) Analysis of the legal acts governed by a legal system different to the Mexican laws, d) communication to directors and employees on the legal and administrative regulations applicable to transactions and e) the performance, at least on annual basis, of internal legal audits.
Operating Risk
With respect to Operating Risk, and pursuant to the corporate methodology, Grupo Financiero Santander has established policies, procedures and methodologies for the identification, control, mitigation, monitoring and reporting of operating risks.
For the identification and classification of operating risks, different categories and business lines defined by national and internal regulating organisms are used. The methodology is based in the identification and documentation of the corresponding risks, controls and processes, and quantitative and qualitative tools are used, such as self-assessment questionnaires, development of historical data bases and Operating Risk indicators, etc. for their control, mitigation and reporting.
Technological Risk
Technological risk is defined as the potential loss due to damages, discontinuation, alterations or failures derived from the use or dependence on hardware, software, systems, applications, networks and any other data channel distribution for the provision of banking services to the clients of Grupo Financiero Santander.
Grupo Financiero Santander has adopted a corporate model for the management of Technological Risks, integrated to the processes of service and support to computing areas in order to identify, oversee, control, mitigate and report the Computing Technology Risks the transaction is exposed to, with the aim of establishing control measures that decrease the probability of risks to occur.
Processes and levels of authorization
Pursuant to internal regulations, all the products and services traded by Grupo Financiero Santander are approved by the “Product Admission Committee” and by the “Corporate Product Admission Committee”. Those products or services that are modified or extended with respect to their original approval must be approved by the “Product Admission Committee” and, depending of their relevance, the “Corporate Product Admission Committee” must approve them too.
All areas taking part in the operation of the product or service, depending on the nature of such product or service, as well as the areas responsible for their accounting registration, legal formalization, fiscal treatment, risk assessment, etc. are present in the Committee. All approvals shall be unanimous as there are no authorizations approved by majority of votes. In addition to the Committee’s approval, there are products that require authorizations from local authorities, and therefore, the Committee’s approvals are subject to the authorizations issued by the competent authorities in each case.
Finally, all the approvals shall be authorized by the Comprehensive Risk Management Committee.
Independent Reviews
Grupo Financiero Santander is subject to the monitoring and supervision of the National Bank and Exchange Commission, the Central Bank of Mexico and the Bank of Spain, and such monitoring and supervision is exercised via follow-up processes, inspection visits, information requests, delivery of documents and reports.
| | 1Q.15| EARNINGS RELEASE | 97 |
| | | |
Likewise, periodic reviews are performed by Internal and External Auditors.
General description of the valuation techniques
Derivative financial securities are valued at reasonable value, according to the accounting rules established in the Circular Letter for Credit Institutions issued by the National Banking and Exchange Commission, in Principle B-5 “Derivative Financial Instruments and hedging Transactions” and the provisions in Principle A-2 “Application of specific rules”, and the provisions in the specific rule included in Bulletin C-10 of the Financial Information Rules.
| A. | Methodology of Valuation |
Valuation is made at the corresponding closing market price. Prices are provided by the supplier of prices.
| b) | Over-the-Counter Markets |
| i) | Derivative financial instruments with optionality. |
In the majority of the cases, a general form of the Black & Scholes model is used. Such model assumes that the underlying product follows a lognormal distribution. For exotic products or when payment depends on the trajectory of any market variable, MonteCarlo simulations are used. In this case, it is assumed that logarithms of the different variables follow a multi-varied normal distribution.
| ii) | Derivative financial instruments with no optionality. |
| The valuation technique is to obtain the present value of the estimated future flows. |
| In all cases, Grupo Financiero Santander carries out the valuation of its positions and registers the corresponding value. In some cases, a different calculation agent is designated, and such calculation agent may be the counterparty or a third party. |
In the performance of its commercial banking activities, Grupo Financiero Santander has tried to cover the evolution of the financial margin of structured portfolios that are exposed to adverse movements in interest rates. The ALCO, the body responsible for the management of long-term assets and liabilities, has constituted the portfolio via which the Grupo Financiero Santander achieves such hedge.
| | An accounting hedge is defined as a transaction that complies with the following conditions: |
| a. | A hedge relationship is designated and documented from the beginning in an individual file, where its objective and strategy is established. |
| b. | The hedge is effective for the compensation of variations in the reasonable value or in the cash flows attributed to such risk, according to the risk management documented at the beginning. |
| The Management of Grupo Financiero Santander performs derivative transactions for hedging purposes with swaps. |
Derivatives for hedging purposes are valued at market value, and the effect is recognized depending on the type of accounting hedge, pursuant to the following:
| | 1Q.15| EARNINGS RELEASE | 98 |
| | | |
| a. | In the case of fair value hedges, they are valued at market value for the risk covered, the primary position and the hedging derivative instrument, and the net effect is registered in the statement of income of the corresponding period. |
| b. | In the case of cash flow hedges, the hedging derivative instrument is valued at market value. The effective portion of the hedge is registered in the comprehensive income account, within the stockholders’ equity, and the ineffective portion is registered in the statement of income. |
Grupo Financiero Santander ceases the recording of hedges at the maturity date of the derivative, or when such derivative is sold, cancelled or exercised; when the derivative does not reach a high efficiency in compensating the changes in the reasonable value or the cash flows of the covered item, or when Grupo Financiero Santander decides to cancel the hedge.
It shall be fully evidenced that the hedge fulfills the objective for which derivatives were contracted for. This effectiveness requirement assumes that the hedge must comply with a maximum range of deviation with respect to the initial objective of 80% to 125%.
In order to demonstrate the efficacy of hedges, two tests are to be carried out:
| | a. | Forward-looking Test: it is demonstrated that, in the future, the hedge will be within the aforementioned range of deviation. |
| | b. | Retrospective Test: This test reviews if, in the past, from its initial date to now, the hedge has been maintained within the allowed range of deviation. |
| | c. | In the cases of Fair Value Hedges and the Cash Flow Hedges, they are retrospective and forward-looking efficient and within the allowed maximum range of deviation. |
| | The most relevant reference variables are: |
| | Baskets of equities and stock indexes. |
| | Derivative financial instruments for trading and hedging purposes are valued on a daily basis. |
Management of internal and external sources of liquidity that may be used for the compliance of requirements related to derivative financial instruments.
Resources are obtained via the National and International Treasury departments.
Changes in exposure to identified risks, contingencies and events, known or expected, in derivative financial instruments.
At the end of the first quarter of 2015, Grupo Financiero Santander has no situation or contingency such as changes in the value of the underlying asset or the reference variables, that may cause the use of the derivative financial instruments to be different to their original intended use, a significant change in their scheme or the total or partial loss of the hedge, requiring the Issuer to assume new obligations, commitments or variations in its cash
| | 1Q.15| EARNINGS RELEASE | 99 |
| | | |
flow or affecting its liquidity (day trade calls), nor contingencies or events known or expected by the Management that may affect future reports.
| Banco Santander México |
| Summary of Derivative Financial Instruments |
| (Million of Mexican pesos as of December 31, 2014) |
| | | | | | |
| Derivatives | Underlying Asset | Purposes trading or hedging | Notional | Fair Value | |
| Current Quarter | Previous Quarter |
| |
| | | | | | |
| Forwards | Interest Rate | Trading | 0 | 0 | 0 |
| Forwards | Foreingn Currency | Trading | 279,132 | (2,579) | 240 |
| Forwards | Equity | Trading | 17,277 | (233) | (102) |
| | | | | | |
| Futures | Foreingn Currency | Trading | 718 | (11) | 0 |
| Futures | Market Index | Trading | 11,592 | 333 | 48 |
| Futures | Interest Rate | Trading | 177,804 | (549) | (837) |
| Futures | Equity | Trading | 2 | 0 | 0 |
| | | | | | |
| Options | Equity | Trading | 3,493 | (403) | (723) |
| Options | Foreingn Currency | Trading | 111,520 | 246 | (266) |
| Options | Market Index | Trading | 332,470 | 540 | 374 |
| Options | Interest Rate | Trading | 354,423 | (858) | (855) |
| | | | | | |
| Swaps | Cross Currency | Trading | 760,952 | (197) | 1,578 |
| Swaps | Interest Rate | Trading | 3,000,622 | 1,476 | 1,609 |
| | | | | | |
| Forwards | Foreingn Currency | Hedging | 53,053 | (1,008) | (1,157) |
| | | | | | |
| Swaps | Cross Currency | Hedging | 49,648 | 1,366 | (1,959) |
| Swaps | Interest Rate | Hedging | 9,612 | (7) | (158) |
The Institution, at the execution of transactions of OTC derivative financial instruments, has Collateral formalized agreements with many of its counterparties, which function as market value guarantee of the derivative transactions, and it is determined based on the exposure of the net position on risk with each opposing party. The managed Collateral consists mainly in cash deposits, whereat there is not a deterioration situation.
| | 1Q.15| EARNINGS RELEASE | 100 |
| | | |
During the quarter, there have been no derivatives which underlying assets are investments in proprietary shares or stock certificates that represent them.
During the fisrt quarter of 2015, the number or expired derivative financial instruments and closed positions was as follows (unaudited):
| Description | Maturities | Closed Positions |
| | | |
| Caps and Floors | 562 | 13 |
| Equity Forward | 8 | 14 |
| OTC Equity | 759 | 798 |
| OTC Fx | 1416 | 1424 |
| Swaptions | 45 | 45 |
| Fx Forward | 1249 | 247 |
| IRS | 1533 | 384 |
| CCS | 586 | 526 |
The amount of day trade calls performed during the quarter was the necessary for covering contributions to organized markets and the requirements in collateral agreements.
During the first quarter of 2015, there were no defaults by counterparties.
Sensitivity measures of market risk associated with securities and derivative financial instruments are those that measure the change (sensitivity) of the market value of the financial instrument concerned, when changes in each of the risk factors associated with same occur.
The sensitivity of the value of a financial instrument when changes in market factors occur and is determined by the full instrument revaluation.
The sensitivities are detailed below according to each risk factor and associated historical consumption of the trading book.
The management strategy of the organization is integrated with security positions and derivatives. The latter are used largely to mitigate the market risk of the first. In view of the above, the sensitivities or exposures as described below are both types of instruments considered as a whole.
1. Sensitivity to risk factor “Equity (“Delta EQ”)”
The EQ Delta shows the change in the portfolio's value in relation to changes in the prices of equities.
The EQ Delta calculated for the case of derivative financial instruments considered the relative change of 1% in the prices of the underlying assets in equities, in the case of equities, this considers the relative variation of 1% of market price title.
| | 1Q.15| EARNINGS RELEASE | 101 |
| | | |
2. Sensitivity to risk factor “Foreign Exchange”, (“Delta FX”)
The FX Delta shows the change in the portfolio's value in relation to changes in asset prices exchange rate. |
The FX Delta calculated for the case of derivative financial instruments considered the relative change of 1% in the prices of the underlying assets of the exchange rate, In the case of currency positions, this considers the relative variation of 1%of the corresponding exchange rate.
| 3. Sensitivity to risk factor “Volatility” (“Vega”) |
Vega sensitivity is the measure resulting from changes in the volatility of the underlying asset (the reference asset). Vega risk is the risk that a change in the volatility of the underlying asset value, that results in a change in the market value of the derivative.
The calculation of Vega sensitivity, considers the absolute change of 1% in the volatility of the underlying asset value.
| 4. Sensitivity to risk factors “Interest Rate” (“Rho”) |
This sensitivity quantifies the change in value of financial instruments for the trading portfolio in the face of a parallel increase in the interest rate curves of a basis point.
The table below presents the sensitivities described above corresponding to the position of the trading portfolio, as of the end of the first quarter of 2015:
| Sensitivity Analysis |
| (Millions of mexican pesos) |
| | | | |
| Total rate sensitivity | | | |
| | MXP | OTHER CURRENCIES | |
| Sens. a 1 Bp | 1.08 | (1.67) | |
| | | | |
| Vega Risk factor | | | |
| | EQ | FX | IR |
| Total | 10.09 | 0.76 | (2.32) |
| | | | |
| Delta Risk Factor (EQ and FX) | | | |
| | EQ | FX | |
| Total | 5.31 | 0.0 | |
| | It is considered that the above sensitivity table reflects prudent management of the trading portfolio of Grupo Financiero Santander with respect to risk factors. |
| | Stress Test for Derivative Financial Instruments |
| | The following are various stress test scenarios considering various scenarios calculated for the trading portfolio of Grupo Financiero Santander. |
| | This scenario was defined based in the movements derived from a standard deviation, with respect to risk factors that have an influence over the valuation of financial instruments. Specifically: |
| | 1Q.15| EARNINGS RELEASE | 102 |
| | | |
| | o | Risk factors of Interest Rate (“IR”), volatility (“Vol”) and rate of Exchange (“FX”) were incremented in a standard deviation. |
| | o | Risk factors with respect to stock market (“EQ”) were decreased in a standard deviation. |
Under this scenario, as requested in the official letter, risk factors were modified in 25%. Specifically:
| | o | Risk factors: IR, Vol and FX were multiplied by 1.25 that means, they were incremented in 25%. |
| | o | Risk factor EQ was multiplied by 0.75 that means, it was decreased in 25%. |
Under this scenario, as requested in the official letter, risk factors were modified in 50%. Specifically:
| | o | Risk factors IR, Vol and FX are multiplied by 1.50, that is, they were incremented in 50%. |
| | o | Risk factor EQ was multiplied by 0.5, that is, it was decreased a 50%. |
Effect in the Income Statement
The following table shows the possible income (loss) for the trading portfolio of Grupo Financiero Santander, in millions of Mexican pesos for each stress scenario, as of the end of the first quarter of 2015:
| Summary of Stress Test |
| (Millions of mexican pesos) |
| Risk Profile | Stress all factors |
| Probable scenario | 1 |
| Remote scenario | (278) |
| Possible scenario | (204) |
| | 1Q.15| EARNINGS RELEASE | 103 |
| | | |
25. Disclosure of the Liquidity Coverage Ratio
Disclosure of the Liquidity Coverage Ratio
During the first quarter of 2015 the weighted average CCL for Banco Santander México (“The Bank”) is 106%, complying with the Bank´s desired Risk Profile and well above the regulatory minimum established in the regulations.
| Table I.1 |
| Liquidity Coverage Ratio Disclosure |
| (Figures in millons of MXN) | Amount unweighted (average) | Weighted Amount (average) |
| |
| LIQUIDITY ASSETS |
| 1 | Total high-quality liquid assets | not applicable | 104,525 |
| CASH OUTFLOWS | | |
| 2 | Unsecured retail funding | 151,094 | 10,637 |
| 3 | Stable funding | 89,442 | 4,472 |
| 4 | Less stable funding | 61,652 | 6,165 |
| 5 | Unsecured wholesale funding | 306,121 | 134,763 |
| 6 | Operational deposits | 143,937 | 33,326 |
| 7 | Non-operatational deposits | 144,783 | 84,037 |
| 8 | Unsecured debt | 17,401 | 17,401 |
| 9 | Secured wholesale funding | not applicable | 927 |
| 10 | Additional requirements: | 62,068 | 38,360 |
| 11 | Outflows related to derivatives exposures and other collateral requirements | 35,726 | 35,726 |
| 12 | Outflows related to loss of funding on debt products | - | - |
| 13 | Credit and liquidity facilities | 26,342 | 2,634 |
| 14 | Other contractual funding obligations | - | - |
| 15 | Other contingent funding obligations | 106,741 | 7,549 |
| 16 | TOTAL CASH OUT | not applicable | 192,237 |
| CASH INFLOWS | | |
| 17 | Cash inflows secured transactions | 59,893 | 5,064 |
| 18 | Cash inflows from operations unsecured | 72,670 | 55,547 |
| 19 | Other cash inflows | 33,051 | 33,051 |
| 20 | TOTAL CASH INFLOWS | 165,614 | 93,662 |
| TOTAL ADJUSTED VALUE |
| 21 | TOTAL OF ELIGIBLE LIQUID ASSETS | not applicable | 104,525 |
| 22 | TOTAL NET CASH OUT | not applicable | 98,574 |
| 23 | LIQUIDITY COVERAGE RATIO | not applicable | 106% |
| | 1Q.15| EARNINGS RELEASE | 104 |
| | | |
Notes relating to the Liquidity Coverage Ratio
| a) | Natural days contemplated in the quarterly report. |
| b) | Main causes of the results of the Liquidity Coverage Ratio and the evolution of its main components and; |
| c) | Changes of major components within the quarter report. |
| | · | During the first quarter, the mix in deposits shifted towards a more favorable proportion of stable resources, better supporting the increase in liquid assets. |
| d) | Evolution of the composition of the Eligible and Computable Liquidity Assets. |
| | · | The Bank has a significant proportion of liquid assets comprised by government debt, deposits in Bank of Mexico and cash. |
| e) | Concentration of funding sources. |
| | · | The main sources of funding are diversified by its own nature as: (i) demand deposits; (ii) term deposits, which include deposits from the general public and the money market (promissory notes with interest payable at maturity), and (iii) repurchase agreements. |
| | · | In addition the Bank has registered programs for local market´s debt issuances and international issuances in dollars. |
| f) | Exposures in financial derivative instruments and possible margin calls. |
| | · | Not seen any significant vulnerabilities coming from financial derivative instruments. |
| | · | Not seen any significant vulnerability in Currency mismatch. |
| h) | Description of the level of centralization of liquidity management and interaction between the units of the group. |
| | · | Banco Santander Mexico is autonomous in terms of liquidity and capital; it develops its financial plans, liquidity forecast, and analyzes funding requirements for all its subsidiaries. The Bank is responsible for its own "ratings", its issuance program, "road shows", any other activities to keep its ability to access capital markets. The issuance activity is performed without having the guarantee of the parent company. |
| | · | The liquidity management of all subsidiaries is centralized. |
| i) | Cash flows and Inflows, if any, that are not captured in this framework, but the institution considers relevant to the liquidity profile. |
| | · | The Liquidity Coverage Ratio considers only the inflows and outflows up to 30 days, however the flows that are not contained in the metric are well managed and controlled by the Group. |
Additional notes for the previous quarter
| | 1Q.15| EARNINGS RELEASE | 105 |
| | | |
I. Quantitative information:
| a) | The concentration limits for different groups of guarantees received and major sources of financing. |
| | · | The Bank has no concentration limits under guarantees received by market operations, as they are mainly composed of government securities and cash. |
| b) | Exposure to liquidity risk and funding needs of the institution, taking into account the legal, regulatory and operational constraints on liquidity transfers. |
| | · | Liquidity risk is associated with our capacity to finance the commitments we undertake at reasonable prices, as well as maintaining our ability to carry out our business plans using stable financing sources. Factors that influence liquidity risk may be external, such as a liquidity crisis, or internal, such as an excessive concentration of maturities. |
| | · | The measures used to control liquidity risk in balance sheet management are the liquidity gap, liquidity ratios, stress scenarios and liquidity horizons. |
| | · | The liquidity horizons metric has been defined to ensure that the Group has sufficient liquid assets to comply with its requirements during a certain period of time, given different stress scenarios. The Group set a 90-day survival horizon for local currency and consolidated balance and a 30-day survival horizon for foreign currency. During 2014 the balance remained above the established limits, and therefore we maintained a sufficient liquidity buffer. |
| c) | Balance sheet maturity liquidity gap including off balance sheet accounts. |
| | · | The table below shows the liquidity gap of our assets and liabilities using maturity dates as of December 31, 2014. The reported amounts include cash flows from interest on fixed and variable rate instruments. The interest on variable rate instruments is determined using the forward interest rates for each period presented. |
| | 1Q.15| EARNINGS RELEASE | 106 |
| | | |
II. Qualitative information:
| a) | The way in which liquidity risk is managed within the institution, considering the risk tolerance, the structure and responsibilities for managing liquidity risk, internal liquidity reports, the liquidity risk strategy, policies and practices across business lines and with the board of directors. |
| | · | Our general policy regarding liquidity management seeks to ensure that even under adverse conditions, we have enough liquidity to cover client needs, maturing liabilities and working capital requirements. The Bank ´s liquidity management is based on analyses of asset and liability maturities, using contractual and management models. |
| | · | The Financial Management Area is responsible for executing the strategies and policies established by ALCO in order to modify the risk profile of the Bank, within the limits established by the CAIR who reports to the Board. |
| b) | Financing strategy, including diversification policies, and whether the funding strategy is centralized or decentralized. |
| | · | Annually the Financial Plan for the Bank is prepared considering: the projected business growth, the debt maturity profile, risk appetite, expected market conditions, the implementation of diversification policies and regulatory metrics and the analysis of the liquidity buffer. The Financial Plan is the guide used to issue debt or contract term liabilities and aims to maintain adequate liquidity profile. |
| | · | The funding strategy of all subsidiaries is centralized. |
| c) | Mitigation techniques of liquidity risk used by the institution. |
| | · | The risk mitigation techniques in the Group have a preventive nature. The Financial Plan in addition to the projection exercises and stress test scenarios allows us to anticipate risks and implement measures to ensure that the liquidity profile is adequate. |
| d) | Explanation of how the stress tests are used. |
| | · | The Liquidity Stress Test is a Risk Management tool designed to warn the governing committees and areas responsible for making decisions in this area about the potential adverse effects of the liquidity risk the Institution is exposed to. |
| | · | The results of these stress tests aim to identify the impacts prospectively in order to improve planning processes, and help align and calibrate Risk Appetite, Exposure Limits and Levels of Liquidity Risk tolerance. |
| | 1Q.15| EARNINGS RELEASE | 107 |
| | | |
| e) | Description of contingent financing plans. |
| | · | The plan includes the following elements: type and business model as the starting point. Early Warning Indicators to identify in a timely manner the increase in liquidity risk and the elements that define the crisis scenarios used. Additionally we measure the liquidity shortages that stress scenarios could produce and the available actions considered by the plan to restore liquidity conditions. Actions are prioritized in order to preserve the value of the entity and the stability of the markets. A key aspect of the Plan is the governance process, stating the areas responsible for the different stages involved: activation, execution, communication and maintenance of the Plan. |
|
1Q.15 I Earnings Presentation

Grupo Financiero Santander M[]xico, S.A.B. de C.V.

Mexico City, April 28(th) , 2015


Mexico
|
|
Safe Harbor Statement

Grupo Financiero Santander M[]xico cautions that this presentation may contain
forward-looking statements within the meaning of the U.S. Private Securities
Litigation Reform Act of 1995. These forward-looking statements could be found
in various places throughout this presentation and include, without limitation,
statements regarding our intent, belief, targets or current expectations in
connection with: asset growth and sources of funding; growth of our fee-based
business; expansion of our distribution network; our focus on strategic
businesses; our compound annual growth rate; our risk, efficiency and
profitability targets; financing plans; competition; impact of regulation;
exposure to market risks including interest rate risk, foreign exchange risk
and equity price risk; exposure to credit risks including credit default risk
and settlement risk; projected capital expenditures; capitalization
requirements and level of reserves; liquidity; trends affecting the economy
generally; and trends affecting our financial condition and our results of
operations. While these forward-looking statements represent our judgment and
future expectations concerning the development of our business, a number of
risks, uncertainties and other important factors could cause actual
developments and results to differ materially from our expectations. These
factors include, but are not limited to: changes in capital markets in general
that may affect policies or attitudes towards lending to Mexico or Mexican
companies; changes in economic conditions, in Mexico in particular, in the
United States or globally; the monetary, foreign exchange and interest rate
policies of the Mexican Central Bank (Banco de M[]xico); inflation; deflation;
unemployment; unanticipated turbulence in interest rates; movements in foreign
exchange rates; movements in equity prices or other rates or prices; changes in
Mexican and foreign policies, legislation and regulations; changes in
requirements to make contributions to, for the receipt of support from programs
organized by or requiring deposits to be made or assessments observed or
imposed by, the Mexican government; changes in taxes; competition, changes in
competition and pricing environments; our inability to hedge certain risks
economically; economic conditions that affect consumer spending and the ability
of customers to comply with obligations; the adequacy of allowances for loans
and other losses; increased default by borrowers; technological changes;
changes in consumer spending and saving habits; increased costs; unanticipated
increases in financing and other costs or the inability to obtain additional
debt or equity financing on attractive terms; changes in, or failure to comply
with, banking regulations; and certain other risk factors included in our
annual report on Form 20-F. The risk factors and other key factors that we have
indicated in our past and future filings and reports, including those with the
U.S. Securities and Exchange Commission, could adversely affect our business
and financial performance.
Note: The information contained in this presentation is not audited.
Nevertheless, the consolidated accounts are prepared on the basis of the
accounting principles and regulations prescribed by the Mexican National
Banking and Securities Commission (Comisi[]n Nacional Bancaria y de Valores)
for credit institutions, as amended (Mexican Banking GAAP). All figures
presented are in millions of nominal Mexican pesos, unless otherwise indicated.
Historical figures are not adjusted by inflation.
|
|
Santander M[]xico Continues to Report Strong Loan Growth Above Market Rates


Total loans up 16%, above market levels
          * Mortgages                  +15%
          * SMEs                       +24%
          * Middle-market              +15%
          * Consumer(1)                 +11%
Deposit growth of 14%
          * Individual demand deposits +23%
Ongoing prudent risk management
          * NPL ratio                  3.68%
          * Cost of risk               3.13%
Focus on efficiency and profitability
          * Expenses annual growth     +8.3%
          * Efficiency ratio(3)        44.8%
          * ROAE(4)                    12.0%
Opened 194 branches since 4Q12, expansion plan expected to
finalize on 2Q15.
Closed agreement to acquire a Ps.3,179 million consumer loan
portfolio from Scotiabank M[]xico; effective as of April 2015


Source: Company filings CNBV GAAP
Notes:             1) Includes credit cards, payroll, personal and auto loans
                   2) Annualized opex (1Q15x4) divided by Annualized income before opex and allowances 2 (1Q15x4)
                   3) Annualized net income (1Q15x4) divided by average equity (4Q14;1Q15)
|
|
Consistent Signs of Economic Recovery Supported by Solid Macro Fundamentals


Interest Rate (CETEs)


Source: GDP -- INEGI
        CETE, Inflation, Exchange Rate -- BANXICO
        Estimates -- SANTANDER


3
|
|
Mexico's Financial System Total Loans and Deposits Posted Second

Consecutive Quarter of Recovery; Trend Expected to Continue


[] Loan growth continues positive trend following inflection point in November
2014

[] Performance expected to continue

[] Strong growth rates across all segments offsets weak performance in credit
cards


Source: CNBV Banks as of February 2015 -- Billions of Pesos
Notes:  1) Includes credit cards, payroll, personal and auto loans
        * Compares February 15 vs 1Q14


4
|
|
Santander M[]xico Total Loans up 16% YoY With Solid Growth Across All Segments


Source: Company filings CNBV GAAP

5
|
|
Individual Loans Expanded 13% YoY, Reflecting Growth in Consumer Loans and
Mortgages, Despite Continued Softness in Credit Card Use99,242
95,865


1Q14 165,829 +13% 187,662 1Q15

40,506 41,439 41,630 42,104
Mortgages Credit Cards Consumer(1)


[] Leading in origination, generating [] Better than market performance []
Strong commercial activity one third of new volumes in the despite soft demand
drives sustained pick-up in banking system sequential growth [] Growing credit
card placement [] 2(nd) largest market player not yet reflected in usage

 YoY growth well above market rates across all individual segments


Source: Company filings CNBV GAAP
Notes:  1) Includes personal, payroll and auto loans


6
|
|
Commercial Loans Increase 18% YoY Achieving Growth Across All Segments


1Q14 243,520 +18% 95,576 287,076 1Q15


Source: Company filings CNBV GAAP
|
|
Deposit Base up 14% YoY; Healthy Mix Contributes to Funding Costs


                           +14%
          401,081 425,108 438,143 459,624 459,130 0%
                                  ------- -------
     Term   36%     39%     35%     36%     36%
Demand      64%     61%     65%     64%     64%
          ------- ------- ------- ------- ------- ---
           1Q14    2Q14    3Q14    4Q14    1Q15


 Individuals, SMEs and mid-market remain the main contributors to demand
deposit growth -- up 23%, 21% and 23%, respectively.

 Optimizing cost of funding

 Continue to drive growth of Select client base

 New branches contribute to deposit growth


Source: Company filings CNBV GAAP
Notes:  * Includes money market


8
|
|
Strong Liquidity Profile and Solid Capital Position

Healthy debt maturity profile

Well positioned for future interest rate increase

Strong capitalization

LCR* = 106%, well above 60% Banxico regulatory requirements


Source:           Company filings CNBV GAAP
Notes:  1) Loans net of allowances divided by total deposits (Demand + Term)
         * LCR = Liquidity Coverage Ratio


9
|
|
Net Interest Income Up for the Fourth Consecutive Quarter: +1.3% 9,262 QoQ and
+10.4% YoY 8,993


NII up 1.3% sequentially

NII grew 10.4% YoY, principally due to:

* Higher interest income from:

    Loan portfolio (ex-credit cards): +13.1%  Investment in securities: +14.6%
* Stable cost of deposits * Partially offset by lower interest income from:
Credit Card Portfolio: +0.5% NIM stood at 4.87%
|
|
Credit Cards and Investment Banking Activities Continue to Impact Net
Commissions and Fees 3,423


Insurance Cash Mangmt* Credit Cards Investment Funds Financial Advisory Cap
Mkts and Sec


                                                        Var YoY
                        --------- --------- -------- ---------- ------
                        1Q14      4Q14      1Q15     $$         %
                        --------- --------- -------- ---------- ------
Insurance                     875      994       983     108       12%
Cash Mangmt*                  765      790       857      92       12%
Credit Cards                  948      839       758    -190      -20%
Investment Funds              312      325       329      17        5%
Financial Advisory            396      384       233    -163      -41%
Cap Mkts and Sec                127        32      138      11        9%
----------------------- --------- --------- -------- ---------- ------
Net commisions and fees     3,423     3,364    3,298    -125       -4%
----------------------- --------- --------- -------- ---------- ------


Source: Company filings CNBV GAAP
   11
Notes: * Includes fees from: collections and payments, account management,
cheques, foreign trade and others
|
|
Gross Operating Income Up 8% YoY Mainly Driven by Net Interest Income Growth


Net Interest Income

Net Commissions and Fees

Trading Gains


Source: Company filings CNBV GAAP
Notes:  *Gross Operating Income does not include Other Income


12
|
|
Cost of Risk Down 19 bps QoQ with Improving NPLs and Coverage Ratios
3,814

Loan Loss Reserves (LLR) Cost of Risk(1)


NPLs         1Q14      4Q14      1Q15      Var YoY (bps)   Var QoQ (bps)
------------ --------- --------- --------- --------------- ----------------
Consumer         4.14%     4.19%     3.61%             -53              -57
 Credit Card     3.20%     4.12%     3.79%              59              -33
Mortgages        4.30%     5.07%     5.00%              69               -7
Commercial*      2.84%     3.14%     3.19%              35                5
  SMEs           2.50%     2.99%    2.75%               25              -24
------------ --------- --------- --------- --------------- ----------------
Total Loans      3.40%     3.75%     3.68%              27               -7
------------ --------- --------- --------- --------------- ----------------


Source: Company filings CNBV GAAP
Notes:  1) Annualized loan loss reserves (1Q15x4) divided by average loans (4Q14,1Q15)
        * Commercial loans include: mid-market, smes, corporates, financial institutios13 and government
        * Commercial NPLs reflect the exposure to homebuilders
|
|
Effective Expense Management Offset by Impact from Deposit Insurance Fee and
Branch Expansion Plan

Administrative and Promotional Expenses Expenses Breakdown


Personnel Admin expenses IPAB

Dep and amort.


                                                            Var YoY
                                ------- ------- ------- --------------
                                1Q14    4Q14    1Q15    Var $$ Var %
                                ------- ------- ------- --------------
Personnel                         2,587   2,886   2,916     329  12.7%
Admin expenses                    2,454   2,256   2,439      -15 -0.6%
IPAB                                436     508     535       99 22.7%
Dep and amort.                      425     409     499       74 17.4%
------------------------------- ------- ------- ------- -------- -----
Admin and prom expenses             5,902   6,059   6,389     487   8.3%
=============================== ======= ======= ======= ======== =====
Admin and prom expenses (ex IPAB)  5,466   5,551    5,854     388   7.1%
------------------------------- ------- ------- ------- -------- -----


Source: Company filings CNBV GAAP
Notes:  1) Annualized opex (1Q15x4) divided by annualized income (before) 14(opex) (net of allowances) (1Q15x4)
|
|
Higher Effective Tax Rate Offsets Strong Loan Volume Growth and Impacts Net
Income


Source: Company filings CNBV GAAP
Notes:  1) Annualized net income (1Q15x4) divided by average equity (4Q14,1Q15)


15
|
|
Based on Our Performance To-Date and Expectations of Continued Economic
Recovery We Maintain Guidance for 2015


Total Loans             []  13%-15%
  [] Consumer            [] 12%-15%
  [] Mortgages           [] 10%-12%
  [] SMEs                [] 22%-25%
Total Deposits          [] 10%-12%
Pre-tax Earnings Growth [] 15%-20%
Cost of Risk             3.4%-3.6%
Expenses                  [] 6%-8%*
Tax Rate                  23%-25%


* Does not include the deposit insurance fee (or IPAB) and the reversal from
the employee profit sharing (EPS) future payments


16
|
|
Consolidated Income Statement


                                                                                               % Change
                                                     1Q15        4Q14        1Q14
                                                                                         QoQ            YoY
                                                     ----------- ----------- -----------
Interest income                                          14,821      15,043      13,744        (1.5)           7.8
Interest expense                                         (4,896)     (5,244)     (4,751)       (6.6)           3.1
---------------------------------------------------- ----------- ----------- ----------- -------------- --- ------
Financial margin                                          9,925       9,799       8,993          1.3         10.4
Allowance for loan losses                                (3,683)     (3,334)     (3,469)       10.5            6.2
---------------------------------------------------- ----------- ----------- ----------- -------------- --- ------
Financial margin after allowance for loan losses          6,242       6,465       5,524        (3.4)         13.0
Commision and fee income                                  4,199       4,350       4,061        (3.5)           3.4
Commision and fee expense                                  (901)       (986)       (638)       (8.6)         41.2
---------------------------------------------------- ----------- ----------- ----------- -------------- --- ------
Net commisions and fees                                   3,298       3,364       3,423        (2.0)         (3.7)
Net gain /(loss) on financial assets and liabilities         795         395         553      101.3          43.8
Othe operating income / (loss)                               239         533         360      (55.2)        (33.6)
Administrative and promotional expenses                  (6,389)     (6,059)     (5,902)         5.4           8.3
---------------------------------------------------- ----------- ----------- ----------- -------------- --- ------
Total operating income                                    4,185       4,698       3,958       (10.9)           5.7
Equity in results of subsidiaries and associated
                                                              19          21          17       (9.5)         11.8
companies
---------------------------------------------------- ----------- ----------- ----------- -------------- --- ------
Income from continuing operations before
                                                          4,204       4,719       3,975       (10.9)           5.8
income taxes
Income taxes                                               (989)       (895)       (716)       10.5          38.1
---------------------------------------------------- ----------- ----------- ----------- -------------- --- ------
Income from continuing operations                         3,215       3,824       3,259       (15.9)         (1.4)
Discontinued operations                                        0           0           0
---------------------------------------------------- ----------- ----------- ----------- -------------- --- ------
Consolidated net income                                   3,215       3,824       3,259       (15.9)         (1.4)
Non-controlling interest                                       0           0           0
---------------------------------------------------- ----------- ----------- ----------- -------------- --- ------
Net income                                                3,215       3,824       3,259       (15.9)         (1.4)
                                                     -----------


Source: Company filings CNBV GAAP
        Millions of pesos


19
|
|
Consolidated Other Balance Sheet

Subordinated Deferred revenues Liabilities from

Total liabilities

Total stockholders[]e


Source: Company filings CNBV GAAP
        Millions of pesos


20
|