Santander Mexico Financial Group, S.A.B. de C.V. Inactive
Filed: 29 Jan 16, 12:00am
UNITED STATES
SECURITIES AND EXCHANGE COMMISSION
Washington, D.C. 20549
FORM 6-K
REPORT OF FOREIGN PRIVATE ISSUER PURSUANT TO RULE 13a-16 OR 15d-16 UNDER THE SECURITIES EXCHANGE ACT OF 1934
For the month of January, 2016
____________________
Commission File Number: 001-35658
GRUPO FINANCIERO SANTANDER MÉXICO, S.A.B. de C.V.
(Exact Name of Registrant as Specified in Its Charter)
SANTANDER MEXICO FINANCIAL GROUP, S.A.B. de C.V.
(Translation of Registrant’s Name into English)
Avenida Prolongación Paseo de la Reforma 500
Colonia Lomas de Santa Fe
Delegación Álvaro Obregón
01219 México, D.F.
(Address of principal executive office)
Indicate by check mark whether the registrant files or will file annual reports under cover of Form 20-F or Form 40-F:
| Form 20-F | X | Form 40-F |
Indicate by check mark if the registrant is submitting the Form 6-K in paper as permitted by Regulation S-T Rule 101(b)(1):
| Yes | No | X |
Indicate by check mark if the registrant is submitting the Form 6-K in paper as permitted by Regulation S-T Rule 101(b)(7):
| Yes | No | X |
GRUPO FINANCIERO SANTANDER MÉXICO, S.A.B. de C.V.
TABLE OF CONTENTS
| ITEM | |
| 1. | Fourth quarter 2015 earnings report of Grupo Financiero Santander México, S.A.B. de C.V. |
| 2. | Fourth quarter and full-year 2015 earnings presentation of Grupo Financiero Santander México, S.A.B. de C.V. |
SIGNATURE
Pursuant to the requirements of the Securities Exchange Act of 1934, the registrant has duly caused this report to be signed on its behalf by the undersigned, thereunto duly authorized.
GRUPO FINANCIERO SANTANDER MÉXICO,
S.A.B. de C.V.
| ||||
| By: | /s/ Gerardo Manuel Freire Alvarado | |||
| Name: | Gerardo Manuel Freire Alvarado | |||
| Title: | Executive Director of Investor Relations | |||
Date: January 29, 2016
Item 1

TABLE OF CONTENTS
| I. | CEO Message / Key Highlights for the Quarter |
| II. | Summary of 4Q15 Consolidated Results |
| III. | Analysis of 4Q15 Consolidated Results |
| IV. | Relevant Events & Representative Activities and Transactions |
| V. | Awards & Recognitions |
| VI. | Sustainability and Social Responsibility |
| VII. | Credit Ratings |
| VIII. | 4Q15 Earnings Call Dial-In Information |
| IX. | Analysts Coverage |
| X. | Definition of Ratios |
| XI. | Financial Statements |
| XII. | Notes to the Financial Statements |
2
Grupo Financiero Santander México Reports Fourth Quarter 2015 Loan Portfolio Up 17.7% YoY and Net Income of Ps.4,224 Million
-Net income growth mainly driven by core earnings
-Loan growth driven by above market YoY increases in both individual and commercial segments
-Strong loan growth achieved while maintaining focus on asset quality
Mexico City – January 29, 2016, Grupo Financiero Santander México, S.A.B. de C.V., (NYSE: BSMX; BMV:SANMEX), (“Santander México”), one of the leading financial groups in Mexico, today announced financial results for the three- and twelve-month periods ending December 31, 2015.
Santander México reported net income for 4Q15 of Ps.4,224 million, representing YoY and QoQ increases of 10.5% and 21.9%, respectively. For 12M15, net income amounted to Ps.14,141 million, reflecting a 0.9% increase from 12M14.
| HIGHLIGHTS | |||||
| Income Statement Data(Millions of pesos) | 4Q15 | 3Q15 | 4Q14 | % YoY | % QoQ |
| Net interest income | 11,431 | 10,810 | 9,799 | 16.7 | 5.7 |
| Fee and commission, net | 3,777 | 3,686 | 3,364 | 12.3 | 2.5 |
| Core revenues | 15,208 | 14,496 | 13,163 | 15.5 | 4.9 |
| Provisions for loan losses | 4,424 | 4,594 | 3,334 | 32.7 | (3.7) |
| Administrative and promotional expenses | 6,437 | 6,426 | 6,059 | 6.2 | 0.2 |
| Net income | 4,224 | 3,464 | 3,824 | 10.5 | 21.9 |
| Net income per share1 | 2.08 | 1.46 | 2.07 | 0.5 | 42.5 |
| Balance Sheet Data(Millions of pesos) | 4Q15 | 3Q15 | 4Q14 | % YoY | % QoQ |
| Total assets | 1,184,857 | 1,182,882 | 937,384 | 26.4 | 0.2 |
| Total loans | 547,745 | 526,037 | 465,541 | 17.7 | 4.1 |
| Deposits | 516,432 | 492,713 | 459,624 | 12.4 | 4.8 |
| Shareholders´s equity | 113,549 | 112,589 | 105,384 | 7.7 | 0.9 |
| Key Ratios | 4Q15 | 3Q15 | 4Q14 | bps YoY | bps QoQ |
| Net interest margin | 4.89% | 4.91% | 4.86% | 2.7 | (1.6) |
| Net loans to deposits ratio | 102.2% | 102.8% | 97.6% | 464.1 | (58.3) |
| ROAE | 12.9% | 12.1% | 14.0% | (109.0) | 78.6 |
| ROAA | 1.3% | 1.2% | 1.6% | (26.0) | 8.5 |
| Efficiency ratio | 42.0% | 42.9% | 43.0% | (100.2) | (87.8) |
| Capital ratio | 15.6% | 15.4% | 16.2% | (56.8) | 17.0 |
| NPLs ratio | 3.33% | 3.49% | 3.75% | (41.8) | (15.7) |
| Cost of Risk | 3.4% | 3.4% | 3.3% | 8.2 | (4.4) |
| Coverage ratio | 108.2% | 105.8% | 97.1% | 1,108.0 | 240.0 |
| Operating Data | 4Q15 | 3Q15 | 4Q14 | % YoY | % QoQ |
| Branches and offices2 | 1,377 | 1,374 | 1,346 | 2.3 | 0.2 |
| ATMs | 5,989 | 5,875 | 5,528 | 8.3 | 1.9 |
| Customers | 12,502,204 | 12,327,031 | 11,742,797 | 6.5 | 1.4 |
| Employees | 17,205 | 17,068 | 16,428 | 4.7 | 0.8 |
| 1) Accumulated EPS, net of treasury shares (compensation plan) and discontinued operations. Calculated by using weighted shares. |
2) As of 4Q15 includes: 1,079 branches (including 120 branches with Select service) + 18 SME offices + 7 SME branches + 119 cash desks (including 1 cash desk with Select service) + 11 Select offices + 45 Select units + 57 Select boxes + 18 Select corner + 23 brokerage house branches |
3
Héctor Grisi, Grupo Financiero Santander México’s Executive President and CEO, commented,“Our fourth quarter 2015 results reflect the many strengths and opportunities we see at Santander México. Total loans grew by 18% year-on-year, exceeding market growth, while we achieved even stronger performance in consumer loans, a clear reflection of the strength of our franchise. We hold leading market shares in core segments - SMEs, middle-market and mortgages, as well as solid positions in consumer banking and credit cards. Our heightened focus on individuals also allowed us to achieve a significant increase in retail deposit growth, although we maintain more ambitious targets for our long term share in this segment.”
“Despite our achievements, key profitability metrics remain below our desired levels. Since joining in December, I have been working closely with our leadership team on a thorough assessment of Santander México’s operations. The bank has identified its key challenges, and we are already implementing initiatives that will enable us to attract new clients and increase customer loyalty in our retail banking operations. Our goal is to be our customers’ primary bank and for this we need to become a client-centric franchise.”
“While Mexico has a growing economy and favorable market dynamics, like all banks, capital is becoming a scarce and increasingly costly resource. In this context, our mandate is clear: to improve profitability. At Santander México, we are uniquely positioned to better realize the strong potential of our investment and corporate banking business, creating additional synergies with our retail operation.”
“I am excited by the opportunities ahead, and confident that the operational transformation of our retail and corporate banking franchise, will ensure we achieve profitable, sustainable growth for customers and shareholders. I am fully committed to maintaining our focus on profitability, and look forward to updating you on our progress,” Mr. Grisi said.
4
SUMMARY OF FOURTH QUARTER 2015 CONSOLIDATED RESULTS
| Income statement |
| Millions of pesos | % Variation | % Variation | |||||||||
| 4Q15 | 3Q15 | 4Q14 | QoQ | YoY | 12M15 | 12M14 | 15/14 | ||||
| Net interest income | 11,431 | 10,810 | 9,799 | 5.7 | 16.7 | 42,632 | 37,578 | 13.4 | |||
| Provisions for loan losses | (4,424) | (4,594) | (3,334) | (3.7) | 32.7 | (17,244) | (14,289) | 20.7 | |||
| Net interest income after provisions for loan losses | 7,007 | 6,216 | 6,465 | 12.7 | 8.4 | 25,388 | 23,289 | 9.0 | |||
| Commission and fee income, net | 3,777 | 3,686 | 3,364 | 2.5 | 12.3 | 14,772 | 13,417 | 10.1 | |||
| Net gain (loss) on financial assets and liabilities | 347 | 583 | 395 | (40.5) | (12.2) | 2,265 | 2,957 | (23.4) | |||
| Other operating income | 706 | 325 | 533 | 117.2 | 32.5 | 1,379 | 1,435 | (3.9) | |||
| Administrative and promotional expenses | (6,437) | (6,426) | (6,059) | 0.2 | 6.2 | (25,643) | (23,820) | 7.7 | |||
| Operating income | 5,400 | 4,384 | 4,698 | 23.2 | 14.9 | 18,161 | 17,278 | 5.1 | |||
| Equity in results of associated companies | 28 | 15 | 21 | 86.7 | 33.3 | 81 | 78 | 3.8 | |||
| Operating income before income taxes | 5,428 | 4,399 | 4,719 | 23.4 | 15.0 | 18,242 | 17,356 | 5.1 | |||
| Income taxes (net) | (1,204) | (935) | (895) | 28.8 | 34.5 | (4,100) | (3,341) | 22.7 | |||
| Income from continuing operations | 4,224 | 3,464 | 3,824 | 21.9 | 10.5 | 14,142 | 14,015 | 0.9 | |||
| Non-controlling interest | 0 | 0 | 0 | 0.0 | 0.0 | (1) | (1) | 0.0 | |||
| Net income | 4,224 | 3,464 | 3,824 | 21.9 | 10.5 | 14,141 | 14,014 | 0.9 | |||
Net income
Santander México reported net income for the quarter of Ps.4,224 million, representing YoY and QoQ increases of 10.5% and 21.9%, respectively. Net income for 12M15 increased by 0.9% to Ps.14,141 million.

4Q15 vs 4Q14
The 10.5% year-on-year increase in net income was principally driven by:
| i) | a 16.7%, or Ps.1,632 million, increase in net interest income, mainly reflecting interest income growth from the loan portfolio and a stable cost of deposits; |
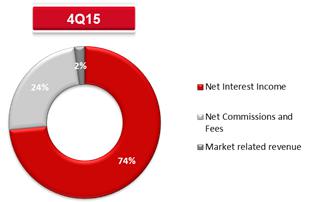
| ii) | a 12.3%, or Ps.413 million, increase in net commissions and fees, principally due to the pick-up in debit and credit card fees in the quarter that resulted fromhigher card use and lower placement fees; higher fees from purchase-sale of securities and money market transactions, collections and payments, foreign trade and insurance. |
5
| iii) | a 32.5%, or Ps.173 million, increase in other operating income, mainly from higher recoveries of previously written-off loans. |
These contributions to net income were partially offset by:
| i) | a 32.7%, or Ps.1,090 million, increase in provisions for loan losses. This increase reflects: i) significant business volume growth across all segments; and ii) higher provisions resulting from the exposure to certain corporates; as well as a difficult comparable year-ago period, as 4Q14 benefitted from a reversal of provisions related to loans that were restructured in 3Q14 and became current in 4Q14; |
| ii) | a 6.2%, or Ps.378 million, increase in administrative and promotional expenses, mainly due to higher leaseholds, taxes and duties, as well as an increase in contributions to the bank savings protection system (IPAB) driven by the higher deposit base and other funding sources; |
| iii) | a 34.5%, or Ps.309 million, increase in expense taxes, that resulted in a 22.2% effective tax rate in the quarter compared to 19.0% in 4Q14; and |
| iv) | a 12.2%, or Ps.48 million, decrease in net gains on financial assets and liabilities, mainly due to lower customer activity as a result of market uncertainty. |
12M15 vs 12M14
Net income growth of 0.9% for 12M15, is mainly explained by the following increases:
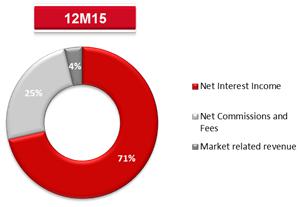
| i) | a 13.4%, or Ps.5,054 million rise in net interest income, mainly reflecting higher interest income from the loan portfolio and a stable cost of deposits; and |
| ii) | a 10.1%, or Ps.1,355 million, in net commissions and fees, mainly resulting from growth in insurance, financial advisory, collections and payments and foreign trade, which more than offset lower debit and credit card fees. The decline in credit card fees during the year resulted from higher expenses incurred in connection with reward programs and placement fees in the open market. |
These contributions to net income were partially offset by:
| i) | a 20.7%, or Ps.2,955 million increase in provisions for loan losses. This reflects: i) significant business volume growth across all segments; ii) provisions required in connection with Pemex suppliers, homebuilders and the consumer loan portfolio acquired from Scotiabank and iii) provisions required in connection with the exposure to certain corporates; |
| ii) | a 7.7%, or Ps.1,823 million, increase in administrative and promotional expenses, mainly explained by higher salaries and employee benefits to support business growth; an increase in contributions to the IPAB resulting from a higher deposit base and other funding sources; followed by increases in leaseholds, depreciations and amortizations, and taxes and duties; |
| iii) | a 22.7%, or Ps.759 million, increase in tax expenses, that resulted in a 22.5% effective tax rate in the year which compares with 19.2% in 2014; |
| iv) | a 23.4%, or Ps.692 million, decrease in net gains on financial assets and liabilities, mainly due to lower customer activity as a result of market uncertainty, as well as a difficult comparable year-ago period which benefitted from the decrease in interest rates in 2Q14; and |
6
| v) | a 3.9%, or Ps.56 million, decrease in other operating income, which mainly resulted from an increase in portfolio recovery legal expenses and costs, as well as in write-offs and bankruptcies which more than offset higher recoveries of previously written-off loans and lower provisions for legal and tax contingencies. |
Gross Operating Income
Santander México’s gross operating income for 4Q15 totaled Ps.15,555 million, representing YoY and QoQ increases of 14.7% and 3.2%, respectively, and is broken down as follows.
Gross operating income for 12M15 amounted to Ps.59,669 million, increasing 10.6% from 12M14, and is broken down as follows:
Profit Before Taxes
Profit before taxes in 4Q15 amounted to Ps.5,428 million, reflecting increases of 15.0% and 23.4% YoY and QoQ, respectively.
Profit before taxes for 12M15 amounted to Ps.18,242 million, and increased 5.1% YoY, mainly explained by higher net interest income and net commissions and fees, partially offset by lower income from trading gains and higher provisions for loan losses and expenses.
Return on Average Equity (ROAE)
Santander México´s ROAE in 4Q15 was 12.9%, which compares with 14.0% in 4Q14 and improved from 12.1% in 3Q15.
7
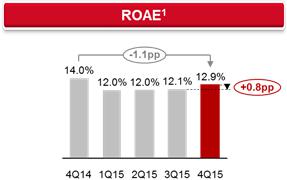
1Annualized net income divided by average equity (4Q14;4Q15)
Loan portfolio growth
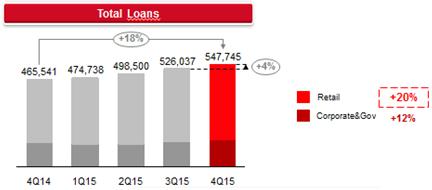
Santander México’s total loan portfolio as of 4Q15 increased YoY by 17.7%, or Ps.82,204 million, to Ps.547,745 million, and by 4.1%, or Ps.21,708 million, on a sequential basis.
In 4Q15, Santander México’s loan portfolio expanded YoY above market growth rates and showed positive trends across all core products, in both the individual and commercial loan segments.
Deposits and loans to deposit ratio
In 4Q15, deposits increased 12.4% YoY and 4.8% sequentially; representing 48.2% of Santander México’s total funding sources. This deposit base provides stable, low-cost funding to support Santander México’s continued growth.
The net loan to deposit ratio was 102.2% in 4Q15, which compares with 97.6% in 4Q14 and 102.8% in 3Q15.
 |  |
8
ANALYSIS OF FOURTH QUARTER 2015 CONSOLIDATED RESULTS
(Amounts expressed in millions of pesos, except where otherwise stated)
Net interest income
| Net interest income | ||||||||||
| Millions of pesos | % Variation | % Variation | ||||||||
| 4Q15 | 3Q15 | 4Q14 | QoQ | YoY | 12M15 | 12M14 | 15/14 | |||
| Interest on funds available | 317 | 327 | 351 | (3.1) | (9.7) | 1,322 | 1,384 | (4.5) | ||
| Interest on margin accounts | 103 | 105 | 65 | (1.9) | 58.5 | 366 | 278 | 31.7 | ||
| Interest and yield on securities | 3,379 | 2,631 | 2,523 | 28.4 | 33.9 | 10,723 | 9,219 | 16.3 | ||
| Interest and yield on loan portfolio – excluding credit cards | 10,352 | 9,997 | 8,677 | 3.6 | 19.3 | 39,031 | 33,480 | 16.6 | ||
| Interest and yield on loan portfolio related to credit card transactions | 2,499 | 2,446 | 2,443 | 2.2 | 2.3 | 9,794 | 9,725 | 0.7 | ||
| Commissions collected on loan originations | 213 | 165 | 189 | 29.1 | 12.7 | 733 | 783 | (6.4) | ||
| Interest and premium on sale and repurchase agreements and securities loans | 433 | 325 | 795 | 33.2 | (45.5) | 1,804 | 2,988 | (39.6) | ||
| Interest income | 17,296 | 15,996 | 15,043 | 8.1 | 15.0 | 63,773 | 57,857 | 10.2 | ||
| Daily average interest earning assets* | 871,957 | 772,855 | 12.8 | |||||||
| Interest from customer deposits – demand deposits | (841) | (818) | (856) | 2.8 | (1.8) | (3,194) | (3,098) | 3.1 | ||
| Interest from customer deposits – time deposits | (1,099) | (1,153) | (1,064) | (4.7) | 3.3 | (4,361) | (4,324) | 0.9 | ||
| Interest from credit instruments issued | (373) | (354) | (293) | 5.4 | 27.3 | (1,361) | (1,152) | 18.1 | ||
| Interest on bank and other loans | (571) | (505) | (488) | 13.1 | 17.0 | (2,107) | (1,874) | 12.4 | ||
| Interest on subordinated capital notes | (424) | (419) | (475) | 1.2 | (10.7) | (1,737) | (1,783) | (2.6) | ||
| Interest and premium on sale and repurchase agreements and securities loans | (2,557) | (1,937) | (2,068) | 32.0 | 23.6 | (8,381) | (8,048) | 4.1 | ||
| Interest expense | (5,865) | (5,186) | (5,244) | 13.1 | 11.8 | (21,141) | (20,279) | 4.3 | ||
| Net interest income | 11,431 | 10,810 | 9,799 | 5.7 | 16.7 | 42,632 | 37,578 | 13.4 | ||
*Includes funds available, margin accounts, investments in securities, loan portfolio and sale and repurchase agreements
Net interest income in 4Q15 increased YoY by 16.7%, or Ps.1,632 million, to Ps.11,431 million and QoQ by 5.7%, or Ps.621 million.
The 16.7% YoY increase in net interest income resulted from the combined effect of:
| i) | A 15.0%, or Ps.2,253 million, increase in interest income, to Ps.17,296 million, explained by an increase of Ps.122,584 million, or 14.6%, in average interest-earning assets and a 3 basis points increase in the average interest income rate; and |
| ii) | An 11.8%, or Ps.621 million, increase in interest expense, to Ps.5,865 million, resulting from an increase of Ps.90,760 million, or 11.8%, in interest-bearing liabilities while the average interest rate paid remained unchanged. |
The net interest margin ratio (NIM) calculated with daily average interest-earning assets for 4Q15 improved to 4.74% from 4.66% in 4Q14.
9
NIM calculated with daily average interest-earning assets for 12M15 improved slightly to 4.89% from 4.86% in 12M14.
Interest Income
Santander México’s main source of recurring interest income comes from the loan portfolio, which in 4Q15 accounted for 75.5% of interest income and 54.5% of average interest earning assets. The sources of earnings in this line item are broken down as follows:
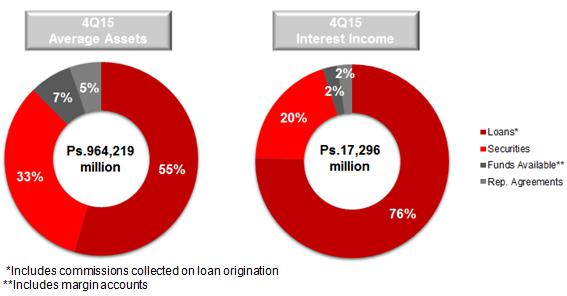
The average interest rate on interest-earning assets for 4Q15 stood at 7.02%, increasing 3 basis points from 6.99% in 4Q14.
Interest income for 4Q15 increased by 15.0%, or Ps.2,253 million, to Ps.17,296 million. On a sequential basis, interest income increased by 8.1%, or Ps.1,300 million.
The 15.0% YoY increase in interest income mainly reflects increases of:
| i) | 15.5%, or Ps.1,755 million, in interest income from our total loan portfolio and commissions on loan origination, which resulted from the combined effect of a Ps.79,031 million, or 17.7%, increase in the average loan portfolio volume, and a 18 basis points decrease in the average interest rate. |
The increase in the average loan portfolio volume is explained by increases across all segments and products, as follows:
| § | 18.7%, or Ps.50,031 million, in the commercial portfolio, mainly reflecting increases of Ps.22,960, or 21.5% million, and Ps.10,226 million, or 20.3%, in mid-market and SMEs, respectively; |
| § | 13.1%, or Ps.13,672 million, in mortgages; |
| § | 33.7%, or Ps.10,905 million, in consumer loans; and |
| § | 10.5%, or Ps.4,423 million, in credit card loans. |
The increase in the average loan portfolio volume more than offset the lower average interest rate earned.
10
The decrease in the average interest rate earned is mainly explained by the prevailing low reference rate in 2015 due to the cut from the Mexican Central Bank during 2014. Variation in the average interest rate earned is broken down as follows:
| § | A 2 basis points decrease in the commercial portfolio, from 5.93% in 4Q14 to 5.91% in 4Q15. This decrease partially resulted from the low reference rate and is also explained by higher competition in middle-market and SMEs; |
| § | A 18 basis points decrease in mortgages, from 9.64% to 9.46%; |
| § | A 39 basis points decrease in consumer loans (excluding credit cards), from 24.76% to 24.37%, explained by the cut in the reference rate during 2014; and |
| § | A 170 basis points decrease in credit cards, from 22.77% to 21.07%, which in addition to the lower reference rate, was further affected by a change in mix in the composition of our credit card portfolio, as we are seeing higher customers who pay their outstanding balances in full therefore not contributing to interest income. |
| ii) | 33.9%, or Ps.856 million, in interest income from our investment in securities portfolio, due to a Ps.86,468 million, or 37.2%, increase in average volume of this portfolio, partially offset by a 10 basis points decrease in the average interest rate earned; and |
| iii) | 58.5%, or Ps.38 million, in margin accounts, which resulted from a Ps.9,946 million, or 49.0%, increase the average volume together with an 8 basis point increase in the average interest rate earned. |
These increases in interest income were partially offset by decreases of:
| i) | 45.5%, or Ps.362 million, in sale and repurchase agreement transactions, which resulted from a Ps.49,230 million, or 49.1%, decrease in the average volume, partially offset by a 22 basis points increase in the average interest rate earned; and |
| ii) | 9.7%, or Ps.34 million, in funds available, which resulted from the combined effect of a Ps.3,631 million, or 8.6%, decrease in the average volume, together with a 4 basis points decrease in the average interest rate earned. |
11
Interest Expense
Santander México’s main sources of funding are repurchase agreements and customer deposits. In 4Q15 these accounted for 43.6% and 33.1% of interest expense, respectively; and 34.7% and 50.7% of average interest liabilities, respectively. Santander México’s funding structure is broken down as follows:
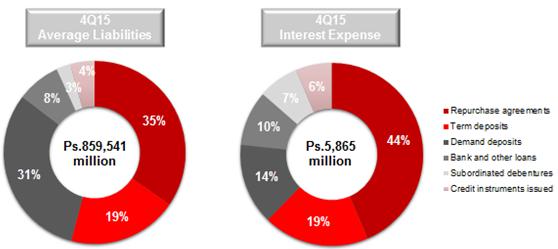
The average interest rate on interest-bearing liabilities remained flat at 2.67% in 4Q15. This stable rate mainly reflects the decrease in reference rates enacted by the Mexican Central Bank during 2014 which resulted in lower interest paid on customer deposits, as well as a shift in the deposit mix towards demand deposits.
Interest expense for 4Q15 increased 11.8%, or Ps.621 million, to Ps.5,865 million. On a sequential basis, interest expense increased by 13.1%, or Ps.679 million.
The 11.8% YoY increase in interest expense mainly reflects increases of:
| i) | 23.6%, or Ps.489 million, in interest paid on sale and repurchase agreement transactions, which resulted from the combined effect of a Ps.26,616 million, or 9.8% increase in the average volume and a 38 basis points increase in the average interest rate paid; |
| ii) | 17.0%, or Ps.83 million, in bank and other loans, mainly due to a Ps.11,886 million, or 21.7% increase in the average volume, was partially offset by a 13 basis points decrease in the average interest rate paid; |
| iii) | 27.3%, or Ps.80 million, in credit instruments issued, which resulted from a Ps.10,800 million, or 41.4% increase in the average volume of credit instruments issued which was partially offset by a 44 basis points decrease in the average interest rate paid; and |
| iv) | 3.3%, or Ps.35 million, in term deposits, which resulted from a Ps.14,159 million, or 9.3% increase in the average volume, partially offset by a 15 basis points decrease in the average interest rate paid. |
These increases in interest expense were partially offset by the following declines:
| i) | 10.7%, or Ps.51 million, on interest paid on subordinated notes, due to a Ps.3,742 million, or 20.7% increase in the average volume together with a 268 basis point decrease in the average interest rate paid; and |
| ii) | 1.8%, or Ps.15 million, on interest paid on demand deposits, due to a Ps.23,557 million, or 9.6% increase in the average volume together with a 15 basis point decrease in the average interest rate paid. |
12
Commission and fee income, net
| Commission and fee income, net | |||||||||||
| Millions of pesos | % Variation | % Variation | |||||||||
| 4Q15 | 3Q15 | 4Q14 | QoQ | YoY | 12M15 | 12M14 | 15/14 | ||||
| Commission and fee income | |||||||||||
| Debit and credit card | 1,424 | 1,307 | 1,257 | 9.0 | 13.3 | 5,196 | 4,756 | 9.3 | |||
| Account management | 220 | 240 | 237 | (8.3) | (7.2) | 896 | 816 | 9.8 | |||
| Collection services | 530 | 531 | 455 | (0.2) | 16.5 | 2,114 | 1,830 | 15.5 | |||
| Investment funds | 350 | 337 | 341 | 3.9 | 2.6 | 1,363 | 1,369 | (0.4) | |||
| Insurance | 1,004 | 1,047 | 1,028 | (4.1) | (2.3) | 4,106 | 3,896 | 5.4 | |||
| Purchase-sale of securities and money market transactions | 204 | 203 | 187 | 0.5 | 9.1 | 814 | 833 | (2.3) | |||
| Checks trading | 65 | 63 | 78 | 3.2 | (16.7) | 257 | 302 | (14.9) | |||
| Foreign trade | 233 | 224 | 175 | 4.0 | 33.1 | 866 | 701 | 23.5 | |||
| Financial advisory services | 365 | 511 | 386 | (28.6) | (5.4) | 1,745 | 1,505 | 15.9 | |||
| Other | 208 | 210 | 206 | (1.0) | 1.0 | 889 | 850 | 4.6 | |||
| Total | 4,603 | 4,673 | 4,350 | (1.5) | 5.8 | 18,246 | 16,858 | 8.2 | |||
| Commission and fee expense | |||||||||||
| Debit and credit card | (438) | (532) | (418) | (17.7) | 4.8 | (1,895) | (1,451) | 30.6 | |||
| Investment funds | (2) | (2) | (16) | 0.0 | (87.5) | (25) | (73) | (65.8) | |||
| Insurance | 25 | (25) | (34) | (200.0) | (173.5) | (18) | (103) | (82.5) | |||
| Purchase-sale of securities and money market transactions | (91) | (71) | (155) | 28.2 | (41.3) | (302) | (406) | (25.6) | |||
| Checks trading | (6) | (6) | (9) | 0.0 | (33.3) | (23) | (33) | (30.3) | |||
| Financial advisory services | (13) | (14) | (2) | (7.1) | 550.0 | (46) | (62) | (25.8) | |||
| Other | (301) | (337) | (352) | (10.7) | (14.5) | (1,165) | (1,313) | (11.3) | |||
| Total | (826) | (987) | (986) | (16.3) | (16.2) | (3,474) | (3,441) | 1.0 | |||
| Commission and fee income, net | |||||||||||
| Debit and credit card | 986 | 775 | 839 | 27.2 | 17.5 | 3,301 | 3,305 | (0.1) | |||
| Account management | 220 | 240 | 237 | (8.3) | (7.2) | 896 | 816 | 9.8 | |||
| Collection services | 530 | 531 | 455 | (0.2) | 16.5 | 2,114 | 1,830 | 15.5 | |||
| Investment funds | 348 | 335 | 325 | 3.9 | 7.1 | 1,338 | 1,296 | 3.2 | |||
| Insurance | 1,029 | 1,022 | 994 | 0.7 | 3.5 | 4,088 | 3,793 | 7.8 | |||
| Purchase-sale of securities and money market transactions | 113 | 132 | 32 | (14.4) | 253.1 | 512 | 427 | 19.9 | |||
| Checks trading | 59 | 57 | 69 | 3.5 | (14.5) | 234 | 269 | (13.0) | |||
| Foreign trade | 233 | 224 | 175 | 4.0 | 33.1 | 866 | 701 | 23.5 | |||
| Financial advisory services | 352 | 497 | 384 | (29.2) | (8.3) | 1,699 | 1,443 | 17.7 | |||
| Other | (93) | (127) | (146) | (26.8) | (36.3) | (276) | (463) | (40.4) | |||
| Total | 3,777 | 3,686 | 3,364 | 2.5 | 12.3 | 14,772 | 13,417 | 10.1 |
* Includes fees from: collections and payments, account management, checks, foreign trade and others
In 4Q15, net commission and fee income totaled Ps.3,777 million, increasing YoY by 12.3%, or Ps.413 million, and by 2.5%, or Ps.91 million, QoQ.
In 2Q15, the cost associated to the insurance premium paid to NAFIN in connection with the guarantee programs for SMEs was reclassified from commission and fee income to expenses for loan recoveries in the other operating income line. On a comparable basis, excluding the reclassification of the insurance premiums, net commissions and fees increased 8.9% YoY and 2.4% sequentially.
13
The main contributor to net commissions and fees in the quarter were insurance fees, which accounted for 27.2% of the total, followed by debit and credit card and cash management1 fees which accounted for 26.1% and 25.1% of total commissions and fees, respectively.
| Commission and fee income, net | |||||||||
| Breakdown (%) | |||||||||
| 4Q15 | 3Q15 | 4Q14 | 12M15 | 12M14 | |||||
| Debit and Credit card | 26.1 | 21.0 | 24.9 | 22.3 | 24.6 | ||||
| Account management | 5.8 | 6.5 | 7.0 | 6.1 | 6.1 | ||||
| Collection services | 14.0 | 14.4 | 13.5 | 14.3 | 13.6 | ||||
| Investment funds | 9.2 | 9.1 | 9.7 | 9.1 | 9.7 | ||||
| Insurance | 27.2 | 27.7 | 29.5 | 27.7 | 28.3 | ||||
| Purchase-sale of securities and money market transactions | 3.0 | 3.6 | 1.0 | 3.5 | 3.2 | ||||
| Checks trading | 1.6 | 1.5 | 2.1 | 1.6 | 2.0 | ||||
| Foreign trade | 6.2 | 6.1 | 5.2 | 5.9 | 5.2 | ||||
| Financial advisory services | 9.3 | 13.5 | 11.4 | 11.5 | 10.8 | ||||
| Other | (2.5) | (3.4) | (4.3) | (1.9) | (3.5) | ||||
| Total | 100.0 | 100.0 | 100.0 | 100.0 | 100.0 |
The 12.3% YoY increase of net commissions and fees in 4Q15 mainly resulted from the following increases:
| i) | 17.5%, or Ps.147 million, in debit and credit cards, mainly reflecting a pick-up after three consecutive flat quarters which resulted from higher card use together with lower placement fees and reward costs in the quarter; |
| ii) | 253.1%, or Ps.81 million, in purchase-sale of securities and money market transactions; |
| iii) | 16.5%, or Ps.75 million, in collection and payment services, reflecting recurring customer activity and transaction activity; and |
| iv) | 33.1%, or Ps.58 million, in foreign trade, which resulted from our strong focus on growing this business and our wide product offering. |
These increases in net commissions and fees were partially offset by an 8.3%, or Ps.32 million, decline in financial advisory fees as this quarter Santander México executed a lower number of deals from its pipeline reflecting weaker market conditions in this segment.
1* Cash management fees include fees from: collections and payments, account management, checks, foreign trade and others
14
Net gain (loss) on financial assets and liabilities
Net gain (loss) on financial assets and liabilities | |||||||||||
| Millions of pesos | % Variation | % Variation | |||||||||
| 4Q15 | 3Q15 | 4Q14 | QoQ | YoY | 12M15 | 12M14 | 15/14 | ||||
| Valuation | |||||||||||
| Foreign exchange | 608 | 116 | (101) | 424.1 | (702.0) | 719 | (101) | (811.9) | |||
| Derivatives | (489) | 2,075 | 3,331 | (123.6) | (114.7) | 8,225 | 3,909 | 110.4 | |||
| Shares | (361) | 235 | (71) | (253.6) | 408.5 | (90) | (118) | (23.7) | |||
| Debt instruments | (76) | (533) | (238) | (85.7) | (68.1) | (967) | 471 | (305.3) | |||
| Valuation result | (318) | 1,893 | 2,921 | (116.8) | (110.9) | 7,887 | 4,161 | 89.5 | |||
| Purchase / sale of securities | |||||||||||
| Foreign exchange | (572) | (212) | (566) | 169.8 | 1.1 | (1,407) | (689) | 104.2 | |||
| Derivatives | 1,415 | (1,606) | (2,044) | (188.1) | (169.2) | (5,134) | (938) | 447.3 | |||
| Shares | (47) | 140 | (90) | (133.6) | (47.8) | 65 | 50 | 30.0 | |||
| Debt instruments | (131) | 368 | 174 | (135.6) | (175.3) | 854 | 373 | 129.0 | |||
| Purchase -sale result | 665 | (1,310) | (2,526) | (150.8) | (126.3) | (5,622) | (1,204) | 366.9 | |||
| Total | 347 | 583 | 395 | (40.5) | (12.2) | 2,265 | 2,957 | (23.4) | |||
In 4Q15, Santander México reported a Ps.347 million net gain from financial assets and liabilities, which compares with gains of Ps.395 million in 4Q14 and Ps.583 million in 3Q15.
The Ps.347 million net gain from financial assets and liabilities in the quarter is mainly explained by:
| i) | A Ps.665 million purchase-sale gain principally related to gains of Ps.1,415 million in derivatives, which were partially offset by purchase-sale losses of Ps.572 million, Ps.131 million and Ps.47 million in foreign exchange instruments, debt instruments and share instruments. |
This gain was partially offset by:
| i) | A Ps.318 million valuation loss which resulted from losses of Ps.489 million, Ps.361 million and Ps.76 million in derivatives, share instruments and in debt instruments, respectively. These valuation losses were partially offset by gains of Ps.608 million in foreign exchange instruments. |
15
Other operating income
| Other operating income |
| Millions of pesos | % Variation | % Variation | |||||||||
| 4Q15 | 3Q15 | 4Q14 | QoQ | YoY | 12M15 | 12M14 | 15/14 | ||||
| Recovery of previously written-off loans | 860 | 601 | 733 | 43.1 | 17.3 | 2,443 | 2,164 | 12.9 | |||
| Cancellation of liabilities and reserves | 77 | 85 | 60 | (9.4) | 28.3 | 329 | 239 | 37.7 | |||
| Interest on personnel loans | 30 | 29 | 27 | 3.4 | 11.1 | 114 | 111 | 2.7 | |||
| Allowance for losses on foreclosed assets | (24) | (36) | (7) | (33.3) | 242.9 | (88) | (40) | 120.0 | |||
| Profit from sale of foreclosed assets | 43 | 55 | 72 | (21.8) | (40.3) | 237 | 478 | (50.4) | |||
| Technical advisory services | 3 | 6 | 7 | (50.0) | (57.1) | 16 | 19 | (15.8) | |||
| Portfolio recovery legal expenses and costs | (321) | (333) | (220) | (3.6) | 45.9 | (1,215) | (728) | 66.9 | |||
| Write-offs and bankruptcies | (72) | (316) | (146) | (77.2) | (50.7) | (828) | (654) | 26.6 | |||
| Provision for legal and tax contingencies | 59 | 40 | (62) | 47.5 | (195.2) | 15 | (227) | (106.6) | |||
| IPAB ("Indemnity") provisions and payments | (2) | (1) | (1) | 100.0 | 100.0 | (6) | (6) | 0.0 | |||
| Result on sale of loan portfolio | 0 | 0 | 6 | 0.0 | (100.0) | 52 | (100) | (152.0) | |||
| Income from acquisition of Scotiabank portfolio | 177 | 0 | (100.0) | 0.0 | 177 | 0 | 0.0 | ||||
| Others | 53 | 18 | 64 | 194.4 | (17.2) | 133 | 179 | (25.7) | |||
| Total | 706 | 325 | 533 | 117.2 | 32.5 | 1,379 | 1,435 | (3.9) | |||
Other income in 4Q15 totaled Ps.706 million, up from Ps.533 million in 4Q14 and Ps.325 million in 3Q15, representing increases of 32.5% YoY and 117.2% QoQ. These comparisons however, are affected by the reclassification made in 2Q15 where the cost associated with the insurance premium paid to NAFIN in connection with the guarantee programs for SMEs was reclassified from commission and fee expense to expenses for loan recoveries in the other operating income line. Excluding this effect, on a comparable basis, other income increased Ps.288 million, or 54.0%, YoY and Ps.388 million, or 89.6%, QoQ.
The 32.5% YoY increase in other income was mainly driven by the following;
| i) | A Ps.127 million, or 17.3%, increase in recoveries from previously written off loans, mainly explained by the sale of Ps.242 million written-off loans; |
| ii) | A Ps.121 million, or 195.2%, decrease in provision for legal and tax contingencies; and |
| iii) | A Ps.74 million, or 50.7%, decrease in expenses in connection with write-offs and bankruptcies. |
These contributions to other income were partially offset by a Ps.101 million, or 45.9%, increase in portfolio recovery costs and legal expenses. On a comparable basis, excluding the cost associated with the insurance premium paid to NAFIN, these expenses would have decreased 6.3% or Ps.14 million.
16
Administrative and promotional expenses
Administrative and promotional expenses consist of personnel costs such as payroll and benefits, promotion and advertising expenses, and other general expenses. Personnel expenses consist mainly of salaries, social security contributions, bonuses and our long-term incentive plan for our executives. Other general expenses mainly consist of: expenses related to technology and systems, administrative services, which are mainly services outsourced in the areas of information technology, taxes and duties, professional fees, contributions to bank savings protection system (IPAB), rental of properties and hardware, advertising and communication, surveillance and cash courier services and expenses related to maintenance, conservation and repair, among others.
| Administrative and promotional expenses | |||||||||||
| Millions of pesos | % Variation | % Variation | |||||||||
| 4Q15 | 3Q15 | 4Q14 | QoQ | YoY | 12M15 | 12M14 | 15/14 | ||||
| Salaries and employee benefits | 2,807 | 3,029 | 2,886 | (7.3) | (2.7) | 11,709 | 10,816 | 8.3 | |||
| Credit card operation | 55 | 72 | 77 | (23.6) | (28.6) | 314 | 285 | 10.2 | |||
| Professional fees | 168 | 92 | 166 | 82.6 | 1.2 | 458 | 437 | 4.8 | |||
| Leasehold | 555 | 427 | 393 | 30.0 | 41.2 | 1,844 | 1,622 | 13.7 | |||
| Promotional and advertising expenses | 243 | 88 | 162 | 176.1 | 50.0 | 659 | 564 | 16.8 | |||
| Taxes and duties | 320 | 358 | 167 | (10.6) | 91.6 | 1,366 | 1,184 | 15.4 | |||
| Technology services (IT) | 527 | 688 | 578 | (23.4) | (8.8) | 2,400 | 2,404 | (0.2) | |||
| Depreciation and amortization | 429 | 439 | 409 | (2.3) | 4.9 | 1,864 | 1,682 | 10.8 | |||
| Contributions to bank savings protection system (IPAB) | 590 | 567 | 508 | 4.1 | 16.1 | 2,238 | 1,887 | 18.6 | |||
| Cash protection | 146 | 154 | 109 | (5.2) | 33.9 | 611 | 589 | 3.7 | |||
| Others | 597 | 512 | 604 | 16.6 | (1.2) | 2,180 | 2,350 | (7.2) | |||
| Total | 6,437 | 6,426 | 6,059 | 0.2 | 6.2 | 25,643 | 23,820 | 7.7 | |||
Santander México’s administrative and promotional expenses are broken down as follows:
| Administrative and promotional expenses | |||||||||
| Breakdown (%) | |||||||||
| 4Q15 | 3Q15 | 4Q14 | 12M15 | 12M14 | |||||
| Salaries and employee benefits | 43.6 | 47.1 | 47.6 | 45.7 | 45.4 | ||||
| Credit card operation | 0.9 | 1.1 | 1.3 | 1.2 | 1.2 | ||||
| Professional fees | 2.6 | 1.4 | 2.7 | 1.8 | 1.8 | ||||
| Leasehold | 8.6 | 6.6 | 6.5 | 7.2 | 6.8 | ||||
| Promotional and advertising expenses | 3.8 | 1.4 | 2.7 | 2.6 | 2.4 | ||||
| Taxes and duties | 5.0 | 5.6 | 2.8 | 5.3 | 5.0 | ||||
| Technology services (IT) | 8.2 | 10.7 | 9.5 | 9.4 | 10.1 | ||||
| Depreciation and amortization | 6.7 | 6.8 | 6.8 | 7.3 | 7.1 | ||||
| Contributions to bank savings protection system (IPAB) | 9.2 | 8.8 | 8.4 | 8.7 | 7.9 | ||||
| Cash protection | 2.3 | 2.4 | 1.8 | 2.4 | 2.5 | ||||
| Others | 9.3 | 8.0 | 10.0 | 8.5 | 9.9 | ||||
| Total | 100.0 | 100.0 | 100.0 | 100.0 | 100.0 | ||||
Administrative and promotional expenses in 4Q15 amounted to Ps.6,437 million which compare with Ps.6,059 million in 4Q14 and Ps.6,426 million in 3Q15, increasing 6.2% YoY and remaining flat QoQ.
17
The 6.2% YoY rise in administrative and promotional expenses was mainly due to the following increases:
| i) | A 41.2%, or Ps.162 million, in leaseholds, mainly reflecting a larger number of branches which resulted from the branch expansion plan executed in the past two years; |
| ii) | A 91.6%, or Ps.153 million, in taxes and duties; |
| iii) | A 50.0%, or Ps.81 million, in promotional and advertising expenses, reflecting the investment in positioning “Santander’s” brand during the last quarter at events such as Formula 1 in Mexico during November 2015; and |
| iv) | A 16.1%, or Ps.82 million, in contributions to the bank savings protection system (IPAB), reflecting growth in funding sources. |
Expenses continue to reflect cost management initiatives that translate into an optimized operating structure, mitigating costs resulting from the investment in strategic businesses, technology and a larger branch network.
Expenses include the deposit insurance fee or IPAB, which increased YoY by 16.1%, or Ps.82 million, reflecting growth in funding sources. Excluding the deposit insurance fee, expenses would have increased by 5.3%.
The implementation of tight cost controls across the organization combined with strong core earnings allowed us to improve the efficiency ratio by 100 basis points YoY to 42.0% from 43.0% and by 90 basis points sequentially.
The recurrence ratio was 62.1%, which compares to 60.6% reported in 4Q14 and 61.9% in 3Q15.
Income Taxes
In 4Q15 Santander México reported a tax expense of Ps.1,204 million compared to tax expenses of Ps.895 million in 4Q14 and Ps.935 million in 3Q15.
The effective tax rate for the quarter was 22.2%, 320 basis points and 90 basis points higher compared to 19.0% reported in 4Q14 and 21.3% paid in 3Q15. The effective tax rate for the twelve-month period ending 31 December, 2015 was 22.5%.
Contribution to net income by subsidiary
Reported net income in 4Q15 was Ps.4,224 million, representing increases of 10.5% YoY and 21.9% QoQ.
Casa de Bolsa Santander, the brokerage business, reported net profit of Ps.8 million in 4Q15, compared with net loss of Ps.2 million in 4Q14 and net profit of Ps.3 million in 3Q15.
The Holding (Grupo Financiero) reported a net loss of Ps.20 million in 4Q15, compared with net losses of Ps.16 million in 4Q14 and Ps.14 million in 3Q15.
| Earnings contribution by subsidiary |
| Millions of pesos | |||||||||||
| % Variation | % Variation | ||||||||||
| 4Q15 | 3Q15 | 4Q14 | QoQ | YoY | 12M15 | 12M14 | 15/14 | ||||
| Banking business 1/ | 4,236 | 3,475 | 3,842 | 21.9 | 10.3 | 14,186 | 14,053 | 0.9 | |||
| Brokerage | 8 | 3 | (2) | 166.7 | 500.0 | 12 | 11 | 9.1 | |||
| Holding | (20) | (14) | (16) | 42.9 | 25.0 | (57) | (50) | 14.0 | |||
| Net income attributable to Grupo Financiero Santander México | 4,224 | 3,464 | 3,824 | 21.9 | 10.5 | 14,141 | 14,014 | 0.9 | |||
| 1/Includes sofomes | |||||||||||
18
LOAN PORTFOLIO AND ASSET QUALITY
Loan portfolio
The evolution of the loan portfolio continues to show a positive trend, with diversification in all segments and growth across all core businesses.
| Portfolio Breakdown | |||||||
| Millions of pesos | % Variation | ||||||
| 4Q15 | 3Q15 | 4Q14 | QoQ | YoY | |||
| Commercial | 335,575 | 320,963 | 283,329 | 4.6 | 18.4 | ||
| Middle- market | 131,503 | 128,805 | 105,552 | 2.1 | 24.6 | ||
| Corporates | 70,865 | 67,132 | 64,435 | 5.6 | 10.0 | ||
| SME´s | 63,493 | 62,020 | 51,835 | 2.4 | 22.5 | ||
| Government & Financial Entities | 69,714 | 63,006 | 61,507 | 10.6 | 13.3 | ||
| Individuals | 212,170 | 205,074 | 182,212 | 3.5 | 16.4 | ||
| Consumer | 91,693 | 88,273 | 75,624 | 3.9 | 21.2 | ||
| Credit Cards | 47,775 | 45,515 | 42,104 | 5.0 | 13.5 | ||
| Other Consumer | 43,918 | 42,758 | 33,520 | 2.7 | 31.0 | ||
| Mortgages | 120,477 | 116,801 | 106,588 | 3.1 | 13.0 | ||
| Total | 547,745 | 526,037 | 465,541 | 4.1 | 17.7 | ||
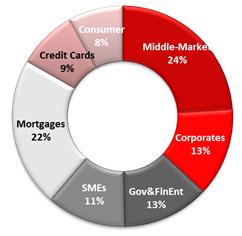
The total loan portfolio rose YoY by 17.7%, or Ps.82,204 million, to Ps.547,745 million in 4Q15. On a sequential basis, the total loan portfolio increased 4.1%, or Ps.21,708 million. All core segments grew above market rates, with SMEs, middle-market, mortgages and consumer showing the strongest performance, followed by corporates and government entities, and financial institutions that also posted healthy growth. Meanwhile, credit cards continued to recover, growing above market rates.
19
| Loan portfolio breakdown | ||||||||
| Millions of pesos | ||||||||
| 4Q15 | % | 3Q15 | % | 4Q14 | % | |||
| Performing loans | ||||||||
| Commercial | 326,979 | 59.7 | 311,781 | 59.3 | 274,438 | 59.0 | ||
| Individuals | 202,518 | 37.0 | 195,904 | 37.2 | 173,648 | 37.3 | ||
| Consumer | 88,029 | 16.1 | 85,010 | 16.2 | 72,459 | 15.6 | ||
| Credit cards | 45,690 | 8.3 | 43,713 | 8.3 | 40,371 | 8.7 | ||
| Other consumer | 42,339 | 7.7 | 41,297 | 7.9 | 32,088 | 6.9 | ||
| Mortgages | 114,489 | 20.9 | 110,894 | 21.1 | 101,189 | 21.7 | ||
| Total performing loans | 529,497 | 96.7 | 507,685 | 96.5 | 448,086 | 96.3 | ||
| Non-performing loans | ||||||||
| Commercial | 8,596 | 1.6 | 9,182 | 1.7 | 8,891 | 1.9 | ||
| Individuals | 9,652 | 1.8 | 9,170 | 1.7 | 8,564 | 1.8 | ||
| Consumer | 3,664 | 0.7 | 3,263 | 0.6 | 3,165 | 0.7 | ||
| Credit cards | 2,084 | 0.4 | 1,802 | 0.3 | 1,733 | 0.4 | ||
| Other consumer | 1,580 | 0.3 | 1,461 | 0.3 | 1,432 | 0.3 | ||
| Mortgages | 5,988 | 1.1 | 5,907 | 1.1 | 5,399 | 1.2 | ||
| Total non-performing loans | 18,248 | 3.3 | 18,352 | 3.5 | 17,455 | 3.7 | ||
| Total loan portfolio | ||||||||
| Commercial | 335,575 | 61.3 | 320,963 | 61.0 | 283,329 | 60.9 | ||
| Individuals | 212,170 | 38.7 | 205,074 | 39.0 | 182,212 | 39.1 | ||
| Consumer | 91,693 | 16.7 | 88,273 | 16.8 | 75,624 | 16.2 | ||
| Credit cards | 47,775 | 8.7 | 45,515 | 8.7 | 42,104 | 9.0 | ||
| Other consumer | 43,918 | 8.0 | 42,758 | 8.1 | 33,520 | 7.2 | ||
| Mortgages | 120,477 | 22.0 | 116,801 | 22.2 | 106,588 | 22.9 | ||
| Total loan portfolio | 547,745 | 100.0 | 526,037 | 100.0 | 465,541 | 100.0 |
The Commercial loan portfolio is comprised of loans to business and commercial entities, as well as loans togovernment entities and financial institutions, and represented 61.3% of the total loan portfolio. Excluding loans to government entities, the commercial loan portfolio accounted for 50.3% of the total loan portfolio. As of 4Q15, commercial loans increased 18.4% YoY, principally reflecting increases of 24.6%, 22.5% and 10.0% in the middle market, SMEs and corporate segments, respectively. Loans to government and financial entities increased 13.3% YoY, reflecting loans to the federal government, and a couple of states and financial entities, but mostly composed by loans to the two state-owned energy companies in Mexico.
On a sequential basis, the commercial loan portfolio increased 4.6%, principally reflecting strong growth in both government and financial entities, and corporates, which grew 10.6% and 5.6%, respectively. Meanwhile, SMEs and middle-markets were up 2.4% and 2.1%, respectively, maintaining a solid performance and a continued positive trend.
The Individual loan portfoliocomprised of mortgages, consumer and credit card loans, represented 38.7% of the total loan portfolio and increased 16.4% YoY. Credit cards, consumer and mortgage loans represented 8.7%, 8.0%, and 22.0% of the total loan portfolio, respectively, and increased YoY by 13.5%, 31.0%, and 13.0%, respectively.
On a sequential basis, consumer loans and credit cards increased 2.7% and 5.0%, respectively, reflecting a sustained pick-up in personal and payroll loans, while credit card growth continued to accelerate and gradually recover. Santander México has maintained above-market growth rates, principally reflecting its focus on innovation and strong commercial activity. We continue to penetrate the open market focusing on medium- and high-income individuals.
20
Asset quality
| Asset quality | ||||||
| Millions of pesos | ||||||
| % Variation | ||||||
| 4Q15 | 3Q15 | 4Q14 | QoQ | YoY | ||
| Total loans | 547,745 | 526,037 | 465,541 | 4.13 | 17.66 | |
| Performing loans | 529,497 | 507,685 | 448,086 | 4.30 | 18.17 | |
| Non-performing loans | 18,248 | 18,352 | 17,455 | (0.57) | 4.54 | |
| Allowance for loan losses | (19,743) | (19,415) | (16,951) | 1.69 | 16.47 | |
| Charge-offs & Debit Relieves | (4,126) | (3,734) | (3,100) | 10.5 | 33.1 | |
| Non-performing loan ratio | 3.33% | 3.49% | 3.75% | (16bps) | (42bps) | |
| Coverage ratio | 108.2% | 105.8% | 97.1% | 240bps | 1110bps | |
| Cost of Risk* | 3.40% | 3.45% | 3.32% | (5bps) | 8bps | |
*Cost of risk is calculated using annualized cumulative provisions for loan losses for the period
Non-performing loans at the end of 4Q15 increased YoY by Ps.793 million, or 4.5%, to Ps.18,248 million, and decreased 0.6%, or Ps.104 million QoQ.
On a YoY basis, increases of Ps.589 million, or 10.9%, in mortgages and Ps.499 million, or 15.6% in consumer loans (including credit cards) were partly offset by a decrease of Ps.295 million, or 3.3%, in commercial loans. The YoY 10.9% increase in non-performing mortgage loans, mainly resulted from an internal change in the charge-off policy which was extended from 12 months to 36 months for those mortgages originated at the bank, which represent 84% of total mortgages. The charge-of policy for the remaining mortgages which were originated at Santander Hipotecario and Santander Vivienda was reduced from 48 months to 36 months, thus unifying the overall charge-off criteria in this segment.
On a sequential basis, Santander México reported increases of Ps.81 million, or 1.4%, in mortgages and Ps.401 million, or 12.3% in consumer loans (including credit cards). The increase in non-performing credit card loans mainly reflects lower charge-offs in the quarter. The increases in non-performing mortgage and credit card loans were more than offset by a decrease of Ps.586 million, or 6.4%, in commercial loans, which mainly resulted from further progress by the homebuilders.
The breakdown of the non-performing loan portfolio is as follows: commercial loans 47.1%, mortgage loans 32.8% and consumer loans (including credit cards) 20.1%.
| Non-Performing Loan Ratios | |||||
| % | 4Q15 | 3Q15 | 4Q14 | ||
| Commercial | 2.56 | 2.86 | 3.14 | ||
| Individuals | |||||
| Consumer | 4.00 | 3.70 | 4.00 | ||
| Credit Card | 4.36 | 3.96 | 4.12 | ||
| Other consumer | 4.07 | 3.35 | 2.43 | ||
| Mortgages | 4.97 | 5.06 | 5.07 | ||
| Total | 3.33 | 3.49 | 3.75 |
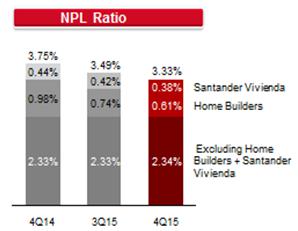
The above mentioned variations to non-performing loans led to an improvement in the NPL ratio, down to 3.33% in 4Q15, decreasing by 42 basis points from 3.75% in 4Q14 and 16 basis points lower than the 3.49% reported in 3Q15.
The NPL ratio for 4Q15 continues to reflect Santander México’s exposure to homebuilders, with non-performing loans of Ps.3,479 million, as well as the impact of Santander Vivienda’s non-performing portfolio, which as of 4Q15 amounted to Ps.2,289 million.
21
Our total exposure to homebuilders as of 4Q15 decreased further QoQ by Ps.560 million to Ps.4,233 million, while non-performing loans declined by the same amount to Ps.3,479 million; driven by additional progress in the situation with the homebuilders, resulting in a write-off of the unsecured exposure in connection with one of the homebuilders´ after receiving shares in payment.
Excluding the impact of the homebuilders and Santander Vivienda’s portfolio, the NPL ratio for 4Q15 would have been 2.34%. The current NPL ratio continues to reflect loan portfolio growth combined with Santander México’s stringent credit scoring model and ongoing monitoring of loan portfolio quality.
*Cost of risk is calculated using annualized cumulative provisions for loan losses for the period
During 4Q15, provisions for loan losses amounted to Ps.4,424 million, which represented an increase of Ps.1,090 million, or 32.7%, YoY and a decrease of Ps.170 million, or 3.7%, on a sequential basis.
The 32.7% YoY increase in provisions mainly reflect: i) significant business volume growth across all segments; and ii) provisions in connection with our exposure to certain corporates, respectively; as well as difficult comps from lower provisions in 4Q14 resulting from the reversal of some provisions related to loans that were restructured in 3Q14 and became current in 4Q14.
Cost of risk in 4Q15 stood at 3.40%, which compares to 3.32% and 3.45% reported in 4Q14 and 3Q15, respectively.
22
The coverage ratio for the quarter was 108.2%, increasing from 97.1% in 4Q14 and 105.8% in 3Q15. The improvement in the coverage ratio was mainly due to lower non-performing loans in the commercial segment reflecting improvements in negotiations with homebuilders.
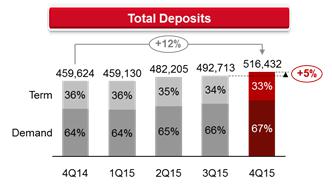
TOTAL DEPOSITS
Total deposits at the end of 4Q15 amounted to Ps.516,432 million, representing increases of 12.4% YoY and 4.8% sequentially. Demand deposits reached Ps.347,786 million, increasing 18.3% YoY and 6.7% sequentially, partly reflecting system seasonality. Term deposits, in turn, reached Ps.168,646 million, showing an increase of 1.9% YoY and 1.1% QoQ.
Santander México continues to implement its strategy of further enhancing customer service to meet the needs of each segment. Campaigns targeting the SMEs and middle-market segments, together with products offered to middle- and high-income clients have resulted in increases of 17.5%, 19.9% and 12.9% in demand deposits from individuals, SMEs and middle-market, respectively. This performance in deposits has led to an improved mix which supports a stable cost of deposits and contributes to funding.

LIQUIDITY COVERAGE RATIO
Pursuant Banxico’s and CNBV regulatory requirements, the average Liquidity Coverage Ratio (LCR or CCL by its Spanish acronym) for 4Q15 was 107.45%, which compares to 106.60% in 3Q15. (Please refer to note 25 of this report).
23
CAPITALIZATION AND ROAE
| Capitalization | ||||||
| Millions of pesos | 4Q15 | 3Q15 | 4Q14 | |||
| Fundamental | 80,328 | 81,344 | 76,697 | |||
| Non-fundamental | 23,311 | 22,456 | 19,820 | |||
| Total Capital | 103,639 | 103,800 | 96,517 | |||
| Risk-weighted assets | ||||||
| Credit risk | 487,440 | 447,044 | 406,832 | |||
| Credit, market and operational risk | 664,122 | 672,566 | 596,952 | |||
| Credit risk ratios: | ||||||
| Fundamental (%) | 16.5 | 18.2 | 18.8 | |||
| Non-fundamental (%) | 4.8 | 5.0 | 4.9 | |||
| Capitalization ratio (%) | 21.3 | 23.2 | 23.7 | |||
| Total capital ratios: | ||||||
| Fundamental (%) | 12.1 | 12.1 | 12.9 | |||
| Non-fundamental (%) | 3.5 | 3.3 | 3.3 | |||
| Capitalization ratio (%) | 15.6 | 15.4 | 16.2 |
Banco Santander México’s preliminary capital ratio at period end 4Q15 was 15.6%, compared to 16.2% and 15.4% at 4Q14 and 3Q15, respectively. The 15.6% capital ratio was comprised of 12.1% fundamental (CET1) and 3.5% non-fundamental (Tier 2).
As of November 2015, Banco Santander México is classified within Category 1 in accordance with Article 134bis of the Mexican Banking Law, and remains in this category as per the preliminary results dated December 2015, which is the most recent available analysis.
ROAE in 4Q15 was 12.9%, which compares with 14.0% in 4Q14 and improved from 12.1% in 3Q15.
24
RELEVANT EVENTS & REPRESENTATIVE ACTIVITIES AND TRANSACTIONS
Relevant Events
Banco Santander México published Pilar III pursuant CNBV requirements
On January 29, 2016 Banco Santander México published its Pilar III report on risk and capital issues, pursuant to CNBV requirements.
Please refer to the following link to access the complete document:
http://www.santander.com.mx/ir/english/financial/annual.html
Banco Santander México completed an equity swap derivative financial instrument with underlying shares of OMA
On January 8, 2016 Banco Santander México announced that upon request of a holding company of Grupo Aeroportuario del Centro Norte, S.A.B. de C.V. (OMA), it completed an equity swap derivative financial instrument with underlying shares of OMA prior to its termination date, thereby eliminating its shareholding in the company.
Banco Santander México issued debt in the local market
On December 10, 2015 Banco Santander México issued a three-year, Ps.3,000 million bond at a variable rate of TIIE + 18 basis points.
Santander México’s changes in its Board of Directors and CEO positions became effective
On January 1st, 2016, the appointment of Ing. Marcos Martínez Gavica as Chairman of the Board of Directors, became effective.
On December 1st, 2015, the appointment of Lic. Héctor B. Grisi Checa as Executive President and CEO of the Group became effective.
General Ordinary and Extraordinary Shareholders’ Meeting
On November 25, 2015, Santander México held its General Ordinary and Extraordinary Shareholders’ Meeting and approved among other items:
| · | To decree payment of a cash dividend to the Company’s Shareholders for the amount of Ps.3,226 million, which was paid on December 22, 2015. |
| · | To amend the Chapter X of the Corporate By-Laws in order to incorporate the measures to avoid Conflict of Interests, as provided by the General Rules of Financial Groups published in the Official Journal of the Federation on December 31, 2014, such resolution is subjected to a suspensive condition that the Corporation attains the corresponding approval by the Ministry of Finance and Public Credit, as well as others required and necessary. |
| · | The resignation of Messrs. Carlos Gómez y Gómez, José Doncel Razola and Carlos Fernández González from the position of Non-Independent Director of Series “F” shares |
| · | The appointment of Messrs. Héctor B. Grisi Checa and Ángel Rivera Congosto as Non Independent Directors of Series “F” shares. |
| · | That the changes to the members of the Board of Directors would become effective on January 1st, 2016. |
| · | Finally, the approval of the composition of the Board of Directors as indicated below: |
25
| Series “F” Non Independent Directors | |
| D. Marcos Alejandro Martínez Gavica | Chairman |
| D. Héctor B. Grisi Checa | Director |
| D. Rodrigo Echenique Gordillo | Director |
| D. Ángel Rivera Congosto | Director |
| D. Rodrigo Brand de Lara | Director |
| D. Vittorio Corbo Lioi | Alternate Director |
| D. Francisco Javier Hidalgo Blazquez | Alternate Director |
| D. Pedro José Moreno Cantalejo | Alternate Director |
| D. Fernando Borja Mujica | Alternate Director |
| Series “F” Independent Directors | |
| D. Guillermo Güemez García | Director |
| D. Joaquín Vargas Guajardo | Director |
| D. Juan Gallardo Thurlow | Director |
| D. Eduardo Carredano Fernández | Alternate Director |
| D. Jesús Federico Reyes Heroles González Garza | Alternate Director |
| Series “B” Independent Directors | |
| D. Fernando Solana Morales | Director |
| D. Fernando Ruíz Sahagún | Director |
| D. Alberto Torrado Martínez | Director |
| D. Gina Lorenza Diez Barroso Azcárraga | Director |
| D. Enrique Krauze Kleinbort | Alternate Director |
| D. Antonio Purón Mier y Terán | Alternate Director |
Santander México selected PricewaterhouseCoopers, S.C. (“PWC”) as external auditors
Santander México selected PWC as external auditors, to audit its financial statements starting in 2016. Such resolution has been adopted in accordance with corporate governance recommendations related to the rotation of the external auditor, following a proposal by the audit committee and the results of a fully transparent selection process.
Representative Transactions
Santander México acted as joint placement agent of Banco Santander México’s debt issuance
Santander México acted as joint placement agent of a three-year, Ps.3,000 million bond at a variable rate of TIIE + 18 basis points.
Santander México acted as joint placement agent of CFE’s debt issuance
Santander México acted as joint placement agent in a combined three-part issuance which totaled Ps.8,000 million, which was broken down as follows: Ps.2,500 million at fix rate, Ps.500 million at variable rate and Ps.5,000 million at an UDI denominated rate.
Santander México participated in a Club Deal with Consorcio Ara
Santander México participated along with 3 other Banks in a 5-year Club Deal with Consorcio Ara for Ps.1,850 million.
Santander México acted as structuring agent and bookrunner of a financing facility for Elementia
Santander México acted as structuring agent and bookrunner of a 5-year, US$500 million financing facility for Elementia.
Santander México acted as manager in a syndicated loan for Minera Frisco
Santander México acted as manager in a 5-year, US$1,100 million syndicated loan for Minera Frisco.
Santander México acted as senior mandated lead arranger for the financing of the new Mexico City’s airport
Santander México acted as senior mandated lead arranger for a U$3,000 million credit facility for the new Mexico City’s airport. Grupo Aeroportuario de la Ciudad de México acted as sponsor.
26
Santander México participated in financing public works (Pidiregas) for CFE
Santander México participated in a 10-year, Ps.5,000 million financing for public works (Pidiregas) for CFE.
AWARDS & RECOGNITIONS
“Best Investment Bank in Mexico” by International Finance Magazine
On November 19, 2015, the prestigious magazineInternational Finance Magazine recognized Banco Santander México as the “Best Investment Bank in Mexico”.
These financial awards recognize organizations that make a difference through the highest standards of innovation and performance.
“Best Infrastructure Bank in Mexico” by LatinFinance
On October 13, 2015, Banco Santander México was awarded for the second consecutive year as "Best Bank in infrastructure in Mexico" by the prestigious magazine LatinFinance, which also recognized the bank's participation in the pipeline“Los Ramones II” with three awards: best project, best funding and best infrastructure financing.
These awards underscore Santander México’s leadership position supporting the energy and infrastructure sectors, where over 14 projects with a total value of Ps.88 billion have been funded over the last year.
SUSTAINABILITY AND SOCIAL RESPONSIBILITY
Santander México recognized “The Most Socially Responsible Bank in Mexico” by International Finance Magazine
On November 19, 2015, the prestigious magazineInternational Finance Magazine recognized Banco Santander México as the “The Most Socially Responsible Bank in Mexico”.
This award recognizes Banco Santander México’s strong track record of social and environmental commitment. Santander México also provides the strongest financial support to higher education and socially disadvantaged children in Mexico.
Santander México will provide financial support to 66 organizations in 2016
During 2016, Santander México will provide financial support to 66 organizations in Mexico which are working on behalf of socially disadvantaged children in various areas such as: health, education and nutrition.
Study by CLARES confirms favorable impact of Santander México’s trust in favor of children in Mexico
The Latin American Center for Social Responsibility (“CLARES” - Centro Latinoamericano de Responsabilidad Social) of the Universidad Anahuac, conducted a study that revealed the favorable impact this trust has had with children in Mexico. After 20 years of work, this initiative has become one Santander México’s most significant socially responsible actions, achieved through the combined effort and commitment of employees, managers, volunteers and strategic partners.
For more information on Santander México – Sustainability and Social Responsibility, please refer to:
https://servicios.santander.com.mx/comprometidos/images/archivos/Reporte2014.pdf
27
CREDIT RATINGS
| Banco Santander México | Moody’s | Fitch Ratings | |
| Global scale | |||
| Foreign currency | |||
| Long term | A3 | BBB+ | |
| Short Term | P-2 | F2 | |
| Local currency | |||
| Long term | A3 | BBB+ | |
| Short Term | P-2 | F2 | |
| National scale | |||
| Long term | Aaa.mx | AAA(mex) | |
| Short Term | Mx-1 | F1+(mex) | |
| Rating viability (VR) | ---- | bbb+ | |
| Support | ---- | 2 | |
| Counterparty risk Assessments (CR) | |||
| Long Term | A2 (cr) | ---- | |
| Short Term | P-1 (cr) | ---- | |
| Standalone BCA | baa1 | ---- | |
| Outlook | Stable | Stable | |
| International Issuances | |||
| Tier 2 Subordinated Capital Notes due 2024 | Baa3 | BB+ | |
| Long-term senior unsecured global notes due 2022 | A3 | BBB+ | |
| Last publication: | Dec-18-2015 | June-25-2015 | |
| Santander Vivienda | Moody´s | Fitch Ratings | |
| National scale | |||
| Long Term | ---- | AAA (mex) | |
| Short Term | ---- | F1+ (mex) | |
| Notes HICOAM 07 | |||
| Global Scale | |||
| Local currency | |||
| Long Term | A3 | ---- | |
| National scale | |||
| Long Term | Aaa.mx | AAA(mex) | |
| Standalone BCA | b1 | ---- | |
| Outlook | Stable | Stable | |
| Last publication: | Nov-11-2015 | June-9-2015 | |
| RMBS Primary Servicer | ---- | AAFC1(mex) | |
| Outlook | ---- | Stable | |
| Last publication: | ---- | Nov-10-2015 | |
28
| Santander Consumo | Moody´s | Fitch Ratings | |
| National Scale | |||
| Long term | ---- | AAA (mex) | |
| Short Term | ---- | F1+ (mex) | |
| Unsecured bonds Issuance Program | |||
| Global Scale | |||
| Local currency | |||
| Short term | P-2 | ---- | |
| National Scale | |||
| Short Term | MX-1 | F1+ (mex) | |
| Standalone Credit Profile (SCP) | ba3 | ---- | |
| Outlook | Stable | Stable | |
| Last publication: | Nov-13-2015 | Dec-18-2015 | |
Brokerage - Casa de Bolsa Santander | Moody´s | Fitch Ratings | |
| Global scale | |||
| Local currency | |||
| Long term | Baa1 | ---- | |
| Short term | P-2 | ---- | |
| National scale | |||
| Local currency | |||
| Long term | Aaa.mx | AAA(mex) | |
| Short term | Mx-1 | F1+(mex) | |
| Standalone BCA | b1 | ---- | |
| Outlook | Stable | Stable | |
| Last publication: | Dec-18-2015 | Sep-01-2015 |
Notes:
| § | BCA = Baseline Credit Assessment |
| § | SR = Support Rating |
| § | VR = Viability Rating |
| § | SCP = Standalone Credit Profile |
| § | CR= Counterparty Risk Assessments |
29
4Q15 EARNINGS CALL DIAL-IN INFORMATION
| Date: | Friday, January 29, 2016 |
| Time: | 8:00 AM (MCT); 9:00 AM (US ET) |
| Dial-in Numbers: | 1-888-215-6982 US & Canada; 1-913-312-0845 International & Mexico |
| Access Code: | 4402274 |
| Webcast: | http://public.viavid.com/index.php?id=117826 |
| Replay: | Friday, January 29, 2016 at 12:00 pm US ET, and Friday, February 5, 2016 at 11:59 pm US ET |
| Dial-in number: | 1-877-870-5176 US & Canada; 1-858-384-5517 International & Mexico Access Code: 4402274 |
ANALYST COVERAGE
Actinver, Bank of America Merrill Lynch, Barclays, Brasil Plural, BTG Pactual, Citi, Credit Suisse, Deutsche Bank, EVA Dimensions, GBM, Goldman Sachs, HSBC, Itaú, JP Morgan, Morgan Stanley, Nau Securities, UBS and Vector.
Santander México is covered by the aforementioned analysts. Please note that any opinions, estimates or forecasts regarding the performance of Santander México issued by these analysts reflect their own views, and therefore do not represent the opinions, estimates or forecasts of Santander México or its management. Although Santander México may refer to or distribute such statements, this does not imply that Santander México agrees with or endorses any information, conclusions or recommendations included therein.
DEFINITION OF RATIOS
ROAE:Annualized net income divided by average equity
EFFICIENCY:Annualized administrative and promotional expenses divided by annualized gross operating income (before administrative and promotional expenses and allowances).
RECURRENCY:Annualized net fees divided by annualized administrative and promotional expenses (net of amortizations and depreciations).
NIM:Financial margin divided by daily average interest earnings assets.
COST OF RISK:Annualized provisions for loan losses divided by average loan portfolio
Note:
·Annualized figures consider (12M15) cumulative results
·Average figures are calculated using 4Q14 and 4Q15
30
ABOUT GRUPO FINANCIERO SANTANDER MÉXICO, S.A.B. DE C.V. (NYSE: BSMX; BMV: SANMEX)
Grupo Financiero Santander México, S.A.B. de C.V. (Santander México), one of Mexico’s leading financial services holding companies, provides a wide range of financial and related services, including retail and commercial banking, securities brokerage, financial advisory and other related investment activities. Santander México offers a multichannel financial services platform focused on mid- to high-income individuals and small- to medium-sized enterprises, while also providing integrated financial services to larger multinational companies in Mexico. As of December 31, 2015, Santander México had total assets of Ps.1,185 billion under Mexican Banking GAAP and more than 12 million customers. Headquartered in Mexico City, the Company operates 1,079 branches and 298 offices nationwide and has a total of 17,205 employees.
We, the undersigned under oath to tell the truth declare that, in the area of our corresponding functions, we prepared the information on Grupo Financiero Santander México contained in this quarterly report, which to the best of our knowledge reasonably reflects its situation.
| HÉCTOR B. GRISI CHECA | PEDRO JOSÉ MORENO CANTALEJO | |
| Executive President and Chief Executive Officer | Vice President of Administration and Finance | |
| EMILIO DE EUSEBIO SAIZ | JUAN CARLOS GARCÍA CONTRERAS | JUAN RAMÓN JIMÉNEZ LORENZO |
| Deputy General Director of Intervention and Control Management | Executive Director Controller Finance | Executive Director of Internal Audit |
The financial information presented in this report has been obtained from the non-audited financial statements prepared in accordance with the General Nature Provisions applicable to Holding Corporations of Financial Groups which are subject to the supervision of the National Banking and Securities Commission on accounting procedures, published in the Federal Official Gazette on January 31, 2011. The exchange rate used to convert foreign currency transactions to pesos is Ps.17.2487
INVESTOR RELATIONS CONTACT
Héctor Chávez Lopez – Managing Director - IRO
+ 52 (55) 5269-1925
hchavez@santander.com.mx
Gerardo Freire Alvarado – Executive Director of Investor Relations
+ 52 (55) 5269-1827/+ 52 (55) 5269-1828
gfreire@santander.com.mx
Investor Relations Team
investor@santander.com.mx
www.santander.com.mx
31
LEGAL DISCLAIMER
Grupo Financiero Santander México cautions that this report may contain forward-looking statements within the meaning of the U.S. Private Securities Litigation Reform Act of 1995. These forward-looking statements may be found in various places throughout this report and include, without limitation, statements regarding our intent, belief, targets or current expectations in connection with: asset growth and sources of funding; growth of our fee-based business; expansion of our distribution network; our focus on strategic businesses; our compound annual growth rate; our risk, efficiency and profitability targets; financing plans; competition; impact of regulation; exposure to market risks including interest rate risk, foreign exchange risk and equity price risk; exposure to credit risks including credit default risk and settlement risk; projected capital expenditures; capitalization requirements and level of reserves; liquidity; trends affecting the economy generally; and trends affecting our financial condition and our results of operations. While these forward-looking statements represent our judgment and future expectations concerning the development of our business, a number of risks, uncertainties and other important factors could cause actual developments and results to differ materially from our expectations. These factors include, but are not limited to: changes in capital markets in general that may affect policies or attitudes towards lending to Mexico or Mexican companies; changes in economic conditions, in Mexico in particular, in the United States or globally; the monetary, foreign exchange and interest rate policies of the Mexican Central Bank (Banco de Mexico); inflation; deflation; unemployment; unanticipated turbulence in interest rates; movements in foreign exchange rates; movements in equity prices or other rates or prices; changes in Mexican and foreign policies, legislation and regulations; changes in requirements to make contributions to, for the receipt of support from programs organized by or requiring deposits to be made or assessments observed or imposed by, the Mexican government; changes in taxes; competition, changes in competition and pricing environments; our inability to hedge certain risks economically; economic conditions that affect consumer spending and the ability of customers to comply with obligations; the adequacy of allowances for loans and other losses; increased default by borrowers; technological changes; changes in consumer spending and saving habits; increased costs; unanticipated increases in financing and other costs or the inability to obtain additional debt or equity financing on attractive terms; changes in, or failure to comply with, banking regulations; and certain other factors indicated in our annual report20F. The risk factors and other key factors that we have indicated in our past and future filings and reports, including those with the U.S. Securities and Exchange Commission, could adversely affect our business and financial performance.
Note: The information contained in this report is not audited. Nevertheless, the consolidated accounts are prepared on the basis of the accounting principles and regulations prescribed by the Mexican National Banking and Securities Commission (Comisión Nacional Bancaria y de Valores) for credit institutions, as amended (Mexican Banking GAAP). All figures presented are in nominal terms. Historical figures are not adjusted for inflation.
32
Grupo Financiero Santander México
| § | Consolidated Balance Sheet |
| § | Consolidated Statement of Income |
| § | Consolidated Statement of Changes in Stockholders’ Equity |
| § | Consolidated Statement of Cash Flows |
The information contained in this report and the financial statements of the Group’s subsidiaries may be consulted on the Internet website: www.santander.com.mx or through the following direct access:
http://www.santander.com.mx/ir/english/financial/quarterly.html
There is also information on Santander México on the CNBV website: www.cnbv.gob.mx
33
| Consolidated balance sheet | ||||||||||
| Millions of pesos | ||||||||||
| 2015 | 2014 | |||||||||
| Dec | Sep | Jun | Mar | Dec | Sep | Jun | Mar | |||
| Assets | ||||||||||
| Funds Available | 99,838 | 97,641 | 102,323 | 105,370 | 101,198 | 97,474 | 91,384 | 94,408 | ||
| Margin accounts | 1,943 | 2,608 | 3,181 | 2,844 | 2,855 | 3,203 | 3,392 | 2,894 | ||
| Investment in securities | 329,345 | 332,893 | 269,782 | 271,576 | 203,455 | 231,705 | 219,044 | 218,047 | ||
| Trading securities | 210,158 | 233,074 | 194,057 | 198,638 | 114,936 | 156,247 | 143,491 | 149,772 | ||
| Securities available for sale | 113,549 | 94,227 | 70,178 | 67,436 | 83,057 | 70,038 | 70,175 | 62,944 | ||
| Securities held to maturity | 5,638 | 5,592 | 5,547 | 5,502 | 5,462 | 5,420 | 5,378 | 5,331 | ||
| Debtors under sale and repurchase agreements | 5,758 | 9,755 | 19,303 | 7,331 | 5,186 | 10,689 | 10,471 | 8,413 | ||
| Securities Lending | 1 | 0 | 1 | 1 | 0 | 0 | 0 | 0 | ||
| Derivatives | 128,789 | 133,864 | 99,783 | 100,357 | 97,284 | 73,888 | 88,209 | 73,878 | ||
| Trading purposes | 116,668 | 116,898 | 90,763 | 89,721 | 92,544 | 72,891 | 87,566 | 73,422 | ||
| Hedging purposes | 12,121 | 16,966 | 9,020 | 10,636 | 4,740 | 997 | 643 | 456 | ||
| Valuation adjustment for hedged financial assets | 104 | 100 | 106 | 49 | (44) | (65) | 85 | 29 | ||
| Performing loan portfolio | ||||||||||
| Commercial loans | 326,979 | 311,781 | 291,182 | 277,921 | 274,438 | 256,496 | 261,976 | 236,610 | ||
| Commercial or business activity | 257,268 | 248,778 | 239,301 | 221,884 | 212,933 | 204,255 | 205,210 | 189,995 | ||
| Financial entities loans | 9,841 | 5,883 | 5,745 | 5,444 | 5,580 | 5,226 | 5,901 | 3,859 | ||
| Government entities loans | 59,870 | 57,120 | 46,136 | 50,593 | 55,925 | 47,015 | 50,865 | 42,756 | ||
| Consumer loans | 88,029 | 85,010 | 81,139 | 74,714 | 72,459 | 70,917 | 69,372 | 67,069 | ||
| Mortgage loans | 114,489 | 110,894 | 107,371 | 104,645 | 101,189 | 97,698 | 94,655 | 91,739 | ||
| Total performing loan portfolio | 529,497 | 507,685 | 479,692 | 457,280 | 448,086 | 425,111 | 426,003 | 395,418 | ||
| Non-performing loan portfolio | ||||||||||
| Commercial loans | 8,596 | 9,182 | 9,876 | 9,155 | 8,891 | 8,709 | 7,152 | 6,910 | ||
| Commercial or business activity | 8,593 | 9,179 | 9,872 | 9,152 | 8,889 | 8,709 | 7,152 | 6,909 | ||
| Financial entities loans | 0 | 0 | 0 | 0 | 0 | 0 | 0 | 1 | ||
| Government entities loans | 3 | 3 | 4 | 3 | 2 | 0 | 0 | 0 | ||
| Consumer loans | 3,664 | 3,263 | 3,211 | 2,799 | 3,165 | 2,755 | 2,933 | 2,895 | ||
| Mortgage loans | 5,988 | 5,907 | 5,721 | 5,504 | 5,399 | 4,900 | 4,587 | 4,126 | ||
| Total non-performing portfolio | 18,248 | 18,352 | 18,808 | 17,458 | 17,455 | 16,364 | 14,672 | 13,931 | ||
| Total loan portfolio | 547,745 | 526,037 | 498,500 | 474,738 | 465,541 | 441,475 | 440,675 | 409,349 | ||
| Allowance for loan losses | (19,743) | (19,415) | (18,643) | (17,382) | (16,951) | (16,631) | (16,397) | (16,081) | ||
| Loan portfolio (net) | 528,002 | 506,622 | 479,857 | 457,356 | 448,590 | 424,844 | 424,278 | 393,268 | ||
| Accrued income receivable from securitization transactions | 73 | 76 | 97 | 128 | 127 | 127 | 128 | 127 | ||
| Other receivables (net) | 61,083 | 71,361 | 62,629 | 93,035 | 51,358 | 62,458 | 55,768 | 51,343 | ||
| Foreclosed assets (net) | 557 | 536 | 387 | 383 | 358 | 328 | 357 | 344 | ||
| Property, furniture and fixtures (net) | 5,556 | 5,416 | 5,279 | 5,378 | 5,268 | 4,699 | 4,664 | 4,704 | ||
| Long-term investment in shares | 182 | 155 | 139 | 172 | 153 | 135 | 112 | 162 | ||
| Deferred taxes and deferred profit sharing (net) | 18,097 | 16,598 | 16,857 | 16,737 | 16,819 | 17,985 | 17,953 | 18,067 | ||
| Deferred charges, advance payments and intangibles | 5,328 | 5,058 | 5,057 | 5,180 | 4,579 | 3,850 | 3,971 | 4,085 | ||
| Other | 201 | 199 | 191 | 200 | 198 | 203 | 200 | 206 | ||
| Total assets | 1,184,857 | 1,182,882 | 1,064,972 | 1,066,097 | 937,384 | 931,523 | 920,016 | 869,975 | ||
34
| Consolidated balance sheet | ||||||||||
| Millions of pesos | ||||||||||
| 2015 | 2014 | |||||||||
| Dec | Sep | Jun | Mar | Dec | Sep | Jun | Mar | |||
| Liabilities | ||||||||||
| Deposits | 556,555 | 527,103 | 514,371 | 489,572 | 486,652 | 464,071 | 447,680 | 423,375 | ||
| Demand deposits | 347,786 | 325,928 | 311,891 | 292,441 | 294,085 | 285,861 | 259,046 | 255,062 | ||
| Time deposits – general public | 121,501 | 123,315 | 119,154 | 122,408 | 133,706 | 113,322 | 120,592 | 122,896 | ||
| Time deposits – money market | 47,145 | 43,470 | 51,160 | 44,281 | 31,833 | 38,960 | 45,470 | 23,123 | ||
| Credit instruments issued | 40,123 | 34,390 | 32,166 | 30,442 | 27,028 | 25,928 | 22,572 | 22,294 | ||
| Bank and other loans | 62,455 | 59,687 | 55,411 | 72,918 | 54,945 | 47,472 | 42,492 | 42,854 | ||
| Demand loans | 9,267 | 11,046 | 13,521 | 23,625 | 3,065 | 5,453 | 9,000 | 7,014 | ||
| Short-term loans | 26,968 | 24,346 | 17,540 | 25,157 | 27,470 | 20,561 | 18,396 | 17,537 | ||
| Long-term loans | 26,220 | 24,295 | 24,350 | 24,136 | 24,410 | 21,458 | 15,096 | 18,303 | ||
| Creditors under sale and repurchase agreements | 194,224 | 187,015 | 156,999 | 148,043 | 104,102 | 118,054 | 127,905 | 114,581 | ||
| Securities Lending | 0 | 0 | 1 | 1 | 0 | 0 | 0 | 0 | ||
| Collateral sold or pledged as guarantee | 24,623 | 34,180 | 27,403 | 28,835 | 14,077 | 14,968 | 9,654 | 17,956 | ||
| Derivatives | 1,019 | 0 | 0 | 0 | 0 | 0 | 0 | 0 | ||
| Securities loans | 23,604 | 34,180 | 27,403 | 28,835 | 14,077 | 14,968 | 9,654 | 17,956 | ||
| Derivatives | 134,357 | 132,171 | 101,019 | 96,722 | 99,168 | 76,404 | 90,416 | 74,146 | ||
| Trading purposes | 124,801 | 123,129 | 95,125 | 91,732 | 94,779 | 74,654 | 86,500 | 71,705 | ||
| Hedging purposes | 9,556 | 9,042 | 5,894 | 4,990 | 4,389 | 1,750 | 3,916 | 2,441 | ||
| Other payables | 75,955 | 107,750 | 79,689 | 100,493 | 53,112 | 87,405 | 82,067 | 81,068 | ||
| Income taxes payable | 765 | 532 | 4 | 2 | 10 | 11 | 13 | 7 | ||
| Employee profit sharing payable | 239 | 177 | 121 | 269 | 221 | 171 | 130 | 277 | ||
| Creditors from settlement of transactions | 41,573 | 71,909 | 49,529 | 66,988 | 24,516 | 52,452 | 45,139 | 55,583 | ||
| Payable for cash collateral received | 14,275 | 14,420 | 8,290 | 10,472 | 6,033 | 3,745 | 3,941 | 4,370 | ||
| Sundry creditors and other payables | 19,103 | 20,712 | 21,745 | 22,762 | 22,332 | 31,026 | 32,844 | 20,831 | ||
| Subordinated credit notes | 22,788 | 22,000 | 20,706 | 19,849 | 19,446 | 17,456 | 17,192 | 17,043 | ||
| Deferred revenues and other advances | 351 | 387 | 502 | 661 | 498 | 589 | 698 | 846 | ||
| Total liabilities | 1,071,308 | 1,070,293 | 956,101 | 957,094 | 832,000 | 826,419 | 818,104 | 771,869 | ||
| Paid-in capital | 48,316 | 48,172 | 48,170 | 48,148 | 48,140 | 48,170 | 48,170 | 48,165 | ||
| Capital stock | 36,357 | 36,357 | 36,357 | 36,357 | 36,357 | 36,357 | 36,357 | 36,357 | ||
| Share premium | 11,959 | 11,815 | 11,813 | 11,791 | 11,783 | 11,813 | 11,813 | 11,808 | ||
| Other capital | 65,233 | 64,417 | 60,701 | 60,855 | 57,244 | 56,934 | 53,742 | 49,941 | ||
| Capital reserves | 1,944 | 1,944 | 1,944 | 1,944 | 1,944 | 1,944 | 1,944 | 1,851 | ||
| Retained earnings | 48,837 | 52,050 | 52,043 | 55,574 | 41,553 | 45,005 | 44,990 | 45,140 | ||
| Result from valuation of available for sale securities, net | (513) | (574) | (563) | (543) | (543) | (225) | 203 | (422) | ||
| Result from valuation of cash flow hedge instruments, net | 813 | 1,070 | 814 | 656 | 266 | 10 | (350) | 104 | ||
| Net income | 14,141 | 9,917 | 6,453 | 3,215 | 14,014 | 10,190 | 6,946 | 3,259 | ||
| Non-controlling interest | 11 | 10 | 10 | 9 | 10 | 10 | 9 | 9 | ||
| Total stockholders´ equity | 113,549 | 112,589 | 108,871 | 109,003 | 105,384 | 105,104 | 101,912 | 98,106 | ||
| Total liabilities and stockholders´ equity | 1,184,857 | 1,182,882 | 1,064,972 | 1,066,097 | 937,384 | 931,523 | 920,016 | 869,975 |
35
| Consolidated balance sheet |
| Millions of pesos |
| 2015 | 2014 | |||||||||
| Dec | Sep | Jun | Mar | Dec | Sep | Jun | Mar | |||
| Memorandum accounts | ||||||||||
| For third parties | ||||||||||
| Current client account | ||||||||||
| Client Banks | 94 | 121 | 145 | 60 | 90 | 66 | 88 | 86 | ||
| Liquidation of client transactions | 394 | (671) | 62 | (278) | 235 | (109) | (21) | (323) | ||
| Dividends on behalf of clients | 1 | 1 | 1 | 1 | 1 | 1 | 1 | 0 | ||
| Custody services | ||||||||||
| Assets under custody | 128,064 | 144,951 | 141,396 | 158,785 | 128,035 | 172,370 | 262,330 | 288,930 | ||
| Transactions on behalf of third parties | ||||||||||
| Sale and repurchase agreements | 6,763 | 19,814 | 29,044 | 34,440 | 19,274 | 40,202 | 32,870 | 57,553 | ||
| Security loans on behalf of clients | 628 | 665 | 1,196 | 1,110 | 994 | 905 | 918 | 829 | ||
| Collaterals received as guarantee on behalf of clients | 296,865 | 296,958 | 281,112 | 279,132 | 267,097 | 245,112 | 235,791 | 240,524 | ||
| Acquisition of derivatives | 175,813 | 214,947 | 208,131 | 202,608 | 218,711 | 200,734 | 226,708 | 237,635 | ||
| Sale of derivatives | 165,376 | 170,745 | 206,769 | 227,950 | 244,042 | 268,444 | 288,587 | 325,240 | ||
| Total on behalf of third parties | 773,998 | 847,531 | 867,856 | 903,808 | 878,479 | 927,725 | 1,047,272 | 1,150,474 | ||
| Proprietary record accounts | ||||||||||
| Contingent assets and liabilities | 395 | 456 | 535 | 433 | 492 | 2,047 | 326 | 448 | ||
| Credit commitments | ||||||||||
| Trusts | 141,287 | 140,977 | 140,498 | 135,613 | 135,497 | 133,983 | 135,503 | 132,085 | ||
| Mandates | 243 | 251 | 252 | 252 | 247 | 290 | 277 | 265 | ||
| Assets in custody or under administration | 3,346,631 | 3,367,587 | 3,362,950 | 3,359,287 | 3,193,157 | 3,406,089 | 3,298,168 | 3,757,406 | ||
| Credit commitments | 138,560 | 147,215 | 137,307 | 144,283 | 132,353 | 159,145 | 153,560 | 158,421 | ||
| Collateral received | 59,377 | 90,808 | 65,160 | 55,814 | 51,680 | 98,230 | 56,094 | 93,842 | ||
| Collateral received and sold or pledged as guarantee | 22,609 | 37,592 | 12,166 | 11,853 | 26,794 | 70,679 | 33,660 | 66,869 | ||
| Uncollected interest earned on past due loan portfolio | 1,876 | 2,916 | 2,172 | 2,675 | 1,427 | 1,708 | 1,704 | 2,078 | ||
| Other record accounts | 971,117 | 855,665 | 775,735 | 703,793 | 690,975 | 612,167 | 606,796 | 560,285 | ||
| Total proprietary record accounts | 4,682,095 | 4,643,467 | 4,496,775 | 4,414,003 | 4,232,622 | 4,484,338 | 4,286,088 | 4,771,699 | ||
| Total memorandum accounts | 5,456,093 | 5,490,998 | 5,364,631 | 5,317,811 | 5,111,101 | 5,412,063 | 5,333,360 | 5,922,173 | ||
36
These consolidated financial statements were approved by the Board of Directors and signed on its behalf by
| HÉCTOR B. GRISI CHECA | PEDRO JOSÉ MORENO CANTALEJO | |
| Executive President and Chief Executive Officer | Vice President of Administration and Finance | |
| EMILIO DE EUSEBIO SAIZ | JUAN CARLOS GARCÍA CONTRERAS | JUAN RAMÓN JIMÉNEZ LORENZO |
| Deputy General Director of Intervention and Control Management | Executive Director Controller Finance | Executive Director of Internal Audit |
The accompanying notes are part of these consolidated financial statements
www.santander.com.mx
37
| Consolidated statement of income |
| Millions of pesos |
| 2015 | 2014 | |||||||||||
| 12M | 4Q | 3Q | 2Q | 1Q | 12M | 4Q | 3Q | 2Q | 1Q | |||
| Interest income | 63,773 | 17,296 | 15,996 | 15,660 | 14,821 | 57,857 | 15,043 | 14,527 | 14,543 | 13,744 | ||
| Interest expense | (21,141) | (5,865) | (5,186) | (5,194) | (4,896) | (20,279) | (5,244) | (5,003) | (5,281) | (4,751) | ||
| Net interest income | 42,632 | 11,431 | 10,810 | 10,466 | 9,925 | 37,578 | 9,799 | 9,524 | 9,262 | 8,993 | ||
| Provisions for loan losses | (17,244) | (4,424) | (4,594) | (4,543) | (3,683) | (14,289) | (3,334) | (3,814) | (3,672) | (3,469) | ||
| Net interest income after provisions for loan losses | 25,388 | 7,007 | 6,216 | 5,923 | 6,242 | 23,289 | 6,465 | 5,710 | 5,590 | 5,524 | ||
| Commission and fee income | 18,246 | 4,603 | 4,673 | 4,771 | 4,199 | 16,858 | 4,350 | 4,222 | 4,225 | 4,061 | ||
| Commission and fee expense | (3,474) | (826) | (987) | (760) | (901) | (3,441) | (986) | (883) | (934) | (638) | ||
| Net gain (loss) on financial assets and liabilities | 2,265 | 347 | 583 | 540 | 795 | 2,957 | 395 | 651 | 1,358 | 553 | ||
| Other operating income | 1,379 | 706 | 325 | 109 | 239 | 1,435 | 533 | 240 | 302 | 360 | ||
| Administrative and promotional expenses | (25,643) | (6,437) | (6,426) | (6,391) | (6,389) | (23,820) | (6,059) | (5,938) | (5,921) | (5,902) | ||
| Operating income | 18,161 | 5,400 | 4,384 | 4,192 | 4,185 | 17,278 | 4,698 | 4,002 | 4,620 | 3,958 | ||
| Equity in results of associated companies | 81 | 28 | 15 | 19 | 19 | 78 | 21 | 24 | 16 | 17 | ||
| Operating income before income taxes | 18,242 | 5,428 | 4,399 | 4,211 | 4,204 | 17,356 | 4,719 | 4,026 | 4,636 | 3,975 | ||
| Current income taxes | (4,993) | (2,242) | (703) | (1,061) | (987) | (2,133) | 71 | (624) | (818) | (762) | ||
| Deferred income taxes (net) | 893 | 1,038 | (232) | 89 | (2) | (1,208) | (966) | (158) | (130) | 46 | ||
| Income from continuing operations | 14,142 | 4,224 | 3,464 | 3,239 | 3,215 | 14,015 | 3,824 | 3,244 | 3,688 | 3,259 | ||
| Consolidated net income | 14,142 | 4,224 | 3,464 | 3,239 | 3,215 | 14,015 | 3,824 | 3,244 | 3,688 | 3,259 | ||
| Non-controlling interest | (1) | 0 | 0 | (1) | 0 | (1) | 0 | 0 | (1) | 0 | ||
| Net income | 14,141 | 4,224 | 3,464 | 3,238 | 3,215 | 14,014 | 3,824 | 3,244 | 3,687 | 3,259 |
These consolidated financial statements were approved by the Board of Directors and signed on its behalf by
| HÉCTOR B. GRISI CHECA | PEDRO JOSÉ MORENO CANTALEJO | |
| Executive President and Chief Executive Officer | Vice President of Administration and Finance | |
| EMILIO DE EUSEBIO SAIZ | JUAN CARLOS GARCÍA CONTRERAS | JUAN RAMÓN JIMÉNEZ LORENZO |
| Deputy General Director of Intervention and Control Management | Executive Director Controller Finance | Executive Director of Internal Audit |
The accompanying notes are part of these consolidated financial statements
www.santander.com.mx
38
| Consolidated statements of changes in stockholders’ equity |
| From January 1st to december 31, 2015 |
| Millions of pesos |
| Paid-in capital | Other capital | |||||||||||
| CONCEPT | Capital stock | Additional paid-in capital | Capital reserves | Retained earnings | Result from valuation of securities available for sale, net | Result from the valuation of cash flow hedge instruments | Net income | Non-controlling interest | Total stockholders' equity | |||
| BALANCE AS OF DECEMBER 31, 2014 | 36,357 | 11,783 | 1,944 | 41,553 | (543) | 266 | 14,014 | 10 | 105,384 | |||
| MOVEMENTS INHERENT TO THE SHAREHOLDERS' DECISIONS | ||||||||||||
| Transfer of prior year's net income | 14,014 | (14,014) | 0 | |||||||||
| Dividends declared | (6,760) | (6,760) | ||||||||||
| TOTAL | 0 | 0 | 0 | 7,254 | 0 | 0 | (14,014) | 0 | (6,760) | |||
| MOVEMENTS INHERENT TO THE RECOGNITION OF THE COMPREHENSIVE INCOME | ||||||||||||
| Result from valuation of available for sale securities, net | 30 | 30 | ||||||||||
| Result from valuation of cash flow hedge instruments, net | 547 | 547 | ||||||||||
| Recognition of share-based payments | 217 | 217 | ||||||||||
| Shares held by treasury | (41) | 5 | (36) | |||||||||
| Recoveries of allowance for loan losses previously applied to retained earnings | 14 | 14 | ||||||||||
| Share of comprehensive income of associated companies accounted by the equity method | 11 | 11 | ||||||||||
| Net income | 14,141 | 1 | 14,142 | |||||||||
| TOTAL | 0 | 176 | 0 | 30 | 30 | 547 | 14,141 | 1 | 14,925 | |||
| BALANCE AS OF DECEMBER 31, 2015 | 36,357 | 11,959 | 1,944 | 48,837 | (513) | (513) | 14,141 | 11 | 113,549 | |||
39
These consolidated financial statements were approved by the Board of Directors and signed on its behalf by
| HÉCTOR B. GRISI CHECA | PEDRO JOSÉ MORENO CANTALEJO | |
| Executive President and Chief Executive Officer | Vice President of Administration and Finance | |
| EMILIO DE EUSEBIO SAIZ | JUAN CARLOS GARCÍA CONTRERAS | JUAN RAMÓN JIMÉNEZ LORENZO |
| Deputy General Director of Intervention and Control Management | Executive Director Controller Finance | Executive Director of Internal Audit |
The accompanying notes are part of these consolidated financial statements
www.santander.com.mx
40
| Consolidated statement of cash flows | |||
| From January 1st to december 31, 2015 | |||
| Millions of pesos | |||
| OPERATING ACTIVITIES | |||
| Net income | 14,141 | ||
| Adjustment for line items that do not require cash flows | |||
| Result from valuation associated with operating activities | (5,733) | ||
| Equity in income of associated companies | (81) | ||
| Depreciation of property, furniture and fixtures | 900 | ||
| Amortizations of intangible assets | 963 | ||
| Recognition of share-based payments | 217 | ||
| Current and deferred income taxes | 4,100 | ||
| Deferred employee profit sharing | (209) | ||
| Provisions | 175 | 332 | |
| 14,473 | |||
| OPERATING ACTIVITIES | |||
| Margin accounts | 912 | ||
| Investment in securities | (127,310) | ||
| Debtors under sale and repurchase agreements | (572) | ||
| Derivatives-asset | (26,030) | ||
| Loan portfolio-net | (77,971) | ||
| Accrued income receivable from securitization transactions | 54 | ||
| Foreclosed assets | (199) | ||
| Other operating assets | (12,660) | ||
| Deposits | 68,490 | ||
| Bank and other loans | 7,510 | ||
| Creditors under sale and repurchase agreements | 90,121 | ||
| Collateral sold or pledged as guarantee | 10,547 | ||
| Derivatives-liability | 35,151 | ||
| Other operating liabilities | 21,279 | ||
| Payments of income taxes | (1,199) | ||
| Net cash provided by (used in) operating activities | 2,596 | ||
| INVESTING ACTIVITIES | |||
| Proceeds from disposal of property, furniture and fixtures | 10 | ||
| Payments for acquistion of property, furniture and fixtures | (1,190) | ||
| Cash dividends received | 51 | ||
| Payments for acquisition of intangible assets | (1,761) | ||
| Net cash provided by (used in) investing activities | (2,890) | ||
| FINANCING ACTIVITIES | |||
| Cash payment of dividends | (6,760) | ||
| Payments associated for purchase of treasury shares | (41) | ||
| Recovery of reserves previously applied to retained earnings | 14 | ||
| Net cash used in financing activities | (6,787) | ||
| Net increase in cash and cash equivalents | (7,081) | ||
| Adjustment to cash flows for changes in exchange rate | 5,721 | ||
| Funds available at the beginning of the year | 101,198 | ||
| Funds available at the end of the year | 99,838 |
41
These consolidated financial statements were approved by the Board of Directors and signed on its behalf by
| HÉCTOR B. GRISI CHECA | PEDRO JOSÉ MORENO CANTALEJO | |
| Executive President and Chief Executive Officer | Vice President of Administration and Finance | |
| EMILIO DE EUSEBIO SAIZ | JUAN CARLOS GARCÍA CONTRERAS | JUAN RAMÓN JIMÉNEZ LORENZO |
| Deputy General Director of Intervention and Control Management | Executive Director Controller Finance | Executive Director of Internal Audit |
The accompanying notes are part of these consolidated financial statements
www.santander.com.mx
42
NOTES TO CONSOLIDATED FINANCIAL STATEMENTS OF GRUPO FINANCIERO SANTANDER MÉXICO
| § | Significant accounting policies |
| § | Earnings per share |
| § | Consolidated balance sheet and consolidated income statement by segment |
| § | Annex 1. Loan portfolio rating |
| § | Annex 2. Financial ratios according to CNBV |
| § | Notes to consolidated financial statements |
The information contained in this report and the financial statements of the Group’s subsidiaries may be consulted on the Internet website:www.santander.com.mxor through the following direct access:http://www.santander.com.mx/ir/english/financial/quarterly.html
There is also information on Santander on the CNBV Website: www.cnbv.gob.mx
43
Significant accounting policies
The significant accounting policies applied by the Financial Group are in accordance with the accounting criteria established by the Mexican National Banking and Securities Commission (CNBV or the Commission), which are included in the General Provisions applicable to Financial Groups, Credit Institutions, Brokerage Firms, Regulated Multiple Purpose Financing Entities and Market Participants in Derivative Contracts Listed in the Exchange (the Provisions) in its circular, as well as general and specific mandates issued for this purpose, which require that management make certain estimates and use certain assumptions to determine the valuation of some of the items included in the consolidated financial statements and disclosures required in the same file. Even though they may differ in their final effect, management believes that the estimates and assumptions used were adequate under the circumstances.
Under the Provisions, the Financial Group accounting shall comply with the Financial Reporting Standards (NIF) defined by the Mexican Board of Financial Reporting Standards (CINIF), except when in the opinion of the Commission is necessary to apply a regulation or a specific accounting criteria, considering that the subsidiaries perform specialized operations.
The regulations of the Commission referred to in the preceding paragraph, is at the level of standards of recognition, measurement, presentation and disclosure if applicable to specific items within the consolidated financial statements and those applicable to its development.
In this regard, the Commission notes that the application of the accounting criteria will not proceed, nor the supplementary concept, in the case of operations that by specific legislation are not permitted or are prohibited, either, not expressly authorized.
Changes in accounting policies
Changes in Significant Accounting Policies of the Commission
On July 23, 2015 an amendment to the General Provisions which establish the accounting principles to which participants in the market for derivatives contracts traded in organized markets will be subject, was published in the Federal Official Gazette. This amendment establishes that the derivatives exchanges and operators involved in the market for derivatives contracts listed on the stock exchange itself, must keep their accounts in terms of the NIF. To this effect, clearing houses and clearing members participating in the market for derivative contracts, should be observed for the same purpose, the "Accounting Criteria for Clearing Houses" and "Accounting Criteria for Clearing Members" respectively, under those provisions. These amendments entered into force the day after its publication.
Changes in FRS issued by the CINIF applicable to Financial Group
Improvements to NIF
The purpose of these improvements is to incorporate in the NIF, changes and clarifications in order to establish a more appropriate regulatory approach. Improvements to the NIF are presented classified in those improvements that generate accounting changes in valuation, presentation or disclosure in the consolidated financial statements, and those improvements which are modifications to the NIF for clarification that help establishing a clearer and more understandable approach; being clarifications they do not generate accounting changes in the consolidated financial statements.
As of January 1, 2015, the Financial Group adopted the following improvements to the NIF that generate accounting changes:
NIF B-8,Consolidated or Combined Financial Statements - Defines what is considered an investment entity and clarifies the elements to be evaluated to identify such entity. It indicates that considering that from their primary activity is hard to exercise control over investment entities in which it participates, an analysis based on professional judgement should be carried out in order to conclude whether there is or not control of an investment
44
entity over the entities in which it participates. In case there is no control, the type of investment must be identified and for accounting recognition, the appropriate NIF must be applied.
Bulletin C-9,Liabilities, provisions, contingent assets and liabilities and commitments - It clarifies and modifies the accounting treatment of customer advances liabilities denominated in foreign currencies. When an entity receives anticipated receipts from sales or services denominated in foreign currency, exchange rate fluctuations between the functional currency and the currency of payment does not affect the amount of the advance payment, therefore, the balance of the "Customer advances" should not be changed to such currency fluctuations.
As of January 1, 2015, the Financial Group adopted the following improvements to the NIF that do not generate accounting changes:
NIF B-13,Facts occurred after the date of the financial statements and Bulletin C-9,Liabilities, provisions, contingent assets and liabilities and commitments – The NIF B-13 mentions in a footnote the disclosures to be made in the financial statements of an institution, when these are not prepared over the ongoing business basis, required by the NIF A-7,Presentation and Disclosure. This requirement was included as part of the regulatory text in the section rules of disclosure of NIF B-13, and as part of Bulletin C-9 to disclose the contingencies that are generated by an entity that is not operating over the ongoing business basis. Consequently, Circular 57 is derogated, Enough Disclosure derived from the Bankruptcy Act.
NIF B-15,Foreign Currency Exchange - the definition of foreign operation was adjusted to clarify that it must be understood not only as a legal entity or a cash-generating unit whose operations are based or conducted in an economic environment or currency different from the reporting entity, but also those that, in respect of the reporting entity (its parent or holding), should be classified as foreign operation to operate with a currency other than the reporting entity, despite operating in the same country. The definition of exchange rate was also adjusted to match the definition that is included in most recent issued standards.
The Financial Group had no material effect on the adoption of these improvements on its financial information.
Changes in accounting estimates applicable in 2015
Methodology for determining the allowance for loan losses applicable to consumer loan portfolio
On August 27, 2015, the Commission issued an order amending the provisions by which made certain adjustments to the methodology applicable to the rating of consumer loan portfolio under the approach of coverage of expected losses to be recognized in this rating, certain guarantees in the aforementioned process and provide for better loan loss reserves for credit risks, taking into account that such guarantees are already recognized in commercial loans.
As discussed above, the Commission considered appropriate to recognize the approach known as “pass or measurement” or “first losses” for the consumer loan portfolio guarantee approach, to eliminate regulatory mismatches.
At December 31, 2015, the Financial Group had no material effect on the consolidated financial statements as a result of this change in accounting estimate.
Methodology for determining the allowance for loan losses applicable to loans made under the Bankruptcy Act
On August 27, 2015, the Commission issued an order amending the provisions, through which it specifies the period during credit institutions may continue to use the methodology for calculating the loss reserves for expected losses arising from credit in respect of loans granted to accredited declared bankruptcy with previous restructuring plan. This resolution provides that once an agreement between the accredited and the creditors is adopted or the bankruptcy of the borrower under the Bankruptcy Act is determined, you cannot continue to apply this methodology.
It also notes that it may request authorization for the Commission to continue using the methodology for calculating
45
the loss reserves for expected loss for credit risk in respect of loans granted to accredited declared bankruptcy with restructuring plan prior for period which may not exceed six months from the adoption of the agreement.
At December 31, 2015, the Financial Group had no material effect on the consolidated financial statements as a result of this change in accounting estimate.
Changes in accounting estimates applicable in 2014
Methodology for determining the allowance for loan losses applicable to loans made under the BankruptcyAct
On March 26, 2014, the Commission issued an order amending the provisions, through which adapts the methodology for the rating of commercial loan portfolio for loans under Section II and III of Article 224 of the Bankruptcy Act, in order to make it consistent with the amendments made on January 10, 2014 to that system.
This methodology mainly involves the consideration of the securities lodged in accordance with Article 75 of the Bankruptcy Act for determining the severity of the loss, applying certain adjustment factors or discount rates for each type of collateral admissible ..
The Financial Group had no material effect on the consolidated financial statements at December 31, 2014 of this change in estimate.
Special accounting criteria in 2014
Special accounting principles applicable to credit support derived subject to flooding caused by hydro-meteorological phenomenon "Odile"
By Memorandum Number. P-110/2014 dated September 19, 2014, the Commission approved the application of special accounting methods to provide assistance to Grupo Financiero Santander’s debt holders who were affected by flooding and damages caused by the hydrometeorological event "Odile", the occurrence of severe rain and other disturbing natural phenomena affecting various parts of the state of Baja California Sur.
This loan rescheduling plans will apply to those customers whose address or the payment source is located in areas that were declared as disaster areas by the “Secretaría de Gobernación” in the Federal Official Gazette. These supports, intended to help in the economic recovery of the affected area by implementing various measures, include:
| 1. | Those loans with a single payment of principal at maturity and periodic interest payments, as well as loans with a single payment of principal and interest at maturity, which are renewed or restructured shall not be considered as past due in terms of the Accounting Criteria B-6, Loan Portfolio of the Commission. It is required that the new maturity to be granted does not exceed three months from the original expiration date. |
This, provided that the loans were performing at the date of the phenomenon and that the corresponding procedures of renewal or restructuring are completed within 120 calendar days after the date of the phenomenon.
| 2. | Loans with periodic payments of principal and interest, which are subject to restructuring or renewal, may be considered as performing loans at the time of the renewal or the restructuring, without applying the following requirements to be classified as non-performing in accordance with the terms of the Accounting Criteria B-6, Loan Portfolio of the Commission, which consist of: |
| i) | Not having occurred at least 80% of the original term of the loan: |
| a. | the borrower has covered all of the accrued interest, and |
| b. | has covered the principal of the original loan amount at the date of renewal or restructuring that should have been covered. |
46
| ii) | During the course of the final 20% of the original term of the loan: |
| a. | settled all accrued interest; |
| b. | covered the entire original loan amount at the date of renewal or restructuring that should have been covered, and |
| c. | covered 60% of the original loan amount. |
This provided that the loans are performing at the date of the phenomenon and that the corresponding procedures for renewal or restructuring are completed within 120 calendar days after the date of the phenomenon. It is required that the new maturity is granted not more than three months from the original expiration date.
| 3. | Loans that from their inception were classified as revolving, which are restructured or renewed within 120 calendar days from the occurrence of the phenomenon, shall not be considered as past due in terms of the Accounting Criteria B-6, Loan Portfolio of the Commission. This benefit may not exceed three months from the original expiration date. This provided that the loans are performing portfolio at the date of the phenomenon. |
| 4. | Loans indicated in the preceding paragraphs shall not be considered as restructured in terms of the Accounting Criteria B-6, Loan Portfolio of the Commission. |
The Financial Group received several requests for support from accredited affected by flooding and damage caused by hydro-meteorological phenomenon "Odile". The support consisted defer payment in 60 days on the original terms. At December 31, 2014, the balance of the loan portfolio that received this support amounted to Ps.170 million. These credits are not considered as past due under the terms of Accounting Criteria B-6, Loan Portfolio of the Commission.
The borrowers, who received the aforementioned supports, are up to date in their payments, both of principal as of interests.
New accounting pronouncements
Modifications accounting standards issued by the Commission
On November 9, 2015 several changes to the accounting criteria for credit institutions were published in the Federal Official Gazette. These amendments are intended to make necessary accounting criteria for credit institutions to their operations in order to have reliable financial information settings. These amendments entered into force on January 1, 2016.
The most relevant changes are listed below:
| a. | The Accounting Criteria C-5, Consolidation of special purpose entities is removed. |
| b. | As part of the Accounting Criteria of the Commission, the NIF C-18, Obligations associated with the retirement of property, plant and equipment and the NIF C-21, Agreements with joint control are added, resulting from the issuance of these standards by the CINIF. |
| c. | For consolidated financial statements, it is incorporated in the application of particular standards, those special purpose entities (SPE) created before January 1, 2009 in which it has maintained control will not be required to apply the provisions of NIF B-8, Combined or consolidated financial statements regarding its consolidation. |
| d. | It specifies that overdrafts on checking accounts for customers who do not have a credit line for these purposes, must be classified as past due debts and simultaneously to this classification an estimate for the total amount of the overdraft in the time of occurrence of such event must be constituted. |
| e. | It states that the net defined benefit asset to employees shall be presented in the balance sheet under the caption "Other assets". |
47
| f. | It specifies to follow the applicable regulation as established by the Bank of Mexico to include as "Cash and cash equivalents", the purchase of foreign currency that are not considered as derivatives transactions. |
| g. | It is established that if the balance of foreign currencies to be received offset with foreign currencies to be delivered should reach a negative balance, such item must be presented under the caption of “Other accounts payable”. |
| h. | It is clarified that if any item of restricted cash and cash equivalents should reach a negative balance, such item must be presented under the caption “Other accounts payable”. Previously, negative balances of restricted cash and cash equivalents were not considered for such presentation. |
| i. | The definition of "transaction costs" in Accounting Criterion B-2, Investments in securities and Accounting Criterion B-5, Derivatives and Hedging Derivatives is modified. |
| j. | The following definitions are incorporated into the Accounting Criteria B-6, Loan Portfolio: "accredited", "accuracy", "ability to pay", "Portfolio in Extension", "Assignment of Rights on Receivables", "Consolidation of Loan Portfolio”, "Debtor of the Rights on Receivables", "factored", "Factoring Finance", "factorer", "Credit Line", "Discount Operation", "Special Regime of Amortization", "Ordinary Regime of Amortization " and "Housing Sub-account. " |
| k. | The definition of "Renewal" is modified in the Accounting Criteria B-6, Loan Portfolio now considered as an operation in which the balance of a loan is settled partially or completely, by increasing the original loan amount, or with the product from another credit contracted with the same entity, which is part of the same obligor, forced solidarity of the debtor or other person for their economic ties constitute common risks. |
| l. | They are considered as "mortgage loans" those for remodeling or home improvement that are backed by the housing saving sub-account of the borrower, or have a guarantee given by an institution development bank or a public trust constituted by the Federal Government for economic development. |
| m. | Credits such as financial factoring, discount and assignment of rights on receivables are incorporated within the definition of "Commercial Loans". |
| n. | It clarifies that a loan will not be considered as renewed if withdrawals are made over the term of a line of credit, as long as the borrower has paid all the payments that are required under the original loan terms. |
| o. | It is included that in the case of credit withdrawals made under a line of credit, when it is restructured or renewed independently of the line of credit that protects, should be assessed according to the characteristics and conditions applicable to the restructured or renewed withdrawals. |
When such evaluation concludes that one or more withdrawals granted under a line of credit must be transferred to non-performing loans as a result of its restructuring or renovation and such arrangements, individually or collectively, represent at least 40% of the total amount drawn on the line of credit at the time of the restructuring or renewal, this balance, and its subsequent withdrawals, shall be transferred to non-performing loans as there is no evidence of sustained loan payment of the withdrawals giving rise to the transfer performing loans, and total withdrawals granted under the credit line fulfills the obligations due to the date of transfer to performing loans.
The percentage mentioned above is applicable from January 1, 2016 and it will decrease to 30% for the year 2017 and 25% for the year 2018 and late.
48
| p. | It is established that in the case of loans which have been acquired from INFONAVIT or FOVISSSTE, where it is required to respect the terms of reference agencies contracted with borrowers, it is considered that there is sustained loan repayment when the borrower have covered without delay, the total payable amount of principal and interest of at least one repayment on the loans under the Ordinary Regime of Amortization (ORA) and three repayments for loans under the Special Regime of Amortization (SRA) . |
| q. | It incorporates that for the restructuring of loans with periodic payments of principal and interest which repayments are less than or equal to 60 days in which it is modified the periodicity of payment to shorter periods, the number of amortizations equivalent to three consecutive amortizations of the original credit payment scheme should be considered. |
| r. | Assumptions to determine sustained payments for those loans with a single payment of principal at maturity, regardless of whether the payment of interest is periodic or at maturity, are specified. The assumptions are: |
| i. | The borrower has covered at least 20% of the original loan amount when the restructuring or renewal takes place, or, |
| ii. | They have covered the amount of accrued interest under the scheme restructuring or renewal payments corresponding to a period of 90 days. |
| s. | In the case of consolidated loans, if two or more loans have caused the transfer of non-performing loans of the total balance of the consolidated loans, in order to determine the required amortizations to consider its sustained payment should be addressed to the original credit payment scheme in which the amortizations are equivalent to the more extended term. Previously it was considered to give the total balance of the restructuring or renewal, the corresponding treatment of the worst credit. |
| t. | It states that should be available for the Commission in demonstrating sustained payment, evidence to justify the borrower has the capacity to pay when they are carrying out the restructuring or renewal to meet the new conditions of credit. |
| u. | It clarifies that the prepayment of restructured or renewed loan, other than those with a single payment of principal at maturity, regardless of whether the interest is paid periodically or at maturity, is not considered sustained payment. Such is the case for amortizations of loans restructured or renewed which are paid before the equivalent calendar days for those loans that cover periods longer than 60 calendar days. |
| v. | It is incorporated as restructuring situation the extension of the term of the loan. |
| w. | The recognition and measurement rules for financial factoring operations, discount and assignment of rights on receivables are included. |
| x. | It specifies that fees and commissions other than those charged for the granting of the loans will be recognized as income on the date of exercise as they are incurred and in the event that some or all of the consideration received for the collection of commission or fee is received in advance to relative income will accrue to, the advance should be recognized as a liability. |
| y. | It eliminates the requirement that overdrafts on checking accounts customers are reported as past due. |
| z. | It incorporates that amortizations that have not been settled in full on the originally agreed terms and are 90 or more days overdue on payments for loans that the company has acquired from the INFONAVIT and FOVISSSTE, to be considered as past due, according to the method of payment ORA or SRA, as well as credits granted to individuals for the renovation or improvement of housing |
49
without purpose of commercial speculation which are backed by the housing saving sub-account of the borrower.
| aa. | The transfer of non-performing loans referred above is subject to an exceptional term of 180 or more days of non-compliance from the date on which: |
| i. | The credit resources are withdraw for the purpose for which they were granted, |
| ii. | The accredited begin a new employment relationship by having a new employer, or |
| iii. | It is received partial payment of the redemption. The exception contained in this paragraph shall apply provided that the appropriations under the ORA scheme, and each of the payments made during that period represent at least 5% of the agreed repayment. |
| bb. | It specifies that in case of loans with a single payment of principal at maturity, regardless of whether the interest is paid periodically or at maturity it will be considered as performing loans until there is evidence of sustained payment |
| cc. | It considers that loans granted under a line of credit, revolving or not, which are restructured or renewed at any time, provided they have obtained evidence to justify the payment capacity of the debtor can be maintained in performing loans. In addition, the borrower must have: |
| i. | Paid all the interest due; |
| ii. | Covered all the payments it is obliged in terms of the contract at the time of restructuring or renovation. |
| dd. | If the borrower pays all interest accrued to the date of renewal or restructuring, this will be considered to meet the requirement to consider that a credit continues as performing, as long as the delay between that date and the restructuring or renewal does not exceed the lesser of half the current pay period and 90 days. |
| ee. | Performing loans with partial periodic payments of principal and interest that are restructured or renewed on more than one occasion, may remain in the performing loan portfolio, if there are elements that justify the payment capacity of the debtor. It specifies that in the case of commercial loans such elements must be properly documented and integrated into the credit file. |
| ff. | In the event of a restructuring and renewal in which various loans granted to the same entity are consolidated, each of the consolidated loans must be analyzed as if separately were restructured or renewed and, if such analysis concludes that one or more of these loans would have been transferred to non-performing loans as a result of such restructuring or renewal, then the total balance of the consolidated loans must be transferred to non-performing loans. |
| gg. | Regarding rules of presentation of the consolidated balance sheet and consolidated income statement, it incorporates that: |
| i. | The mortgage loans acquired from INFONAVIT or FOVISSSTE should be segregated within the existing performing loans portfolio, as ordinary portfolio and portfolio in extension. |
| ii. | It specifies that the amount of loans derived from financial factoring operations, discount and assignment of rights on receivables is presented net of corresponding loan-to-value. |
| iii. | The commissions received in advance to accrue income will be presented in the line item "Deferred credits and prepayments". |
| iv. | The interest income earned on financial factoring operations, discount and assignment of rights on receivables, will be considered as as interest income. |
50
| hh. | Regarding disclosure standards, new requirements are incorporated such as: |
| i. | Breakdown of the performing loan and non-performing loan portfolio restricted and unrestricted for the average residential loan portfolio, social interest, remodeling or improvement with guarantee from the housing sub-account and credits acquired from INFONAVIT or FOVISSSTE, segregated in turn, in ordinary loan portfolio and portfolio loan in extension. |
| ii. | Total amount and number of loans acquired from INFONAVIT or FOVISSSTE which are transferred to non-performing loans, and the total amount of loans that were not transferred to non-performing loans, should be segregated in loans acquired from INFONAVIT or FOVISSSTE, according to the SRA payment mode or ORA and credits granted to individuals for remodeling or home improvement without purpose of commercial speculation and are backed by the housing saving sub-account the of the borrower. |
| iii. | Main characteristics of the loans acquired from INFONAVIT or FOVISSSTE, describing at least those related to its classification as loans in extension, ORA and SRA, as well as those related to the assignment of such credits. |
| iv. | Description of the obligations and rights that keep the INFONAVIT and FOVISSSTE respect of the loan portfolio acquired by the entity. |
| v. | Identification by type of loans for average and residential loan portfolio, social interest, remodeling or improvement with guarantee from the housing sub-account and loans acquired by INFONAVIT or FOVISSSTE balance of non-performing loans from the date on which this was classified as such in the following periods: from 1 to 180 calendar days, from 181 to 365 calendar days, of 366 calendar days to 2 years and more than two years overdue. |
| vi. | Total amount of mortgage loans backed by the housing sub-account, broken down into performing and non-performing loan portfolio and specifying the percentage that represents of the total housing loan portfolio. |
| vii. | Total accumulated amount of the restructured or renewed loans by type of loan distinguishing that originated in the exercise from those consolidated as a result of restructuring or renovation were transferred to non-performing loans of those restructured loans to those loans the criteria were not applied to the transfer performing loans. |
| ii. | It is established in the Accounting Criteria B-7,Foreclosed assets that in case of assets whose valuation to determine its fair value can be made by assessment, it must meet the requirements established by the CNBV applicable to providers of banking appraisal. |
| jj. | In Accounting Criteria C-2,Securitization transactions, it clarifies that in the case of securitization vehicles made and recognized in the consolidated financial statements prior to January 1, 2009, it will not be necessary to reassess the transfer of financial assets recognized prior that date. |
In this regard, the main effects that this derogation would have on the financial statements as well as the effects of recognition by valuation gains on the remainder of the assignee (recognized in income or in equity) and the asset or liability recognized for managing financial assets transferred should be disclosed in the notes to the financial statements.
| kk. | Accounting Criterion C-3,Related partiesincorporates the definition of "Joint Control Agreement", "Joint Control" and the definition of "Associate", "Control", "Controller", "Significant Influence", "Related Party" and "subsidiary".. |
| ll. | Should be considered as related parties, those individuals or entities that directly or indirectly, through one or more intermediaries, exercise significant influence, are significantly influenced by or are under common significant influence of the entity and set the entity involved. |
| mm. | It is extended to joint control agreements the disclosure requirements in the Accounting Criteria C-3,Related parties. |
51
| nn. | As a modification to the Accounting Criteria C-4,Segment reporting, purchases and sales of foreign currencies are incorporated in the segment of treasury operations and investment banking. |
| oo. | Various modifications are made to the presentation of the balance sheet to include the breakdown of the performing and non-performing mortgage portfolio in the following segments: average and residential, social interest, loans acquired from INFONAVIT or FOVISSSTE, remodeling or improving granted by development banks or public trust funds. |
| pp. | It is required to present in the balance sheet as a liability within a caption called "Global Deposits Account without Movement", the principal and interest of the deposits instruments with no maturity date, or that even having a maturity date they are renewed automatically, as well as transfers or past due investments that have not been claimed, in reference to Article 61 of the Line of Credit Institutions investments. |
| qq. | It is added as part of the capital gain on the balance sheet, an item called "Remeasurements for Defined Benefit to Employees" to mark the entry into force of the NIF D-3,Employee Benefits. |
| rr. | The item "Guarantees granted" is incorporated to the footnotes of the balance. |
| ss. | It is specified to be included in the income statement as part of the administration and promotion expenses: insurance and guarantees, technical assistance costs, maintenance costs, other fees than those paid to the IPAB and consumables and goods. |
| tt. | The statement of changes in stockholders' equity should be considered within the movements inherent to the recognition of comprehensive income remeasurements defined benefit to employees arising from the entry into force of the NIF D-3,Employee Benefits. |
NIFs issued by the CINIF
New NIF D-3, Employee Benefits
On January 2015, the CINIF issued several amendments to NIF D-3,Employee Benefits. These amendments entered into force on January 1st, 2016.
The main amendments that the implementation of this new NIF D-3 will have on the financial information of the Financial Group are as follow:
| § | Discount rate for liabilities - Defined Benefit Obligation (DBO) |
The discount rate to calculate the OBD shall be determined by the market rate of high quality corporate bonds, provided there is a deep market for such bonds. Otherwise you should take the market rate on bonds issued by the federal government.
| § | Recognition of actuarial gains and losses |
The use of the corridor for the deferral of actuarial gains and losses is eliminated.
The accumulated gains and accumulated losses at December 31, 2015 balance will be recognized in stockholders' equity and liabilities starting January 1st, 2016.
Actuarial gains and losses generated beginning January 1, 2016 will be treated as remeasurements for defined benefit to employees and will be recognized in stockholders' equity and liabilities.
52
| § | Amortization of actuarial gains and losses |
Gains and losses recognized in stockholders' equity should be recycled to income in the Life Work Plan Remnant.
| § | Expected return on plan assets |
The expected return on plan assets are estimated with the discount rate of liabilities rather than the expected rate of return for the fund.
Derived from the entry into force of the NIF D-3, the Commission issued on 31 December 2015 the various transitory amendments to the "Resolution amending the general provisions applicable to credit institutions", published in the Federal Official Gazette of Mexico on November 9, 2015.
These transitory articles establish that credit institutions may recognize the entire balance of plan amendments (past service) and the accumulated balance of gains and losses unrecognized of the plan for entities that used the corridor approach progressively to 31 December each year.
In case of opting for the progressive implementation of the balances above, it must initiate the recognition of these balances in 2016 recognizing 20% of such balances in that year and an additional 20% in each of the subsequent years, up to reach 100% within a maximum period of 5 years.
With regard to the remeasurement of the gains or losses from the defined benefit plan to be recognized at the end of each period, and the corresponding recycling to income should be calculated on the total amount of profit or loss, i.e. on the sum of the profits or losses of the plan, but not the unrecognized in the balance sheet of the institutions.
Credit institutions using this option should notify the Commission not later than 31 January 2016.
Likewise, in case of recognizing all or part of the remaining effect prior to the established deadlines, this should be reported to the Commission within the next 30 calendar days after the relevant accounting impairment is performed. Institutions may apply anticipated recognitions, provided that in the corresponding year at least 20% or the total remaining amount is recognized.
Credit institutions which have implemented some of the options mentioned above must be disclosed in public statements of financial information for the years 2016 to one in which the progressive recognition of the effects mentioned above is completed, the damages resulting from applying the option it has been used.
In this sense, the initial effect that the implementation of NIF D-3 will have in subsequent years caused by the cumulative unrecognized actuarial losses balance at December 31, 2015 amounted to Ps.2,771. This balance will be recognized within the capital gained in the category of "Remeasurements for Defined Benefit to Employees" from the year 2016 in recognition of the 20% accumulated in the year balance and an additional 20% in each of the subsequent years, up to reach 100% within 5 years.
Additionally, these cumulative actuarial losses not recognized in the balance as of December 31, 2015, will be recycled within the Remaining Labor Life Plan (RLLP) ranging between 9.5 and 14 years depending on the corresponding profit.
NIF and INIF Promulgated
On December 31, 2015, the CINIF has issued the following NIF and Interpretations to the NIF (INIF):
a. With effect from January 1, 2016:
INIF 21,Recognition of payments derived from separation of employees
53
b. With effect from January 1, 2018:
NIF C-2,Investment in financial instruments
NIF C-3,Accounts receivable
NIF C-9,Provisions, contingencies and commitments
NIF C-16,Impairment of financial instruments receivable
NIF C-19,Financial Instruments payable
NIF C-20,Financial Instruments receivable
NIF D-1,Income from contracts with customers
NIF D-2,Costs from contracts with customers
Improvements to NIF 2016
The following improvements to the NIF with effect from January 1, 2016 were issued.
Improvements to NIF that generate accounting changes are:
NIF B-7,Business acquisitions - It is clarified that the acquisition and / or merger of entities under common control and the acquisition of non-controlling interest or the sale without losing control of the subsidiary, are beyond the scope of this standard, regardless how you have determined the amount of the consideration.
NIF C-1,Cash and cash equivalents and NIF B-2,Statement of Cash Flows - are modified to consider foreign currency as cash and not as cash equivalents. It also clarifies that both initial valuation and subsequent cash equivalents should be at fair value.
Bulletin C-2,Financial instruments and Improvement documents to Bulletin C-2
| a. | The definition of financial instruments available for sale is amended to clarify that they are those in which from the moment it is decided to invest in them, they are intended to be negotiate in the medium term and prior to their maturity dates, in order to profit from changes based on their market value, not only through yields. |
| b. | The criteria to be taken into account for an entity to classify a financial instrument as available for sale are precise,which is not possible when i) it intends to keep it for an indefinite period, ii) the institution is willing to sell such financial instrument, iii) there is option or rescue instrument in their favor and iv) the issuer of the instrument has the right to settle the financial instrument at an amount significantly less than amortized cost. |
| c. | The concept “expenses of purchase” is removed and the definition of “transaction costs” is incorporated. |
| d. | The reversal of impairment losses related to financial instruments held to maturity, net profit or loss for the period is allowed. |
NIF C-7,Investments in associates, joint ventures and other permanent investments – It is established that in case of contributions in kind, they should be recognized at fair value at which it was negotiated between the owners or shareholders, unless they result from the capitalization of a debt, in which case, they should be recognized by the capitalized amount.
Bulletin C-10,Derivative Financial Instruments and Hedging
| a. | It must be defined the method used to measure the effectiveness, which must be assessed at the beginning of the coverage, in subsequent periods and on the date of the financial statements. |
| b. | It clarifies how to designate a primary position. |
54
| c. | The accounting for transaction costs of a derivative to be recognized directly in profit or loss for the period at the time of acquisition and not amortized over its term is modified. |
| d. | Details of the implicit recognition of derivative financial instruments are made. |
Improvements to NIF causing no accounting changes are:
NIF C-19, Financial Instruments payable (FIP) - clarifications are made with respect to: i) the definition of transaction costs, ii) when the amortization of the transaction costs must be recalculated, iii) the entity must demonstrate, in support of its accounting policy that it meets the conditions to designate a financial liability at fair value through profit or loss, iv) disclose the gain or loss from the derecognition of a FIP and fair values of significant liabilities at long-term fixed rate. An appendix to support in determining the effective interest rate is also incorporated.
NIF C-20, Financial Instruments receivable - changes to refine and clarify a number of concepts for the issuance of new accounting requirements relating to the issue of financial instruments and the final issuance of the International Financial Reporting Standard 9, Financial Instruments are incorporated. The most important changes include: transaction costs and amortization, effective interest rate, credit deterioration, foreign currency instruments, debt instruments reclassification between fair value and receivable financing, value of money over time and disclosure qualitative and quantitative.
Currently the Financial Group is in the process of determining the impact of these new standards on its financial information, in case they are applicable.
55
| Earnings per ordinary share and earnings per diluted share | |||||||||||||
| (Millions of pesos, except shares and earnings per share) | |||||||||||||
| DECEMBER 2015 | DECEMBER 2014 | DECEMBER 2013 | |||||||||||
| Shares | Earnings | Shares | Earnings | Shares | Earnings | ||||||||
| Earnings | -weighted- | per share | Earnings | -weighted- | per share | Earnings | -weighted- | per share | |||||
| Earnings per share | 14,141 | 6,777,712,725 | 2.09 | 14,014 | 6,775,809,054 | 2.07 | 20,876 | 6,773,811,711 | 3.08 | ||||
| Treasury shares | 8,682,188 | 10,585,859 | 12,583,210 | ||||||||||
| Diluted earnings per share | 14,141 | 6,786,394,913 | 2.08 | 14,014 | 6,786,394,913 | 2.07 | 20,876 | 6,786,394,921 | 3.08 | ||||
| Plus loss / less (profit): | |||||||||||||
| Discontinued operations | (1,918) | ||||||||||||
| Continued fully diluted earnings per share | 14,141 | 6,786,394,913 | 2.08 | 14,014 | 6,786,394,913 | 2.07 | 18,958 | 6,786,394,921 | 2.79 | ||||
| Balance outstanding shares as of December 31, 2015 | 6,777,193,207 | ||||||||||||
56
| Consolidated Balance Sheet by Segment | |||||||
| Millions of pesos | |||||||
| As of December 31, 2015 | As of December 31, 2014 | ||||||
| Retail Banking | Wholesale Banking | Corporate Activities | Retail Banking | Wholesale Banking | Corporate Activities | ||
| Assets | |||||||
| Cash and due from banks | 50,936 | 33,707 | 15,195 | 44,065 | 30,923 | 26,210 | |
| Margin Accounts | 0 | 1,943 | 0 | 0 | 2,855 | 0 | |
| Investment in securities | 0 | 209,404 | 119,941 | 0 | 114,564 | 88,891 | |
| Debtors under sale and repurchase agreements | 0 | 5,758 | 0 | 0 | 5,186 | 0 | |
| Securities loan | 0 | 1 | 0 | 0 | 0 | 0 | |
| Derivatives | 0 | 116,668 | 12,121 | 0 | 92,544 | 4,740 | |
| Valuation adjustment for hedged financial assets | 0 | 0 | 104 | 0 | 0 | (44) | |
| Total loan portfolio | 430,831 | 116,884 | 30 | 355,640 | 109,756 | 145 | |
| Allowance for loan losses | (15,378) | (4,365) | 0 | (13,070) | (3,881) | 0 | |
| Loan Portfolio (net) | 415,453 | 112,519 | 30 | 342,570 | 105,875 | 145 | |
| Accrued income receivable from securitization transactions | 0 | 0 | 73 | 0 | 0 | 127 | |
| Other receivables (net) | 1,018 | 50,535 | 9,530 | 1,400 | 35,772 | 14,186 | |
| Foreclosed assets (net) | 13 | 1 | 543 | 13 | 1 | 344 | |
| Properties, furniture and fixtures (net) | 4,695 | 791 | 70 | 4,451 | 750 | 67 | |
| Long-term investments in shares | 0 | 0 | 182 | 0 | 0 | 153 | |
| Deferred charges, advance payments, intangibles assets | 0 | 0 | 18,097 | 0 | 0 | 16,819 | |
| Other assets | 1,696 | 831 | 3,002 | 1,664 | 719 | 2,394 | |
| Discontinued operations | 0 | 0 | 0 | 0 | 0 | 0 | |
| Total assets | 473,811 | 532,158 | 178,888 | 394,163 | 389,189 | 154,032 | |
| Liabilities | |||||||
| Deposits | 369,471 | 74,162 | 72,799 | 340,487 | 76,668 | 42,469 | |
| Credit instruments issued | 0 | 13,769 | 26,354 | 0 | 5,344 | 21,684 | |
| Bank and other loans | 26,552 | 0 | 35,903 | 27,013 | 200 | 27,732 | |
| Creditors under sale and repurchase agreements | 8,521 | 185,703 | 0 | 17,767 | 86,335 | 0 | |
| Collateral sold or pledged as guarantee | 0 | 24,623 | 0 | 0 | 14,077 | 0 | |
| Derivatives | 0 | 124,801 | 9,556 | 0 | 94,779 | 4,389 | |
| Other payables | 17,789 | 56,094 | 2,072 | 20,596 | 31,067 | 1,449 | |
| Subordinated debentures | 0 | 0 | 22,788 | 0 | 0 | 19,446 | |
| Deferred revenues | 351 | 0 | 0 | 498 | 0 | 0 | |
| Total liabilities | 422,684 | 479,152 | 169,472 | 406,361 | 308,470 | 117,169 | |
| Total stockholders' equity | 58,406 | 18,996 | 36,147 | 51,277 | 19,054 | 35,053 | |
| Total liabilities and stockholders' equity | 481,090 | 498,148 | 205,619 | 457,638 | 327,524 | 152,222 | |
57
| Income Statement by Segment | |||||||
| Millions of pesos | |||||||
| 12M15 | 12M14 | ||||||
| Retail Banking | Global Wholesale Banking | Corporate Activities | Retail Banking | Global Wholesale Banking | Corporate Activities | ||
| Net interest income | 37,229 | 4,076 | 1,327 | 33,395 | 3,811 | 372 | |
| Provisions for loan losses | (16,223) | (1,021) | 0 | (13,470) | (819) | 0 | |
| Net interest income after provisions for loan losses | 21,006 | 3,055 | 1,327 | 19,925 | 2,992 | 372 | |
| Commission and fee income (expense), net | 12,854 | 1,924 | (6) | 11,893 | 1,604 | (80) | |
| Net gain (loss) on financial assets and liabilities | 935 | 837 | 493 | 692 | 1,938 | 327 | |
| Other operating income (expense) | 1,346 | 8 | 25 | 1,634 | 1 | (200) | |
| Administrative and promotional expenses | (22,561) | (2,710) | (372) | (21,160) | (2,451) | (209) | |
| Operating income | 13,580 | 3,114 | 1,467 | 12,984 | 4,084 | 210 | |
| Equity in results of associated companies | 0 | 0 | 81 | 0 | 0 | 78 | |
| Operating income before income taxes | 13,580 | 3,114 | 1,548 | 12,984 | 4,084 | 288 | |
Segment information has been prepared according to the classifications used in Santander México at secondary level, based in the type of developed business:
Commercial banking
It includes all the businesses pertaining to customer banking, under the following segments: Individual, Small and Medium-sized Enterprises (Pymes) Institutions, Local Corporate Banking (large enterprises), as well as the contributions of Mutual Funds businesses (after transfer of commissions to distributors).
Global wholesale banking
This area reflects the earnings from Global Corporate Banking, Investment Banking and Treasury.
Corporate activities
It includes non-commercial assets and liabilities, the result from hedging positions, insurance business (net of commissions paid to Commercial Bank) and others. Even though Corporate Banking, by definition, belongs to Commercial Banking, it is separated herein in order to reflect the results from corporate customers.
58
| Annex 1 | |||||
| Loan Portfolio Rating | |||||
| As of December 31, 2015 | |||||
| Millions of pesos | |||||
| Allowance for loan losses | |||||
| Category | Loan Portfolio | Commercial | Consumer | Mortgages | Total |
| Risk "A" | 518,624 | 1,698 | 625 | 249 | 2,572 |
| Risk "A-1" | 447,460 | 1,232 | 165 | 157 | 1,554 |
| Risk "A-2" | 71,164 | 466 | 460 | 92 | 1,018 |
| Risk "B" | 86,208 | 626 | 3,105 | 164 | 3,895 |
| Risk "B-1" | 24,380 | 128 | 888 | 43 | 1,059 |
| Risk "B-2" | 37,469 | 149 | 1,293 | 91 | 1,533 |
| Risk "B-3" | 24,359 | 349 | 924 | 30 | 1,303 |
| Risk "C" | 24,403 | 487 | 1,701 | 279 | 2,467 |
| Risk "C-1" | 13,137 | 206 | 586 | 121 | 913 |
| Risk "C-2" | 11,266 | 281 | 1,115 | 158 | 1,554 |
| Risk "D" | 14,232 | 1,490 | 2,604 | 1,029 | 5,123 |
| Risk "E" | 8,399 | 3,732 | 1,606 | 304 | 5,642 |
| Total rated portfolio | 651,866 | 8,033 | 9,641 | 2,025 | 19,699 |
| Provisions created | 19,699 | ||||
| Complementary provisions | 44 | ||||
| Total | 19,743 | ||||
Notes:
| 1. | The figures used for grading and the creation of provisions correspond to the ones as of the last day of the month of the balance sheet as ofDecember 31, 2015. |
| 2. | Loan Portfolio and the methodology are graded according the rules issued by CNBV. From August 2009, the Bank implemented the rules for grading revolving consumer credit card loans. From March 2011, the Bank implemented the rules for grading non-revolving consumer and mortgage loans. From September, 2011, the bank implemented new rules for grading loans to States and Municipalities. From June 2013, the bank implemented new rules for grading commercial loans. From June 2014, the bank implemented new rules for grading financial institutions loans. |
| 3. | Allowance created in excess are explained by the following: The Bank maintains an additional allowance to the ones necessary pursuant to the loan portfolio grading process authorized by the Commission, in order to cover potential losses from mortgages portfolio, the valuation of assets determined in the Due Diligence and authorized by the Commission in Official Letter No. 601DGSIF"C"-38625, as well as to cover the cost of Governmental Programs. |
59
| Annex 2 | |||||||
| Financial Ratios | |||||||
| Banco Santander México | |||||||
| Percentages | 4Q15 | 3Q15 | 4Q14 | 2015 | 2014 | ||
| Past Due Loans Ratio | 3.3 | 3.5 | 3.7 | 3.3 | 3.7 | ||
| Past Due Loans Coverage | 108.2 | 105.8 | 97.1 | 108.2 | 97.1 | ||
| Operative Efficiency | 2.2 | 2.3 | 2.6 | 2.2 | 2.5 | ||
| ROE | 15.0 | 12.5 | 14.5 | 12.5 | 13.3 | ||
| ROA | 1.4 | 1.2 | 1.6 | 1.2 | 1.5 | ||
| Capitalization Ratio | |||||||
| Credit Risk | 21.3 | 23.2 | 23.7 | 21.3 | 23.7 | ||
| Credit, Market and operations risk | 15.6 | 15.4 | 16.2 | 15.6 | 16.2 | ||
| Liquidity | 110.3 | 117.6 | 92.2 | 110.3 | 92.2 | ||
| NIM (Net Interest Margin) | 2.6 | 2.5 | 3.1 | 2.4 | 2.8 | ||
Note:ratios are prepared according to the general rules applicable to financial information of credit institutions, issued by the CNBV, according to Annex 34 of the CUB (Circular Única de Bancos).
NPL RATIO = Balance of past due loans portfolio as of the end of the quarter / Balance of loans portfolio as of the end of the quarter.
COVERAGE RATIO= Balance of provision for loan losses as of the end of the quarter / Balance of past due loans portfolio as of the end of the quarter.
EFFICIENCY RATIO = Administration and promotion expenses of the quarter, annualized / Total Average Assets.
ROAE = Annualized quarterly net earnings/ Average stockholders’ equity.
ROAA = Annualized quarterly net earnings /Total average assets.
BREAKDOWN OF CAPITALIZATION RATIO: (1)=Net Capital/ Assets subject to credit risk. (2)=Net Capital / Assets subject to credit, market and operation risk.
LIQUIDITY = Current Assets/ Current Liabilities.
Where: Current Assets = Availabilities + securities for trade + securities available for sale.
Current liabilities= Demand deposits + bank loans and loans from other entities, payable on demand, + short term bank loans and loans from other entities.
NIM = Quarterly Net Interest Margin, adjusted by annualized credit risks, / Average interest-earning assets.
Where: Average interest-earning assets = availabilities, investments in securities, transactions with securities and derivatives and loan portfolio.
Notes:
Average = ((Balance of the corresponding quarter + balance of the previous quarter) / 2).
Annualized figures = (Flow of the corresponding quarter * 4).
60
| Notes to financial statements as of December 31, 2015 | |
| (Millions of pesos, except for number of shares) | |
| 1. Investment in securities | |
| Financial instruments are constituted as follows: | |
| Accounting Value | |
| Trading securities: | |
| Bank securities | 7,826 |
| Government securities | 199,255 |
| Private securities | 953 |
| Shares | 2,124 |
| 210,158 | |
| Securities available for sale: | |
| Government securities | 108,308 |
| Private securities | 5,217 |
| Shares | 24 |
| 113,549 | |
| Securities held until maturity: | |
| Government securities (special cetes) | 5,638 |
| 5,638 | |
| Total | 329,345 |
| 2. Sale and repurchase agreements | |
| The sale and repurchase agreements transactions are constituted as follows: | |
| Net balance | |
| Debit balances | |
| Bank securities | 5,128 |
| Government securities | 630 |
| Total | 5,758 |
| Credit balances | |
| Bank securities | 3,693 |
| Government securities | 188,033 |
| Private securities | 2,498 |
| Total | 194,224 |
| (188,466) | |
61
| 3. Investment in securities different to government securities |
| The table below lists the investments in debt securities of a same issuer, with positions equal or greater than 5% of Tier 1 Capital of Santander México. |
| Issuer / Series | Maturity date | % Rate | Book Value |
| PEMEC29 200723 | 23-jul-20 | 3.50% | 487 |
| PEMEX 020622 | 02-jun-22 | 8.27% | 932 |
| PEMEX 10-2 | 27-ene-20 | 9.10% | 1,384 |
| PEMEX 11 | 08-mar-16 | 3.57% | 1 |
| PEMEX 11-2 | 10-abr-17 | 3.67% | 40 |
| PEMEX 11-3 | 24-nov-21 | 7.65% | 1,006 |
| PEMEX 12 | 23-nov-17 | 3.71% | 181 |
| PEMEX 13 | 28-feb-19 | 3.41% | 192 |
| PEMEX 14 | 19-nov-20 | 3.68% | 30 |
| PEMEX 14-2 | 12-nov-26 | 7.47% | 49 |
| PEMEX 240225 | 24-feb-25 | 5.50% | 304 |
| PEMEX3 030519 | 03-may-19 | 8.00% | 586 |
| PEMEX3 210121 | 21-ene-21 | 5.50% | 528 |
| Total | 5,720 | ||
| Total capital as of December 2015 | 103,639 | ||
| 5 % of Total Capital | 5,182 |
| 4. Derivatives | |||
| The nominal value of the different derivative financial instruments agreements for trading and hedging purposes, as of December 31, 2015, are as follows: | |||
| Trading | |||
| Swaps | |||
| Interest rate | 3,998,295 | ||
| Cross currency | 817,642 | ||
| Futures | Buy | Sell | |
| Interest rate | 684 | 101,955 | |
| Foreign currency | 0 | 86 | |
| Index | 5,281 | 2,168 | |
| Forward contracts | |||
| Interest rate | 0 | 2,020 | |
| Foreign currency | 229,960 | 10,492 | |
| Equity | 3,112 | 7,456 | |
| Options | Long | Short | |
| Interest rate | 110,054 | 146,700 | |
| Foreign currency | 13,411 | 16,749 | |
| Index | 31,558 | 97,088 | |
| Equity | 0 | 500 | |
| Total trading derivatives | 5,209,997 | 385,214 | |
| Hedging | |||
| Cash flow | |||
| Interest rate swaps | 2,050 | ||
| Cross currency swaps | 42,137 | ||
| Foreign Exchange Forwards | 37,922 | ||
| Fair value | |||
| Interest rate swaps | 6,279 | ||
| Cross currency swaps | 6,291 | ||
| Total hedging derivatives | 94,679 | ||
| Total financial instruments | 5,304,676 | 385,214 | |
62
| 5. Performing loan portfolio | ||||
| The loan portfolio, by type of loan and currency, as of Deptember 31, 2015, is constituted as follows: | ||||
| Amount | ||||
| Pesos | USA Dlls | UDIS | Total | |
| Commercial or business activity | 188,298 | 68,969 | 1 | 257,268 |
| Financial entities | 9,164 | 677 | 0 | 9,841 |
| Government entities | 43,602 | 16,268 | 0 | 59,870 |
| Commercial loans | 241,064 | 85,914 | 1 | 326,979 |
| Consumer loans | 88,029 | 0 | 0 | 88,029 |
| Mortgage loans | 109,842 | 941 | 3,706 | 114,489 |
| Total performing loan portfolio | 438,935 | 86,855 | 3,707 | 529,497 |
| 6. Non-performing loan portfolio | ||||
| Amount | ||||
| Pesos | USD | UDIS | Total | |
| Commercial or business activity | 7,443 | 1,150 | 0 | 8,593 |
| Government entities | 3 | 0 | 0 | 3 |
| Commercial loans | 7,446 | 1,150 | 0 | 8,596 |
| Consumer loans | 3,664 | 0 | 0 | 3,664 |
| Mortgage loans | 4,499 | 45 | 1,444 | 5,988 |
| Total non-performing loan portfolio | 15,609 | 1,195 | 1,444 | 18,248 |
The analysis of movements in non-performing loans from January 1 to December 31, is as follows:
| Balance as of January 1st, 2015 | 17,455 | |
| Plus: Transfer from performing loan portfolio to non-performing loan portfolio | 27,786 | |
| Loan acquisition | 222 | |
| Collections: | ||
| Cash | (4,682) | |
| Transfer to performing loan portfolio | (7,347) | |
| Proceeds from foreclosure proceedings | (558) | (12,587) |
| Restructured loans | 0 | |
| Write-offs | (14,628) | |
| Balance as of December 31, 2015 | 18,248 |
| 7. Allowance for loan losses |
| The movement in the allowance for loan losses, from January 1st. to December 31, 2015, is as follows: |
| Balance as of January 1, 2015 | 16,951 |
| Allowance for loan losses | 17,243 |
| Recoveries credited in results from retained earnings | (14) |
| Charge-offs | (14,628) |
| Foreign exchange result | 191 |
| Balance as of December 31, 2015 | 19,743 |
63
The table below presents a summary of write-offs by type of product as of December 31, 2015:
| Product | Charge-offs | Debit Relieves | Total | % | |||
| First quarter | |||||||
| Commercial loans | 783 | 23 | 806 | 25% | |||
| Mortgage loans | 85 | 48 | 133 | 4% | |||
| Credit card loans | 1,374 | 25 | 1,399 | 43% | |||
| Consumer loans | 929 | 17 | 946 | 29% | |||
| Total | 3,171 | 113 | 3,284 | 100% | |||
| Second quarter | |||||||
| Commercial loans | 985 | 48 | 1,033 | 30% | |||
| Mortgage loans | 147 | 54 | 201 | 6% | |||
| Credit card loans | 1,347 | 30 | 1,377 | 40% | |||
| Consumer loans | 862 | 11 | 873 | 25% | |||
| Total | 3,341 | 143 | 3,484 | 100% | |||
| Third quarter | |||||||
| Commercial loans | 855 | 170 | 1,025 | 27% | |||
| Mortgage loans | 124 | 57 | 181 | 5% | |||
| Credit card loans | 1,434 | 28 | 1,462 | 39% | |||
| Consumer loans | 1,052 | 14 | 1,066 | 29% | |||
| Total | 3,465 | 269 | 3,734 | 100% | |||
| Fourth quarter | |||||||
| Commercial loans | 990 | 607 | 1,597 | 39% | |||
| Mortgage loans | 142 | 70 | 212 | 5% | |||
| Credit card loans | 1,183 | 30 | 1,213 | 29% | |||
| Consumer loans | 1,091 | 13 | 1,104 | 27% | |||
| Total | 3,406 | 720 | 4,126 | 100% | |||
| Accumulated 2015 | |||||||
| Commercial loans | 3,613 | 848 | 4,461 | 30% | |||
| Mortgage loans | 498 | 229 | 727 | 5% | |||
| Credit card loans | 5,338 | 113 | 5,451 | 37% | |||
| Consumer loans | 3,934 | 55 | 3,989 | 27% | |||
| Total | 13,383 | 1,245 | 14,628 | 100% |
Commerce Fund
Pursuant to the CNBV's authorization in Official Bulletin No. 601-I-DGSIF "C" - 38625 issued on March, 2001; as of December 31, 2015, there are Ps. 5 million in allowances for loan losses from the commerce fund, which resulted from the restructuring process of Grupo Financiero Santander. As of December 31 2014, such allowances totaled Ps.10 million.
During the fourth quarter of 2015, the abovementioned allowances for loan losses had the following breakdown:
| Mortgages and commercial loans write-offs | (5) |
| Remeasurement of UDIs reserves and foreign exchange effect | 0 |
| (5) |
64
As part of the CNBV’s authorization for these reserves, in case there are loan portfolio recoveries from previously written-off loans, these recoveries will be recorded in the consolidated statement of income. During the fourth quarter of 2015, charges due to income statement due to recoveries of previously written-off loans amounted Ps.14 million.
8. Problematic loans
Loans portfolio was graded according to the general provisions issued by the CNBV. The management considers that problematic loans are the ones graded as “D” and “E”, due to their low possibility for the collection of the full amount of principal.
9. Programs of benefits to bank debtors with the support of the Federal Government. |
At December 31, 2015, Santander México does not have any accounts receivable by Federal Government concerning the early termination of benefit programs granted to debtors of the Bank, under the June 1, 2015, received the amount set the fifth annuity amounting to Ps.110 million. |
Early termination of the support programs for debtors
On July 15, 2010, an Agreement for the early termination of the support programs for bank debtors (the “Agreement”) was entered into. The credit institutions considered to early terminate the following programs, which were created between years 1995- 1998, derived from restructuring of loans, as follows:
| 1. | Support Program for Mortgages Debtors (Support Program); |
| 2. | Support Program for the Construction of Housing, in the stage of individual loans (Support Program), and |
3. Agreement on benefits for Mortgages Debtors (Discounts Program)
The credit institutions reached an agreement with the Mexican Treasury Department (Secretaría de Hacienda y Crédito Público (SHCP)) and the CNBV. The banks were represented by the Mexican Bank’s Association (Asociación de Bancos de México, A.C. (ABM)) and it establishes that, for the correct application of the early termination agreement, the credit institutions are to be subject to the supervision and monitoring of the CNBV, and they shall comply with all the comments and corrections made by such CNBV and they shall deliver all the information requested by the CNBV for the fulfillment of the agreement.
Restructured loans or loans in UDIs granted under the Support Programs for debtors, loans in Mexican pesos; loans in Mexican pesos with right to receive the benefits of the Discounts Program and, loans that, as of December 31, 2010, were current, as well as past due loans that as of the aforementioned date, had been restructured, and those loans that, in order to continue in effect, received a write-off or discount, whatever the amount, were subject to the scheme of early termination, provided that evidence of payments was delivered.
Breakdown of special CETES , of which Ps.3,522 correspond to the early extinction of debtor support programs:
| Amount | ||
| Government Securities | ||
| Special CETES of credit support programs for Mexican States and municipalities and additional benefits | 2,462 | |
| Special CETES for housing loan debtor support programs | 3,549 | |
| Total securities held to maturity (no reserve) | 6,011 | |
| Minus- | ||
| Reserve for Special CETES | (373) | |
| Total securities held to maturity , net | 5,638 |
65
The remaining balance and expiration date Special Cetes that were not repurchased by the Federal Government and therefore the Financial Group holds in its balance sheet at December 31, 2015, is as follows:
| Issue | Trust | Securities Number | Due date | Price (MXN) | Amount |
| B4-170713 | 421-5 | 9,155,840 | 13-jul-17 | 94.07 | 861 |
| B4-170720 | 424-6 | 86,723 | 20-jul-17 | 94.07 | 8 |
| B4-220707 | 422-9 | 12,762,386 | 07-jul-22 | 94.07 | 1,201 |
| B4-270701 | 423-2 | 15,292,752 | 01-jul-27 | 94.07 | 1,439 |
| B4-220804 | 431-2 | 440,294 | 04-ago-22 | 86.13 | 38 |
| BC-220804 | 431-2 | 71,442 | 04-ago-22 | 30.22 | 2 |
| 3,549 |
| 10. Average interest rates paid on deposits |
| The average interest rates paid on deposits during December 2015, is as follow: |
| Pesos | USD | ||
| Average balance | 265,703 | 43,727 | |
| Interest | 829 | 12 | |
| Rate | 1.2205% | 0.1030% |
| 11. Bank and other loans |
As of December 31, 2015, banks and other loans are constituted as follows:
| Average | |||||
| Liabilities | Amount | Rate | Maturity | ||
| Loans in mexican pesos | |||||
| Local bank loans | 5,500 | 3.45% | To 4 years | ||
| Public fiduciary funds | 6,522 | 3.49% | From 1 day to 16 years | ||
| Development banking institutions | 20,346 | 5.33% | From 1 day to 5 years | ||
| Total | 32,368 | ||||
| Loans in foreign currency | |||||
| Foreign bank loans | 18,950 | 0.98% | From 14 days to 5 years | ||
| Local bank loans | 1,121 | 0.80% | From 6 days to 75 days | ||
| Call money | 9,228 | 0.52% | To 4 days | ||
| Public fiduciary funds | 537 | 1.41% | From 31 days to 5 years | ||
| Development banking institutions | 185 | 5.30% | From 8 days to 181 days | ||
| Total | 30,021 | ||||
| Total loans | 62,389 | ||||
| Accrued interests | 66 | ||||
| Total bank and other loans | 62,455 |
66
| 12. Current and deferred taxes | ||
| Current taxes are composed as follows at December 31, 2015 | ||
| Income taxes | (3,074) | |
| Deferred taxes | 678 | (1) |
| Total Bank | (2,396) | |
| Current and-deferred taxes from other subsidiaries | (1,704) | |
| Total Financial Group | (4,100) | |
| (1) Deferred taxes are composed as follows: | ||
| Global provision | 690 | |
| Fixed assets and deferred charges | (344) | |
| Net effect from financial instruments | (951) | |
| Accrued liabilities | 117 | |
| Others | (189) | |
| Total Bank | (677) | |
| Allowance for loan losses of subsidiaries, net | 568 | |
| Others, subsidiaries | (3,991) | |
| Deferred income tax (net), Financial Group | (4,100) | |
| As of December 31, 2015, deferred assets and liabilities are registered at 100% | ||
| Remainder of global provisions and allowances for loan losses | 10,278 | |
| Other | 7,819 | |
| Total deferred income tax (net) | 18,097 | |
| Deferred taxes registered in balance sheet accounts | 18,097 | |
| 13. Employee profit sharing | |
| As of December 31, 2015, the deferred Employee profit sharing EPS is compromised as follows: | |
| Deferred EPS asset: | |
| Allowance for loan losses deducting outstanding | 1,588 |
| Fixed assets and deferred charges | 760 |
| Accrued liabilities | 389 |
| Capital losses carryforward | 798 |
| Commissions and interests early collected | 150 |
| Foreclosed assets | 66 |
| Labor provisions | 74 |
| Net effect from financial instruments | 214 |
| Deferred EPS asset: | 4,039 |
| Deferred EPS liability: | |
| Net effect from financial instruments | (482) |
| Advance prepayments | (81) |
| Others | (56) |
| Deferred EPS liability | (619) |
| Less - Reserve | (160) |
| Deferred EPS asset (net) | 3,260 |
| 14. Capitalization Ratio |
Table I.1
Form for the disclosure of capital of paid-in capital without considering transiency in the application of adjustments in the regulation
| Reference | Capital Description | Capital |
| Level 1 (CET 1) Ordinary capital: Instruments and reserves | ||
| 1 | Ordinary shares that qualify for level 1 Common Capital plus corresponding premium | 34,798 |
| 2 | Earnings from previous fiscal years | 52,747 |
| 3 | Other elements of other comprehensive income (and other reserves) | 24,004 |
67
| 4 | Capital subject to gradual elimination of level 1 ordinary capital (only applicable for companies that are not lined to shares) | |
| 5 | Ordinary shares issued by subsidiaries held by third parties (amount allowed in level 1 ordinary capital) | |
| 6 | Level 1 ordinary capital before adjustments to regulation | 111,550 |
| Level 1 Ordinary capital: adjustments to regulation | ||
| 7 | Adjustments due to prudential valuation | |
| 8 | Commercial credit (net of its corresponding deferred profit taxes debited) | 1,735 |
| 9 | Other intangibles other than rights to mortgage rights (net of its corresponding deferred profit taxes debited) | 3,143 |
| 10 (conservative) | Deferred taxes to profit credited relying on future income excluding those that derive from temporary differences (net of deferred profit taxes debited) | 0 |
| 11 | Results of valuation of cash flow hedging instruments | 0 |
| 12 | Reserves to be constituted | 0 |
| 13 | Benefits over remnant of securitization transactions | 0 |
| 14 | Losses and gains caused for the changes in credit rating of liabilities assessed at a reasonable value | |
| 15 | Pension plan for defined benefits | 0 |
| 16 (conservative) | Investments in proprietary shares | 32 |
| 17 (conservative) | Reciprocal investments in ordinary capital | 0 |
| 18 (conservative) | Investments in capital of banks, financial institutions and insurance companies out of the reach of the regulation consolidation, net of short eligible positions, wherein the institution does not hold more than 10% of the issued capital (amount that exceeds the 10% threshold) | 193 |
| 19 (conservative) | Significant investments in ordinary shares of banks, financial institutions and insurance companies out of the scope of the regulation consolidation, nets of eligible short positions, wherein the institutions holds more than 10% of the issued capital (amount that exceeds the 10% threshold) | 0 |
| 20 (conservative) | Rights for mortgage services (amount exceeding the 10% threshold) | 0 |
| 21 | Deferred taxes to profit credited resulting from temporary differences (amount exceeding the 10% threshold, net of deferred taxes debited) | 935 |
| 22 | Amount exceeding the 15% threshold. | |
| 23 | of which: significant investments wherein the institution holds more than 10% of ordinary shares of financial institutions | |
| 24 | of which: rights for mortgage services | |
| 25 | of which: Taxes to profit Deferred credited deriving from temporary differences | |
| 26 | National regulation adjustments | 25,185 |
| A | of which: Other elements of wholesome profit (and other reserves) | 0 |
| B | of which: investments in subordinated debt | 0 |
| C | of which: profit or increase in the value of assets from the purchase of securitization positions (Originating Institutions) | 0 |
| D | of which: investments in multilateral entities | 0 |
| E | of which: investments in related corporations | 23,325 |
| F | of which: investments in risk capital | 0 |
| G | of which: investments in investment corporations | 0 |
| H | of which: Funding for the purchase of proprietary shares | 0 |
| I | of which: Transactions in breach of provisions | 0 |
| J | of which: Deferred charges and installments | 630 |
| K | of which: Positions in First Losses Schemes | 0 |
| L | of which: Worker's Deferred Profit Sharing | 0 |
68
| M | of which: Relevant Related Persons | 0 |
| N | of which: Pension plan for defined benefits | 0 |
| O | of witch: Adjustment for capital acknowledgment | 0 |
| P | of which: investments in Clearing Houses | 1,231 |
| 27 | Regulation adjustments that apply to level 1 common stock due to level 1 capital shortage and level 2 capital to cover deductions | 0 |
| 28 | Total regulation adjustments to level 1 Common Capital | 31,222 |
| 29 | Level 1 Common Capital (CET1) | 80,328 |
| Level 1 additional capital: instruments | ||
| 30 | Instruments directly issued that qualify as level 1 additional capital, plus premium | 0 |
| 31 | of which: Qualify as capital under the applicable accounting criteria | 0 |
| 32 | of which: Qualify as liability under the applicable accounting criteria | |
| 33 | Capital instruments directly issued subject to gradual elimination of level 1 additional capital | 0 |
| 34 | Instruments issued of level 1 additional capital and level 1 Common Capital instruments that are not included in line 5 issued by subsidiaries held by third parties (amount allowed at additional level 1) | 0 |
| 35 | of which: instruments issued by subsidiaries subject to gradual elimination | |
| 36 | Level 1 additional capital before regulation adjustments | 0 |
| Level 1 additional capital: regulation adjustments | ||
| 37 (conservative) | Investments in held instruments of level 1 additional capital | |
| 38 (conservative) | Investments in reciprocal shares in level 1 additional capital instruments. | |
| 39 (conservative) | Investments in capital of banks, financial institutions and insurance companies out of the scope of the regulation consolidation, net of short eligible positions, wherein the institution holds more than 10% of the issued capital | |
| 40 (conservative) | Significant investments in ordinary shares of banks, financial institutions and insurance companies out of the scope of the regulation consolidation, nets of eligible short positions, wherein the institutions holds more than 10% of the issued capital | |
| 41 | National regulation adjustments | 0 |
| 42 | Regulation adjustments that apply to level 1 common stock due to level 1 capital shortage and level 2 capital to cover deductions | |
| 43 | Total regulation adjustments to level 1 additional Common Capital | 0 |
| 44 | Level 1 additional capital (AT1) | 0 |
| 45 | Level 1 capital (T1 = CET1 + AT1) | 80,328 |
| Level 2 capital: instruments and reserves | ||
| 46 | Instruments directly issued that qualify as level 2 capital, plus premium | 22,842 |
| 47 | Capital instruments directly issued subject to gradual elimination of level 2 capital. | 0 |
| 48 | Level 2 capital instruments and level 1 Common Capital instruments and level 1 additional capital that has not been included in lines 5 or 34, which have been issued by subsidiaries held by third parties (amount allowed in level 2 completer capital) | 0 |
| 49 | of which: instruments issued by subsidiaries subject to gradual elimination | 0 |
| 50 | Reserves | 470 |
| 51 | Level 2 capital before regulation adjustments | 23,311 |
| Level 2 capital : regulation adjustments | ||
| 52 (conservative) | Investments in own instruments of level 2 capital | |
| 53 (conservative) | Reciprocal investments in level 2 capital instruments |
69
| 54 (conservative) | Investments in capital of banks, financial institutions and insurance companies out of the scope of the regulation consolidation, net of short eligible positions, wherein the institution does not hold more than 10% of the issued capital (amount exceeding the 10% threshold) | |
| 55 (conservative) | Significant investments in ordinary shares of banks, financial institutions and insurance companies out of the scope of the regulation consolidation, nets of eligible short positions, wherein the institutions holds more than 10% of the issued capital | |
| 56 | National regulation adjustments | 0 |
| 57 | Total regulation adjustments to level 2 capital | 0 |
| 58 | Level 2 capital (T2) | 23,311 |
| 59 | Total stock (TC = T1 + T2) | 103,639 |
| 60 | Assets weighted by total risk | 664,122 |
| Capital reasons and supplements | ||
| 61 | Level 1 Common Capital (as percentage of assets weighted by total risks) | 12.10% |
| 62 | Level 1 Stock (as percentage of assets weighted by total risks) | 12.10% |
| 63 | Total capital (as percentage of assets weighted by total risks) | 15.61% |
| 64 | Institutional specific supplement (must at least consist of: the level 1 Common Capital requirement plus the capital maintenance cushion, plus the countercyclical cushion, plus G-SIB cushion; expressed as percentage of the assets weighted by total risks) | 7.00% |
| 65 | of which: Supplement of capital preservation | 2.50% |
| 66 | of which: Supplement of specific bank countercyclical | |
| 67 | of which: Supplement of systematically important global banks (G-SIB) | |
| 68 | Level 1 Common Capital available for hedging of supplements (as percentage of assets weighted by total risks) | 5.10% |
| National minimums (if other than those of Basel 3) | ||
| 69 | National minimum reason of CET1 (if different than the minimum established by Basilea 3) | |
| 70 | National minimum reason of T1 (if different than the minimum established by Basel 3) | |
| 71 | National minimum reason of TC (if different than the minimum established by Basel 3) | |
| Amounts under the deduction thresholds (before weighting by risk) | ||
| 72 | Non-significant investment in the capital of other financial institutions | |
| 73 | Significant investment in the capital of other financial institutions | |
| 74 | Rights for mortgage services (net of Deferred profit taxes debited) | |
| 75 | Deferred profit taxes credited derived from temporary differences (net of Deferred profit taxes debited) | 9,061 |
| Applicable limits to the inclusion of reserves in level 2 capital | ||
| 76 | Eligible reserves to be included in level 2 capital with respect to expositions subject to standardized methodology (prior application of limit) | |
| 77 | Limit in the inclusion of level 2 capital provisions under standardized methodology | |
| 78 | Eligible reserves for inclusion in level 2 capital with respect to expositions subject to internal rating methodology (prior to application of limit) | |
| 79 | Limit in the inclusion of reserves in level 2 capital under internal rating methodology | |
| Capital instruments subject to gradual elimination (applicable only between January 1, 2018 and January 1, 2022) | ||
| 80 | Current limit of CET1 instruments subject to gradual elimination | |
| 81 | Amount excluded from CET1 due to limit (excess over the limit after amortization and maturity periods) | |
| 82 | Current limit of AT1 instruments subject to gradual elimination | |
| 83 | Amount excluded from AT1 due to limit (excess over the limit after amortization and maturity periods) | |
| 84 | Current limit of T2 instruments subject to gradual elimination | |
| 85 | Amount excluded from T2 due to limit (excess over the limit after amortization and maturity periods) |
70
Table I.2
Notes to the disclosure form of paid-in capital without considering transiency in the application of regulatory adjustments
| Reference | Description |
| 1 | Elements of capital contributed pursuant to fraction I item a) numbers 1) and 2) of Article 2 Bis 6 hereof |
| 2 | Results from previous fiscal years and their corresponding updates. |
| 3 | Capital reserves, net result, result per assessment of titles available for sale, accrued effect per conversion, result per assessment of cash flow hedging instruments and result per ownership of non-monetary assets. |
| 4 | Does not apply. The capital stock of credit institutions in Mexico is represented by representative certificates or shares. This concept only applies for entities where such capital is represented by representative certificates or shares. |
| 5 | Does not apply for the capitalization scope in Mexico which is on a non-consolidated basis. This concept will only apply for entities with a consolidated scope. |
| 6 | Sum of concepts 1 through 5. |
| 7 | Does not apply. In Mexico the use of internal models for calculating capital requirements per market risk is not allowed. |
| 8 | Commercial credit, net of owed differed profit taxes pursuant to the provisions of fraction I item n) of Article 2 Bis 6 hereof. |
| 9 | Intangibles, other than commercial credit, and if applicable to mortgage service rights, net of owed deferred profit taxes, pursuant to the provisions of fraction I item n) of Article 2 Bis 6 hereof. |
| 10* | Credited deferred profit taxes from losses and fiscal credits pursuant to the provisions of fraction I item p) of Article 2 Bis 6 hereof. |
| This is a more conservative approach than the one established by the Basel Committee on Banking Supervision in its document "Basel III: Global legal framework for the reinforcement of banks and banking systems" published on June 2011, given that it does not allow to set off with owed differed profit taxes. | |
| 11 | Result from assessment of cash flow hedging instruments corresponding to hedged entries that are not assessed at reasonable value. |
| 12* | Reserves pending constitution pursuant to the provisions of fraction I item k) of Article 2 Bis 6 hereof. |
| This is a more conservative approach than the one established by the Basel Committee on Banking Supervision in its document "Basel III: Global legal framework for the reinforcement of banks and banking systems" published on June 2011, given that deducts from level 1 common stock the preventive reserves pending constitution, according to the provisions of Chapter V of the Second Title hereof, as well as those constituted charged to accounting accounts that are part of the result entries or shareholders' equity and not only the positive difference between the Aggregate Expected Losses minus the Aggregate Admissible Reserves, in the event the Institutions use methods based in internal qualifications in the determination of their capital requirements. | |
| 13 | Benefits over the remnant in securitization transactions pursuant to the provisions of fraction I item c) of Article 2 Bis 6 hereof. |
| 14 | Does not apply |
| 15 | Investments made by the benefit pension fund defined corresponding to resources to which the Institution does not have unrestrictive or unlimited access. These investments are considered as net of the plan's liabilities and owed differed taxes to profit that correspond that have not been applied in any other regulatory adjustment. |
| 16* | The amount of the investment in any share acquired by the Institution: pursuant with the provisions of the Law according to the provisions of fraction I item d) of Article 2 Bis 6 hereof; through indexes |
| This is a more conservative approach to the one established by the Basel Committee on Banking Supervision in its documents "Basel III: Global regulatory framework for the reinforcement of banks and banking systems" published on June 2011 given that the deduction | |
| 17* | Investments, in capital of corporations, other than financial entities referred to by item f) of Article 2 Bis 6 hereof, that are in turn, directly or indirectly, shareholders of the institution itself, of the corporation |
71
| This is a more conservative approach to the one established by the Basel Committee on Banking Supervision in its documents "Basel III: Global regulatory framework for the reinforcement of banks and banking systems" published on June 2011 given that the deduction for this concept is made in the level 1 common stock, irrespective of the capital level where it has been invested, and in addition because any type of entity is considered, not only financial entities. | |
| 18* | Investments in shares, where the Institution owns up to 10% of the capital stock of the financial entities referred to by Articles 89 of the Law and 31 of the Law Regulating Financial Groups pursuant to the provisions of fraction I item f) of Article 2 Bis 6 hereof, including those investments made through investment corporations referred to by fraction I item i) of Article 2 Bis 6. The previous investments exclude those made in the capital of development and promotion multilateral organizations of an international nature that have a credit Qualification assigned by any of the issuer's Qualifying Institutions, equal or greater than long term Risk Degree 2. |
| This is a more conservative approach to the one established by the Basel Committee on Banking Supervision in its documents "Basel III: Global regulatory framework for the reinforcement of banks and banking systems" published on June 2011 given that the deduction for this concept is made in level 1 common stock, irrespective of the capital level in which it is invested, and additionally because it is deducted from the aggregate amount registered of the investments. | |
| 19* | Investments in shares, where the Institution owns up to 10% of the capital stock of the financial entities referred to by Articles 89 of the Law and 31 of the Law Regulating Financial Groups pursuant to the provisions of fraction I fraction f) of Article 2 Bis 6 hereof, including those investments made through investment corporations referred to by fraction I item i) of Article 2 Bis 6. The previous investments exclude those made in development and promotion multilateral organizations of an international nature that have a credit Qualification assigned by any of the issuer's Qualifying institutions, equal or greater than long term Risk Degree 2. |
| This is a more conservative approach to the one established by the Basel Committee on Banking Supervision in its documents "Basel III: Global regulatory framework for the reinforcement of banks and banking systems" published on June 2011 given that the deduction for this concept is made from level 1 common stock, irrespective of the level of capital where it has been investment, and additionally because the aggregate amount registered of investments is deducted. | |
| 20* | Mortgage service s rights shall be deducted from the aggregate amount registered in the event these rights exist. |
| This is a more conservative approach to the one established by the Basel Committee on Banking Supervision in its documents "Basel III: Global regulatory framework for the reinforcement of banks and banking systems" published on June 2011 given that the aggregate amount registered of rights is deducted. | |
| 21 | The amount of credited deferred profit taxes originating from temporary differences minus the corresponding owed differed profit taxes not considered to set-off other adjustments, exceeding 10% of the difference between the reference 6 and the sum of references 7 through 20. |
| 22 | Does not apply. Concepts were deducted from the aggregate capital. See notes of references 19, 20 and 21. |
| 23 | Does not apply. Concepts were deducted from the aggregate capital. See note of references 19. |
| 24 | Does not apply. Concepts were deducted from the aggregate capital. See note of reference 20. |
| 25 | Does not apply. Concepts were deducted from the aggregate capital. See note of reference 21. |
| 26 | National adjustments considered as the sum of the following concepts. |
| A. | The sum of the accrued effect for conversion and result for ownership of non-monetary assets considering the amount of each of these concepts with a sign different than the one considered to include them in reference 3, namely, if positive in this concept shall be entered as negatives and vice versa. |
| B. | Investments in subordinated debt instruments, pursuant to the provisions of fraction I item b) of Article 2 Bis 6 hereof. |
| C. | The amount resulting if on account of the purchase of securitization positions, the originating Institutions register a profit or increase in the value of their assets with respect to the assets previously registered in its balance, pursuant to the provisions of fraction I item c) of Article 2 Bis 6 hereof. |
| D. | Investments in capital of development or promotion multilateral organizations of an international nature pursuant to the provisions of fraction I item f) of Article 2 Bis 6 hereof, that have a credit Qualification assigned by any of the issuer's Qualifying Institutions, equal or better to long term Risk Degree 2. |
| E. | Investments in shares or corporations related to the Institution under the terms of Articles 73, 73 Bis and 73 Bis 1 of the Law, including the amount corresponding to investments in investmentcorporations and investments indices pursuant to the provisions of fraction I item g) of Article 2 Bis 6 hereof. |
72
| F. | Investments made by development banking institutions in risk capital, pursuant to the provisions of fraction I item h) of Article 2 Bis 6 hereof. |
| G. | Investments in shares, other than fix capital, in listed investment corporations wherein the Institutions holds more than 15 per cent of shareholder's equity of the aforementioned investment corporation, pursuant to fraction I item i) of Article 2 Bis 6, that have not been considered in the preceding references. |
| H. | Any type of contribution which resources are destined to the purchase of shares in the financial group's holding company, of the other financial entities that comprise the group to which the Institution belongs or of the financial affiliates of the latter pursuant to the provisions of fraction I item l) of Article 2 Bis 6 hereof. |
| I. | Transactions that infringe the provisions, pursuant to the provisions of fraction I item m) of Article 2 Bis 6 hereof. |
| J. | Differed charges and early payments, net of owed differed profit taxes, pursuant to the provisions of fraction I item n) of Article 2 Bis 6 hereof. |
| K. | Positions pertaining to the First Losses Scheme where the risk is preserved or credit protection is provided up to a certain limit of a position pursuant to fraction I item o) of Article 2 Bis 6. |
| L. | Worker's participation in credited differed profits pursuant to fraction I item p) of Article 2 Bis 6 hereof. |
| M. | The added amount of Transactions Subject to Credit Risk owed by Relevant Related Persons pursuant to fraction I item r) of Article 2 Bis 6 hereof. |
| N. | The difference between the investments made by the benefit pension funds defined pursuant to Article 2 Bis 8 minus reference 15. |
| O. | Adjustment for the acknowledgment of Net Capital . The amount shown corresponds to the amount registered in box C1 of the form included in section II hereof. |
| P. | The investments or contributions, directly or indirectly, in the corporation's capital or in the trust estate or other type of similar figures that have the purpose to set off and liquidate Transactions executed in the stock market, except for such corporation's or trust's share in the former pursuant to item f) fraction I of Article 2 Bis 6. |
| 27 | Does not apply. There are no regulatory adjustments for additional level 1 capital nor for ancillary capital. All regulatory adjustments are made from the level 1 common stock. |
| 28 | Sum of lines 7 through 22, plus lines 26 and 27. |
| 29 | Line 6 minus line 28. |
| 30 | The amount corresponding to titles representing the capital stock (including its share sale premium) that had not been considered in Fundamental Capital and Capital Instruments, that meet the conditions established in fraction II of Article 2 Bis 6 hereof. |
| 31 | Amount of line 30 qualified as capital under the applicable accounting standards. |
| 32 | Does not apply. Instruments directly issued that qualify as additional level 1 capital, plus its premium are registered for accounting purposes as capital. |
| 33 | Subordinated obligations computed as Non-Fundamental Capital, pursuant to the provisions of Article Third Transitory of Resolution 50th that amends the general provisions applicable to Credit Institutions, (Resolution 50th) |
| 34 | Does not apply. See note to reference 5. |
| 35 | Does not apply. See note to reference 5. |
| 36 | Sum of lines 30, 33 and 34. |
| 37* | Does not apply. Deduction is made in aggregate level 1 common capital. |
| 38* | Does not apply. Deduction is made in aggregate level 1 common capital. |
| 39* | Does not apply. Deduction is made in aggregate level 1 common capital. |
| 40* | Does not apply. Deduction is made in aggregate level 1 common capital. |
| 41 | National adjustments considered: |
| Adjustment for the acknowledgment of Net Capital. The amount shown corresponds to the amount registered in box C2 of the form included in section II hereof. | |
| 42 | Does not apply. There are no regulatory adjustments for ancillary capital. All regulatory adjustments are made from the level 1 common stock. |
73
| 43 | Sum of lines 37 through 42. |
| 44 | Line 36, minus line 43. |
| 45 | Line 29, plus line 44. |
| 46 | The amount corresponding to titles representing the capital stock (including its share sale premium) that had not been considered in Capital Fundamental nor in Non-Fundamental Capital and Capital Instruments, that comply with Exhibit 1-S hereof pursuant to the provisions of Article 2 Bis 7 hereof. |
| 47 | Subordinated obligations computed as ancillary capital, pursuant to the provisions of Article Third Transitory, of Resolution 50th |
| 48 | Does not apply. See note to reference 5. |
| 49 | Does not apply. See note to reference 5. |
| 50 | Preventive estimations for credit risk up to a sum of 1.25% of the assets weighed by credit risk corresponding to the Transactions that use the Standard Method to calculate the capital requirement per credit risk; and the positive difference of the Aggregate Admissible Reserves minus the Aggregate Expected Losses, up to an amount that does not exceed of 0.6 per cent of the assets weighed by credit risk, corresponding to the Transactions wherein the method based in internal qualifications to calculate the capital requirements by credit risk is used, pursuant to fraction III of Article 2 Bis 7. |
| 51 | Sun of lines 46 through 48, plus line 50. |
| 52* | Does not apply. The deduction is made in aggregate of level 1 common stock. |
| 53* | Does not apply. The deduction is made in aggregate of level 1 common stock. |
| 54* | Does not apply. The deduction is made in aggregate of level 1 common stock. |
| 55* | Does not apply. The deduction is made in aggregate of level 1 common stock. |
| 56 | National adjustments considered: |
| Adjustment for the acknowledgment of Net Capital. The amount shown corresponds to the amount registered in box C4 of the form included in section II hereof. | |
| 57 | Sum of lines 52 through 56. |
| 58 | Line 51, minus line 57. |
| 59 | Line 45, plus line 58. |
| 60 | Weighed Assets Subject to Total Risks. |
| 61 | Line 29 divided by line 60 (expressed as percentages) |
| 62 | Line 45, divided by line 60 (expressed as percentages) |
| 63 | Line 59 divided by line 60 (expressed as percentages) |
| 64 | Report 7% |
| 65 | Report 2.5% |
| 66 | Does not apply. There is no requirement that corresponds to the countercyclical supplement. |
| 67 | Does not apply. There is no requirement that corresponds to the supplement of systematically important global banks (G-SIB). |
| 68 | Line 61 minus 7% |
| 69 | Does not apply. The minimum is the same as established by the Basel Committee on Banking Supervision in its document "Basel III: Global regulatory framework for the reinforcement of banks and banking systems" published in June 2011. |
| 70 | Does not apply. The minimum is the same as established by the Basel Committee on Banking Supervision in its document "Basel III: Global regulatory framework for the reinforcement of banks and banking systems" published in June 2011. |
| 71 | Does not apply. The minimum is the same as established by the Basel Committee on Banking Supervision in its document "Basel III: Global regulatory framework for the reinforcement of banks and banking systems" published in June 2011. |
| 72 | Does not apply. The concept was deducted from the aggregate capital. See note of reference 18. |
| 73 | Does not apply. The concept was deducted from the aggregate capital. See note of reference 19. |
| 74 | Does not apply. The concept was deducted from the aggregate capital. See note of reference 20. |
| 75 | The amount, that does not exceed 10% of the difference between reference 6 and the sum of references 7 through 20, of the credited differed profit taxes resulting from temporary differences minus those corresponding to owed profit taxes not considered to set off other adjustments. |
74
| 76 | Preventive estimations for credit risk corresponding to the Transactions that use the Standard Method to calculate the capital requirement per credit risk. |
| 77 | 1.25% of weighed assets per credit risk, corresponding to Transactions wherein the Standard Method to calculate the capital requirement by credit risk. |
| 78 | Positive difference of the Aggregate Admissible Reserves minus the Aggregate Expected Losses corresponding to Transactions wherein the method based in internal qualifications to calculate the capital requirement by credit risk is used. |
| 79 | 0.6 per cent of the weighted assets by credit risk, corresponding to Transactions wherein the method based in internal qualifications to calculate the capital requirement by credit risk is used. |
| 80 | Does not apply. There are no instruments subject to transience that compute in level 1 common stock |
| 81 | Does not apply. There are no instruments subject to transience that compute in level 1 common stock |
| 82 | Balance of instruments computed as capital in the basic portion by December 31, 2012 for the corresponding balance limit therein. |
| 83 | Balance of instruments computed as capital in the basic portion by December 31, 2012 minus line 33. |
| 84 | Balance of instruments computed as capital in the complementary portion by December 31, 2012 for the corresponding balance limit therein. |
| 85 | Balance of instruments computed as capital in the basic portion by December 31, 2012 minus line 47. |
Note: * The aforementioned approach is more conservative than the one established by the Basel Committee on Banking Supervision in its document "Basel III: Global regulatory framework for the reinforcement of banks and banking systems" published in June 2011.
75
| Table II.1 | ||
| Net Capital Ratio of the balance sheet | ||
| Reference of the balance sheet items | Balance sheet items | Amount shown in the balance sheet |
| Assets | 1,163,969 | |
| BG1 | Funds Available | 99,803 |
| BG2 | Margin accounts | 1,175 |
| BG3 | Investment in securities | 330,414 |
| BG4 | Debtors under sale and repurchase agreements | 5,128 |
| BG5 | Securities loans) | 1 |
| BG6 | Derivatives | 128,937 |
| BG7 | Valuation adjustment for hedged financial assets | 104 |
| BG8 | Total loan portfolio | 488,674 |
| BG9 | Benefits to be received in securitization transactions | 0 |
| BG10 | Other receivables (net) | 60,514 |
| BG11 | Foreclosed assets (net | 242 |
| BG12 | Property, furniture and fixtures (net) | 5,541 |
| BG13 | Long-term investment in shares | 25,523 |
| BG14 | Non current assets held for sale | 0 |
| BG15 | Deferred income taxes (net) | 12,329 |
| BG16 | Other assets (net) | 5,585 |
| Liabilities | 1,052,214 | |
| BG17 | Deposits | 556,520 |
| BG18 | Bank and other loans | 43,916 |
| BG19 | Creditors under sale and repurchase agreements | 195,290 |
| BG20 | Securities loans | 0 |
| BG21 | Collateral sold or pledged as guarantee | 24,624 |
| BG22 | Derivatives | 134,357 |
| BG23 | Valuation adjustment for hedged financial liabilities | 0 |
| BG24 | Creditors from settlement of transactions | 0 |
| BG25 | Other payables, deferred revenues and other advances | 74,414 |
| BG26 | Subordinated debentures outstanding | 22,788 |
| BG27 | Deferred income taxes (net) | 0 |
| BG28 | Deferred revenues and other advances | 304 |
| Shareholders' Equity | 111,550 | |
| BG29 | Paid-in capital | 34,798 |
| BG30 | Other capital | 76,752 |
| Memorandum accounts | 4,366,330 | |
| BG31 | Guarantees granted | 0 |
| BG32 | Contingent assets and liabilities | 19 |
| BG33 | Credit commitments | 66,964 |
| BG34 | Assets in trust or mandate | 137,912 |
| BG35 | Federal Government financial agent | |
| BG36 | Assets in custody or under administration | 3,261,128 |
| BG37 | Collateral received | 59,377 |
| BG38 | Collateral received and sold or pledged as guarantee | 23,239 |
| BG39 | Investment bank operations on behalf of third parties | 0 |
| BG40 | Uncollected interest earned on past due loan portfolio | 1,274 |
| BG41 | Other accounts | 816,416 |
76
| Table II.2 | ||||
| Regulatory concepts considered in the calculation of Net Capital components | ||||
| Identifier | Regulatory concepts considered for the calculation of Net Capital components | Reference of the format for the disclosure of capital integration of section I hereof | Amount pursuant to the notes of the table Regulatory concepts considered for the calculation of Net Capital components | Reference(s) of balance sheet item and amount related with the regulatory concept considered for the calculation of Net Capital derived from the aforementioned reference |
| Asset | ||||
| 1 | Commercial Credit | 8 | 1,735 | BG16= 5,585 Minus: deferred charges and advance payments 630; intangibles 3,143; advance payments that are computed as risk assets 42; other assets are computed as risk assets 35 |
| 2 | Other Intangibles | 9 | 3,143 | BG16= 5,585 Minus: deferred charges and advance payments 630; intangibles 1,735; advance payments that are computed as risk assets 42; other assets that are computed as risk assets 35 |
| 3 | Deferred profit tax (credited) from fiscal losses and credits | 10 | 0 | 0 |
| 4 | Benefits over remnant of securitization transactions | 13 | 0 | 0 |
| 5 | Investments of the pension plan for benefits defined without restrictive and unlimited access | 15 | 0 | 0 |
| 6 | Investment in shares of the institution | 16 | 32 | BG3= 330,414 Minus: Reciprocal investments in common capital of financial entities 193; Investments in securities computed as risk assets 330,190 |
77
| 7 | Reciprocal investments in common capital | 17 | 0 | 0 |
| 8 | Direct investments in the capita of financial organizations wherein the institution does not hold more than 10% of the issued capital stock | 18 | 0 | 0 |
| 9 | Indirect investment in capital of financial organizations wherein the institution does not hold more than 10% of the issued capital stock | 18 | 193 | BG3= 330,414 Minus: Investment in own-equity securities 3; Investments in securities computed as risk assets 330,190 |
| 10 | Direct investments in the capita of financial organizations wherein the institution holds more than 10% of the issued capital stock | 19 | 0 | 0 |
| 11 | Indirect investment in capital of financial organizations wherein the institution holds more than 10% of the issued capital stock | 19 | 0 | 0 |
| 12 | Deferred profit tax (credited) from temporary differences | 21 | 935 | BG15= 12,329 Minus: Amount computed as risk asset 11,394 |
| 13 | Reserves acknowledged as complementary capital | 50 | 470 | BG8= Total loan portfolio 488,674 |
| 14 | Investments in subordinated debt | 26 - B | 0 | 0 |
| 15 | Investments in multilateral entities | 26 - D | 0 | BG13= 25,523 Minus: Investments in subsidiaries 23,325; Investments in clearing houses 1,231; Investments in associated companies 176; Other investments that are computed as risk assets 792 |
| 16 | Investments in related companies | 26 - E | 23,325 | BG13= 25,523Minus: Investments in clearing houses 1,231; Investments in associated companies 176; Other investments that are computed as risk assets 792 |
| 17 | Investments in risk capital | 26 - F | 0 | 0 |
| 18 | Investments in investment corporations | 26 - G | 0 | 0 |
| 19 | Funding for the purchase of own shares | 26 - H | 0 | 0 |
| 20 | Deferred charges and installments | 26 - J | 630 | BG16= 5,585 Minus: intangible assets 1,735; others assets that are computed as risk assets 42; intangible assets 3,143; other assets are computed as risk assets 35 |
| 21 | Worker's share in deferred profits (net) | 26 - L | 0 | 0 |
| 22 | Investments in pension plans for defined benefits | 26 - N | 0 | 0 |
| 23 | Investments in clearing houses | 26 - P | 1,231 | BG13= 25,523 Minus: Investments in subsidiaries |
78
| 23,325; Investments in associated companies 176; other investments that are computed as risk assets 792 | ||||
| Liabilities | 0 | 0 | ||
| 24 | Deferred profit taxes (debited) related to a commercial credit | 8 | 0 | 0 |
| 25 | Deferred profit taxes (debited) related to other intangibles | 9 | 0 | 0 |
| 26 | Liabilities of the pension plan for defined benefits without restrictive and unlimited access | 15 | 0 | 0 |
| 27 | Deferred profit taxes (debited) related to the pension plan for defined benefits | 15 | 0 | 0 |
| 28 | Deferred profit taxes (debited) related to others other than the foregoing | 21 | 0 | 0 |
| 29 | Subordinated obligations amount that meets with Exhibit 1-R | 31 | 0 | 0 |
| 30 | Subordinated obligations subject to transitory computed as Non-Fundamental Capital | 33 | 0 | 0 |
| 31 | Subordinated obligations amount that meets with Exhibit 1-S | 46 | 0 | 0 |
| 32 | Subordinated obligations subject to transitory that compute as complementary capital | 46 | 0 | 0 |
| 33 | Deferred profit tax (credited) related to deferred charges and installments | 26 - J | 0 | 0 |
| Shareholders' Equity | 0 | 0 | ||
| 34 | Paid-in capital that meets with Exhibit 1-Q | 1 | 34,798 | BG29 |
| 35 | Result of previous years | 2 | 52,747 | BG30= 76,752 Minus: other items of earned capital 24,004 |
| 36 | Result for valuation of cash flow hedging instruments of non-registered items with reasonable value | 3 | 0 | 0 |
| 37 | Other elements of the capital earned other than the foregoing | 3 | 24,004 | BG30= 76,752 Minus: Retained earnings 52,747 |
| 38 | Paid-in capital that meets with Exhibit 1-R | 31 | 0 | 0 |
| 39 | Paid-in capital that meets with Exhibit 1-S | 46 | 22,842 | BG26= 22,788 Plus: Other expenses amortization for bond issue 54 |
| 40 | Result for valuation of cash flow hedging instruments of non-registered items with reasonable value | 03, 11 | 0 | 0 |
| 41 | Accrued effect due to conversion | 3, 26 - A | 0 | 0 |
| 42 | Result for ownership of non-monetary assets | 3, 26 - A | 0 | 0 |
| Accounts in order | 0 | 0 | ||
| 43 | Positions in First Losses Schemes | 26 - K | 0 | 0 |
| Regulatory concepts not considered in the balance sheet | 0 | 0 | ||
| 44 | Reserves pending constitution | 12 | 0 | 0 |
| 45 | Profit or increase of the value of assets for the purchase of securitization positions (Originating Institutions) | 26 - C | 0 | 0 |
| 46 | Transactions that breach the provisions | 26 - I | 0 | 0 |
| 47 | Transactions with Relevant Related Persons | 26 - M | 0 | 0 |
| 48 | Adjustment for capital acknowledgment | 26 - O, 41, 56 | 0 | 0 |
79
| Table II.3 | |
| Notes to table III.2 "Regulatory concepts considered for the calculation of Net Capital components" | |
| Identifier | Description |
| 1 | Commercial credit. |
| 2 | Intangibles, without including commercial credit. |
| 3 | Credited differed profit taxes originating from fiscal losses and credits. |
| 4 | Benefits regarding the remnant of securitization transactions. |
| 5 | Investments of pension plan for defined benefits without unrestrictive and unlimited access. |
| 6 | Any share that the Institution acquires pursuant to the provisions of the Law, that have not been subtracted; considering those amounts acquired through investments in securities indexes and the amount corresponding to investments in investment corporations other than those provided by reference 18. |
| 7 | Investments in shares in corporations other than financial entities referred to by item f) of fraction I of Article 2 Bis 6 hereof, that are in turn, directly or indirectly shareholders of the Institution itself, of the financial group's holding company, of the remaining financial entities that comprise the group to which the Institution belongs or financial affiliates of the latter, considering those investments corresponding to investment corporations other than those provided by reference 18. |
| 8 | Direct investments in financial entities capital referred to by Article 89 of the Law and 12 and 8 of the Law Regulating Financial Groups, where the Institution owns more than 10% of the capital thereof. |
| 9 | Direct investments in financial entities capital referred to by Article 89 of the Law and 12 and 8 of the Law Regulating Financial Groups, where the Institution owns more than 10% of the capital thereof. |
| 10 | Direct investments in financial entities capital referred to by Article 89 of the Law and 12 and 8 of the Law Regulating Financial Groups, where the Institution owns more than 10% of the capital thereof. |
| 11 | Indirect investments in financial entities capital referred to by Article 89 of the Law and 12 and 8 of the Law Regulating Financial Groups, where the Institution owns more than 10% of the capital thereof. |
| 12 | Credited differed profit taxes originating from temporary differences. |
| 13 | Preventive estimates for credit risk up to a sum of 1.25% of the weighted assets by credit risk, corresponding to Transactions wherein the Standard Method is used to calculate the capital requirement by credit risk; and the positive difference of the Aggregate Admissible Reserves minus the Aggregate the Expected Losses, up to an amount that does not exceed of 0.6 per cent of the weighted assets by credit risk, corresponding to Transactions where the method based in internal qualifications is used to calculate the capital requirement by credit risk. |
| 14 | Investments in subordinated debt instruments, pursuant to the provisions of fraction I item b) of Article 2 Bis 6 hereof. |
| 15 | Investments in development or promotion multilateral organizations of an international nature pursuant to the provisions of fraction I item f) of Article 2 Bis 6 hereof that have a credit Qualification assigned by any of the issuer's Qualifying Institutions, equal or greater than long term Risk Degree 2. |
| 16 | Investments in shares of corporations related with the Institution under the terms of Articles 73, 73 Bis and 73 Bis 1 of the Law, including the amount corresponding to investments in investment corporations and investments in indices pursuant to the provisions of fraction I item g) of Article 2 Bis 6 hereof. |
| 17 | Investments made in development banking institutions in risk capital, pursuant to the provisions of fraction I item h) of Article 2 Bis 6 hereof. |
| 18 | Investments in shares, other than fix capital, of listed investment corporations, wherein the Institution holds more than 15 per cent of shareholders' equity of the aforementioned investment corporation, pursuant to fraction I item i) of Article 2 Bis 6, that have not been considered in the previous references. |
| 19 | Any type of contributions which resources are destined to the purchase of shares of the financial group's holding company, of the other financial entities that comprise the group to which the Institution belongs or the latter's financial affiliates, pursuant to the provisions of fraction I item l) of Article 2 Bis 6 hereof. |
| 20 | Differed charges and early payments. |
| 21 | Workers' share in credited differed profits pursuant to fraction I item p) of Article 2 Bis 6 hereof. |
| 22 | Investments of the pension plan for benefits defined that have to be deducted according with Article 2 Bis 8 hereof. |
80
| 23 | Investments or contributions, directly or indirectly, in the corporation's capital or in trust estate or other type of similar figures that have the purpose of setting off and liquidating Transactions executed in the stock market, unless the share in such corporations or trusts in the former pursuant to item f) fraction I of Article 2 Bis 6. |
| 24 | Owed differed taxes to profit originating from temporary differences related to commercial credit. |
| 25 | Owed differed taxes to profit originated from temporary differences related to other intangibles (other than commercial credit). |
| 26 | Liabilities of the pension plan for benefits defined related to investments of the pension plan for defined benefits. |
| 27 | Owed differed taxes originated from temporary differences related to the pension plan for defined benefits. |
| 28 | Owed differed profit taxes originated from temporary differences other than those of references 24, 25, 27 and 33 |
| 29 | Amount of subordinated obligations that meet with Exhibit 1-R hereof. |
| 30 | Amount of subordinated obligations subject to transience that are computed as Non-Fundamental Capital. |
| 31 | Amount of subordinated obligations that meet with Exhibit 1-S hereof. |
| 32 | Amount of subordinated obligations subject to transience that compute as ancillary capital. |
| 33 | Owed differed profit taxes originated from temporary differences related to differed charges and early payments. |
| 34 | Amount of capital contributed that meets the provisions of Exhibit 1-Q hereof. |
| 35 | Result of the previous fiscal years. |
| 36 | Result for the assessment of cash flow hedging instruments from covered entries assessed at reasonable value. |
| 37 | Net result and result for the assessment of titles available for sale. |
| 38 | Amount of capital contributed that meets the provisions of Exhibit 1-R hereof. |
| 39 | Amount of capital contributed that meets the provisions of Exhibit 1-S hereof. |
| 40 | Result for the assessment of cash flow hedging instruments from covered entries assessed at capitalized cost. |
| 41 | Accrued effect by conversion. |
| 42 | Result for ownership of non-monetary assets. |
| 43 | Positions related with the First Losses Scheme wherein risk is preserved or credit protection provided until certain limit of a position pursuant to fraction I item o) of Article 2 Bis 6. |
| 44 | Reserves pending constitution pursuant to the provisions of fraction I item k) of Article 2 Bis 6 hereof. |
| 45 | The amount resulting if on account of the purchase of securitization positions, the originating Institutions register a profit or an increase in the value of their assets with respect to assets previously registered in its balance, pursuant to the provisions of fraction I item c) of Article 2 Bis 6 hereof. |
| 46 | Transactions that infringe the provisions, pursuant to the provisions of fraction I item m) of Article 2 Bis 6 hereof. |
| 47 | The aggregate amount of Transactions Subject to Credit Risk owed by Relevant Related Persons pursuant to fraction I item r) of Article 2 Bis 6 hereof. |
| Table III.1 | ||
Positions exposed to market risks per risk factor | ||
| Concept | Amount of equivalent positions | Capital Requirement |
| Transactions in national currency with nominal rate | 50,367 | 4,029 |
| Transactions with debt instruments in national currency with surtax and reviewable rate | 6,456 | 516 |
| Transactions in national currency with real rate or denominated in UDIs | 11,269 | 902 |
| Transactions in national currency with yield rate referred to the increase of the General Minimum Wage | 11,482 | 919 |
| Positions in UDIs or with yield referred to INPC | 30 | 2 |
| Positions in national currency with yield rate referred to the increase of the General Minimum Wage | 0 | 0 |
| Transactions in foreign currency with nominal rate | 23,618 | 1,889 |
| Positions in foreign currency or with yield indexed to the exchange rate | 7,497 | 600 |
| Positions in shares or with yield indexed to the price of one share or set of shares | 853 | 68 |
| Positions in commodities | 0 | 0 |
| Impact Capital requirement for Gamma and Vega | 858 | 69 |
81
| Table III.2 | ||
| Assets weighted subject to credit risk by risk group | ||
| Concept | Assets weighted by risk | Capital Requirement |
| Group I -A (weighted to 0%) | 0 | 0 |
| Group I- A (weighted to 10%) | 0 | 0 |
| Group I-A (weighted to 20%) | 0 | 0 |
| Group II (weighted to 0%) | 16 | 1 |
| Group II (weighted to 20%) | 0 | 0 |
| Group II (weighted to 50%) | 0 | 0 |
| Group II (weighted to 100%) | 10,406 | 833 |
| Group II (weighted to 120%) | 0 | 0 |
| Group II (weighted to 150%) | 0 | 0 |
| Group III (weighted to 2.5%) | 0 | 0 |
| Group III (weighted to 10%) | 1,285 | 103 |
| Group III (weighted to 11.5%) | 0 | 0 |
| Group III (weighted to 20%) | 16,873 | 1,350 |
| Group III (weighted to 23%) | 260 | 21 |
| Group III (weighted to 50%) | 10,935 | 875 |
| Group III (weighted to 57.5%) | 693 | 55 |
| Group III (weighted to 60%) | 1 | 0 |
| Group III (weighted to 75%) | 82 | 7 |
| Group III (weighted to 100%) | 5,759 | 461 |
| Group III (weighted to 115%) | 0 | 0 |
| Group III (weighted to 120%) | 0 | 0 |
| Group III (weighted to 138%) | 0 | 0 |
| Group III (weighted to 150%) | 0 | 0 |
| Group III (weighted to 172.5%) | 0 | 0 |
| Group IV (weighted to 0%) | 0 | 0 |
| Group IV (weighted to 20%) | 9,456 | 756 |
| Group V (weighted to 10%) | 0 | 0 |
| Group V (weighted to 20%) | 3,687 | 295 |
| Group V (weighted to 50%) | 0 | 0 |
| Group V (weighted to 115%) | 0 | 0 |
| Group V (weighted to 150%) | 1,564 | 125 |
| Group VI (weighted to 20%) | 0 | 0 |
| Group VI (weighted to 50%) | 19,674 | 1,574 |
| Group VI (weighted to 75%) | 7,799 | 624 |
| Group VI (weighted to 100%) | 49,091 | 3,927 |
| Group VI (weighted to 120%) | 0 | 0 |
82
| Group VI (weighted to 150%) | 0 | 0 |
| Group VI (weighted to 172.5%) | 0 | 0 |
| Group VII-A (weighted to 10%) | 0 | 0 |
| Group VII-A (weighted to 11.5%) | 0 | 0 |
| Group VII-A (weighted to 20%) | 14,995 | 1,200 |
| Group VII-A (weighted to 23%) | 1,196 | 96 |
| Group VII-A (weighted to 50%) | 2,016 | 161 |
| Group VII-A (weighted to 57.5%) | 0 | 0 |
| Group VII-A (weighted to 100%) | 134,707 | 10,777 |
| Group VII-A (weighted to 115%) | 15,849 | 1,268 |
| Group VII-A (weighted to 120%) | 25 | 2 |
| Group VII-A (weighted to 138%) | 0 | 0 |
| Group VII-A (weighted to 150%) | 11,824 | 946 |
| Group VII-A (weighted to 172.5%) | 251 | 20 |
| Group VII-B (weighted to 0%) | 0 | 0 |
| Group VII-B (weighted to 20%) | 202 | 16 |
| Group VII-B (weighted to 23%) | 0 | 0 |
| Group VII-B weighted to 50%) | 0 | 0 |
| Group VII-B weighted to 57.5%) | 0 | 0 |
| Group VII-B (weighted to 100%) | 19,214 | 1,537 |
| Group VII-B (weighted to 115%) | 0 | 0 |
| Group VII-B (weighted to 120%) | 0 | 0 |
| Group VII-B (weighted to 138%) | 0 | 0 |
| Group VII-B (weighted to 150%) | 0 | 0 |
| Group VII-B (weighted to 172.5%) | 0 | 0 |
| Group VIII (weighted to 115%) | 4,921 | 394 |
| Group VIII (weighted to 150%) | 2,578 | 206 |
| Group IX (weighted to 100%) | 65,884 | 5,271 |
| Group IX (weighted to 115%) | 0 | 0 |
| Group X (weighted to 1250%) | 2,111 | 169 |
| Other Assets (weighted to 0%) | 0 | 0 |
| Other Assets (weighted to 100%) | 28,694 | 2,296 |
| Securitization with Risk Degree 1 (weighted at 20%) | 45,392 | 3,631 |
| Securitization with Risk Degree 2 (weighted at 50%) | 0 | 0 |
| Securitization with Risk Degree 3 (weighted at 100%) | 0 | 0 |
| Securitization with Risk Degree 4 (weighted to 350%) | 0 | 0 |
| Securitization with Risk Degree 4, 5, 6 or Non-qualified (weighted to 1250%) | 0 | 0 |
| Re-securitization with Risk Degree 1 (weighted at 40%) | 0 | 0 |
| Re-securitization with Risk Degree 1 (weighted at 100%) | 0 | 0 |
| Re-securitization with Risk Degree 1 (weighted at 225%) | 0 | 0 |
| Re-securitization with Risk Degree 1 (weighted at 650%) | 0 | 0 |
| Re-securitization with Risk Degree 4, 5 or Not qualified (weighted at 1250%) | 0 | 0 |
83
| Table III.3 | ||
| Assets weighted subject to operational risk | ||
| Method | Assets weighted by risk | Capital Requirement |
| Basic | 64,255 | 5,140 |
| Average of requirement by market and credit risk of the last 36 months | Average of annual positive net income of the last 36 months | |
| 41,125 | 34,275 | |
| Table IV.1 | ||
| Main characteristics of titles that are part of the Net Capital | ||
| Reference | Characteristic | Options |
| 1 | Issuer | Banco Santander (Mexico), S. A. |
| 2 | ISIN, CUSIP or Bloomberg Identifier | |
| 3 | Legal frame | Securities Market Law |
| Regulation treatment | ||
| 4 | Level of capital with transitory | N.A |
| 5 | Level of capital without transitory | Fundamental Capital |
| 6 | Instrument level | Credit Institution without consolidating |
| 7 | Instrument type | Series F Shares |
| 8 | Amount acknowledge of regulatory capital | $9,514,367,512.00 |
| 9 | Instrument's par value | $0.10 |
| 9A | Instrument's currency | Mexican Pesos |
| 10 | Accounting qualification | Capital |
| 11 | Date of issuance | N.A |
| 12 | Instrument´s term | Perpetual |
| 13 | Date of expiration | Without expiration |
| 14 | Early payment clause | No |
| 15 | First date of early payment | N.A |
| 15A | Regulatory or fiscal events | No |
| 15B | Liquidation price of the early payment clause | N.A |
| 16 | Subsequent early payment dates | N.A |
| Yields / Dividends | ||
| 17 | Type of yield/dividend | Variable |
| 18 | Interest rate/dividend | Variable |
| 19 | Cancellation of dividends clause | No |
| 20 | Payment discretion | Mandatory |
| 21 | Interest increase clause | No |
| 22 | Yields/Dividends | Not Accruable |
| 23 | Convertibility of the instrument | N.A |
| 24 | Convertibility conditions | N.A |
| 25 | Degree of convertibility | N.A |
| 26 | Conversion rate | N.A |
| 27 | Instrument convertibility rate | N.A |
| 28 | Type of convertibility financial instrument | N.A |
| 29 | Instrument issuer | N.A |
| 30 | Write-down clause | No |
| 31 | Conditions for write-down | N.A |
| 32 | Degree of write-down | N.A |
| 33 | Temporality of write-down | N.A |
| 34 | Mechanism for temporary write down | N.A |
| 35 | Subordination position in the event of liquidation | Creditors in general |
| 36 | Breach characteristics | No |
| 37 | Description of breach characteristics | N.A |
84
| Table IV.1.2 | ||
| Main characteristics of titles that are part of the Net Capital | ||
| Reference | Characteristic | Options |
| 1 | Issuer | Banco Santander (Mexico), S. A. |
| 2 | ISIN, CUSIP or Bloomberg Identifier | MX00BS030007 |
| 3 | Legal frame | Securities Market Law |
| Regulation treatment | ||
| 4 | Level of capital with transitory | N.A |
| 5 | Level of capital without transitory | Fundamental Capital |
| 6 | Instrument level | Credit Institution without consolidating |
| 7 | Instrument type | Series B Shares |
| 8 | Amount acknowledge of regulatory capital | $1,833,249,750.00 |
| 9 | Instrument's par value | $0.10 |
| 9A | Instrument's currency | Mexican Pesos |
| 10 | Accounting qualification | Capital |
| 11 | Date of issuance | N.A |
| 12 | Instrument´s term | Perpetual |
| 13 | Date of expiration | Without expiration |
| 14 | Early payment clause | No |
| 15 | First date of early payment | N.A |
| 15A | Regulatory or fiscal events | No |
| 15B | Liquidation price of the early payment clause | N.A |
| 16 | Subsequent early payment dates | N.A |
| Yields / Dividends | ||
| 17 | Type of yield/dividend | Variable |
| 18 | Interest rate/dividend | Variable |
| 19 | Cancellation of dividends clause | No |
| 20 | Payment discretion | Mandatory |
| 21 | Interest increase clause | No |
| 22 | Yields/Dividends | Not Accruable |
| 23 | Convertibility of the instrument | N.A |
| 24 | Convertibility conditions | N.A |
| 25 | Degree of convertibility | N.A |
| 26 | Conversion rate | N.A |
| 27 | Instrument convertibility rate | N.A |
| 28 | Type of convertibility financial instrument | N.A |
| 29 | Instrument issuer | N.A |
| 30 | Write-down clause | No |
| 31 | Conditions for write-down | N.A |
| 32 | Degree of write-down | N.A |
| 33 | Temporality of write-down | N.A |
| 34 | Mechanism for temporary write down | N.A |
| 35 | Subordination position in the event of liquidation | Creditors in general |
| 36 | Breach characteristics | No |
| 37 | Description of breach characteristics | N.A |
85
| Table IV.1.3 |
| Main characteristics of titles that are part of the Net Capital |
| Reference | Characteristic | Options |
| 1 | Issuer | Banco Santander (México), S. A. |
| 2 | ISIN, CUSIP or Bloomberg Identifier | Reg S: USP1507SAD91 / 144A: US05969BAB99 |
| 3 | Legal frame | New York Law, in case that a "TRIGGER EVENT" takes to a "WRITE DOWN" or "Mexican Regulatory Event" which involves a suspension period and occurs based in mexican regulatory determination according to the Mexican law. The ranking and Subordinated Notes would be determined according to the Mexican law |
| Regulation treatment | ||
| 4 | Level of capital with transitory | N.A |
| 5 | Level of capital without transitory | Complementary |
| 6 | Instrument level | Credit Institution without consolidating |
| 7 | Instrument type | 5.95% Tier 2 Subordinated Capital Notes due 2024 |
| 8 | Amount acknowledge of regulatory capital | $22,841,795,112.16 |
| 9 | Instrument's par value | $22,423,310,000.00 |
| 9A | Instrument's currency | USD |
| 10 | Accounting qualification | Subordinated credit notes |
| 11 | Date of issuance | 27/12/2013 |
| 12 | Instrument´s term | Maturity |
| 13 | Date of expiration | 30/01/2024 |
| 14 | Early payment clause | Yes ("Optional Redemption") |
| 15 | First date of early payment | 30/01/2019 (only date of call) |
| 15A | Regulatory or fiscal events | Yes ("Withholding Tax Redemption" y "Special Event Redemption" which includes: "Capital Event" y "Tax Event") |
| 15B | Liquidation price of the early payment clause | accrued and unpaid interest |
| 16 | Subsequent early payment dates | N/A (only on the first date of early payment). |
| Yields / Dividends | ||
| 17 | Type of yield/dividend | Variable |
| 18 | Interest rate/dividend | 5.95% |
| 19 | Cancellation of dividends clause | N.A |
| 20 | Payment discretion | Mandatory |
| 21 | Interest increase clause | No |
| 22 | Yields/Dividends | Not Accruable |
| 23 | Convertibility of the instrument | No Convertible |
| 24 | Convertibility conditions | N.A |
| 25 | Degree of convertibility | N.A |
| 26 | Conversion rate | N.A |
| 27 | Instrument convertibility rate | N.A |
| 28 | Type of convertibility financial instrument | N.A |
| 29 | Instrument issuer | N.A |
| 30 | Write-down clause | Yes |
| 31 | Conditions for write-down | If a Trigger Event occurs the following write-downs shall be will deemed to have occurred if (i) the CNBV publishes a determination, in its official publication of capitalization levels for Mexican banks, that our Tier 1 Capital 1 Ratio (“Fundamental Capital”), as calculated pursuant to the applicable Mexican |
86
| Capitalization Requirements, is equal to or below 4.5% (four point five percent), (ii) both (A) the CNBV notifies us that it has made a determination, pursuant to Article 29 Bis of the Mexican Banking Law, that a cause for revocation of our license has occurred resulting from (y) our non-compliance with corrective measures imposed by the CNBV pursuant to the Mexican Banking Law, or (z) our non-compliance with the capitalization requirements set forth in the Mexican Capitalization Requirements and (B) we have not cured such cause for revocation, by (a) complying with such corrective measures, or (b)(1) submitting a capital restoration plan to, and receiving approval of such plan by, the CNBV, (2) pledging to the Mexican governmental authorities, to secure performance of such capital restoration plan, seventy five percent (75%) of the Issuer’s aggregate issued and outstanding shares and (3) not being classified in Class III, IV, or V, or (c) remedying any capital deficiency, in the case of (a), (b) and (c), on or before the 15th business day in Mexico following the date on which the CNBV notifies us of such determination; or (iii) the Financial Stability Committee, which is a committee formed by the CNBV, the Ministry of Finance and Public Credit, the Mexican Central Bank and the Mexican Savings Protection Agency, determines pursuant to Article 122 Bis of the Mexican Banking Law that financial assistance is required by us to avoid revocation of our license for our failure to comply with corrective measures, comply with capitalization requirements or to satisfy certain liabilities when due, as a means to maintain the solvency of the Mexican financial system or to avoid risks affecting the Mexican payments system and such determination is either made public or notified to us. | ||
| 32 | Degree of write-down | Partial, until restore adequate capital levels |
| 33 | Temporality of write-down | Permanent |
| 34 | Mechanism for temporary write down | “Write-Down Amount” means an (i) amount that would be sufficient, together with any concurrent prorata write down of any other loss-absorbing instruments issued by us and then outstanding, to return our Capital Básico 1 to the levels of Capital Básico 1 required under Section IX, b), 2 of Annex 1-S of the General Rules Applicable to Mexican Banks (currently 7% (seven percent)), or (ii) if any Write-Down of the Current Principal Amount, together with any concurrent pro rata write down of any other loss absorbing instruments issued by us and then outstanding, would be insufficient to return our Fundamenlta Capital to the levels of Fundamental Capital required under Section IX, b), 2 of Annex 1-S of the General Rules Applicable to Mexican Banks (currently 7% (seven percent)), the amount necessary |
87
| to reduce the Current Principal Amount of each outstanding Note to zero. | ||
| 35 | Subordination position in the event of liquidation | The Notes constitute subordinated indebtedness, and (i) will be subordinate and junior in right of payment and in liquidation to all of our present and future senior indebtedness, (ii) will rank pari passu with all other unsecured subordinated preferred indebtedness and (iii) will be senior to subordinated non-preferred indebtedness and all classes of our equity or capital stock. |
| 36 | Breach characteristics | N.A |
| 37 | Description of breach characteristics | N.A |
| Table V.2 | |
| Assistance in filling in the information regarding the characteristics of the titles that are part of the Net Capital | |
| Reference | Description |
| 1 | Credit institution that issues titles that are part of the Net Capital |
| 2 | Title identifier or code that is part of the Net Capital (ISIN, CUSIP or ID number of international value) |
| 3 | Legal framework with which the title must comply, as well as the laws to which it shall be subject. |
| 4 | Level of capital that corresponds to the title that shall be subject to transience established pursuant to Article Third Transitory, of Resolution 50th. |
| 5 | Level of capita that corresponds to the title that meets exhibit 1-Q, 1-R or 1-S hereof. |
| 6 | Level within the group to which the title is included. |
| 7 | Type of Capital Instrument or title representing the capital stock that is included as part of the Net Capital. In the event of titles subject to the transiency established pursuant to Article Third Transitory, established in Resolution 50th, refers to the subordinated obligations described on Article 64 of the Credit Institutions Act. |
| 8 | Amount of the Capital Instrument or title representing the capital stock, that is acknowledged in the Net Capital pursuant to Article 2 bis 6 hereof, in the event of reference 5 either Fundamental Capital or Non-Fundamental Capital; and pursuant to Article 2 bis 7 hereof in the event such reference is Ancillary. in any other event, it shall be the amount corresponding pursuant to the provisions of Article Third Transitory of Resolution 50th. |
| 9 | Title's par value in Mexican pesos. |
| 9A | Currency used to express the title's par value in Mexican pesos pursuant to international standard ISO 4217 |
| 10 | Accounting classification of the title that is part of the Net Capital. |
| 11 | Date of issuance of the title that is part of the Net Capital |
| 12 | Specify if the title has expiration or is at perpetuity |
| 13 | Expiration date of the title, without considering the dates of early payment. |
| 14 | Specify if the title includes a early payment clause by the issuer wherein the right to pay the title early is exercised with prior authorization from Banco de Mexico. |
| 15 | Date when the issuer may, for the first time, exercise the right to pay the title early prior authorization from Banco de Mexico. |
| 15A | Specify if the early payment clause considers regulatory or fiscal events. |
| 15B | Specify the liquidation price of the early payment clause. |
| 16 | Dates when the issuer may, subsequently to the one specified in reference 15, exercise the right of title early payment prior authorization from Banco de Mexico |
| 17 | Specify the type of yield/dividend that shall be held during the entire term of the title. |
| 18 | Interest rate or index referred to by the title's yield/dividend. |
| 19 | Specify if the title includes clauses that forbid payment of dividends to the holders of titles representing the capital stock when failing to perform payment of a coupon or dividend of any capital instrument. |
88
| 20 | issuer's discretionarily for payment of the title's interests or dividends. If the Institution at any time may cancel payment of yields or dividends it must be selected (entirely Optional); if it may only cancel in some situations (partially Optional) or if the credit institutions may not cancel payment (Mandatory) |
| 21 | Specify if in the title there is a clause that generates incentives that the issuer may early pay, as clauses of increase of interests known as "Step-Up". |
| 22 | Specify if yields or dividends of the title are accruable or not. |
| 23 | Specify if the title is convertible or not in ordinary shares of the multiple banking institutions or the Financial Group. |
| 24 | Conditions under which the title is convertible into ordinary shares of the multiple banking institution or Financial Group. |
| 25 | Specify if the title is wholly converted or only partially when it meets the contractual conditions to convert. |
| 26 | Amount per share considered for converting the title into ordinary shares of the multiple banking institution or the Financial Group into the currency on which such instrument was issued. |
| 27 | Specify if the conversion is mandatory or optional. |
| 28 | Type of shares into which the title is converted. |
| 29 | Issuer of the instrument into which the title is converted. |
| 30 | Specify if the title has the principal cancellation characteristics. |
| 31 | Conditions under which the title has a principal cancellation characteristics. |
| 32 | Specify if once the hypothesis of the value decrease clause occurs, the title decreases value in its aggregate or only partially. |
| 33 | Specify if once the hypothesis of the value decrease clause occurs, the instrument decreases value permanently or temporarily |
| 34 | Explain the temporary value decrease mechanism. |
| 35 | Most subordinated position to which the capital instrument is subordinated that corresponds to the type of instrument in liquidation. |
| 36 | Specify whether there is or not characteristics of the title that fails to meet with the conditions established in exhibits 1-Q, 1-R and 1-S hereof. |
| 37 | Specify the characteristics of the title that fail to meet the characteristics established in exhibits 1-Q, 1-R and 1-S hereof. |
The information relating to Annex 1-O Capitalization Ratio Santander Consumo and Santander Hipotecario is available on the websitewww.santander.com.mx/ir
| 15. Risk Diversification |
| Pursuant to the general rules for risk diversification in the performance of borrowing and lending transactions applicable to credit institutions, published in the Federal official Gazette on April 30, 2003, the following information with respect to credit risk transactions as of December 31, 2015, is provided: |
| - At December 31, 2015 did not have financing granted to debtors or groups of individuals representing single common risk is greater the amount of core capital (the month immediately preceding the date that is reported) Bank. |
| - Loans granted to the three major debtors or groups of persons representing a common risk for a total amount of $36,121 representing the 44.97% of the basic capital of the Bank. |
16. Internal and external Sources of Liquidity
Internal sources of liquidity in domestic and foreign currency come from the different savings products that Banco Santander México offers to its clients; mainly checking accounts and time deposits.
An additional internal source of liquidity is the collection of fees, interests and principal amounts of the loans that the Bank grants to its clients.
With respect to external sources of liquidity, the Bank has access to the local and foreign capital markets through different alternatives that range from the issuance of senior and subordinated debt as well as the issuance of other debt or equity instruments. Santander México also obtains funding from other institutions including the Mexican Central Bank, development banks, commercial banks, and other institutions.
Santander México may also obtain liquidity via sale and repurchase agreements (short-term repos) over securities it holds in its investment portfolio. Additionally, the Bank could obtain liquidity through the sale of assets.
89
17. Dividends Policy
Santander México performs the payment of dividends pursuant to the applicable legal, administrative, fiscal and accounting rules, based in the results obtained by Santander México. The Board of Directors proposes the payment of dividends at the Ordinary General Stockholders’ Meeting, which is the body that orders and approves the payment of dividends to the stockholders of the institution.
18. Treasury Policies
The activities of Santander México’s treasury are performed pursuant to the following:
| a) | In compliance with the provisions issued by the different authorities of the financial system for bank institutions, such as guidelines for lending and borrowing transactions, accounting rules, liquidity ratios, regulatory matching, capacity of the payment systems, etc. |
| b) | Internal limits for market, liquidity and credit risks, i.e., there are limits for the management of the assets and liabilities of the bank with respect to the market and liquidity risk derived from such management, as well as the limits regarding counterparty risk derived from the daily transactions. |
| c) | Compliance with the guidelines stipulated by national and international standard agreements regarding transactions performed in markets. |
| d) | Sound market practices. |
| e) | Strategies proposed in the banks internal committees. |
| f) | Compliance with the operation procedures of the institution. |
| 19. Shareholding | ||
| Subsidiaries | % of interest | |
| Banco Santander (México), S.A. | 99.99% | |
| Casa de Bolsa Santander, S.A. de C.V. | 99.97% |
20. Internal Control
The activities of Santander México are governed by a series of guidelines established by Banco Santander (España), the holding company of Santander México, whose head offices are located in the city of Madrid, and the Mexican laws.
For the compliance of the rules in effect, Santander México has developed and implemented an Internal Control Model (ICM) which includes the participation of the Board of Directors, the statutory advisor, the Audit Committee, the Internal Audit Department, the General Direction, the Internal Control Unit and the Regulatory Control Department.
The ICM is based in the identification and documentation of the main risks and the periodic assessment of the controls that are created to mitigate such risks. ICM guarantees, among other aspects, the design, establishment and updating of measures and controls that promote the compliance with the internal and external rules and the proper operation of the data processing systems.
The internal control system includes:
The implementation of an organizational structure has allowed the development and growth of the group. Such structure is constituted as follows:
CEO and General Direction
The following functions report to the CEO and General Direction:
| § | Vice-president of Finance and Administration: |
| Ø | Deputy General Direction of Intervention and Management Control |
| Ø | Deputy General Direction of Technology, Operations and Quality |
| Ø | Deputy General of Human Resources, Organization and Costs |
| Ø | Deputy General Direction of Legal Affairs |
| Ø | Counsel for Legal Affairs |
| Ø | Executive Direction of Competitive Strategy |
| Ø | Executive Direction of Financial Management |
| Ø | Executive Direction of Investor Relations |
| Ø | Executive Direction of Financial Strategy |
90
| § | Vice-president of Commercial Banking: |
| Ø | Deputy General Direction of Commercial Strategy |
| Ø | Deputy General Direction of Companies and Institutions Banking |
| Ø | Deputy General Direction of Particulars |
| Ø | Deputy General Direction of Payment Systems |
| Ø | Deputy General Direction of Private Banking |
| Ø | Executive Direction of Universities-Universia |
| Ø | Executive Direction of Analysis and Commercial Planning |
| Ø | Executive Director of Business Strategy Equity Products |
| Ø | Executive Director of Digital Multi-channel Banking |
| § | Deputy General Director of Risk |
| § | Deputy General Director of Wholesale Banking |
| § | Deputy General Director of Public Affairs and Marketing |
| § | Executive Direction of Internal Audit |
| § | Executive Direction of Advertising and Corporate Image |
| § | Executive Direction Corporate of Recoveries and Assets Restructuring |
The roles and responsibilities of each direction have been stipulated in order to optimize the performance of the activities of Santander México.
The Organization area related to the Executive Direction of Processes and Change Management, via manuals, circulars and bulletins, governs the activities of the group; likewise, the Regulatory Control Department has established a general Code of Conduct that every employee of Santander México has to follow.
The structure of Santander México includes the constitution of a Board of Directors, which establishes the objectives, the policies and general procedures of Santander México, the appointment of directors and the constitution of committees that are to supervise the development of the activities of Santander México.
The committees that supervise the development of the entities that constitute Santander México, created by the Board of Directors, are the following:
| § | Audit Committee |
| § | Corporate Practices, Nominating and Compensation Committee |
| § | Integral Risk management Committee |
| § | Communication and Control Committee |
The registration, control and storage of the daily activities of Santander México are carried out by systems mainly designed and focused on the banking and brokerage activity. The common platform for such purposes is known as ALTAIR and it is applied by all the entities in Latin America that are part of Banco Santander (España).
Loans portfolio and transactions of commercial banking of the group are controlled and registered at ALTAIR. Treasury activities are controlled and registered in computer platforms and the operations are centralized for its accounting registration in ALTAIR. Such platforms comply with the parameters stipulated by the CNBV with respect to reliability and accuracy.
Santander México is regulated by the CNBV, and therefore, the financial statements are prepared according to the accounting practices stipulated by such Commission via the issue of accounting circulars, general official letters and particular official letters regarding the accounting registration of transactions. For such purposes, the accounting system of Santander México has been structured with an accounts catalog stipulated by the Commission, and all the reports come from such system and comply with the applicable provisions.
Within Santander México, there is an independent area of Internal Audit, whose mission is to oversee the compliance, efficacy and efficiency of the internal control systems of the Group, as well as the reliability and quality of the accounting information.
To achieve so, Internal Audit verifies that the risks inherent to the activity of Santander México are properly covered and the policies stipulated by the Direction, the applicable internal and external regulations and the procedures are observed.
The results of the activities of Internal Audit are reported on regular basis to the General Direction, the Audit Committee and the Board of Directors. Among other issues, the results of the audits performed to the different business units of the companies that constitute Santander México and the follow up of the recommendations provided to the different areas and/ or entities are informed.
91
Internal Audit has a quality system oriented to the client satisfaction focus on continuous process improvement, which has been subject to a successful Quality Assurance Review (QAR) during 2014
In summary, Internal Control of Santander México includes the continuous development, implementation and updating of an internal control model where all the areas of the group have an active role.
During the quarter, there have been no changes to the internal controls and internal audit guidelines.
| 21. Accounting differences between CNBV regulations in México and the Circular issued by Bank of Spain | ||
| Earnings of Grupo Financiero Santander under CNBV regulations in México | 14,141 | |
| Temporary differences in classification of hedging instruments | 479 | (a) |
| Income and expenses from the Headquarter | (724) | (b) |
| Other differences | 674 | |
| Earnings of Grupo Financiero Santander under the regulations set forth in the Circular issued by the Bank of Spain | 14,570 | |
| (a) Certain derivative financial instruments are reclassified from hedging instruments to trading instruments since they hedge an intercompany item that is not valid for global consolidation purposes. |
| (b) Allocation of corporate income and expenses performed by the Corporate Head Office to its subsidiaries, pursuant to the rules and policies of Bank of Spain. |
| 22. Transactions with related parties | |
| Receivable | |
| Funds available | 103 |
| Derivatives (asset) | 40,146 |
| Performing loan portfolio | 1,535 |
| Other receivables, (net) | 5,981 |
| Payable | |
| Demand deposits | 1,544 |
| Credit instruments issued | 850 |
| Creditors under sale and repurchase agreements | 25 |
| Derivatives (liability) | 37,931 |
| Other payables | 3,806 |
| Creditors from settlement of transactions | 6,453 |
| Subordinated debentures | 18,440 |
| Revenues | |
| Interest | 74 |
| Commissions and fee income | 5,474 |
| Other | 74 |
| Net gain (loss) on financial assets and liabilities | 1,242 |
| Expenses | |
| Interest | 1,047 |
| Administrative expenses | 382 |
| Technical assistance | 1,710 |
| Commissions and fee expense | 225 |
| 23. Interests on loan portfolio |
| As of December 31, 2015, the consolidated statement of i includes in the item "Interest income " Ps.49,152 million that correspond to interests from the loan portfolio of Banco Santander (México), S.A., Santander Consumo, S.A. de C.V. SOFOM E.R., Santander Hipotecario, S.A. de C.V. SOFOM E.R. and Santander Vivienda, S.A. de C.V. SOFOM E.R. |
92
| 24. | Integral Risk Management(unaudited) |
Risk management is considered by Grupo Financiero Santander as a competitive element of strategic nature with the purpose of maximizing the value for the stockholder. This management is defined, from a conceptual and organizational sense, as a comprehensive management of the different risks (market risk, liquidity risk, credit risk, counterparty risk, operative risk, legal risk and technological risk) assumed by Grupo Financiero Santander for the development of its activities. The management of the risk inherent to transactions is essential for understanding and determining the behavior of the financial condition of Grupo Financiero Santander and the creation of long-term value.
In order to comply with the provisions regarding the Comprehensive Risk management applicable to credit institutions, issued by the National Banking and Exchange Commission, the Board of Directors agreed to create the Comprehensive Risk Management Committee of Grupo Financiero Santander, to work pursuant to the rules set by such regulations. This Committee gathers every month and verifies that the transactions are according to the objectives, policies and procedures approved by the Board of Directors for the Comprehensive Risk Management.
The Comprehensive Risk management Committee delegates in the Comprehensive Risk Management Unit the responsibility for the implementation of procedures for the measure, administration and control of risks according to the applicable policies; such Unit has the faculty to authorize amounts greater than the stipulated limits and in such cases, the Board of Directors shall be informed on such deviations.
Market Risk
The Market Risk Management department of the Comprehensive Risk management Unit is responsible for recommending the policies on market risk management of Grupo Financiero Santander, and to establish the parameters for risk measuring, and to provide reports, analysis and assessments to the senior management, to the Comprehensive Risk management Committee and to the Board of Directors.
The market risk management is to identify measure, monitor and control risks arising from fluctuations in interest rates, exchange rates, prices and other market risk factors in currency, money, capital and derivative markets that are exposed the positions that belong to Grupo Financiero Santander.
The market risk measurement quantifies the potential variation in the value of the positions as a consequence of changes in the market risk factors.
Depending on the nature of the activities of each business unit, debt and capital instruments are registered as securities for trade, securities available for sale and or securities held to maturity. The main characteristic that identifies securities available for sale is their permanent nature and they are managed as an structural part of the balance sheet. Grupo Financiero Santander has established provisions that all securities available for sale must fulfill, as well as adequate controls for the compliance of such provisions.
Whenever significant risks are identified, they are measured and limits are allocated in order to assure an adequate control. Global measurement of risk is carried out via a combination of the methodology applied to Portfolios for Trade and to the management of Assets and Liabilities.
Trading Books
In order to measure the risk in a global approach, the methodology of Value at Risk (“VaR”) is used. VaR is defined as the statistical estimate of the potential loss of value of a given position, during certain period and at certain confidence level. VaR provides a universal measure of the level of exposure of the different risk portfolios; it allows the comparison of the risk level assumed in different securities and markets and expresses the level of each portfolio through a unique figure in economic units.
VaR is calculated via historical simulation, with a 521 working-days window (520 percentage changes) and a one-day horizon. The calculation is performed from a series of simulated gains and losses with 1% percentile at constant pesos and with pesos decreasing on an exponential basis, with a decrease factor that is reviewed on annual basis, the most conservative measure is the one to be reported. A confidence level of 99% is assumed.
Note that the historical simulation model is limiting to assume that the recent past represent the near future.
The Value at Risk as of the end of fourth quarter of 2015 (unaudited) amounted to:
93
| Bank and Brokerage | ||
| VaR (thousands of mexican pesos) | % | |
| Trading Desks | 69,725.05 | 0.07% |
| Market Making | 58,240.89 | 0.06% |
| Proprietary Trading | 21,726.44 | 0.02% |
| Risk factor | 69,725.05 | 0.07% |
| Interest rate | 59,867.56 | 0.06% |
| Foreign exchange | 4,295.92 | 0.00% |
| Equity | 5,464.94 | 0.01% |
| * % of VaR with respect to Net Capital | ||
The Value at Risk for the average the fourth quarter of 2015 (unaudited) amounted to:
| Bank and Brokerage | ||
| VaR (thousands of pesos) | % | |
| Trading Desks | 76,538.74 | 0.07% |
| Market Making | 64,648.09 | 0.06% |
| Proprietary Trading | 27,585.58 | 0.03% |
| Risk factor | 76,538.74 | 0.07% |
| Interest rate | 72,648.93 | 0.07% |
| Foreign exchange | 4,159.72 | 0.00% |
| Equity | 5,768.98 | 0.01% |
| VaR with respect to Net Capital | ||
Likewise, monthly simulations of gains or losses of portfolios are carried out by revaluating such portfolios under different scenarios (Stress Test). Such estimates are generated using two different methods:
§ Applying to risk factors the percentage changes observed in certain periods including relevant market turbulences.
§ Applying to risk factors changes that depend on the volatility of each risk factor.
On a monthly basis “back testing” is carried out to compare daily gains and losses that would have been observed is the same positions had been maintained, taking into account only the change in value at risk in order to be able to fine tune the models. Even though these reports are prepared on a monthly basis, they include daily tests.
Assets and Liabilities Management
Commercial banking activities of Grupo Financiero Santander generate important balance sheet amounts. The Assets and Liabilities Committee (“ALCO”) is responsible for determining the guidelines for the management of financial margin risk, net worth value and liquidity that must be followed by the different commercial portfolios. Pursuant to this approach, the General Direction of Finances has the responsibility to execute the strategies defined by the Assets and Liabilities Committee in order to modify the risk profile of the commercial portfolio by following the corresponding policies. Compliance with information requirements for interest rate, Exchange rate and liquidity risks is fundamental.
As part of the financial management of Grupo Financiero Santander, sensitivity to Net Interest Income (“NIM”) and Market Value of Equity (“MVE”) of the different balance sheet items is analyzed in comparison to variations in interest rates. This sensitivity is derived from the difference between maturity dates of assets and liabilities and the dates interest rates are modified. The analysis is performed from the classification of each item sensitive to interest rate throughout time, according to their repayment, maturity or contractual modification of the applicable interest rate
| Sensitivity NIM | Sensitivity MVE | ||||||||
| Bank and Brokerage | Oct-15 | Nov-15 | Dec-15 | Average | Oct-15 | Nov-15 | Dec-15 | Average | |
| Balance MXN GAP | 57% | 39% | 44% | 47% | 59% | 61% | 61% | 60% | |
| Scenario | (100bp) | (100 bp) | (100 bp) | N/A | +100bp | +100 bp | +100 bp | N/A | |
| Balance USD GAP | 43% | 67% | 39% | 50% | 75% | 48% | 38% | 54% | |
| Scenario | (100)bp | (100)bp | (100)bp | N/A | (100)bp | (5000%) | (5000%) | N/A | |
94
Using simulation techniques, the predictable change of the net interest income and the market value of equity are measured in different interest rate scenarios, and their sensitivity under extreme movement of such scenarios, as of the end of the fourth quarter of 2015:
| MM MXN | Sensitivity NIM | Sensitivity MVE | |||||||
| Bank and Brokerage | Scenario | Total | Derivatives | Non Derivatives | Scenario | Total | Derivatives | Non Derivatives | |
| Balance MXN GAP | (100) | (666) | (309) | (357) | 100 | (3,454) | 673 | (4,128) | |
| Balance USD GAP | (100) | (134) | 159 | (294) | (50) | (232) | 371 | (603) | |
The Assets and Liabilities Committee adopts investment and hedging strategies in order to maintain such sensitivities within the target range.
Limits
Limits are used to control global risk of the financial group derived from each portfolio and books. The structure of limits is used to control exposures and to establish the total risk authorized to business units. These limits are established for VaR, Loss alert, maximum loss, equivalent volume of interest rate, delta equivalent in equity, open foreign currency positions, sensitivity of net interest income and sensitivity of market value of equity.
Liquidity Risk
Liquidity risk is related to the ability of Grupo Financiero Santander to finance acquired commitments at reasonable market prices, as well as to fulfill business plans with stable financing sources. Risk factors may be external (liquidity crisis) and internal due to excessive concentration of maturities.
Grupo Financiero Santander carries out a coordinated management of maturities of assets and liabilities, and oversees the maximum timing difference profiles. This monitoring is based in the analysis of maturities of assets and liabilities, both contractual and managerial. Grupo Financiero Santander realizes a control for the maintenance of a sufficient quantity of liquid assets to guarantee a horizon of survival during a minimum of days facing a scene of stress of liquidity without resorting to additional financing sources. The risk of Liquidity is limited in terms of a minimal period of days established for local, foreign and consolidated currencies. It is necessary to indicate that in the fourth quarter incidents have not been had in the metrics.
| Millions of Pesos |
Total | 1D | 1W | 1M | 3M | 6M | 9M | 1Y | 5Y | >5Y | ||
| Structural GAP | 125,217 | 142,921 | 32,308 | (92,047) | 5,110 | 33,696 | 10,663 | 8,123 | (58,403 ) | 42,845 | ||
| Non Derivative | 130,615 | 143,919 | 30,731 | (92,433) | 4,661 | 34,147 | 11,795 | 8,314 | (59,927) | 49,407 | ||
| Derivatives | (5,397) | (998) | 1,578 | 386 | 449 | (451) | (1,132) | (191) | 1,524 | (6,562) | ||
Credit Risk
Management of credit risk of Grupo Financiero Santander is developed differently for the different segments of clients along the three phases of the credit process: acceptance, follow-up and recovery.
From a global perspective, management of credit risk in Grupo Financiero Santander is responsible for the identification, measurement, integration and assessment of the aggregated risk and the profitability according to such risk; with the purpose of oversee the levels of risk concentration and to adapt them to the limits and objectives previously established.
Risks receiving an individual treatment (risks with companies, Grupo Financiero Santander and financial entities) are identified and taken apart from those other risk that are managed in standardized manner (consumer and mortgages credits to individuals, loans to businesses and small enterprises) ..
Risks managed on individual basis are subject to a solvency or rating system with a related probability of failure that allows the measuring of the risk for each client and for each transaction from the beginning. The assessment of the client, after analyzing other relevant risk factors in different areas, is adjusted according to the special characteristics of the transaction (guarantee, term, etc,).
Standardized risks require, due to their special characteristics (great number of transactions for relatively low amounts), a different management that allows an efficient process and effective use of resources, so automated decision tools are used (expert and credit scoring systems).
95
Management of loans to companies is complemented, during the follow-up phase, with the so called “system of special monitoring” that determines the policy to be followed in the management of the risks with companies or groups rated within such category. Different situations of levels of monitoring are identified and generate different actions. A special monitoring grade is given in the case of alert signals, systematic reviews, or specific initiatives promoted by the Risks Department or Internal Audit.
Recovery Units constitute a critical element in the management of irregular risk, in order to minimize the final loss for Grupo Financiero Santander. These units are responsible for a specialized management of the risk from the moment they are classified as irregular risk loans (defaulting payment).
Grupo Financiero Santander has carried out a policy for the selective growth of risk and a strict treatment of late payments and the creation of the corresponding provisions, based in the prudent criteria defined by the Group.
Probability of Default and Expected Losses
Pursuant to the provisions on Comprehensive Risk Management included in the general regulations applicable to credit institutions, as part of the credit risk management, credit institutions must determine the probability of default.
The system allows the calculation of the probability for the different loans portfolios.
a. The probability of failure is for “No Retail” portfolios. It is determined via the fine tune of the ratings of clients in a given moment, based in the Monthly Default Rates observed during a period of five years. Such Default Rates are adjusted to an economic cycle of ten years. For “Retail” portfolios, the standard default probabilities set by the Basilea Convention are used.
b. Once the probability of default is determined, the parameters of “severity of Loss” (“LGD”) and “Exposure at Default” (“EAD”) stipulated in Basilea, are taken into consideration.
Once the abovementioned factors are obtained, the Expected Loss (“PE”) is calculated as follows:
Expected Loss = Probability of Default x Severity of Loss x Exposure at Default
i.e.: PE = PD * LGD * EAD
Counterparty Risk
Included in the credit risk, there is a concept that, due to its characteristics, it requires a special management: the Counterparty Risk.
Counterparty Risk is the risk Grupo Financiero Santander assumes with governmental entities, financial institutions, corporations, companies and individuals in their treasury activities and correspondent bank activities. The measurement and control of the Credit Risk in Financial Instruments, Counterparty Risk, is carried out by a special unit with an organizational structure independent from the business areas.
The control of Counterparty Risk is performed daily via theInteractive Risk Integrated System (“IRIS”), which informs the credit line available with any counterparty, in any product and any term.
For the control of the counterparty lines, the Equivalent Credit Risk (“REC”) is used. REC is an estimate of the amount Grupo Financiero Santander may lose in current transactions with certain counterparty, if such counterparty commits a default in any moment until the maturity date of transactions. REC takes into account the Current Credit Exposure, which is defined as the cost to substitute the transaction at market value provided that this value is positive for Grupo Financiero Santander, and it is measured as the market value of the transaction (“MtM”). In addition, REC includes the Potential Credit Exposure or Potential Additional Risk (“RPA”), which represents the possible evolution of the current credit exposure until maturity, given the characteristics of the transaction and the possible variations in the market factors. The REC Gross considers definitions described above, without considering mitigating by netting or by mitigating collateral.
For the calculation of REC, mitigating factors of the counterparty credit risk are taken into consideration, such as collaterals, netting agreements, among other. The methodology continues to be effective.
96
In addition to the Counterparty Risk, there is the Settlement Risk, which is present in every transaction at its maturity date, when the possibility that the counterparty does not comply with its payment obligations arises, once Grupo Financiero Santander has complied with its obligations by issuing payment directions.
For the process of control for this risk, the Deputy General Direction of Financial Risks oversees on a daily basis the compliance with the limits on counterparty credit risks by product, term and other conditions stipulated in the authorization for financial markets. Likewise, it is the responsible for communicating on a daily bases, the limits, consumptions and any incurred deviation or excess.
On a monthly basis, a report is presented to the Comprehensive Risk Management Committee, with respect to the limits to Counterparty Risks, Issuer Risks and current consumptions. In addition, on a monthly basis, a report is presented to the Global Banking Credit Committee and Retail Credit Committee with respect to incurred excesses and transactions with non authorized customers. In addition, it informs to the Comprehensive Risk Management Committee the calculation of the Expected Loss for current transactions in financial markets at the closing of every month and different scenarios of stress of Expected Loss. All of the above according to the methodologies and assumptions approved by the Comprehensive Risk Management Committee.
Currently, we have approved lines of Counterparty Risks in Grupo Financiero Santander for the following segments: Mexican Sovereign Risk and Domestic Development Banking, Foreign Financial Institutions, Mexican Financial Institutions, Corporations, Companies Banking-SGC, Institutional Banking, Large Enterprises Unit, Project Finance.
Equivalent Net Credit Risk of the lines of Counterparty Risk and Issuer Risk of Grupo Financiero Santander for the fourth quarter of 2015:
Equivalent Net Credit Risk (millions of U.S. dollars) | ||||
| Segment | oct-15 | nov-15 | dec-15 | Average |
| Sovereign Risk, Development Banking and Financial Institutions | 23,700.43 | 22,388.22 | 21,377.75 | 22,488.80 |
| Corporates | 1,266.16 | 1,244.29 | 1,070.01 | 1,193.49 |
| Companies | 155.64 | 144.58 | 174.01 | 158.08 |
The equivalent credit risk lines maximum gross counterparty risk of Grupo Financiero Santander as of the end of the fourth quarter of 2015, which corresponds to derivative transactions, is distributed depending on the type of derivative:
Equivalent Gross Credit Risk (millions of U.S. dollars) | |
| Type of Derivative | End of the third quarter of 2015 |
| Interest Rate Derivatives | 17,225 |
| Exchange Rate Derivatives | 24,332 |
| Bonds Derivatives | 3 |
| Equity Derivatives | 1,519 |
| Total | 43,079 |
The Expected Loss of Grupo Financiero Santander at the end of the fourth quarter of 2015, and the quarterly average of the expected loss of the lines of Counterparty risk and issuer risk of Grupo Financiero Santander, for the fourth quarter of 2015 are:
Expected Loss (millions of U.S. dollars) | ||||
| Segment | oct-15 | nov-15 | dec-15 | Average |
| Sovereign Risk, Development Banking and Financial Institutions | 4.58 | 9.05 | 9.27 | 7.63 |
| Corporates | 2.81 | 2.73 | 2.60 | 2.71 |
| Companies | 1.03 | 1.28 | 1.51 | 1.27 |
97
The segments of Mexican Financial Institutions and Foreign Financial Institutions are very active counterparties with whom Grupo Financiero Santander has current positions of financial instruments with Counterparty Credit Risk. It is important to mention that Equivalent Credit Risk is mitigated by netting agreements (ISDA-CMOF) and, in some cases, by collateral agreements (CSA-CGAR) or revaluation agreements with counterparties.
Respect to total collateral received for derivatives transactions as of the end of the fourth quarter of 2015:
| Cash collateral | 69.02% |
| Collateral refer to bonds issued by the Mexican Federal Government | 30.98% |
In respect to collateral management in derivatives transactions, counterparty’s positions are valuated according to the frequency established at each collateral agreement. In addition, all credit risk parameters, established at each collateral agreement are considered to obtain the amount of collateral to be delivered or to be received from the counterparty. These amounts, margin calls, will be requested from the counterparty which has the right to receive the collateral, according to the frequency established at the collateral agreement.
The counterparty which receives the margin call, has the right to analyze the valuation and it could result on discrepancies to solve.
In respect to the correlation between the collateral and the counterparty in derivatives transactions, the Institution confirms that, at this time, the eligible collateral consists on government bonds and cash collateral, so as a result, there are no adverse effects due to correlation between the counterparty and the collateral.
In the hypothetical stressed scenario, assuming that the Institution’s credit rating decreases and the impact of this credit rating decrease on the collateral that the Institution would have to deliver, this stressed test confirms that there would not be significant impact; a few of the Thresholds established on the Institution’s collateral agreements are dependent on the Institution Credit Rating.
Legal Risk
Legal Risk is defined as the potential loss due to the failure to comply with the applicable legal and administrative regulations, the issue of administrative and judicial resolutions against Grupo Financiero Santander and the application of fines, with respect to the transactions carried out by Grupo Financiero Santander.
Pursuant to the provisions regarding the Comprehensive Risk Management, the following activities are performed: a) Establishment of policies and procedures for analyzing the legal validity and the proper execution of the legal acts. b) estimates of the amount of potential losses derived from judicial or administrative orders against Grupo Financiero Santander and the possible application of fines c) Analysis of the legal acts governed by a legal system different to the Mexican laws, d) communication to directors and employees on the legal and administrative regulations applicable to transactions and e) the performance, at least on annual basis, of internal legal audits.
Operating Risk
With respect to Operating Risk, and pursuant to the corporate methodology, Grupo Financiero Santander has established policies, procedures and methodologies for the identification, control, mitigation, monitoring and reporting of operating risks.
For the identification and classification of operating risks, different categories and business lines defined by national and internal regulating organisms are used. The methodology is based in the identification and documentation of the corresponding risks, controls and processes, and quantitative and qualitative tools are used, such as self-assessment questionnaires, development of historical data bases and Operating Risk indicators, etc. for their control, mitigation and reporting.
Technological Risk
Technological risk is defined as the potential loss due to damages, discontinuation, alterations or failures derived from the use or dependence on hardware, software, systems, applications, networks and any other data channel distribution for the provision of banking services to the clients of Grupo Financiero Santander.
Grupo Financiero Santander has adopted a corporate model for the management of Technological Risks, integrated to the processes of service and support to computing areas in order to identify, oversee, control, mitigate and report the Computing Technology Risks the transaction is exposed to, with the aim of establishing control measures that decrease the probability of risks to occur.
98
Processes and levels of authorization
Pursuant to internal regulations, all the products and services traded by Grupo Financiero Santander are approved by the “Comité de Comercialización” and by the “Comité Corporativo de Comercialización”. Those products or services that are modified or extended with respect to their original approval must be approved by the “Comité de Comercialización” and, depending of their relevance, the “Comité Corporativo de Comercialización” must approve them too.
All areas taking part in the operation of the product or service, depending on the nature of such product or service, as well as the areas responsible for their accounting registration, legal formalization, fiscal treatment, risk assessment, etc. are present in the Committee. All approvals shall be unanimous as there are no authorizations approved by majority of votes. In addition to the Committee’s approval, there are products that require authorizations from local authorities, and therefore, the Committee’s approvals are subject to the authorizations issued by the competent authorities in each case.
Finally, all the approvals shall be authorized by the Comprehensive Risk Management Committee.
Independent Reviews
Grupo Financiero Santander is subject to the monitoring and supervision of the National Bank and Exchange Commission, the Central Bank of Mexico and the Bank of Spain, and such monitoring and supervision is exercised via follow-up processes, inspection visits, information requests, delivery of documents and reports.
Likewise, periodic reviews are performed by Internal and External Auditors.
General description of the valuation techniques
Derivative financial securities are valued at reasonable value, according to the accounting rules established in the Circular Letter for Credit Institutions issued by the National Banking and Exchange Commission, in Principle B-5 “Derivative Financial Instruments and hedging Transactions” and the provisions in Principle A-2 “Application of specific rules”, and the provisions in the specific rule included in Bulletin C-10 of the Financial Information Rules.
| A. | Methodology of Valuation |
| 1) | Trading purposes |
| a) | Organized Markets |
Valuation is made at the corresponding closing market price. Prices are provided by the supplier of prices.
| b) | Over-the-Counter Markets |
| i) | Derivative financial instruments with optionality. |
In the majority of the cases, a general form of the Black & Scholes model is used. Such model assumes that the underlying product follows a lognormal distribution. For exotic products or when payment depends on the trajectory of any market variable, MonteCarlo simulations are used. In this case, it is assumed that logarithms of the different variables follow a multi-varied normal distribution.
| ii) | Derivative financial instruments with no optionality. |
The valuation technique is to obtain the present value of the estimated future flows.
In all cases, Grupo Financiero Santander carries out the valuation of its positions and registers the corresponding value. In some cases, a different calculation agent is designated, and such calculation agent may be the counterparty or a third party.
| 2) | Hedging purposes |
In the performance of its commercial banking activities, Grupo Financiero Santander has tried to cover the evolution of the financial margin of structured portfolios that are exposed to adverse movements in interest rates. The ALCO, the body responsible for the management of long-term assets and liabilities, has constituted the portfolio via which the Grupo Financiero Santander achieves such hedge.
An accounting hedge is defined as a transaction that complies with the following conditions:
| a. | A hedge relationship is designated and documented from the beginning in an individual file, where its objective and strategy is established. |
99
b. The hedge is effective for the compensation of variations in the reasonable value or in the cash flows attributed to such risk, according to the risk management documented at the beginning.
The Management of Grupo Financiero Santander performs derivative transactions for hedging purposes with swaps.
Derivatives for hedging purposes are valued at market value, and the effect is recognized depending on the type of accounting hedge, pursuant to the following:
a. In the case of fair value hedges, they are valued at market value for the risk covered, the primary position and the hedging derivative instrument, and the net effect is registered in the statement of income of the corresponding period.
b. In the case of cash flow hedges, the hedging derivative instrument is valued at market value. The effective portion of the hedge is registered in the comprehensive income account, within the stockholders’ equity, and the ineffective portion is registered in the statement of income.
Grupo Financiero Santander ceases the recording of hedges at the maturity date of the derivative, or when such derivative is sold, cancelled or exercised; when the derivative does not reach a high efficiency in compensating the changes in the reasonable value or the cash flows of the covered item, or when Grupo Financiero Santander decides to cancel the hedge.
It shall be fully evidenced that the hedge fulfills the objective for which derivatives were contracted for. This effectiveness requirement assumes that the hedge must comply with a maximum range of deviation with respect to the initial objective of 80% to 125%.
In order to demonstrate the efficacy of hedges, two tests are to be carried out:
a) Forward-looking Test: it is demonstrated that, in the future, the hedge will be within the aforementioned range of deviation.
b) Retrospective Test: This test reviews if, in the past, from its initial date to now, the hedge has been maintained within the allowed range of deviation.
In the cases of Fair Value Hedges and the Cash Flow Hedges, they are retrospective and forward-looking efficient and within the allowed maximum range of deviation.
| B. | Reference Variables |
The most relevant reference variables are:
Exchange Rates
Interest Rates
Equity
Baskets of equities and stock indexes.
| C. | Frequency of valuation |
Derivative financial instruments for trading and hedging purposes are valued on a daily basis.
Management of internal and external sources of liquidity that may be used for the compliance of requirements related to derivative financial instruments.
Resources are obtained via the National and International Treasury departments.
Changes in exposure to identified risks, contingencies and events, known or expected, in derivative financial instruments.
At the end of the fourth quarter of 2015, Grupo Financiero Santander has no situation or contingency such as changes in the value of the underlying asset or the reference variables, that may cause the use of the derivative financial instruments to be different to their original intended use, a significant change in their scheme or the total or partial loss of the hedge, requiring the Issuer to assume new obligations, commitments or variations in its cash flow or affecting its liquidity (day trade calls), nor contingencies or events known or expected by the Management that may affect future reports.
100
Grupo Financiero Santander México
Summary of Derivative Financial Instruments
(Millions of pesos as of December 31, 2015)
| Derivatives | Underlying Asset | Purposes trading or hedging | Notional | Fair Value | |
| Current Quarter | Previous Quarter | ||||
| Forwards | Interest Rate | Trading | 2,020 | 6 | (18) |
| Forwards | Foreign Currency | Trading | 240,451 | 600 | 267 |
| Forwards | Equity | Trading | 10,568 | (49) | 70 |
| Futures | Foreign Currency | Trading | 86 | 0 | 33 |
| Futures | Market Index | Trading | 7,449 | (68) | (153) |
| Futures | Interest Rate | Trading | 102,639 | (334) | (362) |
| Futures | Equity | Trading | 0 | 0 | 0 |
| Options | Equity | Trading | 804 | (329) | (243) |
| Options | Foreign Currency | Trading | 30,160 | (28) | 176 |
| Options | Market Index | Trading | 128,342 | 372 | 83 |
| Options | Interest Rate | Trading | 256,755 | (469) | (540) |
| Swaps | Cross Currency | Trading | 817,642 | (7,687) | (6,733) |
| Swaps | Interest Rate | Trading | 3,998,295 | (148) | 1,189 |
| Swaps | Equity | Trading | 0 | 0 | 0 |
| Forwards | Foreign Currency | Hedging | 37,922 | (1,522) | 3,953 |
| Swaps | Cross Currency | Hedging | 48,428 | 4,143 | 4,024 |
| Swaps | Interest Rate | Hedging | 8,329 | (56) | (53) |
Santander México, at the execution of transactions of OTC derivative financial instruments, has Collateral formalized agreements with many of its counterparties, which function as market value guarantee of the derivative transactions, and it is determined based on the exposure of the net position on risk with each opposing party. The managed Collateral consists mainly in cash deposits, whereat there is not a deterioration situation.
During the fourth quarter of 2015, the number or expired derivative financial instruments and closed positions was as follows (unaudited):
| Description | Maturities | Closed Positions |
| Caps and Floors | 506 | 11 |
| Equity Forward | 24 | 7 |
| OTC Equity | 771 | 0 |
| OTC Fx | 1834 | 229 |
| Swaptions | 6 | 0 |
| Fx Forward | 1251 | 82 |
| IRS | 733 | 246 |
| CCS | 40 | 0 |
101
The amount of day trade calls performed during the quarter was the necessary for covering contributions to organized markets and the requirements in collateral agreements.
During the fourth quarter of 2015, there were no defaults by counterparties.
Sensitivity Analysis
Identification of Risks
Sensitivity measures of market risk associated with securities and derivative financial instruments are those that measure the change (sensitivity) of the market value of the financial instrument concerned, when changes in each of the risk factors associated with same occur.
The sensitivity of the value of a financial instrument when changes in market factors occur and is determined by the full instrument revaluation.
The sensitivities are detailed below according to each risk factor and associated historical consumption of the trading book.
The management strategy of the organization is integrated with security positions and derivatives. The latter are used largely to mitigate the market risk of the first. In view of the above, the sensitivities or exposures as described below are both types of instruments considered as a whole.
1. Sensitivity to risk factor “Equity (“Delta EQ”)”
The EQ Delta shows the change in the portfolio's value in relation to changes in the prices of equities.
The EQ Delta calculated for the case of derivative financial instruments considered the relative change of 1% in the prices of the underlying assets in equities, in the case of equities, this considers the relative variation of 1% of market price title.
2. Sensitivity to risk factor “Foreign Exchange”, (“Delta FX”)
The FX Delta shows the change in the portfolio's value in relation to changes in asset prices exchange rate.
The FX Delta calculated for the case of derivative financial instruments considered the relative change of 1% in the prices of the underlying assets of the exchange rate, In the case of currency positions, this considers the relative variation of 1%of the corresponding exchange rate.
3. Sensitivity to risk factor “Volatility” (“Vega”)
Vega sensitivity is the measure resulting from changes in the volatility of the underlying asset (the reference asset). Vega risk is the risk that a change in the volatility of the underlying asset value, that results in a change in the market value of the derivative.
The calculation of Vega sensitivity, considers the absolute change of 1% in the volatility of the underlying asset value.
4. Sensitivity to risk factors “Interest Rate” (“Rho”)
This sensitivity quantifies the change in value of financial instruments for the trading portfolio in the face of a parallel increase in the interest rate curves of a basis point.
The table below presents the sensitivities described above corresponding to the position of the trading portfolio,as of the end of the fourth quarter of 2015:
102
| Sensitivity Analysis | |||
| (Millions of pesos) | |||
| Total rate sensitivity | |||
| Mexican Pesos | Other Currencies | ||
| Sens. a 1 Bp | 0.20 | 0.69 | |
| Vega Risk factor | |||
| EQ | FX | IR | |
| Total | 2.13 | (0.52) | (0.18) |
| Delta Risk Factor (EQ and FX) | |||
| EQ | FX | ||
| Total | 0.73 | 2.70 | |
It is considered that the above sensitivity table reflects prudent management of the trading portfolio of Grupo Financiero Santander with respect to risk factors.
Stress Test for Derivative Financial Instruments
The following are various stress test scenarios considering various scenarios calculated for the trading portfolio of Grupo Financiero Santander.
| · | Probable scenario |
This scenario was defined based in the movements derived from a standard deviation, with respect to risk factors that have an influence over the valuation of financial instruments. Specifically:
| o | Risk factors of Interest Rate (“IR”), volatility (“Vol”) and rate of Exchange (“FX”) were incremented in a standard deviation. |
| o | Risk factors with respect to stock market (“EQ”) were decreased in a standard deviation. |
| · | Possible scenario |
Under this scenario, as requested in the official letter, risk factors were modified in 25%. Specifically:
| o | Risk factors: IR, Vol and FX were multiplied by 1.25 that means, they were incremented in 25%. |
| o | Risk factor EQ was multiplied by 0.75 that means, it was decreased in 25%. |
| · | Remote scenario |
Under this scenario, as requested in the official letter, risk factors were modified in 50%. Specifically:
| o | Risk factors IR, Vol and FX are multiplied by 1.50, that is, they were incremented in 50%. |
| o | Risk factor EQ was multiplied by 0.5, that is, it was decreased a 50%. |
Effect in the Income Statement
The following table shows the possible income (loss) for the trading portfolio of Grupo Financiero Santander México, in Millions of pesos for each stress scenario,as of the end of the fourth quarter of 2015:
103
| Summary of Stress Test | |
| (Millions of pesos) | |
| Risk Profile | Stress all factors |
| Probable scenario | (6) |
| Remote scenario | (149) |
| Possible scenario | (168) |
25. Disclosure of the Liquidity Coverage Ratio
On December 31, 2014, the Commission and the Central Bank of Mexico published in the Federal Official Gazette, the General Provisions on Liquidity Requirements for multiple banking institutions, which establish liquidity requirements that credit institutions must comply at all times in accordance with the guidelines established by the Committee on Regulation of Bank Liquidity at its meeting held on October 17, 2014.
These regulations came into force on January 1, 2015.
During the fourth quarter of 2015 the weighted average CCL for the Bank is 107.45%, complying with the Bank´s desired Risk Profile and well above the regulatory minimum established in the regulations.
| (Figures in millions of Mexican Pesos) | Amount unweighted (average) | Weighted Amount (average) | ||
| LIQUIDITY ASSETS | ||||
| 1 | Total high-quality liquid assets | not applicable | 130,983 | |
| CASH OUTFLOWS | ||||
| 2 | Unsecured retail financing | 159,306 | 11,538 | |
| 3 | Stable funding | 87,860 | 4,393 | |
| 4 | Less stable funding | 71,446 | 7,145 | |
| 5 | Unsecured wholesale funding | 328,504 | 128,262 | |
| 6 | Operational deposits | 209,720 | 49,110 | |
| 7 | Non-operational deposits | 99,371 | 59,738 | |
| 8 | Unsecured debt | 19,413 | 19,413 | |
| 9 | Secured wholesale funding | not applicable | 526 | |
| 10 | Additional requirements: | 53,812 | 37,858 | |
| 11 | Outflows related to derivatives exposures and other collateral requirements | 36,086 | 36,086 | |
| 12 | Outflows related to loss of funding on debt products | - | - | |
| 13 | Credit and liquidity facilities | 17,726 | 1,773 | |
| 14 | Other contractual funding obligations | - | - | |
| 15 | Other contingent funding obligations | 111,358 | 9,293 | |
| 16 | TOTAL CASH OUT | not applicable | 187,476 | |
| CASH INFLOWS | ||||
| 17 | Cash inflows secured transactions | 38,359 | 5,639 | |
| 18 | Cash inflows from operations unsecured | 59,185 | 42,545 | |
| 19 | Other cash inflows | 17,338 | 17,338 | |
| 20 | TOTAL CASH INFLOWS | 114,882 | 65,523 | |
| TOTAL ADJUSTED VALUE | ||||
| 21 | TOTAL OF ELIGIBLE LIQUID ASSETS | not applicable | 130,983 | |
| 22 | TOTAL NET CASH OUT | not applicable | 121,953 | |
| 23 | LIQUIDITY COVERAGE RATIO | not applicable | 107.45% | |
The presented numbers are subject to review and therefore they might suffer changes.
104
Information relating to the Liquidity Coverage Ratio
| a) | Natural days contemplated in the quarterly report. |
| · | 92 days. |
| b) | Main causes of the results of the Liquidity Coverage Ratio and the evolution of its main components; |
| · | During the quarter, the mix in deposits shifted towards a more favorable proportion of stable resources, better supporting the increase in liquid assets. |
| c) | Changes of major components within the quarter report. |
| · | During the quarter, the mix in deposits shifted towards a more favorable proportion of stable resources, better supporting the increase in liquid assets. |
| d) | Evolution of the composition of the Eligible and Computable Liquid Assets. |
| · | The Bank has a significant proportion of liquid assets comprised by government debt, deposits in Bank of Mexico and cash. |
| e) | Concentration of funding sources. |
| · | The main sources of funding are diversified by its own nature as: (i) demand deposits; (ii) term deposits, which include retail deposits and the money market (promissory notes with interest payable at maturity), and (iii) repurchase agreements. |
| · | In addition the Bank has registered programs for local market´s debt issuances and has experience issuing in international markets. |
| f) | Exposures in financial derivative instruments and possible margin calls. |
| · | Performed analyses don’t show any significant vulnerabilities coming from financial derivative instruments. |
| g) | Currency mismatch. |
| · | Performed analyses don’t show any significant vulnerability in Currency mismatch. |
| h) | Description of the level of centralization of liquidity management and interaction between the units of the group. |
| · | The Bank is autonomous in terms of liquidity and capital; it develops its financial plans, liquidity forecast, and analyzes funding requirements for all its subsidiaries. The Bank is responsible for its own "ratings", its issuance program, "road shows", any other activities to keep its ability to access capital markets. The issuance activity is performed without having the guarantee of the parent company. |
| · | The liquidity management of all Bank subsidiaries is centralized. |
| i) | Cash flows and Inflows, if any, that are not captured in this framework, but the institution considers relevant to the liquidity profile. |
| · | The Liquidity Coverage Ratio considers only the inflows and outflows up to 30 days, however the flows that are not contained in the metric are well managed and controlled by the Bank. |
105
Additional information for the previous quarter
I. Quantitative information:
| a) | The concentration limits for different groups of guarantees received and major sources of financing. |
| · | The Bank has no concentration limits under guarantees received by market operations, as they are mainly composed of government securities and cash. |
| b) | Exposure to liquidity risk and funding needs, taking into account the legal, regulatory and operational constraints on liquidity transfers. |
| · | Liquidity risk is associated with our capacity to finance the commitments we undertake at reasonable prices, as well as maintaining our ability to carry out our business plans using stable financing sources. Factors that influence liquidity risk may be external, such as a liquidity crisis, or internal, such as an excessive concentration of maturities. |
| · | The measures used to control liquidity risk in balance sheet management are the liquidity gap, liquidity ratios, stress scenarios and liquidity horizons. |
| · | The liquidity horizons metric has been defined to ensure that the Group has sufficient liquid assets to comply with its requirements during a certain period of time, given different stress scenarios. The Group set a 90-day survival horizon for local currency and consolidated balance and a 30-day survival horizon for foreign currency. During the third quarter of 2015, the balance remained above the established limits, and therefore we maintained a sufficient liquidity buffer. |
| September 30, 2015 | Term | Amount | |
| (Millions of pesos) | |||
| Consolidated | 90 days | Ps. 57,508 | |
| Local Currency | 90 days | 34,184 | |
| Foreign Currency | 30 days | 42,748 | |
c) | Balance sheet maturity liquidity gap including off balance sheet accounts. |
| · | The table below shows the liquidity gap of our assets and liabilities using maturity dates as of September 30, 2015. The reported amounts include cash flows from interest on fixed and variable rate instruments. The interest on variable rate instruments is determined using the forward interest rates for each period presented. |
| Total | 0-1 months | 1-3 months | 3-6 months | 6-12 months | 1-3 years | 3-5 years | >5 years | Not Sensitive | |||||||||
| Money Market | 143,638 | 122,232 | 507 | 125 | 9 | 37 | 36 | 18 | 20,674 | ||||||||
| Loans | 636,744 | 90,858 | 57,927 | 49,261 | 66,141 | 170,645 | 64,745 | 143,680 | (6,514) | ||||||||
| Trade Finance | — | — | — | — | — | — | — | — | — | ||||||||
| Intragroup | (5) | — | — | — | — | — | — | — | (5) | ||||||||
| Securities | 346,558 | 315,924 | 1 | 1 | 1 | 5,985 | — | — | 24,646 | ||||||||
| Permanent | 5,140 | — | — | — | — | — | — | — | 5,140 | ||||||||
| Other Balance Sheet Assets | 69,506 | — | — | — | — | — | — | — | 69,506 | ||||||||
| Total Balance Sheet Assets | 1,201,581 | 529,014 | 58,435 | 49,387 | 66,151 | 176,667 | 64,781 | 143,698 | 113,448 | ||||||||
| Money Market | (284,067) | (260,290) | (2,816) | (3,919) | (12,464) | (1,824) | (1,337) | - | (1,418) | ||||||||
| Deposits | (449,625) | (147,589) | (49,731) | (38) | (14,353) | (237,914) | — | — | — | ||||||||
| Trade Finance | (596) | — | — | — | — | — | — | — | (596) | ||||||||
| Intragroup | — | — | — | — | — | — | — | — | — | ||||||||
| Long-Term Funding | (146,452) | (21,404) | (2,373) | (9,478) | (24,454) | (35,133) | (26,520) | (27,090) | — | ||||||||
| Equity | (97,408) | — | — | — | — | — | — | — | (97,408) | ||||||||
| Other Balance Sheet Liabilities | (123,906) | — | — | — | — | — | — | — | (123,906) | ||||||||
| Total Balance Sheet Liabilities | (1,102,054) | (429,284) | (54,919) | (13,434) | (51,271) | (274,871) | (27,857) | (27,090) | (223,327) | ||||||||
| Total Balance Sheet Gap | 99,527 | 99,730 | 3,516 | 35,953 | 14,880 | (98,204) | 36,924 | 116,608 | (109,879) | ||||||||
| Total Off-Balance Sheet Gap | 1,641 | (569) | (233) | 2,517 | (1,345) | (347) | 2,665 | (4,006) | 2,959 | ||||||||
| Total Structural Gap | 99,162 | 3,283 | 38,470 | 13,536 | (98,551) | 39,588 | 112,602 | (106,921) | |||||||||
| Accumulated Gap | 99,162 | 102,444 | 140,914 | 154,450 | 55,899 | 95,487 | 208,089 | 101,169 |
106
II. Qualitative information:
| a) | The way in which liquidity risk is managed, considering the risk tolerance, the structure and responsibilities for managing liquidity risk, internal liquidity reports, the liquidity risk strategy, policies and practices across business lines and with the board of directors. |
| · | Our general policy regarding liquidity management seeks to ensure that even under adverse conditions, we have enough liquidity to fulfill client needs, maturing liabilities and working capital requirements. The Bank ´s liquidity management is based on analyses of asset and liability maturities, using contractual and management models. |
| · | The Financial Management Area is responsible for executing the strategies and policies established by ALCO in order to modify the risk profile of the Bank, within the limits established by the Integral Risk management Committee who reports to the Board. |
| b) | Financing strategy, including diversification policies, and whether the funding strategy is centralized or decentralized. |
| · | Annually the financial plan for the Bank is prepared considering: the projected business growth, the debt maturity profile, risk appetite, expected market conditions, the implementation of diversification policies and regulatory metrics and the analysis of the liquidity buffer. The financial plan is the guide used to issue debt or contract term liabilities and aims to maintain adequate liquidity profile. |
| · | The funding strategy of all subsidiaries is centralized. |
| c) | Mitigation techniques of liquidity risk used by the institution. |
| · | The risk mitigation techniques in the Bank have a proactive nature. The financial plan in addition to the projection exercises and stress test scenarios allows us to anticipate risks and implement measures to ensure that the liquidity profile is adequate. |
| d) | Explanation of how the stress tests are used. |
| · | The Liquidity Stress Test is a Risk Management tool designed to warn the governing committees and areas responsible for making decisions in this area about the potential adverse effects of the liquidity risk the Bank is exposed to. |
| · | The results of these stress tests aim to identify the impacts prospectively in order to improve planning processes, and help align and calibrate Risk Appetite, Exposure Limits and Levels of Liquidity Risk tolerance. |
| e) | Description of contingent financing plans. |
The plan includes the following elements: type and business model as the starting point. Early Warning Indicators to identify in a timely manner the increase in liquidity risk and the elements that define the crisis scenarios used. Additionally we measure the liquidity shortages that stress scenarios could produce and the available actions considered by the plan to restore liquidity conditions. Actions are prioritized in order to preserve the value of the entity and the stability of the markets. A key aspect of the plan is the governance process, stating the areas responsible for the different stages involved: activation, execution, communication and maintenance of the Plan.
107
Item 2

4Q and Full - Year 2015 Earnings Presentation
2 Earnings Presentation 4Q and Full - Year 2015 Safe Harbor Statement Grupo Financiero Santander México cautions that this presentation may contain forward - looking statements within the meaning of the U . S . Private Securities Litigation Reform Act of 1995 . These forward - looking statements could be found in various places throughout this presentation and include, without limitation, statements regarding our intent, belief, targets or current expectations in connection with : asset growth and sources of funding ; growth of our fee - based business ; expansion of our distribution network ; our focus on strategic businesses ; our compound annual growth rate ; our risk, efficiency and profitability targets ; financing plans ; competition ; impact of regulation ; exposure to market risks including interest rate risk, foreign exchange risk and equity price risk ; exposure to credit risks including credit default risk and settlement risk ; projected capital expenditures ; capitalization requirements and level of reserves ; liquidity ; trends affecting the economy generally ; and trends affecting our financial condition and our results of operations . While these forward - looking statements represent our judgment and future expectations concerning the development of our business, a number of risks, uncertainties and other important factors could cause actual developments and results to differ materially from our expectations . These factors include, but are not limited to : changes in capital markets in general that may affect policies or attitudes towards lending to Mexico or Mexican companies ; changes in economic conditions, in Mexico in particular, in the United States or globally ; the monetary, foreign exchange and interest rate policies of the Mexican Central Bank ( Banco de México ) ; inflation ; deflation ; unemployment ; unanticipated turbulence in interest rates ; movements in foreign exchange rates ; movements in equity prices or other rates or prices ; changes in Mexican and foreign policies, legislation and regulations ; changes in requirements to make contributions to, for the receipt of support from programs organized by or requiring deposits to be made or assessments observed or imposed by, the Mexican government ; changes in taxes ; competition, changes in competition and pricing environments ; our inability to hedge certain risks economically ; economic conditions that affect consumer spending and the ability of customers to comply with obligations ; the adequacy of allowances for loans and other losses ; increased default by borrowers ; technological changes ; changes in consumer spending and saving habits ; increased costs ; unanticipated increases in financing and other costs or the inability to obtain additional debt or equity financing on attractive terms ; changes in, or failure to comply with, banking regulations ; and certain other risk factors included in our annual report on Form 20 - F . The risk factors and other key factors that we have indicated in our past and future filings and reports, including those with the U . S . Securities and Exchange Commission, could adversely affect our business and financial performance . Note : T he information contained in this presentation is not audited . Nevertheless, the consolidated accounts are prepared on the basis of the accounting principles and regulations prescribed by the Mexican National Banking and Securities Commission ( Comisión Nacional Bancaria y de Valores ) for credit institutions, as amended (Mexican Banking GAAP) . All figures presented are in millions of nominal Mexican pesos, unless otherwise indicated .. Historical figures are not adjusted by inflation .

3 Earnings Presentation 4Q and Full - Year 2015 CEO Message
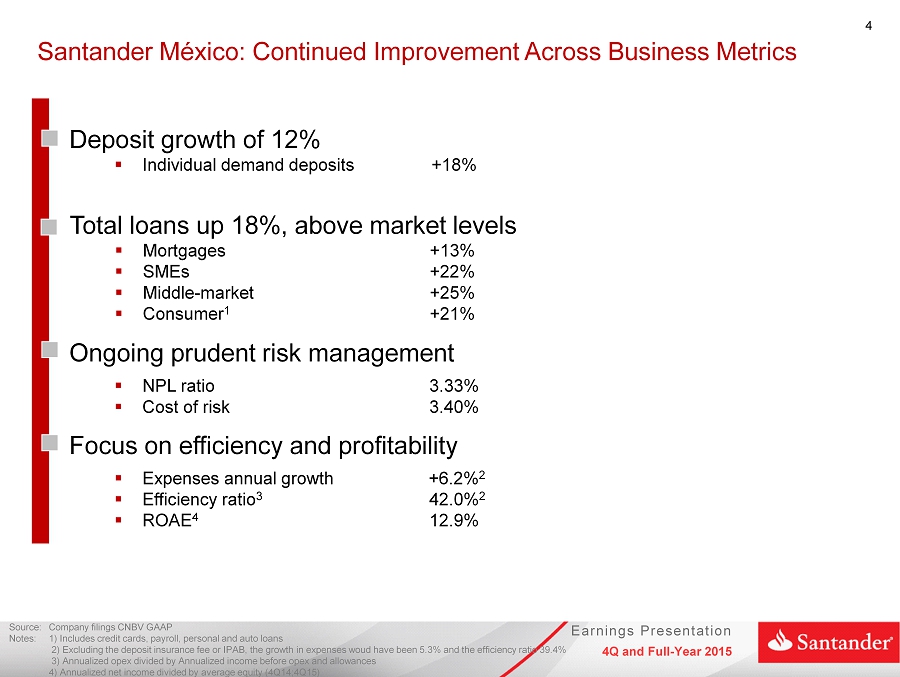
4 Earnings Presentation 4Q and Full - Year 2015 Santander México: Continued Improvement Across Business Metrics Source : Company filings CNBV GAAP Notes: 1 ) Includes credit cards , payroll , personal and auto loans 2) Excluding the deposit insurance fee or IPAB, the growth in expenses woud have been 5.3% and the efficiency ratio 39.4% 3) Annualized opex divided by Annualized i ncome before opex and allowances 4) Annualized net income divided by average equity (4Q14;4Q15) Focus on efficiency and profitability ▪ Expenses annual growth +6.2% 2 ▪ Efficiency ratio 3 42.0% 2 ▪ ROAE 4 12.9% Total loans up 18%, above market levels ▪ Mortgages +13% ▪ SMEs +22% ▪ Middle - market +25% ▪ Consumer 1 +21% Ongoing prudent risk management ▪ NPL ratio 3.33% ▪ Cost of risk 3.40% Deposit growth of 12% ▪ Individual demand deposits +18%
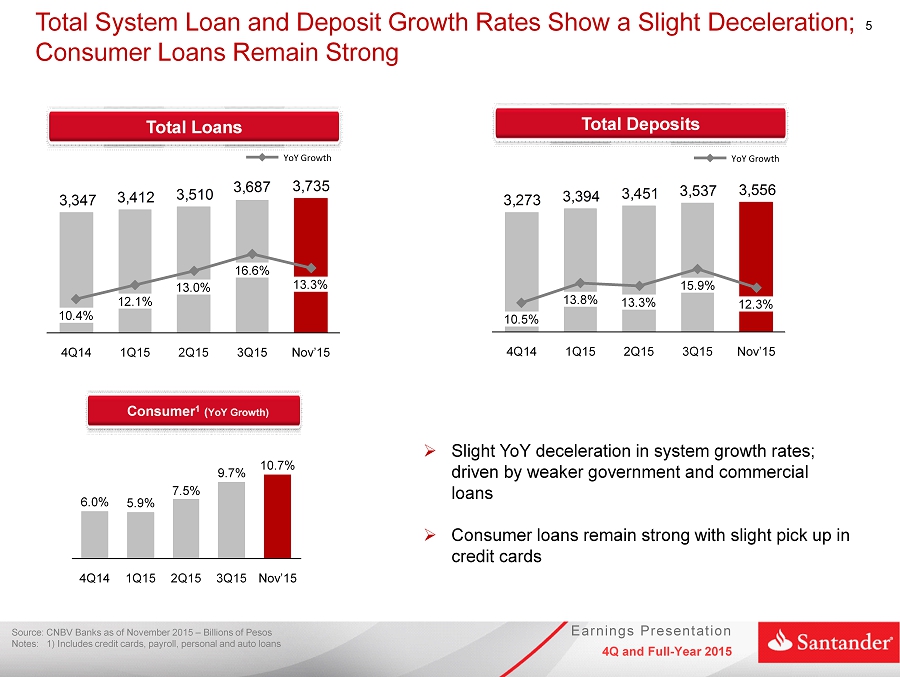
5 Earnings Presentation 4Q and Full - Year 2015 Total System Loan and Deposit Growth Rates Show a Slight Deceleration; Consumer Loans Remain Strong » Slight YoY deceleration in system growth rates; driven by weaker government and commercial loans » Consumer loans remain strong with slight pick up in credit cards Total Loans Total Deposits 3,556 3,537 3,451 3,394 3,273 1Q15 13.8% 4Q14 10.5% Nov’15 12.3% 3Q15 15.9% 2Q15 13.3% 3,735 3,687 3,510 3,412 3,347 12.1% 4Q14 10.4% Nov’15 13.3% 3Q15 16.6% 2Q15 13.0% 1Q15 YoY Growth YoY Growth Consumer 1 ( YoY Growth ) 4Q14 1Q15 3Q15 10.7% 7.5% Nov’15 2Q15 5.9% 9.7% 6.0% Source: CNBV Banks as of November 2015 – Billions of Pesos Notes: 1) Includes credit cards, payroll, personal and auto loans

6 Earnings Presentation 4Q and Full - Year 2015 Strong Performance in Retail with Contributions from All Other Segments Supports 18% YoY Loan Growth at Santander México Total Loans +12% 547,745 +4% +18% 4Q15 3Q15 526,037 2Q15 498,500 1Q15 474,738 4Q14 465,541 4 Q15 Source : C ompany filings CNBV GAAP Middle - Market 24% Corporates 13% Gov&FinEnt 13% SMEs 11% Mortgages 22% Credit Cards 9% Consumer 8% Corporate&Gov Retail +20% Loan Portfolio B reakdown
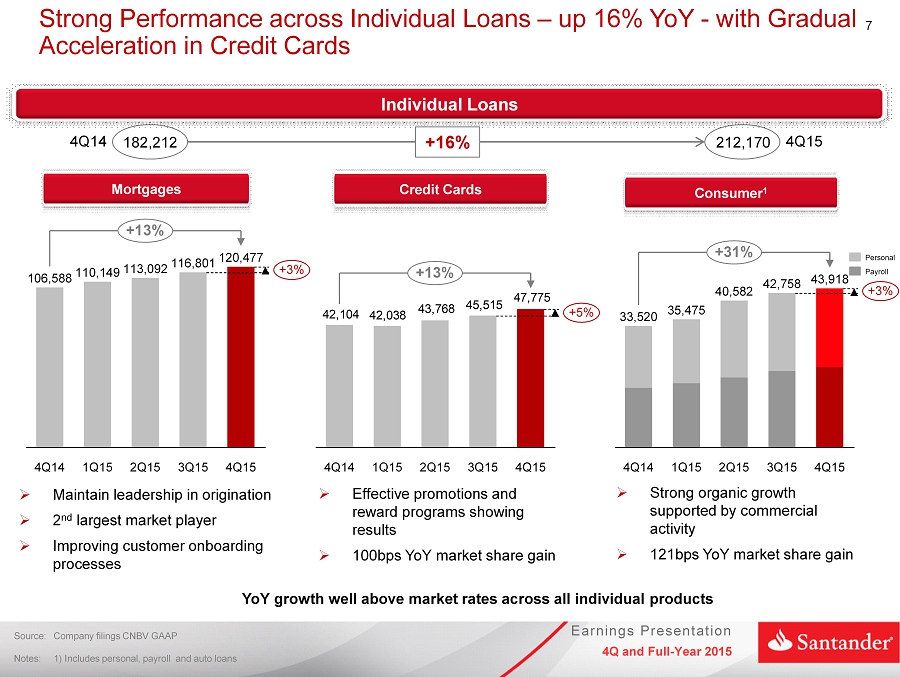
7 Earnings Presentation 4Q and Full - Year 2015 Strong Performance across Individual Loans – up 16% YoY - with Gradual Acceleration in Credit Cards 212,170 182,212 Consumer 1 Credit Cards Mortgages Individual Loans 47,775 45,515 43,768 42,038 42,104 +5% +13% 4Q15 3Q15 2Q15 1Q15 4Q14 +13% 120,477 +3% 4Q15 3Q15 116,801 2Q15 113,092 1Q15 110,149 4Q14 106,588 4Q14 4Q15 +16% 43,918 +31% +3% 4Q15 3Q15 42,758 2Q15 40,582 1Q15 35,475 4Q14 33,520 Personal Payroll » Effective promotions and reward programs showing results » 100bps YoY market share gain » Maintain leadership in origination » 2 nd largest market player » Improving customer onboarding processes » Strong organic growth supported by commercial activity » 121bps YoY market share gain YoY growth well above market rates across all individual products Source: Company filings CNBV GAAP Notes: 1) Includes personal, payroll and auto loans
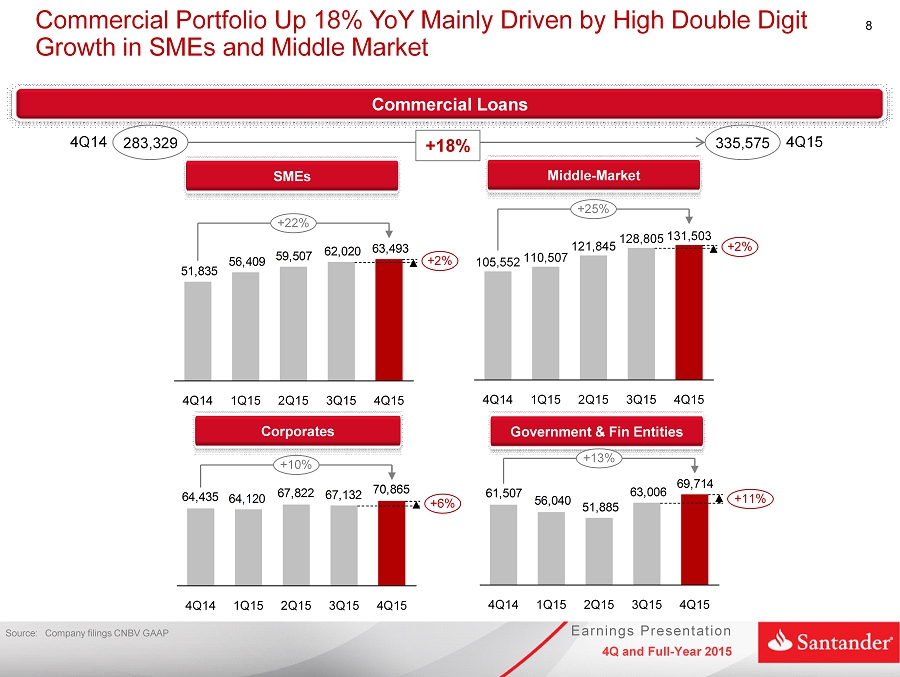
8 Earnings Presentation 4Q and Full - Year 2015 Commercial Portfolio Up 18% YoY Mainly Driven by High Double Digit Growth in SMEs and Middle Market SMEs Middle - Market Corporates +25% 131,503 +2% 4Q15 3Q15 128,805 2Q15 121,845 1Q15 110,507 4Q14 105,552 63,493 62,020 59,507 56,409 51,835 +2% +22% 4Q15 3Q15 2Q15 1Q15 4Q14 70,865 67,132 67,822 64,120 64,435 4Q15 2Q15 +10% +6% 3Q15 1Q15 4Q14 Commercial Loans 335,575 283,329 4 Q14 4 Q15 +18% Government & Fin Entities 69,714 63,006 51,885 56,040 61,507 +11% 4Q14 +13% 2Q15 4Q15 1Q15 3Q15 Source : C ompany filings CNBV GAAP

9 Earnings Presentation 4Q and Full - Year 2015 Focus on Individuals, SMEs and Mid - Market Continues to Drive Demand Deposit Growth Supports and Cost of Funding Total Deposits +18% 4Q15 347,786 4Q14 294,085 +2% 4Q15 168,646 4Q14 165,539 Demand Term * 516,432 1Q15 34% 65% 482,205 +5% +12% 492,713 4Q15 67% 33% 2Q15 3Q15 35% 66% Demand Term 459,130 64% 36% 4Q14 459,624 64% 36% » Healthy mix supports cost of funding » Individuals, SMEs and mid - market growth – up 18%, 20% and 13%, respectively » Continue to drive growth of Select and Payroll client base » New branches contribute to deposit growth +18% Individuals Other +19% Source : C ompany filings CNBV GAAP Notes: * Includes money market
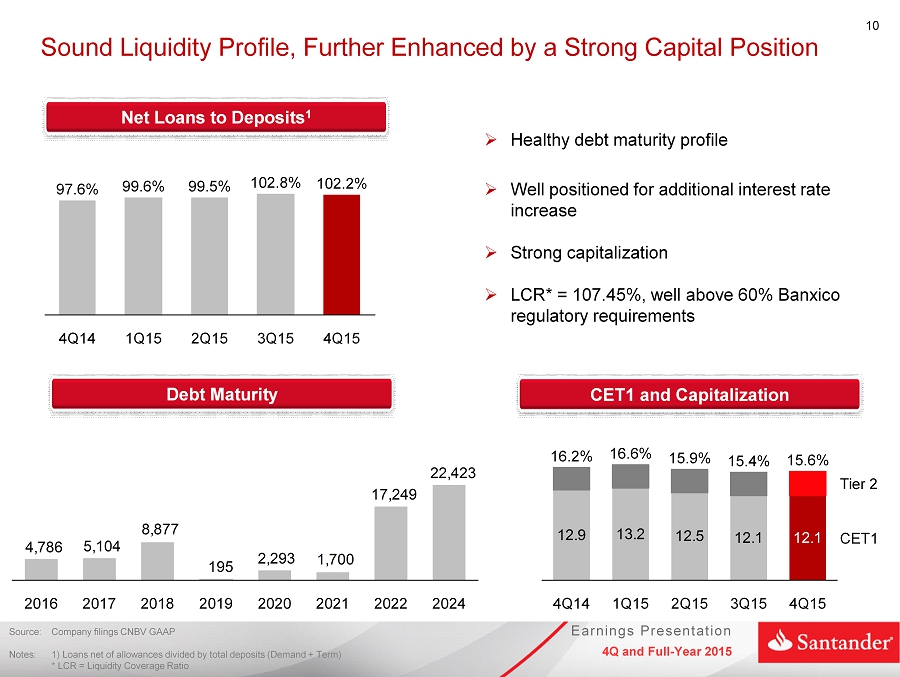
10 Earnings Presentation 4Q and Full - Year 2015 Sound Liquidity Profile, Further Enhanced by a Strong Capital Position Debt Maturity 4Q15 102.2% 3Q15 102.8% 2Q15 99.5% 1Q15 99.6% 4Q14 97.6% » Healthy debt maturity profile » Well positioned for additional interest rate increase » Strong capitalization » LCR* = 107.45%, well above 60% Banxico regulatory requirements CET1 and Capitalization 12.9 13.2 12.5 12.1 12.1 CET1 Tier 2 4Q15 15.6% 3Q15 15.4% 2Q15 15.9% 1Q15 16.6% 4Q14 16.2% Debt Maturity Net Loans to Deposits 1 Source: Company filings CNBV GAAP Notes : 1 ) Loans net of allowances divided by total deposits (Demand + Term ) * LCR = Liquidity Coverage Ratio 22,423 17,249 1,700 2,293 195 8,877 5,104 4,786 2022 2024 2021 2020 2019 2018 2017 2016

11 Earnings Presentation 4Q and Full - Year 2015 Solid Loan Expansion Supports Continued Growth in Net Interest Income - Up 16.7%; NIM of 4.89% Net Interest Income and NIM 1 11,431 10,810 10,466 9,925 9,799 16.7% 5.7% 4Q15 4.89 3Q15 2Q15 1Q15 4Q14 4.86 » NII up 5.7% sequentially » NII grew 16.7% YoY , principally due to: ▪ Strong interest income from: Loan portfolio (ex - credit cards): +19.3% Investment in securities: +33.9% ▪ Stable cost of deposits » NIM increased to 4.89% 42,632 4.89 2014 37,578 4.86 13.4% 2015 Source : Company filings CNBV GAAP Notes: 1) Annualized net interest income divided by daily average i nterest earnings assets (12M15)
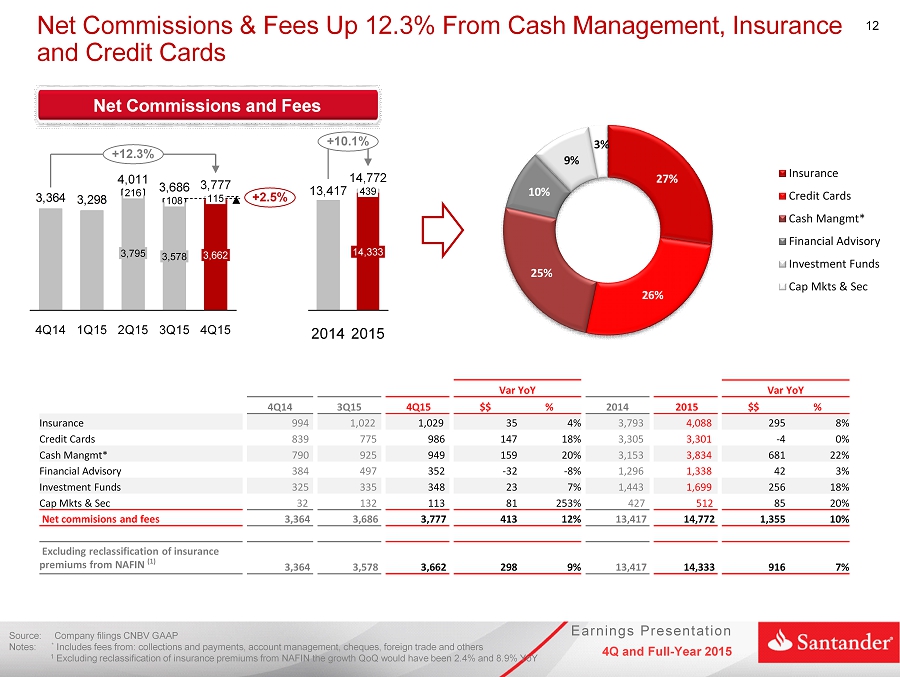
12 Earnings Presentation 4Q and Full - Year 2015 Net Commissions & Fees Up 12.3% From Cash Management, Insurance and Credit Cards Net Commissions and Fees 3,298 3,364 +12.3% 4Q15 3,686 3,578 108 2Q15 4,011 3,795 216 1Q15 4Q14 115 3,777 +2.5% 3Q15 3,662 Source : Company filings CNBV GAAP Notes: * Includes fees from : collections and payments , account management , cheques, foreign trade and others 1 Excluding reclassification of insurance premiums from NAFIN the growth QoQ would have been 2.4% and 8.9% YoY +10.1% 2015 14,772 14,333 439 2014 13,417 27% 26% 25% 10% 9% 3% Insurance Credit Cards Cash Mangmt* Financial Advisory Investment Funds Cap Mkts & Sec Var YoY Var YoY 4Q14 3Q15 4Q15 $$ % 2014 2015 $$ % Insurance 994 1,022 1,029 35 4% 3,793 4,088 295 8% Credit Cards 839 775 986 147 18% 3,305 3,301 - 4 0% Cash Mangmt* 790 925 949 159 20% 3,153 3,834 681 22% Financial Advisory 384 497 352 - 32 - 8% 1,296 1,338 42 3% Investment Funds 325 335 348 23 7% 1,443 1,699 256 18% Cap Mkts & Sec 32 132 113 81 253% 427 512 85 20% Net commisions and fees 3,364 3,686 3,777 413 12% 13,417 14,772 1,355 10% Excluding reclassification of insurance premiums from NAFIN (1) 3,364 3,578 3,662 298 9% 13,417 14,333 916 7%
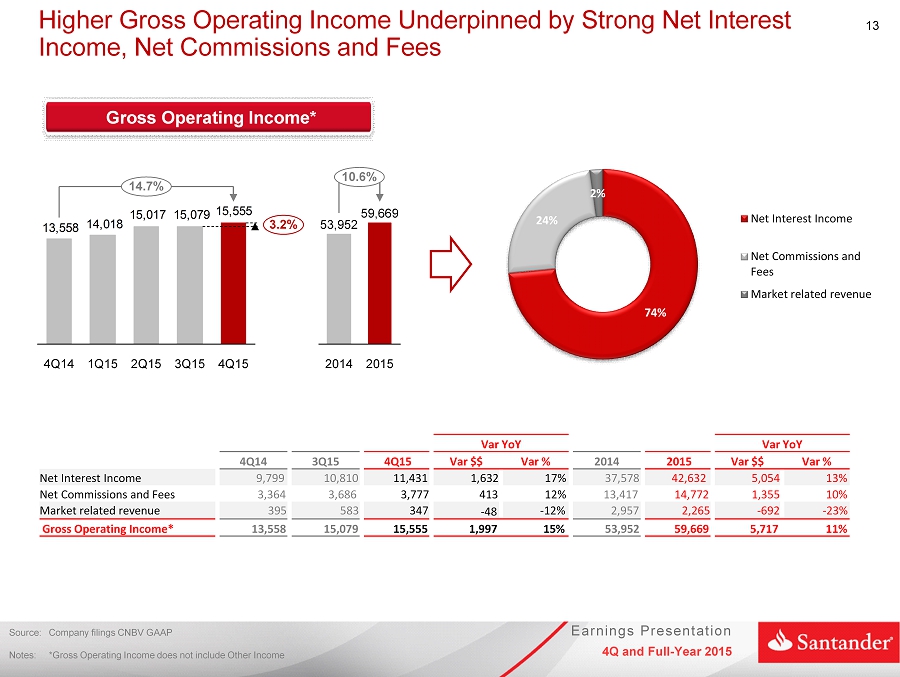
13 Earnings Presentation 4Q and Full - Year 2015 Higher Gross Operating Income Underpinned by Strong Net Interest Income, Net Commissions and Fees Gross Operating Income* 15,555 15,07915,017 14,018 13,558 1Q15 4Q14 14.7% 3.2% 4Q15 3Q15 2Q15 74% 24% 2% Net Interest Income Net Commissions and Fees Market related revenue 2015 2014 59,669 10.6% 53,952 Var YoY Var YoY 4Q14 3Q15 4Q15 Var $$ Var % 2014 2015 Var $$ Var % Net Interest Income 9,799 10,810 11,431 1,632 17 % 37,578 42,632 5,054 13 % Net Commissions and Fees 3,364 3,686 3,777 413 12 % 13,417 14,772 1,355 10 % Market related revenue 395 583 347 - 48 - 12% 2,957 2,265 - 692 - 23% Gross Operating Income* 13,558 15,079 15,555 1,997 15 % 53,952 59,669 5,717 11 % Source : Company filings CNBV GAAP Notes: * Gross Operating Income does not include Other Income
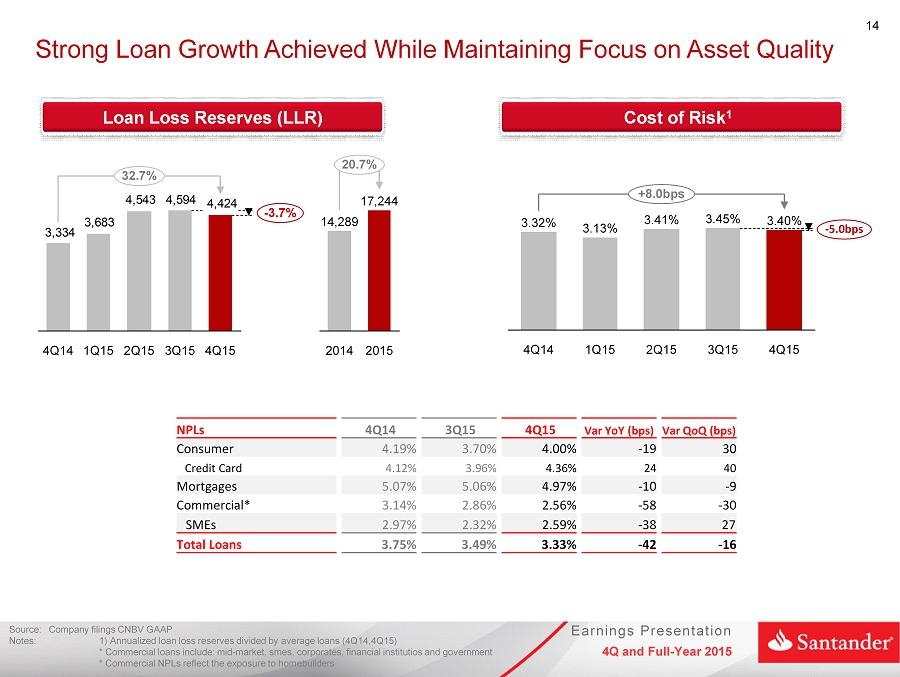
14 Earnings Presentation 4Q and Full - Year 2015 Strong Loan Growth Achieved While Maintaining Focus on Asset Quality Cost of Risk 1 Loan Loss Reserves (LLR) - 5.0bps +8.0 bps 4Q15 3.40% 3Q15 3.45% 2Q15 3.41% 1Q15 3.13% 4Q14 3.32% 4,424 4,5944,543 3,683 3,334 - 3.7% 32.7% 4Q15 3Q15 2Q15 1Q15 4Q14 Source : Company filings CNBV GAAP Notes: 1 ) Annualized loan l oss reserves divided by average loans (4Q14,4Q15) * Commercial loans include : mid - market , smes , corporates , financial institutios and government * Commercial NPLs reflect the exposure to homebuilders 20.7% 2015 17,244 2014 14,289 NPLs 4Q14 3Q15 4Q15 Var YoY (bps) Var QoQ (bps) Consumer 4.19% 3.70% 4.00% - 19 30 Credit Card 4.12% 3.96% 4.36% 24 40 Mortgages 5.07% 5.06% 4.97% - 10 - 9 Commercial* 3.14% 2.86% 2.56% - 58 - 30 SMEs 2.97% 2.32% 2.59% - 38 27 Total Loans 3.75% 3.49% 3.33% - 42 - 16
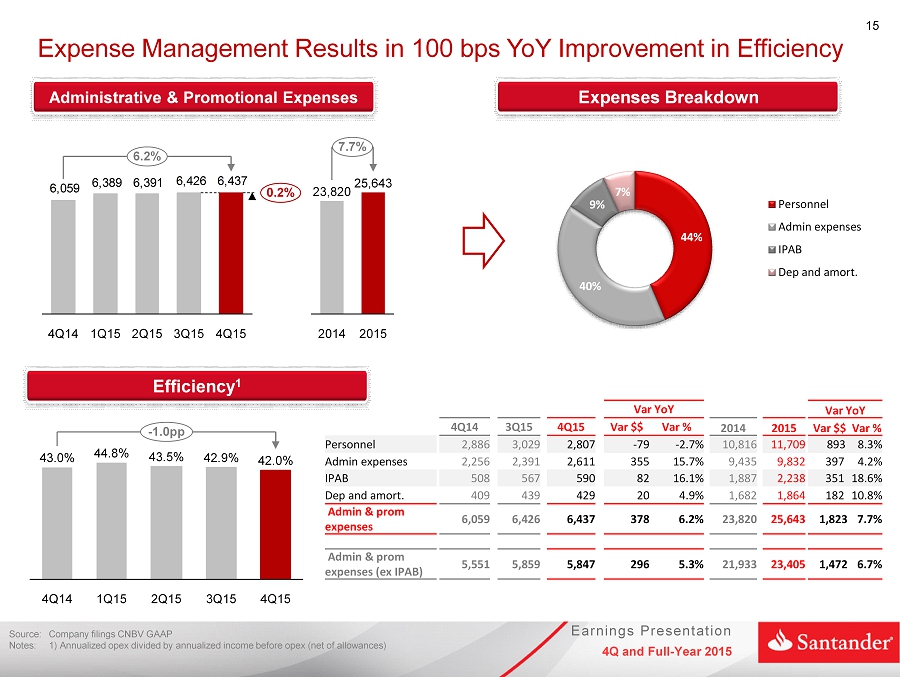
15 Earnings Presentation 4Q and Full - Year 2015 Expense Management Results in 100 bps YoY Improvement in Efficiency Expenses B reakdown Administrative & Promotional Expenses 6,4376,426 6,3916,389 6,059 6.2% 0.2% 4Q15 3Q15 2Q15 1Q15 4Q14 Efficiency 1 - 1.0pp 4Q15 42.0% 3Q15 42.9% 2Q15 43.5% 1Q15 44.8% 4Q14 43.0% Source: Company filings CNBV GAAP Notes: 1 ) Annualized opex divided by annualized income before opex (net of allowances ) 2015 7.7% 25,643 2014 23,820 44% 40% 9% 7% Personnel Admin expenses IPAB Dep and amort. Var YoY Var YoY 4Q14 3Q15 4Q15 Var $$ Var % 2014 2015 Var $$ Var % Personnel 2,886 3,029 2,807 - 79 - 2.7% 10,816 11,709 893 8.3% Admin expenses 2,256 2,391 2,611 355 15.7% 9,435 9,832 397 4.2% IPAB 508 567 590 82 16.1% 1,887 2,238 351 18.6% Dep and amort. 409 439 429 20 4.9% 1,682 1,864 182 10.8% Admin & prom expenses 6,059 6,426 6,437 378 6.2% 23,820 25,643 1,823 7.7% Admin & prom expenses (ex IPAB) 5,551 5,859 5,847 296 5.3% 21,933 23,405 1,472 6.7%

16 Earnings Presentation 4Q and Full - Year 2015 4Q15 Net Income Up 10.5% YoY Despite Higher Effective Tax Rate ROAE 1 Effective Tax Rate Net Income 4,224 3,464 3,215 3,824 3,238 +10.5% +21.9% 4Q15 3Q15 2Q15 1Q15 4Q14 22.2% +0.9pp +3.2pp 4Q15 3Q15 21.3% 2Q15 23.1% 1Q15 23.5% 4Q14 19.0% Profit before Taxes Source : Company filings CNBV GAAP Notes: 1 ) Annualized net income divided by average equity (4Q14,4Q15) +0.9% 2015 14,141 2014 14,014 +3.3pp 2015 22.5% 2014 19.2% 5,428 4,399 4,211 4,204 4,719 +15.0% +23.4% 4Q15 3Q15 2Q15 1Q15 4Q14 +5.1% 2015 18,242 2014 17,356 12.9% +0.8pp - 1.1pp 4Q15 3Q15 12.1% 2Q15 12.0% 1Q15 12.0% 4Q14 14.0%

17 Earnings Presentation 4Q and Full - Year 2015 Meets 2015 Guidance Metrics ▪ Total Loans Δ 13% - 15% • Consumer Δ 12% - 15 % • Mortgages Δ 10% - 12% • SMEs Δ 22% - 25 % ▪ Total Deposits Δ 10% - 12 % ▪ Pre - tax Earnings Growth 1 Δ 5% - 10% ▪ Cost of Risk 3.4 % - 3.6 % ▪ Expenses Δ 6% - 8 %* ▪ Tax Rate 23 % - 25 % 2015 Target * Does not include the deposit insurance fee (or IPAB) and the reversal from the employee profit sharing (EPS) future payments 1 Profit before taxes was revised in 2Q15, all other metrics remained unchanged

18 Earnings Presentation 4Q and Full - Year 2015 Guidance 2016 Metrics 2016 Target * Does not include the deposit insurance fee (or IPAB ) ▪ Total Loans Δ 10% - 12% ▪ Total Deposits Δ 10% - 12 % ▪ Pre - tax Earnings Growth Δ 8% - 12% ▪ Cost of Risk 3.3% - 3.5% ▪ Expenses Δ 6% - 8 %* ▪ Tax Rate 25% - 26%

19 Earnings Presentation 4Q and Full - Year 2015 Questions and Answers

20 Earnings Presentation 4Q and Full - Year 2015 Annexes
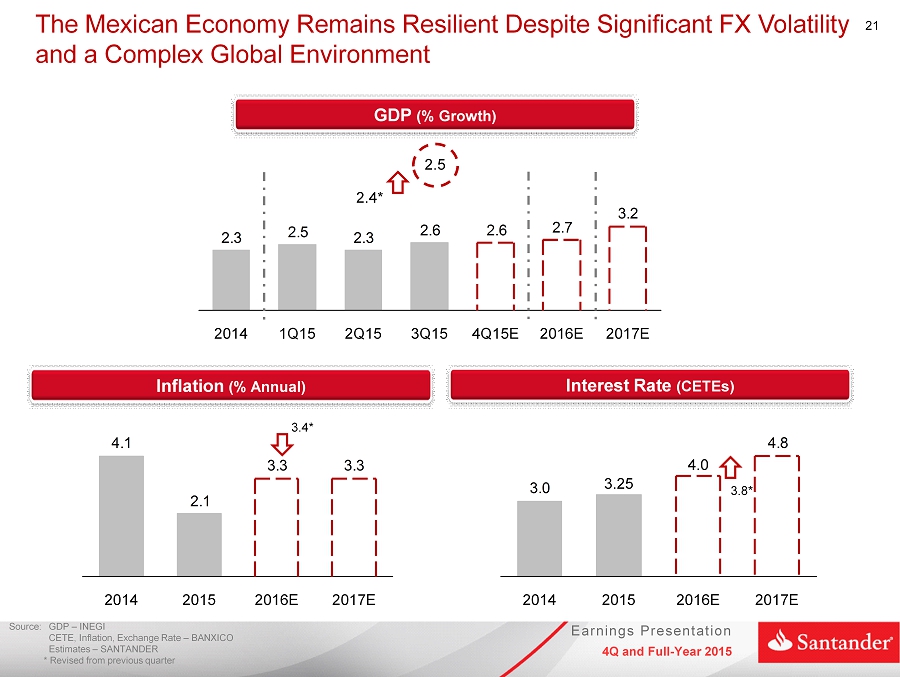
21 Earnings Presentation 4Q and Full - Year 2015 The Mexican Economy Remains Resilient Despite Significant FX Volatility and a Complex Global Environment GDP (% Growth ) Interest Rate ( CETEs ) Inflation (% Annual ) 3.2 2.7 2.62.6 2.3 2.5 2.3 2017E 2016E 4Q15E 3Q15 2Q15 1Q15 2014 3.0 4.8 2014 2017E 4.0 2016E 2015 3.25 3.33.3 2.1 4.1 2015 2016E 2017E 2014 2.5 2.4* 3.8* Source : GDP – INEGI CETE , Inflation , Exchange Rate – BANXICO Estimates – SANTANDER * Revised from previous quarter 3 .4*
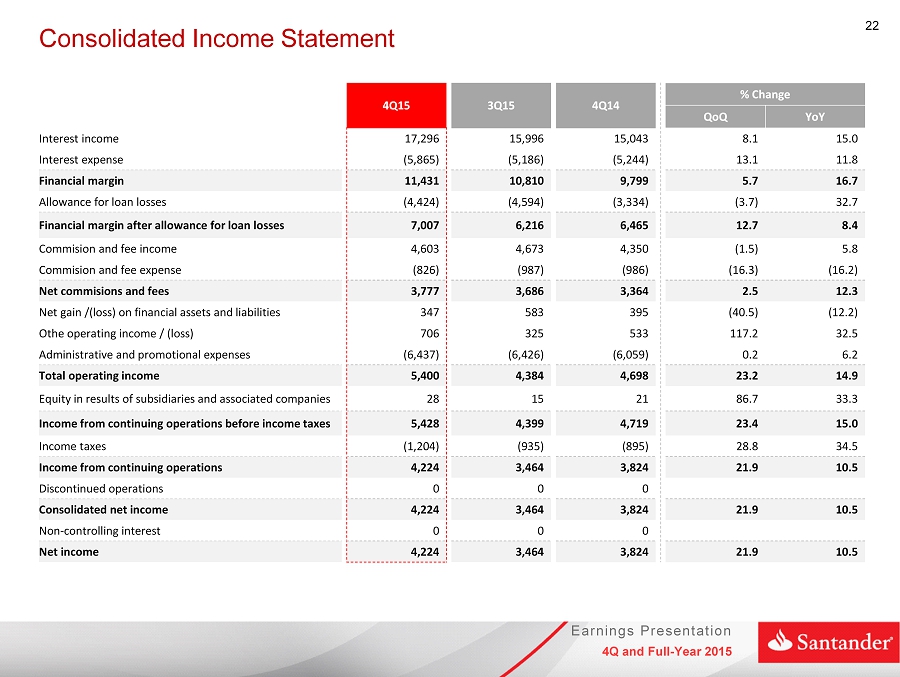
22 Earnings Presentation 4Q and Full - Year 2015 Consolidated Income Statement 4Q15 3Q15 4Q14 % Change QoQ YoY Interest income 17,296 15,996 15,043 8.1 15.0 Interest expense (5,865) (5,186) (5,244) 13.1 11.8 Financial margin 11,431 10,810 9,799 5.7 16.7 Allowance for loan losses (4,424) (4,594) (3,334) (3.7) 32.7 Financial margin after allowance for loan losses 7,007 6,216 6,465 12.7 8.4 Commision and fee income 4,603 4,673 4,350 (1.5) 5.8 Commision and fee expense (826) (987) (986) (16.3) (16.2) Net commisions and fees 3,777 3,686 3,364 2.5 12.3 Net gain /(loss) on financial assets and liabilities 347 583 395 (40.5) (12.2) Othe operating income / (loss) 706 325 533 117.2 32.5 Administrative and promotional expenses (6,437) (6,426) (6,059) 0.2 6.2 Total operating income 5,400 4,384 4,698 23.2 14.9 Equity in results of subsidiaries and associated companies 28 15 21 86.7 33.3 Income from continuing operations before income taxes 5,428 4,399 4,719 23.4 15.0 Income taxes (1,204) (935) (895) 28.8 34.5 Income from continuing operations 4,224 3,464 3,824 21.9 10.5 Discontinued operations 0 0 0 Consolidated net income 4,224 3,464 3,824 21.9 10.5 Non - controlling interest 0 0 0 Net income 4,224 3,464 3,824 21.9 10.5
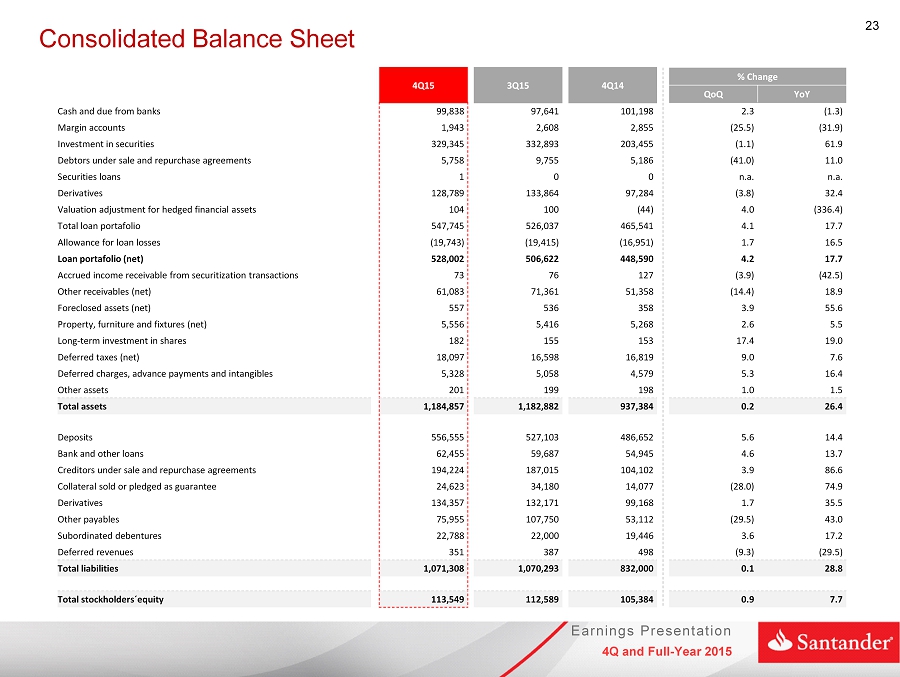
23 Earnings Presentation 4Q and Full - Year 2015 Consolidated Balance Sheet 4Q15 3Q15 4Q14 % Change QoQ YoY Cash and due from banks 99,838 97,641 101,198 2.3 (1.3) Margin accounts 1,943 2,608 2,855 (25.5) (31.9) Investment in securities 329,345 332,893 203,455 (1.1) 61.9 Debtors under sale and repurchase agreements 5,758 9,755 5,186 (41.0) 11.0 Securities loans 1 0 0 n.a . n.a. Derivatives 128,789 133,864 97,284 (3.8) 32.4 Valuation adjustment for hedged financial assets 104 100 (44) 4.0 (336.4) Total loan portafolio 547,745 526,037 465,541 4.1 17.7 Allowance for loan losses (19,743) (19,415) (16,951) 1.7 16.5 Loan portafolio (net) 528,002 506,622 448,590 4.2 17.7 Accrued income receivable from securitization transactions 73 76 127 (3.9) (42.5) Other receivables (net) 61,083 71,361 51,358 (14.4) 18.9 Foreclosed assets (net) 557 536 358 3.9 55.6 Property, furniture and fixtures (net) 5,556 5,416 5,268 2.6 5.5 Long - term investment in shares 182 155 153 17.4 19.0 Deferred taxes (net) 18,097 16,598 16,819 9.0 7.6 Deferred charges, advance payments and intangibles 5,328 5,058 4,579 5.3 16.4 Other assets 201 199 198 1.0 1.5 Total assets 1,184,857 1,182,882 937,384 0.2 26.4 Deposits 556,555 527,103 486,652 5.6 14.4 Bank and other loans 62,455 59,687 54,945 4.6 13.7 Creditors under sale and repurchase agreements 194,224 187,015 104,102 3.9 86.6 Collateral sold or pledged as guarantee 24,623 34,180 14,077 (28.0) 74.9 Derivatives 134,357 132,171 99,168 1.7 35.5 Other payables 75,955 107,750 53,112 (29.5) 43.0 Subordinated debentures 22,788 22,000 19,446 3.6 17.2 Deferred revenues 351 387 498 (9.3) (29.5) Total liabilities 1,071,308 1,070,293 832,000 0.1 28.8 Total stockholders ´ equity 113,549 112,589 105,384 0.9 7.7

Our purpose is to help people and businesses prosper .. Our culture is based on the belief that everything we do should be Thank you Simple Personal Fair