
v First Quarter 2022 Earnings Chris Cartwright, President and CEO Todd Cello, CFO April 26, 2022 Exhibit 99.2
© 2022 TransUnion LLC All Rights Reserved | 2 Forward-Looking Statements This presentation contains forward-looking statements within the meaning of the Private Securities Litigation Reform Act of 1995. These statements are based on the current beliefs and expectations of TransUnion’s management and are subject to significant risks and uncertainties. Actual results may differ materially from those described in the forward-looking statements. Factors that could cause TransUnion’s actual results to differ materially from those described in the forward-looking statements include: the effects of the COVID-19 pandemic; the duration of the COVID-19 pandemic and the timing of the recovery from the COVID-19 pandemic; the prevalence and severity of variants of the COVID-19 virus; the war in Ukraine and escalating geopolitical tensions as a result of Russia’s invasion of Ukraine; the effects of pending and future legislation and regulatory actions and reforms; macroeconomic and industry trends and adverse developments in the debt, consumer credit and financial services markets and other macroeconomic factors beyond TransUnion’s control; risks related to TransUnion’s indebtedness, including TransUnion’s ability to make timely payments of principal and interest and TransUnion’s ability to satisfy covenants in the agreements governing its indebtedness; our ability to maintain our liquidity; our ability to maintain the security and integrity of our data; our ability to deliver services timely without interruption; our ability to maintain our access to data sources; government regulation and changes in the regulatory environment; litigation or regulatory proceedings; regulatory oversight of “critical activities”; our ability to effectively manage our costs; economic and political stability in the United States and international markets where we operate; the possibility that the expected benefits of the Healthcare divestiture will not be realized, or will not be realized within the expected time period; risks related to the distraction of management from ongoing business operations and other opportunities due to recent acquisitions and divestitures; our ability to acquire businesses, successfully secure financing for our acquisitions and timely consummate such acquisitions; the possibility that we will not successfully integrate the operations of our acquisitions, control the costs of integrating our acquisitions or realize the intended benefits of such acquisitions, including our recent Neustar acquisition; and other one-time events and other factors that can be found in TransUnion’s Annual Report on Form 10-K for the year ended December 31, 2021, and any subsequent Quarterly Report on Form 10-Q or Current Report on Form 8-K, which are filed with the Securities and Exchange Commission and are available on TransUnion’s website (www.transunion.com/tru) and on the Securities and Exchange Commission’s website (www.sec.gov). TransUnion undertakes no obligation to publicly release the result of any revisions to these forward-looking statements to reflect the impact of events or circumstances that may arise after the date of this presentation. Non-GAAP Financial Information This investor presentation includes certain non-GAAP measures that are more fully described in Exhibit 99.1, “Press release of TransUnion dated April 26, 2022, announcing results for the quarter ended March 31, 2022,” under the heading ‘Non-GAAP Financial Measures,’”, furnished to the Securities and Exchange Commission (“SEC”) on April 26, 2022. These financial measures should be reviewed in conjunction with the relevant GAAP financial measures and are not presented as alternative measures of GAAP. Other companies in our industry may define or calculate these measures differently than we do, limiting their usefulness as comparative measures. Because of these limitations, these non-GAAP financial measures should not be considered in isolation or as substitutes for performance measures calculated in accordance with GAAP. Reconciliations of these non- GAAP financial measures to their most directly comparable GAAP financial measures for each of the periods included in this presentation are included in the tables of Exhibit 99.1 of our Current Report on Form 8-K furnished to the SEC on April 26, 2022, and in Exhibit 99.1 of our Current Reports on Form 8-K furnished to the SEC on February 22, 2022, October 26, 2021, July 27, 2021, April 27, 2021 and February 16, 2021.
© 2022 TransUnion LLC All Rights Reserved | 3 Market commentary and first quarter 2022 highlights Acquisitions update First quarter 2022 financial results 1 2 3 Second quarter and full year 2022 guidance4
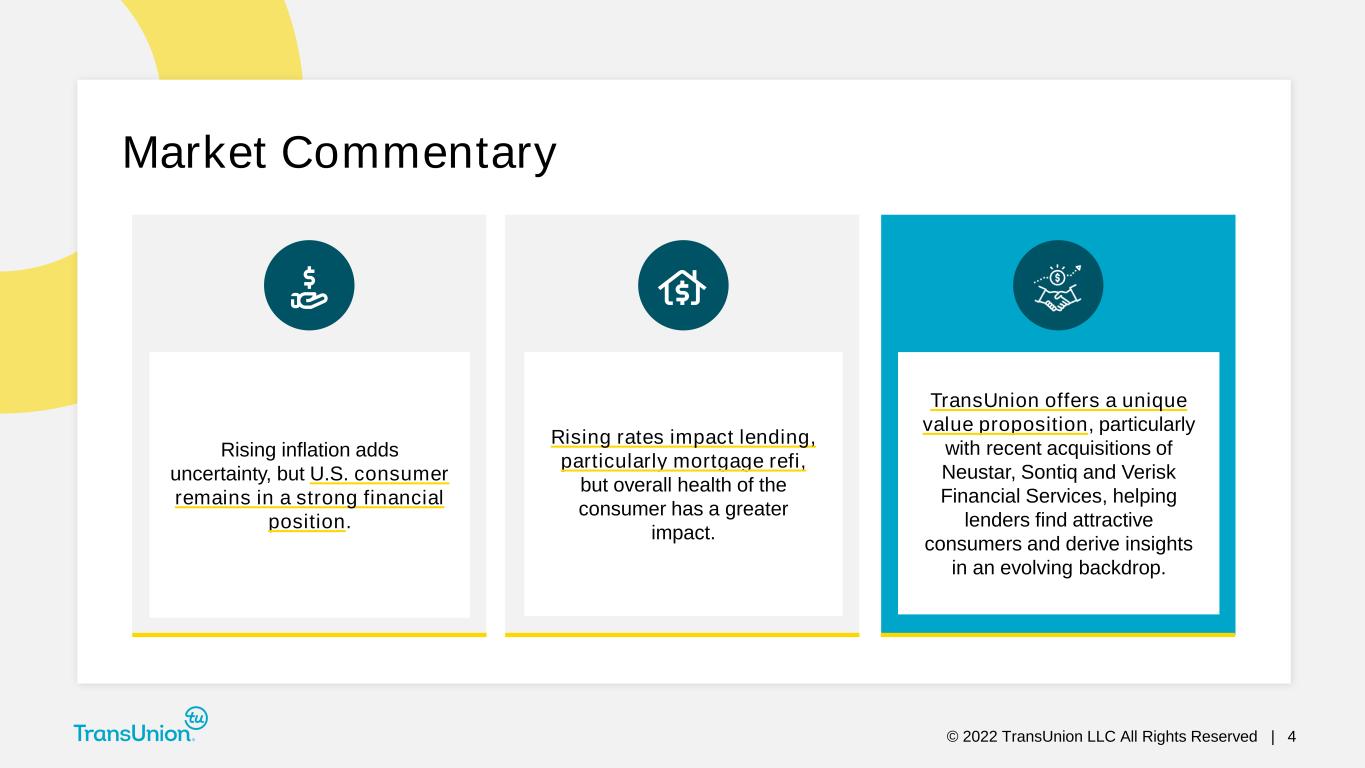
© 2022 TransUnion LLC All Rights Reserved | 4 Market Commentary Rising inflation adds uncertainty, but U.S. consumer remains in a strong financial position. TransUnion offers a unique value proposition, particularly with recent acquisitions of Neustar, Sontiq and Verisk Financial Services, helping lenders find attractive consumers and derive insights in an evolving backdrop. Rising rates impact lending, particularly mortgage refi, but overall health of the consumer has a greater impact.
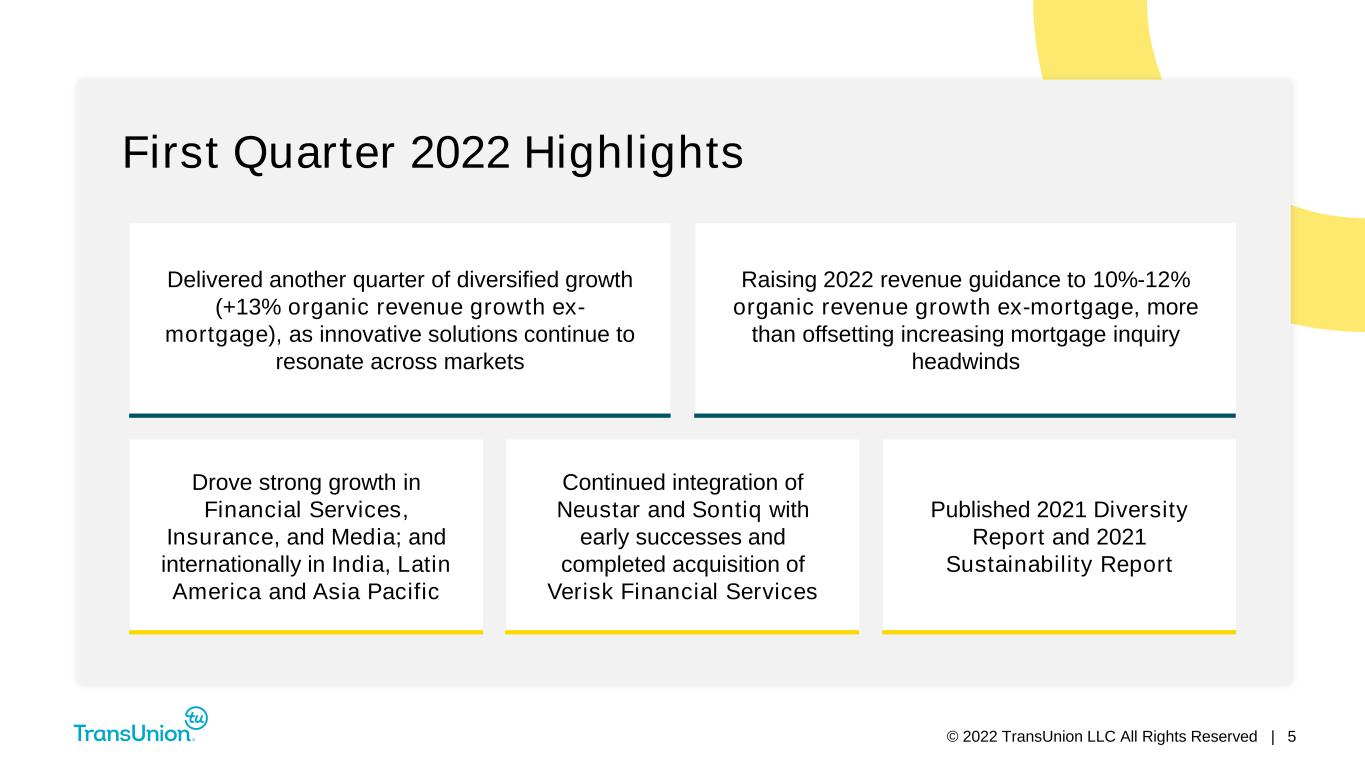
© 2022 TransUnion LLC All Rights Reserved | 5 Drove strong growth in Financial Services, Insurance, and Media; and internationally in India, Latin America and Asia Pacific Continued integration of Neustar and Sontiq with early successes and completed acquisition of Verisk Financial Services Published 2021 Diversity Report and 2021 Sustainability Report Delivered another quarter of diversified growth (+13% organic revenue growth ex- mortgage), as innovative solutions continue to resonate across markets Raising 2022 revenue guidance to 10%-12% organic revenue growth ex-mortgage, more than offsetting increasing mortgage inquiry headwinds First Quarter 2022 Highlights
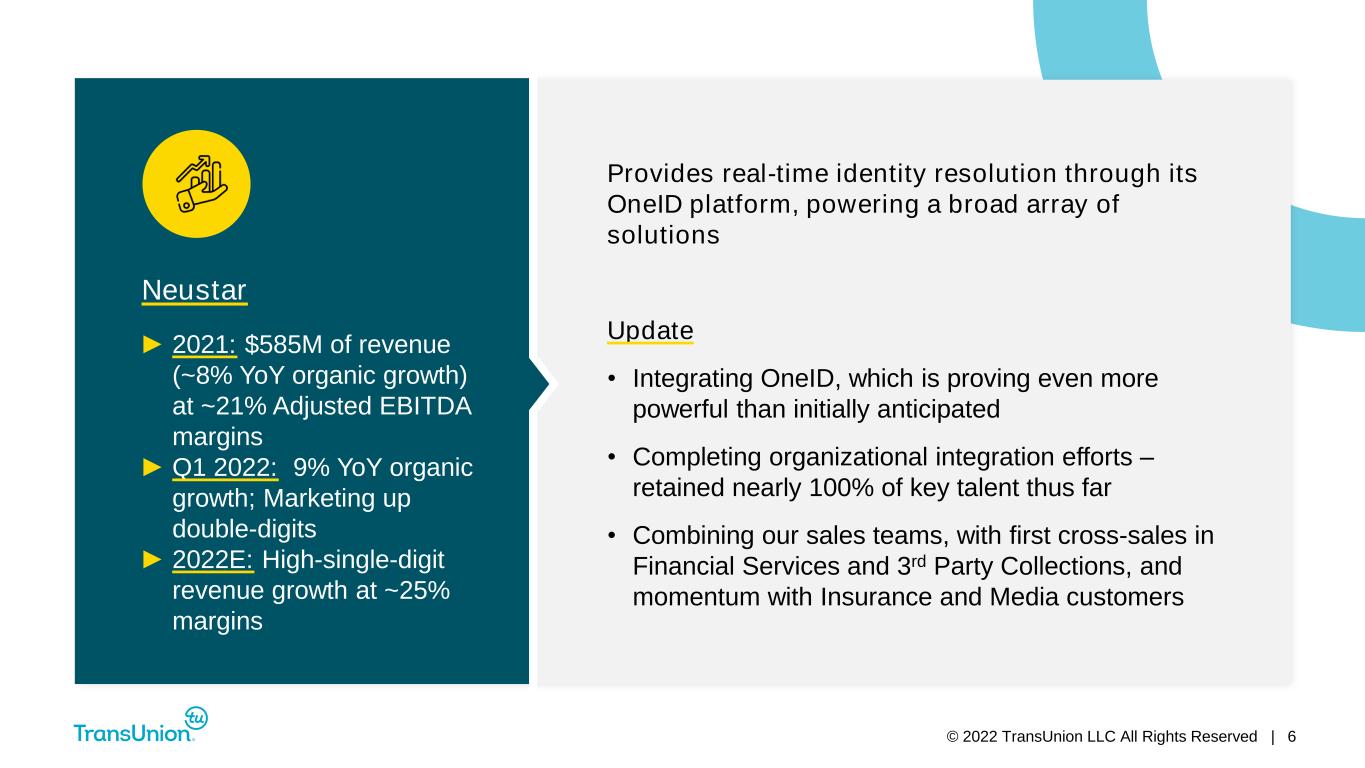
© 2022 TransUnion LLC All Rights Reserved | 6 Provides real-time identity resolution through its OneID platform, powering a broad array of solutions Update • Integrating OneID, which is proving even more powerful than initially anticipated • Completing organizational integration efforts – retained nearly 100% of key talent thus far • Combining our sales teams, with first cross-sales in Financial Services and 3rd Party Collections, and momentum with Insurance and Media customers Neustar ► 2021: $585M of revenue (~8% YoY organic growth) at ~21% Adjusted EBITDA margins ► Q1 2022: 9% YoY organic growth; Marketing up double-digits ► 2022E: High-single-digit revenue growth at ~25% margins
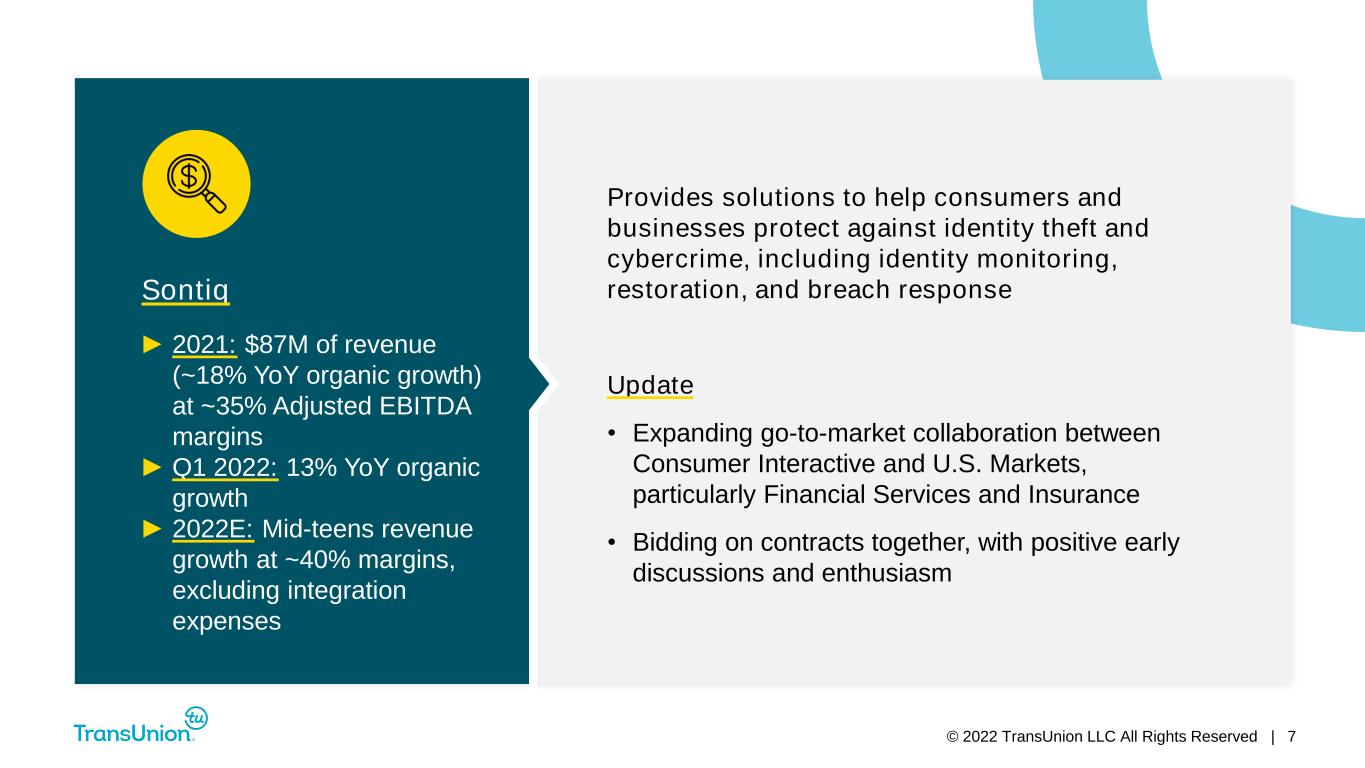
© 2022 TransUnion LLC All Rights Reserved | 7 Sontiq Provides solutions to help consumers and businesses protect against identity theft and cybercrime, including identity monitoring, restoration, and breach response Update • Expanding go-to-market collaboration between Consumer Interactive and U.S. Markets, particularly Financial Services and Insurance • Bidding on contracts together, with positive early discussions and enthusiasm ► 2021: $87M of revenue (~18% YoY organic growth) at ~35% Adjusted EBITDA margins ► Q1 2022: 13% YoY organic growth ► 2022E: Mid-teens revenue growth at ~40% margins, excluding integration expenses
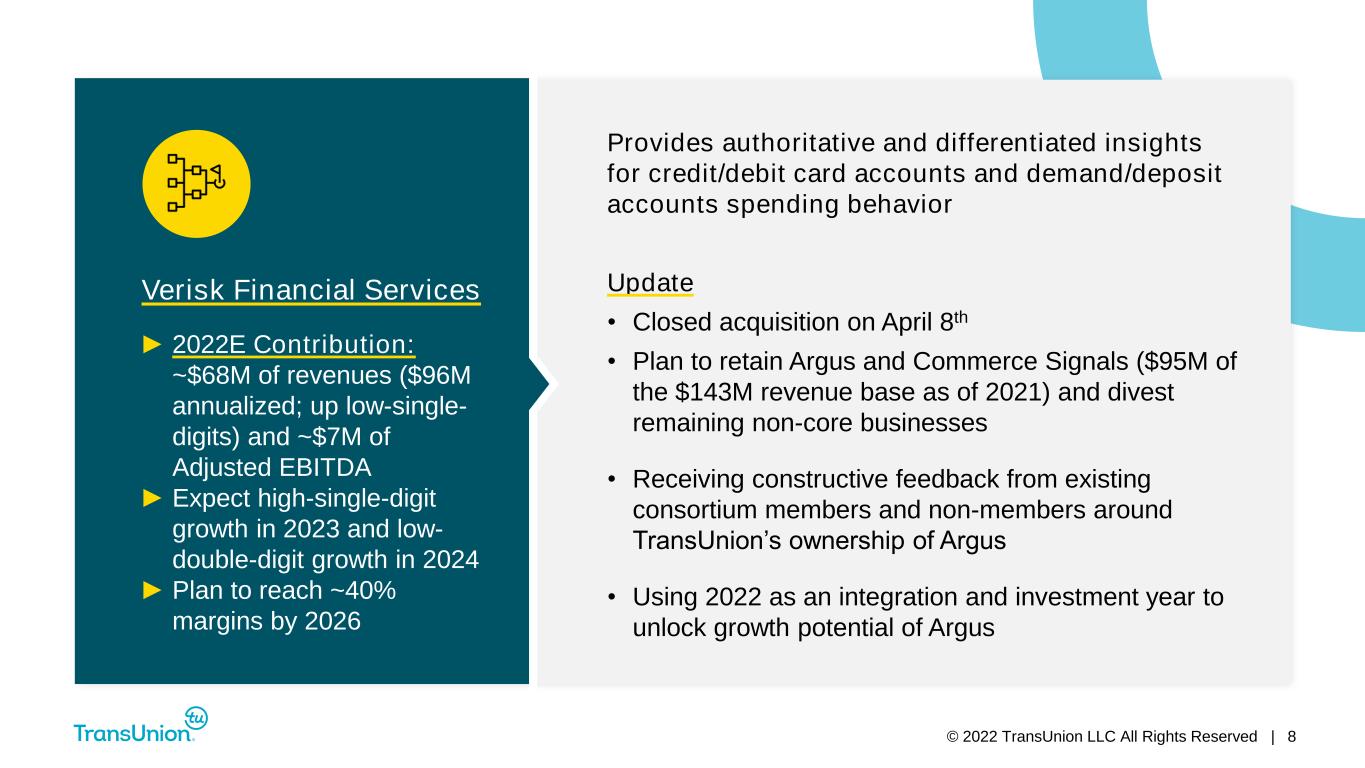
© 2022 TransUnion LLC All Rights Reserved | 8 Provides authoritative and differentiated insights for credit/debit card accounts and demand/deposit accounts spending behavior Update • Closed acquisition on April 8th • Plan to retain Argus and Commerce Signals ($95M of the $143M revenue base as of 2021) and divest remaining non-core businesses • Receiving constructive feedback from existing consortium members and non-members around TransUnion’s ownership of Argus • Using 2022 as an integration and investment year to unlock growth potential of Argus Verisk Financial Services ► 2022E Contribution: ~$68M of revenues ($96M annualized; up low-single- digits) and ~$7M of Adjusted EBITDA ► Expect high-single-digit growth in 2023 and low- double-digit growth in 2024 ► Plan to reach ~40% margins by 2026

© 2022 TransUnion LLC All Rights Reserved | 9 For additional information, refer to the “Non-GAAP Financial Information” section on slide 2. Reported ($M) Y/Y Change Revenue $921 32% Constant Currency Revenue 32% Organic Constant Currency Revenue 8% Adjusted EBITDA $334 20% Constant Currency Adjusted EBITDA 21% Organic Constant Currency Adjusted EBITDA 5% Adjusted Diluted EPS $0.93 11% ►Organic constant currency growth ex-mortgage of +13% ►Adjusted EBITDA margin of 36.3%; excluding Neustar and Sontiq, organic Adjusted EBITDA margin of 38.8% Consolidated Q1 2022 Highlights
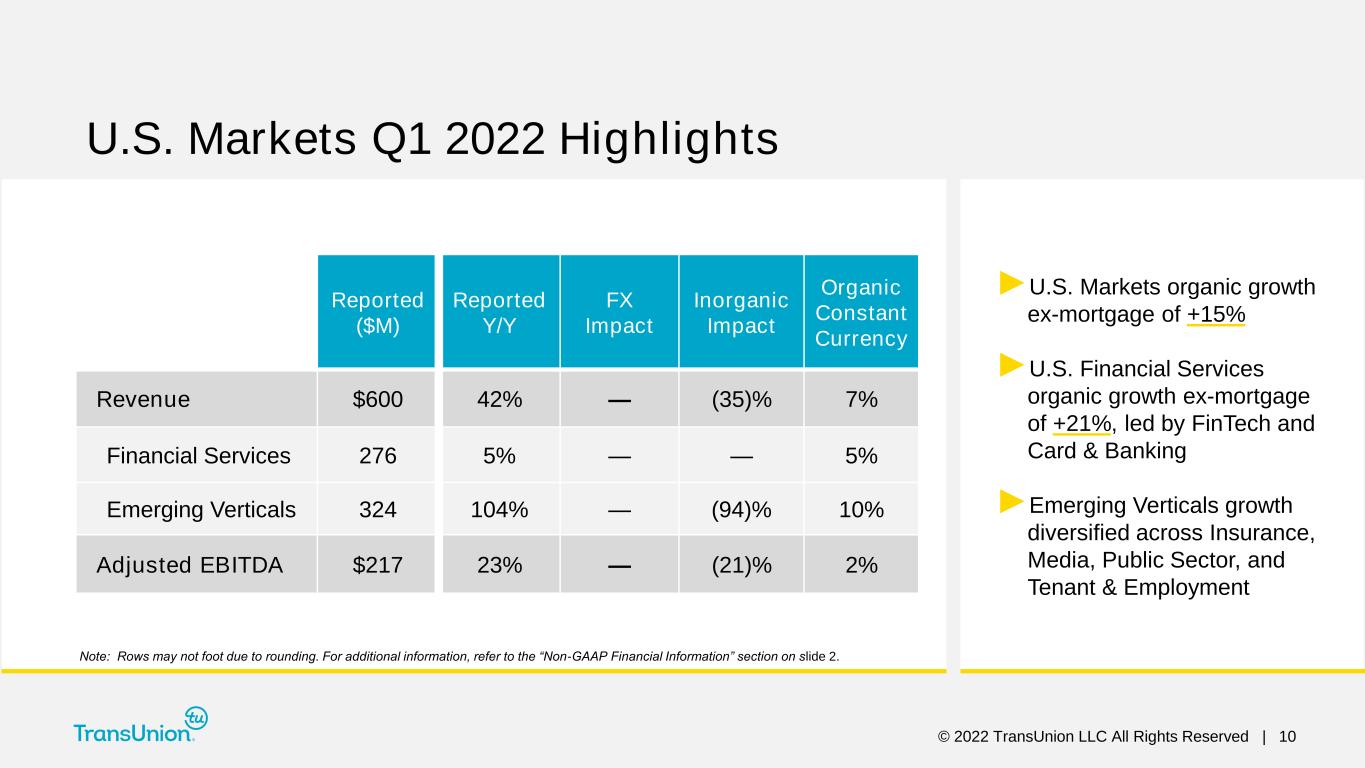
© 2022 TransUnion LLC All Rights Reserved | 10 Reported ($M) Reported Y/Y FX Impact Inorganic Impact Organic Constant Currency Revenue $600 42% — (35)% 7% Financial Services 276 5% — — 5% Emerging Verticals 324 104% — (94)% 10% Adjusted EBITDA $217 23% — (21)% 2% U.S. Markets Q1 2022 Highlights ►U.S. Markets organic growth ex-mortgage of +15% ►U.S. Financial Services organic growth ex-mortgage of +21%, led by FinTech and Card & Banking ►Emerging Verticals growth diversified across Insurance, Media, Public Sector, and Tenant & Employment Note: Rows may not foot due to rounding. For additional information, refer to the “Non-GAAP Financial Information” section on slide 2.

© 2022 TransUnion LLC All Rights Reserved | 11 Reported ($M) Reported Y/Y FX Impact Inorganic Impact Organic Constant Currency Revenue $150 15% — (17)% (3)% Adjusted EBITDA $69 18% — (13)% 5% Consumer Interactive Q1 2022 Highlights ►Direct and indirect channel revenue both declined ►Normalizing demand for paid credit monitoring products following historically strong 2020-2021 Note: Rows may not foot due to rounding. For additional information, refer to the “Non-GAAP Financial Information” section on slide 2.
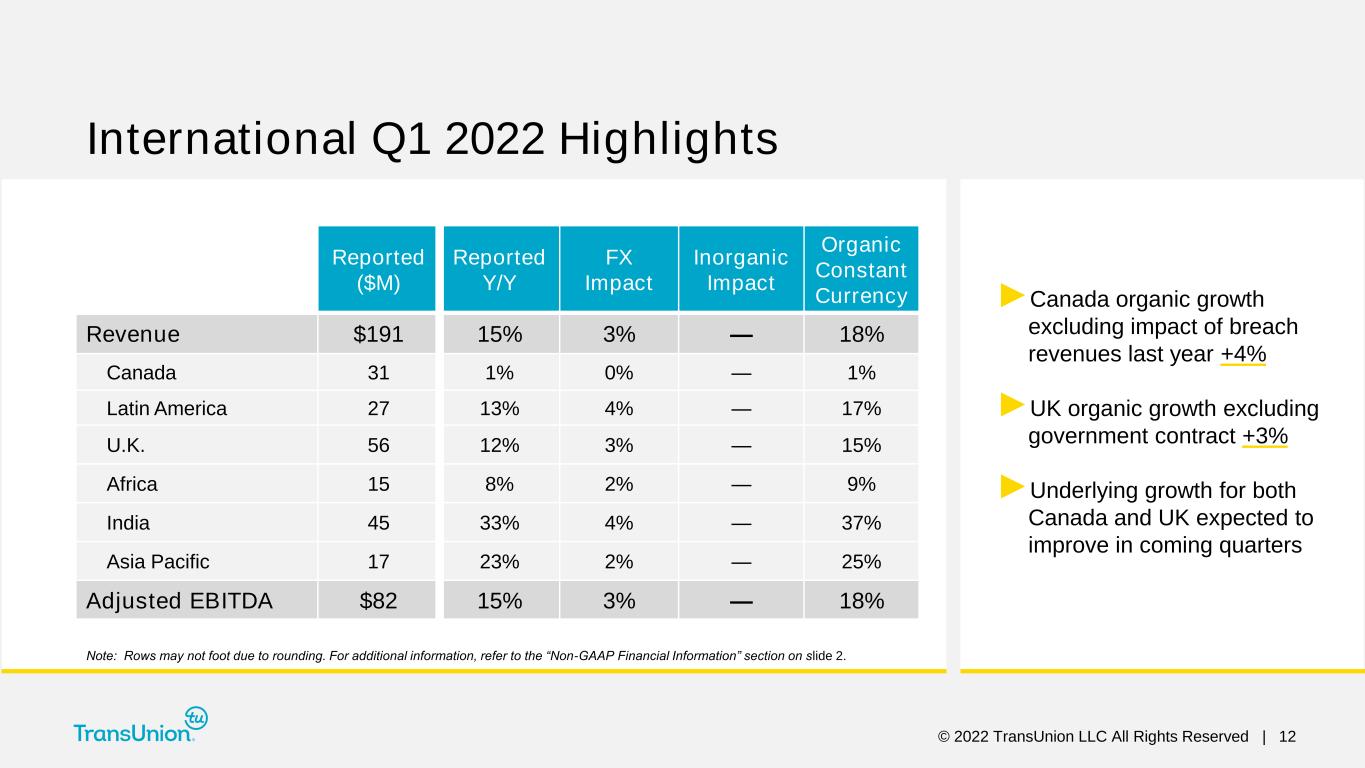
© 2022 TransUnion LLC All Rights Reserved | 12 Reported ($M) Reported Y/Y FX Impact Inorganic Impact Organic Constant Currency Revenue $191 15% 3% — 18% Canada 31 1% 0% — 1% Latin America 27 13% 4% — 17% U.K. 56 12% 3% — 15% Africa 15 8% 2% — 9% India 45 33% 4% — 37% Asia Pacific 17 23% 2% — 25% Adjusted EBITDA $82 15% 3% — 18% International Q1 2022 Highlights ►Canada organic growth excluding impact of breach revenues last year +4% ►UK organic growth excluding government contract +3% ►Underlying growth for both Canada and UK expected to improve in coming quarters Note: Rows may not foot due to rounding. For additional information, refer to the “Non-GAAP Financial Information” section on slide 2.

© 2022 TransUnion LLC All Rights Reserved | 13 TransUnion Has Shown a Consistent Ability to De-Lever via Adjusted EBITDA Growth • Roughly $6B of debt and $1.3B cash at quarter-end • Expecting net leverage of ~3.9x in Q2 2022; in April, deployed $515M of cash for Verisk Financial Services acquisition, and paid $355M for taxes on Healthcare transaction • Expecting to reach ~3.6x net debt to Adjusted EBITDA by end of 2022 2021 and Q1 2022 pro-forma leverage includes Neustar and Sontiq and removes Healthcare. Q2 and FY 2022E pro- forma leverage includes full year of continuing operations of Verisk Financial Services. Net Debt / Adjusted EBITDA Ratio 4.8x 3.9x 3.4x 3.1x 4.2x 3.2x 2.8x 3.9x 3.5x 3.5x ~3.9x ~3.6x 2015 IPO 2015 2016 2017 2018 2019 2020 2021 Pro-Forma 2021 Pro-Forma Q1 2022 Pro-Forma Q2 2022E Pro-Forma 2022E

© 2022 TransUnion LLC All Rights Reserved | 14 Reported Revenue: $958M to $968M +32% to +33% Assumed M&A contribution: ~27pt. benefit Assumed FX contribution: ~(1)pt. headwind Organic Constant Currency Revenue: +6% to +7% Assumed Mortgage impact: ~(4.5)pt. headwind Organic CC Revenue ex. Mortgage: +10.5% to +11.5% Adjusted EBITDA: $347M to $353M +17% to +20% Assumed FX contribution: ~(1)pt. headwind Adjusted EBITDA Margin 36.2% to 36.5% Adjusted EBITDA Margin bps change: -440bps to -400bps Adjusted Diluted EPS: $0.96 to $0.99 +8% to +11% For additional information, refer to the “Non-GAAP Financial Information” section on slide 2. Q2 2022 Guidance ►Revenue: Expecting another quarter of double-digit organic constant currency growth ex- mortgage ►Adjusted EBITDA: Margin comparability impacted by lower margin profile of acquisitions
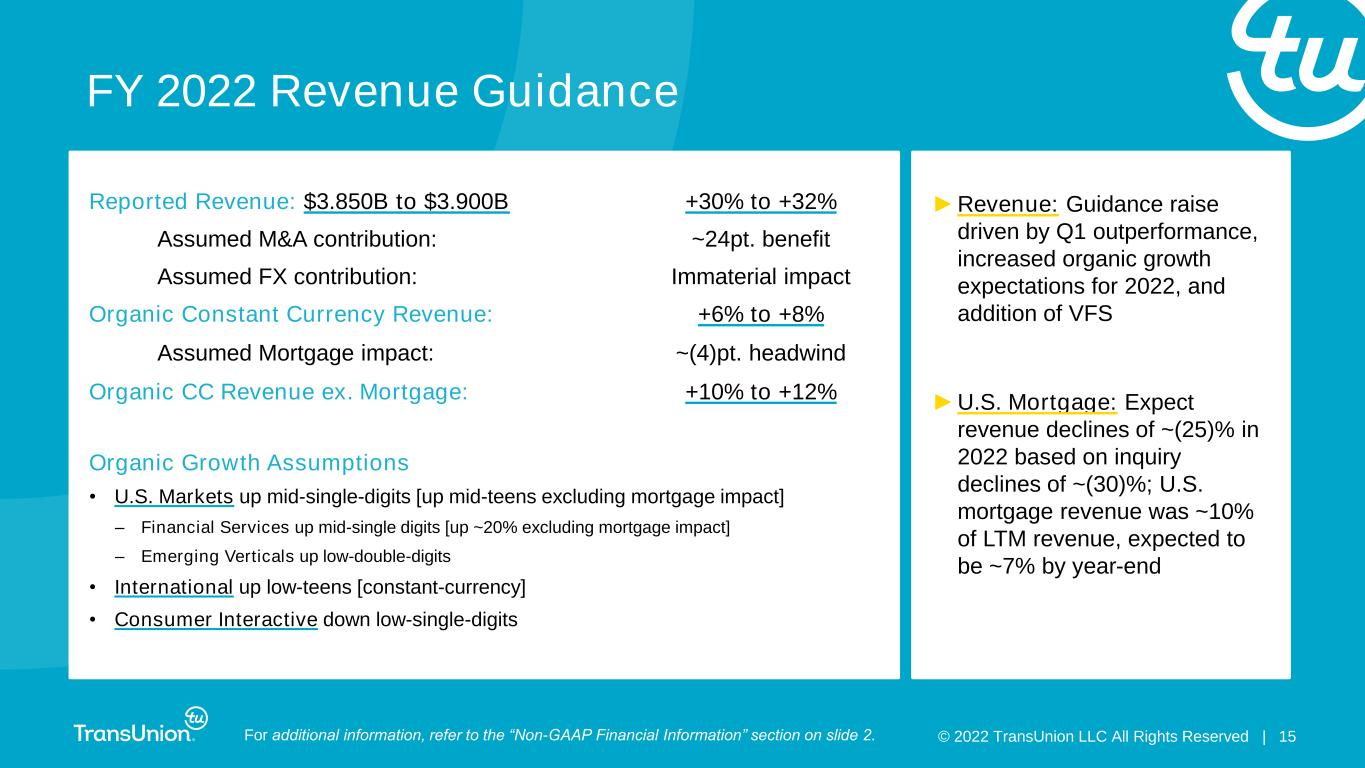
© 2022 TransUnion LLC All Rights Reserved | 15 Reported Revenue: $3.850B to $3.900B +30% to +32% Assumed M&A contribution: ~24pt. benefit Assumed FX contribution: Immaterial impact Organic Constant Currency Revenue: +6% to +8% Assumed Mortgage impact: ~(4)pt. headwind Organic CC Revenue ex. Mortgage: +10% to +12% Organic Growth Assumptions • U.S. Markets up mid-single-digits [up mid-teens excluding mortgage impact] – Financial Services up mid-single digits [up ~20% excluding mortgage impact] – Emerging Verticals up low-double-digits • International up low-teens [constant-currency] • Consumer Interactive down low-single-digits FY 2022 Revenue Guidance ►Revenue: Guidance raise driven by Q1 outperformance, increased organic growth expectations for 2022, and addition of VFS ►U.S. Mortgage: Expect revenue declines of ~(25)% in 2022 based on inquiry declines of ~(30)%; U.S. mortgage revenue was ~10% of LTM revenue, expected to be ~7% by year-end For additional information, refer to the “Non-GAAP Financial Information” section on slide 2.
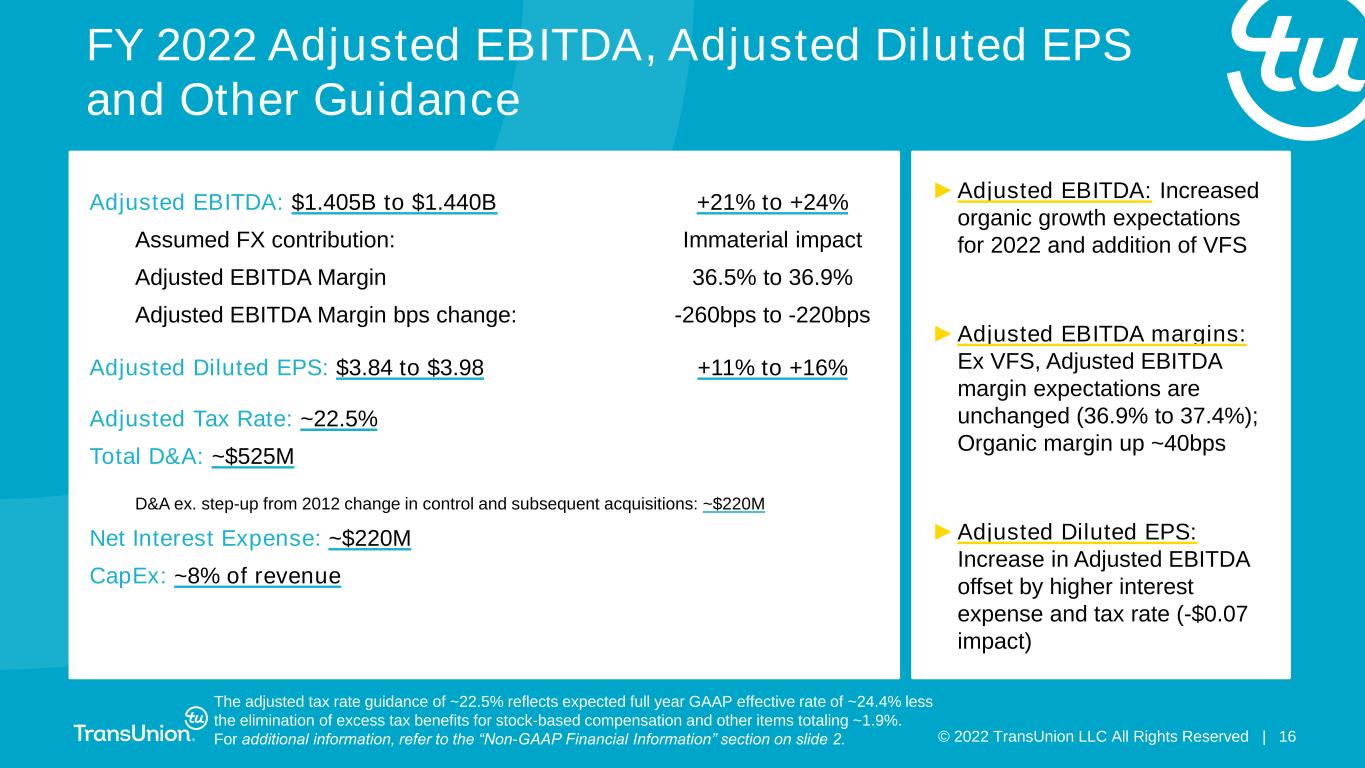
© 2022 TransUnion LLC All Rights Reserved | 16 ►Adjusted EBITDA: Increased organic growth expectations for 2022 and addition of VFS ►Adjusted EBITDA margins: Ex VFS, Adjusted EBITDA margin expectations are unchanged (36.9% to 37.4%); Organic margin up ~40bps ►Adjusted Diluted EPS: Increase in Adjusted EBITDA offset by higher interest expense and tax rate (-$0.07 impact) Adjusted EBITDA: $1.405B to $1.440B +21% to +24% Assumed FX contribution: Immaterial impact Adjusted EBITDA Margin 36.5% to 36.9% Adjusted EBITDA Margin bps change: -260bps to -220bps Adjusted Diluted EPS: $3.84 to $3.98 +11% to +16% Adjusted Tax Rate: ~22.5% Total D&A: ~$525M D&A ex. step-up from 2012 change in control and subsequent acquisitions: ~$220M Net Interest Expense: ~$220M CapEx: ~8% of revenue FY 2022 Adjusted EBITDA, Adjusted Diluted EPS and Other Guidance The adjusted tax rate guidance of ~22.5% reflects expected full year GAAP effective rate of ~24.4% less the elimination of excess tax benefits for stock-based compensation and other items totaling ~1.9%. For additional information, refer to the “Non-GAAP Financial Information” section on slide 2.
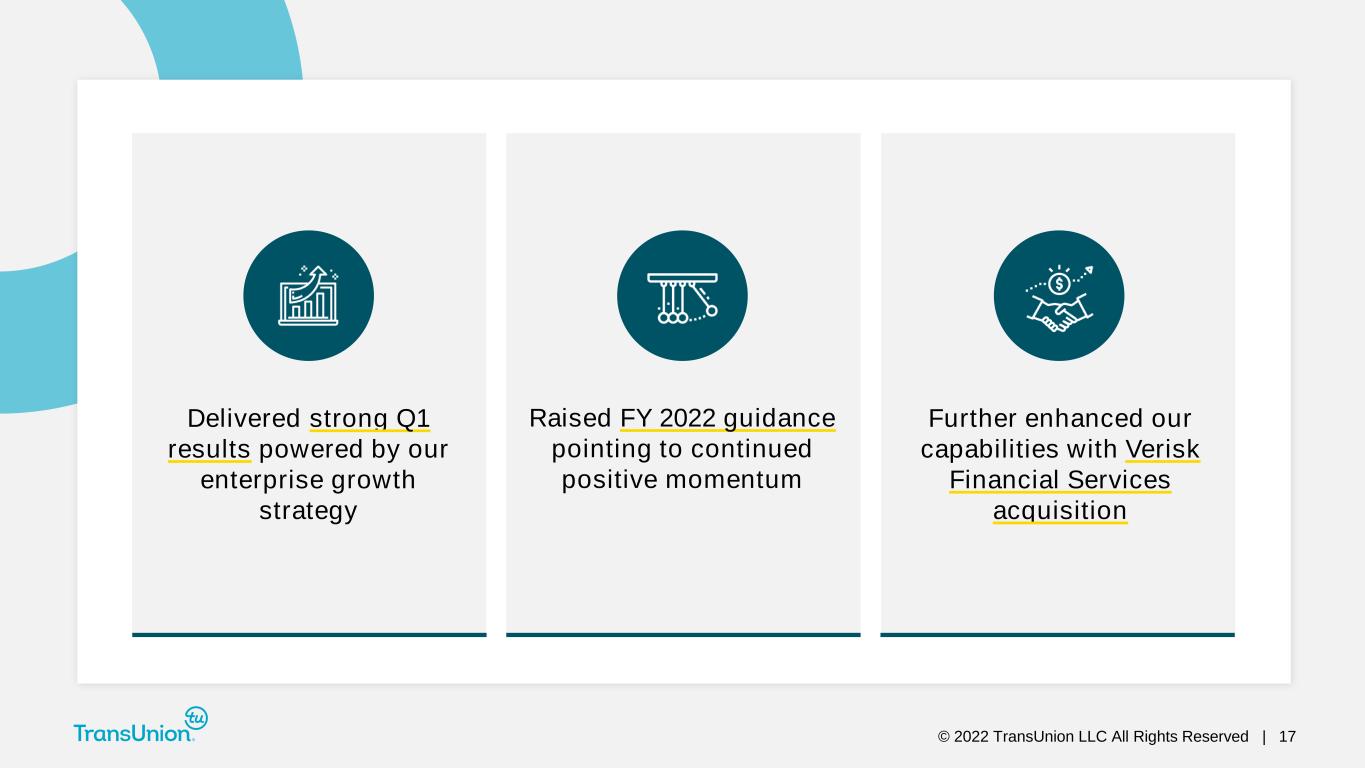
© 2022 TransUnion LLC All Rights Reserved | 17 Raised FY 2022 guidance pointing to continued positive momentum Delivered strong Q1 results powered by our enterprise growth strategy Further enhanced our capabilities with Verisk Financial Services acquisition

© 2022 TransUnion LLC All Rights Reserved | 18 Q&A


