
Second Quarter 2023 Earnings July 25, 2023 Chris Cartwright, President and CEO Todd Cello, CFO Exhibit 99.2
2@ Copyright 2023 TransUnion, its subsidiaries and/or affiliates. All Rights Reserved. Non-GAAP Financial InformationForward-Looking Statements This presentation contains forward-looking statements within the meaning of the Private Securities Litigation Reform Act of 1995. These statements are based on the current beliefs and expectations of TransUnion’s management and are subject to significant risks and uncertainties. Actual results may differ materially from those described in the forward-looking statements. Factors that could cause TransUnion’s actual results to differ materially from those described in the forward-looking statements include: macroeconomic effects and changes in market conditions, including the impact of inflation, risk of recession and industry trends and adverse developments in the debt, consumer credit and financial services markets; our ability to provide competitive services and prices; our ability to retain or renew existing agreements with large or long-term customers; our ability to maintain the security and integrity of our data; our ability to deliver services timely without interruption; our ability to maintain our access to data sources; government regulation and changes in the regulatory environment; litigation or regulatory proceedings; our ability to effectively manage our costs; economic and political stability in the United States and international markets where we operate; our ability to effectively develop and maintain strategic alliances and joint ventures; our ability to timely develop new services and the market’s willingness to adopt our new services; our ability to manage and expand our operations and keep up with rapidly changing technologies; our ability to acquire businesses, successfully secure financing for our acquisitions, timely consummate our acquisitions, successfully integrate the operations of our acquisitions, control the costs of integrating our acquisitions and realize the intended benefits of such acquisitions; the war in Ukraine and escalating geopolitical tensions as a result of Russia’s invasion of Ukraine; risks related to our indebtedness, including our ability to make timely payments of principal and interest and our ability to satisfy covenants in the agreements governing our indebtedness; our ability to maintain our liquidity; and other one-time events and other factors that can be found in TransUnion’s Annual Report on Form 10-K for the year ended December 31, 2022, and any subsequent Quarterly Report on Form 10-Q or Current Report on Form 8-K, which are filed with the Securities and Exchange Commission and are available on TransUnion’s website (www.transunion.com/tru) and on the Securities and Exchange Commission’s website (www.sec.gov). TransUnion undertakes no obligation to publicly release the result of any revisions to these forward-looking statements to reflect the impact of events or circumstances that may arise after the date of this presentation. This investor presentation includes certain non- GAAP measures that are more fully described in the appendices to the presentation. Exhibit 99.1, “Press release of TransUnion dated July 25, 2023, announcing results for the quarter ended June 30, 2023,” under the heading ‘Non-GAAP Financial Measures,’” furnished to the Securities and Exchange Commission (“SEC”) on July 25, 2023. These financial measures should be reviewed in conjunction with the relevant GAAP financial measures and are not presented as alternative measures of GAAP. Other companies in our industry may define or calculate these measures differently than we do, limiting their usefulness as comparative measures. Because of these limitations, these non-GAAP financial measures should not be considered in isolation or as substitutes for performance measures calculated in accordance with GAAP. Reconciliations of these non-GAAP financial measures to their most directly comparable GAAP financial measures for each of the periods included in this presentation are included in the Appendices at the back of this investor presentation.
3@ Copyright 2023 TransUnion, its subsidiaries and/or affiliates. All Rights Reserved. Economic perspectives and financial highlights Spotlight on Global Capability Centers (GCCs) Second quarter 2023 financial results 1 2 3 Third quarter and full-year 2023 guidance4
4@ Copyright 2023 TransUnion, its subsidiaries and/or affiliates. All Rights Reserved. Economic conditions stable across TransUnion’s markets U.S. consumer credit demand healthy as employment and wages remain strong; credit metrics normalizing Emerging markets growth continues with loan volume increases driven by strong consumer demand Canada and UK conditions similar to U.S. as consumers contend with high inflation and interest rates U.S. lenders more cautious but still actively originating, albeit at below-peak levels
5@ Copyright 2023 TransUnion, its subsidiaries and/or affiliates. All Rights Reserved. *Revenue growth figures referenced above are organic constant currency. Second quarter 2023 highlights Revenue, Adjusted EBITDA and Adjusted Diluted EPS all exceeded guidance 3% organic revenue growth,* or 2% excluding U.S. mortgage 9th straight quarter of double-digit International revenue growth,* led by India, Asia Pacific, Africa and Canada Strategic partnership and minority investment in Truework to expand income and employment verification solutions Prepayment of $75M in debt or $150M year-to- date; intend to make additional prepayments in 2023 For additional information, refer to the “Non-GAAP Financial Information” section on slide 2 and the Appendix at the back of this investor presentation.
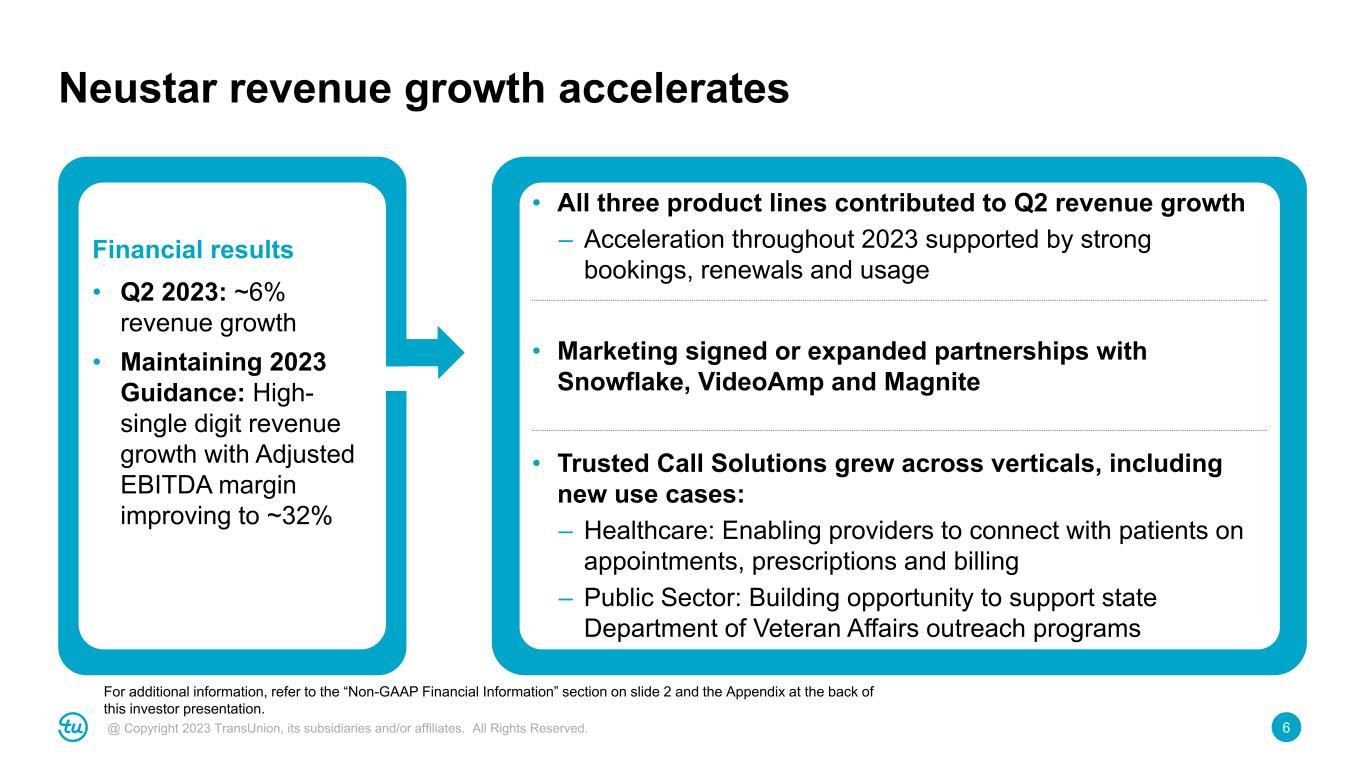
6@ Copyright 2023 TransUnion, its subsidiaries and/or affiliates. All Rights Reserved. Neustar revenue growth accelerates • All three product lines contributed to Q2 revenue growth – Acceleration throughout 2023 supported by strong bookings, renewals and usage • Marketing signed or expanded partnerships with Snowflake, VideoAmp and Magnite • Trusted Call Solutions grew across verticals, including new use cases: – Healthcare: Enabling providers to connect with patients on appointments, prescriptions and billing – Public Sector: Building opportunity to support state Department of Veteran Affairs outreach programs Financial results • Q2 2023: ~6% revenue growth • Maintaining 2023 Guidance: High- single digit revenue growth with Adjusted EBITDA margin improving to ~32% For additional information, refer to the “Non-GAAP Financial Information” section on slide 2 and the Appendix at the back of this investor presentation.
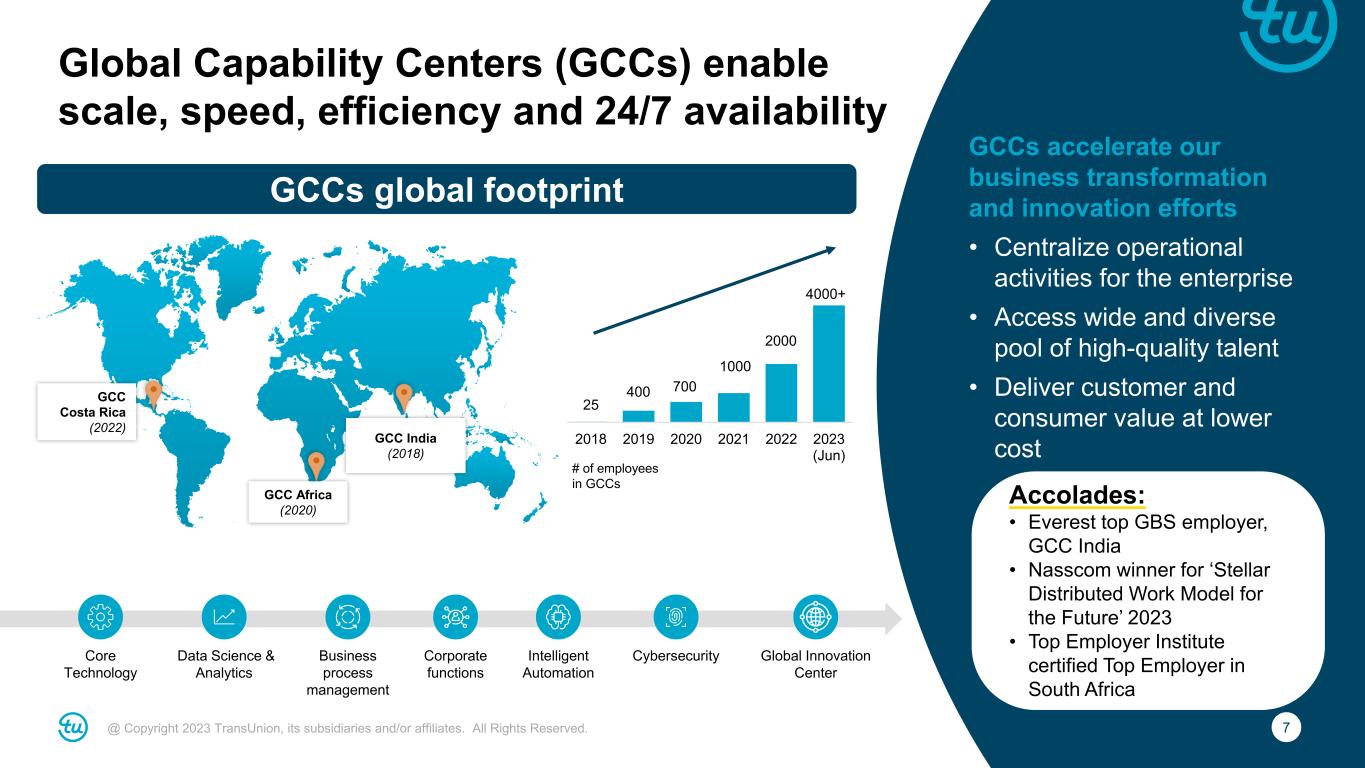
7@ Copyright 2023 TransUnion, its subsidiaries and/or affiliates. All Rights Reserved. GCCs accelerate our business transformation and innovation efforts • Centralize operational activities for the enterprise • Access wide and diverse pool of high-quality talent • Deliver customer and consumer value at lower cost Global Capability Centers (GCCs) enable scale, speed, efficiency and 24/7 availability 25 400 700 1000 2000 4000+ 2018 2019 2020 2021 2022 2023 (Jun) Core Technology Data Science & Analytics Business process management Corporate functions Intelligent Automation Cybersecurity Global Innovation Center GCC Africa (2020) GCC Costa Rica (2022) # of employees in GCCs Accolades: • Everest top GBS employer, GCC India • Nasscom winner for ‘Stellar Distributed Work Model for the Future’ 2023 • Top Employer Institute certified Top Employer in South Africa GCCs global footprint GCC India (2018)
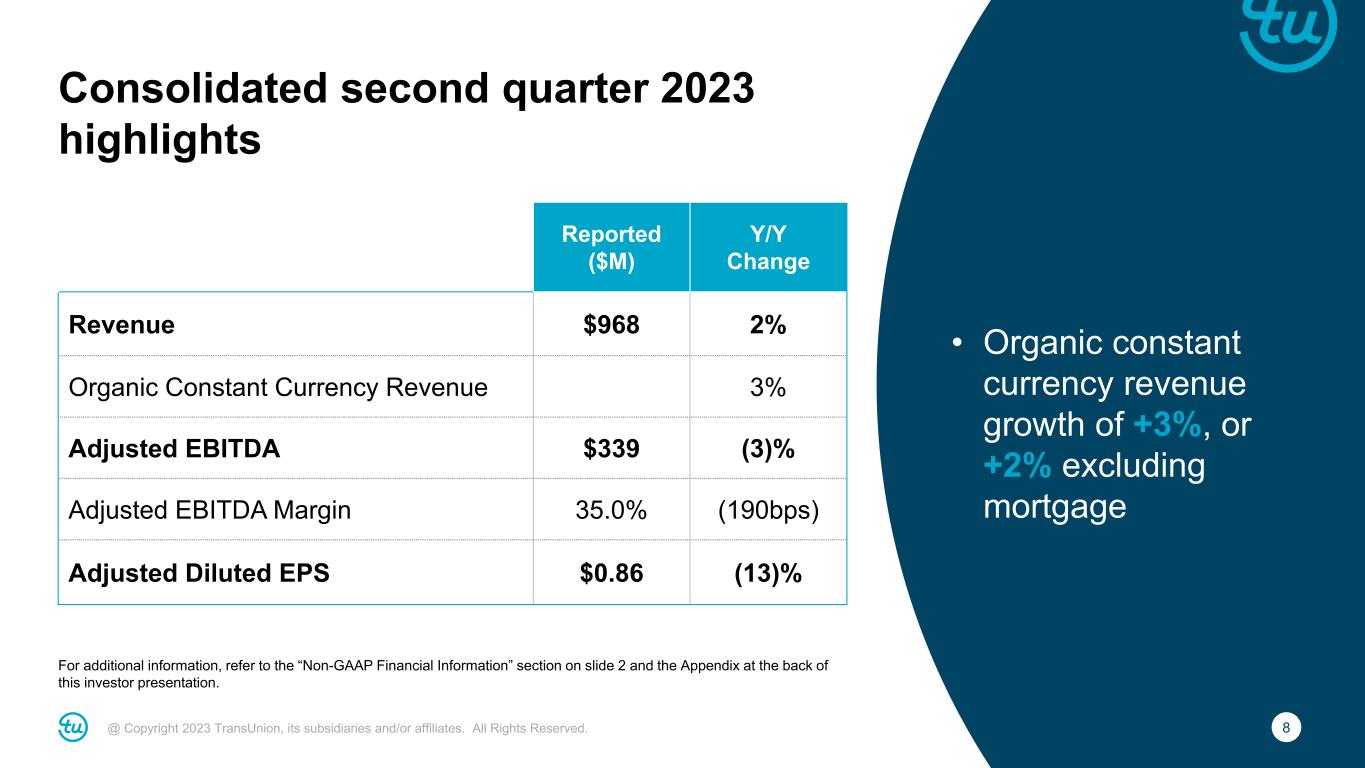
8@ Copyright 2023 TransUnion, its subsidiaries and/or affiliates. All Rights Reserved. Consolidated second quarter 2023 highlights For additional information, refer to the “Non-GAAP Financial Information” section on slide 2 and the Appendix at the back of this investor presentation. Reported ($M) Y/Y Change Revenue $968 2% Organic Constant Currency Revenue 3% Adjusted EBITDA $339 (3)% Adjusted EBITDA Margin 35.0% (190bps) Adjusted Diluted EPS $0.86 (13)% • Organic constant currency revenue growth of +3%, or +2% excluding mortgage
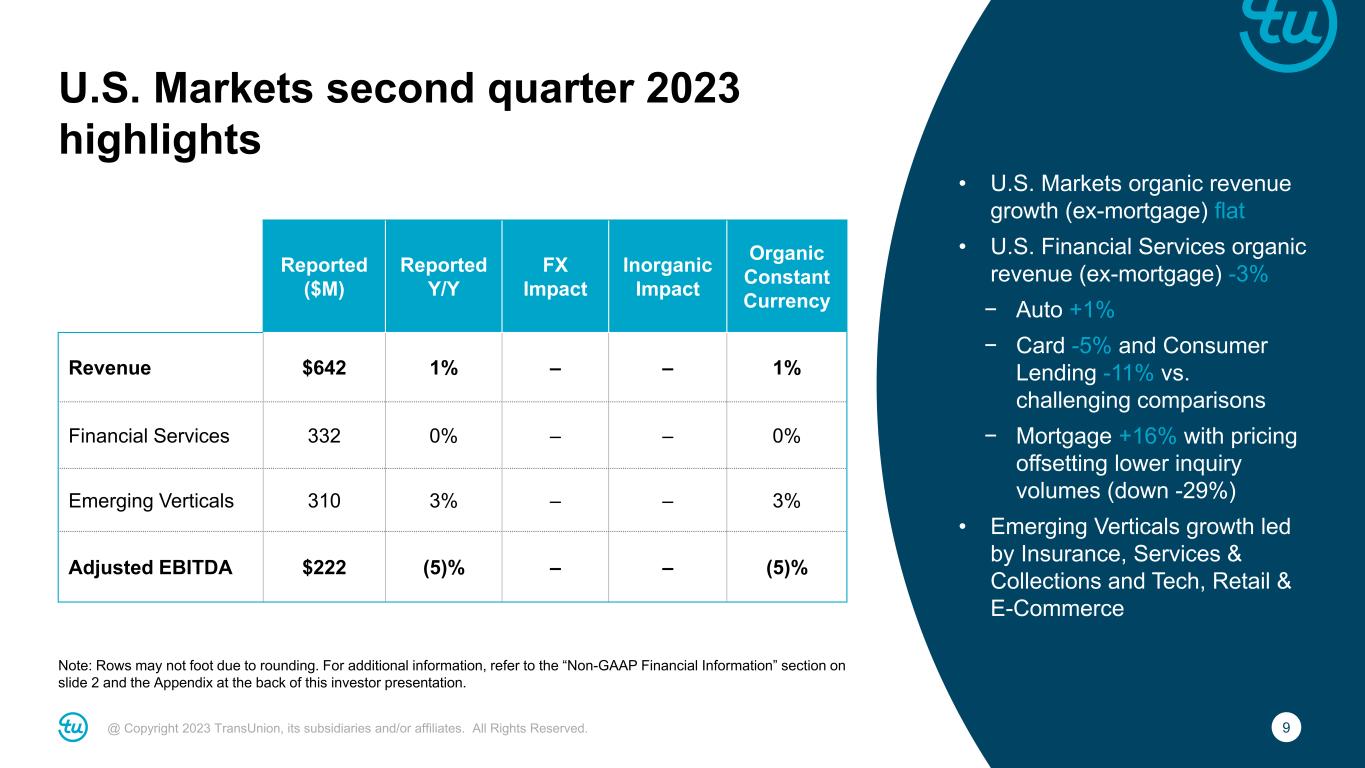
9@ Copyright 2023 TransUnion, its subsidiaries and/or affiliates. All Rights Reserved. U.S. Markets second quarter 2023 highlights Note: Rows may not foot due to rounding. For additional information, refer to the “Non-GAAP Financial Information” section on slide 2 and the Appendix at the back of this investor presentation. • U.S. Markets organic revenue growth (ex-mortgage) flat • U.S. Financial Services organic revenue (ex-mortgage) -3% − Auto +1% − Card -5% and Consumer Lending -11% vs. challenging comparisons − Mortgage +16% with pricing offsetting lower inquiry volumes (down -29%) • Emerging Verticals growth led by Insurance, Services & Collections and Tech, Retail & E-Commerce Reported ($M) Reported Y/Y FX Impact Inorganic Impact Organic Constant Currency Revenue $642 1% – – 1% Financial Services 332 0% – – 0% Emerging Verticals 310 3% – – 3% Adjusted EBITDA $222 (5)% – – (5)%
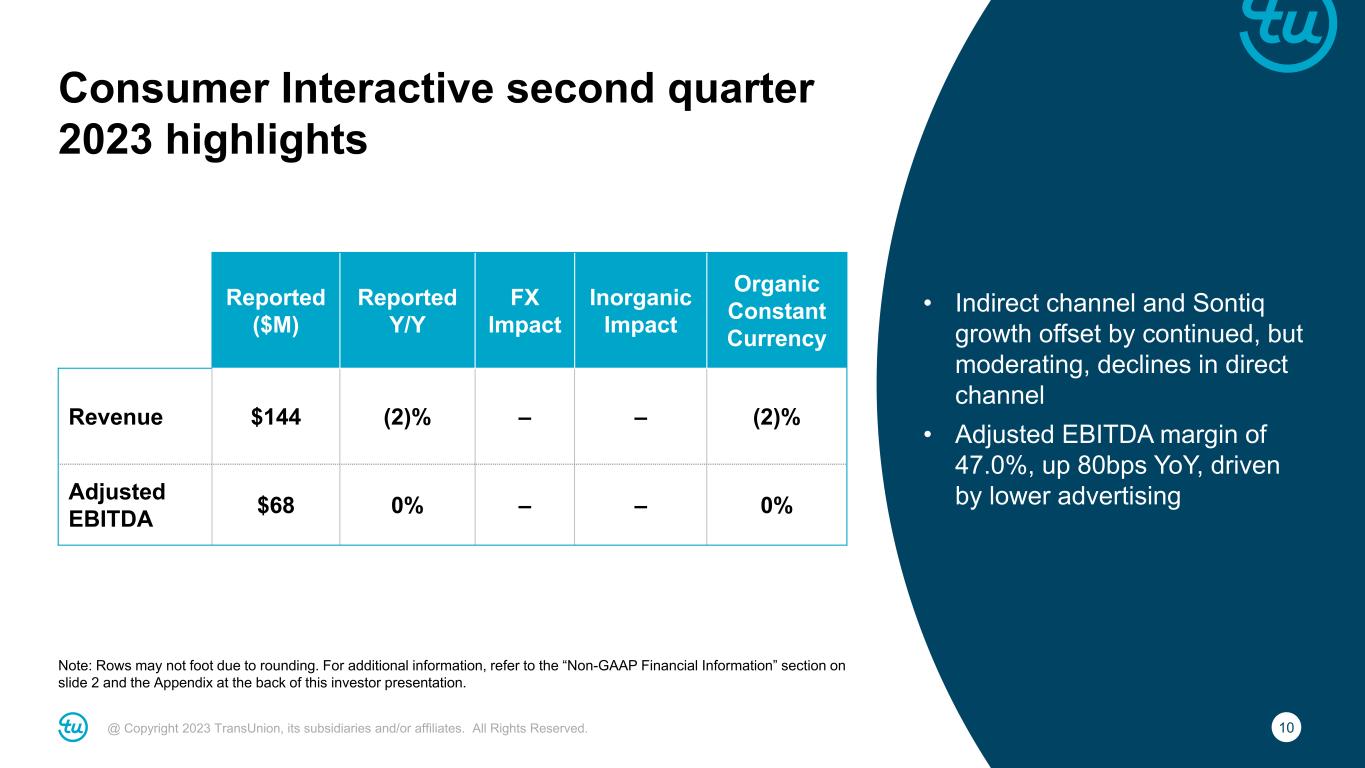
10@ Copyright 2023 TransUnion, its subsidiaries and/or affiliates. All Rights Reserved. Consumer Interactive second quarter 2023 highlights Note: Rows may not foot due to rounding. For additional information, refer to the “Non-GAAP Financial Information” section on slide 2 and the Appendix at the back of this investor presentation. • Indirect channel and Sontiq growth offset by continued, but moderating, declines in direct channel • Adjusted EBITDA margin of 47.0%, up 80bps YoY, driven by lower advertising Reported ($M) Reported Y/Y FX Impact Inorganic Impact Organic Constant Currency Revenue $144 (2)% – – (2)% Adjusted EBITDA $68 0% – – 0%
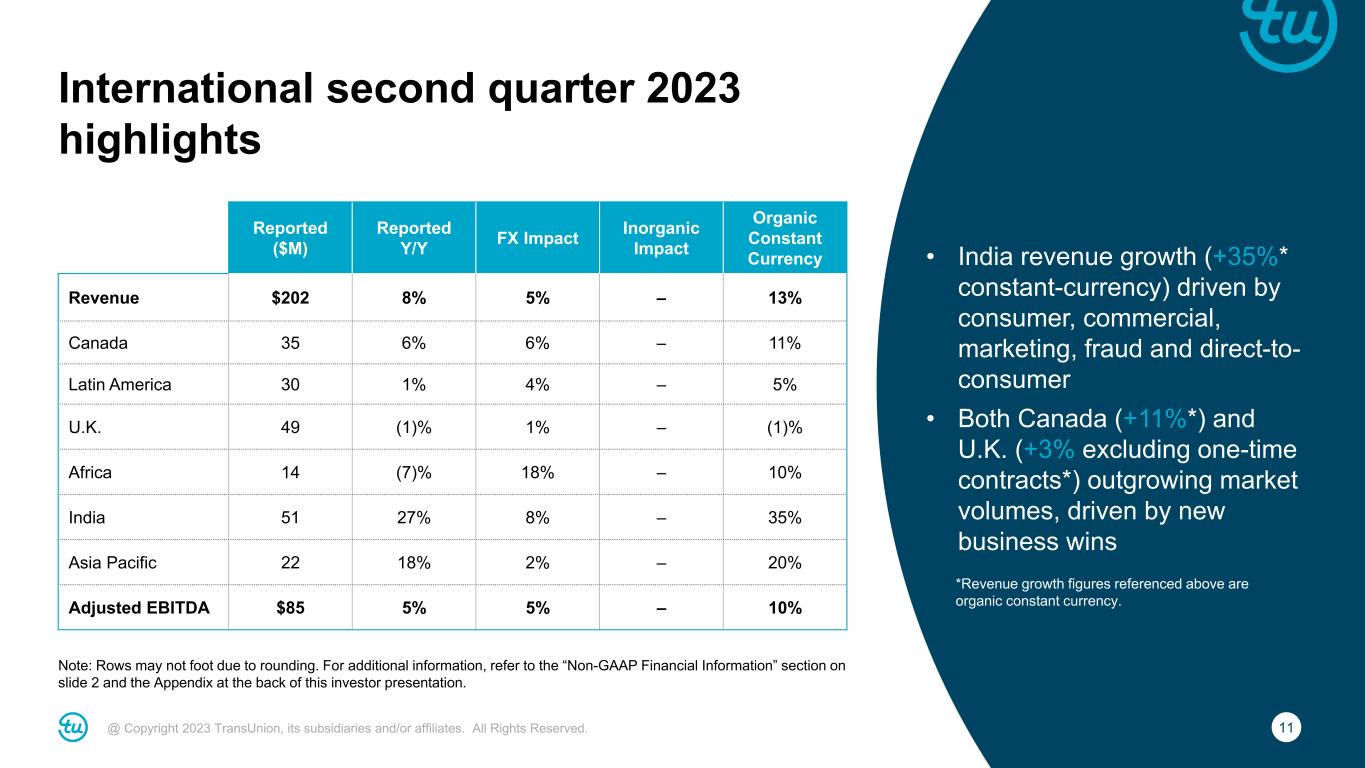
11@ Copyright 2023 TransUnion, its subsidiaries and/or affiliates. All Rights Reserved. International second quarter 2023 highlights Note: Rows may not foot due to rounding. For additional information, refer to the “Non-GAAP Financial Information” section on slide 2 and the Appendix at the back of this investor presentation. • India revenue growth (+35%* constant-currency) driven by consumer, commercial, marketing, fraud and direct-to- consumer • Both Canada (+11%*) and U.K. (+3% excluding one-time contracts*) outgrowing market volumes, driven by new business wins Reported ($M) Reported Y/Y FX Impact Inorganic Impact Organic Constant Currency Revenue $202 8% 5% – 13% Canada 35 6% 6% – 11% Latin America 30 1% 4% – 5% U.K. 49 (1)% 1% – (1)% Africa 14 (7)% 18% – 10% India 51 27% 8% – 35% Asia Pacific 22 18% 2% – 20% Adjusted EBITDA $85 5% 5% – 10% *Revenue growth figures referenced above are organic constant currency.
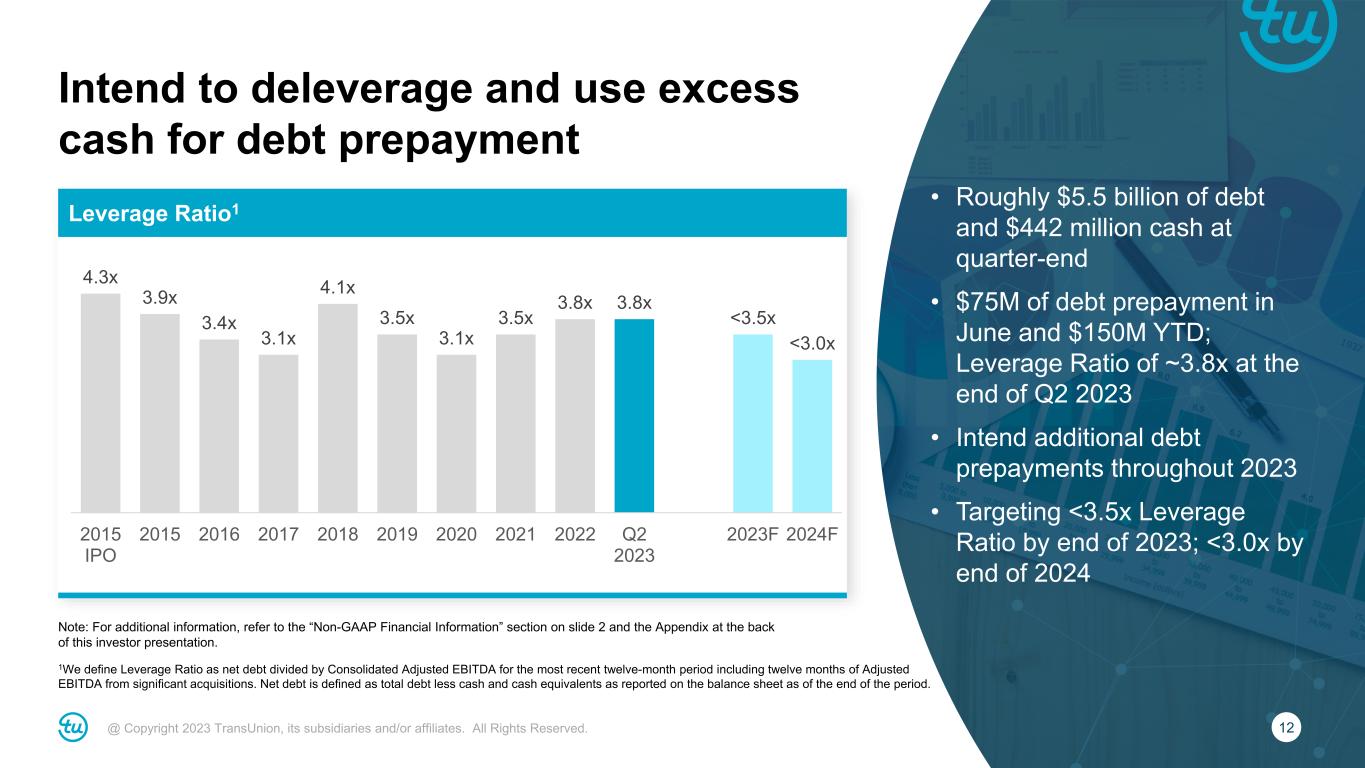
12@ Copyright 2023 TransUnion, its subsidiaries and/or affiliates. All Rights Reserved. • Roughly $5.5 billion of debt and $442 million cash at quarter-end • $75M of debt prepayment in June and $150M YTD; Leverage Ratio of ~3.8x at the end of Q2 2023 • Intend additional debt prepayments throughout 2023 • Targeting <3.5x Leverage Ratio by end of 2023; <3.0x by end of 2024 1We define Leverage Ratio as net debt divided by Consolidated Adjusted EBITDA for the most recent twelve-month period including twelve months of Adjusted EBITDA from significant acquisitions. Net debt is defined as total debt less cash and cash equivalents as reported on the balance sheet as of the end of the period. Note: For additional information, refer to the “Non-GAAP Financial Information” section on slide 2 and the Appendix at the back of this investor presentation. Intend to deleverage and use excess cash for debt prepayment Leverage Ratio1 4.3x 3.9x 3.4x 3.1x 4.1x 3.5x 3.1x 3.5x 3.8x 3.8x <3.5x <3.0x 2015 IPO 2015 2016 2017 2018 2019 2020 2021 2022 Q2 2023 2023F 2024F

13@ Copyright 2023 TransUnion, its subsidiaries and/or affiliates. All Rights Reserved. Reported Revenue: $973M to $988M +4% to +5% Assumed M&A contribution: No impact Assumed FX contribution: Insignificant Organic Constant Currency Revenue: +4% to +5% Assumed mortgage impact: ~1.5pt. benefit Organic CC Revenue ex. mortgage: +2.5% to +3.5% Adjusted EBITDA: $361M to $370M +6% to +9% Assumed FX contribution: Insignificant Adjusted EBITDA margin: 37.1% to 37.4% Adjusted EBITDA margin bps change: +80bps to +110bps Adjusted Diluted EPS: $0.92 to $0.95 (1%) to +2% Note: For additional information, refer to the “Non-GAAP Financial Information” section on slide 2 and the Appendix at the back of this investor presentation. Revenue Third quarter 2023 guidance Strong results in International and improving growth in U.S. Markets Adjusted EBITDA Sequential margin improvement driven by higher revenues, Neustar synergies and proactive cost actions Note: For additional information, refer to the “Non-GAAP Financial Information” section on slide 2 and the Appendix at the back of this investor presentation.

14@ Copyright 2023 TransUnion, its subsidiaries and/or affiliates. All Rights Reserved. Organic Growth Assumptions • Maintaining FY guidance to account for uncertain market conditions • U.S. mortgage: Now expect ~20 percent revenue growth based on ~25 percent inquiry decline; U.S. mortgage was ~6.5% of LTM revenues Note: For additional information, refer to the “Non-GAAP Financial Information” section on slide 2 and the Appendix at the back of this investor presentation. Full-year 2023 revenue guidance Reported Revenue: $3.825B to $3.885B +3% to +5% Assumed M&A contribution: <1pt. benefit Assumed FX contribution: ~(1)pt. headwind Organic Constant Currency Revenue: +3% to +5% Assumed mortgage impact: ~1pt. benefit Organic CC Revenue ex. mortgage: +2% to +4% Market Assumptions • U.S. Markets up mid-single digit (up low-single digit excluding mortgage) – Financial Services up low-single digit (down low-single digit excluding mortgage) – Emerging Verticals up mid-single digit • International up low-double digit (constant-currency) • Consumer Interactive down low-single digit Note: For additional information, refer to the “Non-GAAP Financial Information” section on slide 2 and the Appendix at the back of this investor presentation.
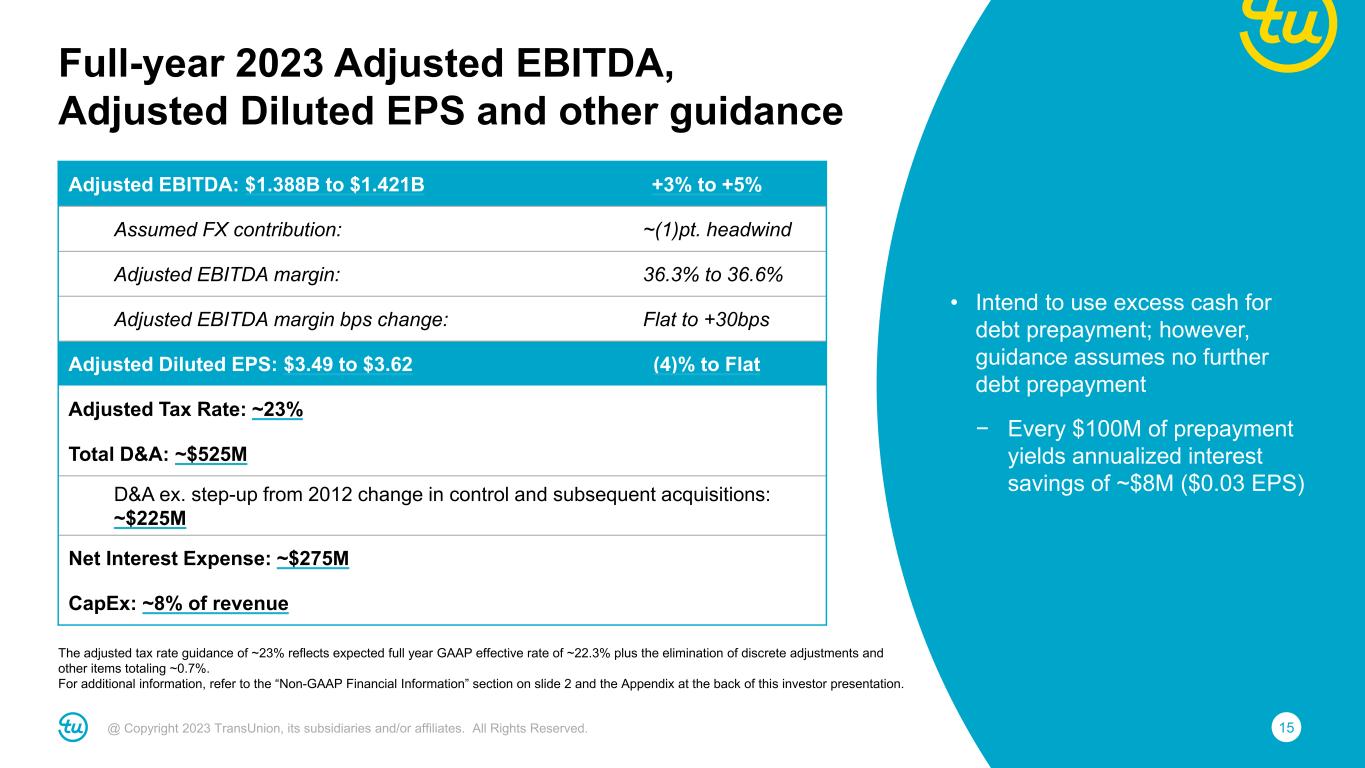
15@ Copyright 2023 TransUnion, its subsidiaries and/or affiliates. All Rights Reserved. • Intend to use excess cash for debt prepayment; however, guidance assumes no further debt prepayment − Every $100M of prepayment yields annualized interest savings of ~$8M ($0.03 EPS) The adjusted tax rate guidance of ~23% reflects expected full year GAAP effective rate of ~22.3% plus the elimination of discrete adjustments and other items totaling ~0.7%. For additional information, refer to the “Non-GAAP Financial Information” section on slide 2 and the Appendix at the back of this investor presentation. Full-year 2023 Adjusted EBITDA, Adjusted Diluted EPS and other guidance Adjusted EBITDA: $1.388B to $1.421B +3% to +5% Assumed FX contribution: ~(1)pt. headwind Adjusted EBITDA margin: 36.3% to 36.6% Adjusted EBITDA margin bps change: Flat to +30bps Adjusted Diluted EPS: $3.49 to $3.62 (4)% to Flat Adjusted Tax Rate: ~23% Total D&A: ~$525M D&A ex. step-up from 2012 change in control and subsequent acquisitions: ~$225M Net Interest Expense: ~$275M CapEx: ~8% of revenue
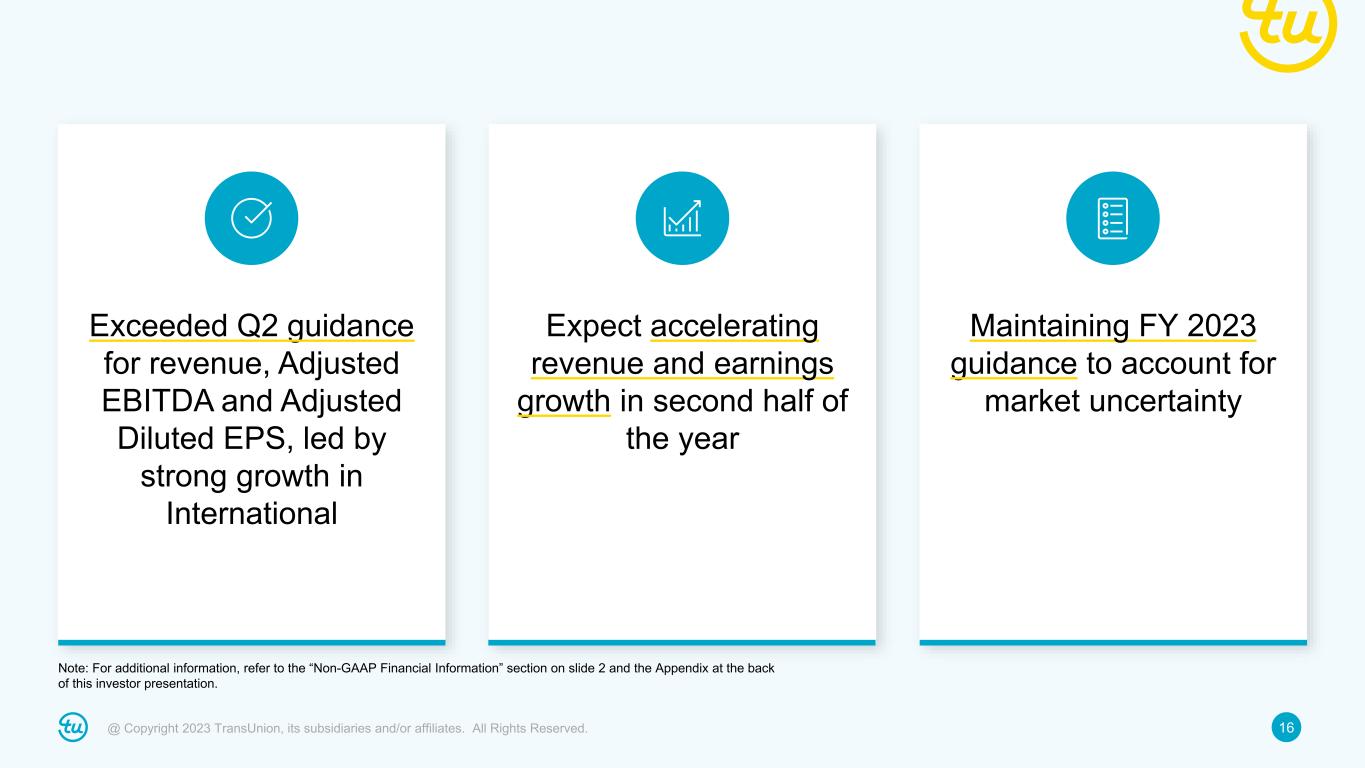
16@ Copyright 2023 TransUnion, its subsidiaries and/or affiliates. All Rights Reserved. Expect accelerating revenue and earnings growth in second half of the year Exceeded Q2 guidance for revenue, Adjusted EBITDA and Adjusted Diluted EPS, led by strong growth in International Maintaining FY 2023 guidance to account for market uncertainty Note: For additional information, refer to the “Non-GAAP Financial Information” section on slide 2 and the Appendix at the back of this investor presentation.

17@ Copyright 2023 TransUnion, its subsidiaries and/or affiliates. All Rights Reserved. Q&A

18@ Copyright 2023 TransUnion, its subsidiaries and/or affiliates. All Rights Reserved. Appendices: Non-GAAP Reconciliations
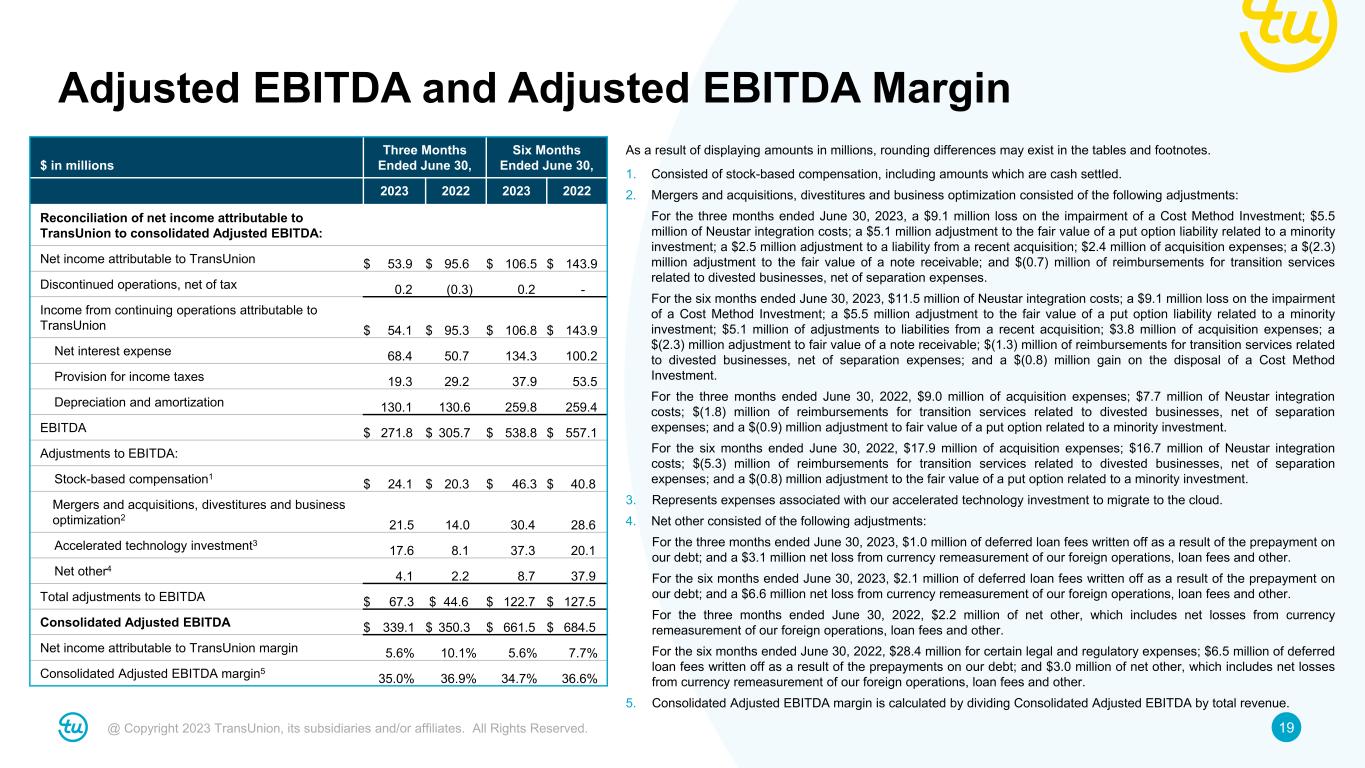
19@ Copyright 2023 TransUnion, its subsidiaries and/or affiliates. All Rights Reserved. Adjusted EBITDA and Adjusted EBITDA Margin $ in millions Three Months Ended June 30, Six Months Ended June 30, 2023 2022 2023 2022 Reconciliation of net income attributable to TransUnion to consolidated Adjusted EBITDA: Net income attributable to TransUnion $ 53.9 $ 95.6 $ 106.5 $ 143.9 Discontinued operations, net of tax 0.2 (0.3) 0.2 - Income from continuing operations attributable to TransUnion $ 54.1 $ 95.3 $ 106.8 $ 143.9 Net interest expense 68.4 50.7 134.3 100.2 Provision for income taxes 19.3 29.2 37.9 53.5 Depreciation and amortization 130.1 130.6 259.8 259.4 EBITDA $ 271.8 $ 305.7 $ 538.8 $ 557.1 Adjustments to EBITDA: Stock-based compensation1 $ 24.1 $ 20.3 $ 46.3 $ 40.8 Mergers and acquisitions, divestitures and business optimization2 21.5 14.0 30.4 28.6 Accelerated technology investment3 17.6 8.1 37.3 20.1 Net other4 4.1 2.2 8.7 37.9 Total adjustments to EBITDA $ 67.3 $ 44.6 $ 122.7 $ 127.5 Consolidated Adjusted EBITDA $ 339.1 $ 350.3 $ 661.5 $ 684.5 Net income attributable to TransUnion margin 5.6% 10.1% 5.6% 7.7% Consolidated Adjusted EBITDA margin5 35.0% 36.9% 34.7% 36.6% As a result of displaying amounts in millions, rounding differences may exist in the tables and footnotes. 1. Consisted of stock-based compensation, including amounts which are cash settled. 2. Mergers and acquisitions, divestitures and business optimization consisted of the following adjustments: For the three months ended June 30, 2023, a $9.1 million loss on the impairment of a Cost Method Investment; $5.5 million of Neustar integration costs; a $5.1 million adjustment to the fair value of a put option liability related to a minority investment; a $2.5 million adjustment to a liability from a recent acquisition; $2.4 million of acquisition expenses; a $(2.3) million adjustment to the fair value of a note receivable; and $(0.7) million of reimbursements for transition services related to divested businesses, net of separation expenses. For the six months ended June 30, 2023, $11.5 million of Neustar integration costs; a $9.1 million loss on the impairment of a Cost Method Investment; a $5.5 million adjustment to the fair value of a put option liability related to a minority investment; $5.1 million of adjustments to liabilities from a recent acquisition; $3.8 million of acquisition expenses; a $(2.3) million adjustment to fair value of a note receivable; $(1.3) million of reimbursements for transition services related to divested businesses, net of separation expenses; and a $(0.8) million gain on the disposal of a Cost Method Investment. For the three months ended June 30, 2022, $9.0 million of acquisition expenses; $7.7 million of Neustar integration costs; $(1.8) million of reimbursements for transition services related to divested businesses, net of separation expenses; and a $(0.9) million adjustment to fair value of a put option related to a minority investment. For the six months ended June 30, 2022, $17.9 million of acquisition expenses; $16.7 million of Neustar integration costs; $(5.3) million of reimbursements for transition services related to divested businesses, net of separation expenses; and a $(0.8) million adjustment to the fair value of a put option related to a minority investment. 3. Represents expenses associated with our accelerated technology investment to migrate to the cloud. 4. Net other consisted of the following adjustments: For the three months ended June 30, 2023, $1.0 million of deferred loan fees written off as a result of the prepayment on our debt; and a $3.1 million net loss from currency remeasurement of our foreign operations, loan fees and other. For the six months ended June 30, 2023, $2.1 million of deferred loan fees written off as a result of the prepayment on our debt; and a $6.6 million net loss from currency remeasurement of our foreign operations, loan fees and other. For the three months ended June 30, 2022, $2.2 million of net other, which includes net losses from currency remeasurement of our foreign operations, loan fees and other. For the six months ended June 30, 2022, $28.4 million for certain legal and regulatory expenses; $6.5 million of deferred loan fees written off as a result of the prepayments on our debt; and $3.0 million of net other, which includes net losses from currency remeasurement of our foreign operations, loan fees and other. 5. Consolidated Adjusted EBITDA margin is calculated by dividing Consolidated Adjusted EBITDA by total revenue.
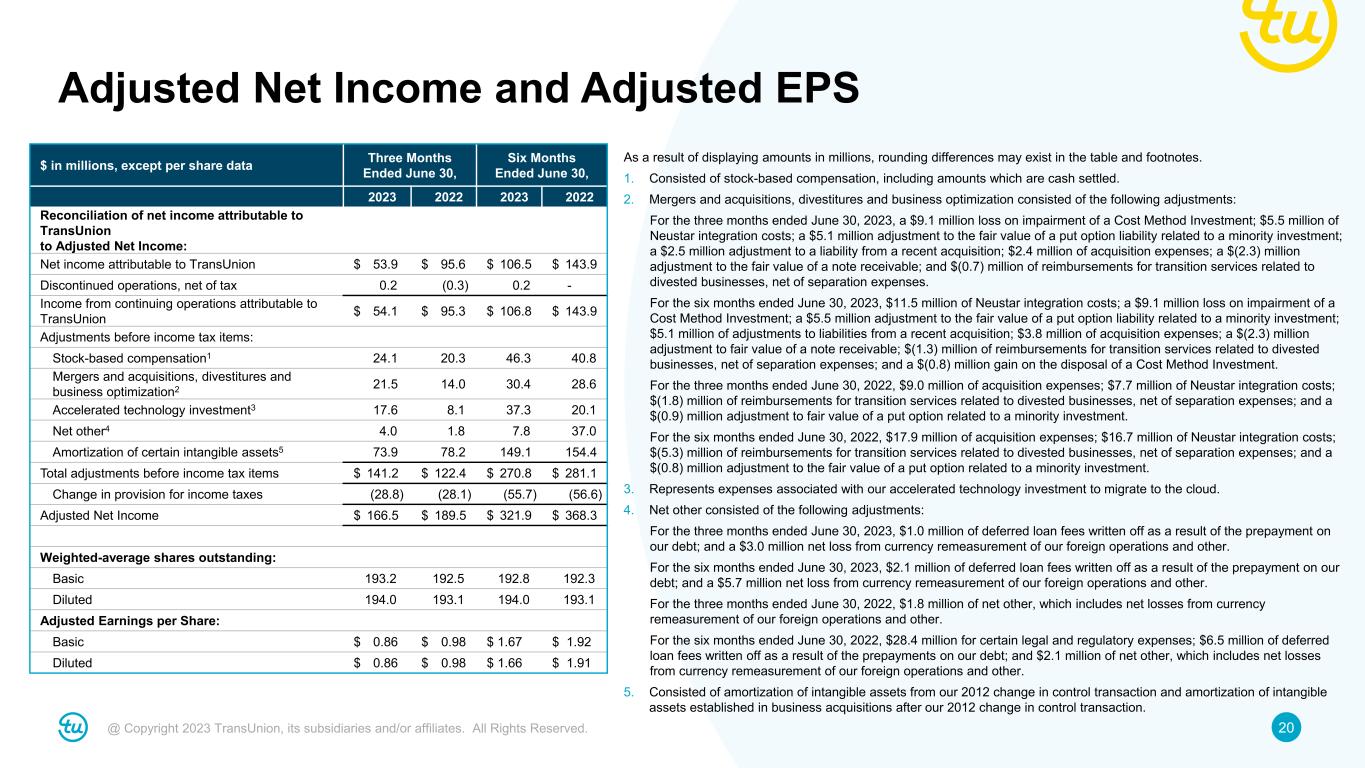
20@ Copyright 2023 TransUnion, its subsidiaries and/or affiliates. All Rights Reserved. Adjusted Net Income and Adjusted EPS $ in millions, except per share data Three Months Ended June 30, Six Months Ended June 30, 2023 2022 2023 2022 Reconciliation of net income attributable to TransUnion to Adjusted Net Income: Net income attributable to TransUnion $ 53.9 $ 95.6 $ 106.5 $ 143.9 Discontinued operations, net of tax 0.2 (0.3) 0.2 - Income from continuing operations attributable to TransUnion $ 54.1 $ 95.3 $ 106.8 $ 143.9 Adjustments before income tax items: Stock-based compensation1 24.1 20.3 46.3 40.8 Mergers and acquisitions, divestitures and business optimization2 21.5 14.0 30.4 28.6 Accelerated technology investment3 17.6 8.1 37.3 20.1 Net other4 4.0 1.8 7.8 37.0 Amortization of certain intangible assets5 73.9 78.2 149.1 154.4 Total adjustments before income tax items $ 141.2 $ 122.4 $ 270.8 $ 281.1 Change in provision for income taxes (28.8) (28.1) (55.7) (56.6) Adjusted Net Income $ 166.5 $ 189.5 $ 321.9 $ 368.3 Weighted-average shares outstanding: Basic 193.2 192.5 192.8 192.3 Diluted 194.0 193.1 194.0 193.1 Adjusted Earnings per Share: Basic $ 0.86 $ 0.98 $ 1.67 $ 1.92 Diluted $ 0.86 $ 0.98 $ 1.66 $ 1.91 As a result of displaying amounts in millions, rounding differences may exist in the table and footnotes. 1. Consisted of stock-based compensation, including amounts which are cash settled. 2. Mergers and acquisitions, divestitures and business optimization consisted of the following adjustments: For the three months ended June 30, 2023, a $9.1 million loss on impairment of a Cost Method Investment; $5.5 million of Neustar integration costs; a $5.1 million adjustment to the fair value of a put option liability related to a minority investment; a $2.5 million adjustment to a liability from a recent acquisition; $2.4 million of acquisition expenses; a $(2.3) million adjustment to the fair value of a note receivable; and $(0.7) million of reimbursements for transition services related to divested businesses, net of separation expenses. For the six months ended June 30, 2023, $11.5 million of Neustar integration costs; a $9.1 million loss on impairment of a Cost Method Investment; a $5.5 million adjustment to the fair value of a put option liability related to a minority investment; $5.1 million of adjustments to liabilities from a recent acquisition; $3.8 million of acquisition expenses; a $(2.3) million adjustment to fair value of a note receivable; $(1.3) million of reimbursements for transition services related to divested businesses, net of separation expenses; and a $(0.8) million gain on the disposal of a Cost Method Investment. For the three months ended June 30, 2022, $9.0 million of acquisition expenses; $7.7 million of Neustar integration costs; $(1.8) million of reimbursements for transition services related to divested businesses, net of separation expenses; and a $(0.9) million adjustment to fair value of a put option related to a minority investment. For the six months ended June 30, 2022, $17.9 million of acquisition expenses; $16.7 million of Neustar integration costs; $(5.3) million of reimbursements for transition services related to divested businesses, net of separation expenses; and a $(0.8) million adjustment to the fair value of a put option related to a minority investment. 3. Represents expenses associated with our accelerated technology investment to migrate to the cloud. 4. Net other consisted of the following adjustments: For the three months ended June 30, 2023, $1.0 million of deferred loan fees written off as a result of the prepayment on our debt; and a $3.0 million net loss from currency remeasurement of our foreign operations and other. For the six months ended June 30, 2023, $2.1 million of deferred loan fees written off as a result of the prepayment on our debt; and a $5.7 million net loss from currency remeasurement of our foreign operations and other. For the three months ended June 30, 2022, $1.8 million of net other, which includes net losses from currency remeasurement of our foreign operations and other. For the six months ended June 30, 2022, $28.4 million for certain legal and regulatory expenses; $6.5 million of deferred loan fees written off as a result of the prepayments on our debt; and $2.1 million of net other, which includes net losses from currency remeasurement of our foreign operations and other. 5. Consisted of amortization of intangible assets from our 2012 change in control transaction and amortization of intangible assets established in business acquisitions after our 2012 change in control transaction.
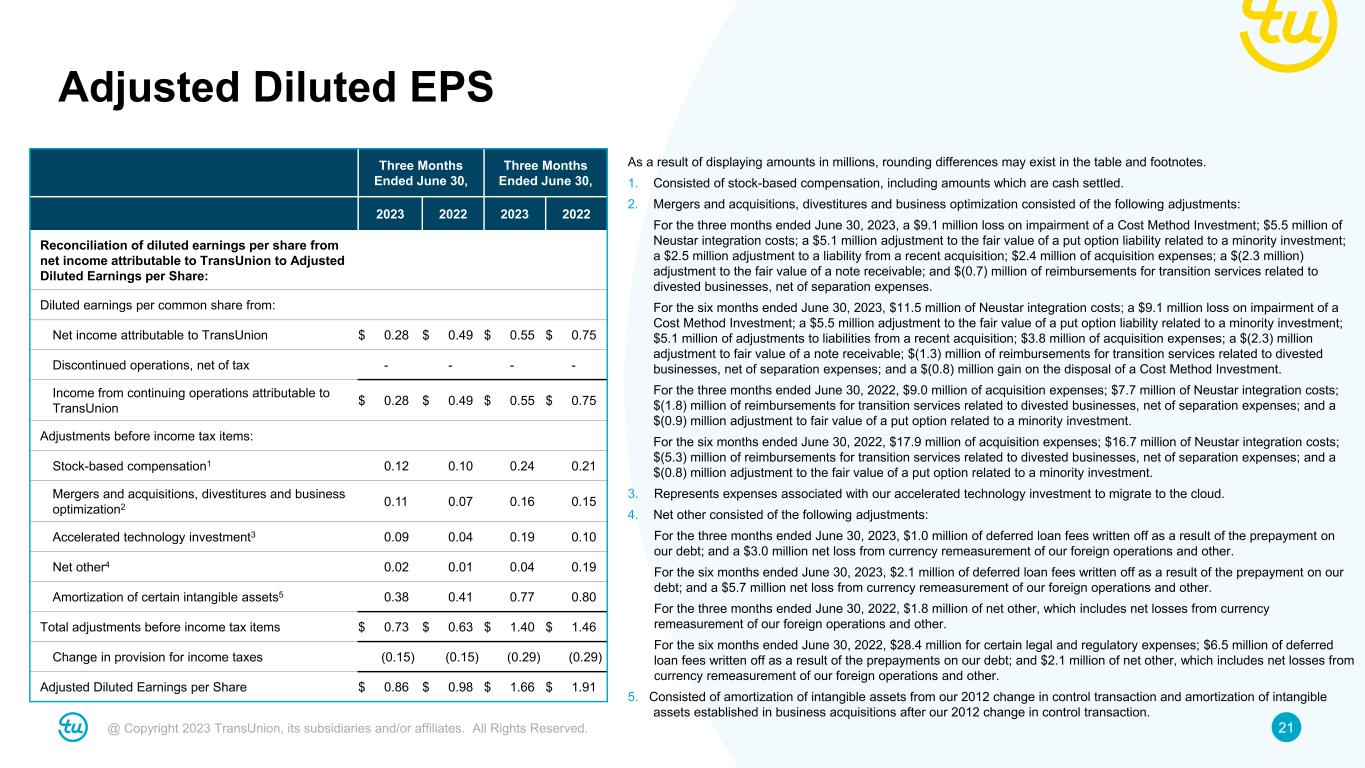
21@ Copyright 2023 TransUnion, its subsidiaries and/or affiliates. All Rights Reserved. Adjusted Diluted EPS Three Months Ended June 30, Three Months Ended June 30, 2023 2022 2023 2022 Reconciliation of diluted earnings per share from net income attributable to TransUnion to Adjusted Diluted Earnings per Share: Diluted earnings per common share from: Net income attributable to TransUnion $ 0.28 $ 0.49 $ 0.55 $ 0.75 Discontinued operations, net of tax - - - - Income from continuing operations attributable to TransUnion $ 0.28 $ 0.49 $ 0.55 $ 0.75 Adjustments before income tax items: Stock-based compensation1 0.12 0.10 0.24 0.21 Mergers and acquisitions, divestitures and business optimization2 0.11 0.07 0.16 0.15 Accelerated technology investment3 0.09 0.04 0.19 0.10 Net other4 0.02 0.01 0.04 0.19 Amortization of certain intangible assets5 0.38 0.41 0.77 0.80 Total adjustments before income tax items $ 0.73 $ 0.63 $ 1.40 $ 1.46 Change in provision for income taxes (0.15) (0.15) (0.29) (0.29) Adjusted Diluted Earnings per Share $ 0.86 $ 0.98 $ 1.66 $ 1.91 As a result of displaying amounts in millions, rounding differences may exist in the table and footnotes. 1. Consisted of stock-based compensation, including amounts which are cash settled. 2. Mergers and acquisitions, divestitures and business optimization consisted of the following adjustments: For the three months ended June 30, 2023, a $9.1 million loss on impairment of a Cost Method Investment; $5.5 million of Neustar integration costs; a $5.1 million adjustment to the fair value of a put option liability related to a minority investment; a $2.5 million adjustment to a liability from a recent acquisition; $2.4 million of acquisition expenses; a $(2.3 million) adjustment to the fair value of a note receivable; and $(0.7) million of reimbursements for transition services related to divested businesses, net of separation expenses. For the six months ended June 30, 2023, $11.5 million of Neustar integration costs; a $9.1 million loss on impairment of a Cost Method Investment; a $5.5 million adjustment to the fair value of a put option liability related to a minority investment; $5.1 million of adjustments to liabilities from a recent acquisition; $3.8 million of acquisition expenses; a $(2.3) million adjustment to fair value of a note receivable; $(1.3) million of reimbursements for transition services related to divested businesses, net of separation expenses; and a $(0.8) million gain on the disposal of a Cost Method Investment. For the three months ended June 30, 2022, $9.0 million of acquisition expenses; $7.7 million of Neustar integration costs; $(1.8) million of reimbursements for transition services related to divested businesses, net of separation expenses; and a $(0.9) million adjustment to fair value of a put option related to a minority investment. For the six months ended June 30, 2022, $17.9 million of acquisition expenses; $16.7 million of Neustar integration costs; $(5.3) million of reimbursements for transition services related to divested businesses, net of separation expenses; and a $(0.8) million adjustment to the fair value of a put option related to a minority investment. 3. Represents expenses associated with our accelerated technology investment to migrate to the cloud. 4. Net other consisted of the following adjustments: For the three months ended June 30, 2023, $1.0 million of deferred loan fees written off as a result of the prepayment on our debt; and a $3.0 million net loss from currency remeasurement of our foreign operations and other. For the six months ended June 30, 2023, $2.1 million of deferred loan fees written off as a result of the prepayment on our debt; and a $5.7 million net loss from currency remeasurement of our foreign operations and other. For the three months ended June 30, 2022, $1.8 million of net other, which includes net losses from currency remeasurement of our foreign operations and other. For the six months ended June 30, 2022, $28.4 million for certain legal and regulatory expenses; $6.5 million of deferred loan fees written off as a result of the prepayments on our debt; and $2.1 million of net other, which includes net losses from currency remeasurement of our foreign operations and other. 5. Consisted of amortization of intangible assets from our 2012 change in control transaction and amortization of intangible assets established in business acquisitions after our 2012 change in control transaction.
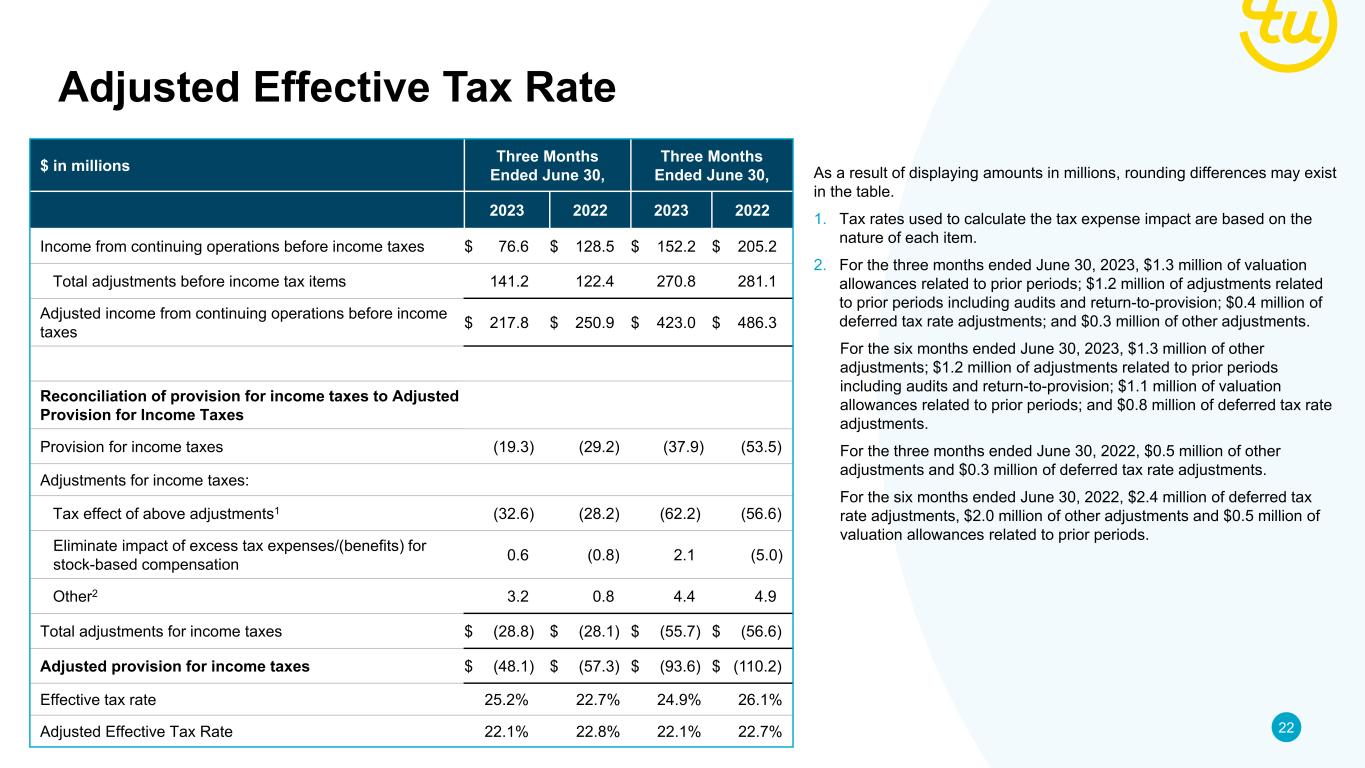
22@ Copyright 2023 TransUnion, its subsidiaries and/or affiliates. All Rights Reserved. Adjusted Effective Tax Rate $ in millions Three Months Ended June 30, Three Months Ended June 30, 2023 2022 2023 2022 Income from continuing operations before income taxes $ 76.6 $ 128.5 $ 152.2 $ 205.2 Total adjustments before income tax items 141.2 122.4 270.8 281.1 Adjusted income from continuing operations before income taxes $ 217.8 $ 250.9 $ 423.0 $ 486.3 Reconciliation of provision for income taxes to Adjusted Provision for Income Taxes Provision for income taxes (19.3) (29.2) (37.9) (53.5) Adjustments for income taxes: Tax effect of above adjustments1 (32.6) (28.2) (62.2) (56.6) Eliminate impact of excess tax expenses/(benefits) for stock-based compensation 0.6 (0.8) 2.1 (5.0) Other2 3.2 0.8 4.4 4.9 Total adjustments for income taxes $ (28.8) $ (28.1) $ (55.7) $ (56.6) Adjusted provision for income taxes $ (48.1) $ (57.3) $ (93.6) $ (110.2) Effective tax rate 25.2% 22.7% 24.9% 26.1% Adjusted Effective Tax Rate 22.1% 22.8% 22.1% 22.7% As a result of displaying amounts in millions, rounding differences may exist in the table. 1. Tax rates used to calculate the tax expense impact are based on the nature of each item. 2. For the three months ended June 30, 2023, $1.3 million of valuation allowances related to prior periods; $1.2 million of adjustments related to prior periods including audits and return-to-provision; $0.4 million of deferred tax rate adjustments; and $0.3 million of other adjustments. For the six months ended June 30, 2023, $1.3 million of other adjustments; $1.2 million of adjustments related to prior periods including audits and return-to-provision; $1.1 million of valuation allowances related to prior periods; and $0.8 million of deferred tax rate adjustments. For the three months ended June 30, 2022, $0.5 million of other adjustments and $0.3 million of deferred tax rate adjustments. For the six months ended June 30, 2022, $2.4 million of deferred tax rate adjustments, $2.0 million of other adjustments and $0.5 million of valuation allowances related to prior periods.

23@ Copyright 2023 TransUnion, its subsidiaries and/or affiliates. All Rights Reserved. Leverage Ratio $ in millions Trailing Twelve Months Ended June 30, 2023 Reconciliation of net income attributable to TransUnion to Adjusted EBITDA: Net income attributable to TransUnion $ 232.1 Discontinued operations, net of tax (17.2) Income from continuing operations attributable to TransUnion $ 215.0 Net interest expense 260.4 Provision for income taxes 104.2 Depreciation and amortization 519.4 EBITDA $ 1,099.0 Adjustments to EBITDA: Stock-based compensation1 86.5 Mergers and acquisitions, divestitures and business optimization2 52.5 Accelerated technology investment3 68.5 Net other4 16.9 Total adjustments to EBITDA $ 224.5 Leverage Ratio Adjusted EBITDA $ 1,323.5 Total debt $ 5,469.1 Less: Cash and cash equivalents 442.0 Net Debt $ 5,027.1 Ratio of Net Debt to Net income attributable to TransUnion 21.7 Leverage Ratio 3.8 As a result of displaying amounts in millions, rounding differences may exist in the table. 1. Consisted of stock-based compensation, including amounts which are cash settled. 2. Mergers and acquisitions, divestitures and business optimization consisted of the following adjustments: $27.9 million of Neustar integration costs; a $13.7 million loss on the impairment of Cost Method Investments; $9.6 million of acquisition expenses; a $5.6 million adjustment to the fair value of a put option liability related to a minority investment; a $5.1 million adjustment to a liability from a recent acquisition; a $(0.8) million gain on disposal of a Cost Method investment; a $(2.3) million adjustment to the fair value of a note receivable; $(2.8) million of reimbursements for transition services related to divested businesses, net of separation expenses; and a $(3.4) million gain related to a government tax reimbursement from a recent business acquisition. 3. Represents expenses associated with our accelerated technology investment to migrate to the cloud. 4. Net other consisted of the following adjustments: a $10.4 million net loss from currency remeasurement of our foreign operations, loan fees and other; and $6.4 million of deferred loan fees written off as a result of the prepayments on our debt.
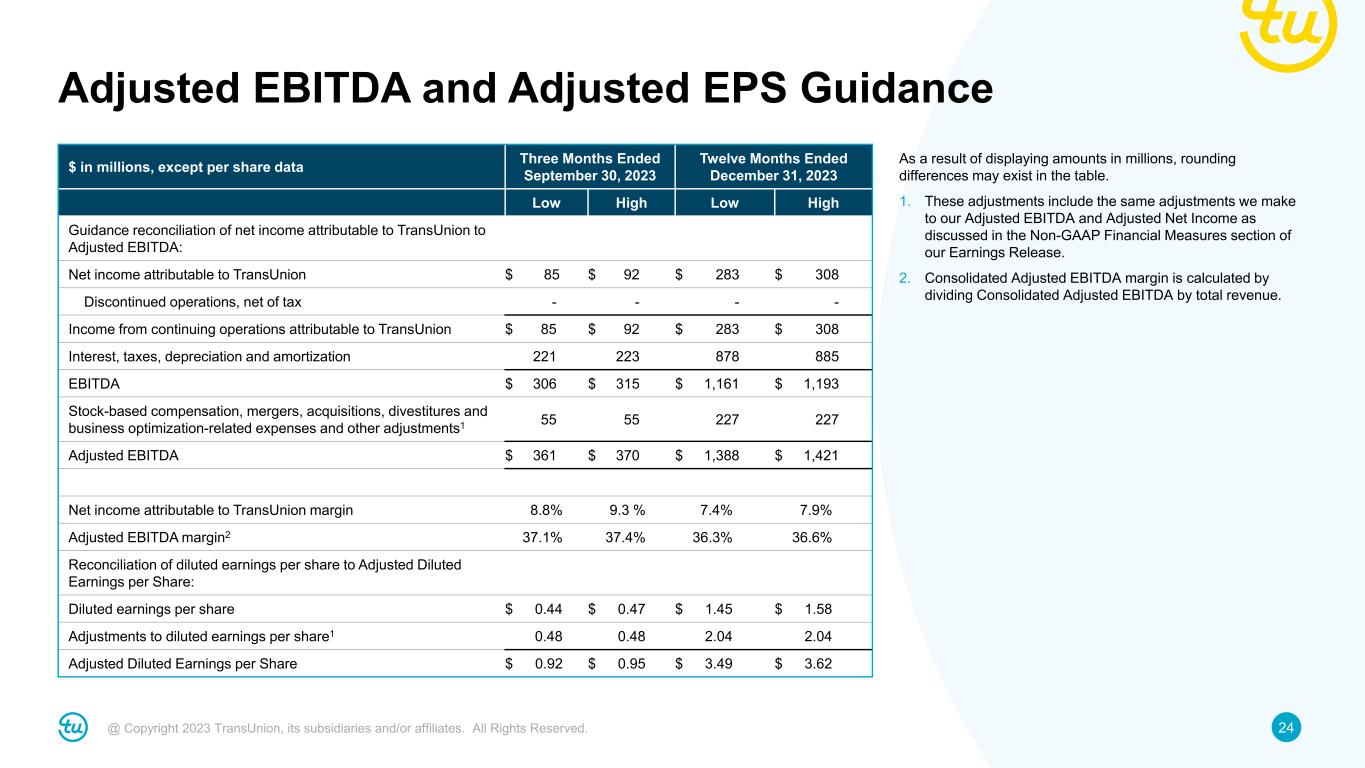
24@ Copyright 2023 TransUnion, its subsidiaries and/or affiliates. All Rights Reserved. Adjusted EBITDA and Adjusted EPS Guidance $ in millions, except per share data Three Months Ended September 30, 2023 Twelve Months Ended December 31, 2023 Low High Low High Guidance reconciliation of net income attributable to TransUnion to Adjusted EBITDA: Net income attributable to TransUnion $ 85 $ 92 $ 283 $ 308 Discontinued operations, net of tax - - - - Income from continuing operations attributable to TransUnion $ 85 $ 92 $ 283 $ 308 Interest, taxes, depreciation and amortization 221 223 878 885 EBITDA $ 306 $ 315 $ 1,161 $ 1,193 Stock-based compensation, mergers, acquisitions, divestitures and business optimization-related expenses and other adjustments1 55 55 227 227 Adjusted EBITDA $ 361 $ 370 $ 1,388 $ 1,421 Net income attributable to TransUnion margin 8.8% 9.3 % 7.4% 7.9% Adjusted EBITDA margin2 37.1% 37.4% 36.3% 36.6% Reconciliation of diluted earnings per share to Adjusted Diluted Earnings per Share: Diluted earnings per share $ 0.44 $ 0.47 $ 1.45 $ 1.58 Adjustments to diluted earnings per share1 0.48 0.48 2.04 2.04 Adjusted Diluted Earnings per Share $ 0.92 $ 0.95 $ 3.49 $ 3.62 As a result of displaying amounts in millions, rounding differences may exist in the table. 1. These adjustments include the same adjustments we make to our Adjusted EBITDA and Adjusted Net Income as discussed in the Non-GAAP Financial Measures section of our Earnings Release. 2. Consolidated Adjusted EBITDA margin is calculated by dividing Consolidated Adjusted EBITDA by total revenue.


