Exhibit 99.2
Earnings Presentation Quarter Ended June 30, 2019 WhiteHorse Finance, Inc. NASDAQ: WHF (Common Stock) NASDAQ: WHFBZ (6.50% Notes due 2025)
1 References in this presentation to “WHF”, “we”, “us”, “our” and “the Company” refer to WhiteHorse Finance, Inc. This presentation and the information and views included herein do not constitute investment advice, or a recommendation or a n o ffer to enter into any transaction with the Company or any of its affiliates. Investors are advised to consider carefully the Company’s investment objectives, r isk s, charges and expenses before investing in the Company’s securities. Our annual reports on Form 10 - K and quarterly reports on Form 10 - Q, which have been filed with the Securities and Exchange Commission (“SEC”), contain this and other information about the Company and should be read carefully before investi ng in the Company’s securities. The information in this presentation is not complete and may be changed. This presentation is not an offer to sell the Company’s securities and is not soliciting an offer to buy the Company’s securities in any jurisdiction where such offer or sale is not permitted. A shelf registration statement relating to the Company’s securities is on file with the SEC. A public offering of the Company’s securities may be made only by means of a prospectus and a related prospectus supplement, copies of which may be obtained by writing the Company at 1450 Brickell Avenue, 31st Floor, Miami, FL 33131, Attention: Investor Relations, or by calling (305) 381 - 6999; copies may also be obtained by visiting EDGAR on the SEC’s website at http://www.sec.gov . Forward Looking Statements Some of the statements in this presentation constitute forward - looking statements, which relate to future events or the Company’s fut ure performance or financial condition. The forward - looking statements contained in this presentation involve risks and uncertainties, including statements as to: the Company’s future operating results; changes in political, economic or industry conditions, the interest rate environment or conditions affecti ng the financial and capital markets, which could result in changes to the value of the Company’s assets; the Company’s business prospects and the prospects of its pr ospective portfolio companies; the impact of investments that the Company expects to make; the impact of increased competition; the Company’s contractual ar ran gements and relationships with third parties; the dependence of the Company’s future success on the general economy and its impact on the industries in wh ich the Company invests; the ability of the Company’s prospective portfolio companies to achieve their objectives; the relative and absolute performance o f t he Company’s investment adviser; the Company’s expected financings and investments; the adequacy of the Company’s cash resources and working capital; the timi ng of cash flows, if any, from the operations of the Company’s prospective portfolio companies; and the impact of future acquisitions and divestitures. Such forward - looking statements may include statements preceded by, followed by or that otherwise include the words “may,” “migh t,” “will,” “intend,” “should,” “could,” “can,” “would,” “expect,” “believe,” “estimate,” “anticipate,” “predict,” “potential,” “plan” or similar words. The Company has based the forward - looking statements included in this presentation on information available to us on the date of this presentation, and the Company assumes no obligation to update any such forward - looking statements. Actual results could differ materially from those implied or expressed in the Company’s forward - looking statements for any reason, and future results could differ materially from historical performance. Al though the Company undertakes no obligation to revise or update any forward - looking statements, whether as a result of new information, future events or other wise, you are advised to consult any additional disclosures that are made directly to you or through reports that the Company in the future may file with the Sec urities and Exchange Commission, including annual reports on Form 10 - K, quarterly reports on Form 10 - Q and current reports on Form 8 - K. For a further discussion of factors that could cause the Company’s future results to differ materially from any forward - looking statements, see the section entitled “Risk Factors” in th e annual reports on Form 10 - K and quarterly reports on Form 10 - Q we file with the SEC. Important Information and Forward Looking Statements

2 WhiteHorse Finance Snapshot Company: WhiteHorse Finance, Inc. (“ WhiteHorse Finance” or the “Company”) : Equity Ticker: NASDAQ : WHF Market Cap: $288.1MM (1 ) NAV / Share: $15.38 Portfolio Fair Value: $534.8MM Current Dividend Yield: 10.1% (1) ; consistent quarterly dividends of $0.355 per share since 2012 IPO (1) Based on July 31, 2019 share price of $14.02 External Manager: Affiliate of H.I.G. Capital, LLC (“H.I.G. Capital” or “H.I.G.”)
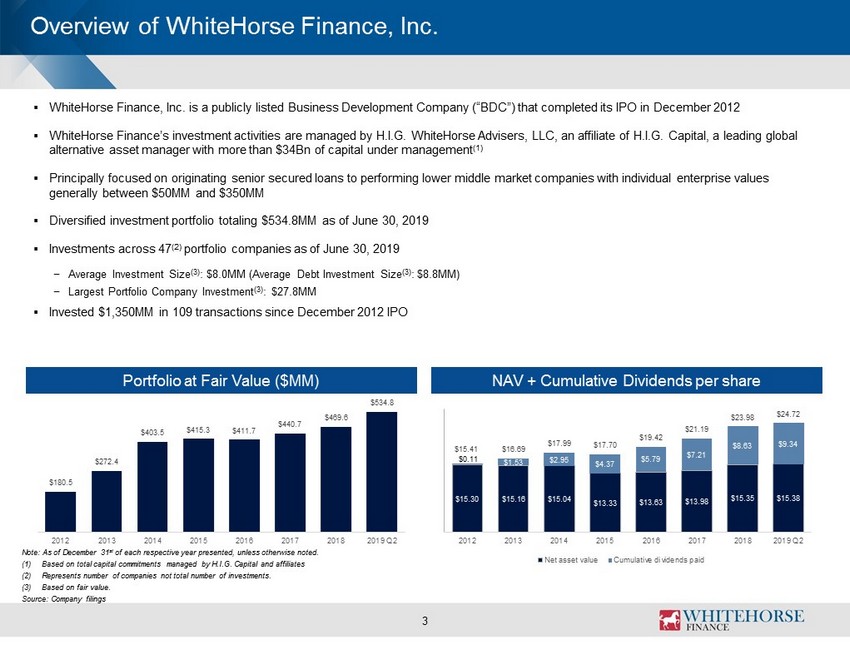
Overview of WhiteHorse Finance, Inc. 3 Portfolio at Fair Value ($MM) NAV + Cumulative Dividends per share Note: As of December 31 st of each respective year presented, unless otherwise noted. (1) Based on total capital commitments managed by H.I.G. Capital and affiliates (2) Represents number of companies not total number of investments. (3) Based on fair value. Source: Company filings ▪ WhiteHorse Finance, Inc. is a publicly listed Business Development Company (“BDC”) that completed its IPO in December 2012 ▪ WhiteHorse Finance’s investment activities are managed by H.I.G. WhiteHorse Advisers, LLC, an affiliate of H.I.G. Capital, a leading global alternative asset manager with more than $34Bn of capital under management (1) ▪ Principally focused on originating senior secured loans to performing lower middle market companies with individual enterpris e v alues generally between $50MM and $350MM ▪ Diversified investment portfolio totaling $534.8MM as of June 30, 2019 ▪ Investments across 47 (2 ) portfolio companies as of June 30, 2019 − Average Investment Size (3) : $8.0MM (Average Debt Investment Size (3) : $8.8MM) − Largest Portfolio Company Investment (3) : $27.8MM ▪ Invested $1,350MM in 109 transactions since December 2012 IPO $180.5 $272.4 $403.5 $415.3 $411.7 $440.7 $469.6 $534.8 2012 2013 2014 2015 2016 2017 2018 2019 Q2 $15.30 $15.16 $15.04 $13.33 $13.63 $13.98 $15.35 $15.38 $0.11 $1.53 $2.95 $4.37 $5.79 $7.21 $8.63 $9.34 $15.41 $16.69 $17.99 $17.70 $19.42 $21.19 $23.98 $24.72 2012 2013 2014 2015 2016 2017 2018 2019 Q2 Net asset value Cumulative dividends paid
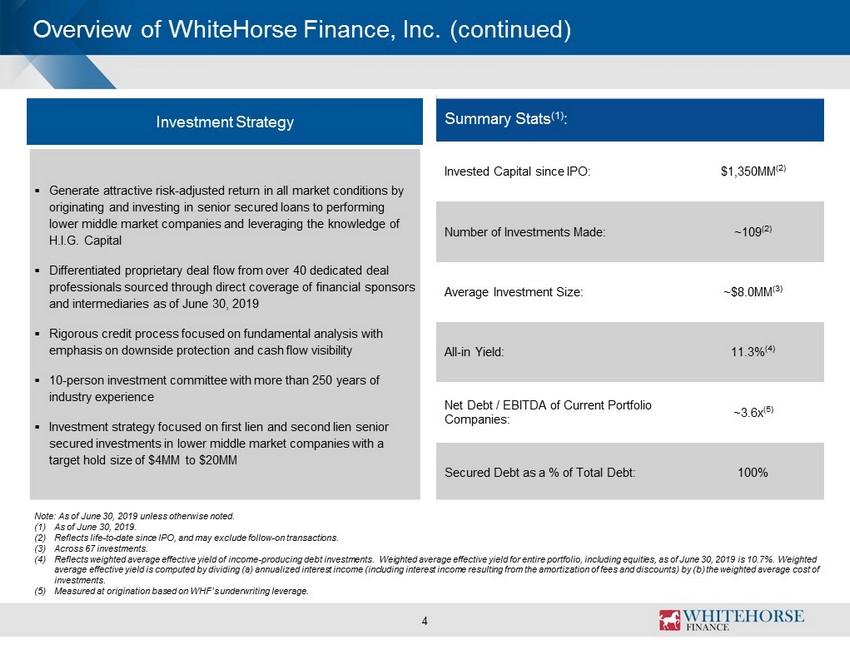
4 Overview of WhiteHorse Finance, Inc . (continued) Note: As of June 30, 2019 unless otherwise noted. (1) As of June 30, 2019. (2) Reflects life - to - date since IPO, and may exclude follow - on transactions. (3) Across 67 investments. (4) Reflects weighted average effective yield of income - producing debt investments. Weighted average effective yield for entire por tfolio, including equities, as of June 30, 2019 is 10.7%. Weighted average effective yield is computed by dividing (a) annualized interest income (including interest income resulting from the amo rtization of fees and discounts) by (b) the weighted average cost of investments. (5) Measured at origination based on WHF’s underwriting leverage. ▪ Generate attractive risk - adjusted return in all market conditions by originating and investing in senior secured loans to performing lower middle market companies and leveraging the knowledge of H.I.G. Capital ▪ Differentiated proprietary deal flow from over 40 dedicated deal professionals sourced through direct coverage of financial sponsors and intermediaries as of June 30, 2019 ▪ Rigorous credit process focused on fundamental analysis with emphasis on downside protection and cash flow visibility ▪ 10 - person investment committee with more than 250 years of industry experience ▪ Investment strategy focused on first lien and second lien senior secured investments in lower middle market companies with a target hold size of $4MM to $20MM Summary Stats (1) : Invested Capital since IPO: $1,350MM (2) Number of Investments Made: ~109 (2) Average Investment Size: ~$8.0 MM (3) All - in Yield : 11.3% (4) Net Debt / EBITDA of Current Portfolio Companies: ~3.6x (5) Secured Debt as a % of Total Debt : 100% Investment Strategy

5 Summary of Quarterly Results Fiscal Quarter Highlights ▪ Total investments at fair value increased to $534.8 million in Q2 2019 as compared to $468.4 million in Q1 2019. ▪ The Company made investments in 7 new portfolio companies for gross additions of $71.4 million and funded a small add - on investment to an existing portfolio company for $3.7 million. ▪ The Company had 1 full exit during Q2 2019: Account Control Technology Holdings, Inc. ▪ The weighted average effective yield on income producing investments at the end of Q2 2019 was approximately 11.3% as compared to 11.7% at the end of the prior quarter. ▪ Q2 net investment income (“NII”) was ~$7.2 million, or $0.352 per share, which compares to Q1 NII of ~$7.6 million, or $0.370 pe r share. ▪ Q2 Core NII (1) , after adjusting for the ~$0.2 million capital gains incentive fee accrual, was ~ $7.4 million, or $0.362 per share, compared with the quarterly distribution of $0.355 per share. This compares with Q1 Core NII of $7.5 million, or $0.365 per share. ▪ Net realized and unrealized gains for Q2 2019 were ~$1.0 million and were primarily driven by price adjustments in the portfolio including markups on Grupo HIMA, Sigue Corp., Fox Rent A Car, Inc., Crews of California, Inc. and Golden Pear Funding Assetco , LLC as well as markdowns on AG Kings Holdings Inc., Bulk Midco , LLC and StackPath , LLC . ▪ NAV per share at the end of Q2 2019 was $15.38 per share, increasing from $15.33 per share reported at the end of Q1 2019. ▪ Leverage levels increased during the quarter, and leverage was approximately 0.79x at the end of Q2 2019 as compared to 0.57x at the end of Q1 2019. Cash on - hand at the end of Q2 2019 was $50.4 million; resulting in net leverage of 0.63x as compared to 0.45x at the end of Q1 2019 (1) Core net investment income is a non - GAAP financial measure. Refer to next slide for components and discussion of core net investment income. Additional information on core net investment income and a reconciliation of core net investment income to its most directly comparable GAAP financial measure, net investment income, can also be found by accessing the earnings releases posted to the Company’s website at http://www.whitehorsefinance.com .
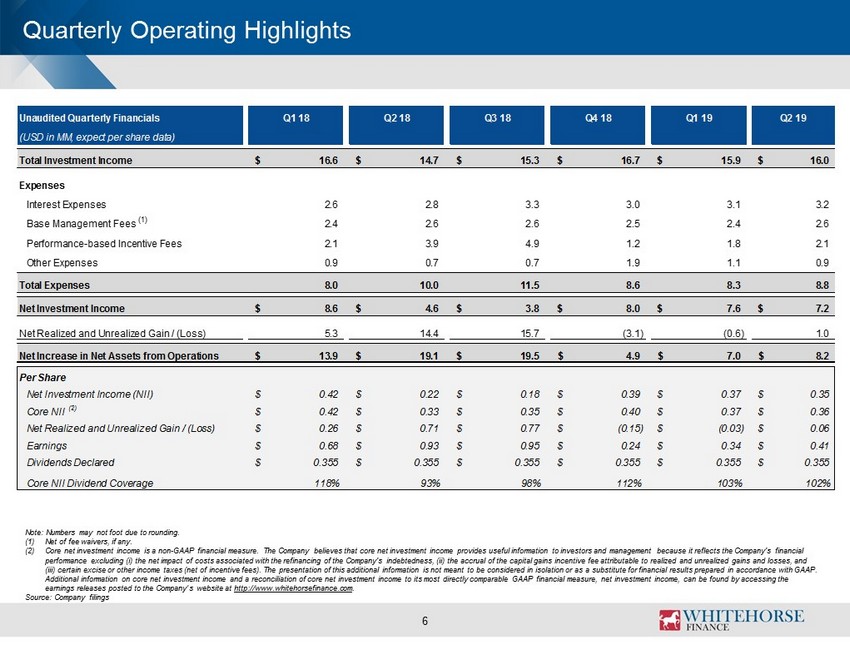
6 Quarterly Operating Highlights Note: N umbers may not foot due to rounding. (1) Net of fee waivers, if any. (2) Core net investment income is a non - GAAP financial measure. The Company believes that core net investment income provides useful information to investors and management because it reflects the Company's financial performance excluding (i) the net impact of costs associated with the refinancing of the Company's indebtedness, (ii) the acc rua l of the capital gains incentive fee attributable to realized and unrealized gains and losses, and (iii) certain excise or other income taxes (net of incentive fees). The presentation of this additional information is not me ant to be considered in isolation or as a substitute for financial results prepared in accordance with GAAP. Additional information on core net investment income and a reconciliation of core net investment income to its most directly com parable GAAP financial measure, net investment income, can be found by accessing the earnings releases posted to the Company’s website at http://www.whitehorsefinance.com . Source: Company filings Unaudited Quarterly Financials Q1 18 Q2 18 Q3 18 Q4 18 Q1 19 Q2 19 (USD in MM, expect per share data) Total Investment Income 16.6$ 14.7$ 15.3$ 16.7$ 15.9$ 16.0$ Expenses Interest Expenses 2.6 2.8 3.3 3.0 3.1 3.2 Base Management Fees (1) 2.4 2.6 2.6 2.5 2.4 2.6 Performance-based Incentive Fees 2.1 3.9 4.9 1.2 1.8 2.1 Other Expenses 0.9 0.7 0.7 1.9 1.1 0.9 Total Expenses 8.0 10.0 11.5 8.6 8.3 8.8 Net Investment Income 8.6$ 4.6$ 3.8$ 8.0$ 7.6$ 7.2$ Net Realized and Unrealized Gain / (Loss) 5.3 14.4 15.7 (3.1) (0.6) 1.0 Net Increase in Net Assets from Operations 13.9$ 19.1$ 19.5$ 4.9$ 7.0$ 8.2$ Per Share Net Investment Income (NII) 0.42$ 0.22$ 0.18$ 0.39$ 0.37$ 0.35$ Core NII (2) 0.42$ 0.33$ 0.35$ 0.40$ 0.37$ 0.36$ Net Realized and Unrealized Gain / (Loss) 0.26$ 0.71$ 0.77$ (0.15)$ (0.03)$ 0.06$ Earnings 0.68$ 0.93$ 0.95$ 0.24$ 0.34$ 0.41$ Dividends Declared 0.355$ 0.355$ 0.355$ 0.355$ 0.355$ 0.355$ Core NII Dividend Coverage 118% 93% 98% 112% 103% 102%
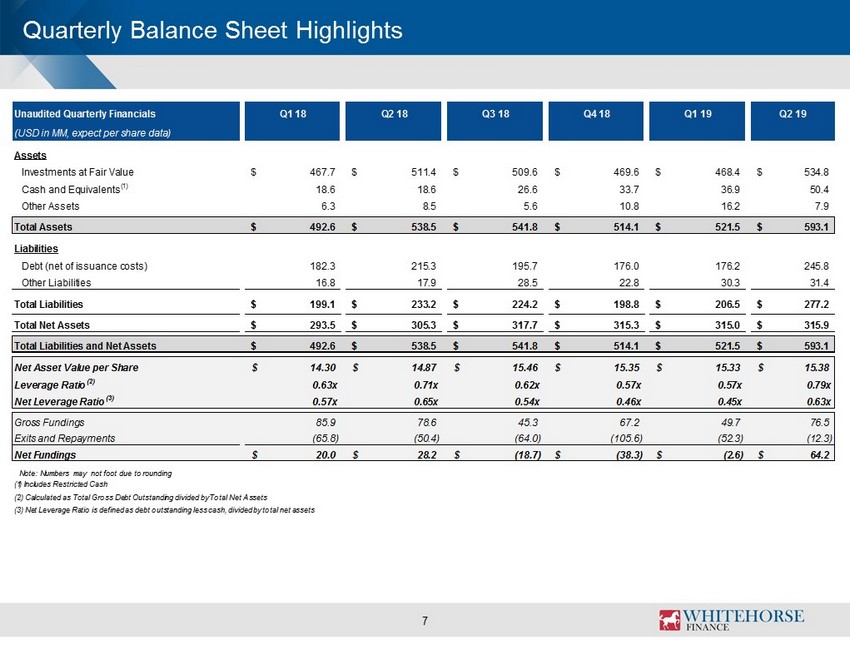
7 Quarterly Balance Sheet Highlights Note: Numbers may not foot due to rounding Unaudited Quarterly Financials Q1 18 Q2 18 Q3 18 Q4 18 Q1 19 Q2 19 (USD in MM, expect per share data) Assets Investments at Fair Value 467.7$ 511.4$ 509.6$ 469.6$ 468.4$ 534.8$ Cash and Equivalents (1) 18.6 18.6 26.6 33.7 36.9 50.4 Other Assets 6.3 8.5 5.6 10.8 16.2 7.9 Total Assets 492.6$ 538.5$ 541.8$ 514.1$ 521.5$ 593.1$ Liabilities Debt (net of issuance costs) 182.3 215.3 195.7 176.0 176.2 245.8 Other Liabilities 16.8 17.9 28.5 22.8 30.3 31.4 Total Liabilities 199.1$ 233.2$ 224.2$ 198.8$ 206.5$ 277.2$ Total Net Assets 293.5$ 305.3$ 317.7$ 315.3$ 315.0$ 315.9$ Total Liabilities and Net Assets 492.6$ 538.5$ 541.8$ 514.1$ 521.5$ 593.1$ Net Asset Value per Share 14.30$ 14.87$ 15.46$ 15.35$ 15.33$ 15.38$ Leverage Ratio (2) 0.63x 0.71x 0.62x 0.57x 0.57x 0.79x Net Leverage Ratio (3) 0.57x 0.65x 0.54x 0.46x 0.45x 0.63x Gross Fundings 85.9 78.6 45.3 67.2 49.7 76.5 Exits and Repayments (65.8) (50.4) (64.0) (105.6) (52.3) (12.3) Net Fundings 20.0$ 28.2$ (18.7)$ (38.3)$ (2.6)$ 64.2$ (1) Includes Restricted Cash (2) Calculated as Total Gross Debt Outstanding divided by Total Net Assets (3) Net Leverage Ratio is defined as debt outstanding less cash, divided by total net assets
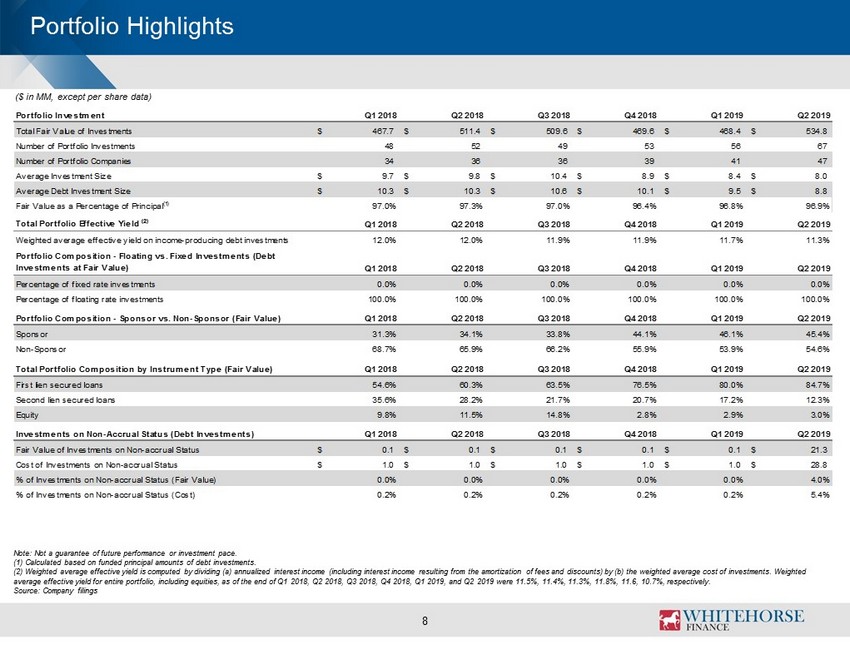
Portfolio Highlights 8 Note: Not a guarantee of future performance or investment pace. (1) C alculated based on funded principal amounts of debt investments. (2) Weighted average effective yield is computed by dividing (a) annualized interest income (including interest income resulting from the amortization of fees and discounts) by (b) the weighted average cost of inv estments. Weighted average effective yield for entire portfolio, including equities, as of the end of Q1 2018, Q2 2018, Q3 2018, Q4 2018, Q1 2019, and Q2 2019 were 11.5%, 11.4%, 11.3%, 11.8%, 11.6, 10.7%, respectivel y. Source: Company filings ($ in MM, except per share data) Portfolio Investment Q1 2018 Q2 2018 Q3 2018 Q4 2018 Q1 2019 Q2 2019 Total Fair Value of Investments 467.7$ 511.4$ 509.6$ 469.6$ 468.4$ 534.8$ Number of Portfolio Investments 48 52 49 53 56 67 Number of Portfolio Companies 34 36 36 39 41 47 Average Investment Size 9.7$ 9.8$ 10.4$ 8.9$ 8.4$ 8.0$ Average Debt Investment Size 10.3$ 10.3$ 10.6$ 10.1$ 9.5$ 8.8$ Fair Value as a Percentage of Principal(1) 97.0% 97.3% 97.0% 96.4% 96.8% 96.9% Total Portfolio Effective Yield (2) Q1 2018 Q2 2018 Q3 2018 Q4 2018 Q1 2019 Q2 2019 Weighted average effective yield on income-producing debt investments 12.0% 12.0% 11.9% 11.9% 11.7% 11.3% Portfolio Composition - Floating vs. Fixed Investments (Debt Investments at Fair Value) Q1 2018 Q2 2018 Q3 2018 Q4 2018 Q1 2019 Q2 2019 Percentage of fixed rate investments 0.0% 0.0% 0.0% 0.0% 0.0% 0.0% Percentage of floating rate investments 100.0% 100.0% 100.0% 100.0% 100.0% 100.0% Portfolio Composition - Sponsor vs. Non-Sponsor (Fair Value) Q1 2018 Q2 2018 Q3 2018 Q4 2018 Q1 2019 Q2 2019 Sponsor 31.3% 34.1% 33.8% 44.1% 46.1% 45.4% Non-Sponsor 68.7% 65.9% 66.2% 55.9% 53.9% 54.6% Total Portfolio Composition by Instrument Type (Fair Value) Q1 2018 Q2 2018 Q3 2018 Q4 2018 Q1 2019 Q2 2019 First lien secured loans 54.6% 60.3% 63.5% 76.5% 80.0% 84.7% Second lien secured loans 35.6% 28.2% 21.7% 20.7% 17.2% 12.3% Equity 9.8% 11.5% 14.8% 2.8% 2.9% 3.0% Investments on Non-Accrual Status (Debt Investments) Q1 2018 Q2 2018 Q3 2018 Q4 2018 Q1 2019 Q2 2019 Fair Value of Investments on Non-accrual Status 0.1$ 0.1$ 0.1$ 0.1$ 0.1$ 21.3$ Cost of Investments on Non-accrual Status 1.0$ 1.0$ 1.0$ 1.0$ 1.0$ 28.8$ % of Investments on Non-accrual Status (Fair Value) 0.0% 0.0% 0.0% 0.0% 0.0% 4.0% % of Investments on Non-accrual Status (Cost) 0.2% 0.2% 0.2% 0.2% 0.2% 5.4%
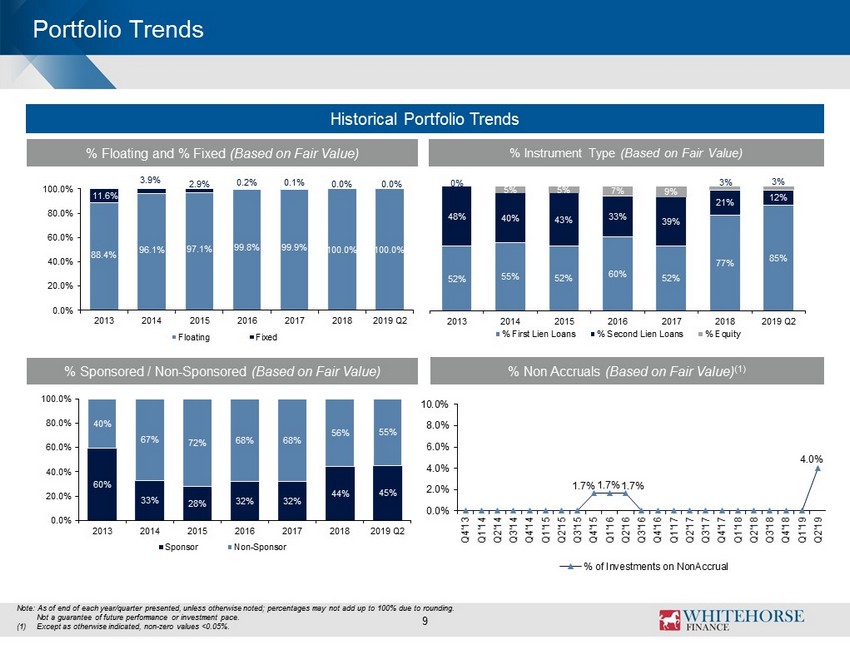
Portfolio Trends Historical Portfolio Trends 9 % Floating and % Fixed (Based on Fair Value ) % Instrument Type (Based on Fair Value) % Sponsored / Non - Sponsored (Based on Fair Value) % Non Accruals (Based on Fair Value) (1) Note: As of end of each year/quarter presented, unless otherwise noted; percentages may not add up to 100% due to rounding. Not a guarantee of future performance or investment pace . (1) Except as otherwise indicated, non - zero values <0.05%. 88.4% 96.1% 97.1% 99.8% 99.9% 100.0% 100.0% 11.6% 3.9% 2.9% 0.2% 0.1% 0.0% 0.0% 0.0% 20.0% 40.0% 60.0% 80.0% 100.0% 2013 2014 2015 2016 2017 2018 2019 Q2 Floating Fixed 52% 55% 52% 60% 52% 77% 85% 48% 40% 43% 33% 39% 21% 12% 0% 5% 5% 7% 9% 3% 3% 2013 2014 2015 2016 2017 2018 2019 Q2 % First Lien Loans % Second Lien Loans % Equity 60% 33% 28% 32% 32% 44% 45% 40% 67% 72% 68% 68% 56% 55% 0.0% 20.0% 40.0% 60.0% 80.0% 100.0% 2013 2014 2015 2016 2017 2018 2019 Q2 Sponsor Non-Sponsor 1.7% 1.7% 1.7% 4.0% 0.0% 2.0% 4.0% 6.0% 8.0% 10.0% Q4'13 Q1'14 Q2'14 Q3'14 Q4'14 Q1'15 Q2'15 Q3'15 Q4'15 Q1'16 Q2'16 Q3'16 Q4'16 Q1'17 Q2'17 Q3'17 Q4'17 Q1'18 Q2'18 Q3'18 Q4'18 Q1'19 Q2'19 % of Investments on NonAccrual
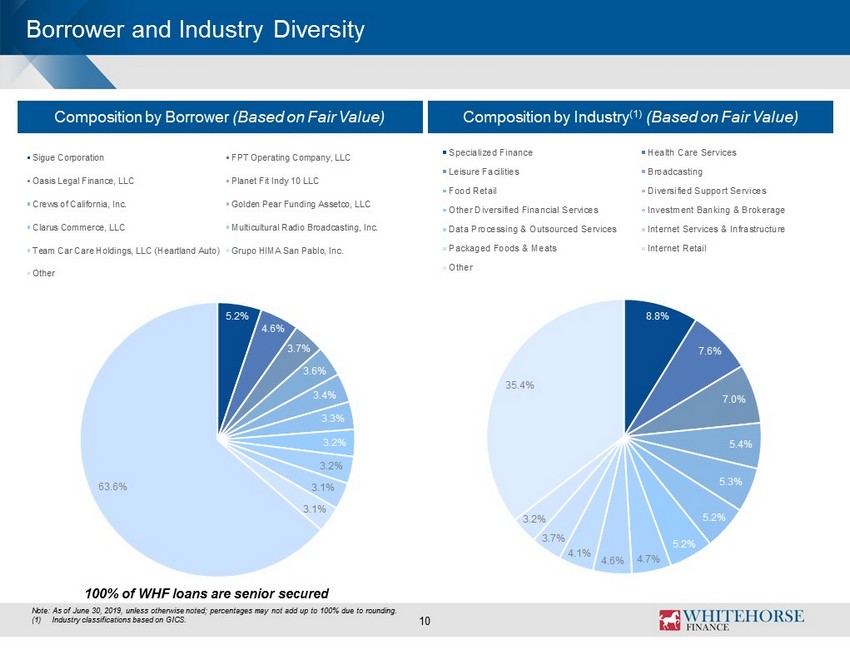
10 Note: As of June 30, 2019, unless otherwise noted; percentages may not add up to 100% due to rounding. (1) Industry classifications based on GICS. Composition by Borrower (Based on Fair Value) Composition by Industry (1) (Based on Fair Value) 100% of WHF loans are senior secured Borrower and Industry Diversity 8.8% 7.6% 7.0% 5.4% 5.3% 5.2% 5.2% 4.7% 4.6% 4.1% 3.7% 3.2% 35.4% Specialized Finance Health Care Services Leisure Facilities Broadcasting Food Retail Diversified Support Services Other Diversified Financial Services Investment Banking & Brokerage Data Processing & Outsourced Services Internet Services & Infrastructure Packaged Foods & Meats Internet Retail Other 5.2% 4.6% 3.7% 3.6% 3.4% 3.3% 3.2% 3.2% 3.1% 3.1% 63.6% Sigue Corporation FPT Operating Company, LLC Oasis Legal Finance, LLC Planet Fit Indy 10 LLC Crews of California, Inc. Golden Pear Funding Assetco, LLC Clarus Commerce, LLC Multicultural Radio Broadcasting, Inc. Team Car Care Holdings, LLC (Heartland Auto) Grupo HIMA San Pablo, Inc. Other
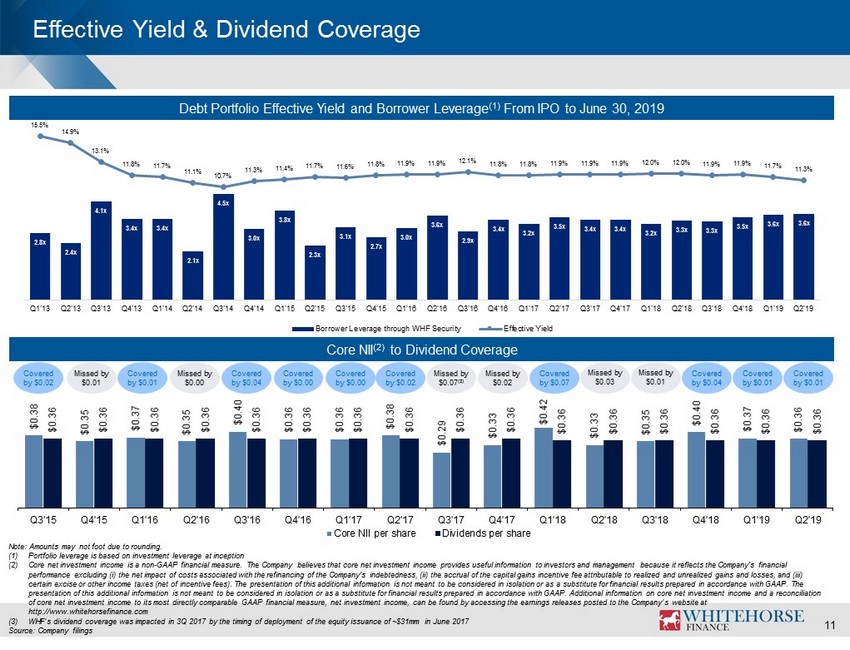
Effective Yield & Dividend Coverage Debt Portfolio Effective Yield and Borrower Leverage (1) From IPO to June 30, 2019 11 Core NII (2) to Dividend Coverage Covered by $0.01 Covered by $0.02 Missed by $0.01 Covered by $0.01 Missed by $0.00 Covered by $0.04 Covered by $0.00 Covered by $0.00 Covered by $0.02 Missed by $0.07 (3) Covered by $0.07 Missed by $0.02 Note: Amounts may not foot due to rounding. (1) Portfolio leverage is based on investment leverage at inception (2) Core net investment income is a non - GAAP financial measure. The Company believes that core net investment income provides useful information to investors and management because it reflects the Company's financial performance excluding (i) the net impact of costs associated with the refinancing of the Company's indebtedness, (ii) the accrual of the capital gains incentive fee attributable to realized and unrealized gains and losses, and (iii) certain excise or other income taxes (net of incentive fees). The presentation of this additional information is not meant to be considered in isolation or as a substitute for financial r es ults prepared in accordance with GAAP. The presentation of this additional information is not meant to be considered in isolation or as a substitute for financial resul ts prepared in accordance with GAAP. Additional information on core net investment income and a reconciliation of core net investment income to its most directly comparable GAAP financial measure, net investment income, can be found by acc essing the earnings releases posted to the Company’s website at http://www.whitehorsefinance.com (3) WHF’s dividend coverage was impacted in 3Q 2017 by the timing of deployment of the equity issuance of ~$31mm in June 2017 Source: Company filings Missed by $0.03 Missed by $0.01 Covered by $0.04 2.8x 2.4x 4.1x 3.4x 3.4x 2.1x 4.5x 3.0x 3.8x 2.3x 3.1x 2.7x 3.0x 3.6x 2.9x 3.4x 3.2x 3.5x 3.4x 3.4x 3.2x 3.3x 3.3x 3.5x 3.6x 3.6x 15.5% 14.9% 13.1% 11.8% 11.7% 11.1% 10.7% 11.3% 11.4% 11.7% 11.6% 11.8% 11.9% 11.9% 12.1% 11.8% 11.8% 11.9% 11.9% 11.9% 12.0% 12.0% 11.9% 11.9% 11.7% 11.3% Q1'13 Q2'13 Q3'13 Q4'13 Q1'14 Q2'14 Q3'14 Q4'14 Q1'15 Q2'15 Q3'15 Q4'15 Q1'16 Q2'16 Q3'16 Q4'16 Q1'17 Q2'17 Q3'17 Q4'17 Q1'18 Q2'18 Q3'18 Q4'18 Q1'19 Q2'19 Borrower Leverage through WHF Security Effective Yield $0.38 $0.35 $0.37 $0.35 $0.40 $0.36 $0.36 $0.38 $0.29 $0.33 $0.42 $0.33 $0.35 $0.40 $0.37 $0.36 $0.36 $0.36 $0.36 $0.36 $0.36 $0.36 $0.36 $0.36 $0.36 $0.36 $0.36 $0.36 $0.36 $0.36 $0.36 $0.36 Q3'15 Q4'15 Q1'16 Q2'16 Q3'16 Q4'16 Q1'17 Q2'17 Q3'17 Q4'17 Q1'18 Q2'18 Q3'18 Q4'18 Q1'19 Q2'19 Core NII per share Dividends per share Covered by $0.01
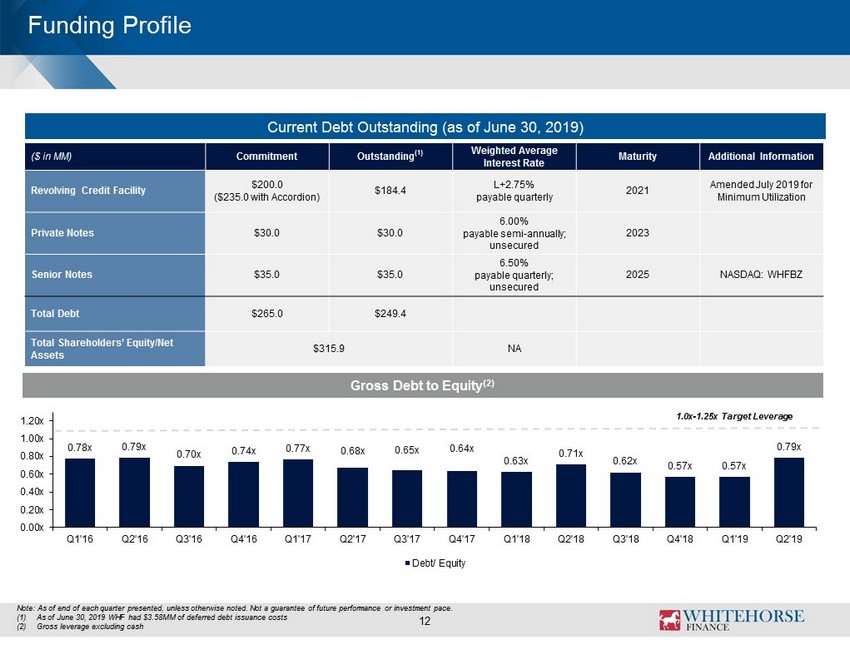
Note: As of end of each quarter presented, unless otherwise noted. Not a guarantee of future performance or investment pace . (1) As of June 30, 2019 WHF had $3.58MM of deferred debt issuance costs (2) Gross leverage excluding cash 3 Current Debt Outstanding (as of June 30, 2019) ($ in MM) Commitment Outstanding (1) Weighted Average Interest Rate Maturity Additional Information Revolving Credit Facility $200.0 ($235.0 with Accordion) $ 184.4 L+2.75% payable quarterly 2021 Amended July 2019 for Minimum Utilization Private Notes $30.0 $30.0 6.00% payable semi - annually; unsecured 2023 Senior Notes $ 35.0 $ 35.0 6.50 % payable quarterly; unsecured 2025 NASDAQ: WHFBZ Total Debt $ 265.0 $249.4 Total Shareholders ’ Equity/Net Assets $315.9 NA Funding Profile 1 2 Gross Debt to Equity (2) 1.0x - 1.25x Target Leverage 0.78x 0.79x 0.70x 0.74x 0.77x 0.68x 0.65x 0.64x 0.63x 0.71x 0.62x 0.57x 0.57x 0.79x 0.00x 0.20x 0.40x 0.60x 0.80x 1.00x 1.20x Q1'16 Q2'16 Q3'16 Q4'16 Q1'17 Q2'17 Q3'17 Q4'17 Q1'18 Q2'18 Q3'18 Q4'18 Q1'19 Q2'19 Debt/ Equity

13 Appendix
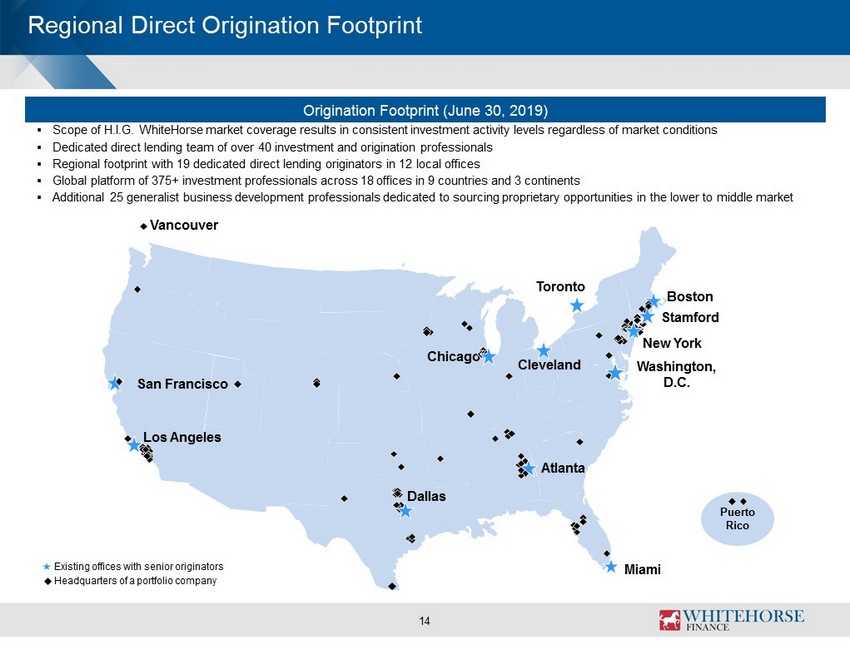
Origination Footprint ( June 30, 2019) Regional Direct Origination Footprint ▪ Scope of H.I.G. WhiteHorse market coverage results in consistent investment activity levels regardless of market conditions ▪ Dedicated direct lending team of over 40 investment and origination professionals ▪ Regional footprint with 19 dedicated direct lending originators in 12 local offices ▪ Global platform of 375+ investment professionals across 18 offices in 9 countries and 3 continents ▪ Additional 25 generalist business development professionals dedicated to sourcing proprietary opportunities in the lower to m idd le market Los Angeles Miami New York Boston Chicago Atlanta Stamford San Francisco Existing offices with senior originators Puerto Rico Headquarters of a portfolio company Dallas Washington, D.C. Cleveland Toronto Vancouver 14
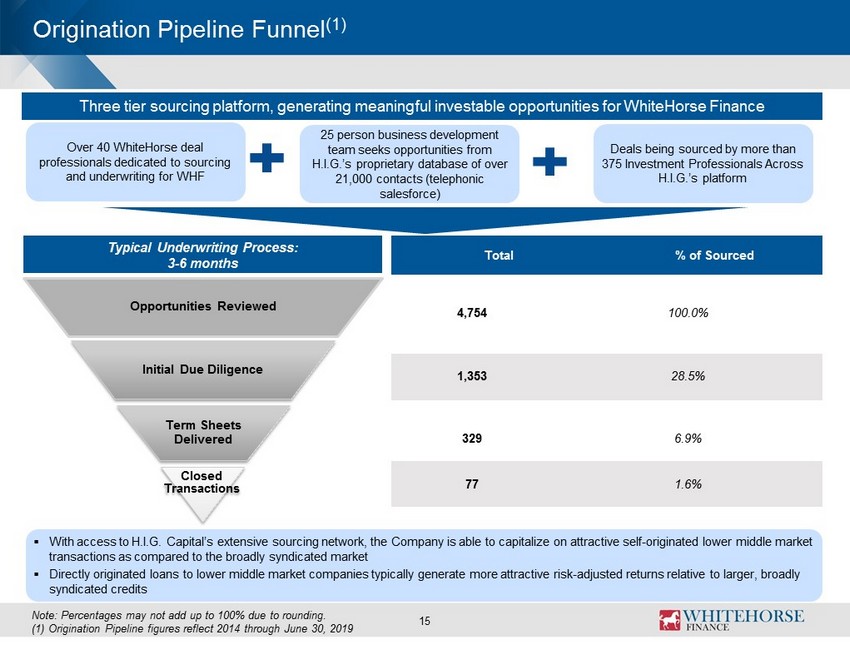
Origination Pipeline Funnel (1) 15 Note: Percentages may not add up to 100% due to rounding. (1 ) Origination Pipeline figures reflect 2014 through June 30, 2019 Three tier sourcing platform, generating meaningful investable opportunities for WhiteHorse Finance Over 40 WhiteHorse deal professionals dedicated to sourcing and underwriting for WHF 25 person business development team seeks opportunities from H.I.G.’s proprietary database of over 21,000 contacts (telephonic salesforce) ▪ With access to H.I.G. Capital’s extensive sourcing network, the Company is able to capitalize on attractive self - originated lowe r middle market transactions as compared to the broadly syndicated market ▪ Directly originated loans to lower middle market companies typically generate more attractive risk - adjusted returns relative to larger, broadly syndicated credits Typical Underwriting Process: 3 - 6 months Opportunities Reviewed Initial Due Diligence Term Sheets Delivered Closed Transactions Total % of Sourced 4,754 100.0% 1,353 28.5% 329 6.9% 77 1.6% Deals being sourced by more than 375 Investment Professionals Across H.I.G.’s platform