UNITED STATES
SECURITIES AND EXCHANGE COMMISSION
Washington, D.C. 20549
Form N-CSR
CERTIFIED SHAREHOLDER REPORT OF REGISTERED
MANAGEMENT INVESTMENT COMPANIES
Investment Company Act File Number: 811-22714
Eaton Vance Series Fund, Inc.
(Exact Name of Registrant as Specified in Charter)
One Post Office Square, Boston, Massachusetts 02109
(Address of Principal Executive Offices)
Deidre E. Walsh
One Post Office Square, Boston, Massachusetts 02109
(Name and Address of Agent for Services)
(617) 482-8260
(Registrant’s Telephone Number)
July 31
Date of Fiscal Year End
July 31, 2024
Date of Reporting Period
Item 1. Reports to Stockholders
(a)
Eaton Vance Emerging Markets Debt Opportunities Fund
Annual Shareholder Report July 31, 2024
This annual shareholder report contains important information about the Eaton Vance Emerging Markets Debt Opportunities Fund for the period of August 1, 2023 to July 31, 2024. You can find additional information about the Fund at www.eatonvance.com/open-end-mutual-fund-documents.php. You can also request this information by contacting us at 1-800-262-1122.
What were the Fund costs for the last year?
(based on a hypothetical $10,000 investment)
| Class Name | Costs of a $10,000 investment | Costs paid as a percentage of a $10,000 investment |
|---|
| Class A | $122 | 1.15% |
How did the Fund perform last year and what affected its performance?
Key contributors to (↑) and detractors from (↓) performance, relative to the J.P. Morgan EMB (JEMB) Hard Currency/Local Currency 50-50 Index (the Index):
↑ An overweight position in Surinamese government bonds -- boosted by debt restructuring in late 2023 -- helped Index-relative returns during the period
↑ An out-of-Index allocation to Egyptian local-currency bonds aided returns as actions by Egypt’s central bank led to support by the IMF and other groups
↑ An overweight exposure to Brazilian corporate bonds -- including sugar and ethanol producer Usina Coruripe, and mining firm Samarco -- helped returns
↑ The use of derivatives -- including foreign exchange forwards to manage currency exposures and interest-rate swaps to manage interest-rate exposures -- helped Index-relative performance
↓ The Fund’s lack of exposure to U.S. interest rates hurt performance as short-term interest-rate declines led to multiple bond rallies during the period
↓ An underweight exposure to the South African rand, which rallied after the ANC Party lost its majority in a national election, detracted from returns
↓ An out-of-Index exposure to the South Korean won hurt returns as the currency weakened amid rising concerns over political and economic risks
Comparison of the change in value of a $10,000 investment for the period indicated.
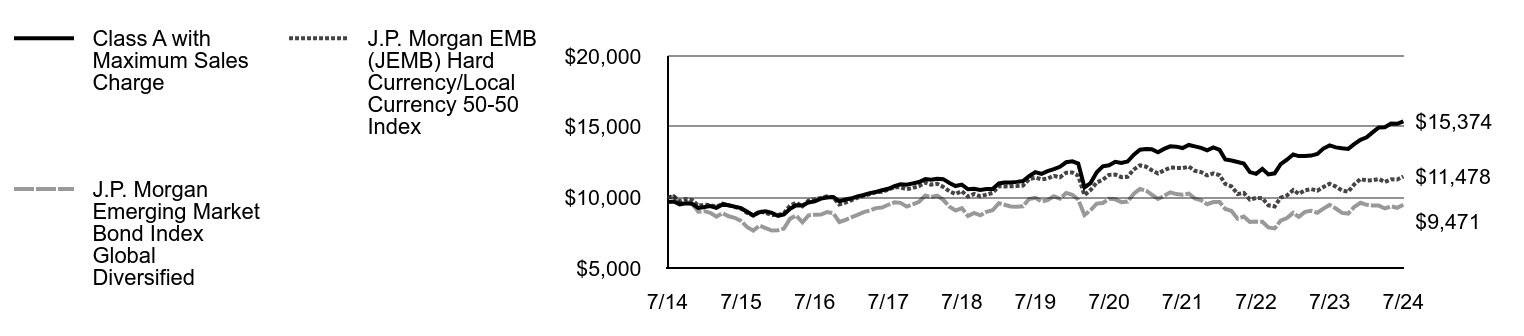
| Class A with Maximum Sales Charge | J.P. Morgan Emerging Market Bond Index Global Diversified | J.P. Morgan EMB (JEMB) Hard Currency/Local Currency 50-50 Index |
|---|
| 7/14 | $9,675 | $10,000 | $10,000 |
| 8/14 | $9,704 | $10,048 | $10,065 |
| 9/14 | $9,499 | $9,535 | $9,741 |
| 10/14 | $9,577 | $9,684 | $9,881 |
| 11/14 | $9,538 | $9,557 | $9,814 |
| 12/14 | $9,255 | $8,990 | $9,419 |
| 1/15 | $9,316 | $9,021 | $9,473 |
| 2/15 | $9,387 | $8,899 | $9,456 |
| 3/15 | $9,255 | $8,634 | $9,333 |
| 4/15 | $9,499 | $8,886 | $9,547 |
| 5/15 | $9,438 | $8,657 | $9,427 |
| 6/15 | $9,346 | $8,552 | $9,312 |
| 7/15 | $9,234 | $8,332 | $9,203 |
| 8/15 | $8,979 | $7,884 | $8,899 |
| 9/15 | $8,725 | $7,650 | $8,711 |
| 10/15 | $8,949 | $7,996 | $9,017 |
| 11/15 | $9,010 | $7,823 | $8,906 |
| 12/15 | $8,907 | $7,649 | $8,749 |
| 1/16 | $8,690 | $7,676 | $8,752 |
| 2/16 | $8,793 | $7,787 | $8,880 |
| 3/16 | $9,196 | $8,492 | $9,425 |
| 4/16 | $9,434 | $8,710 | $9,629 |
| 5/16 | $9,423 | $8,237 | $9,368 |
| 6/16 | $9,640 | $8,722 | $9,764 |
| 7/16 | $9,713 | $8,774 | $9,876 |
| 8/16 | $9,909 | $8,778 | $9,955 |
| 9/16 | $9,992 | $8,955 | $10,070 |
| 10/16 | $10,018 | $8,879 | $9,996 |
| 11/16 | $9,723 | $8,255 | $9,490 |
| 12/16 | $9,847 | $8,410 | $9,629 |
| 1/17 | $9,929 | $8,599 | $9,802 |
| 2/17 | $10,065 | $8,754 | $9,973 |
| 3/17 | $10,169 | $8,956 | $10,106 |
| 4/17 | $10,296 | $9,061 | $10,231 |
| 5/17 | $10,380 | $9,239 | $10,370 |
| 6/17 | $10,497 | $9,281 | $10,396 |
| 7/17 | $10,604 | $9,473 | $10,546 |
| 8/17 | $10,790 | $9,643 | $10,712 |
| 9/17 | $10,921 | $9,610 | $10,704 |
| 10/17 | $10,893 | $9,340 | $10,572 |
| 11/17 | $10,991 | $9,497 | $10,663 |
| 12/17 | $11,085 | $9,689 | $10,799 |
| 1/18 | $11,289 | $10,123 | $11,041 |
| 2/18 | $11,249 | $10,017 | $10,901 |
| 3/18 | $11,315 | $10,119 | $10,960 |
| 4/18 | $11,286 | $9,820 | $10,740 |
| 5/18 | $11,020 | $9,331 | $10,428 |
| 6/18 | $10,800 | $9,065 | $10,237 |
| 7/18 | $10,903 | $9,237 | $10,437 |
| 8/18 | $10,572 | $8,674 | $10,046 |
| 9/18 | $10,603 | $8,899 | $10,238 |
| 10/18 | $10,525 | $8,725 | $10,067 |
| 11/18 | $10,594 | $8,970 | $10,194 |
| 12/18 | $10,592 | $9,087 | $10,313 |
| 1/19 | $10,980 | $9,583 | $10,778 |
| 2/19 | $11,055 | $9,478 | $10,775 |
| 3/19 | $11,055 | $9,353 | $10,777 |
| 4/19 | $11,093 | $9,336 | $10,795 |
| 5/19 | $11,157 | $9,364 | $10,835 |
| 6/19 | $11,493 | $9,880 | $11,285 |
| 7/19 | $11,779 | $9,971 | $11,397 |
| 8/19 | $11,663 | $9,708 | $11,271 |
| 9/19 | $11,848 | $9,801 | $11,330 |
| 10/19 | $11,995 | $10,085 | $11,526 |
| 11/19 | $12,157 | $9,902 | $11,419 |
| 12/19 | $12,481 | $10,311 | $11,740 |
| 1/20 | $12,550 | $10,179 | $11,755 |
| 2/20 | $12,388 | $9,832 | $11,525 |
| 3/20 | $10,707 | $8,743 | $10,156 |
| 4/20 | $11,013 | $9,086 | $10,516 |
| 5/20 | $11,770 | $9,556 | $11,051 |
| 6/20 | $12,196 | $9,601 | $11,250 |
| 7/20 | $12,272 | $9,891 | $11,590 |
| 8/20 | $12,519 | $9,858 | $11,612 |
| 9/20 | $12,440 | $9,660 | $11,427 |
| 10/20 | $12,532 | $9,701 | $11,458 |
| 11/20 | $13,000 | $10,233 | $11,959 |
| 12/20 | $13,370 | $10,589 | $12,267 |
| 1/21 | $13,419 | $10,476 | $12,166 |
| 2/21 | $13,410 | $10,195 | $11,923 |
| 3/21 | $13,195 | $9,882 | $11,692 |
| 4/21 | $13,425 | $10,105 | $11,906 |
| 5/21 | $13,611 | $10,357 | $12,106 |
| 6/21 | $13,587 | $10,232 | $12,080 |
| 7/21 | $13,487 | $10,188 | $12,073 |
| 8/21 | $13,707 | $10,266 | $12,170 |
| 9/21 | $13,606 | $9,914 | $11,878 |
| 10/21 | $13,505 | $9,782 | $11,786 |
| 11/21 | $13,325 | $9,515 | $11,555 |
| 12/21 | $13,535 | $9,663 | $11,697 |
| 1/22 | $13,353 | $9,662 | $11,564 |
| 2/22 | $12,679 | $9,179 | $10,946 |
| 3/22 | $12,606 | $9,039 | $10,768 |
| 4/22 | $12,501 | $8,494 | $10,237 |
| 5/22 | $12,395 | $8,644 | $10,313 |
| 6/22 | $11,784 | $8,259 | $9,844 |
| 7/22 | $11,661 | $8,283 | $9,956 |
| 8/22 | $12,016 | $8,271 | $9,930 |
| 9/22 | $11,624 | $7,869 | $9,435 |
| 10/22 | $11,699 | $7,799 | $9,349 |
| 11/22 | $12,350 | $8,353 | $9,982 |
| 12/22 | $12,664 | $8,534 | $10,136 |
| 1/23 | $13,032 | $8,900 | $10,511 |
| 2/23 | $12,919 | $8,618 | $10,245 |
| 3/23 | $12,927 | $8,974 | $10,502 |
| 4/23 | $12,952 | $9,051 | $10,584 |
| 5/23 | $13,066 | $8,908 | $10,470 |
| 6/23 | $13,449 | $9,199 | $10,727 |
| 7/23 | $13,672 | $9,463 | $10,959 |
| 8/23 | $13,536 | $9,209 | $10,759 |
| 9/23 | $13,471 | $8,899 | $10,487 |
| 10/23 | $13,425 | $8,852 | $10,392 |
| 11/23 | $13,766 | $9,319 | $10,907 |
| 12/23 | $14,072 | $9,618 | $11,295 |
| 1/24 | $14,249 | $9,471 | $11,196 |
| 2/24 | $14,597 | $9,417 | $11,212 |
| 3/24 | $14,948 | $9,414 | $11,297 |
| 4/24 | $14,957 | $9,213 | $11,092 |
| 5/24 | $15,216 | $9,362 | $11,272 |
| 6/24 | $15,205 | $9,261 | $11,255 |
| 7/24 | $15,374 | $9,471 | $11,478 |
Average Annual Total Returns (%)Footnote Reference*
| 1 Year | 5 Years | 10 Years |
|---|
| Class A | 12.42% | 5.46% | 4.73% |
| Class A with 3.25% Maximum Sales Charge | 8.83% | 4.78% | 4.39% |
J.P. Morgan Emerging Market Bond Index Global Diversified Footnote Reference†Footnote Referencea | 0.08% | (1.02%) | (0.54%) |
J.P. Morgan EMB (JEMB) Hard Currency/Local Currency 50-50 IndexFootnote Referencea | 4.73% | 0.14% | 1.39% |
| Footnote | Description |
Footnote† | In accordance with regulatory changes requiring the Fund’s primary benchmark to represent the overall applicable market, the Fund’s primary prospectus benchmark changed to the indicated benchmark effective May 1, 2024. |
Footnotea | Index is used with permission. Copyright 2021, J.P. Morgan Chase & Co. All rights reserved. See Fund prospectus for full description. |
Footnote* | Class A performance prior to 9/3/15 is linked to Class R6. This linked performance is adjusted for any applicable sales charge, but is not adjusted for class expense differences. If adjusted for such differences, the performance would be different. Performance presented in the Financial Highlights included in the financial statements is not linked. |
Performance does not reflect the deduction of taxes that a shareholder would pay on Fund distributions or redemption of Fund shares. Performance assumes that all dividends and distributions, if any, were reinvested. For more recent performance information, visit www.eatonvance.com/performance.php.
THE FUND'S PAST PERFORMANCE IS NO GUARANTEE OF FUTURE RESULTS.
| Total Net Assets | $2,357,927,839 |
| # of Portfolio Holdings (including derivatives) | 699 |
| Portfolio Turnover Rate | 173% |
| Total Advisory Fees Paid | $11,163,451 |
What did the Fund invest in?
The following tables reflect what the Fund invested in as of the report date.
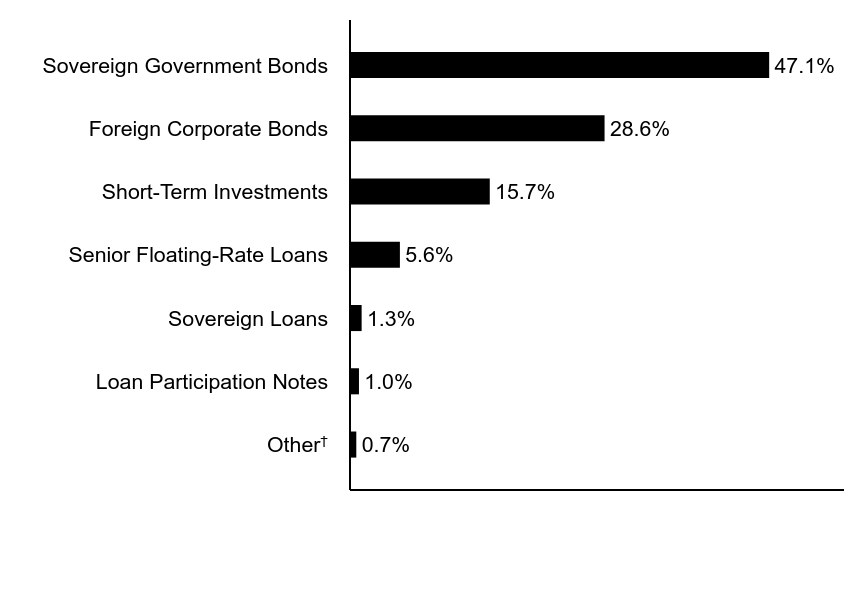
Asset Allocation (% of total investments)
| Value | Value |
|---|
OtherFootnote Reference† | 0.7% |
| Loan Participation Notes | 1.0% |
| Sovereign Loans | 1.3% |
| Senior Floating-Rate Loans | 5.6% |
| Short-Term Investments | 15.7% |
| Foreign Corporate Bonds | 28.6% |
| Sovereign Government Bonds | 47.1% |
| Footnote | Description |
Footnote† | Investment types less than 1% each |
Foreign Currency Exposure (% of net assets)Footnote Reference*
| Egypt | 9.7% |
| Uzbekistan | 9.3% |
| Dominican Republic | 4.4% |
| Nigeria | 3.6% |
| Serbia | 3.2% |
| Turkey | 2.7% |
| Taiwan | 1.9% |
| Kazakhstan | 1.9% |
| Malaysia | 1.6% |
| Other | 9.3% |
| Total Long Exposure | 47.7% |
| Euro | (3.0%) |
| Total Short Exposure | (3.0%) |
| Footnote | Description |
Footnote* | Currency exposures include all foreign exchange denominated assets and currency derivatives. |
If you wish to view additional information about the Fund, including the prospectus, statement of additional information, financial statements and holdings, please scan the QR code or visit www.eatonvance.com/open-end-mutual-fund-documents.php. For proxy information, please visit www.eatonvance.com/proxyvoting.
The Funds may deliver a single copy of certain required shareholder documents (including prospectuses, shareholder reports, and proxy materials) to investors with the same last name and the same address. Your participation will continue indefinitely unless you instruct otherwise by calling 1-800-262-1122 or by contacting your financial intermediary. Your instruction will typically be effective within 30 days of receipt.
Not FDIC Insured | May Lose Value | No Bank Guarantee
Annual Shareholder Report July 31, 2024
Eaton Vance Emerging Markets Debt Opportunities Fund
Annual Shareholder Report July 31, 2024
This annual shareholder report contains important information about the Eaton Vance Emerging Markets Debt Opportunities Fund for the period of August 1, 2023 to July 31, 2024. You can find additional information about the Fund at www.eatonvance.com/open-end-mutual-fund-documents.php. You can also request this information by contacting us at 1-800-262-1122.
What were the Fund costs for the last year?
(based on a hypothetical $10,000 investment)
| Class Name | Costs of a $10,000 investment | Costs paid as a percentage of a $10,000 investment |
|---|
| Class I | $97 | 0.91% |
How did the Fund perform last year and what affected its performance?
Key contributors to (↑) and detractors from (↓) performance, relative to the J.P. Morgan EMB (JEMB) Hard Currency/Local Currency 50-50 Index (the Index):
↑ An overweight position in Surinamese government bonds -- boosted by debt restructuring in late 2023 -- helped Index-relative returns during the period
↑ An out-of-Index allocation to Egyptian local-currency bonds aided returns as actions by Egypt’s central bank led to support by the IMF and other groups
↑ An overweight exposure to Brazilian corporate bonds -- including sugar and ethanol producer Usina Coruripe, and mining firm Samarco -- helped returns
↑ The use of derivatives -- including foreign exchange forwards to manage currency exposures and interest-rate swaps to manage interest-rate exposures -- helped Index-relative performance
↓ The Fund’s lack of exposure to U.S. interest rates hurt performance as short-term interest-rate declines led to multiple bond rallies during the period
↓ An underweight exposure to the South African rand, which rallied after the ANC Party lost its majority in a national election, detracted from returns
↓ An out-of-Index exposure to the South Korean won hurt returns as the currency weakened amid rising concerns over political and economic risks
Comparison of the change in value of a $1,000,000 investment for the period indicated.
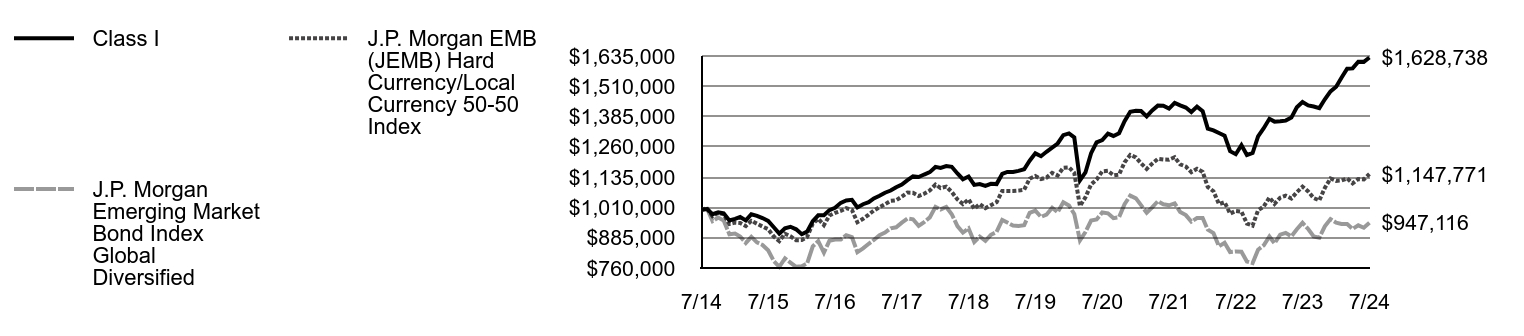
| Class I | J.P. Morgan Emerging Market Bond Index Global Diversified | J.P. Morgan EMB (JEMB) Hard Currency/Local Currency 50-50 Index |
|---|
| 7/14 | $1,000,000 | $1,000,000 | $1,000,000 |
| 8/14 | $1,003,041 | $1,004,800 | $1,006,507 |
| 9/14 | $981,784 | $953,471 | $974,074 |
| 10/14 | $989,883 | $968,373 | $988,062 |
| 11/14 | $985,830 | $955,682 | $981,372 |
| 12/14 | $956,557 | $899,035 | $941,886 |
| 1/15 | $962,877 | $902,050 | $947,255 |
| 2/15 | $970,250 | $889,941 | $945,646 |
| 3/15 | $956,558 | $863,416 | $933,273 |
| 4/15 | $981,840 | $888,615 | $954,692 |
| 5/15 | $975,518 | $865,700 | $942,688 |
| 6/15 | $966,033 | $855,160 | $931,157 |
| 7/15 | $954,443 | $833,234 | $920,259 |
| 8/15 | $928,104 | $788,415 | $889,850 |
| 9/15 | $901,764 | $765,008 | $871,146 |
| 10/15 | $923,883 | $799,639 | $901,690 |
| 11/15 | $930,203 | $782,348 | $890,640 |
| 12/15 | $919,700 | $764,915 | $874,876 |
| 1/16 | $899,354 | $767,573 | $875,214 |
| 2/16 | $910,064 | $778,654 | $887,954 |
| 3/16 | $952,890 | $849,173 | $942,511 |
| 4/16 | $977,519 | $871,017 | $962,878 |
| 5/16 | $977,519 | $823,660 | $936,784 |
| 6/16 | $998,932 | $872,154 | $976,446 |
| 7/16 | $1,008,567 | $877,403 | $987,650 |
| 8/16 | $1,028,908 | $877,755 | $995,515 |
| 9/16 | $1,038,542 | $895,514 | $1,006,957 |
| 10/16 | $1,041,538 | $887,943 | $999,554 |
| 11/16 | $1,010,115 | $825,506 | $949,007 |
| 12/16 | $1,023,157 | $840,957 | $962,902 |
| 1/17 | $1,031,840 | $859,894 | $980,190 |
| 2/17 | $1,047,327 | $875,389 | $997,346 |
| 3/17 | $1,058,394 | $895,633 | $1,010,614 |
| 4/17 | $1,070,676 | $906,094 | $1,023,115 |
| 5/17 | $1,079,601 | $923,858 | $1,037,039 |
| 6/17 | $1,093,169 | $928,086 | $1,039,570 |
| 7/17 | $1,104,507 | $947,334 | $1,054,582 |
| 8/17 | $1,122,892 | $964,321 | $1,071,243 |
| 9/17 | $1,137,897 | $961,047 | $1,070,380 |
| 10/17 | $1,135,312 | $933,956 | $1,057,194 |
| 11/17 | $1,145,750 | $949,692 | $1,066,304 |
| 12/17 | $1,155,781 | $968,892 | $1,079,881 |
| 1/18 | $1,177,264 | $1,012,287 | $1,104,140 |
| 2/18 | $1,173,381 | $1,001,718 | $1,090,103 |
| 3/18 | $1,180,470 | $1,011,947 | $1,095,952 |
| 4/18 | $1,177,773 | $982,024 | $1,073,956 |
| 5/18 | $1,150,328 | $933,148 | $1,042,833 |
| 6/18 | $1,126,453 | $906,484 | $1,023,732 |
| 7/18 | $1,137,449 | $923,663 | $1,043,675 |
| 8/18 | $1,103,175 | $867,447 | $1,004,594 |
| 9/18 | $1,106,721 | $889,940 | $1,023,789 |
| 10/18 | $1,098,800 | $872,504 | $1,006,718 |
| 11/18 | $1,107,544 | $897,000 | $1,019,386 |
| 12/18 | $1,106,329 | $908,713 | $1,031,304 |
| 1/19 | $1,148,243 | $958,304 | $1,077,821 |
| 2/19 | $1,156,376 | $947,830 | $1,077,530 |
| 3/19 | $1,156,623 | $935,253 | $1,077,652 |
| 4/19 | $1,160,839 | $933,613 | $1,079,460 |
| 5/19 | $1,167,749 | $936,372 | $1,083,484 |
| 6/19 | $1,203,068 | $987,961 | $1,128,503 |
| 7/19 | $1,233,222 | $997,124 | $1,139,683 |
| 8/19 | $1,221,445 | $970,800 | $1,127,123 |
| 9/19 | $1,239,687 | $980,133 | $1,133,036 |
| 10/19 | $1,256,715 | $1,008,532 | $1,152,649 |
| 11/19 | $1,273,848 | $990,202 | $1,141,893 |
| 12/19 | $1,308,047 | $1,031,138 | $1,174,018 |
| 1/20 | $1,315,565 | $1,017,869 | $1,175,454 |
| 2/20 | $1,298,887 | $983,163 | $1,152,535 |
| 3/20 | $1,122,037 | $874,279 | $1,015,617 |
| 4/20 | $1,154,291 | $908,555 | $1,051,624 |
| 5/20 | $1,233,732 | $955,600 | $1,105,094 |
| 6/20 | $1,278,566 | $960,097 | $1,125,007 |
| 7/20 | $1,288,335 | $989,087 | $1,158,962 |
| 8/20 | $1,314,481 | $985,841 | $1,161,152 |
| 9/20 | $1,304,991 | $965,965 | $1,142,679 |
| 10/20 | $1,316,454 | $970,079 | $1,145,759 |
| 11/20 | $1,365,779 | $1,023,317 | $1,195,879 |
| 12/20 | $1,404,778 | $1,058,914 | $1,226,736 |
| 1/21 | $1,408,794 | $1,047,562 | $1,216,627 |
| 2/21 | $1,408,166 | $1,019,493 | $1,192,265 |
| 3/21 | $1,385,909 | $988,197 | $1,169,194 |
| 4/21 | $1,410,271 | $1,010,525 | $1,190,632 |
| 5/21 | $1,430,110 | $1,035,737 | $1,210,564 |
| 6/21 | $1,429,516 | $1,023,155 | $1,207,964 |
| 7/21 | $1,417,793 | $1,018,783 | $1,207,296 |
| 8/21 | $1,441,198 | $1,026,635 | $1,217,041 |
| 9/21 | $1,430,952 | $991,407 | $1,187,819 |
| 10/21 | $1,422,238 | $978,240 | $1,178,629 |
| 11/21 | $1,403,726 | $951,483 | $1,155,466 |
| 12/21 | $1,426,077 | $966,287 | $1,169,664 |
| 1/22 | $1,407,343 | $966,237 | $1,156,419 |
| 2/22 | $1,335,154 | $917,920 | $1,094,583 |
| 3/22 | $1,327,843 | $903,861 | $1,076,770 |
| 4/22 | $1,317,109 | $849,392 | $1,023,728 |
| 5/22 | $1,306,284 | $864,367 | $1,031,310 |
| 6/22 | $1,242,323 | $825,879 | $984,437 |
| 7/22 | $1,229,707 | $828,297 | $995,576 |
| 8/22 | $1,267,262 | $827,134 | $992,974 |
| 9/22 | $1,226,356 | $786,851 | $943,501 |
| 10/22 | $1,234,540 | $779,909 | $934,857 |
| 11/22 | $1,303,300 | $835,334 | $998,175 |
| 12/22 | $1,336,712 | $853,375 | $1,013,615 |
| 1/23 | $1,375,757 | $890,009 | $1,051,109 |
| 2/23 | $1,364,151 | $861,845 | $1,024,475 |
| 3/23 | $1,365,320 | $897,396 | $1,050,200 |
| 4/23 | $1,368,331 | $905,133 | $1,058,435 |
| 5/23 | $1,380,674 | $890,841 | $1,047,018 |
| 6/23 | $1,423,140 | $919,882 | $1,072,750 |
| 7/23 | $1,445,149 | $946,350 | $1,095,932 |
| 8/23 | $1,431,102 | $920,923 | $1,075,869 |
| 9/23 | $1,426,570 | $889,918 | $1,048,662 |
| 10/23 | $1,420,071 | $885,233 | $1,039,164 |
| 11/23 | $1,456,361 | $931,876 | $1,090,708 |
| 12/23 | $1,489,002 | $961,763 | $1,129,469 |
| 1/24 | $1,508,030 | $947,116 | $1,119,643 |
| 2/24 | $1,545,143 | $941,683 | $1,121,165 |
| 3/24 | $1,582,527 | $941,417 | $1,129,667 |
| 4/24 | $1,583,801 | $921,300 | $1,109,241 |
| 5/24 | $1,611,548 | $936,163 | $1,127,225 |
| 6/24 | $1,610,804 | $926,051 | $1,125,490 |
| 7/24 | $1,628,738 | $947,116 | $1,147,771 |
Average Annual Total Returns (%)Footnote Reference*
| 1 Year | 5 Years | 10 Years |
|---|
| Class I | 12.70% | 5.71% | 4.99% |
J.P. Morgan Emerging Market Bond Index Global Diversified Footnote Reference†Footnote Referencea | 0.08% | (1.02%) | (0.54%) |
J.P. Morgan EMB (JEMB) Hard Currency/Local Currency 50-50 IndexFootnote Referencea | 4.73% | 0.14% | 1.39% |
| Footnote | Description |
Footnote† | In accordance with regulatory changes requiring the Fund’s primary benchmark to represent the overall applicable market, the Fund’s primary prospectus benchmark changed to the indicated benchmark effective May 1, 2024. |
Footnotea | Index is used with permission. Copyright 2021, J.P. Morgan Chase & Co. All rights reserved. See Fund prospectus for full description. |
Footnote* | Class I performance prior to 9/3/15 is linked to Class R6. This linked performance is adjusted for any applicable sales charge, but is not adjusted for class expense differences. If adjusted for such differences, the performance would be different. Performance presented in the Financial Highlights included in the financial statements is not linked. |
Performance does not reflect the deduction of taxes that a shareholder would pay on Fund distributions or redemption of Fund shares. Performance assumes that all dividends and distributions, if any, were reinvested. For more recent performance information, visit www.eatonvance.com/performance.php.
THE FUND'S PAST PERFORMANCE IS NO GUARANTEE OF FUTURE RESULTS.
| Total Net Assets | $2,357,927,839 |
| # of Portfolio Holdings (including derivatives) | 699 |
| Portfolio Turnover Rate | 173% |
| Total Advisory Fees Paid | $11,163,451 |
What did the Fund invest in?
The following tables reflect what the Fund invested in as of the report date.
Asset Allocation (% of total investments)
| Value | Value |
|---|
OtherFootnote Reference† | 0.7% |
| Loan Participation Notes | 1.0% |
| Sovereign Loans | 1.3% |
| Senior Floating-Rate Loans | 5.6% |
| Short-Term Investments | 15.7% |
| Foreign Corporate Bonds | 28.6% |
| Sovereign Government Bonds | 47.1% |
| Footnote | Description |
Footnote† | Investment types less than 1% each |
Foreign Currency Exposure (% of net assets)Footnote Reference*
| Egypt | 9.7% |
| Uzbekistan | 9.3% |
| Dominican Republic | 4.4% |
| Nigeria | 3.6% |
| Serbia | 3.2% |
| Turkey | 2.7% |
| Taiwan | 1.9% |
| Kazakhstan | 1.9% |
| Malaysia | 1.6% |
| Other | 9.3% |
| Total Long Exposure | 47.7% |
| Euro | (3.0%) |
| Total Short Exposure | (3.0%) |
| Footnote | Description |
Footnote* | Currency exposures include all foreign exchange denominated assets and currency derivatives. |
If you wish to view additional information about the Fund, including the prospectus, statement of additional information, financial statements and holdings, please scan the QR code or visit www.eatonvance.com/open-end-mutual-fund-documents.php. For proxy information, please visit www.eatonvance.com/proxyvoting.
The Funds may deliver a single copy of certain required shareholder documents (including prospectuses, shareholder reports, and proxy materials) to investors with the same last name and the same address. Your participation will continue indefinitely unless you instruct otherwise by calling 1-800-262-1122 or by contacting your financial intermediary. Your instruction will typically be effective within 30 days of receipt.
Not FDIC Insured | May Lose Value | No Bank Guarantee
Annual Shareholder Report July 31, 2024
Eaton Vance Emerging Markets Debt Opportunities Fund
Annual Shareholder Report July 31, 2024
This annual shareholder report contains important information about the Eaton Vance Emerging Markets Debt Opportunities Fund for the period of August 1, 2023 to July 31, 2024. You can find additional information about the Fund at www.eatonvance.com/open-end-mutual-fund-documents.php. You can also request this information by contacting us at 1-800-262-1122.
What were the Fund costs for the last year?
(based on a hypothetical $10,000 investment)
| Class Name | Costs of a $10,000 investment | Costs paid as a percentage of a $10,000 investment |
|---|
| Class R6 | $87 | 0.82% |
How did the Fund perform last year and what affected its performance?
Key contributors to (↑) and detractors from (↓) performance, relative to the J.P. Morgan EMB (JEMB) Hard Currency/Local Currency 50-50 Index (the Index):
↑ An overweight position in Surinamese government bonds -- boosted by debt restructuring in late 2023 -- helped Index-relative returns during the period
↑ An out-of-Index allocation to Egyptian local-currency bonds aided returns as actions by Egypt’s central bank led to support by the IMF and other groups
↑ An overweight exposure to Brazilian corporate bonds -- including sugar and ethanol producer Usina Coruripe, and mining firm Samarco -- helped returns
↑ The use of derivatives -- including foreign exchange forwards to manage currency exposures and interest-rate swaps to manage interest-rate exposures -- helped Index-relative performance
↓ The Fund’s lack of exposure to U.S. interest rates hurt performance as short-term interest-rate declines led to multiple bond rallies during the period
↓ An underweight exposure to the South African rand, which rallied after the ANC Party lost its majority in a national election, detracted from returns
↓ An out-of-Index exposure to the South Korean won hurt returns as the currency weakened amid rising concerns over political and economic risks
Comparison of the change in value of a $5,000,000 investment for the period indicated.
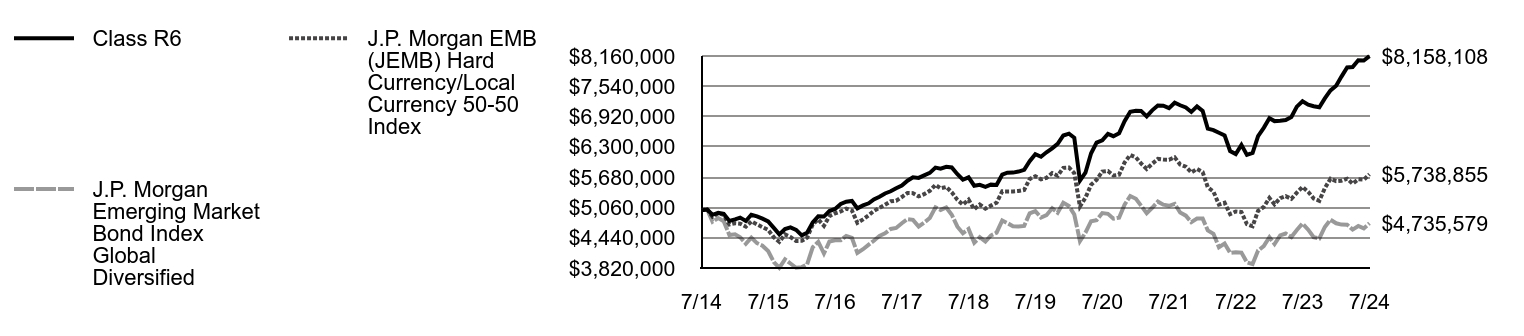
| Class R6 | J.P. Morgan Emerging Market Bond Index Global Diversified | J.P. Morgan EMB (JEMB) Hard Currency/Local Currency 50-50 Index |
|---|
| 7/14 | $5,000,000 | $5,000,000 | $5,000,000 |
| 8/14 | $5,015,203 | $5,024,002 | $5,032,537 |
| 9/14 | $4,908,919 | $4,767,355 | $4,870,371 |
| 10/14 | $4,949,415 | $4,841,866 | $4,940,309 |
| 11/14 | $4,929,149 | $4,778,409 | $4,906,861 |
| 12/14 | $4,782,787 | $4,495,175 | $4,709,428 |
| 1/15 | $4,814,385 | $4,510,250 | $4,736,274 |
| 2/15 | $4,851,248 | $4,449,703 | $4,728,229 |
| 3/15 | $4,782,788 | $4,317,082 | $4,666,366 |
| 4/15 | $4,909,199 | $4,443,075 | $4,773,459 |
| 5/15 | $4,877,588 | $4,328,502 | $4,713,441 |
| 6/15 | $4,830,166 | $4,275,799 | $4,655,783 |
| 7/15 | $4,772,214 | $4,166,168 | $4,601,297 |
| 8/15 | $4,640,518 | $3,942,077 | $4,449,251 |
| 9/15 | $4,508,820 | $3,825,042 | $4,355,731 |
| 10/15 | $4,619,417 | $3,998,197 | $4,508,449 |
| 11/15 | $4,651,017 | $3,911,742 | $4,453,202 |
| 12/15 | $4,599,861 | $3,824,575 | $4,374,380 |
| 1/16 | $4,487,391 | $3,837,863 | $4,376,072 |
| 2/16 | $4,540,950 | $3,893,271 | $4,439,770 |
| 3/16 | $4,755,164 | $4,245,863 | $4,712,555 |
| 4/16 | $4,878,344 | $4,355,086 | $4,814,391 |
| 5/16 | $4,872,968 | $4,118,301 | $4,683,919 |
| 6/16 | $4,985,416 | $4,360,769 | $4,882,229 |
| 7/16 | $5,028,237 | $4,387,014 | $4,938,249 |
| 8/16 | $5,129,967 | $4,388,776 | $4,977,577 |
| 9/16 | $5,178,154 | $4,477,572 | $5,034,786 |
| 10/16 | $5,193,257 | $4,439,714 | $4,997,769 |
| 11/16 | $5,041,561 | $4,127,530 | $4,745,035 |
| 12/16 | $5,101,502 | $4,204,785 | $4,814,511 |
| 1/17 | $5,145,136 | $4,299,469 | $4,900,949 |
| 2/17 | $5,222,755 | $4,376,943 | $4,986,730 |
| 3/17 | $5,278,230 | $4,478,167 | $5,053,071 |
| 4/17 | $5,345,453 | $4,530,472 | $5,115,575 |
| 5/17 | $5,390,252 | $4,619,289 | $5,185,196 |
| 6/17 | $5,452,599 | $4,640,431 | $5,197,852 |
| 7/17 | $5,509,481 | $4,736,670 | $5,272,912 |
| 8/17 | $5,607,487 | $4,821,606 | $5,356,214 |
| 9/17 | $5,676,815 | $4,805,234 | $5,351,902 |
| 10/17 | $5,663,964 | $4,669,781 | $5,285,970 |
| 11/17 | $5,716,318 | $4,748,459 | $5,331,519 |
| 12/17 | $5,766,594 | $4,844,458 | $5,399,404 |
| 1/18 | $5,874,294 | $5,061,436 | $5,520,702 |
| 2/18 | $5,854,984 | $5,008,589 | $5,450,513 |
| 3/18 | $5,890,594 | $5,059,737 | $5,479,761 |
| 4/18 | $5,877,210 | $4,910,119 | $5,369,778 |
| 5/18 | $5,739,960 | $4,665,741 | $5,214,164 |
| 6/18 | $5,626,841 | $4,532,422 | $5,118,661 |
| 7/18 | $5,675,805 | $4,618,315 | $5,218,375 |
| 8/18 | $5,504,348 | $4,337,237 | $5,022,970 |
| 9/18 | $5,522,194 | $4,449,700 | $5,118,944 |
| 10/18 | $5,482,678 | $4,362,518 | $5,033,589 |
| 11/18 | $5,526,626 | $4,484,999 | $5,096,930 |
| 12/18 | $5,520,692 | $4,543,564 | $5,156,521 |
| 1/19 | $5,730,753 | $4,791,521 | $5,389,104 |
| 2/19 | $5,771,585 | $4,739,148 | $5,387,648 |
| 3/19 | $5,773,015 | $4,676,264 | $5,388,259 |
| 4/19 | $5,794,293 | $4,668,064 | $5,397,301 |
| 5/19 | $5,828,977 | $4,681,862 | $5,417,422 |
| 6/19 | $6,006,021 | $4,939,807 | $5,642,513 |
| 7/19 | $6,150,394 | $4,985,619 | $5,698,414 |
| 8/19 | $6,098,345 | $4,853,998 | $5,635,617 |
| 9/19 | $6,189,861 | $4,900,664 | $5,665,180 |
| 10/19 | $6,268,342 | $5,042,661 | $5,763,247 |
| 11/19 | $6,361,278 | $4,951,011 | $5,709,463 |
| 12/19 | $6,532,845 | $5,155,688 | $5,870,090 |
| 1/20 | $6,570,690 | $5,089,345 | $5,877,271 |
| 2/20 | $6,487,247 | $4,915,813 | $5,762,676 |
| 3/20 | $5,608,344 | $4,371,397 | $5,078,083 |
| 4/20 | $5,770,087 | $4,542,775 | $5,258,122 |
| 5/20 | $6,168,340 | $4,777,998 | $5,525,471 |
| 6/20 | $6,385,877 | $4,800,485 | $5,625,033 |
| 7/20 | $6,434,960 | $4,945,434 | $5,794,812 |
| 8/20 | $6,566,082 | $4,929,205 | $5,805,760 |
| 9/20 | $6,518,577 | $4,829,825 | $5,713,396 |
| 10/20 | $6,576,042 | $4,850,395 | $5,728,793 |
| 11/20 | $6,823,363 | $5,116,586 | $5,979,397 |
| 12/20 | $7,018,992 | $5,294,570 | $6,133,682 |
| 1/21 | $7,039,276 | $5,237,808 | $6,083,134 |
| 2/21 | $7,036,261 | $5,097,467 | $5,961,326 |
| 3/21 | $6,924,868 | $4,940,984 | $5,845,970 |
| 4/21 | $7,047,216 | $5,052,623 | $5,953,158 |
| 5/21 | $7,146,809 | $5,178,687 | $6,052,820 |
| 6/21 | $7,144,070 | $5,115,777 | $6,039,821 |
| 7/21 | $7,093,404 | $5,093,916 | $6,036,482 |
| 8/21 | $7,202,913 | $5,133,173 | $6,085,206 |
| 9/21 | $7,151,613 | $4,957,034 | $5,939,094 |
| 10/21 | $7,107,998 | $4,891,201 | $5,893,146 |
| 11/21 | $7,015,240 | $4,757,413 | $5,777,331 |
| 12/21 | $7,127,500 | $4,831,435 | $5,848,321 |
| 1/22 | $7,033,571 | $4,831,183 | $5,782,097 |
| 2/22 | $6,671,666 | $4,589,600 | $5,472,917 |
| 3/22 | $6,643,553 | $4,519,304 | $5,383,851 |
| 4/22 | $6,589,857 | $4,246,960 | $5,118,639 |
| 5/22 | $6,535,708 | $4,321,836 | $5,156,550 |
| 6/22 | $6,214,917 | $4,129,393 | $4,922,185 |
| 7/22 | $6,151,716 | $4,141,484 | $4,977,879 |
| 8/22 | $6,340,208 | $4,135,670 | $4,964,870 |
| 9/22 | $6,135,073 | $3,934,253 | $4,717,504 |
| 10/22 | $6,176,223 | $3,899,543 | $4,674,284 |
| 11/22 | $6,521,301 | $4,176,670 | $4,990,873 |
| 12/22 | $6,689,125 | $4,266,877 | $5,068,074 |
| 1/23 | $6,885,131 | $4,450,043 | $5,255,546 |
| 2/23 | $6,827,077 | $4,309,226 | $5,122,374 |
| 3/23 | $6,833,128 | $4,486,979 | $5,251,001 |
| 4/23 | $6,848,426 | $4,525,663 | $5,292,174 |
| 5/23 | $6,910,464 | $4,454,205 | $5,235,088 |
| 6/23 | $7,123,851 | $4,599,409 | $5,363,749 |
| 7/23 | $7,234,574 | $4,731,749 | $5,479,659 |
| 8/23 | $7,164,163 | $4,604,613 | $5,379,344 |
| 9/23 | $7,131,979 | $4,449,588 | $5,243,311 |
| 10/23 | $7,109,252 | $4,426,164 | $5,195,821 |
| 11/23 | $7,291,628 | $4,659,381 | $5,453,540 |
| 12/23 | $7,455,690 | $4,808,815 | $5,647,345 |
| 1/24 | $7,551,418 | $4,735,581 | $5,598,214 |
| 2/24 | $7,737,953 | $4,708,415 | $5,605,823 |
| 3/24 | $7,925,860 | $4,707,084 | $5,648,334 |
| 4/24 | $7,932,456 | $4,606,501 | $5,546,204 |
| 5/24 | $8,071,888 | $4,680,817 | $5,636,124 |
| 6/24 | $8,068,359 | $4,630,256 | $5,627,452 |
| 7/24 | $8,158,108 | $4,735,579 | $5,738,855 |
Average Annual Total Returns (%)
| 1 Year | 5 Years | 10 Years |
|---|
| Class R6 | 12.76% | 5.81% | 5.01% |
J.P. Morgan Emerging Market Bond Index Global Diversified Footnote Reference†Footnote Referencea | 0.08% | (1.02%) | (0.54%) |
J.P. Morgan EMB (JEMB) Hard Currency/Local Currency 50-50 IndexFootnote Referencea | 4.73% | 0.14% | 1.39% |
| Footnote | Description |
Footnote† | In accordance with regulatory changes requiring the Fund’s primary benchmark to represent the overall applicable market, the Fund’s primary prospectus benchmark changed to the indicated benchmark effective May 1, 2024. |
Footnotea | Index is used with permission. Copyright 2021, J.P. Morgan Chase & Co. All rights reserved. See Fund prospectus for full description. |
Performance does not reflect the deduction of taxes that a shareholder would pay on Fund distributions or redemption of Fund shares. Performance assumes that all dividends and distributions, if any, were reinvested. For more recent performance information, visit www.eatonvance.com/performance.php.
THE FUND'S PAST PERFORMANCE IS NO GUARANTEE OF FUTURE RESULTS.
| Total Net Assets | $2,357,927,839 |
| # of Portfolio Holdings (including derivatives) | 699 |
| Portfolio Turnover Rate | 173% |
| Total Advisory Fees Paid | $11,163,451 |
What did the Fund invest in?
The following tables reflect what the Fund invested in as of the report date.
Asset Allocation (% of total investments)
| Value | Value |
|---|
OtherFootnote Reference† | 0.7% |
| Loan Participation Notes | 1.0% |
| Sovereign Loans | 1.3% |
| Senior Floating-Rate Loans | 5.6% |
| Short-Term Investments | 15.7% |
| Foreign Corporate Bonds | 28.6% |
| Sovereign Government Bonds | 47.1% |
| Footnote | Description |
Footnote† | Investment types less than 1% each |
Foreign Currency Exposure (% of net assets)Footnote Reference*
| Egypt | 9.7% |
| Uzbekistan | 9.3% |
| Dominican Republic | 4.4% |
| Nigeria | 3.6% |
| Serbia | 3.2% |
| Turkey | 2.7% |
| Taiwan | 1.9% |
| Kazakhstan | 1.9% |
| Malaysia | 1.6% |
| Other | 9.3% |
| Total Long Exposure | 47.7% |
| Euro | (3.0%) |
| Total Short Exposure | (3.0%) |
| Footnote | Description |
Footnote* | Currency exposures include all foreign exchange denominated assets and currency derivatives. |
If you wish to view additional information about the Fund, including the prospectus, statement of additional information, financial statements and holdings, please scan the QR code or visit www.eatonvance.com/open-end-mutual-fund-documents.php. For proxy information, please visit www.eatonvance.com/proxyvoting.
The Funds may deliver a single copy of certain required shareholder documents (including prospectuses, shareholder reports, and proxy materials) to investors with the same last name and the same address. Your participation will continue indefinitely unless you instruct otherwise by calling 1-800-262-1122 or by contacting your financial intermediary. Your instruction will typically be effective within 30 days of receipt.
Not FDIC Insured | May Lose Value | No Bank Guarantee
Annual Shareholder Report July 31, 2024
(b) Not applicable.
Item 2. Code of Ethics
The registrant (sometimes referred to as the “Fund”) has adopted a code of ethics applicable to its Principal Executive Officer, Principal Financial Officer and Principal Accounting Officer. The registrant undertakes to provide a copy of such code of ethics to any person upon request, without charge, by calling 1-800-262-1122. The registrant has not amended the code of ethics as described in Form N-CSR during the period covered by this report. The registrant has not granted any waiver, including an implicit waiver, from a provision of the code of ethics as described in Form N-CSR during the period covered by this report.
Item 3. Audit Committee Financial Expert
The registrant’s Board of Trustees (the “Board”) has designated George J. Gorman and Scott E. Wennerholm, each an independent trustee, as audit committee financial experts. Mr. Gorman is a certified public accountant who is the Principal at George J. Gorman LLC (a consulting firm). Previously, Mr. Gorman served in various capacities at Ernst & Young LLP (a registered public accounting firm), including as Senior Partner. Mr. Gorman also has experience serving as an independent trustee and audit committee financial expert of other mutual fund complexes. Mr. Wennerholm is a private investor. Previously, Mr. Wennerholm served as a Trustee at Wheelock College (postsecondary institution), as a Consultant at GF Parish Group (executive recruiting firm), Chief Operating Officer and Executive Vice President at BNY Mellon Asset Management (investment management firm), Chief Operating Officer and Chief Financial Officer at Natixis Global Asset Management (investment management firm), and Vice President at Fidelity Investments Institutional Services (investment management firm).
Item 4. Principal Accountant Fees and Services
Eaton Vance Emerging Markets Debt Opportunities Fund (the “Fund”) is the only series of Eaton Vance Series Fund, Inc. (the “Corporation”), a Maryland corporation. The Corporation is registered under the Investment Company Act of 1940 as an open-end management investment company. This Form N-CSR relates to the Fund’s annual report.
(a)-(d)
The following table presents the aggregate fees billed to the registrant for the registrant’s fiscal years ended July 31, 2023 and July 31, 2024 by the registrant’s principal accountant, Deloitte & Touche LLP (“D&T”), for professional services rendered for the audit of the registrant’s annual financial statements and fees billed for other services rendered by D&T during those periods.
Eaton Vance Emerging Markets Debt Opportunities Fund
| | | | | | | | |
Fiscal Years Ended | | 7/31/23 | | | 7/31/24 | |
Audit Fees | | $ | 109,100 | | | $ | 108,900 | |
Audit-Related Fees(1) | | $ | 0 | | | $ | 0 | |
Tax Fees(2) | | $ | 7,481 | | | $ | 0 | |
All Other Fees(3) | | $ | 0 | | | $ | 0 | |
| | | | | | | | |
Total | | $ | 116,581 | | | $ | 108,900 | |
| | | | | | | | |
| (1) | Audit-related fees consist of the aggregate fees billed for assurance and related services that are reasonably related to the performance of the audit of the registrant’s financial statements and are not reported under the category of audit fees. |
| (2) | Tax fees consist of the aggregate fees billed for professional services rendered by the principal accountant relating to tax compliance, tax advice, and tax planning and specifically include fees for tax return preparation and other related tax compliance/planning matters. |
| (3) | All other fees consist of the aggregate fees billed for products and services provided by the registrant’s principal accountant other than audit, audit-related, and tax services. |
(e)(1) The registrant’s audit committee has adopted policies and procedures relating to the pre-approval of services provided by the registrant’s principal accountant (the “Pre-Approval Policies”). The Pre-Approval Policies establish a framework intended to assist the audit committee in the proper discharge of its pre-approval responsibilities. As a general matter, the Pre-Approval Policies (i) specify certain types of audit, audit-related, tax, and other services determined to be pre-approved by the audit committee; and (ii) delineate specific procedures governing the mechanics of the pre-approval process, including the approval and monitoring of audit and non-audit service fees. Unless a service is specifically pre-approved under the Pre-Approval Policies, it must be separately pre-approved by the Audit Committee.
The Pre-Approval Policies and the types of audit and non-audit services pre-approved therein must be reviewed and ratified by the registrant’s audit committee at least annually. The registrant’s audit committee maintains full responsibility for the appointment, compensation, and oversight of the work of the registrant’s principal accountant.
(e)(2) No services described in paragraphs (b)-(d) above were approved by the registrant’s audit committee pursuant to the “de minimis exception” set forth in Rule 2-01 (c)(7)(i)(C) of Regulation S-X.
(f) Not applicable.
(g) The following table presents (i) the aggregate non-audit fees (i.e., fees for audit-related, tax, and other services) billed to the registrant by D&T for the registrant’s fiscal years ended July 31, 2023 and July 31, 2024; and (ii) the aggregate non-audit fees (i.e., fees for audit-related, tax, and other services) billed to the Eaton Vance organization by D&T for the same time periods.
| | | | | | | | |
Fiscal Years Ended | | 7/31/23 | | | 7/31/24 | |
Registrant | | $ | 7,481 | | | $ | 0 | |
Eaton Vance(1) | | $ | 0 | | | $ | 18,490 | |
| (1) | The investment adviser to the registrant, as well as any of its affiliates that provide ongoing services to the registrant, are subsidiaries of Morgan Stanley. |
(h) The registrant’s audit committee has considered whether the provision by the registrant’s principal accountant of non-audit services to the registrant’s investment adviser and any entity controlling, controlled by, or under common control with the adviser that provides ongoing services to the registrant that were not pre-approved pursuant to Rule 2-01(c)(7)(ii) of Regulation S-X is compatible with maintaining the principal accountant’s independence.
(i) Not applicable.
(j) Not applicable.
Item 5. Audit Committee of Listed Registrants
Not applicable.
Item 6. Schedule of Investments
(a) Please see schedule of investments contained in the Financial Statements and Financial Highlights included under Item 7 of this Form N-CSR.
Item 7. Financial Statements and Financial Highlights for Open-End Management Investment Companies
Eaton Vance
Emerging Markets Debt Opportunities Fund
Annual Financial Statements and Additional Information
July 31, 2024
This report must be preceded or accompanied by a current summary prospectus or prospectus. Before investing, investors should consider carefully the investment objective, risks, and charges and expenses of a mutual fund. This and other important information is contained in the prospectus and/or statement of additional information, which can be obtained by calling 1-800-262-1122 or from a financial intermediary. Prospective investors should read the prospectus carefully before investing.
Annual Financial Statements and Additional Information July 31, 2024
Eaton Vance
Emerging Markets Debt Opportunities Fund
Eaton Vance
Emerging Markets Debt Opportunities Fund
July 31, 2024
| Security | Principal
Amount
(000's omitted) | Value |
| China — 0.3% |
| Alibaba Group Holding Ltd., 0.50%, 6/1/31(1) | USD | 2,082 | $ 2,095,872 |
| H World Group Ltd., 3.00%, 5/1/26 | USD | 2,023 | 2,071,016 |
| PDD Holdings, Inc., 0.00%, 12/1/25 | USD | 2,067 | 2,008,883 |
| Sunac China Holdings Ltd., 1.00% PIK, 9/30/32(2) | USD | 1,231 | 80,650 |
| | | | $ 6,256,421 |
| India — 0.2% |
| Sammaan Capital Ltd., 4.50%, 9/28/26(2) | USD | 4,965 | $ 4,893,901 |
| | | | $ 4,893,901 |
| Tanzania — 0.1% |
| HTA Group Ltd., 2.875%, 3/18/27(2) | USD | 3,400 | $ 3,188,725 |
| | | | $ 3,188,725 |
Total Convertible Bonds
(identified cost $15,023,032) | | | $ 14,339,047 |
| Foreign Corporate Bonds — 26.5% |
| Security | Principal
Amount
(000's omitted) | Value |
| Argentina — 1.0% |
| Generacion Mediterranea SA/Central Termica Roca SA, 12.50%, 5/28/27(1) | USD | 7,712 | $ 7,712,000 |
| Pan American Energy LLC, 8.50%, 4/30/32(1) | USD | 7,784 | 8,124,706 |
| Telecom Argentina SA, 9.50%, 7/18/31(1) | USD | 4,640 | 4,603,496 |
| Transportadora de Gas del Sur SA, 8.50%, 7/24/31(1) | USD | 3,981 | 4,019,381 |
| | | | $ 24,459,583 |
| Brazil — 4.5% |
| Braskem Netherlands Finance BV, 8.50% to 10/24/25, 1/23/81(2)(3) | USD | 11,571 | $ 11,678,279 |
| Coruripe Netherlands BV, 10.00%, 2/10/27(2) | USD | 10,856 | 9,744,926 |
| Gol Finance SA, 15.844%, (1 mo. SOFR + 10.50%), 1/29/25(1)(4) | USD | 2,517 | 2,712,278 |
| Itau BBA International PLC, 9.03%, 2/19/30 | PYG | 55,450,500 | 8,045,146 |
| MC Brazil Downstream Trading SARL: | | | |
| 7.25%, 6/30/31(2) | USD | 589 | 545,111 |
| 7.25%, 6/30/31(1) | USD | 700 | 648,240 |
| MV24 Capital BV, 6.748%, 6/1/34(2) | USD | 6,071 | 5,758,776 |
| OHI Group SA, 13.00%, 7/22/29(1) | USD | 28,420 | 28,660,149 |
| Security | Principal
Amount
(000's omitted) | Value |
| Brazil (continued) |
| Samarco Mineracao SA, 9.00%, 6/30/31(2)(5) | USD | 23,861 | $ 22,121,320 |
| Vale SA, Series A6, 1.378%(6)(7) | BRL | 55,335 | 3,561,043 |
| Yinson Boronia Production BV, 8.947%, 7/31/42(1) | USD | 12,581 | 12,790,914 |
| | | | $ 106,266,182 |
| Chile — 0.1% |
| AES Andes SA, 6.35% to 1/7/25, 10/7/79(2)(3) | USD | 1,592 | $ 1,573,412 |
| | | | $ 1,573,412 |
| China — 1.2% |
| China Oil & Gas Group Ltd., 4.70%, 6/30/26(2) | USD | 12,060 | $ 11,288,160 |
| Greentown China Holdings Ltd., 4.70%, 4/29/25(2) | USD | 11,940 | 11,584,039 |
| KWG Group Holdings Ltd., 7.875%, 8/30/24(8) | USD | 5,749 | 376,766 |
| Shimao Group Holdings Ltd., 5.60%, 7/15/26(2)(8) | USD | 15,682 | 877,878 |
| Sunac China Holdings Ltd.: | | | |
| 6.00%, (5.00% cash or 6.00% PIK), 9/30/26(2)(5) | USD | 1,021 | 130,161 |
| 6.25%, (5.25% cash or 6.25% PIK), 9/30/27(2)(5) | USD | 1,022 | 117,257 |
| 6.50%, (5.50% cash or 6.50% PIK), 9/30/27(2)(5) | USD | 2,047 | 214,903 |
| 6.75%, (5.75% cash or 6.75% PIK), 9/30/28(2)(5) | USD | 3,074 | 306,608 |
| 7.00%, (6.00% cash or 7.00% PIK), 9/30/29(2)(5) | USD | 3,077 | 274,511 |
| 7.25%, (6.25% cash or 7.25% PIK), 9/30/30(2)(5) | USD | 1,447 | 121,804 |
| Times China Holdings Ltd.: | | | |
| 5.55%, 6/4/24(2)(8) | USD | 17,720 | 498,464 |
| 6.75%, 7/16/23(2)(8) | USD | 3,803 | 109,336 |
| West China Cement Ltd., 4.95%, 7/8/26(2) | USD | 1,324 | 1,090,202 |
| | | | $ 26,990,089 |
| Colombia — 1.8% |
| ABRA Global Finance, 11.50%, (6.00% cash and 5.50% PIK), 3/2/28(1) | USD | 129 | $ 123,853 |
| Banco Davivienda SA, 6.65% to 4/22/31(2)(3)(6) | USD | 3,051 | 2,361,706 |
| Banco de Occidente SA, 10.875% to 5/13/29, 8/13/34(2)(3) | USD | 15,700 | 16,815,877 |
| Bancolombia SA, 8.625% to 6/24/29, 12/24/34(3) | USD | 14,724 | 15,260,582 |
| Canacol Energy Ltd., 5.75%, 11/24/28(2) | USD | 15,150 | 7,505,436 |
| | | | $ 42,067,454 |
| Cyprus — 0.0%(9) |
| Bank of Cyprus PLC, 11.875% to 12/21/28(2)(3)(6) | EUR | 359 | $ 440,056 |
| | | | $ 440,056 |
1
See Notes to Financial Statements.
Eaton Vance
Emerging Markets Debt Opportunities Fund
July 31, 2024
Portfolio of Investments — continued
| Security | Principal
Amount
(000's omitted) | Value |
| Georgia — 1.4% |
| Bank of Georgia JSC: | | | |
| 9.50% to 7/16/29(1)(3)(6) | USD | 205 | $ 200,336 |
| 9.50% to 7/16/29(2)(3)(6) | USD | 13,175 | 12,864,597 |
| TBC Bank JSC: | | | |
| 8.894% to 11/6/26(2)(3)(6) | USD | 7,668 | 7,368,948 |
| 10.25% to 7/30/29(2)(3)(6) | USD | 13,150 | 12,933,979 |
| | | | $ 33,367,860 |
| Ghana — 0.4% |
| Kosmos Energy Ltd., 7.50%, 3/1/28(2) | USD | 3,505 | $ 3,385,358 |
| Tullow Oil PLC, 10.25%, 5/15/26(2) | USD | 6,207 | 5,998,591 |
| | | | $ 9,383,949 |
| Greece — 0.9% |
| Piraeus Financial Holdings SA: | | | |
| 7.25% to 1/17/29, 4/17/34(2)(3) | EUR | 6,153 | $ 7,160,679 |
| 8.75% to 6/16/26(2)(3)(6) | EUR | 13,671 | 15,093,382 |
| | | | $ 22,254,061 |
| Hong Kong — 0.8% |
| CAS Capital No. 1 Ltd., 4.00% to 7/12/26(2)(3)(6) | USD | 5,900 | $ 5,595,118 |
| Yuexiu REIT MTN Co. Ltd., 2.65%, 2/2/26(2) | USD | 13,542 | 12,530,673 |
| | | | $ 18,125,791 |
| Hungary — 0.5% |
| MBH Bank Nyrt, 8.625% to 10/19/26, 10/19/27(2)(3) | EUR | 6,343 | $ 7,263,894 |
| OTP Bank Nyrt, 8.75% to 2/15/28, 5/15/33(2)(3) | USD | 4,622 | 4,863,158 |
| | | | $ 12,127,052 |
| India — 0.9% |
| Piramal Capital & Housing Finance Ltd., 7.80%, 1/29/28(2) | USD | 6,940 | $ 6,987,396 |
| Vedanta Resources Finance II PLC, 13.875%, 12/9/28(2) | USD | 14,591 | 14,585,778 |
| | | | $ 21,573,174 |
| Indonesia — 0.9% |
| Indika Energy Tbk. PT, 8.75%, 5/7/29(1) | USD | 13,060 | $ 13,273,936 |
| LLPL Capital Pte. Ltd., 6.875%, 2/4/39(2) | USD | 8,075 | 8,216,847 |
| | | | $ 21,490,783 |
| Security | Principal
Amount
(000's omitted) | Value |
| Jamaica — 0.8% |
| Digicel Intermediate Holdings Ltd./Digicel International Finance Ltd./DIFL U.S., 12.00%, (9.00% cash and 3.00% PIK), 5/25/27 | USD | 18,553 | $ 18,436,263 |
| | | | $ 18,436,263 |
| Kazakhstan — 0.7% |
| Development Bank of Kazakhstan JSC, 13.00%, 4/15/27(1) | KZT | 7,365,500 | $ 15,515,496 |
| | | | $ 15,515,496 |
| Latvia — 0.1% |
| Air Baltic Corp. AS, 14.50%, 8/14/29(1) | EUR | 2,030 | $ 2,330,864 |
| | | | $ 2,330,864 |
| Luxembourg — 0.6% |
| FORESEA Holding SA, 7.50%, 6/15/30(2) | USD | 15,793 | $ 14,718,259 |
| | | | $ 14,718,259 |
| Mexico — 1.2% |
| Alpha Holding SA de CV: | | | |
| 9.00%, 2/10/25(2)(8) | USD | 8,785 | $ 48,056 |
| 10.00%, 12/19/22(2)(8) | USD | 5,495 | 82,418 |
| BBVA Bancomer SA: | | | |
| 5.125% to 1/17/28, 1/18/33(2)(3) | USD | 9,044 | 8,432,359 |
| 8.45% to 6/29/33, 6/29/38(1)(3) | USD | 1,046 | 1,105,178 |
| Grupo Kaltex SA de CV, 14.50%, (13.00% cash and 1.50% PIK), 9/30/25(1) | USD | 7,480 | 5,910,771 |
| Petroleos Mexicanos, 7.19%, 9/12/24(1) | MXN | 1,420 | 75,780 |
| Total Play Telecomunicaciones SA de CV: | | | |
| 6.375%, 9/20/28(2) | USD | 7,037 | 4,315,591 |
| 10.50%, 12/31/28(1) | USD | 9,099 | 7,651,986 |
| | | | $ 27,622,139 |
| Moldova — 0.2% |
| Aragvi Finance International DAC, 8.45%, 4/29/26(2) | USD | 6,297 | $ 5,652,691 |
| | | | $ 5,652,691 |
| Nigeria — 0.3% |
| Access Bank PLC, 6.125%, 9/21/26(2) | USD | 6,321 | $ 6,020,752 |
| | | | $ 6,020,752 |
2
See Notes to Financial Statements.
Eaton Vance
Emerging Markets Debt Opportunities Fund
July 31, 2024
Portfolio of Investments — continued
| Security | Principal
Amount
(000's omitted) | Value |
| Panama — 0.4% |
| AES Panama Generation Holdings SRL, 4.375%, 5/31/30(2) | USD | 11,053 | $ 9,763,551 |
| | | | $ 9,763,551 |
| Paraguay — 0.4% |
| Frigorifico Concepcion SA: | | | |
| 7.70%, 7/21/28(2) | USD | 5,798 | $ 3,536,466 |
| 7.70%, 7/21/28(1) | USD | 7,960 | 4,855,170 |
| | | | $ 8,391,636 |
| Peru — 1.2% |
| Auna SA, 10.00%, 12/15/29(1) | USD | 15,398 | $ 15,865,778 |
| Peru LNG SRL, 5.375%, 3/22/30(2) | USD | 7,489 | 6,597,851 |
| Telefonica del Peru SAA, 7.375%, 4/10/27(2) | PEN | 26,000 | 5,362,567 |
| | | | $ 27,826,196 |
| Russia — 0.0% |
| Tinkoff Bank JSC Via TCS Finance Ltd., 6.00% to 12/20/26(2)(3)(6)(8)(10) | USD | 4,509 | $ 0 |
| | | | $ 0 |
| Singapore — 0.3% |
| Puma International Financing SA, 7.75%, 4/25/29(1) | USD | 6,673 | $ 6,770,125 |
| | | | $ 6,770,125 |
| Supranational — 0.4% |
| European Bank for Reconstruction & Development: | | | |
| 17.20%, 4/9/26(2) | USD | 6,300 | $ 6,348,183 |
| 17.35%, 3/1/27(2) | USD | 2,300 | 2,278,628 |
| International Finance Corp., 16.00%, 2/21/25 | UZS | 19,000,000 | 1,487,382 |
| | | | $ 10,114,193 |
| Trinidad and Tobago — 0.1% |
| Telecommunications Services of Trinidad & Tobago Ltd., 8.875%, 10/18/29(2) | USD | 1,412 | $ 1,409,960 |
| | | | $ 1,409,960 |
| Tunisia — 0.0%(9) |
| Tunisian Republic, 3.28%, 8/9/27 | JPY | 200,000 | $ 1,016,771 |
| | | | $ 1,016,771 |
| Turkey — 1.1% |
| Eregli Demir ve Celik Fabrikalari TAS, 8.375%, 7/23/29(2) | USD | 8,783 | $ 8,873,219 |
| Security | Principal
Amount
(000's omitted) | Value |
| Turkey (continued) |
| Limak Iskenderun Uluslararasi Liman Isletmeciligi AS, 9.50%, 7/10/36(2) | USD | 7,891 | $ 7,328,638 |
| WE Soda Investments Holding PLC, 9.50%, 10/6/28(2) | USD | 9,325 | 9,602,195 |
| | | | $ 25,804,052 |
| United Arab Emirates — 0.5% |
| Ittihad International Ltd., 9.75%, 11/9/28(2) | USD | 11,130 | $ 11,456,944 |
| | | | $ 11,456,944 |
| United Kingdom — 0.7% |
| Avianca Midco 2 PLC: | | | |
| 9.00%, 12/1/28(2) | USD | 4,220 | $ 4,134,679 |
| 9.00%, 12/1/28(2) | USD | 11,851 | 11,613,050 |
| | | | $ 15,747,729 |
| Uzbekistan — 2.1% |
| Ipoteka-Bank ATIB: | | | |
| 5.50%, 11/19/25(2) | USD | 576 | $ 560,115 |
| 20.50%, 4/25/27(2) | UZS | 256,750,000 | 20,232,394 |
| Uzbek Industrial & Construction Bank ATB, 21.00%, 7/24/27(2) | UZS | 370,880,000 | 29,566,067 |
| | | | $ 50,358,576 |
| Venezuela — 0.8% |
| Petroleos de Venezuela SA: | | | |
| 5.375%, 4/12/27(2)(8) | USD | 35,423 | $ 4,028,884 |
| 5.50%, 4/12/37(2)(8) | USD | 12,934 | 1,455,019 |
| 6.00%, 10/28/22(2)(8) | USD | 9,482 | 948,196 |
| 6.00%, 5/16/24(2)(8) | USD | 35,278 | 4,162,812 |
| 6.00%, 11/15/26(2)(8) | USD | 15,098 | 1,736,300 |
| 8.50%, 10/27/20(2)(8) | USD | 2,128 | 1,936,480 |
| 9.00%, 11/17/21(2)(8) | USD | 16,078 | 1,937,399 |
| 9.75%, 5/17/35(2)(8) | USD | 18,355 | 2,294,354 |
| 12.75%, 2/17/22(2)(8) | USD | 10,019 | 1,377,640 |
| | | | $ 19,877,084 |
| Vietnam — 0.2% |
| Mong Duong Finance Holdings BV, 5.125%, 5/7/29(2) | USD | 5,591 | $ 5,375,501 |
| | | | $ 5,375,501 |
Total Foreign Corporate Bonds
(identified cost $649,778,912) | | | $ 624,328,228 |
3
See Notes to Financial Statements.
Eaton Vance
Emerging Markets Debt Opportunities Fund
July 31, 2024
Portfolio of Investments — continued
| Loan Participation Notes — 0.9% |
| Security | Principal
Amount
(000's omitted) | Value |
| Uzbekistan — 0.9% |
| Daryo Finance BV (borrower - Uzbek Industrial and Construction Bank ATB), 18.75%, 6/15/25(2)(10)(11) | UZS | 86,016,955 | $ 6,898,940 |
| Europe Asia Investment Finance BV (borrower - Joint Stock Commercial Bank “Asaka”), 18.70%, 7/21/26(2)(10)(11) | UZS | 197,697,150 | 15,718,251 |
Total Loan Participation Notes
(identified cost $23,724,315) | | | $ 22,617,191 |
| Senior Floating-Rate Loans — 5.2%(12) |
| Borrower/Description | Principal
Amount
(000's omitted) | Value |
| Argentina — 0.5% |
| Provincia De Neuquen: | | | |
| Term Loan, 11/1/27(13) | $ | 3,282 | $ 3,347,257 |
| Term Loan, 11/1/27(13) | | 3,926 | 4,004,753 |
| Term Loan, 11/28/27(13) | | 3,548 | 3,583,871 |
| | | | $ 10,935,881 |
| Bahamas — 1.0% |
| Commonwealth of the Bahamas, Term Loan, 10.512%, (3 mo. EURIBOR + 6.85%), 11/24/28 | EUR | 21,080 | $ 22,813,828 |
| | | | $ 22,813,828 |
| Luxembourg — 0.1% |
| Zacapa SARL, Term Loan, 9.335%, (SOFR + 4.00%), 3/22/29 | $ | 2,346 | $ 2,348,058 |
| | | | $ 2,348,058 |
| Paraguay — 0.6% |
| Frigorifico Concepcion SA, Term Loan, 10.834%, (SOFR + 5.50%), 12/8/26 | $ | 14,610 | $ 14,756,100 |
| | | | $ 14,756,100 |
| Saint Lucia — 0.4% |
| Digicel International Finance Ltd., Term Loan, 12.002%, (SOFR + 6.75%), 5/25/27 | $ | 8,959 | $ 8,696,285 |
| | | | $ 8,696,285 |
| Borrower/Description | Principal
Amount
(000's omitted) | Value |
| Tanzania — 2.2% |
| HTA Group Ltd.: | | | |
| Term Loan, 9/13/28(13) | $ | 1,740 | $ 1,735,650 |
| Term Loan, 9/13/28(13) | | 10,645 | 10,618,387 |
| Tanzania, Term Loan, 10.696%, (SOFR + 5.45%), 2/27/31 | | 40,200 | 39,948,750 |
| | | | $ 52,302,787 |
| Uzbekistan — 0.4% |
| Navoi Mining & Metallurgical Co., Term Loan, 10.065%, (SOFR + 4.76%), 4/23/27 | $ | 10,575 | $ 10,564,650 |
| | | | $ 10,564,650 |
Total Senior Floating-Rate Loans
(identified cost $122,524,210) | | | $ 122,417,589 |
| Sovereign Government Bonds — 43.6% |
| Security | Principal
Amount
(000's omitted) | Value |
| Albania — 1.3% |
| Albania Government International Bonds: | | | |
| 3.50%, 6/16/27(2) | EUR | 154 | $ 161,890 |
| 3.50%, 11/23/31(2) | EUR | 447 | 440,182 |
| 5.90%, 6/9/28(2) | EUR | 10,009 | 11,172,296 |
| Albanian Government Bonds: | | | |
| 4.30%, 7/10/27 | ALL | 289,500 | 3,167,928 |
| 4.70%, 2/23/27 | ALL | 141,600 | 1,566,093 |
| 4.95%, 7/22/29 | ALL | 393,800 | 4,317,643 |
| 5.25%, 1/26/29 | ALL | 883,700 | 9,829,963 |
| | | | $ 30,655,995 |
| Angola — 2.3% |
| Angola Government International Bonds: | | | |
| 8.75%, 4/14/32(2) | USD | 12,575 | $ 11,274,292 |
| 9.125%, 11/26/49(2) | USD | 30,596 | 25,304,972 |
| 9.375%, 5/8/48(2) | USD | 20,368 | 17,172,363 |
| | | | $ 53,751,627 |
| Argentina — 0.2% |
| Bonos Para La Reconstruccion De Una Argentina Libre, 3.00%, 5/31/26 | USD | 7,343 | $ 5,445,072 |
| | | | $ 5,445,072 |
4
See Notes to Financial Statements.
Eaton Vance
Emerging Markets Debt Opportunities Fund
July 31, 2024
Portfolio of Investments — continued
| Security | Principal
Amount
(000's omitted) | Value |
| Armenia — 1.6% |
| Republic of Armenia Treasury Bonds: | | | |
| 9.00%, 4/29/26 | AMD | 376,680 | $ 971,340 |
| 9.25%, 4/29/28 | AMD | 3,206,460 | 8,219,491 |
| 9.60%, 10/29/33 | AMD | 9,310,190 | 24,114,213 |
| 9.75%, 10/29/50 | AMD | 884,427 | 2,307,373 |
| 9.75%, 10/29/52 | AMD | 953,900 | 2,480,185 |
| | | | $ 38,092,602 |
| Bahamas — 0.4% |
| Bahamas Government International Bonds: | | | |
| 6.00%, 11/21/28(2) | USD | 5,831 | $ 5,393,673 |
| 8.95%, 10/15/32(2) | USD | 4,571 | 4,536,362 |
| | | | $ 9,930,035 |
| Benin — 2.7% |
| Benin Government International Bonds: | | | |
| 4.875%, 1/19/32(2) | EUR | 15,252 | $ 14,084,357 |
| 4.95%, 1/22/35(2) | EUR | 27,686 | 23,973,758 |
| 6.875%, 1/19/52(2) | EUR | 25,541 | 21,991,979 |
| 7.96%, 2/13/38(2) | USD | 4,190 | 3,915,686 |
| | | | $ 63,965,780 |
| Bosnia and Herzegovina — 0.0%(9) |
| Republic of Srpska Treasury Bonds: | | | |
| 1.50%, 6/9/25 | BAM | 10 | $ 5,357 |
| 1.50%, 9/25/26 | BAM | 126 | 69,934 |
| | | | $ 75,291 |
| Cameroon — 2.9% |
| Republic of Cameroon International Bonds: | | | |
| 5.95%, 7/7/32(2) | EUR | 13,391 | $ 11,415,362 |
| 9.50%, 7/31/31(2) | USD | 58,254 | 55,851,023 |
| | | | $ 67,266,385 |
| Colombia — 1.3% |
| Titulos De Tesoreria B: | | | |
| 2.25%, 4/18/29 | COP | 14,605,906 | $ 3,157,105 |
| 3.00%, 3/25/33 | COP | 31,398,577 | 6,451,233 |
| 3.75%, 2/25/37 | COP | 79,999,916 | 16,321,663 |
| 4.75%, 4/4/35 | COP | 23,100,176 | 5,278,402 |
| | | | $ 31,208,403 |
| Security | Principal
Amount
(000's omitted) | Value |
| Dominican Republic — 4.3% |
| Dominican Republic Bonds: | | | |
| 8.00%, 1/15/27(2) | DOP | 50,040 | $ 786,322 |
| 8.00%, 2/12/27(2) | DOP | 255,750 | 4,023,829 |
| 10.75%, 6/1/36(1) | DOP | 2,449,050 | 42,400,079 |
| 11.25%, 9/15/35(1) | DOP | 176,600 | 3,143,782 |
| 11.25%, 9/15/35(2) | DOP | 164,200 | 2,923,041 |
| 12.00%, 8/8/25(1) | DOP | 209,200 | 3,569,508 |
| 12.75%, 9/23/29(1) | DOP | 494,600 | 9,253,738 |
| 13.00%, 6/10/34(2) | DOP | 421,100 | 8,366,211 |
| 13.625%, 2/3/33(2) | DOP | 63,350 | 1,262,592 |
| 13.625%, 2/3/33(1) | DOP | 461,150 | 9,190,912 |
| Dominican Republic Central Bank Notes: | | | |
| 8.00%, 3/12/27(2) | DOP | 17,280 | 274,392 |
| 12.00%, 10/3/25(1) | DOP | 634,070 | 10,836,304 |
| 13.00%, 12/5/25(1) | DOP | 53,380 | 914,351 |
| 13.00%, 1/30/26(1) | DOP | 209,070 | 3,589,287 |
| | | | $ 100,534,348 |
| Ecuador — 1.8% |
| Ecuador Government International Bonds: | | | |
| 0.00%, 7/31/30(2) | USD | 33,230 | $ 17,090,236 |
| 2.50%, 7/31/40(2) | USD | 800 | 324,449 |
| 2.50%, 7/31/40(2) | USD | 2,515 | 1,019,909 |
| 2.50%, 7/31/40(2) | USD | 1,538 | 623,770 |
| 2.50%, 7/31/40(2) | USD | 3,451 | 1,399,418 |
| 2.50%, 7/31/40(2) | USD | 1,640 | 665,158 |
| 5.00%, 7/31/40(2) | USD | 410 | 166,290 |
| 5.00%, 7/31/40(2) | USD | 182 | 73,906 |
| 6.90%, 7/31/30(2) | USD | 29,308 | 19,904,679 |
| | | | $ 41,267,815 |
| Ethiopia — 1.6% |
| Ethiopia International Bonds, 6.625%, 12/11/24(2)(8) | USD | 47,270 | $ 37,328,055 |
| | | | $ 37,328,055 |
| Ghana — 1.8% |
| Ghana Government International Bonds: | | | |
| 6.375%, 2/11/27(2)(8) | USD | 4,711 | $ 2,372,990 |
| 7.625%, 5/16/29(2)(8) | USD | 14,034 | 7,112,080 |
| 7.75%, 4/7/29(2)(8) | USD | 6,711 | 3,411,285 |
| 7.875%, 3/26/27(2)(8) | USD | 1,893 | 962,283 |
| 7.875%, 2/11/35(2)(8) | USD | 7,357 | 3,768,715 |
| 8.125%, 1/18/26(2)(8) | USD | 4,030 | 2,085,557 |
| 8.125%, 3/26/32(2)(8) | USD | 7,573 | 3,890,629 |
5
See Notes to Financial Statements.
Eaton Vance
Emerging Markets Debt Opportunities Fund
July 31, 2024
Portfolio of Investments — continued
| Security | Principal
Amount
(000's omitted) | Value |
| Ghana (continued) |
| Ghana Government International Bonds: (continued) | | | |
| 8.625%, 4/7/34(2)(8) | USD | 10,300 | $ 5,295,410 |
| 8.627%, 6/16/49(2)(8) | USD | 5,115 | 2,584,482 |
| 8.75%, 3/11/61(2)(8) | USD | 9,282 | 4,791,788 |
| 8.875%, 5/7/42(2)(8) | USD | 4,509 | 2,306,849 |
| 8.95%, 3/26/51(2)(8) | USD | 9,392 | 4,849,794 |
| | | | $ 43,431,862 |
| Indonesia — 2.3% |
| Indonesia Treasury Bonds: | | | |
| 6.625%, 2/15/34 | IDR | 246,872,000 | $ 14,881,174 |
| 7.125%, 6/15/43 | IDR | 541,600,000 | 33,540,229 |
| 7.375%, 5/15/48 | IDR | 86,457,000 | 5,451,417 |
| | | | $ 53,872,820 |
| Ivory Coast — 0.8% |
| Ivory Coast Government International Bonds: | | | |
| 6.625%, 3/22/48(2) | EUR | 10,967 | $ 9,272,500 |
| 6.875%, 10/17/40(2) | EUR | 4,106 | 3,736,139 |
| 8.25%, 1/30/37(2) | USD | 5,338 | 5,175,266 |
| | | | $ 18,183,905 |
| Jordan — 0.1% |
| Jordan Government International Bonds, 7.50%, 1/13/29(2) | USD | 2,747 | $ 2,735,220 |
| | | | $ 2,735,220 |
| Kenya — 1.3% |
| Republic of Kenya Government International Bonds: | | | |
| 8.25%, 2/28/48(2) | USD | 4,448 | $ 3,438,838 |
| 9.75%, 2/16/31(2) | USD | 28,061 | 26,769,955 |
| | | | $ 30,208,793 |
| Mexico — 0.2% |
| Mexican Bonos, 4.50%, 11/22/35 | MXN | 105,140 | $ 5,322,444 |
| | | | $ 5,322,444 |
| Paraguay — 0.7% |
| Paraguay Government Bonds, 7.90%, 2/9/31(1) | PYG | 113,186,000 | $ 15,538,420 |
| | | | $ 15,538,420 |
| Peru — 3.3% |
| Peru Government Bonds: | | | |
| 5.40%, 8/12/34 | PEN | 95,245 | $ 22,731,109 |
| Security | Principal
Amount
(000's omitted) | Value |
| Peru (continued) |
| Peru Government Bonds: (continued) | | | |
| 6.15%, 8/12/32 | PEN | 47,974 | $ 12,479,485 |
| 6.90%, 8/12/37 | PEN | 66,253 | 17,258,744 |
| 7.60%, 8/12/39(1)(2) | PEN | 94,299 | 25,836,662 |
| | | | $ 78,306,000 |
| Serbia — 3.1% |
| Serbia Treasury Bonds: | | | |
| 4.50%, 8/20/32 | RSD | 1,479,890 | $ 13,099,113 |
| 7.00%, 10/26/31 | RSD | 5,859,780 | 60,045,325 |
| | | | $ 73,144,438 |
| Seychelles — 0.0%(9) |
| Seychelles International Bonds, 8.00%, 1/1/26(2) | USD | 53 | $ 53,634 |
| | | | $ 53,634 |
| Sri Lanka — 2.2% |
| Sri Lanka Government International Bonds: | | | |
| 5.75%, 4/18/23(2)(8) | USD | 7,778 | $ 4,335,722 |
| 5.875%, 7/25/22(2)(8) | USD | 1,400 | 778,318 |
| 6.20%, 5/11/27(2)(8) | USD | 11,393 | 6,373,293 |
| 6.35%, 6/28/24(2)(8) | USD | 6,574 | 3,689,582 |
| 6.75%, 4/18/28(2)(8) | USD | 6,800 | 3,875,983 |
| 6.825%, 7/18/26(2)(8) | USD | 24,753 | 13,978,235 |
| 6.85%, 3/14/24(2)(8) | USD | 5,889 | 3,296,509 |
| 6.85%, 11/3/25(2)(8) | USD | 21,313 | 12,145,545 |
| 7.55%, 3/28/30(2)(8) | USD | 3,815 | 2,142,549 |
| | | | $ 50,615,736 |
| Suriname — 1.9% |
| Suriname Government International Bonds: | | | |
| 0.00%, Oil-Linked, 12/31/50(1) | USD | 17,170 | $ 15,109,600 |
| 7.95%, (4.95% cash and 3.00% PIK), 7/15/33(1) | USD | 31,253 | 30,315,853 |
| | | | $ 45,425,453 |
| Tajikistan — 0.0%(9) |
| Republic of Tajikistan International Bonds, 7.125%, 9/14/27(2) | USD | 565 | $ 545,258 |
| | | | $ 545,258 |
| Tunisia — 0.6% |
| Tunisian Republic: | | | |
| 3.50%, 2/3/33 | JPY | 600,000 | $ 2,510,603 |
| 4.20%, 3/17/31 | JPY | 30,000 | 138,505 |
6
See Notes to Financial Statements.
Eaton Vance
Emerging Markets Debt Opportunities Fund
July 31, 2024
Portfolio of Investments — continued
| Security | Principal
Amount
(000's omitted) | Value |
| Tunisia (continued) |
| Tunisian Republic: (continued) | | | |
| 5.75%, 1/30/25(2) | USD | 3,968 | $ 3,823,852 |
| 6.375%, 7/15/26(2) | EUR | 8,931 | 8,609,610 |
| | | | $ 15,082,570 |
| Turkey — 0.4% |
| Turkiye Government Bonds, 50.00% (TLREF), 5/17/28(4) | TRY | 329,380 | $ 9,886,120 |
| | | | $ 9,886,120 |
| Ukraine — 1.0% |
| Ukraine Government Bonds: | | | |
| 9.79%, 5/26/27 | UAH | 213,080 | $ 3,545,567 |
| 15.84%, 2/26/25 | UAH | 15,254 | 277,948 |
| 17.80%, 10/15/25 | UAH | 53,942 | 1,014,982 |
| 19.19%, 9/30/26 | UAH | 26,729 | 522,380 |
| Ukraine Government International Bonds: | | | |
| 4.375%, 1/27/32(2)(8) | EUR | 532 | 163,191 |
| 6.876%, 5/21/31(2)(8) | USD | 3,329 | 1,027,829 |
| 7.253%, 3/15/35(2)(8) | USD | 15,281 | 4,713,711 |
| 7.375%, 9/25/34(2)(8) | USD | 7,158 | 2,211,106 |
| 7.75%, 9/1/25(2)(8) | USD | 2,813 | 1,030,894 |
| 7.75%, 9/1/26(2)(8) | USD | 501 | 170,888 |
| 7.75%, 9/1/28(2)(8) | USD | 1,355 | 435,886 |
| 7.75%, 9/1/29(2)(8) | USD | 9,686 | 3,133,058 |
| 9.75%, 11/1/30(2)(8) | USD | 13,273 | 4,456,277 |
| | | | $ 22,703,717 |
| Uruguay — 1.1% |
| Uruguay Government Bonds: | | | |
| 3.40%, 5/16/45 | UYU | 287,812 | $ 7,070,327 |
| 3.875%, 7/2/40(14) | UYU | 399,396 | 10,421,739 |
| 9.75%, 7/20/33 | UYU | 350,216 | 8,768,429 |
| | | | $ 26,260,495 |
| Uzbekistan — 1.7% |
| National Bank of Uzbekistan, 19.875%, 7/5/27(2) | UZS | 175,670,000 | $ 13,909,940 |
| Republic of Uzbekistan Bonds: | | | |
| 16.25%, 10/12/26(2) | UZS | 181,050,000 | 14,680,607 |
| 16.625%, 5/29/27(2) | UZS | 90,000,000 | 7,171,469 |
| Republic of Uzbekistan International Bonds: | | | |
| 5.375%, 5/29/27(2) | EUR | 2,162 | 2,345,171 |
| 6.90%, 2/28/32(2) | USD | 3,005 | 2,948,420 |
| | | | $ 41,055,607 |
| Security | Principal
Amount
(000's omitted) | Value |
| Venezuela — 0.7% |
| Venezuela Government International Bonds: | | | |
| 6.00%, 12/9/20(2)(8) | USD | 13,632 | $ 1,832,704 |
| 7.00%, 3/31/38(2)(8) | USD | 4,210 | 613,641 |
| 7.65%, 4/21/25(2)(8) | USD | 8,539 | 1,336,123 |
| 7.75%, 10/13/19(2)(8) | USD | 15,543 | 2,256,114 |
| 8.25%, 10/13/24(2)(8) | USD | 12,954 | 2,026,057 |
| 9.00%, 5/7/23(2)(8) | USD | 2,387 | 375,139 |
| 9.25%, 9/15/27(8) | USD | 12,824 | 2,349,900 |
| 9.25%, 5/7/28(2)(8) | USD | 14,255 | 2,468,859 |
| 9.375%, 1/13/34(8) | USD | 976 | 190,234 |
| 11.75%, 10/21/26(2)(8) | USD | 5,305 | 980,222 |
| 11.95%, 8/5/31(2)(8) | USD | 5,917 | 1,078,414 |
| 12.75%, 8/23/22(2)(8) | USD | 6,018 | 1,082,919 |
| | | | $ 16,590,326 |
| Zambia — 0.0%(9) |
| Zambia Government International Bonds, 5.75% to 6/30/31, 6/30/33(2)(15) | USD | 15 | $ 13,155 |
| | | | $ 13,155 |
Total Sovereign Government Bonds
(identified cost $993,966,018) | | | $1,028,497,381 |
| Borrower/Description | Principal
Amount
(000's omitted) | Value |
| Ivory Coast — 0.1% |
| Republic of Ivory Coast, Term Loan, 9.426%, (6 mo. EURIBOR + 5.75%), 1/6/28(4) | EUR | 735 | $ 849,870 |
| | | | $ 849,870 |
| Kenya — 0.0%(9) |
| Government of Kenya, Term Loan, 12.142%, (6 mo. SOFR + 6.45%), 6/29/25(4) | USD | 391 | $ 394,725 |
| | | | $ 394,725 |
7
See Notes to Financial Statements.
Eaton Vance
Emerging Markets Debt Opportunities Fund
July 31, 2024
Portfolio of Investments — continued
| Borrower/Description | Principal
Amount
(000's omitted) | Value |
| Tanzania — 1.1% |
| Government of the United Republic of Tanzania, Term Loan, 12.022%, (6 mo. SOFR + 6.30%), 4/28/31(4) | USD | 25,748 | $ 26,159,764 |
| | | | $ 26,159,764 |
Total Sovereign Loans
(identified cost $27,000,180) | | | $ 27,404,359 |
| Security | Shares | Value |
| Financial Intermediaries — 0.0%(9) |
| Alpha Holding SA, Escrow Certificates(10)(16) | | 9,319,000 | $ 0 |
Total Miscellaneous
(identified cost $0) | | | $ 0 |
| Short-Term Investments — 14.6% |
| Security | Shares | Value |
| Morgan Stanley Institutional Liquidity Funds - Government Portfolio, Institutional Class, 5.21%(17) | | 86,614,587 | $ 86,614,587 |
Total Affiliated Fund
(identified cost $86,614,587) | | | $ 86,614,587 |
| Sovereign Government Securities — 8.9% |
| Security | Principal
Amount
(000's omitted) | Value |
| Egypt — 4.9% |
| Egypt Treasury Bills: | | | |
| 0.00%, 8/6/24 | EGP | 137,100 | $ 2,822,602 |
| 0.00%, 8/6/24 | EGP | 614,000 | 12,640,977 |
| 0.00%, 9/10/24 | EGP | 1,814,725 | 36,436,752 |
| 0.00%, 12/3/24 | EGP | 261,300 | 4,955,154 |
| 0.00%, 12/10/24 | EGP | 1,004,725 | 18,964,406 |
| 0.00%, 12/17/24 | EGP | 1,244,375 | 23,379,254 |
| 0.00%, 3/11/25 | EGP | 817,525 | 14,555,896 |
| 0.00%, 3/18/25 | EGP | 158,350 | 2,807,172 |
| | | | $ 116,562,213 |
| Security | Principal
Amount
(000's omitted) | Value |
| Nigeria — 3.4% |
| Nigeria OMO Bills: | | | |
| 0.00%, 1/28/25 | NGN | 1,676,448 | $ 918,515 |
| 0.00%, 2/25/25 | NGN | 2,798,096 | 1,500,547 |
| 0.00%, 4/1/25 | NGN | 8,326,542 | 4,438,667 |
| 0.00%, 5/20/25 | NGN | 27,576,817 | 13,872,319 |
| 0.00%, 5/27/25 | NGN | 32,731,995 | 16,377,554 |
| 0.00%, 6/10/25 | NGN | 1,121,950 | 554,242 |
| 0.00%, 6/17/25 | NGN | 15,822,539 | 7,790,380 |
| Nigeria Treasury Bills: | | | |
| 0.00%, 2/6/25 | NGN | 3,549,468 | 1,931,003 |
| 0.00%, 2/20/25 | NGN | 15,581,382 | 8,387,553 |
| 0.00%, 3/6/25 | NGN | 8,658,262 | 4,611,665 |
| 0.00%, 3/27/25 | NGN | 22,042,230 | 11,554,702 |
| 0.00%, 4/10/25 | NGN | 14,161,750 | 7,345,001 |
| | | | $ 79,282,148 |
| Pakistan — 0.6% |
| Pakistan Treasury Bills: | | | |
| 0.00%, 8/8/24 | PKR | 304,000 | $ 1,085,997 |
| 0.00%, 8/8/24 | PKR | 304,000 | 1,085,997 |
| 0.00%, 8/8/24 | PKR | 151,800 | 542,284 |
| 0.00%, 8/8/24 | PKR | 911,000 | 3,254,419 |
| 0.00%, 8/8/24 | PKR | 227,800 | 813,783 |
| 0.00%, 8/22/24 | PKR | 595,000 | 2,109,756 |
| 0.00%, 8/22/24 | PKR | 525,100 | 1,861,904 |
| 0.00%, 11/14/24 | PKR | 607,700 | 2,064,244 |
| 0.00%, 11/14/24 | PKR | 212,000 | 720,125 |
| | | | $ 13,538,509 |
Total Sovereign Government Securities
(identified cost $223,382,460) | | | $ 209,382,870 |
| U.S. Treasury Obligations — 2.0% |
| Security | Principal
Amount
(000's omitted) | Value |
| U.S. Treasury Bills: | | | |
| 0.00%, 8/1/24 | $ | 10,000 | $ 10,000,000 |
| 0.00%, 8/22/24 | | 2,680 | 2,671,761 |
| 0.00%, 9/5/24(18) | | 2,622 | 2,608,561 |
| 0.00%, 10/10/24(18) | | 22,698 | 22,470,263 |
8
See Notes to Financial Statements.
Eaton Vance
Emerging Markets Debt Opportunities Fund
July 31, 2024
Portfolio of Investments — continued
| Security | Principal
Amount
(000's omitted) | Value |
| U.S. Treasury Bills: (continued) | | | |
| 0.00%, 10/24/24 | $ | 10,000 | $ 9,880,207 |
Total U.S. Treasury Obligations
(identified cost $47,629,175) | | | $ 47,630,792 |
Total Short-Term Investments
(identified cost $357,626,222) | | | $ 343,628,249 |
| | | |
Total Purchased Options — 0.0%(9)
(identified cost $721,745) | | | $ 459,352 |
Total Investments — 92.6%
(identified cost $2,190,364,634) | | | $2,183,691,396 |
| Other Assets, Less Liabilities — 7.4% | | | $ 174,236,443 |
| Net Assets — 100.0% | | | $2,357,927,839 |
| The percentage shown for each investment category in the Portfolio of Investments is based on net assets. |
| (1) | Security exempt from registration under Rule 144A of the Securities Act of 1933, as amended. These securities may be sold in certain transactions in reliance on an exemption from registration (normally to qualified institutional buyers). At July 31, 2024, the aggregate value of these securities is $314,744,805 or 13.3% of the Fund's net assets. |
| (2) | Security exempt from registration under Regulation S of the Securities Act of 1933, as amended, which exempts from registration securities offered and sold outside the United States. Security may not be offered or sold in the United States except pursuant to an exemption from, or in a transaction not subject to, the registration requirements of the Securities Act of 1933, as amended. At July 31, 2024, the aggregate value of these securities is $1,023,401,083 or 43.4% of the Fund's net assets. |
| (3) | Security converts to variable rate after the indicated fixed-rate coupon period. |
| (4) | Variable rate security. The stated interest rate represents the rate in effect at July 31, 2024. |
| (5) | Represents a payment-in-kind security which may pay interest in additional principal at the issuer’s discretion. |
| (6) | Perpetual security with no stated maturity date but may be subject to calls by the issuer. |
| (7) | Variable rate security whose coupon rate is linked to the issuer’s mining activity revenue. The coupon rate shown represents the rate in effect at July 31, 2024. |
| (8) | Issuer is in default with respect to interest and/or principal payments and is non-income producing. |
| (9) | Amount is less than 0.05%. |
| (10) | For fair value measurement disclosure purposes, security is categorized as Level 3 (see Note 11). |
| (11) | Limited recourse note whose payments by the issuer are limited to amounts received by the issuer from the borrower pursuant to a loan agreement with the borrower. |
| (12) | Senior floating-rate loans (Senior Loans) often require prepayments from excess cash flows or permit the borrowers to repay at their election. The degree to which borrowers repay, whether as a contractual requirement or at their election, cannot be predicted with accuracy. As a result, the actual remaining maturity may be substantially less than the stated maturities shown. However, Senior Loans will typically have an expected average life of approximately two to four years. Senior Loans typically have rates of interest which are redetermined periodically by reference to a base lending rate, plus a spread. These base lending rates are primarily the Secured Overnight Financing Rate (“SOFR”) and secondarily, the prime rate offered by one or more major United States banks (the “Prime Rate”). Base lending rates may be subject to a floor, or minimum rate. Rates for SOFR are generally 1 or 3-month tenors and may also be subject to a credit spread adjustment. Senior Loans are generally subject to contractual restrictions that must be satisfied before they can be bought or sold. |
| (13) | This Senior Loan will settle after July 31, 2024, at which time the interest rate will be determined. |
| (14) | Inflation-linked security whose principal is adjusted for inflation based on changes in a designated inflation index or inflation rate for the applicable country. Interest is calculated based on the inflation-adjusted principal. |
| (15) | Step coupon security. Interest rate represents the rate in effect at July 31, 2024. |
| (16) | Non-income producing security. |
| (17) | May be deemed to be an affiliated investment company. The rate shown is the annualized seven-day yield as of July 31, 2024. |
| (18) | Security (or a portion thereof) has been pledged to cover collateral requirements on open derivative contracts. |
| Purchased Currency Options (OTC) — 0.0%(1) |
| Description | Counterparty | Notional Amount | Exercise
Price | Expiration
Date | Value |
| Put USD vs. Call INR | JPMorgan Chase Bank, N.A. | USD | 42,300,000 | INR | 85.50 | 1/25/29 | $224,063 |
| Put USD vs. Call INR | JPMorgan Chase Bank, N.A. | USD | 22,600,000 | INR | 85.50 | 1/25/29 | 119,712 |
| Put USD vs. Call INR | JPMorgan Chase Bank, N.A. | USD | 21,770,000 | INR | 85.50 | 1/30/29 | 115,577 |
| Total | | | | | | | $459,352 |
| (1) | Amount is less than 0.05%. |
9
See Notes to Financial Statements.
Eaton Vance
Emerging Markets Debt Opportunities Fund
July 31, 2024
Portfolio of Investments — continued
| Forward Foreign Currency Exchange Contracts (Centrally Cleared) |
| Currency Purchased | Currency Sold | Settlement
Date | Value/Unrealized
Appreciation
(Depreciation) |
| BRL | 75,858,000 | USD | 13,393,008 | 8/2/24 | $ 18,588 |
| USD | 14,071,360 | BRL | 75,858,000 | 8/2/24 | 659,764 |
| BRL | 11,723,000 | USD | 2,152,214 | 9/4/24 | (86,377) |
| BRL | 39,200,000 | USD | 7,079,083 | 9/4/24 | (171,227) |
| USD | 5,183,063 | BRL | 29,019,453 | 9/4/24 | 69,231 |
| USD | 13,348,185 | BRL | 75,858,000 | 9/4/24 | (19,575) |
| COP | 33,980,350,000 | USD | 8,294,870 | 9/18/24 | 38,192 |
| COP | 28,945,800,000 | USD | 7,072,025 | 9/18/24 | 26,405 |
| COP | 10,776,400,000 | USD | 2,636,751 | 9/18/24 | 5,965 |
| COP | 312,450,435 | USD | 74,340 | 9/18/24 | 2,283 |
| COP | 312,450,435 | USD | 76,335 | 9/18/24 | 288 |
| COP | 24,121,100,000 | USD | 5,941,158 | 9/18/24 | (25,897) |
| EUR | 2,417,586 | USD | 2,606,639 | 9/18/24 | 15,538 |
| EUR | 3,853,955 | USD | 4,169,263 | 9/18/24 | 10,836 |
| EUR | 1,865,955 | USD | 2,018,617 | 9/18/24 | 5,247 |
| EUR | 1,757,071 | USD | 1,900,824 | 9/18/24 | 4,940 |
| EUR | 709,692 | USD | 767,755 | 9/18/24 | 1,995 |
| EUR | 313,407 | USD | 339,048 | 9/18/24 | 881 |
| EUR | 16,885 | USD | 18,267 | 9/18/24 | 47 |
| EUR | 1,730,874 | USD | 1,889,837 | 9/18/24 | (12,487) |
| EUR | 6,539,029 | USD | 7,139,573 | 9/18/24 | (47,173) |
| EUR | 7,592,627 | USD | 8,289,934 | 9/18/24 | (54,774) |
| EUR | 13,636,811 | USD | 14,889,216 | 9/18/24 | (98,377) |
| EUR | 19,195,938 | USD | 20,958,893 | 9/18/24 | (138,482) |
| IDR | 509,615,395,631 | USD | 31,253,627 | 9/18/24 | 78,930 |
| IDR | 66,077,000,000 | USD | 4,052,175 | 9/18/24 | 10,420 |
| PEN | 75,357,000 | USD | 19,634,445 | 9/18/24 | 521,296 |
| PEN | 63,224,000 | USD | 16,490,349 | 9/18/24 | 420,178 |
| PEN | 37,047,000 | USD | 9,804,944 | 9/18/24 | 104,019 |
| PEN | 13,330,000 | USD | 3,547,760 | 9/18/24 | 17,616 |
| TWD | 186,500,000 | USD | 5,750,848 | 9/18/24 | (21,766) |
| TWD | 277,000,000 | USD | 8,539,367 | 9/18/24 | (30,221) |
| TWD | 126,000,000 | USD | 3,918,993 | 9/18/24 | (48,406) |
| TWD | 135,000,000 | USD | 4,202,727 | 9/18/24 | (55,670) |
| TWD | 145,800,000 | USD | 4,542,764 | 9/18/24 | (63,942) |
| TWD | 162,000,000 | USD | 5,042,048 | 9/18/24 | (65,580) |
| TWD | 144,000,000 | USD | 4,491,228 | 9/18/24 | (67,701) |
| TWD | 153,000,000 | USD | 4,767,766 | 9/18/24 | (67,768) |
| TWD | 170,890,000 | USD | 5,318,540 | 9/18/24 | (68,980) |
| USD | 913,077 | COP | 3,652,400,000 | 9/18/24 | 17,393 |
| USD | 1,745,696 | COP | 7,112,400,000 | 9/18/24 | 1,509 |
| USD | 22,689 | COP | 94,000,000 | 9/18/24 | (363) |
| USD | 51,975 | COP | 218,450,435 | 9/18/24 | (1,596) |
| USD | 8,166,787 | COP | 33,835,000,000 | 9/18/24 | (130,630) |
10
See Notes to Financial Statements.
Eaton Vance
Emerging Markets Debt Opportunities Fund
July 31, 2024
Portfolio of Investments — continued
| Forward Foreign Currency Exchange Contracts (Centrally Cleared) (continued) |
| Currency Purchased | Currency Sold | Settlement
Date | Value/Unrealized
Appreciation
(Depreciation) |
| USD | 8,428,675 | COP | 34,920,000,000 | 9/18/24 | $ (134,819) |
| USD | 18,778,568 | COP | 78,926,320,000 | 9/18/24 | (576,675) |
| USD | 19,380,859 | COP | 81,457,750,996 | 9/18/24 | (595,171) |
| USD | 11,333,299 | EUR | 10,380,000 | 9/18/24 | 74,882 |
| USD | 9,834,203 | EUR | 9,007,000 | 9/18/24 | 64,978 |
| USD | 8,149,494 | EUR | 7,464,000 | 9/18/24 | 53,846 |
| USD | 2,896,089 | EUR | 2,652,485 | 9/18/24 | 19,135 |
| USD | 125,558 | EUR | 116,063 | 9/18/24 | (326) |
| USD | 146,212 | EUR | 135,155 | 9/18/24 | (380) |
| USD | 167,180 | EUR | 154,537 | 9/18/24 | (434) |
| USD | 394,213 | EUR | 364,400 | 9/18/24 | (1,025) |
| USD | 1,084,776 | EUR | 1,002,738 | 9/18/24 | (2,819) |
| USD | 1,481,012 | EUR | 1,369,008 | 9/18/24 | (3,849) |
| USD | 1,872,484 | EUR | 1,730,874 | 9/18/24 | (4,867) |
| USD | 2,018,617 | EUR | 1,865,955 | 9/18/24 | (5,247) |
| USD | 4,130,488 | EUR | 3,818,112 | 9/18/24 | (10,736) |
| USD | 6,931,300 | EUR | 6,407,108 | 9/18/24 | (18,015) |
| USD | 7,022,549 | EUR | 6,491,456 | 9/18/24 | (18,252) |
| USD | 7,074,014 | EUR | 6,539,029 | 9/18/24 | (18,386) |
| USD | 7,467,453 | EUR | 6,902,713 | 9/18/24 | (19,409) |
| USD | 7,658,446 | EUR | 7,079,262 | 9/18/24 | (19,905) |
| USD | 12,467,668 | EUR | 11,524,778 | 9/18/24 | (32,405) |
| USD | 5,852,538 | EUR | 5,428,069 | 9/18/24 | (34,886) |
| USD | 14,752,495 | EUR | 13,636,811 | 9/18/24 | (38,343) |
| USD | 19,268,478 | EUR | 17,811,265 | 9/18/24 | (50,081) |
| USD | 22,116,690 | EUR | 20,444,076 | 9/18/24 | (57,483) |
| USD | 27,042,199 | EUR | 24,997,084 | 9/18/24 | (70,285) |
| USD | 27,631,201 | EUR | 25,541,541 | 9/18/24 | (71,816) |
| USD | 45,502,686 | EUR | 42,061,463 | 9/18/24 | (118,266) |
| USD | 92,936,821 | EUR | 85,908,306 | 9/18/24 | (241,552) |
| USD | 1,589,288 | IDR | 25,934,000,000 | 9/18/24 | (5,206) |
| USD | 1,250,744 | IDR | 20,428,400,000 | 9/18/24 | (5,250) |
| USD | 1,608,184 | IDR | 26,252,000,000 | 9/18/24 | (5,861) |
| USD | 1,607,790 | IDR | 26,252,000,000 | 9/18/24 | (6,255) |
| USD | 2,745,819 | IDR | 44,799,000,000 | 9/18/24 | (8,547) |
| USD | 5,501,655 | IDR | 89,638,290,824 | 9/18/24 | (9,554) |
| USD | 6,878,368 | IDR | 112,083,000,000 | 9/18/24 | (12,804) |
| USD | 10,303,285 | IDR | 168,129,000,000 | 9/18/24 | (33,749) |
| USD | 8,108,235 | IDR | 132,431,800,000 | 9/18/24 | (34,037) |
| USD | 10,425,937 | IDR | 170,193,000,000 | 9/18/24 | (37,997) |
| USD | 10,423,322 | IDR | 170,192,000,000 | 9/18/24 | (40,551) |
| USD | 30,939,316 | IDR | 504,490,293,751 | 9/18/24 | (78,136) |
| USD | 9,133,281 | PEN | 33,900,000 | 9/18/24 | 66,046 |
| USD | 117,426 | PEN | 443,000 | 9/18/24 | (1,064) |
11
See Notes to Financial Statements.
Eaton Vance
Emerging Markets Debt Opportunities Fund
July 31, 2024
Portfolio of Investments — continued
| Forward Foreign Currency Exchange Contracts (Centrally Cleared) (continued) |
| Currency Purchased | Currency Sold | Settlement
Date | Value/Unrealized
Appreciation
(Depreciation) |
| USD | 238,827 | PEN | 901,000 | 9/18/24 | $ (2,163) |
| USD | 406,464 | PEN | 1,528,000 | 9/18/24 | (2,230) |
| USD | 826,690 | PEN | 3,107,735 | 9/18/24 | (4,536) |
| USD | 1,603,716 | PEN | 6,059,000 | 9/18/24 | (16,885) |
| USD | 1,400,449 | PEN | 5,300,000 | 9/18/24 | (17,142) |
| USD | 3,634,099 | PEN | 13,710,000 | 9/18/24 | (32,916) |
| USD | 3,221,990 | PEN | 12,173,000 | 9/18/24 | (33,923) |
| USD | 2,800,898 | PEN | 10,600,000 | 9/18/24 | (34,284) |
| USD | 1,939,240 | PEN | 7,402,078 | 9/18/24 | (40,595) |
| USD | 12,570,733 | PEN | 47,256,527 | 9/18/24 | (68,973) |
| USD | 3,825,164 | PEN | 14,596,825 | 9/18/24 | (79,050) |
| USD | 7,885,949 | PEN | 30,102,151 | 9/18/24 | (165,475) |
| USD | 8,162,725 | PEN | 31,151,000 | 9/18/24 | (169,235) |
| USD | 49,354,437 | PEN | 186,466,000 | 9/18/24 | (519,635) |
| USD | 43,017,572 | PEN | 162,800,000 | 9/18/24 | (526,554) |
| KRW | 7,489,000,000 | USD | 5,460,177 | 9/19/24 | 16,616 |
| KRW | 7,489,000,000 | USD | 5,465,067 | 9/19/24 | 11,726 |
| KRW | 10,736,345,459 | USD | 7,842,645 | 9/19/24 | 8,970 |
| KRW | 2,031,000,000 | USD | 1,480,788 | 9/19/24 | 4,506 |
| KRW | 7,179,500,000 | USD | 5,246,945 | 9/19/24 | 3,507 |
| KRW | 2,032,000,000 | USD | 1,482,844 | 9/19/24 | 3,182 |
| KRW | 2,912,700,000 | USD | 2,127,658 | 9/19/24 | 2,434 |
| BRL | 54,966,998 | USD | 9,951,660 | 10/2/24 | (296,215) |
| | | | | | $(3,349,857) |
| Forward Foreign Currency Exchange Contracts (OTC) |
| Currency Purchased | Currency Sold | Counterparty | Settlement
Date | Unrealized
Appreciation | Unrealized
(Depreciation) |
| USD | 23,030,132 | EUR | 21,080,000 | Bank of America, N.A. | 8/8/24 | $ 210,052 | $ — |
| EUR | 2,789,352 | USD | 3,017,060 | Citibank, N.A. | 8/9/24 | 2,681 | — |
| EUR | 8,676,548 | USD | 9,477,321 | Citibank, N.A. | 8/9/24 | — | (84,126) |
| EUR | 330,452 | USD | 360,987 | JPMorgan Chase Bank, N.A. | 8/9/24 | — | (3,240) |
| EUR | 613,150 | USD | 662,745 | UBS AG | 8/9/24 | 1,049 | — |
| EUR | 1,482,964 | USD | 1,613,114 | UBS AG | 8/9/24 | — | (7,664) |
| EUR | 1,404,440 | USD | 1,532,787 | UBS AG | 8/9/24 | — | (12,347) |
| EUR | 3,490,511 | USD | 3,796,552 | UBS AG | 8/9/24 | — | (17,739) |
| EUR | 5,582,117 | USD | 6,099,518 | UBS AG | 8/9/24 | — | (56,341) |
| USD | 1,086,424 | EUR | 1,000,000 | State Street Bank and Trust Company | 8/9/24 | 3,828 | — |
| HUF | 2,617,534,801 | EUR | 6,544,655 | Barclays Bank PLC | 8/12/24 | 100,458 | — |
| HUF | 2,632,465,199 | EUR | 6,645,961 | Barclays Bank PLC | 8/12/24 | 31,762 | — |
| KZT | 608,505,000 | USD | 1,306,927 | ICBC Standard Bank plc | 8/21/24 | — | (29,498) |
12
See Notes to Financial Statements.
Eaton Vance
Emerging Markets Debt Opportunities Fund
July 31, 2024
Portfolio of Investments — continued
| Forward Foreign Currency Exchange Contracts (OTC) (continued) |
| Currency Purchased | Currency Sold | Counterparty | Settlement
Date | Unrealized
Appreciation | Unrealized
(Depreciation) |
| EUR | 23,013,062 | HUF | 9,064,730,089 | JPMorgan Chase Bank, N.A. | 8/22/24 | $ 48,804 | $ — |
| EUR | 63,662,716 | HUF | 25,164,636,631 | JPMorgan Chase Bank, N.A. | 8/22/24 | — | (107,106) |
| HUF | 5,225,746,917 | EUR | 13,366,244 | Bank of America, N.A. | 8/22/24 | — | (135,801) |
| HUF | 5,389,003,116 | EUR | 13,765,718 | Barclays Bank PLC | 8/22/24 | — | (120,439) |
| HUF | 3,538,249,967 | EUR | 9,027,990 | Goldman Sachs International | 8/22/24 | — | (68,085) |
| KZT | 2,290,181,000 | USD | 4,875,942 | Citibank, N.A. | 8/26/24 | — | (71,576) |
| KZT | 614,386,000 | USD | 1,306,926 | ICBC Standard Bank plc | 8/26/24 | — | (18,061) |
| USD | 721,355 | ZMW | 19,693,000 | Citibank, N.A. | 8/26/24 | — | (22,673) |
| UZS | 18,086,166,394 | USD | 1,364,788 | ICBC Standard Bank plc | 8/26/24 | 65,578 | — |
| ZMW | 19,693,000 | USD | 775,321 | Standard Chartered Bank | 8/26/24 | — | (31,293) |
| HUF | 5,053,497,925 | EUR | 12,731,619 | Citibank, N.A. | 8/30/24 | 70,240 | — |
| HUF | 241,633,361 | EUR | 608,763 | Citibank, N.A. | 8/30/24 | 3,359 | — |
| HUF | 4,042,797,914 | EUR | 10,219,925 | JPMorgan Chase Bank, N.A. | 8/30/24 | 18,664 | — |
| HUF | 193,306,668 | EUR | 488,666 | JPMorgan Chase Bank, N.A. | 8/30/24 | 892 | — |
| HUF | 5,053,497,511 | EUR | 12,709,364 | UBS AG | 8/30/24 | 94,355 | — |
| HUF | 241,633,341 | EUR | 607,699 | UBS AG | 8/30/24 | 4,512 | — |
| UZS | 40,756,227,000 | USD | 3,015,629 | ICBC Standard Bank plc | 8/30/24 | 203,538 | — |
| UZS | 27,709,158,000 | USD | 2,049,494 | JPMorgan Chase Bank, N.A. | 8/30/24 | 139,139 | — |
| EUR | 3,820,613 | USD | 4,137,112 | Citibank, N.A. | 9/6/24 | 4,489 | — |
| USD | 529,809 | AMD | 211,287,739 | Citibank, N.A. | 9/6/24 | — | (13,104) |
| EGP | 361,922,851 | USD | 7,378,651 | Goldman Sachs International | 9/12/24 | — | (47,980) |
| USD | 644,439 | UYU | 25,552,000 | Citibank, N.A. | 9/12/24 | 12,527 | — |
| USD | 1,575,257 | AMD | 639,948,000 | Citibank, N.A. | 9/16/24 | — | (67,371) |
| CZK | 93,697,518 | USD | 4,084,868 | Standard Chartered Bank | 9/18/24 | — | (89,734) |
| CZK | 93,902,482 | USD | 4,095,696 | Standard Chartered Bank | 9/18/24 | — | (91,823) |
| EGP | 303,775,076 | USD | 6,183,717 | Standard Chartered Bank | 9/18/24 | — | (44,952) |
| EUR | 7,605,173 | CZK | 188,190,000 | JPMorgan Chase Bank, N.A. | 9/18/24 | 224,604 | — |
| EUR | 5,692,370 | USD | 6,112,079 | Goldman Sachs International | 9/18/24 | 62,012 | — |
| MXN | 265,000,000 | USD | 14,841,484 | Standard Chartered Bank | 9/18/24 | — | (721,012) |
| MXN | 277,900,000 | USD | 15,622,753 | Standard Chartered Bank | 9/18/24 | — | (814,907) |
| MYR | 34,811,000 | USD | 7,573,371 | Credit Agricole Corporate and Investment Bank | 9/18/24 | 43,255 | — |
| MYR | 31,209,000 | USD | 6,800,087 | Goldman Sachs International | 9/18/24 | 28,423 | — |
| MYR | 39,320,000 | USD | 8,575,791 | Goldman Sachs International | 9/18/24 | 27,402 | — |
| SGD | 20,380,000 | USD | 15,141,463 | BNP Paribas | 9/18/24 | 140,382 | — |
| SGD | 5,530,000 | USD | 4,117,138 | Citibank, N.A. | 9/18/24 | 29,506 | — |
| SGD | 28,853,700 | USD | 21,423,994 | State Street Bank and Trust Company | 9/18/24 | 211,814 | — |
| USD | 3,084,068 | JPY | 477,733,015 | Citibank, N.A. | 9/18/24 | — | (127,189) |
| USD | 5,517,746 | MXN | 98,355,000 | Bank of America, N.A. | 9/18/24 | 276,919 | — |
| USD | 7,806,946 | MXN | 146,300,000 | Goldman Sachs International | 9/18/24 | 11,379 | — |
| USD | 115,242 | MXN | 2,112,000 | Goldman Sachs International | 9/18/24 | 2,704 | — |
| USD | 19,546,843 | MXN | 367,138,948 | UBS AG | 9/18/24 | — | (16,083) |
| USD | 2,895,486 | PEN | 11,046,946 | Standard Chartered Bank | 9/18/24 | — | (59,241) |
| USD | 2,183,747 | SGD | 2,939,000 | Citibank, N.A. | 9/18/24 | — | (20,048) |
13
See Notes to Financial Statements.
Eaton Vance
Emerging Markets Debt Opportunities Fund
July 31, 2024
Portfolio of Investments — continued
| Forward Foreign Currency Exchange Contracts (OTC) (continued) |
| Currency Purchased | Currency Sold | Counterparty | Settlement
Date | Unrealized
Appreciation | Unrealized
(Depreciation) |
| USD | 3,922,679 | SGD | 5,279,000 | Standard Chartered Bank | 9/18/24 | $ — | $ (35,754) |
| USD | 4,429,210 | ZAR | 80,172,726 | Goldman Sachs International | 9/18/24 | 43,187 | — |
| USD | 4,434,439 | ZAR | 80,112,161 | Standard Chartered Bank | 9/18/24 | 51,728 | — |
| ZAR | 7,787,383 | USD | 409,923 | Bank of America, N.A. | 9/18/24 | 16,103 | — |
| ZAR | 101,100,000 | USD | 5,421,676 | Standard Chartered Bank | 9/18/24 | 109,220 | — |
| ZAR | 12,391,509 | USD | 679,881 | UBS AG | 9/18/24 | — | (1,976) |
| CNH | 196,185 | USD | 27,181 | JPMorgan Chase Bank, N.A. | 9/19/24 | 74 | — |
| USD | 27,180 | CNH | 196,185 | HSBC Bank USA, N.A. | 9/19/24 | — | (75) |
| KZT | 1,153,500,000 | USD | 2,459,488 | JPMorgan Chase Bank, N.A. | 9/20/24 | — | (48,239) |
| KZT | 1,729,328,000 | USD | 3,689,233 | JPMorgan Chase Bank, N.A. | 9/20/24 | — | (74,287) |
| TRY | 468,370,185 | USD | 12,258,530 | Standard Chartered Bank | 9/20/24 | 1,130,843 | — |
| TRY | 198,904,000 | USD | 5,430,706 | Standard Chartered Bank | 9/20/24 | 255,394 | — |
| TRY | 118,552,522 | USD | 3,232,983 | Standard Chartered Bank | 9/20/24 | 156,097 | — |
| TRY | 27,110,000 | USD | 707,038 | Standard Chartered Bank | 9/20/24 | 67,960 | — |
| TRY | 47,504,355 | USD | 1,305,829 | Standard Chartered Bank | 9/20/24 | 52,186 | — |
| TRY | 47,504,357 | USD | 1,306,274 | Standard Chartered Bank | 9/20/24 | 51,741 | — |
| TRY | 90,000,000 | USD | 2,562,227 | Standard Chartered Bank | 9/20/24 | 10,617 | — |
| USD | 10,784,504 | TRY | 377,730,282 | Standard Chartered Bank | 9/20/24 | — | (13,732) |
| USD | 5,193,101 | TRY | 198,904,000 | Standard Chartered Bank | 9/20/24 | — | (493,000) |
| KZT | 2,287,847,447 | USD | 4,901,655 | Citibank, N.A. | 9/23/24 | — | (121,234) |
| TRY | 284,472,146 | USD | 7,214,612 | Standard Chartered Bank | 9/23/24 | 891,655 | — |
| TRY | 266,320,714 | USD | 6,800,890 | Standard Chartered Bank | 9/23/24 | 788,137 | — |
| TRY | 54,070,000 | USD | 1,456,050 | Standard Chartered Bank | 9/23/24 | 84,719 | — |
| USD | 5,643,804 | TRY | 198,324,863 | Standard Chartered Bank | 9/23/24 | — | (7,625) |
| USD | 5,039,771 | TRY | 177,451,337 | Standard Chartered Bank | 9/23/24 | — | (16,850) |
| USD | 4,966,421 | TRY | 175,016,660 | Standard Chartered Bank | 9/23/24 | — | (20,823) |
| USD | 1,410,155 | TRY | 54,070,000 | Standard Chartered Bank | 9/23/24 | — | (130,614) |
| EGP | 616,000,000 | USD | 12,295,409 | Citibank, N.A. | 9/26/24 | 114,861 | — |
| KZT | 1,155,598,000 | USD | 2,437,970 | Citibank, N.A. | 9/26/24 | — | (24,397) |
| KZT | 1,252,689,645 | USD | 2,613,854 | ICBC Standard Bank plc | 10/1/24 | 644 | — |
| KZT | 627,325,184 | USD | 1,306,938 | Standard Chartered Bank | 10/3/24 | 1,989 | — |
| KZT | 626,018,000 | USD | 1,306,937 | Standard Chartered Bank | 10/3/24 | — | (738) |
| KZT | 626,018,000 | USD | 1,306,937 | Standard Chartered Bank | 10/3/24 | — | (738) |
| USD | 657,999 | UYU | 26,701,600 | JPMorgan Chase Bank, N.A. | 10/3/24 | — | (1,154) |
| UZS | 36,315,194,425 | USD | 2,705,042 | JPMorgan Chase Bank, N.A. | 10/4/24 | 94,183 | — |
| KZT | 55,724,266 | USD | 115,515 | Citibank, N.A. | 10/7/24 | 691 | — |
| USD | 107,050 | UYU | 4,358,000 | HSBC Bank USA, N.A. | 10/10/24 | — | (458) |
| TRY | 230,084,457 | USD | 5,700,640 | Standard Chartered Bank | 10/17/24 | 693,271 | — |
| TRY | 229,929,099 | USD | 5,699,825 | Standard Chartered Bank | 10/17/24 | 689,769 | — |
| EUR | 8,867,985 | PLN | 38,169,582 | Barclays Bank PLC | 10/21/24 | 14,043 | — |
| EUR | 8,717,158 | PLN | 37,521,262 | Citibank, N.A. | 10/21/24 | 13,584 | — |
| PLN | 75,690,844 | EUR | 17,225,954 | Bank of America, N.A. | 10/21/24 | 362,565 | — |
| UZS | 47,845,825,410 | USD | 3,565,263 | ICBC Standard Bank plc | 10/21/24 | 147,847 | — |
| UZS | 1,956,595,576 | USD | 145,797 | ICBC Standard Bank plc | 10/21/24 | 885 | — |
14
See Notes to Financial Statements.
Eaton Vance
Emerging Markets Debt Opportunities Fund
July 31, 2024
Portfolio of Investments — continued
| Forward Foreign Currency Exchange Contracts (OTC) (continued) |
| Currency Purchased | Currency Sold | Counterparty | Settlement
Date | Unrealized
Appreciation | Unrealized
(Depreciation) |
| UZS | 14,747,260,998 | USD | 1,084,357 | JPMorgan Chase Bank, N.A. | 10/22/24 | $ 60,114 | $ — |
| EGP | 156,739,000 | USD | 3,136,662 | Citibank, N.A. | 10/24/24 | — | (5,014) |
| EGP | 410,870,000 | USD | 8,192,822 | Deutsche Bank AG | 10/24/24 | 16,369 | — |
| UZS | 14,801,478,870 | USD | 1,084,357 | JPMorgan Chase Bank, N.A. | 10/24/24 | 63,493 | — |
| UZS | 6,924,287,425 | USD | 507,274 | JPMorgan Chase Bank, N.A. | 11/1/24 | 28,562 | — |
| MYR | 18,010,000 | USD | 3,928,455 | Goldman Sachs International | 11/4/24 | 21,540 | — |
| MYR | 51,950,000 | USD | 11,335,370 | State Street Bank and Trust Company | 11/4/24 | 58,423 | — |
| TRY | 126,294,500 | USD | 3,195,534 | Standard Chartered Bank | 11/6/24 | 242,622 | — |
| TRY | 896,714,000 | USD | 22,749,028 | Standard Chartered Bank | 11/8/24 | 1,608,503 | — |
| TRY | 878,717,453 | USD | 22,350,871 | Standard Chartered Bank | 11/8/24 | 1,517,818 | — |
| TRY | 274,490,532 | USD | 7,038,275 | Standard Chartered Bank | 11/8/24 | 417,738 | — |
| TRY | 274,490,532 | USD | 7,038,275 | Standard Chartered Bank | 11/8/24 | 417,738 | — |
| TRY | 96,578,563 | USD | 2,504,651 | Standard Chartered Bank | 11/8/24 | 118,722 | — |
| USD | 8,400,822 | TRY | 310,580,890 | Standard Chartered Bank | 11/8/24 | — | (35,517) |
| USD | 5,846,289 | TRY | 218,536,020 | Standard Chartered Bank | 11/8/24 | — | (89,827) |
| USD | 8,540,451 | TRY | 318,814,170 | Standard Chartered Bank | 11/8/24 | — | (119,530) |
| USD | 3,728,248 | TRY | 144,349,578 | Standard Chartered Bank | 11/8/24 | — | (192,734) |
| USD | 5,837,604 | TRY | 225,508,438 | Standard Chartered Bank | 11/8/24 | — | (287,904) |
| USD | 7,783,472 | TRY | 300,358,793 | Standard Chartered Bank | 11/8/24 | — | (375,204) |
| USD | 9,729,338 | TRY | 375,730,595 | Standard Chartered Bank | 11/8/24 | — | (476,669) |
| USD | 13,621,075 | TRY | 527,112,596 | Standard Chartered Bank | 11/8/24 | — | (696,936) |
| UZS | 34,537,725,000 | USD | 2,541,968 | ICBC Standard Bank plc | 11/15/24 | 116,077 | — |
| KZT | 632,879,458 | USD | 1,306,927 | ICBC Standard Bank plc | 11/18/24 | 4,834 | — |
| EGP | 51,765,378 | USD | 1,000,297 | HSBC Bank USA, N.A. | 11/27/24 | 22,132 | — |
| USD | 888,315 | ZMW | 24,784,000 | Citibank, N.A. | 11/29/24 | — | (10,398) |
| ZMW | 24,784,000 | USD | 960,628 | Standard Chartered Bank | 11/29/24 | — | (61,914) |
| TRY | 510,813,390 | USD | 13,123,121 | Standard Chartered Bank | 12/16/24 | 192,415 | — |
| USD | 6,286,955 | TRY | 278,200,000 | Standard Chartered Bank | 12/16/24 | — | (964,973) |
| EGP | 371,906,000 | USD | 7,242,571 | Citibank, N.A. | 12/18/24 | 46,528 | — |
| KES | 322,228,991 | USD | 2,299,993 | Standard Chartered Bank | 12/18/24 | 89,327 | — |
| TRY | 185,127,692 | USD | 4,437,385 | Standard Chartered Bank | 12/18/24 | 378,173 | — |
| USD | 2,192,034 | KES | 322,228,991 | Standard Chartered Bank | 12/18/24 | — | (197,286) |
| TRY | 333,107,276 | USD | 8,477,158 | Standard Chartered Bank | 12/20/24 | 169,339 | — |
| TRY | 333,082,518 | USD | 8,479,765 | Standard Chartered Bank | 12/20/24 | 166,089 | — |
| USD | 2,247,554 | TRY | 87,804,438 | Standard Chartered Bank | 12/20/24 | — | (31,594) |
| USD | 11,030,951 | TRY | 429,523,182 | Standard Chartered Bank | 12/20/24 | — | (118,223) |
| EGP | 516,236,339 | USD | 9,880,121 | Goldman Sachs International | 12/26/24 | 208,193 | — |
| TRY | 300,832,267 | USD | 7,116,137 | Standard Chartered Bank | 1/6/25 | 554,743 | — |
| TRY | 230,483,900 | USD | 5,452,380 | Standard Chartered Bank | 1/6/25 | 424,696 | — |
| TRY | 172,852,600 | USD | 4,089,250 | Standard Chartered Bank | 1/6/25 | 318,294 | — |
| TRY | 164,067,900 | USD | 3,878,146 | Standard Chartered Bank | 1/6/25 | 305,399 | — |
| USD | 22,075,508 | TRY | 868,236,667 | Standard Chartered Bank | 1/6/25 | — | (63,536) |
| UZS | 25,907,790,000 | USD | 1,850,556 | JPMorgan Chase Bank, N.A. | 1/6/25 | 103,528 | — |
| EGP | 207,087,344 | USD | 3,952,049 | Standard Chartered Bank | 1/15/25 | 65,519 | — |
15
See Notes to Financial Statements.
Eaton Vance
Emerging Markets Debt Opportunities Fund
July 31, 2024
Portfolio of Investments — continued
| Forward Foreign Currency Exchange Contracts (OTC) (continued) |
| Currency Purchased | Currency Sold | Counterparty | Settlement
Date | Unrealized
Appreciation | Unrealized
(Depreciation) |
| TRY | 96,330,000 | USD | 2,242,858 | Standard Chartered Bank | 1/15/25 | $ 190,702 | $ — |
| UZS | 33,316,019,454 | USD | 2,383,973 | ICBC Standard Bank plc | 1/23/25 | 112,584 | — |
| UZS | 28,142,613,000 | USD | 2,000,186 | ICBC Standard Bank plc | 1/23/25 | 108,698 | — |
| EGP | 108,470,000 | USD | 2,091,190 | Standard Chartered Bank | 1/27/25 | 4,052 | — |
| TRY | 313,578,860 | USD | 7,146,502 | Standard Chartered Bank | 1/29/25 | 662,879 | — |
| TRY | 217,626,418 | USD | 5,013,048 | Standard Chartered Bank | 1/29/25 | 406,730 | — |
| TRY | 179,846,000 | USD | 4,140,992 | Standard Chartered Bank | 1/29/25 | 337,900 | — |
| USD | 21,818,539 | TRY | 877,221,386 | Standard Chartered Bank | 1/29/25 | — | (27,819) |
| UZS | 36,999,525,274 | USD | 2,673,376 | JPMorgan Chase Bank, N.A. | 1/29/25 | 92,877 | — |
| EGP | 174,342,399 | USD | 3,333,507 | Citibank, N.A. | 2/3/25 | 25,659 | — |
| TRY | 159,596,626 | USD | 3,687,567 | Standard Chartered Bank | 2/10/25 | 239,022 | — |
| TRY | 107,167,508 | USD | 2,501,722 | Standard Chartered Bank | 2/10/25 | 134,943 | — |
| USD | 6,575,351 | TRY | 266,764,134 | Standard Chartered Bank | 2/10/25 | 12,098 | — |
| UZS | 28,002,600,000 | USD | 2,000,186 | ICBC Standard Bank plc | 2/10/25 | 82,762 | — |
| EGP | 356,634,976 | USD | 5,924,169 | Citibank, N.A. | 2/13/25 | 924,111 | — |
| UZS | 36,293,975,020 | USD | 2,583,201 | JPMorgan Chase Bank, N.A. | 2/13/25 | 113,307 | — |
| UZS | 53,130,298,587 | USD | 3,778,826 | JPMorgan Chase Bank, N.A. | 2/18/25 | 160,809 | — |
| EGP | 119,470,742 | USD | 1,974,723 | Citibank, N.A. | 2/20/25 | 313,996 | — |
| EGP | 73,341,213 | USD | 1,184,834 | Citibank, N.A. | 2/20/25 | 220,175 | — |
| EGP | 61,710,094 | USD | 987,362 | Citibank, N.A. | 2/20/25 | 194,828 | — |
| NGN | 3,697,649,537 | USD | 2,009,592 | Standard Chartered Bank | 2/24/25 | 48,425 | — |
| NGN | 1,873,944,670 | USD | 1,004,796 | Standard Chartered Bank | 2/24/25 | 38,194 | — |
| NGN | 2,869,876,260 | USD | 1,735,113 | JPMorgan Chase Bank, N.A. | 2/25/25 | — | (138,519) |
| EGP | 29,501,474 | USD | 545,818 | Goldman Sachs International | 2/26/25 | 18,204 | — |
| EGP | 64,474,706 | USD | 987,362 | Citibank, N.A. | 2/27/25 | 244,880 | — |
| EGP | 55,516,492 | USD | 1,000,297 | HSBC Bank USA, N.A. | 2/27/25 | 60,735 | — |
| UZS | 63,207,936,629 | USD | 4,490,795 | ICBC Standard Bank plc | 2/28/25 | 177,774 | — |
| UZS | 19,066,083,951 | USD | 1,364,788 | ICBC Standard Bank plc | 3/5/25 | 40,695 | — |
| UZS | 17,640,403,111 | USD | 1,250,649 | JPMorgan Chase Bank, N.A. | 3/17/25 | 43,675 | — |
| UZS | 19,289,401,749 | USD | 1,367,073 | JPMorgan Chase Bank, N.A. | 3/20/25 | 46,595 | — |
| KES | 319,918,215 | USD | 2,217,804 | Citibank, N.A. | 3/21/25 | 88,596 | — |
| KES | 8,886,878 | USD | 61,331 | Standard Chartered Bank | 3/21/25 | 2,738 | — |
| USD | 2,192,034 | KES | 328,805,093 | Standard Chartered Bank | 3/21/25 | — | (178,435) |
| EGP | 429,982,880 | USD | 7,904,097 | Goldman Sachs International | 3/26/25 | 239,749 | — |
| EGP | 66,531,783 | USD | 1,243,130 | Standard Chartered Bank | 4/3/25 | 13,624 | — |
| KES | 430,511,298 | USD | 2,948,708 | Citibank, N.A. | 4/4/25 | 142,585 | — |
| KES | 48,718,702 | USD | 335,991 | Citibank, N.A. | 4/4/25 | 13,834 | — |
| USD | 3,288,027 | KES | 479,230,000 | Standard Chartered Bank | 4/4/25 | — | (153,091) |
| UZS | 29,098,670,665 | USD | 2,056,443 | JPMorgan Chase Bank, N.A. | 4/4/25 | 63,780 | — |
| UZS | 19,205,801,148 | USD | 1,352,521 | JPMorgan Chase Bank, N.A. | 4/4/25 | 46,875 | — |
| EGP | 627,456,844 | USD | 11,684,485 | Goldman Sachs International | 4/8/25 | 148,204 | — |
| EGP | 96,271,916 | USD | 1,810,644 | HSBC Bank USA, N.A. | 4/8/25 | 4,869 | — |
| TRY | 217,550,000 | USD | 4,739,689 | Standard Chartered Bank | 4/8/25 | 321,376 | — |
| TRY | 195,578,000 | USD | 4,265,639 | Standard Chartered Bank | 4/8/25 | 284,271 | — |
16
See Notes to Financial Statements.
Eaton Vance
Emerging Markets Debt Opportunities Fund
July 31, 2024
Portfolio of Investments — continued
| Forward Foreign Currency Exchange Contracts (OTC) (continued) |
| Currency Purchased | Currency Sold | Counterparty | Settlement
Date | Unrealized
Appreciation | Unrealized
(Depreciation) |
| KES | 277,775,913 | USD | 1,912,399 | Citibank, N.A. | 4/9/25 | $ 79,331 | $ — |
| USD | 1,902,575 | KES | 277,775,913 | Standard Chartered Bank | 4/9/25 | — | (89,155) |
| UZS | 17,105,446,074 | USD | 1,194,514 | Standard Chartered Bank | 4/15/25 | 46,577 | — |
| KES | 277,490,527 | USD | 1,900,620 | Citibank, N.A. | 4/16/25 | 85,099 | — |
| USD | 1,902,575 | KES | 277,490,527 | Standard Chartered Bank | 4/16/25 | — | (83,144) |
| UZS | 79,830,380,000 | USD | 5,604,098 | ICBC Standard Bank plc | 4/17/25 | 183,575 | — |
| KES | 12,274,550 | USD | 83,785 | Citibank, N.A. | 5/5/25 | 3,623 | — |
| KES | 204,927,256 | USD | 1,423,106 | Standard Chartered Bank | 5/5/25 | 36,208 | — |
| KES | 204,927,256 | USD | 1,439,096 | Standard Chartered Bank | 5/5/25 | 20,218 | — |
| USD | 1,407,467 | KES | 204,927,256 | Standard Chartered Bank | 5/5/25 | — | (51,846) |
| USD | 702,918 | KES | 108,600,903 | Standard Chartered Bank | 5/5/25 | — | (70,443) |
| USD | 702,918 | KES | 108,600,903 | Standard Chartered Bank | 5/5/25 | — | (70,443) |
| UZS | 22,317,443,000 | USD | 1,556,036 | JPMorgan Chase Bank, N.A. | 6/9/25 | 32,121 | — |
| UZS | 37,293,170,000 | USD | 2,605,181 | Standard Chartered Bank | 6/23/25 | 35,496 | — |
| UZS | 41,728,949,000 | USD | 2,931,433 | ICBC Standard Bank plc | 6/26/25 | 20,194 | — |
| UZS | 56,900,277,000 | USD | 3,987,406 | ICBC Standard Bank plc | 6/27/25 | 35,913 | — |
| UZS | 57,179,642,717 | USD | 3,987,423 | ICBC Standard Bank plc | 6/30/25 | 51,356 | — |
| UZS | 83,440,309,666 | USD | 5,862,866 | ICBC Standard Bank plc | 7/1/25 | 28,702 | — |
| EGP | 237,918,558 | USD | 4,345,544 | HSBC Bank USA, N.A. | 7/8/25 | 4,155 | — |
| EGP | 66,843,912 | USD | 1,229,879 | Standard Chartered Bank | 7/10/25 | — | (8,649) |
| UZS | 25,018,612,000 | USD | 1,746,500 | Deutsche Bank AG | 7/10/25 | 14,411 | — |
| UZS | 88,677,198,496 | USD | 6,194,705 | Deutsche Bank AG | 7/22/25 | 20,449 | — |
| UZS | 52,908,750,000 | USD | 3,296,495 | Standard Chartered Bank | 3/25/26 | 116,698 | — |
| | | | | | | $22,897,184 | $(8,489,930) |
| Futures Contracts |
| Description | Number of
Contracts | Position | Expiration
Date | Notional
Amount | Value/Unrealized
Appreciation
(Depreciation) |
| Interest Rate Futures | | | | | |
| Euro-Bobl | (143) | Short | 9/6/24 | $ (18,186,052) | $ (342,200) |
| Euro-Bund | (347) | Short | 9/6/24 | (50,221,060) | (1,509,678) |
| Euro-Buxl | (112) | Short | 9/6/24 | (16,332,104) | (912,924) |
| Euro-Schatz | (114) | Short | 9/6/24 | (13,087,161) | (109,808) |
| Japan 10-Year Bond | (3) | Short | 9/12/24 | (2,858,116) | 3,596 |
| U.S. 2-Year Treasury Note | (636) | Short | 9/30/24 | (130,613,532) | (974,034) |
| U.S. 5-Year Treasury Note | (3,565) | Short | 9/30/24 | (384,630,078) | (5,372,529) |
| U.S. 10-Year Treasury Note | (486) | Short | 9/19/24 | (54,340,875) | (1,459,490) |
| U.S. Long Treasury Bond | (318) | Short | 9/19/24 | (38,408,438) | (1,106,963) |
| U.S. Ultra 10-Year Treasury Note | (221) | Short | 9/19/24 | (25,542,766) | (791,068) |
| | | | | | $(12,575,098) |
17
See Notes to Financial Statements.
Eaton Vance
Emerging Markets Debt Opportunities Fund
July 31, 2024
Portfolio of Investments — continued
| Interest Rate Swaps (Centrally Cleared) |
Notional Amount
(000's omitted) | Fund
Pays/
Receives
Floating
Rate | Floating Rate | Annual
Fixed Rate | Termination
Date | Value | Unamortized
Upfront
Receipts
(Payments) | Unrealized
Appreciation
(Depreciation) |
| CNY | 267,000 | Pays | 7-day China Fixing Repo Rates
(pays quarterly) | 2.10%
(pays quarterly) | 3/20/29 | $ 530,848 | $ — | $ 530,848 |
| CNY | 233,000 | Pays | 7-day China Fixing Repo Rates
(pays quarterly) | 2.10%
(pays quarterly) | 3/20/29 | 466,180 | — | 466,180 |
| CNY | 175,000 | Pays | 7-day China Fixing Repo Rates
(pays quarterly) | 2.10%
(pays quarterly) | 3/20/29 | 352,337 | — | 352,337 |
| CNY | 43,000 | Pays | 7-day China Fixing Repo Rates
(pays quarterly) | 2.11%
(pays quarterly) | 3/20/29 | 88,468 | — | 88,468 |
| CNY | 46,000 | Pays | 7-day China Fixing Repo Rates
(pays quarterly) | 2.00%
(pays quarterly) | 6/18/29 | 60,847 | — | 60,847 |
| CNY | 63,800 | Pays | 7-day China Fixing Repo Rates
(pays quarterly) | 2.00%
(pays quarterly) | 6/18/29 | 85,151 | — | 85,151 |
| CNY | 44,100 | Pays | 7-day China Fixing Repo Rates
(pays quarterly) | 2.01%
(pays quarterly) | 6/18/29 | 63,289 | — | 63,289 |
| CNY | 62,000 | Pays | 7-day China Fixing Repo Rates
(pays quarterly) | 2.11%
(pays quarterly) | 6/19/29 | 127,341 | — | 127,341 |
| COP | 46,588,500 | Pays | Colombia Overnight Interbank Reference Rate
(pays quarterly) | 7.83%
(pays quarterly) | 9/18/29 | 39,678 | — | 39,678 |
| CZK | 142,000 | Receives | 6-month CZK PRIBOR
(pays semi-annually) | 4.56%
(pays annually) | 12/20/28 | (437,465) | — | (437,465) |
| CZK | 247,700 | Pays | 6-month CZK PRIBOR
(pays semi-annually) | 3.39%
(pays annually) | 9/18/29 | 66,389 | — | 66,389 |
| CZK | 60,598 | Pays | 6-month CZK PRIBOR
(pays semi-annually) | 3.94%
(pays annually) | 9/20/33 | 148,253 | — | 148,253 |
| CZK | 77,000 | Pays | 6-month CZK PRIBOR
(pays semi-annually) | 4.31%
(pays annually) | 12/20/33 | 309,089 | — | 309,089 |
| CZK | 219,600 | Pays | 6-month CZK PRIBOR
(pays semi-annually) | 4.55%
(pays annually) | 12/20/33 | 1,082,195 | — | 1,082,195 |
| CZK | 181,846 | Pays | 6-month CZK PRIBOR
(pays semi-annually) | 3.41%
(pays annually) | 3/20/34 | (59,522) | — | (59,522) |
| CZK | 363,692 | Pays | 6-month CZK PRIBOR
(pays semi-annually) | 3.43%
(pays annually) | 3/20/34 | (96,728) | — | (96,728) |
| CZK | 181,846 | Pays | 6-month CZK PRIBOR
(pays semi-annually) | 3.45%
(pays annually) | 3/20/34 | (29,922) | — | (29,922) |
| CZK | 181,846 | Pays | 6-month CZK PRIBOR
(pays semi-annually) | 3.47%
(pays annually) | 3/20/34 | (22,522) | — | (22,522) |
| CZK | 68,000 | Pays | 6-month CZK PRIBOR
(pays semi-annually) | 3.52%
(pays annually) | 3/20/34 | 4,030 | — | 4,030 |
| HUF | 1,959,656 | Pays | 6-month HUF BUBOR
(pays semi-annually) | 5.66%
(pays annually) | 9/18/29 | 30,933 | — | 30,933 |
| HUF | 1,936,644 | Pays | 6-month HUF BUBOR
(pays semi-annually) | 5.76%
(pays annually) | 9/18/29 | 52,606 | — | 52,606 |
| INR | 3,594,900 | Pays | 1-day INR FBIL MIBOR
(pays semi-annually) | 6.53%
(pays semi-annually) | 9/18/26 | 166,365 | — | 166,365 |
18
See Notes to Financial Statements.
Eaton Vance
Emerging Markets Debt Opportunities Fund
July 31, 2024
Portfolio of Investments — continued
| Interest Rate Swaps (Centrally Cleared) (continued) |
Notional Amount
(000's omitted) | Fund
Pays/
Receives
Floating
Rate | Floating Rate | Annual
Fixed Rate | Termination
Date | Value | Unamortized
Upfront
Receipts
(Payments) | Unrealized
Appreciation
(Depreciation) |
| INR | 3,595,000 | Pays | 1-day INR FBIL MIBOR
(pays semi-annually) | 6.55%
(pays semi-annually) | 9/18/26 | $ 181,294 | $ — | $ 181,294 |
| INR | 1,797,500 | Pays | 1-day INR FBIL MIBOR
(pays semi-annually) | 6.57%
(pays semi-annually) | 9/18/26 | 96,931 | — | 96,931 |
| INR | 1,798,000 | Pays | 1-day INR FBIL MIBOR
(pays semi-annually) | 6.59%
(pays semi-annually) | 9/18/26 | 105,403 | — | 105,403 |
| INR | 1,797,000 | Pays | 1-day INR FBIL MIBOR
(pays semi-annually) | 6.61%
(pays semi-annually) | 9/18/26 | 112,215 | — | 112,215 |
| INR | 1,797,000 | Pays | 1-day INR FBIL MIBOR
(pays semi-annually) | 6.61%
(pays semi-annually) | 9/18/26 | 114,179 | — | 114,179 |
| INR | 1,335,200 | Pays | 1-day INR FBIL MIBOR
(pays semi-annually) | 6.62%
(pays semi-annually) | 9/18/26 | 86,294 | — | 86,294 |
| INR | 1,797,500 | Pays | 1-day INR FBIL MIBOR
(pays semi-annually) | 6.64%
(pays semi-annually) | 9/18/26 | 126,778 | — | 126,778 |
| INR | 1,797,500 | Pays | 1-day INR FBIL MIBOR
(pays semi-annually) | 6.66%
(pays semi-annually) | 9/18/26 | 133,845 | — | 133,845 |
| INR | 450,000 | Pays | 1-day INR FBIL MIBOR
(pays semi-annually) | 6.25%
(pays semi-annually) | 9/18/29 | 7,324 | — | 7,324 |
| INR | 452,300 | Pays | 1-day INR FBIL MIBOR
(pays semi-annually) | 6.25%
(pays semi-annually) | 9/18/29 | 8,712 | — | 8,712 |
| INR | 459,000 | Pays | 1-day INR FBIL MIBOR
(pays semi-annually) | 6.25%
(pays semi-annually) | 9/18/29 | 8,727 | — | 8,727 |
| INR | 719,000 | Pays | 1-day INR FBIL MIBOR
(pays semi-annually) | 6.25%
(pays semi-annually) | 9/18/29 | 14,207 | — | 14,207 |
| KRW | 12,007,000 | Pays | 3-month KRW Certificate of Deposit Rate
(pays quarterly) | 3.33%
(pays quarterly) | 9/20/33 | 264,250 | — | 264,250 |
| KRW | 7,565,200 | Pays | 3-month KRW Certificate of Deposit Rate
(pays quarterly) | 3.34%
(pays quarterly) | 9/20/33 | 170,148 | — | 170,148 |
| KRW | 1,387,000 | Pays | 3-month KRW Certificate of Deposit Rate
(pays quarterly) | 3.40%
(pays quarterly) | 9/20/33 | 36,427 | — | 36,427 |
| KRW | 1,417,000 | Pays | 3-month KRW Certificate of Deposit Rate
(pays quarterly) | 3.52%
(pays quarterly) | 9/20/33 | 47,051 | — | 47,051 |
| KRW | 1,318,000 | Pays | 3-month KRW Certificate of Deposit Rate
(pays quarterly) | 3.56%
(pays quarterly) | 9/20/33 | 46,826 | — | 46,826 |
| KRW | 1,336,000 | Pays | 3-month KRW Certificate of Deposit Rate
(pays quarterly) | 3.59%
(pays quarterly) | 9/20/33 | 50,208 | — | 50,208 |
| KRW | 8,790,000 | Pays | 3-month KRW Certificate of Deposit Rate
(pays quarterly) | 3.20%
(pays quarterly) | 3/20/34 | 128,304 | — | 128,304 |
| KRW | 4,000,000 | Pays | 3-month KRW Certificate of Deposit Rate
(pays quarterly) | 3.30%
(pays quarterly) | 3/20/34 | 81,786 | — | 81,786 |
| KRW | 7,075,300 | Pays | 3-month KRW Certificate of Deposit Rate
(pays quarterly) | 3.26%
(pays quarterly) | 6/19/34 | 128,577 | — | 128,577 |
19
See Notes to Financial Statements.
Eaton Vance
Emerging Markets Debt Opportunities Fund
July 31, 2024
Portfolio of Investments — continued
| Interest Rate Swaps (Centrally Cleared) (continued) |
Notional Amount
(000's omitted) | Fund
Pays/
Receives
Floating
Rate | Floating Rate | Annual
Fixed Rate | Termination
Date | Value | Unamortized
Upfront
Receipts
(Payments) | Unrealized
Appreciation
(Depreciation) |
| KRW | 8,782,000 | Pays | 3-month KRW Certificate of Deposit Rate
(pays quarterly) | 3.02%
(pays quarterly) | 9/18/34 | $ 34,677 | $ — | $ 34,677 |
| KRW | 9,574,000 | Pays | 3-month KRW Certificate of Deposit Rate
(pays quarterly) | 3.02%
(pays quarterly) | 9/18/34 | 37,804 | — | 37,804 |
| KRW | 9,220,000 | Pays | 3-month KRW Certificate of Deposit Rate
(pays quarterly) | 3.03%
(pays quarterly) | 9/18/34 | 42,337 | — | 42,337 |
| KRW | 3,424,000 | Pays | 3-month KRW Certificate of Deposit Rate
(pays quarterly) | 3.05%
(pays quarterly) | 9/18/34 | 19,687 | — | 19,687 |
| PLN | 45,000 | Pays | 6-month PLN WIBOR
(pays semi-annually) | 4.81%
(pays annually) | 9/18/29 | 76,061 | — | 76,061 |
| THB | 178,030 | Pays | Thai Overnight Repurchase Rate
(pays quarterly) | 2.36%
(pays quarterly) | 9/18/29 | 41,214 | — | 41,214 |
| THB | 224,000 | Pays | Thai Overnight Repurchase Rate
(pays quarterly) | 2.36%
(pays quarterly) | 9/18/29 | 52,628 | — | 52,628 |
| THB | 224,300 | Pays | Thai Overnight Repurchase Rate
(pays quarterly) | 2.36%
(pays quarterly) | 9/18/29 | 53,412 | — | 53,412 |
| THB | 179,000 | Pays | Thai Overnight Repurchase Rate
(pays quarterly) | 2.36%
(pays quarterly) | 9/18/29 | 43,337 | — | 43,337 |
| ZAR | 171,891 | Pays | 3-month ZAR JIBAR
(pays quarterly) | 9.46%
(pays quarterly) | 9/18/34 | 432,575 | — | 432,575 |
| ZAR | 235,007 | Pays | 3-month ZAR JIBAR
(pays quarterly) | 9.52%
(pays quarterly) | 9/18/34 | 639,032 | — | 639,032 |
| ZAR | 569,053 | Pays | 3-month ZAR JIBAR
(pays quarterly) | 9.55%
(pays quarterly) | 9/18/34 | 1,611,946 | — | 1,611,946 |
| ZAR | 142,683 | Pays | 3-month ZAR JIBAR
(pays quarterly) | 9.59%
(pays quarterly) | 9/18/34 | 427,411 | — | 427,411 |
| ZAR | 285,366 | Pays | 3-month ZAR JIBAR
(pays quarterly) | 9.60%
(pays quarterly) | 9/18/34 | 865,337 | — | 865,337 |
| Total | | | | | | $9,354,784 | $ — | $9,354,784 |
20
See Notes to Financial Statements.
Eaton Vance
Emerging Markets Debt Opportunities Fund
July 31, 2024
Portfolio of Investments — continued
| Interest Rate Swaps (OTC) |
| Counterparty | Notional Amount
(000's omitted) | Fund
Pays/Receives
Floating Rate | Floating Rate | Annual
Fixed Rate | Termination
Date | Value/Unrealized
Appreciation
(Depreciation) |
| Goldman Sachs International | MYR | 34,000 | Pays | 3-month MYR KLIBOR
(pays quarterly) | 3.68%
(pays quarterly) | 6/19/29 | $ 64,901 |
| JPMorgan Chase Bank, N.A. | MYR | 31,000 | Pays | 3-month MYR KLIBOR
(pays quarterly) | 3.68%
(pays quarterly) | 6/19/29 | 59,814 |
| Standard Chartered Bank | MYR | 38,000 | Pays | 3-month MYR KLIBOR
(pays quarterly) | 3.69%
(pays quarterly) | 6/19/29 | 75,633 |
| Total | | | | | | | $200,348 |
| Credit Default Swaps - Sell Protection (Centrally Cleared) |
| Reference Entity | Notional
Amount*
(000's omitted) | Contract Annual
Fixed Rate** | Current
Market Annual
Fixed Rate*** | Termination
Date | Value | Unamortized
Upfront
Receipts
(Payments) | Unrealized
Appreciation
(Depreciation) |
| Egypt | $ 5,938 | 1.00%
(pays quarterly)(1) | 6.12% | 12/20/28 | $(1,061,829) | $1,583,991 | $522,162 |
| Petroleos Mexicanos | 20,600 | 1.00%
(pays quarterly)(1) | 4.82 | 6/20/29 | (3,121,607) | 3,491,718 | 370,111 |
| Total | $26,538 | | | | $(4,183,436) | $5,075,709 | $892,273 |
| Credit Default Swaps - Buy Protection (Centrally Cleared) | |
| Reference Entity | Notional
Amount
(000's omitted) | Contract
Annual
Fixed Rate** | Termination
Date | Value | Unamortized
Upfront
Receipts
(Payments) | Unrealized
Appreciation
(Depreciation) |
| Brazil | | $73,160 | 1.00%
(pays quarterly)(1) | 6/20/29 | $1,744,441 | $(1,269,210) | $ 475,231 |
| China | | 31,150 | 1.00%
(pays quarterly)(1) | 6/20/29 | (528,172) | 490,084 | (38,088) |
| Colombia | | 59,800 | 1.00%
(pays quarterly)(1) | 6/20/29 | 2,151,818 | (2,050,514) | 101,304 |
| Indonesia | | 20,630 | 1.00%
(pays quarterly)(1) | 6/20/29 | (252,649) | 239,159 | (13,490) |
| Mexico | | 43,800 | 1.00%
(pays quarterly)(1) | 6/20/29 | 121,130 | 87,509 | 208,639 |
| Peru | | 21,670 | 1.00%
(pays quarterly)(1) | 6/20/29 | (262,096) | 273,233 | 11,137 |
| Turkey | | 7,610 | 1.00%
(pays quarterly)(1) | 6/20/29 | 510,748 | (696,218) | (185,470) |
| Total | | | | | $3,485,220 | $(2,925,957) | $559,263 |
21
See Notes to Financial Statements.
Eaton Vance
Emerging Markets Debt Opportunities Fund
July 31, 2024
Portfolio of Investments — continued
| Credit Default Swaps - Sell Protection (OTC) |
| Reference Entity | Counterparty | Notional
Amount*
(000's omitted) | Contract Annual
Fixed Rate** | Current
Market
Annual
Fixed Rate*** | Termination
Date | Value | Unamortized
Upfront
Receipts
(Payments) | Unrealized
Appreciation
(Depreciation) |
| Benin | Barclays Bank PLC | $ 1,000 | 1.00%
(pays quarterly)(1) | 2.67% | 6/20/27 | $ (42,895) | $ 79,633 | $ 36,738 |
| Benin | Barclays Bank PLC | 1,000 | 1.00%
(pays quarterly)(1) | 2.67 | 6/20/27 | (42,895) | 77,865 | 34,970 |
| Ivory Coast | Barclays Bank PLC | 4,389 | 1.00%
(pays quarterly)(1) | 2.84 | 6/20/27 | (206,438) | 328,426 | 121,988 |
| Ivory Coast | Deutsche Bank AG | 10,219 | 1.00%
(pays quarterly)(1) | 2.84 | 6/20/27 | (480,664) | 765,935 | 285,271 |
| Ivory Coast | Deutsche Bank AG | 11,383 | 1.00%
(pays quarterly)(1) | 2.84 | 6/20/27 | (535,402) | 852,145 | 316,743 |
| Petroleos Mexicanos | Citibank, N.A. | 6,104 | 1.00%
(pays quarterly)(1) | 4.82 | 6/20/29 | (916,192) | 967,772 | 51,580 |
| Petroleos Mexicanos | Citibank, N.A. | 11,572 | 1.00%
(pays quarterly)(1) | 4.82 | 6/20/29 | (1,736,923) | 1,813,845 | 76,922 |
| Total | | $45,667 | | | | $(3,961,409) | $4,885,621 | $924,212 |
| * | If the Fund is the seller of credit protection, the notional amount is the maximum potential amount of future payments the Fund could be required to make if a credit event, as defined in the credit default swap agreement, were to occur. At July 31, 2024, such maximum potential amount for all open credit default swaps in which the Fund is the seller was $72,205,000. |
| ** | The contract annual fixed rate represents the fixed rate of interest received by the Fund (as a seller of protection) or paid by the Fund (as a buyer of protection) on the notional amount of the credit default swap contract. |
| *** | Current market annual fixed rates, utilized in determining the net unrealized appreciation or depreciation as of period end, serve as an indicator of the market’s perception of the current status of the payment/performance risk associated with the credit derivative. The current market annual fixed rate of a particular reference entity reflects the cost, as quoted by the pricing vendor, of selling protection against default of that entity as of period end and may include upfront payments required to be made to enter into the agreement. The higher the fixed rate, the greater the market perceived risk of a credit event involving the reference entity. A rate identified as “Defaulted” indicates a credit event has occurred for the reference entity. |
| (1) | Upfront payment is exchanged with the counterparty as a result of the standardized trading coupon. |
| Total Return Swaps (OTC) |
| Counterparty | Notional Amount
(000's omitted) | Fund Receives | Fund Pays | Termination
Date | Value/Unrealized
Appreciation
(Depreciation) |
| Barclays Bank PLC | USD | 16,885 | Return on PEN 63,320,401 Government of Peru, 5.35%, 8/12/40 (pays upon termination) | SOFR + 1.10% on Notional Amount (pays upon termination) | 8/8/24 | $48,219 |
| | | | | | | $48,219 |
22
See Notes to Financial Statements.
Eaton Vance
Emerging Markets Debt Opportunities Fund
July 31, 2024
Portfolio of Investments — continued
| Cross-Currency Swaps (OTC) | | |
| Counterparty | Fund Receives | Fund Pays | Termination
Date | Value/Unrealized
Appreciation
(Depreciation) |
| JPMorgan Chase Bank, N.A. | 3-month PLN WIBOR + 0.63% on PLN 416,859,314 (Notional Amount) (pays quarterly) plus EUR equivalent of Notional Amount at effective date* | 3-month EURIBOR on EUR equivalent of Notional Amount at effective date (pays quarterly) plus Notional Amount* | 6/13/29 | $(17,183) |
| | | | | $(17,183) |
| * | The Fund pays interest on the currency received and receives interest on the currency delivered. At the termination date, the notional amount of the currency received will be exchanged for the notional amount of the currency delivered. |
| Abbreviations: |
| BUBOR | – Budapest Interbank Offered Rate |
| EURIBOR | – Euro Interbank Offered Rate |
| FBIL | – Financial Benchmarks India Ltd. |
| JIBAR | – Johannesburg Interbank Average Rate |
| KLIBOR | – Kuala Lumpur Interbank Offered Rate |
| MIBOR | – Mumbai Interbank Offered Rate |
| |
| OTC | – Over-the-counter |
| PIK | – Payment In Kind |
| PRIBOR | – Prague Interbank Offered Rate |
| SOFR | – Secured Overnight Financing Rate |
| TLREF | – Turkish Lira Overnight Reference Rate |
| WIBOR | – Warsaw Interbank Offered Rate |
| Currency Abbreviations: |
| ALL | – Albanian Lek |
| AMD | – Armenian Dram |
| BAM | – Bosnia-Herzegovina Convertible Mark |
| BRL | – Brazilian Real |
| CNH | – Yuan Renminbi Offshore |
| CNY | – Yuan Renminbi |
| COP | – Colombian Peso |
| CZK | – Czech Koruna |
| DOP | – Dominican Peso |
| EGP | – Egyptian Pound |
| EUR | – Euro |
| HUF | – Hungarian Forint |
| IDR | – Indonesian Rupiah |
| INR | – Indian Rupee |
| JPY | – Japanese Yen |
| KES | – Kenyan Shilling |
| KRW | – South Korean Won |
| KZT | – Kazakhstani Tenge |
| MXN | – Mexican Peso |
| |
| MYR | – Malaysian Ringgit |
| NGN | – Nigerian Naira |
| PEN | – Peruvian Sol |
| PKR | – Pakistan Rupee |
| PLN | – Polish Zloty |
| PYG | – Paraguayan Guarani |
| RSD | – Serbian Dinar |
| SGD | – Singapore Dollar |
| THB | – Thai Baht |
| TRY | – Turkish Lira |
| TWD | – New Taiwan Dollar |
| UAH | – Ukrainian Hryvnia |
| USD | – United States Dollar |
| UYU | – Uruguayan Peso |
| UZS | – Uzbekistani Som |
| ZAR | – South African Rand |
| ZMW | – Zambian Kwacha |
23
See Notes to Financial Statements.
Eaton Vance
Emerging Markets Debt Opportunities Fund
July 31, 2024
Statement of Assets and Liabilities
| | July 31, 2024 |
| Assets | |
| Unaffiliated investments, at value (identified cost $2,103,750,047) | $2,097,076,809 |
| Affiliated investments, at value (identified cost $86,614,587) | 86,614,587 |
| Cash | 2,756,363 |
| Deposits for derivatives collateral: | |
| Futures contracts | 10,404,409 |
| Centrally cleared derivatives | 51,965,811 |
| OTC derivatives | 5,320,000 |
| Foreign currency, at value (identified cost $27,467,068) | 27,197,423 |
| Interest receivable | 37,139,710 |
| Dividends receivable from affiliated investments | 535,491 |
| Receivable for investments sold | 67,844,487 |
| Receivable for Fund shares sold | 6,373,591 |
| Receivable for variation margin on open centrally cleared derivatives | 719,485 |
| Receivable for open forward foreign currency exchange contracts | 22,897,184 |
| Receivable for open swap contracts | 1,172,779 |
| Tax reclaims receivable | 60,192 |
| Directors' deferred compensation plan | 28,124 |
| Total assets | $2,418,106,445 |
| Liabilities | |
| Cash collateral due to brokers | $5,320,000 |
| Payable for investments purchased | 35,852,254 |
| Payable for Fund shares redeemed | 1,999,377 |
| Payable for variation margin on open futures contracts | 1,103,293 |
| Payable for open forward foreign currency exchange contracts | 8,489,930 |
| Payable for open swap contracts | 17,183 |
| Upfront receipts on open non-centrally cleared swap contracts | 4,885,621 |
| Payable to affiliates: | |
| Investment adviser and administration fee | 1,189,429 |
| Distribution and service fees | 18,183 |
| Directors' deferred compensation plan | 28,124 |
| Accrued foreign capital gains taxes | 80,475 |
| Accrued expenses | 1,194,737 |
| Total liabilities | $60,178,606 |
| Net Assets | $2,357,927,839 |
| Sources of Net Assets | |
| Common shares, $0.001 par value, 1,000,000,000 shares authorized (see Note 7), 301,475,168 shares issued and outstanding | $301,475 |
| Additional paid-in capital | 2,379,483,040 |
| Accumulated loss | (21,856,676) |
| Net Assets | $2,357,927,839 |
| Class A Shares | |
| Net Assets | $88,268,666 |
| Shares Outstanding | 11,312,084 |
Net Asset Value and Redemption Price Per Share
(net assets ÷ shares outstanding) | $7.80 |
Maximum Offering Price Per Share
(100 ÷ 96.75 of net asset value per share) | $8.06 |
| Class I Shares | |
| Net Assets | $1,929,763,388 |
| Shares Outstanding | 246,620,639 |
Net Asset Value, Offering Price and Redemption Price Per Share
(net assets ÷ shares outstanding) | $7.82 |
24
See Notes to Financial Statements.
Eaton Vance
Emerging Markets Debt Opportunities Fund
July 31, 2024
Statement of Assets and Liabilities — continued
| | July 31, 2024 |
| Class R6 Shares | |
| Net Assets | $339,895,785 |
| Shares Outstanding | 43,542,445 |
Net Asset Value, Offering Price and Redemption Price Per Share
(net assets ÷ shares outstanding) | $7.81 |
| On sales of $100,000 or more, the offering price of Class A shares is reduced. |
25
See Notes to Financial Statements.
Eaton Vance
Emerging Markets Debt Opportunities Fund
July 31, 2024
| | Year Ended |
| | July 31, 2024 |
| Investment Income | |
| Dividend income from affiliated investments | $6,995,759 |
| Interest income (net of foreign taxes withheld of $1,149,697) | 161,421,092 |
| Other income | 599,408 |
| Total investment income | $169,016,259 |
| Expenses | |
| Investment adviser and administration fee | $11,356,102 |
| Distribution and service fees: | |
| Class A | 192,054 |
| Directors’ fees and expenses | 107,903 |
| Custodian fee | 987,810 |
| Transfer and dividend disbursing agent fees | 1,439,198 |
| Legal and accounting services | 167,872 |
| Printing and postage | 558,536 |
| Registration fees | 230,141 |
| Interest expense and fees | 185,059 |
| Interest expense on securities sold short | 1,511,818 |
| Miscellaneous | 71,474 |
| Total expenses | $16,807,967 |
| Deduct: | |
| Waiver and/or reimbursement of expenses by affiliates | $192,651 |
| Total expense reductions | $192,651 |
| Net expenses | $16,615,316 |
| Net investment income | $152,400,943 |
| Realized and Unrealized Gain (Loss) | |
| Net realized gain (loss): | |
| Investment transactions (net of foreign capital gains taxes of $128,453) | $(9,412,908) |
| Written options | 252,797 |
| Securities sold short | 4,342,579 |
| Futures contracts | 20,339,388 |
| Swap contracts | (14,336,823) |
| Foreign currency transactions | 8,552,021 |
| Forward foreign currency exchange contracts | 3,230,935 |
| Non-deliverable bond forward contracts | 2,474,429 |
| Net realized gain | $15,442,418 |
| Change in unrealized appreciation (depreciation): | |
| Investments (including net decrease in accrued foreign capital gains taxes of $192,556) | $42,295,359 |
| Futures contracts | (19,281,625) |
| Swap contracts | 17,211,849 |
| Foreign currency | (243,703) |
| Forward foreign currency exchange contracts | 15,544,011 |
| Non-deliverable bond forward contracts | (126,670) |
| Net change in unrealized appreciation (depreciation) | $55,399,221 |
| Net realized and unrealized gain | $70,841,639 |
| Net increase in net assets from operations | $223,242,582 |
26
See Notes to Financial Statements.
Eaton Vance
Emerging Markets Debt Opportunities Fund
July 31, 2024
Statements of Changes in Net Assets
| | Year Ended July 31, |
| | 2024 | 2023 |
| Increase (Decrease) in Net Assets | | |
| From operations: | | |
| Net investment income | $152,400,943 | $95,446,348 |
| Net realized gain (loss) | 15,442,418 | (100,047,901) |
| Net change in unrealized appreciation (depreciation) | 55,399,221 | 180,382,880 |
| Net increase in net assets from operations | $223,242,582 | $175,781,327 |
| Distributions to shareholders: | | |
| Class A | $(4,085,878) | $(3,737,116) |
| Class I | (81,149,266) | (54,365,257) |
| Class R6 | (13,031,032) | (12,162,608) |
| Total distributions to shareholders | $(98,266,176) | $(70,264,981) |
| Tax return of capital to shareholders: | | |
| Class A | $(2,578,602) | $(1,828,261) |
| Class I | (54,658,176) | (26,547,773) |
| Class R6 | (8,771,989) | (5,154,993) |
| Total tax return of capital to shareholders | $(66,008,767) | $(33,531,027) |
| Transactions in common shares: | | |
| Class A | $18,004,939 | $13,977,270 |
| Class I | 679,759,551 | 455,855,220 |
| Class R6 | 130,972,242 | (11,929,251) |
| Net increase in net assets from Fund share transactions | $828,736,732 | $457,903,239 |
| Net increase in net assets | $887,704,371 | $529,888,558 |
| Net Assets | | |
| At beginning of year | $1,470,223,468 | $940,334,910 |
| At end of year | $2,357,927,839 | $1,470,223,468 |
27
See Notes to Financial Statements.
Eaton Vance
Emerging Markets Debt Opportunities Fund
July 31, 2024
| | Class A |
| | Year Ended July 31, |
| | 2024 | 2023 | 2022 | 2021 | 2020 |
| Net asset value — Beginning of year | $7.57 | $7.06 | $8.85 | $8.66 | $9.03 |
| Income (Loss) From Operations | | | | | |
| Net investment income(1) | $0.61 | $0.61 | $0.54 | $0.54 | $0.56 |
| Net realized and unrealized gain (loss) | 0.27 | 0.56 | (1.68) | 0.30 | (0.19) |
| Total income (loss) from operations | $0.88 | $1.17 | $(1.14) | $0.84 | $0.37 |
| Less Distributions | | | | | |
| From net investment income | $(0.41) | $(0.47) | $(0.48) | $(0.55) | $(0.64) |
| From net realized gain | — | — | (0.04) | (0.01) | — |
| Tax return of capital | (0.24) | (0.19) | (0.13) | (0.09) | (0.10) |
| Total distributions | $(0.65) | $(0.66) | $(0.65) | $(0.65) | $(0.74) |
| Net asset value — End of year | $7.80 | $7.57 | $7.06 | $8.85 | $8.66 |
| Total Return(2) | 12.42% | 17.25% | (13.54)% | 9.90% | 4.19% |
| Ratios/Supplemental Data | | | | | |
| Net assets, end of year (000’s omitted) | $88,269 | $67,670 | $49,974 | $55,838 | $18,761 |
| Ratios (as a percentage of average daily net assets):(3) | | | | | |
| Total expenses | 1.16%(4) | 1.12% | 1.10% | 1.11% | 1.28% |
| Net expenses | 1.15%(4)(5) | 1.11%(5) | 1.10%(5) | 1.11% | 1.15% |
| Net investment income | 8.02% | 8.29% | 6.63% | 6.03% | 6.42% |
| Portfolio Turnover | 173% | 104% | 84% | 87% | 110% |
| (1) | Computed using average shares outstanding. |
| (2) | Returns are historical and are calculated by determining the percentage change in net asset value with all distributions reinvested and do not reflect the effect of sales charges. |
| (3) | Total expenses do not reflect amounts reimbursed and/or waived by the adviser and certain of its affiliates, if applicable. Net expenses are net of all reductions and represent the net expenses paid by the Fund. |
| (4) | Includes interest expense, including on securities sold short, of 0.09% of average daily net assets for the year ended July 31, 2024. |
| (5) | Includes a reduction by the investment adviser and administrator of a portion of its adviser and administration fee due to the Fund’s investment in the Liquidity Fund (equal to 0.01%, 0.01% and less than 0.005% of average daily net assets for the years ended July 31, 2024, 2023 and 2022, respectively). |
28
See Notes to Financial Statements.
Eaton Vance
Emerging Markets Debt Opportunities Fund
July 31, 2024
Financial Highlights — continued
| | Class I |
| | Year Ended July 31, |
| | 2024 | 2023 | 2022 | 2021 | 2020 |
| Net asset value — Beginning of year | $7.59 | $7.08 | $8.87 | $8.69 | $9.06 |
| Income (Loss) From Operations | | | | | |
| Net investment income(1) | $0.64 | $0.63 | $0.56 | $0.57 | $0.58 |
| Net realized and unrealized gain (loss) | 0.27 | 0.56 | (1.67) | 0.29 | (0.19) |
| Total income (loss) from operations | $0.91 | $1.19 | $(1.11) | $0.86 | $0.39 |
| Less Distributions | | | | | |
| From net investment income | $(0.43) | $(0.48) | $(0.50) | $(0.57) | $(0.66) |
| From net realized gain | — | — | (0.04) | (0.01) | — |
| Tax return of capital | (0.25) | (0.20) | (0.14) | (0.10) | (0.10) |
| Total distributions | $(0.68) | $(0.68) | $(0.68) | $(0.68) | $(0.76) |
| Net asset value — End of year | $7.82 | $7.59 | $7.08 | $8.87 | $8.69 |
| Total Return(2) | 12.70% | 17.52% | (13.27)% | 10.05% | 4.47% |
| Ratios/Supplemental Data | | | | | |
| Net assets, end of year (000’s omitted) | $1,929,763 | $1,201,270 | $690,681 | $828,507 | $217,227 |
| Ratios (as a percentage of average daily net assets):(3) | | | | | |
| Total expenses | 0.92%(4) | 0.87% | 0.85% | 0.86% | 1.03% |
| Net expenses | 0.91%(4)(5) | 0.86%(5) | 0.85%(5) | 0.86% | 0.90% |
| Net investment income | 8.31% | 8.54% | 6.84% | 6.27% | 6.60% |
| Portfolio Turnover | 173% | 104% | 84% | 87% | 110% |
| (1) | Computed using average shares outstanding. |
| (2) | Returns are historical and are calculated by determining the percentage change in net asset value with all distributions reinvested. |
| (3) | Total expenses do not reflect amounts reimbursed and/or waived by the adviser and certain of its affiliates, if applicable. Net expenses are net of all reductions and represent the net expenses paid by the Fund. |
| (4) | Includes interest expense, including on securities sold short, of 0.09% of average daily net assets for the year ended July 31, 2024. |
| (5) | Includes a reduction by the investment adviser and administrator of a portion of its adviser and administration fee due to the Fund’s investment in the Liquidity Fund (equal to 0.01%, 0.01% and less than 0.005% of average daily net assets for the years ended July 31, 2024, 2023 and 2022, respectively). |
29
See Notes to Financial Statements.
Eaton Vance
Emerging Markets Debt Opportunities Fund
July 31, 2024
Financial Highlights — continued
| | Class R6 |
| | Year Ended July 31, |
| | 2024 | 2023 | 2022 | 2021 | 2020 |
| Net asset value — Beginning of year | $7.57 | $7.06 | $8.84 | $8.66 | $9.03 |
| Income (Loss) From Operations | | | | | |
| Net investment income(1) | $0.64 | $0.64 | $0.57 | $0.57 | $0.59 |
| Net realized and unrealized gain (loss) | 0.28 | 0.55 | (1.67) | 0.29 | (0.20) |
| Total income (loss) from operations | $0.92 | $1.19 | $(1.10) | $0.86 | $0.39 |
| Less Distributions | | | | | |
| From net investment income | $(0.43) | $(0.48) | $(0.50) | $(0.57) | $(0.66) |
| From net realized gain | — | — | (0.04) | (0.01) | — |
| Tax return of capital | (0.25) | (0.20) | (0.14) | (0.10) | (0.10) |
| Total distributions | $(0.68) | $(0.68) | $(0.68) | $(0.68) | $(0.76) |
| Net asset value — End of year | $7.81 | $7.57 | $7.06 | $8.84 | $8.66 |
| Total Return(2) | 12.76% | 17.60% | (13.28)% | 10.23% | 4.63% |
| Ratios/Supplemental Data | | | | | |
| Net assets, end of year (000’s omitted) | $339,896 | $201,284 | $199,679 | $281,359 | $119,237 |
| Ratios (as a percentage of average daily net assets):(3) | | | | | |
| Total expenses | 0.83%(4) | 0.79% | 0.78% | 0.81% | 0.98% |
| Net expenses | 0.82%(4)(5) | 0.78%(5) | 0.78%(5) | 0.81% | 0.85% |
| Net investment income | 8.40% | 8.69% | 6.91% | 6.34% | 6.76% |
| Portfolio Turnover | 173% | 104% | 84% | 87% | 110% |
| (1) | Computed using average shares outstanding. |
| (2) | Returns are historical and are calculated by determining the percentage change in net asset value with all distributions reinvested. |
| (3) | Total expenses do not reflect amounts reimbursed and/or waived by the adviser and certain of its affiliates, if applicable. Net expenses are net of all reductions and represent the net expenses paid by the Fund. |
| (4) | Includes interest expense, including on securities sold short, of 0.09% of average daily net assets for the year ended July 31, 2024. |
| (5) | Includes a reduction by the investment adviser and administrator of a portion of its adviser and administration fee due to the Fund’s investment in the Liquidity Fund (equal to 0.01%, 0.01% and less than 0.005% of average daily net assets for the years ended July 31, 2024, 2023 and 2022, respectively). |
30
See Notes to Financial Statements.
Eaton Vance
Emerging Markets Debt Opportunities Fund
July 31, 2024
Notes to Financial Statements
1 Significant Accounting Policies
Eaton Vance Emerging Markets Debt Opportunities Fund (the Fund) is a non-diversified series of Eaton Vance Series Fund, Inc. (the Corporation). The Corporation is a Maryland corporation registered under the Investment Company Act of 1940, as amended (the 1940 Act), as an open-end management investment company. The Fund’s investment objective is total return. The Fund offers three classes of shares. Class A shares are generally sold subject to a sales charge imposed at time of purchase. Class I and Class R6 shares are sold at net asset value and are not subject to a sales charge. Each class represents a pro rata interest in the Fund, but votes separately on class-specific matters and (as noted below) is subject to different expenses. Realized and unrealized gains and losses and net investment income and losses, other than class-specific expenses, are allocated daily to each class of shares based on the relative net assets of each class to the total net assets of the Fund. Sub-accounting, recordkeeping and similar administrative fees payable to financial intermediaries, which are a component of transfer and dividend disbursing agent fees on the Statement of Operations, are not allocated to Class R6 shares. Each class of shares differs in its distribution plan and certain other class-specific expenses.
The following is a summary of significant accounting policies of the Fund. The policies are in conformity with accounting principles generally accepted in the United States of America (U.S. GAAP). The Fund is an investment company and follows accounting and reporting guidance in the Financial Accounting Standards Board (FASB) Accounting Standards Codification Topic 946.
A Investment Valuation—The following methodologies are used to determine the market value or fair value of investments.
Debt Obligations. Debt obligations are generally valued on the basis of valuations provided by third party pricing services, as derived from such services’ pricing models. Inputs to the models may include, but are not limited to, reported trades, executable bid and ask prices, broker/dealer quotations, prices or yields of securities with similar characteristics, interest rates, anticipated prepayments, benchmark curves or information pertaining to the issuer, as well as industry and economic events. The pricing services may use a matrix approach, which considers information regarding securities with similar characteristics to determine the valuation for a security. Short-term debt obligations purchased with a remaining maturity of sixty days or less for which a valuation from a third party pricing service is not readily available may be valued at amortized cost, which approximates fair value.
Senior Floating-Rate Loans. Interests in senior floating-rate loans (Senior Loans) are valued generally at the average mean of bid and ask quotations obtained from a third party pricing service.
Derivatives. U.S. exchange-traded options are valued at the mean between the bid and ask prices at valuation time as reported by the Options Price Reporting Authority. Non-U.S. exchange-traded options and over-the-counter options (including options on securities, indices and foreign currencies) are valued by a third party pricing service using techniques that consider factors including the value of the underlying instrument, the volatility of the underlying instrument and the period of time until option expiration. Futures contracts are valued at the closing settlement price established by the board of trade or exchange on which they are traded. Forward foreign currency exchange contracts are generally valued at the mean of the average bid and average ask prices that are reported by currency dealers to a third party pricing service at the valuation time. Such third party pricing service valuations are supplied for specific settlement periods and the Fund’s forward foreign currency exchange contracts are valued at an interpolated rate between the closest preceding and subsequent settlement period reported by the third party pricing service. Non-deliverable bond forward contracts are generally valued based on the current price of the underlying bond as provided by a third party pricing service and current interest rates. Swaps and options on swaps (“swaptions”) are normally valued using valuations provided by a third party pricing service. Such pricing service valuations are based on the present value of fixed and projected floating rate cash flows over the term of the swap contract, and in the case of credit default swaps, based on credit spread quotations obtained from broker/dealers and expected default recovery rates determined by the pricing service using proprietary models. In the case of total return swaps, the pricing service valuations are based on the value of the underlying index or instrument and reference interest rate. Future cash flows on swaps are discounted to their present value using swap rates provided by electronic data services or by broker/dealers. Alternatively, swaptions may be valued at the valuation provided by a broker/dealer (usually the counterparty to the option), so determined using similar techniques as those employed by the pricing service.
Foreign Securities and Currencies. Foreign securities and currencies are valued in U.S. dollars, based on foreign currency exchange rate quotations supplied by a third party pricing service. The pricing service uses a proprietary model to determine the exchange rate. Inputs to the model include reported trades and implied bid/ask spreads.
Other. Investments in management investment companies (including money market funds) that do not trade on an exchange are valued at the net asset value as of the close of each business day.
Fair Valuation. In connection with Rule 2a-5 of the 1940 Act, the Directors have designated the Fund’s investment adviser as its valuation designee. Investments for which valuations or market quotations are not readily available or are deemed unreliable are valued by the investment adviser, as valuation designee, at fair value using methods that most fairly reflect the security’s “fair value”, which is the amount that the Fund might reasonably expect to receive for the security upon its current sale in the ordinary course. Each such determination is based on a consideration of relevant factors, which are likely to vary from one pricing context to another. These factors may include, but are not limited to, the type of security, the existence of any contractual restrictions on the security’s disposition, the price and extent of public trading in similar securities of the issuer or of comparable companies or entities, quotations or relevant information obtained from broker/dealers or other market participants, information obtained from the issuer, analysts, and/or the appropriate stock exchange (for exchange-traded securities), an analysis of the company’s or entity’s financial statements, and an evaluation of the forces that influence the issuer and the market(s) in which the security is purchased and sold.
Eaton Vance
Emerging Markets Debt Opportunities Fund
July 31, 2024
Notes to Financial Statements — continued
B Investment Transactions—Investment transactions for financial statement purposes are accounted for on a trade date basis. Realized gains and losses on investments sold are determined on the basis of identified cost.
C Income—Interest income is recorded on the basis of interest accrued, adjusted for amortization of premium or accretion of discount. Fees in connection with investments in loans may include amendment fees, consent fees and prepayment fees, which are recorded to income as earned and included in Other income on the Statement of Operations. Inflation adjustments to the principal amount of inflation-adjusted bonds and notes are reflected as interest income. Deflation adjustments to the principal amount of an inflation-adjusted bond or note are reflected as reductions to interest income to the extent of interest income previously recorded on such bond or note. Dividend income is recorded on the ex-dividend date for dividends received in cash and/or securities. Withholding taxes on foreign interest and capital gains have been provided for in accordance with the Fund’s understanding of the applicable countries’ tax rules and rates.
D Federal and Other Taxes—The Fund’s policy is to comply with the provisions of the Internal Revenue Code applicable to regulated investment companies and to distribute to shareholders each year substantially all of its net investment income, and all or substantially all of its net realized capital gains. Accordingly, no provision for federal income or excise tax is necessary.
In addition to the requirements of the Internal Revenue Code, the Fund may also be subject to local taxes on the recognition of capital gains in certain countries. In determining the daily net asset value, the Fund estimates the accrual for such taxes, if any, based on the unrealized appreciation on certain portfolio securities and the related tax rates. Taxes attributable to unrealized appreciation are included in the change in unrealized appreciation (depreciation) on investments. Capital gains taxes on securities sold are included in net realized gain (loss) on investments.
As of July 31, 2024, the Fund had no uncertain tax positions that would require financial statement recognition, de-recognition, or disclosure. The Fund files a U.S. federal income tax return annually after its fiscal year-end, which is subject to examination by the Internal Revenue Service for a period of three years from the date of filing.
E Foreign Currency Translation—Investment valuations, other assets, and liabilities initially expressed in foreign currencies are translated each business day into U.S. dollars based upon current exchange rates. Purchases and sales of foreign investment securities and income and expenses denominated in foreign currencies are translated into U.S. dollars based upon currency exchange rates in effect on the respective dates of such transactions. Recognized gains or losses on investment transactions attributable to changes in foreign currency exchange rates are recorded for financial statement purposes as net realized gains and losses on investments. That portion of unrealized gains and losses on investments that results from fluctuations in foreign currency exchange rates is not separately disclosed.
F Unfunded Loan Commitments—The Fund may enter into certain loan agreements all or a portion of which may be unfunded. The Fund is obligated to fund these commitments at the borrower's discretion. These commitments, if any, are disclosed in the accompanying Portfolio of Investments.
G Use of Estimates—The preparation of the financial statements in conformity with U.S. GAAP requires management to make estimates and assumptions that affect the reported amounts of assets and liabilities at the date of the financial statements and the reported amounts of income and expense during the reporting period. Actual results could differ from those estimates.
H Indemnifications—The Corporation’s Articles of Incorporation provide that no Director or officer of the Corporation shall be liable, to the fullest extent permitted by Maryland law and the 1940 Act, to the Corporation or to its shareholders for money damages. Additionally, in the normal course of business, the Fund enters into agreements with service providers that may contain indemnification clauses. The Fund’s maximum exposure under these arrangements is unknown as this would involve future claims that may be made against the Fund that have not yet occurred.
I Futures Contracts—Upon entering into a futures contract, the Fund is required to deposit with the broker, either in cash or securities, an amount equal to a certain percentage of the contract amount (initial margin). Subsequent payments, known as variation margin, are made or received by the Fund each business day, depending on the daily fluctuations in the value of the underlying security, and are recorded as unrealized gains or losses by the Fund. Gains (losses) are realized upon the expiration or closing of the futures contracts. Should market conditions change unexpectedly, the Fund may not achieve the anticipated benefits of the futures contracts and may realize a loss. Futures contracts have minimal counterparty risk as they are exchange traded and the clearinghouse for the exchange is substituted as the counterparty, guaranteeing counterparty performance.
J Forward Foreign Currency Exchange and Non-Deliverable Bond Forward Contracts—The Fund may enter into forward foreign currency exchange contracts for the purchase or sale of a specific foreign currency at a fixed price on a future date. The forward foreign currency exchange contracts are adjusted by the daily exchange rate of the underlying currency and any gains or losses are recorded as unrealized until such time as the contracts have been closed. While forward foreign currency exchange contracts are privately negotiated agreements between the Fund and a counterparty, certain contracts may be “centrally cleared”, whereby all payments made or received by the Fund pursuant to the contract are with a central clearing party (CCP) rather than the original counterparty. The CCP guarantees the performance of the original parties to the contract. Upon entering into centrally cleared contracts, the Fund is required to deposit with the CCP, either in cash or securities, an amount of initial margin determined by the CCP, which is subject to adjustment. For centrally cleared contracts, the daily change in valuation is recorded as a receivable or payable for variation margin and settled in cash with the CCP daily. The Fund may also enter into non-deliverable bond forward contracts for the purchase or sale of a bond denominated in a non-deliverable foreign currency at a fixed price on a future date. For non-deliverable bond forward contracts, unrealized gains and losses, based on
Eaton Vance
Emerging Markets Debt Opportunities Fund
July 31, 2024
Notes to Financial Statements — continued
changes in the value of the contract, and realized gains and losses are accounted for as described above. Risks may arise upon entering these contracts from the potential inability of counterparties to meet the terms of their contracts and, in the case of forward foreign currency exchange contracts, from movements in the value of a foreign currency relative to the U.S. dollar. In the case of centrally cleared contracts, counterparty risk is minimal due to protections provided by the CCP.
K Purchased Options—Upon the purchase of a call or put option, the premium paid by the Fund is included in the Statement of Assets and Liabilities as an investment. The amount of the investment is subsequently marked-to-market to reflect the current market value of the option purchased, in accordance with the Fund’s policies on investment valuations discussed above. Premiums paid for purchasing options that expire are treated as realized losses. Premiums paid for purchasing options that are exercised or closed are added to the amounts paid or offset against the proceeds on the underlying investment transaction to determine the realized gain or loss. As the purchaser of an index option, the Fund has the right to receive a cash payment equal to any depreciation in the value of the index below the exercise price of the option (in the case of a put) or equal to any appreciation in the value of the index over the exercise price of the option (in the case of a call) as of the valuation date of the option. The risk associated with purchasing options is limited to the premium originally paid. Purchased options traded over-the-counter risk that the issuer or counterparty will fail to perform its contractual obligations.
L Written Options—Upon the writing of a call or a put option, the premium received by the Fund is included in the Statement of Assets and Liabilities as a liability. The amount of the liability is subsequently marked-to-market to reflect the current market value of the option written, in accordance with the Fund’s policies on investment valuations discussed above. Premiums received from writing options that expire are treated as realized gains. Premiums received from writing options that are exercised or are closed are added to or offset against the proceeds or amount paid on the transaction to determine the realized gain or loss. The Fund, as a writer of an option, may have no control over whether the underlying instrument may be sold (call) or purchased (put) and, as a result, bears the market risk of an unfavorable change in the price of the instrument underlying the written option. The Fund may also bear the risk of not being able to enter into a closing transaction if a liquid secondary market does not exist.
M Interest Rate Swaps—Swap contracts are privately negotiated agreements between the Fund and a counterparty. Certain swap contracts may be centrally cleared. Pursuant to interest rate swap agreements, the Fund either makes floating-rate payments to the counterparty (or CCP in the case of centrally cleared swaps) based on a benchmark interest rate in exchange for fixed-rate payments or the Fund makes fixed-rate payments to the counterparty (or CCP in the case of a centrally cleared swap) in exchange for payments on a floating benchmark interest rate. Payments received or made, including amortization of upfront payments/receipts, if any (which are amortized over the life of the swap contract), are recorded as realized gains or losses. During the term of the outstanding swap agreement, changes in the underlying value of the swap are recorded as unrealized gains or losses. For centrally cleared swaps, the daily change in valuation is recorded as a receivable or payable for variation margin and settled in cash with the CCP daily. The value of the swap is determined by changes in the relationship between two rates of interest. The Fund is exposed to credit loss in the event of non-performance by the swap counterparty. In the case of centrally cleared swaps, counterparty risk is minimal due to protections provided by the CCP. Risk may also arise from movements in interest rates.
N Cross-Currency Swaps—Cross-currency swaps are interest rate swaps in which interest cash flows are exchanged between two parties based on the notional amounts of two different currencies. The notional amounts are typically determined based on the spot exchange rates at the inception of the trade. Cross-currency swaps also involve the exchange of the notional amounts at the start of the contract at the current spot rate with an agreement to re-exchange such amounts at a later date at either the same exchange rate, a specified rate or the then current spot rate. The entire principal value of a cross-currency swap is subject to the risk that the counterparty to the swap will default on its contractual delivery obligations.
O Credit Default Swaps—When the Fund is the buyer of a credit default swap contract, the Fund is entitled to receive the par (or other agreed-upon) value of a referenced debt obligation (or basket of debt obligations) from the counterparty (or CCP in the case of a centrally cleared swap) to the contract if a credit event by a third party, such as a U.S. or foreign corporate issuer or sovereign issuer, on the debt obligation occurs. In return, the Fund pays the counterparty a periodic stream of payments over the term of the contract provided that no credit event has occurred. If no credit event occurs, the Fund would have spent the stream of payments and received no proceeds from the contract. When the Fund is the seller of a credit default swap contract, it receives the stream of payments, but is obligated to pay to the buyer of the protection an amount up to the notional amount of the swap and in certain instances take delivery of securities of the reference entity upon the occurrence of a credit event, as defined under the terms of that particular swap agreement. Credit events are contract specific but may include bankruptcy, failure to pay, restructuring, obligation acceleration and repudiation/moratorium. If the Fund is a seller of protection and a credit event occurs, the maximum potential amount of future payments that the Fund could be required to make would be an amount equal to the notional amount of the agreement. This potential amount would be partially offset by any recovery value of the respective referenced obligation, or net amount received from the settlement of a buy protection credit default swap agreement entered into by the Fund for the same referenced obligation. As the seller, the Fund may create economic leverage to its portfolio because, in addition to its total net assets, the Fund is subject to investment exposure on the notional amount of the swap. The interest fee paid or received on the swap contract, which is based on a specified interest rate on a fixed notional amount, is accrued daily as a component of unrealized appreciation (depreciation) and is recorded as realized gain upon receipt or realized loss upon payment. The Fund also records an increase or decrease to unrealized appreciation (depreciation) in an amount equal to the daily valuation. For centrally cleared swaps, the daily change in valuation is recorded as a receivable or payable for variation margin and settled in cash with the CCP daily. All upfront payments and receipts, if any, are amortized over the life of the swap contract as realized gains or losses. Those upfront payments or receipts for non-centrally cleared swaps are recorded as other assets or other liabilities, respectively, net of amortization. For financial reporting purposes, unamortized upfront payments or receipts, if any, are netted with unrealized appreciation or depreciation on swap contracts to determine the market value
Eaton Vance
Emerging Markets Debt Opportunities Fund
July 31, 2024
Notes to Financial Statements — continued
of swaps as presented in Notes 8 and 11. These transactions involve certain risks, including the risk that the seller may be unable to fulfill the transaction. In the case of centrally cleared swaps, counterparty risk is minimal due to protections provided by the CCP.
P Total Return Swaps—In a total return swap, the buyer receives a periodic return equal to the total return of a specified security, securities or index for a specified period of time. In return, the buyer pays the counterparty a fixed or variable stream of payments, typically based upon short-term interest rates, possibly plus or minus an agreed upon spread. During the term of the outstanding swap agreement, changes in the underlying value of the swap are recorded as unrealized gains and losses. Periodic payments received or made are recorded as realized gains or losses. The Fund is exposed to credit loss in the event of nonperformance by the swap counterparty. Risk may also arise from the unanticipated movements in value of exchange rates, interest rates, securities, or the index.
Q Swaptions—A purchased swaption contract grants the Fund, in return for payment of the purchase price, the right, but not the obligation, to enter into a new swap agreement or to shorten, extend, cancel or otherwise modify an existing swap agreement, at some designated future time on specified terms. When the Fund purchases a swaption, the premium paid to the writer is recorded as an investment and subsequently marked-to-market to reflect the current value of the swaption. A written swaption gives the Fund the obligation, if exercised by the purchaser, to enter into a swap contract according to the terms of the underlying agreement. When the Fund writes a swaption, the premium received by the Fund is recorded as a liability and subsequently marked-to-market to reflect the current value of the swaption. When a swaption is exercised, the cost of the swap is adjusted by the amount of the premium paid or received. When a swaption expires or an unexercised swaption is closed, a gain or loss is recognized in the amount of the premium paid or received, plus the cost to close. The Fund’s risk for purchased swaptions is limited to the premium paid. The writer of a swaption bears the risk of unfavorable changes in the preset terms of the underlying swap contract. Purchased swaptions traded over-the-counter involve risk that the issuer or counterparty will fail to perform its contractual obligations.
R Repurchase Agreements—A repurchase agreement is the purchase by the Fund of securities from a counterparty in exchange for cash that is coupled with an agreement to resell those securities to the counterparty at a specified date and price. When a repurchase agreement is entered, the Fund typically receives securities with a value that equals or exceeds the repurchase price, including any accrued interest earned on the agreement. The value of such securities will be marked-to-market daily, and cash or additional securities will be exchanged between the parties as needed. Except in the case of a repurchase agreement entered to settle a short sale, the value of the securities delivered to the Fund will be at least equal to 90% of the repurchase price during the term of the repurchase agreement. The terms of a repurchase agreement entered to settle a short sale may provide that the cash purchase price paid by the Fund is more than the value of purchased securities that effectively collateralize the repurchase price payable by the counterparty. In the event of insolvency of the counterparty to a repurchase agreement, recovery of the repurchase price owed to the Fund may be delayed. Such an insolvency also may result in a loss to the extent that the value of the purchased securities decreases during the delay or that value has otherwise not been maintained at an amount at least equal to the repurchase price.
S Securities Sold Short—A short sale is a transaction in which the Fund sells a security it does not own in anticipation of a decline in the market value of that security. To complete such a transaction, the Fund must borrow the security to make delivery to the buyer with an obligation to replace such borrowed security at a later date. Until the security is replaced, the Fund is required to repay the lender any dividends or interest, which accrue during the period of the loan. The proceeds received from a short sale are recorded as a liability and the Fund records an unrealized gain or loss to the extent of the difference between the proceeds received and the value of the open short position on the day of determination. A gain, limited to the price at which the Fund sold the security short, or a loss, potentially unlimited as there is no upward limit on the price of a security, is recorded when the short position is terminated. Interest and dividends payable on securities sold short are recorded as an expense.
2 Distributions to Shareholders and Income Tax Information
It is the present policy of the Fund to make monthly distributions of all or substantially all of its net investment income and to distribute annually all or substantially all of its net realized capital gains. Distributions to shareholders are recorded on the ex-dividend date. Distributions are declared separately for each class of shares. Shareholders may reinvest income and capital gain distributions in additional shares of the same class of the Fund at the net asset value as of the ex-dividend date or, at the election of the shareholder, receive distributions in cash. Distributions to shareholders are determined in accordance with income tax regulations, which may differ from U.S. GAAP. As required by U.S. GAAP, only distributions in excess of tax basis earnings and profits are reported in the financial statements as a return of capital. Permanent differences between book and tax accounting relating to distributions are reclassified to paid-in capital. For tax purposes, distributions from short-term capital gains are considered to be from ordinary income.
Eaton Vance
Emerging Markets Debt Opportunities Fund
July 31, 2024
Notes to Financial Statements — continued
The tax character of distributions declared for the years ended July 31, 2024 and July 31, 2023 was as follows:
| | Year Ended July 31, |
| | 2024 | 2023 |
| Ordinary income | $98,266,176 | $70,264,981 |
| Tax return of capital | $66,008,767 | $33,531,027 |
During the year ended July 31, 2024, accumulated loss was increased by $421,726 and paid-in capital was increased by $421,726 due to differences between book and tax accounting. These reclassifications had no effect on the net assets or net asset value per share of the Fund.
As of July 31, 2024, the components of distributable earnings (accumulated loss) on a tax basis were as follows:
| Deferred capital losses | $(34,652,723) |
| Net unrealized appreciation | 12,796,047 |
| Accumulated loss | $(21,856,676) |
At July 31, 2024, the Fund, for federal income tax purposes, had deferred capital losses of $34,652,723 which would reduce its taxable income arising from future net realized gains on investment transactions, if any, to the extent permitted by the Internal Revenue Code, and thus would reduce the amount of distributions to shareholders, which would otherwise be necessary to relieve the Fund of any liability for federal income or excise tax. The deferred capital losses are treated as arising on the first day of the Fund’s next taxable year and retain the same short-term or long-term character as when originally deferred. Of the deferred capital losses at July 31, 2024, $34,652,723 are long-term.
The cost and unrealized appreciation (depreciation) of investments, including open derivative contracts, of the Fund at July 31, 2024, as determined on a federal income tax basis, were as follows:
| Aggregate cost | $2,181,698,953 |
| Gross unrealized appreciation | $95,628,168 |
| Gross unrealized depreciation | (82,543,876) |
| Net unrealized appreciation | $13,084,292 |
3 Investment Adviser and Administration Fee and Other Transactions with Affiliates
The investment adviser and administration fee is earned by Eaton Vance Management (EVM), an indirect, wholly-owned subsidiary of Morgan Stanley, as compensation for investment advisory and administrative services rendered to the Fund. The fee is computed at an annual rate as a percentage of average daily net assets as follows and is payable monthly:
| Average Daily Net Assets | Annual Fee Rate |
| Up to $500 million | 0.650% |
| $500 million but less than $1.0 billion | 0.625% |
| $1.0 billion but less than $2.5 billion | 0.600% |
| $2.5 billion but less than $5.0 billion | 0.580% |
| $5.0 billion and over | 0.565% |
For the year ended July 31, 2024, the investment adviser and administration fee amounted to $11,356,102 or 0.62% of the Fund’s average daily net assets. The Fund may invest in a money market fund, the Institutional Class of the Morgan Stanley Institutional Liquidity Funds - Government Portfolio (the "Liquidity Fund"), an open-end management investment company managed by Morgan Stanley Investment Management Inc., a wholly-owned subsidiary of
Eaton Vance
Emerging Markets Debt Opportunities Fund
July 31, 2024
Notes to Financial Statements — continued
Morgan Stanley. The investment adviser and administration fee paid by the Fund is reduced by an amount equal to its pro rata share of the advisory and administration fees paid by the Fund due to its investment in the Liquidity Fund. For the year ended July 31, 2024, the investment adviser and administration fee paid was reduced by $192,651 relating to the Fund’s investment in the Liquidity Fund.
EVM provides sub-transfer agency and related services to the Fund pursuant to a Sub-Transfer Agency Support Services Agreement. For the year ended July 31, 2024, EVM earned $11,268 from the Fund pursuant to such agreement, which is included in transfer and dividend disbursing agent fees on the Statement of Operations. The Fund was informed that Eaton Vance Distributors, Inc. (EVD), an affiliate of EVM and the Fund's principal underwriter, received $4,523 as its portion of the sales charge on sales of Class A shares for the year ended July 31, 2024. EVD also received distribution and service fees from Class A shares (see Note 4).
Directors and officers of the Fund who are members of EVM’s organization receive remuneration for their services to the Fund out of the investment adviser and administration fee. Directors of the Fund who are not affiliated with EVM may elect to defer receipt of all or a percentage of their annual fees in accordance with the terms of the Directors Deferred Compensation Plan. Certain officers and Directors of the Fund are officers of EVM.
4 Distribution Plan
The Fund has in effect a distribution plan for Class A shares (Class A Plan) pursuant to Rule 12b-1 under the 1940 Act. Pursuant to the Class A Plan, the Fund pays EVD a distribution and service fee of 0.25% per annum of its average daily net assets attributable to Class A shares for distribution services and facilities provided to the Fund by EVD, as well as for personal services and/or the maintenance of shareholder accounts. Distribution and service fees paid or accrued to EVD for the year ended July 31, 2024 amounted to $192,054 for Class A shares.
Distribution and service fees are subject to the limitations contained in the Financial Industry Regulatory Authority Rule 2341(d).
5 Contingent Deferred Sales Charges
Class A shares may be subject to a 0.75% contingent deferred sales charge (CDSC) if redeemed within 12 months of purchase (depending on the circumstances of purchase). Generally, the CDSC is based upon the lower of the net asset value at date of redemption or date of purchase. No charge is levied on shares acquired by reinvestment of dividends or capital gain distributions. For the year ended July 31, 2024, the Fund was informed that EVD received no CDSCs paid by Class A shareholders.
6 Purchases and Sales of Investments
Purchases and sales of investments, other than short-term obligations and including principal repayments on loans and securities sold short, aggregated $2,971,818,404 and $2,496,074,878, respectively, for the year ended July 31, 2024.
7 Common Shares
The Corporation's Articles of Incorporation permit the Directors to issue one billion full and fractional common shares of the Fund ($0.001 par value per share). The Corporation’s authorized shares are subdivided into 300 million shares for each of Class A, Class I and Class R6 and 100 million shares for Class C, which has not commenced operations. Transactions in Fund shares were as follows:
| | Year Ended
July 31, 2024 | | Year Ended
July 31, 2023 |
| | Shares | Amount | | Shares | Amount |
| Class A | | | | | |
| Sales | 7,101,487 | $ 54,314,268 | | 7,421,857 | $ 54,993,452 |
| Issued to shareholders electing to receive payments of distributions in Fund shares | 875,414 | 6,660,004 | | 759,023 | 5,560,062 |
| Redemptions | (5,606,314) | (42,969,333) | | (6,320,615) | (46,576,244) |
| Net increase | 2,370,587 | $ 18,004,939 | | 1,860,265 | $ 13,977,270 |
Eaton Vance
Emerging Markets Debt Opportunities Fund
July 31, 2024
Notes to Financial Statements — continued
| | Year Ended
July 31, 2024 | | Year Ended
July 31, 2023 |
| | Shares | Amount | | Shares | Amount |
| Class I | | | | | |
| Sales | 149,440,459 | $1,145,541,919 | | 107,290,653 | $795,996,772 |
| Issued to shareholders electing to receive payments of distributions in Fund shares | 17,380,650 | 132,791,421 | | 10,656,169 | 78,309,231 |
| Redemptions | (78,474,795) | (598,573,789) | | (57,245,336) | (418,450,783) |
| Net increase | 88,346,314 | $ 679,759,551 | | 60,701,486 | $455,855,220 |
| Class R6 | | | | | |
| Sales | 15,097,659 | $ 116,959,200 | | 2,360,584 | $ 17,593,032 |
| Issued to shareholders electing to receive payments of distributions in Fund shares | 2,849,173 | 21,707,691 | | 2,361,674 | 17,255,710 |
| Redemptions | (1,001,766) | (7,694,649) | | (6,421,704) | (46,777,993) |
| Net increase (decrease) | 16,945,066 | $ 130,972,242 | | (1,699,446) | $(11,929,251) |
At July 31, 2024, Eaton Vance Strategic Income Fund (formerly, Eaton Vance Short Duration Strategic Income Fund) and donor advised funds (established and maintained by a public charity) managed by EVM owned in the aggregate 11.5% of the value of the outstanding shares of the Fund.
8 Financial Instruments
The Fund may trade in financial instruments with off-balance sheet risk in the normal course of its investing activities. These financial instruments may include written options, forward foreign currency exchange contracts, non-deliverable bond forward contracts, futures contracts and swap contracts and may involve, to a varying degree, elements of risk in excess of the amounts recognized for financial statement purposes. The notional or contractual amounts of these instruments represent the investment the Fund has in particular classes of financial instruments and do not necessarily represent the amounts potentially subject to risk. The measurement of the risks associated with these instruments is meaningful only when all related and offsetting transactions are considered. A summary of obligations under these financial instruments at July 31, 2024 is included in the Portfolio of Investments. At July 31, 2024, the Fund had sufficient cash and/or securities to cover commitments under these contracts.
In the normal course of pursuing its investment objective, the Fund is subject to the following risks:
Credit Risk: The Fund enters into credit default swaps and swaptions to manage certain investment risks and/or to enhance total return or as a substitute for the purchase or sale of securities.
Foreign Exchange Risk: The Fund engages in forward foreign currency exchange contracts, currency options and cross-currency swaps to enhance total return, to seek to hedge against fluctuations in currency exchange rates and/or as a substitute for the purchase or sale of securities or currencies.
Interest Rate Risk: The Fund utilizes various interest rate derivatives including non-deliverable bond forward contracts, interest rate futures contracts, interest rate swaps, total return swaps and cross-currency swaps to enhance total return, to seek to hedge against fluctuations in interest rates, and/or to change the effective duration of its portfolio.
The Fund enters into over-the-counter (OTC) derivatives that may contain provisions whereby the counterparty may terminate the contract under certain conditions, including but not limited to a decline in the Fund’s net assets below a certain level over a certain period of time, which would trigger a payment by the Fund for those derivatives in a liability position. At July 31, 2024, the fair value of derivatives with credit-related contingent features in a net liability position was $12,468,522. The aggregate fair value of assets pledged as collateral by the Fund for such liability was $12,507,409 at July 31, 2024.
The OTC derivatives in which the Fund invests are subject to the risk that the counterparty to the contract fails to perform its obligations under the contract. To mitigate this risk, the Fund has entered into an International Swaps and Derivatives Association, Inc. Master Agreement (“ISDA Master Agreement”) or similar agreement with substantially all its derivative counterparties. An ISDA Master Agreement is a bilateral agreement between the Fund and a counterparty that governs certain OTC derivatives and typically contains, among other things, set-off provisions in the event of a default and/or termination event as defined under the relevant ISDA Master Agreement. Under an ISDA Master Agreement, the Fund may, under certain circumstances, offset with the counterparty certain derivative financial instruments’ payables and/or receivables with collateral held and/or posted and create one single net payment. The provisions of the ISDA Master Agreement typically permit a single net payment in the event of default including the bankruptcy or insolvency of the counterparty. However, bankruptcy or insolvency laws of a particular jurisdiction may impose restrictions on or prohibitions against the right of offset
Eaton Vance
Emerging Markets Debt Opportunities Fund
July 31, 2024
Notes to Financial Statements — continued
in bankruptcy or insolvency. Certain ISDA Master Agreements allow counterparties to OTC derivatives to terminate derivative contracts prior to maturity in the event the Fund’s net assets decline by a stated percentage or the Fund fails to meet the terms of its ISDA Master Agreements, which would cause the counterparty to accelerate payment by the Fund of any net liability owed to it.
The collateral requirements for derivatives traded under an ISDA Master Agreement are governed by a Credit Support Annex to the ISDA Master Agreement. Collateral requirements are determined at the close of business each day and are typically based on changes in market values for each transaction under an ISDA Master Agreement and netted into one amount for such agreement. Generally, the amount of collateral due from or to a counterparty is subject to a minimum transfer threshold amount before a transfer is required, which may vary by counterparty. Collateral pledged for the benefit of the Fund and/or counterparty is held in segregated accounts by the Fund’s custodian and cannot be sold, re-pledged, assigned or otherwise used while pledged. The portion of such collateral representing cash, if any, is reflected as deposits for derivatives collateral and, in the case of cash pledged by a counterparty for the benefit of the Fund, a corresponding liability on the Statement of Assets and Liabilities. Securities pledged by the Fund as collateral, if any, are identified as such in the Portfolio of Investments. The carrying amount of the liability for cash collateral due to brokers at July 31, 2024 approximated its fair value. If measured at fair value, such liability would have been considered as Level 2 in the fair value hierarchy (see Note 11) at July 31, 2024.
The fair value of open derivative instruments (not considered to be hedging instruments for accounting disclosure purposes) by risk exposure at July 31, 2024 was as follows:
| | Fair Value |
| Statement of Assets and Liabilities Caption | Credit | Foreign
Exchange | Interest
Rate | Total |
| Unaffiliated investments, at value | $ — | $459,352 | $ — | $459,352 |
| Accumulated loss* | 4,528,137 | 2,361,389 | 10,004,539 | 16,894,065 |
| Receivable for open forward foreign currency exchange contracts | — | 22,897,184 | — | 22,897,184 |
| Receivable/Payable for open swap contracts | — | — | 248,567 | 248,567 |
| Total Asset Derivatives | $4,528,137 | $25,717,925 | $10,253,106 | $40,499,168 |
| Derivatives not subject to master netting or similar agreements | $4,528,137 | $2,361,389 | $10,004,539 | $16,894,065 |
| Total Asset Derivatives subject to master netting or similar agreements | $ — | $23,356,536 | $248,567 | $23,605,103 |
| Accumulated loss* | $(5,226,353) | $(5,711,246) | $(13,224,853) | $(24,162,452) |
| Payable for open forward foreign currency exchange contracts | — | (8,489,930) | — | (8,489,930) |
| Payable for open swap contracts; Upfront receipts on open non-centrally cleared swap contracts | (3,961,409) | — | (17,183) | (3,978,592) |
| Total Liability Derivatives | $(9,187,762) | $(14,201,176) | $(13,242,036) | $(36,630,974) |
| Derivatives not subject to master netting or similar agreements | $(5,226,353) | $(5,711,246) | $(13,224,853) | $(24,162,452) |
| Total Liability Derivatives subject to master netting or similar agreements | $(3,961,409) | $(8,489,930) | $(17,183) | $(12,468,522) |
| * | Only the current day’s variation margin on open futures contracts and centrally cleared derivatives is reported within the Statement of Assets and Liabilities as Receivable or Payable for variation margin on open futures contracts and centrally cleared derivatives, as applicable. |
Eaton Vance
Emerging Markets Debt Opportunities Fund
July 31, 2024
Notes to Financial Statements — continued
The Fund's derivative assets and liabilities at fair value by risk, which are reported gross in the Statement of Assets and Liabilities, are presented in the table above. The following tables present the Fund's derivative assets and liabilities by counterparty, net of amounts available for offset under a master netting agreement and net of the related collateral received by the Fund for such assets and pledged by the Fund for such liabilities as of July 31, 2024.
| Counterparty | Derivative
Assets Subject to
Master Netting
Agreement | Derivatives
Available
for Offset | Non-cash
Collateral
Received(a) | Cash
Collateral
Received(a) | Net Amount
of Derivative
Assets(b) | Total Cash
Collateral
Received |
| Bank of America, N.A. | $865,639 | $(135,801) | $ — | $(729,838) | $ — | $760,000 |
| Barclays Bank PLC | 194,482 | (194,482) | — | — | — | — |
| BNP Paribas | 140,382 | — | — | (60,000) | 80,382 | 60,000 |
| Citibank, N.A. | 2,635,183 | (2,635,183) | — | — | — | — |
| Credit Agricole Corporate and Investment Bank | 43,255 | — | — | — | 43,255 | — |
| Deutsche Bank AG | 51,229 | (51,229) | — | — | — | — |
| Goldman Sachs International | 875,898 | (116,065) | — | (759,833) | — | 770,000 |
| HSBC Bank USA, N.A. | 91,891 | (533) | (91,358) | — | — | — |
| ICBC Standard Bank plc | 1,381,656 | (47,559) | — | (1,170,000) | 164,097 | 1,170,000 |
| JPMorgan Chase Bank, N.A. | 1,901,262 | (389,728) | — | (1,511,534) | — | 2,560,000 |
| Standard Chartered Bank | 15,050,245 | (7,017,708) | — | — | 8,032,537 | — |
| State Street Bank and Trust Company | 274,065 | — | — | — | 274,065 | — |
| UBS AG | 99,916 | (99,916) | — | — | — | — |
| | $23,605,103 | $(10,688,204) | $(91,358) | $(4,231,205) | $8,594,336 | $5,320,000 |
| Counterparty | Derivative
Liabilities Subject to
Master Netting
Agreement | Derivatives
Available
for Offset | Non-cash
Collateral
Pledged(a) | Cash
Collateral
Pledged(a) | Net Amount
of Derivative
Liabilities(c) | Total Cash
Collateral
Pledged |
| Bank of America, N.A. | $(135,801) | $135,801 | $ — | $ — | $ — | $ — |
| Barclays Bank PLC | (412,667) | 194,482 | 218,185 | — | — | — |
| Citibank, N.A. | (3,220,245) | 2,635,183 | 585,062 | — | — | — |
| Deutsche Bank AG | (1,016,066) | 51,229 | 964,837 | — | — | — |
| Goldman Sachs International | (116,065) | 116,065 | — | — | — | — |
| HSBC Bank USA, N.A. | (533) | 533 | — | — | — | — |
| ICBC Standard Bank plc | (47,559) | 47,559 | — | — | — | — |
| JPMorgan Chase Bank, N.A. | (389,728) | 389,728 | — | — | — | — |
| Standard Chartered Bank | (7,017,708) | 7,017,708 | — | — | — | — |
| UBS AG | (112,150) | 99,916 | — | — | (12,234) | — |
| | $(12,468,522) | $10,688,204 | $1,768,084 | $ — | $(12,234) | $ — |
| Total — Deposits for derivatives collateral — OTC derivatives | | | | $5,320,000 |
| (a) | In some instances, the total collateral received and/or pledged may be more than the amount shown due to overcollateralization. |
| (b) | Net amount represents the net amount due from the counterparty in the event of default. |
| (c) | Net amount represents the net amount payable to the counterparty in the event of default. |
Eaton Vance
Emerging Markets Debt Opportunities Fund
July 31, 2024
Notes to Financial Statements — continued
The effect of derivative instruments (not considered to be hedging instruments for accounting disclosure purposes) on the Statement of Operations by risk exposure for the year ended July 31, 2024 was as follows:
| Statement of Operations Caption | Credit | Foreign
Exchange | Interest
Rate | Total |
| Net realized gain (loss): | | | | |
| Investment transactions | $(5,906,590) | $(6,303,023) | $ — | $(12,209,613) |
| Written options | — | 252,797 | — | 252,797 |
| Futures contracts | — | — | 20,339,388 | 20,339,388 |
| Swap contracts | 114,717 | — | (14,451,540) | (14,336,823) |
| Forward foreign currency exchange contracts | — | 3,230,935 | — | 3,230,935 |
| Non-deliverable bond forward contracts | — | — | 2,474,429 | 2,474,429 |
| Total | $(5,791,873) | $(2,819,291) | $8,362,277 | $(248,887) |
| Change in unrealized appreciation (depreciation): | | | | |
| Investments | $5,521,910 | $(763,507) | $ — | $4,758,403 |
| Futures contracts | — | — | (19,281,625) | (19,281,625) |
| Swap contracts | 3,164,202 | — | 14,047,647 | 17,211,849 |
| Forward foreign currency exchange contracts | — | 15,544,011 | — | 15,544,011 |
| Non-deliverable bond forward contracts | — | — | (126,670) | (126,670) |
| Total | $8,686,112 | $14,780,504 | $(5,360,648) | $18,105,968 |
The average notional cost of futures contracts and average notional amounts of other derivative contracts outstanding during the year ended July 31, 2024, which are indicative of the volume of these derivative types, were approximately as follows:
Futures
Contracts — Short | Forward
Foreign Currency
Exchange Contracts* | Non-Deliverable
Bond Forward
Contracts | Purchased
Swaptions | Swap
Contracts |
| $616,419,000 | $1,482,188,000 | $14,358,000 | $62,192,000 | $1,334,532,000 |
| * | The average notional amount for forward foreign currency exchange contracts is based on the absolute value of notional amounts of currency purchased and currency sold. |
The average principal amount of purchased and written currency options contracts outstanding during the year ended July 31, 2024, which are indicative of the volume of these derivative types, were approximately $108,601,000 and $1,699,000, respectively.
9 Line of Credit
The Fund participates with other portfolios and funds managed by EVM and its affiliates in a $650 million unsecured revolving line of credit agreement with a group of banks, which is in effect through October 22, 2024. Borrowings are made by the Fund solely for temporary purposes related to redemptions and other short-term cash needs. Interest is charged to the Fund based on its borrowings at an amount above either the Secured Overnight Financing Rate (SOFR) or Federal Funds rate. In addition, a fee computed at an annual rate of 0.15% on the daily unused portion of the line of credit is allocated among the participating portfolios and funds at the end of each quarter. In connection with the renewal of the agreement in October 2023, an arrangement fee of $150,000 was incurred that was allocated to the participating portfolios and funds. Because the line of credit is not available exclusively to the Fund, it may be unable to borrow some or all of its requested amounts at any particular time. The Fund did not have any significant borrowings or allocated fees during the year ended July 31, 2024.
Eaton Vance
Emerging Markets Debt Opportunities Fund
July 31, 2024
Notes to Financial Statements — continued
10 Affiliated Investments
At July 31, 2024, the value of the Fund's investment in funds that may be deemed to be affiliated was $86,614,587, which represents 3.7% of the Fund's net assets. Transactions in such investments by the Fund for the year ended July 31, 2024 were as follows:
| Name | Value,
beginning
of period | Purchases | Sales
proceeds | Net realized
gain (loss) | Change in
unrealized
appreciation
(depreciation) | Value, end
of period | Dividend
income | Shares,
end of period |
| Short-Term Investments |
| Liquidity Fund | $109,338,638 | $1,528,023,837 | $(1,550,747,888) | $ — | $ — | $86,614,587 | $6,995,759 | 86,614,587 |
11 Fair Value Measurements
Under generally accepted accounting principles for fair value measurements, a three-tier hierarchy to prioritize the assumptions, referred to as inputs, is used in valuation techniques to measure fair value. The three-tier hierarchy of inputs is summarized in the three broad levels listed below.
| • | Level 1 – quoted prices in active markets for identical investments |
| • | Level 2 – other significant observable inputs (including quoted prices for similar investments, interest rates, prepayment speeds, credit risk, etc.) |
| • | Level 3 – significant unobservable inputs (including a fund's own assumptions in determining the fair value of investments) |
In cases where the inputs used to measure fair value fall in different levels of the fair value hierarchy, the level disclosed is determined based on the lowest level input that is significant to the fair value measurement in its entirety. The inputs or methodology used for valuing securities are not necessarily an indication of the risk associated with investing in those securities.
At July 31, 2024, the hierarchy of inputs used in valuing the Fund's investments and open derivative instruments, which are carried at fair value, were as follows:
| Asset Description | Level 1 | Level 2 | Level 3 | Total |
| Convertible Bonds | $ — | $ 14,339,047 | $ — | $ 14,339,047 |
| Foreign Corporate Bonds | — | 624,328,228 | 0 | 624,328,228 |
| Loan Participation Notes | — | — | 22,617,191 | 22,617,191 |
| Senior Floating-Rate Loans | — | 122,417,589 | — | 122,417,589 |
| Sovereign Government Bonds | — | 1,028,497,381 | — | 1,028,497,381 |
| Sovereign Loans | — | 27,404,359 | — | 27,404,359 |
| Miscellaneous | — | — | 0 | 0 |
| Short-Term Investments: | | | | |
| Affiliated Fund | 86,614,587 | — | — | 86,614,587 |
| Sovereign Government Securities | — | 209,382,870 | — | 209,382,870 |
| U.S. Treasury Obligations | — | 47,630,792 | — | 47,630,792 |
| Purchased Currency Options | — | 459,352 | — | 459,352 |
| Total Investments | $ 86,614,587 | $2,074,459,618 | $22,617,191 | $2,183,691,396 |
| Forward Foreign Currency Exchange Contracts | $ — | $ 25,258,573 | $ — | $ 25,258,573 |
| Futures Contracts | 3,596 | — | — | 3,596 |
| Swap Contracts | — | 14,777,647 | — | 14,777,647 |
| Total | $ 86,618,183 | $2,114,495,838 | $22,617,191 | $2,223,731,212 |
| Liability Description | | | | |
| Forward Foreign Currency Exchange Contracts | $ — | $ (14,201,176) | $ — | $ (14,201,176) |
Eaton Vance
Emerging Markets Debt Opportunities Fund
July 31, 2024
Notes to Financial Statements — continued
| Liability Description (continued) | Level 1 | Level 2 | Level 3 | Total |
| Futures Contracts | $(12,578,694) | $ — | $ — | $ (12,578,694) |
| Swap Contracts | — | (9,851,104) | — | (9,851,104) |
| Total | $(12,578,694) | $ (24,052,280) | $ — | $ (36,630,974) |
The following is a reconciliation of Level 3 investments for which significant unobservable inputs were used to determine fair value:
| | Foreign
Corporate Bonds | Loan
Participation Notes | Miscellaneous | Total |
| Balance as of July 31, 2023 | $ — | $31,121,371 | $0 | $31,121,371 |
| Realized gains (losses) | — | (1,279,725) | 692,658 | (587,067) |
| Change in net unrealized appreciation (depreciation) | (2,412,547) | (932,840) | — | (3,345,387) |
| Cost of purchases | — | — | — | — |
| Proceeds from sales, including return of capital | — | (6,818,733) | (692,658) | (7,511,391) |
| Accrued discount (premium) | 232 | 527,118 | — | 527,350 |
| Transfers to Level 3(1) | 2,412,315 | — | — | 2,412,315 |
| Transfers from Level 3 | — | — | — | — |
| Balance as of July 31, 2024 | $0 | $22,617,191 | $0 | $22,617,191 |
| Change in net unrealized appreciation (depreciation) on investments still held as of July 31, 2024 | $(2,412,547) | $(1,064,678) | $ — | $(3,477,225) |
| (1) | Transferred from Level 2 to Level 3 due to restrictions imposed on the sale of the investment. |
The following is a summary of quantitative information about significant unobservable valuation inputs for Level 3 investments held as of July 31, 2024:
| Type of Investment | Fair Value as of
July 31, 2024 | Valuation Technique | Unobservable Input | Range of Unobservable Input | Impact to
Valuation from an
Increase to Input* |
| Foreign Corporate Bonds | $0 | Estimated Recovery Value | Estimated Recovery Value Percentage | 0% | Increase |
| Loan Participation Notes | 22,617,191 | Matrix Pricing | Adjusted Credit Spread to the Central Bank of Uzbekistan Quoted Policy Rate | 5.25% - 6.24%** | Decrease |
| Miscellaneous | 0 | Estimated Recovery Value | Estimated Recovery Value Percentage | 0% | Increase |
| * | Represents the directional change in the fair value of the Level 3 investments that would result from an increase to the corresponding unobservable input. A decrease to the unobservable input would have the opposite effect. |
| ** | The weighted average of the unobservable input is 5.94% based on relative principal amounts. |
12 Risks and Uncertainties
Risks Associated with Foreign Investments
Foreign investments can be adversely affected by political, economic and market developments abroad, including the imposition of economic and other sanctions by the United States or another country, and by acts of terrorism and war. There may be less publicly available information about foreign issuers because they may not be subject to reporting practices, requirements or regulations comparable to those to which United States companies are subject. Foreign markets may be smaller, less liquid and more volatile than the major markets in the United States. Trading in foreign markets typically involves higher expense than trading in the United States. The Fund may have difficulties enforcing its legal or contractual rights in a foreign country. Securities that trade or are denominated in currencies other than the U.S. dollar may be adversely affected by fluctuations in currency exchange rates.
Eaton Vance
Emerging Markets Debt Opportunities Fund
July 31, 2024
Notes to Financial Statements — continued
Emerging market securities often involve greater risks than developed market securities. Investment markets within emerging market countries are typically smaller, less liquid, less developed and more volatile than those in more developed markets like the United States, and may be focused in certain economic sectors. The information available about an emerging market issuer may be less reliable than for comparable issuers in more developed capital markets. Governmental actions can have a significant effect on the economic conditions in emerging market countries. It may be more difficult to make a claim or obtain a judgment in the courts of these countries than it is in the United States. The possibility of fraud, negligence, undue influence being exerted by an issuer or refusal to recognize ownership exists in some emerging markets. Disruptions due to work stoppages and trading improprieties in foreign securities markets have caused such markets to close. Emerging market securities are also subject to speculative trading, which contributes to their volatility.
Economic data as reported by sovereign entities may be delayed, inaccurate or fraudulent. In the event of a default by a sovereign entity, there are typically no assets to be seized or cash flows to be attached. Furthermore, the willingness or ability of a sovereign entity to restructure defaulted debt may be limited. Therefore, losses on sovereign defaults may far exceed the losses from the default of a similarly rated U.S. debt issuer.
Eaton Vance
Emerging Markets Debt Opportunities Fund
July 31, 2024
Report of Independent Registered Public Accounting Firm
To the Directors of Eaton Vance Series Fund, Inc. and Shareholders of Eaton Vance Emerging Markets Debt Opportunities Fund:
Opinion on the Financial Statements and Financial Highlights
We have audited the accompanying statement of assets and liabilities of Eaton Vance Emerging Markets Debt Opportunities Fund (the "Fund") (one of the funds constituting Eaton Vance Series Fund, Inc.), including the portfolio of investments, as of July 31, 2024, the related statement of operations for the year then ended, the statements of changes in net assets for each of the two years in the period then ended, the financial highlights for each of the five years in the period then ended, and the related notes. In our opinion, the financial statements and financial highlights present fairly, in all material respects, the financial position of the Fund as of July 31, 2024, and the results of its operations for the year then ended, the changes in its net assets for each of the two years in the period then ended, and the financial highlights for each of the five years in the period then ended, in conformity with accounting principles generally accepted in the United States of America.
Basis for Opinion
These financial statements and financial highlights are the responsibility of the Fund's management. Our responsibility is to express an opinion on the Fund's financial statements and financial highlights based on our audits. We are a public accounting firm registered with the Public Company Accounting Oversight Board (United States) (PCAOB) and are required to be independent with respect to the Fund in accordance with the U.S. federal securities laws and the applicable rules and regulations of the Securities and Exchange Commission and the PCAOB.
We conducted our audits in accordance with the standards of the PCAOB. Those standards require that we plan and perform the audit to obtain reasonable assurance about whether the financial statements and financial highlights are free of material misstatement, whether due to error or fraud. The Fund is not required to have, nor were we engaged to perform, an audit of its internal control over financial reporting. As part of our audits, we are required to obtain an understanding of internal control over financial reporting but not for the purpose of expressing an opinion on the effectiveness of the Fund’s internal control over financial reporting. Accordingly, we express no such opinion.
Our audits included performing procedures to assess the risks of material misstatement of the financial statements and financial highlights, whether due to error or fraud, and performing procedures that respond to those risks. Such procedures included examining, on a test basis, evidence regarding the amounts and disclosures in the financial statements and financial highlights. Our audits also included evaluating the accounting principles used and significant estimates made by management, as well as evaluating the overall presentation of the financial statements and financial highlights. Our procedures included confirmation of securities and senior loans owned as of July 31, 2024, by correspondence with the custodian, brokers and agent banks; when replies were not received from brokers and agent banks, we performed other auditing procedures. We believe that our audits provide a reasonable basis for our opinion.
/s/ Deloitte & Touche LLP
Boston, Massachusetts
September 18, 2024
We have served as the auditor of one or more Eaton Vance investment companies since 1959.
Eaton Vance
Emerging Markets Debt Opportunities Fund
July 31, 2024
Federal Tax Information (Unaudited)
The Form 1099-DIV you receive in February 2025 will show the tax status of all distributions paid to your account in calendar year 2024. Shareholders are advised to consult their own tax adviser with respect to the tax consequences of their investment in the Fund. As required by the Internal Revenue Code and/or regulations, shareholders must be notified regarding the status of the foreign tax credit and 163(j) interest dividends.
Foreign Tax Credit. For the fiscal year ended July 31, 2024, the Fund paid foreign taxes of $1,278,150 and recognized foreign source income of $157,306,157.
163(j) Interest Dividends. For the fiscal year ended July 31, 2024, the Fund designates 100.00% of distributions from net investment income as a 163(j) interest dividend.
Eaton Vance
Emerging Markets Debt Opportunities Fund
July 31, 2024
Board of Directors’ Contract Approval
Overview of the Contract Review Process
The Investment Company Act of 1940, as amended (the “1940 Act”), provides, in substance, that the investment advisory agreement between a fund and its investment adviser will continue in effect from year-to-year only if its continuation is approved on an annual basis by a vote of the fund’s board of trustees, including a majority of the trustees who are not “interested persons” of the fund (“independent trustees”), cast in person at a meeting called for the purpose of considering such approval.
At a meeting held on June 6, 2024, the Boards of Trustees/Directors (collectively, the “Board”) that oversee the registered investment companies advised by Eaton Vance Management or its affiliate, Boston Management and Research (the “Eaton Vance Funds”), including a majority of the independent trustees (the “Independent Trustees”), voted to approve the continuation of existing investment advisory agreements and sub-advisory agreements1 for each of the Eaton Vance Funds for an additional one-year period. The Board relied upon the affirmative recommendation of its Contract Review Committee, which is a committee comprised of all of the Independent Trustees. Prior to making its recommendation, the Contract Review Committee reviewed information furnished by the adviser and sub-adviser to each of the Eaton Vance Funds (including information specifically requested by the Board) for a series of meetings held between April and June 2024, as well as certain additional information provided in response to specific requests from the Independent Trustees as members of the Contract Review Committee. Members of the Contract Review Committee also considered information received at prior meetings of the Board and its committees, to the extent such information was relevant to the Contract Review Committee’s annual evaluation of the investment advisory agreements and sub-advisory agreements.
In connection with its evaluation of the investment advisory agreements and sub-advisory agreements, the Board considered various information relating to the Eaton Vance Funds. This included information applicable to all or groups of Eaton Vance Funds, which is referenced immediately below, and information applicable to the particular Eaton Vance Fund covered by this report (each “Eaton Vance Fund” is referred to below as a “fund”). (For funds that invest through one or more underlying portfolios, references to “each fund” in this section may include information that was considered at the portfolio-level.)
Information about Fees, Performance and Expenses
• A report from an independent data provider comparing advisory and other fees paid by each fund to such fees paid by comparable funds, as identified by the independent data provider (“comparable funds”);
• A report from an independent data provider comparing each fund’s total expense ratio (and its components) to those of comparable funds;
• A report from an independent data provider comparing the investment performance of each fund (including, as relevant, total return data, income data, Sharpe ratios, and information ratios) to the investment performance of comparable funds and, as applicable, benchmark indices, over various time periods;
• In certain instances, data regarding investment performance relative to customized groups of peer funds and blended indices identified by the adviser in consultation with the Portfolio Management Committee of the Board (a committee exclusively comprised of Independent Trustees);
• Comparative information concerning the fees charged and services provided by the adviser and sub-adviser to each fund in managing other accounts (which may include other funds, collective investment trusts and institutional accounts) with the same or substantially similar investment objective as the fund and with a significant overlap in holdings based on criteria set by the Board, if any;
• Profitability analyses with respect to the adviser and sub-adviser to each of the funds;
Information about Portfolio Management and Trading
• Descriptions of the investment management services provided to each fund, as well as each of the funds’ investment strategies and policies;
• The procedures and processes used by the adviser to determine the value of fund assets, including, when necessary, the determination of “fair value” by the adviser in its role as each funds’ valuation designee and actions taken to monitor and test the effectiveness of such procedures and processes;
• Information about the policies and practices of each fund’s adviser and sub-adviser with respect to trading, including their processes for seeking best execution of portfolio transactions;
• Information about the allocation of brokerage transactions and the benefits, if any, received by the adviser and sub-adviser to each fund as a result of brokerage allocation, including, as applicable, information concerning the acquisition of research through client commission arrangements and policies with respect to “soft dollars”;
• Data relating to the portfolio turnover rate of each fund and related information regarding active management in the context of particular strategies;
Information about each Adviser and Sub-adviser
• Reports detailing the financial results and condition of the adviser and sub-adviser to each fund;
1 Not all Eaton Vance Funds have entered into a sub-advisory agreement with a sub-adviser. Accordingly, references to “sub-adviser” or “sub-advisory agreement” in this “Overview” section may not be applicable to the particular Eaton Vance Fund covered by this report. Eaton Vance Management and Boston Management and Research are referred to collectively as the “adviser.”
Eaton Vance
Emerging Markets Debt Opportunities Fund
July 31, 2024
Board of Directors’ Contract Approval — continued
• Information regarding the individual investment professionals whose responsibilities include portfolio management and investment research for the funds, and, for portfolio managers and certain other investment professionals, information relating to their responsibilities with respect to managing other funds and investment accounts, as applicable;
• Information regarding the adviser’s and its parent company’s (Morgan Stanley’s) efforts to retain and attract talented investment professionals, including in the context of a competitive marketplace for talent;
• Information regarding the adviser’s compensation methodology for its investment professionals and the incentives and accountability it creates, along with investment professionals’ investments in the fund(s) they manage;
• The personal trading codes of ethics of the adviser and its affiliates and the sub-adviser of each fund, together with information relating to compliance with, and the administration of, such codes;
• Policies and procedures relating to proxy voting, including regular reporting with respect to fund proxy voting activities;
• Information regarding the handling of corporate actions and class actions, as well as information regarding litigation and other regulatory matters;
• Information concerning the resources devoted to compliance efforts undertaken by the adviser and its affiliates and the sub-adviser of each fund, including descriptions of their various compliance programs and their record of compliance and remediation;
• Information concerning the business continuity and disaster recovery plans of the adviser and its affiliates and the sub-adviser of each fund;
• A description of the adviser’s oversight of sub-advisers, including with respect to regulatory and compliance issues, investment management and other matters;
Other Relevant Information
• Information regarding ongoing initiatives to further integrate and harmonize, where applicable, the investment management and other departments of the adviser and its affiliates with the overall investment management infrastructure of Morgan Stanley, in light of Morgan Stanley’s acquisition of Eaton Vance Corp. on March 1, 2021;
• Information concerning the nature, cost, and character of the administrative and other non-investment advisory services provided by the adviser and its affiliates;
• Information concerning oversight of the relationship with the custodian, subcustodians, fund accountants, and other third-party service providers by the adviser and/or administrator to each of the funds;
• Information concerning efforts to implement policies and procedures with respect to various regulations applicable to the funds, including Rule 12d1-4 (the Fund-of-Funds Rule), Rule 18f-4 (the Derivatives Rule), and Rule 2a-5 (the Fair Valuation Rule);
• For an Eaton Vance Fund structured as an exchange-listed closed-end fund, information concerning the benefits of the closed-end fund structure, as well as, where relevant, the closed-end fund’s market prices (including as compared to the closed-end fund’s net asset value (NAV)), trading volume data, continued use of auction preferred shares (where applicable), distribution rates, and other relevant matters;
• The risks that the adviser and/or its affiliates incur in connection with the management and operation of the funds, including, among others, litigation, regulatory, entrepreneurial, and other business risks (and the associated costs of such risks); and
• The terms of each investment advisory agreement and sub-advisory agreement.
During the various meetings of the Board and its committees over the course of the year leading up to the June 6, 2024 meeting, the Board and its committees received information from portfolio managers and other investment professionals of the adviser and sub-advisers of the funds regarding investment and performance matters, and considered various investment and trading strategies used in pursuing the funds’ investment objectives. The Board and its committees also received information regarding risk management techniques employed in connection with the management of the funds. The Board and its committees evaluated issues pertaining to industry and regulatory developments, compliance procedures, fund governance, and other issues with respect to the funds, and received and participated in reports and presentations provided by the adviser and sub-advisers, with respect to such matters. In addition to the formal meetings of the Board and its committees, the Independent Trustees held regular video or telephone conferences to discuss, among other topics, matters relating to the continuation of investment advisory agreements and sub-advisory agreements.
The Contract Review Committee was advised throughout the contract review process by Kirkland & Ellis LLP, independent legal counsel for the Independent Trustees. The members of the Contract Review Committee, with the advice of such counsel, exercised their own business judgment in determining the material factors to be considered in evaluating each investment advisory agreement and sub-advisory agreement and the weight to be given to each such factor. The conclusions reached with respect to each investment advisory agreement and sub-advisory agreement were based on a comprehensive evaluation of all the information provided and not any single factor. Moreover, each member of the Contract Review Committee may have placed varying emphasis on particular factors in reaching conclusions with respect to each investment advisory agreement and sub-advisory agreement. In evaluating each investment advisory agreement and sub-advisory agreement, including the fee structures and other terms contained in such agreements, the members of the Contract Review Committee were also informed by multiple years of analysis and discussion with the adviser and sub-adviser to each of the Eaton Vance Funds.
Eaton Vance
Emerging Markets Debt Opportunities Fund
July 31, 2024
Board of Directors’ Contract Approval — continued
Results of the Contract Review Process
Based on its consideration of the foregoing, and such other information it deemed relevant, including the factors and conclusions described below, the Contract Review Committee concluded that the continuation of the investment advisory and administrative agreement between Eaton Vance Emerging Markets Debt Opportunities Fund (the “Fund”) and Eaton Vance Management (the “Adviser”), including its fee structure, is in the interests of shareholders and, therefore, recommended to the Board approval of the agreement. Based on the recommendation of the Contract Review Committee, the Board, including a majority of the Independent Trustees, voted to approve continuation of the investment advisory and administrative agreement for the Fund.
Nature, Extent and Quality of Services
In considering whether to approve the investment advisory and administrative agreement for the Fund, the Board evaluated the nature, extent and quality of services provided to the Fund by the Adviser.
The Board considered the Adviser’s management capabilities and investment processes in light of the types of investments held by the Fund, including the education and experience of the investment professionals who provide services to the Fund, including recent changes to such personnel. In particular, the Board considered the abilities and experience of the Adviser’s investment professionals in investing in securities, derivatives and other instruments to establish long and short investment exposures to emerging markets, and investing in derivatives to establish short investment exposure to the euro. The Board also took into account the resources dedicated to portfolio management and other services, the compensation methods of the Adviser and other factors, including the reputation and resources of the Adviser to recruit and retain highly qualified research, advisory and supervisory investment professionals. In addition, the Board considered the time and attention devoted to the Eaton Vance Funds, including the Fund, by senior management, as well as the infrastructure, operational capabilities and support staff in place to assist in the portfolio management and operations of the Fund, including the provision of administrative services. The Board also considered the business-related and other risks to which the Adviser or its affiliates may be subject in managing the Fund.
The Board considered the compliance programs of the Adviser and relevant affiliates thereof. The Board considered compliance and reporting matters regarding, among other things, personal trading by investment professionals, disclosure of portfolio holdings, compliance with policies and procedures, portfolio valuation, business continuity and the allocation of investment opportunities. The Board also considered relevant examinations of the Adviser and its affiliates by regulatory authorities, such as the Securities and Exchange Commission and the Financial Industry Regulatory Authority.
The Board considered other administrative services provided or overseen by Eaton Vance Management and its affiliates, including transfer agency and accounting services. The Board evaluated the benefits to shareholders of investing in a fund that is a part of a large fund complex offering exposure to a variety of asset classes and investment disciplines, as well as the ability, in many cases, to exchange an investment among different funds without incurring additional sales charges.
After consideration of the foregoing factors, among others, the Board concluded that the nature, extent and quality of services provided by the Adviser, taken as a whole, are appropriate and consistent with the terms of the investment advisory and administrative agreement.
Fund Performance
The Board compared the Fund’s investment performance to that of comparable funds identified by an independent data provider (the peer group), as well as an appropriate benchmark index and a customized peer group of similarly managed funds. The Board’s review included comparative performance data with respect to the Fund for the one-, three- and five-year periods ended December 31, 2023. In this regard, the Board noted that the performance of the Fund was higher than the median performance of the Fund’s peer group and custom peer group for the three-year period. The Board also noted that the performance of the Fund was higher than its benchmark index for the three-year period. The Board concluded that the performance of the Fund was satisfactory.
Management Fees and Expenses
The Board considered contractual fee rates payable by the Fund for advisory and administrative services (referred to collectively as “management fees”). As part of its review, the Board considered the Fund’s management fees and total expense ratio for the one-year period ended December 31, 2023, as compared to those of comparable funds, before and after giving effect to any undertaking to waive fees or reimburse expenses. The Board also considered factors that had an impact on the Fund’s total expense ratio relative to comparable funds. The Board also received and considered information about the services offered and the fee rates charged by the Adviser to other types of accounts with the same or substantially similar investment objective as the Fund and with a significant overlap in holdings based on criteria set by the Board. For any such type of account, the Board received information about the differences in the nature and scope of services the Adviser provides to the Fund as compared to other type of account and the material differences in compliance, reporting and other legal burdens and risks to the Adviser as between the Fund and other type of account.
After considering the foregoing information, and in light of the nature, extent and quality of the services provided by the Adviser, the Board concluded that the management fees charged for advisory and related services are reasonable.
Eaton Vance
Emerging Markets Debt Opportunities Fund
July 31, 2024
Board of Directors’ Contract Approval — continued
Profitability and “Fall-Out” Benefits
The Board considered the level of profits realized by the Adviser and relevant affiliates thereof in providing investment advisory and administrative services to the Fund and to all Eaton Vance Funds as a group. The Board considered the level of profits realized without regard to marketing support or other payments by the Adviser and its affiliates to third parties in respect of distribution or other services.
The Board concluded that, in light of the foregoing factors and the nature, extent and quality of the services rendered, the profits realized by the Adviser and its affiliates are not excessive.
The Board also considered direct or indirect fall-out benefits received by the Adviser and its affiliates in connection with their respective relationships with the Fund, including the benefits of research services that may be available to the Adviser as a result of securities transactions effected for the Fund and other investment advisory clients.
Economies of Scale
In reviewing management fees and profitability, the Board also considered the extent to which the Adviser and its affiliates, on the one hand, and the Fund, on the other hand, can expect to realize benefits from economies of scale as the assets of the Fund increase. The Board acknowledged the difficulty in accurately measuring the benefits resulting from economies of scale, if any, with respect to the management of any specific fund or group of funds. To assist in the evaluation of the sharing of any economies of scale, the Board received data showing for recent years, asset levels, Adviser profitability and total expense ratios. Based upon the foregoing, the Board concluded that the Fund currently shares in the benefits from economies of scale, if any, when they are realized by the Adviser. The Board also concluded that the structure of the advisory fee, which includes breakpoints at several asset levels, will allow the Fund to continue to benefit from any economies of scale in the future.
This Page Intentionally Left Blank
This Page Intentionally Left Blank
This Page Intentionally Left Blank
Item 8. Changes in and Disagreements with Accountants for Open-End Management Investment Companies
Not applicable.
Item 9. Proxy Disclosures for Open-End Management Investment Companies
Not applicable.
Item 10. Remuneration Paid to Directors, Officers, and Others of Open-End Management Investment Companies
The information is disclosed as part of the Financial Statements included in Item 7 of this Form N-CSR.
Item 11. Statement Regarding Basis for Approval of Investment Advisory Contract
The information is included in Item 7 of this Form N-CSR.
Item 12. Disclosure of Proxy Voting Policies and Procedures for Closed-End Management Investment Companies
Not applicable.
Item 13. Portfolio Managers of Closed-End Management Investment Companies
Not applicable.
Item 14. Purchases of Equity Securities by Closed-End Management Investment Company and Affiliated Purchasers
Not applicable.
Item 15. Submission of Matters to a Vote of Security Holders
There have been no material changes to the procedures by which shareholders may recommend nominee to the Corporation’s Board of Directors since the Corporation last provided disclosure in response to this item.
Item 16. Controls and Procedures
| (a) | It is the conclusion of the registrant’s principal executive officer and principal financial officer that the effectiveness of the registrant’s current disclosure controls and procedures (such disclosure controls and procedures having been evaluated within 90 days of the date of this filing) provide reasonable assurance that the information required to be disclosed by the registrant has been recorded, processed, summarized and reported within the time period specified in the Commission’s rules and forms and that the information required to be disclosed by the registrant has been accumulated and communicated to the registrant’s principal executive officer and principal financial officer in order to allow timely decisions regarding required disclosure. |
| (b) | There have been no changes in the registrant’s internal controls over financial reporting during the period covered by this report that has materially affected, or is reasonably likely to materially affect, the registrant’s internal control over financial reporting. |
Item 17. Disclosure of Securities Lending Activities for Closed-End Management Investment Companies
Not applicable.
Item 18. Recovery of Erroneously Awarded Compensation
Not applicable.
Item 19. Exhibits
| (a)(1) | Registrant’s Code of Ethics – Not applicable (please see Item 2). |
Signatures
Pursuant to the requirements of the Securities Exchange Act of 1934 and the Investment Company Act of 1940, the registrant has duly caused this report to be signed on its behalf by the undersigned, thereunto duly authorized.
| | |
| Eaton Vance Series Fund, Inc. |
| |
| By: | | /s/ Kenneth A. Topping |
| | Kenneth A. Topping |
| | Principal Executive Officer |
| |
| Date: | | September 23, 2024 |
Pursuant to the requirements of the Securities Exchange Act of 1934 and the Investment Company Act of 1940, this report has been signed below by the following persons on behalf of the registrant and in the capacities and on the dates indicated.
| | |
| By: | | /s/ James F. Kirchner |
| | James F. Kirchner |
| | Principal Financial Officer |
| |
Date: | | September 23, 2024 |
| |
| By: | | /s/ Kenneth A. Topping |
| | Kenneth A. Topping |
| | Principal Executive Officer |
| |
Date: | | September 23, 2024 |