UNITED STATES
SECURITIES AND EXCHANGE COMMISSION
WASHINGTON, D.C. 20549
FORM 10-Q
|
| |
| ý | QUARTERLY REPORT PURSUANT TO SECTION 13 OR 15(d) OF THE SECURITIES EXCHANGE ACT OF 1934 |
For the Quarterly Period Ended March 31, 2015
OR |
| |
| o | TRANSITION REPORT PURSUANT TO SECTION 13 OR 15(d) OF THE SECURITIES EXCHANGE ACT OF 1934 |
For the transition period from to
JAVELIN MORTGAGE INVESTMENT CORP.
(Exact name of registrant as specified in its charter)
|
| | |
| Maryland | 001-35673 | 45-5517523 |
| (State or other jurisdiction of incorporation or organization) | (Commission File Number) | (I.R.S. Employer Identification No.) |
3001 Ocean Drive, Suite 201, Vero Beach, FL 32963
(Address of principal executive offices)(zip code)
(772) 617-4340
(Registrant’s telephone number, including area code)
Indicate by check mark whether the registrant (1) has filed all reports required to be filed by Section 13 or 15(d) of the Securities Exchange Act of 1934 during the preceding twelve months (or for such shorter period that the registrant was required to file such reports) and (2) has been subject to such filing requirements for the past 90 days. YES ý NO o
Indicate by check mark whether the registrant has submitted electronically and posted on its corporate Web site, if any, every Interactive Data File required to be submitted and posted pursuant to Rule 405 of Regulation S-T (§232.405 of this chapter) during the preceding twelve months (or for such shorter period that the registrant was required to submit and post such files). YES ý NO o
Indicate by check mark whether the registrant is a large accelerated filer, an accelerated filer, a non-accelerated filer or a smaller reporting company. See the definitions of "larger accelerated filer," "accelerated filer" and "smaller reporting company" in Rule 12b-2 of the Exchange Act.
Large accelerated filer o Accelerated filer ý Non-accelerated filer o Smaller reporting company o
Indicate by check mark whether the registrant is a shell company (as defined in Rule 12b-2 of the Act). YES o NO ý
The number of outstanding shares of the Registrant’s common stock as of May 1, 2015 was 11,991,742.
JAVELIN Mortgage Investment Corp. and Subsidiary
TABLE OF CONTENTS
JAVELIN Mortgage Investment Corp. and Subsidiary
CONDENSED CONSOLIDATED BALANCE SHEETS
(in thousands, except per share amounts)
(Unaudited)
PART I. FINANCIAL INFORMATION
Item 1. Financial Statements
|
| | | | | | | |
| | March 31, 2015 | | December 31, 2014 |
| Assets | | | |
| Cash | $ | 19,505 |
| | $ | 29,882 |
|
| Cash collateral posted to counterparties | 11,791 |
| | 3,209 |
|
| Agency Securities, available for sale, at fair value (including pledged securities of $758,261 and $1,071,298) | 759,732 |
| | 1,075,521 |
|
| Non-Agency Securities, trading, at fair value (including pledged securities of $201,315 and $158,931) | 201,315 |
| | 158,931 |
|
| Linked Transactions, net, at fair value (including pledged securities of $8,940 in 2014) | — |
| | 2,532 |
|
| Receivable for unsettled sales (including pledged securities of $151,130 in 2015) | 151,130 |
| | — |
|
| Derivatives, at fair value | 722 |
| | 7,321 |
|
| Accrued interest receivable | 2,322 |
| | 2,792 |
|
| Prepaid and other assets | 635 |
| | 713 |
|
| Total Assets | $ | 1,147,152 |
| | $ | 1,280,901 |
|
| Liabilities and Stockholders’ Equity | | | |
| Liabilities: | | | |
| Repurchase agreements | $ | 1,004,067 |
| | $ | 1,134,387 |
|
| Cash collateral posted by counterparties | 524 |
| | 2,876 |
|
| Derivatives, at fair value | 8,720 |
| | 2,603 |
|
| Accrued interest payable | 586 |
| | 696 |
|
| Accounts payable and other accrued expenses | 132 |
| | 731 |
|
| Total Liabilities | $ | 1,014,029 |
| | $ | 1,141,293 |
|
| | | | |
| Commitments and Contingencies (Note 11) |
| |
|
| | | | |
| Stockholders’ Equity: | | | |
| Preferred stock, $0.001 par value, 25,000 shares authorized and none issued and outstanding at March 31, 2015 and December 31, 2014. | — |
| | — |
|
| Common stock, $0.001 par value, 250,000 shares authorized, 11,991 shares and 11,985 shares issued and outstanding at March 31, 2015 and December 31, 2014. | 12 |
| | 12 |
|
| Additional paid-in capital | 243,937 |
| | 243,892 |
|
| Accumulated deficit | (123,399 | ) | | (112,899 | ) |
| Accumulated other comprehensive income | 12,573 |
| | 8,603 |
|
| Total Stockholders’ Equity | $ | 133,123 |
| | $ | 139,608 |
|
| Total Liabilities and Stockholders’ Equity | $ | 1,147,152 |
| | $ | 1,280,901 |
|
See notes to condensed consolidated financial statements.
JAVELIN Mortgage Investment Corp. and Subsidiary
CONDENSED CONSOLIDATED STATEMENTS OF OPERATIONS
(in thousands, except per share amounts)
(Unaudited)
|
| | | | | | | |
| | For the Quarter Ended |
| | March 31, 2015 | | March 31, 2014 |
| Interest Income: | | | |
| Agency Securities, net of amortization of premium | $ | 5,304 |
| | $ | 8,445 |
|
| Non-Agency Securities, including discount accretion | 2,697 |
| | 2,308 |
|
| Total Interest Income | $ | 8,001 |
|
| $ | 10,753 |
|
| Interest expense | (1,430 | ) | | (1,448 | ) |
| Net Interest Income | $ | 6,571 |
|
| $ | 9,305 |
|
| Other Income (Loss): | | | |
| Realized gain on sale of Agency Securities (reclassified from Other comprehensive income (loss)) | 4,271 |
| | 8,810 |
|
| Gain on Non-Agency Securities | 2,606 |
| | 833 |
|
| Unrealized net gain and net interest income from Linked Transactions | — |
| | 4,427 |
|
| Subtotal | $ | 6,877 |
|
| $ | 14,070 |
|
| Realized loss on derivatives (1) | (2,263 | ) | | (3,106 | ) |
| Unrealized loss on derivatives | (15,633 | ) | | (20,029 | ) |
| Subtotal | $ | (17,896 | ) |
| $ | (23,135 | ) |
| Total Other Loss | $ | (11,019 | ) |
| $ | (9,065 | ) |
| Expenses: | | | |
| Management fee | 901 |
| | 912 |
|
| Professional fees | 359 |
| | 742 |
|
| Insurance | 99 |
| | 110 |
|
| Board compensation | 179 |
| | 125 |
|
| Other | 199 |
| | 214 |
|
| Total Expenses | $ | 1,737 |
|
| $ | 2,103 |
|
| Net Loss | $ | (6,185 | ) | | $ | (1,863 | ) |
| Net loss per common share (Note 14) | $ | (0.52 | ) | | $ | (0.16 | ) |
| Dividends declared per common share | $ | 0.36 |
| | $ | 0.45 |
|
| Weighted average common shares outstanding | 11,985 |
| | 11,993 |
|
(1) Interest expense related to our interest rate swap contracts is recorded in realized losses on derivatives on the statements of operations. For additional information see Note 10 to the condensed consolidated financial statements.
See notes to condensed consolidated financial statements.
JAVELIN Mortgage Investment Corp. and Subsidiary
CONDENSED CONSOLIDATED STATEMENTS OF
COMPREHENSIVE INCOME (LOSS)
(in thousands)
(Unaudited)
|
| | | | | | | |
| | For the Quarter Ended |
| | March 31, 2015 | | March 31, 2014 |
| Net Loss | $ | (6,185 | ) | | $ | (1,863 | ) |
| Other comprehensive income (loss): | | | |
| Reclassification adjustment for realized gain on sale of available for sale Agency Securities | (4,271 | ) | | (8,810 | ) |
| Net unrealized gain on available for sale Agency Securities | 8,241 |
| | 5,298 |
|
| Other comprehensive income (loss) | $ | 3,970 |
|
| $ | (3,512 | ) |
| Comprehensive Loss | $ | (2,215 | ) |
| $ | (5,375 | ) |
See notes to condensed consolidated financial statements.
JAVELIN Mortgage Investment Corp.
CONDENSED CONSOLIDATED STATEMENTS OF STOCKHOLDERS’ EQUITY
(in thousands)
(Unaudited)
|
| | | | | | | | | | | | | | | | | | | | | | |
| | Shares | | Par Amount | | Additional Paid-In Capital | | Accumulated Deficit | | Accumulated Other Comprehensive Income | | Total |
| Balance, January 1, 2015 | 11,985 |
| | $ | 12 |
| | $ | 243,892 |
| | $ | (112,899 | ) | | $ | 8,603 |
| | $ | 139,608 |
|
| Common stock dividends declared | — |
| | — |
| | — |
| | (4,315 | ) | | — |
| | (4,315 | ) |
| Issuance of common stock, net | — |
| | — |
| | 1 |
| | — |
| | — |
| | 1 |
|
| Stock based compensation, net of withholding requirements | 6 |
| | — |
| | 44 |
| | — |
| | — |
| | 44 |
|
| Net loss | — |
| | — |
| | — |
| | (6,185 | ) | | — |
| | (6,185 | ) |
| Other comprehensive income | — |
| | — |
| | — |
| | — |
| | 3,970 |
| | 3,970 |
|
| Balance, March 31, 2015 | 11,991 |
|
| $ | 12 |
|
| $ | 243,937 |
|
| $ | (123,399 | ) |
| $ | 12,573 |
|
| $ | 133,123 |
|
See notes to condensed consolidated financial statements.
JAVELIN Mortgage Investment Corp. and Subsidiary
CONDENSED CONSOLIDATED STATEMENTS OF CASH FLOWS
(in thousands)
(Unaudited)
|
| | | | | | | |
| | For the Quarter Ended |
| | March 31, 2015 | | March 31, 2014 |
| Cash Flows From Operating Activities: | | | |
| Net loss | $ | (6,185 | ) | | $ | (1,863 | ) |
| Adjustments to reconcile net loss to net cash provided by operating activities: | | | |
| Net amortization of premium on Agency Securities | 1,032 |
| | 180 |
|
| Accretion of net discount on Non-Agency Securities | 24 |
| | (328 | ) |
| Net gain on Non-Agency Securities | (2,606 | ) | | (833 | ) |
| Realized gain on sale of Agency Securities | (4,271 | ) | | (8,810 | ) |
| Unrealized net gain and net interest income (loss) from Linked Transactions | — |
| | (4,427 | ) |
| Stock based compensation | 44 |
| | 45 |
|
| Changes in operating assets and liabilities: | | | |
| (Increase) decrease in accrued interest receivable | 470 |
| | (1,001 | ) |
| Increase in prepaid and other assets | 78 |
| | 50 |
|
| Increase in derivatives, at fair value | 12,716 |
| | 21,192 |
|
| Increase (decrease) in accrued interest payable | (134 | ) | | 67 |
|
| Decrease in accounts payable and other accrued expenses | (599 | ) | | (1,037 | ) |
| Net cash provided by operating activities | $ | 569 |
|
| $ | 3,235 |
|
| Cash Flows From Investing Activities: | | | |
| Purchases of Agency Securities | (128,908 | ) | | (826,539 | ) |
| Purchases of Non-Agency Securities | (34,596 | ) | | (1,250 | ) |
| Cash receipts on Linked Transactions | — |
| | 681 |
|
| Principal repayments of Agency Securities | 21,055 |
| | 14,534 |
|
| Principal repayments of Non-Agency Securities | 3,734 |
| | 3,400 |
|
| Proceeds from sales of Agency Securities | 279,721 |
| | 385,191 |
|
| Increase in cash collateral posted to/by counterparties | (10,934 | ) | | (19,223 | ) |
| Net cash provided by (used in) investing activities | $ | 130,072 |
|
| $ | (443,206 | ) |
| Cash Flows From Financing Activities: | | | |
| Issuance of common stock, net of expenses | 1 |
| | — |
|
| Proceeds from repurchase agreements | 1,464,434 |
| | 2,150,972 |
|
| Principal repayments on repurchase agreements | (1,601,138 | ) | | (1,714,584 | ) |
| Common stock dividends paid | (4,315 | ) | | (5,397 | ) |
| Net cash provided by (used in) financing activities | $ | (141,018 | ) |
| $ | 430,991 |
|
| Net decrease in cash | (10,377 | ) |
| (8,980 | ) |
| Cash - beginning of period | 29,882 |
| | 41,524 |
|
| Cash - end of period | $ | 19,505 |
|
| $ | 32,544 |
|
| Supplemental Disclosure: | | | |
| Cash paid during the period for interest | $ | 7,674 |
| | $ | 6,361 |
|
| Non-Cash Investing and Financing Activities: | | | |
| Receivable for unsettled sales | $ | 151,130 |
| | $ | 358,456 |
|
| Payable for unsettled purchases | $ | — |
| | $ | 312,447 |
|
| Net unrealized gain on available for sale Agency Securities | $ | 8,241 |
| | $ | 5,298 |
|
| Linked Transaction value of purchased Non-Agency Securities | $ | 2,532 |
| | $ | — |
|
See notes to condensed consolidated financial statements.
JAVELIN Mortgage Investment Corp. and Subsidiary
NOTES TO CONDENSED CONSOLIDATED FINANCIAL STATEMENTS
(in thousands, except per share amounts)
(Unaudited)
Note 1 - Basis of Presentation
The accompanying condensed consolidated financial statements have been prepared in accordance with generally accepted accounting principles in the United States (“GAAP”) for interim financial information and with the instructions to Form 10-Q and Rule 10-01 of Regulation S-X promulgated by the Securities and Exchange Commission (the “SEC”). Accordingly, they do not include all of the information and footnotes required by GAAP for complete financial statements. In the opinion of management, all adjustments (consisting of normal recurring accruals) considered necessary for a fair presentation have been included. Operating results for the quarter ended March 31, 2015 are not necessarily indicative of the results that may be expected for the calendar year ending December 31, 2015. These unaudited financial statements should be read in conjunction with the audited financial statements and notes thereto included in our annual report on Form 10-K for the year ended December 31, 2014.
The condensed consolidated financial statements include the accounts of JAVELIN Mortgage Investment Corp. and its subsidiary. All intercompany accounts and transactions have been eliminated. The preparation of financial statements in conformity with GAAP requires management to make estimates and assumptions that affect the reported amounts of assets and liabilities and disclosure of contingent assets and liabilities at the date of the financial statements and the reported amounts of revenues and expenses during the reporting period. Actual results could differ from those estimates. Significant estimates affecting the accompanying condensed consolidated financial statements include the valuation of Agency Securities (as defined below) and derivative instruments.
Note 2 - Organization and Nature of Business Operations
References to “we,” “us,” “our,” "JAVELIN" or the “Company” are to JAVELIN Mortgage Investment Corp. References to "ACM" are to ARMOUR Capital Management LP, a Delaware limited partnership, formerly known as ARMOUR Residential Management LLC. On December 19, 2014, ARMOUR Residential Management LLC, our external manager under the Management Agreement (as defined below), changed its name to ARMOUR Capital Management LP and converted from a Delaware limited liability company to a Delaware limited partnership, and continued as the manager under the same Management Agreement (the "Conversion").
We are an externally managed Maryland corporation managed by ACM, an investment advisor registered with the SEC (see Note 11, “Commitments and Contingencies” and Note 16, “Related Party Transactions” for additional discussion). We invest primarily in fixed rate and hybrid adjustable rate mortgage backed securities. Some of these securities may be issued or guaranteed by a United States (“U.S.”) Government-sponsored entity (“GSE”), such as the Federal National Mortgage Association (Fannie Mae), the Federal Home Loan Mortgage Corporation (Freddie Mac), or guaranteed by the Government National Mortgage Administration (Ginnie Mae) (collectively, “Agency Securities”). Other securities backed by residential mortgages in which we invest, for which the payment of principal and interest is not guaranteed by a GSE or government agency (collectively, “Non-Agency Securities” and together with Agency Securities, “MBS”), may benefit from credit enhancement derived from structural elements such as subordination, over collateralization or insurance. We also may invest in collateralized commercial mortgage backed securities and other mortgage related investments, including mortgage loans, mortgage related derivatives and mortgage servicing rights. From time to time, a portion of our assets may be invested in unsecured notes and bonds issued by GSEs, U.S. Treasuries and money market instruments, subject to certain income tests we must satisfy for our qualification as a real estate investment trust (“REIT”). Our charter permits us to invest in Agency Securities and Non-Agency Securities.
We have elected to be taxed as a REIT under the Internal Revenue Code (the “Code”). Our qualification as a REIT depends on our ability to meet, on a continuing basis, various complex requirements under the Code relating to, among other things, the sources of our gross income, the composition and values of our assets, our distribution levels and the concentration of ownership of our capital stock. We believe that we are organized in conformity with the requirements for qualification as a REIT under the Code and our manner of operations enables us to meet the requirements for taxation as a REIT for federal income tax purposes.
As a REIT, we will generally not be subject to federal income tax on the taxable REIT income that we currently distribute to our stockholders. If we fail to qualify as a REIT in any taxable year and do not qualify for certain statutory relief provisions, we will be subject to federal income tax at regular corporate rates. Even if we qualify as a REIT for federal income tax purposes, we may still be subject to some federal, state and local taxes on our income.
JAVELIN Mortgage Investment Corp. and Subsidiary
NOTES TO CONDENSED CONSOLIDATED FINANCIAL STATEMENTS
(in thousands, except per share amounts)
(Unaudited)
Note 3 - Summary of Significant Accounting Policies
Cash
Cash includes cash on deposit with financial institutions. We may maintain deposits in federally insured financial institutions in excess of federally insured limits. However, management believes we are not exposed to significant credit risk due to the financial position and creditworthiness of the depository institutions in which those deposits are held.
Cash Collateral Posted To/By Counterparties
Cash collateral posted to/by counterparties represents cash posted by us to counterparties or posted by counterparties to us as collateral for our interest rate swap contracts (including swaptions) and repurchase agreements on our MBS.
MBS, at Fair Value
We generally intend to hold most of our MBS for extended periods of time. We may, from time to time, sell any of our MBS as part of the overall management of our MBS portfolio. Management determines the appropriate classifications of the securities at the time they are acquired and evaluates the appropriateness of such classifications at each balance sheet date.
Purchases and sales of our MBS are recorded on the trade date. However, in 2014, if on the purchase settlement date, a repurchase agreement was used to finance the purchase of an MBS with the same counterparty and such transaction was determined to be linked, then the MBS and linked repurchase borrowing were reported on the same settlement date as Linked Transactions (see below).
Agency Securities, Available For Sale
At March 31, 2015 and December 31, 2014, all of our Agency Securities were classified as available for sale securities. Agency Securities classified as available for sale are reported at their estimated fair values with unrealized gains and losses excluded from earnings and reported as part of the statements of comprehensive income (loss).
We evaluate Agency Securities for other than temporary impairment at least on a quarterly basis and more frequently when economic or market concerns warrant such evaluation. We consider an impairment to be other than temporary if we (1) have the intent to sell the Agency Securities, (2) believe it is more likely than not that we will be required to sell the securities before recovery (for example, because of liquidity requirements or contractual obligations) or (3) a credit loss exists. Impairment losses recognized establish a new cost basis for the related Agency Securities.
Non-Agency Securities, Trading
At March 31, 2015 and December 31, 2014, all of our Non-Agency Securities were classified as trading securities. Non-Agency Securities classified as trading are reported at their estimated fair values with unrealized gains and losses included in other income (loss) as a component of the statements of operations. We estimate future cash flows for each Non-Agency Security and then discount those cash flows based on our estimates of current market yield for each individual security. We then compare our calculated price with our pricing services and/or dealer marks. Our estimates for future cash flows and current market yields incorporate such factors as coupons, prepayment speeds, defaults, delinquencies and severities.
Receivables and Payables for Unsettled Sales and Purchases
We account for purchases and sales of securities on the trade date, including purchases and sales for forward settlement. Receivables and payables for unsettled trades represent the agreed trade price times the outstanding balance of the securities at the balance sheet date.
Accrued Interest Receivable and Payable
Accrued interest receivable includes interest accrued between payment dates on MBS. Accrued interest payable includes interest payable on our repurchase agreements.
JAVELIN Mortgage Investment Corp. and Subsidiary
NOTES TO CONDENSED CONSOLIDATED FINANCIAL STATEMENTS
(in thousands, except per share amounts)
(Unaudited)
Repurchase Agreements
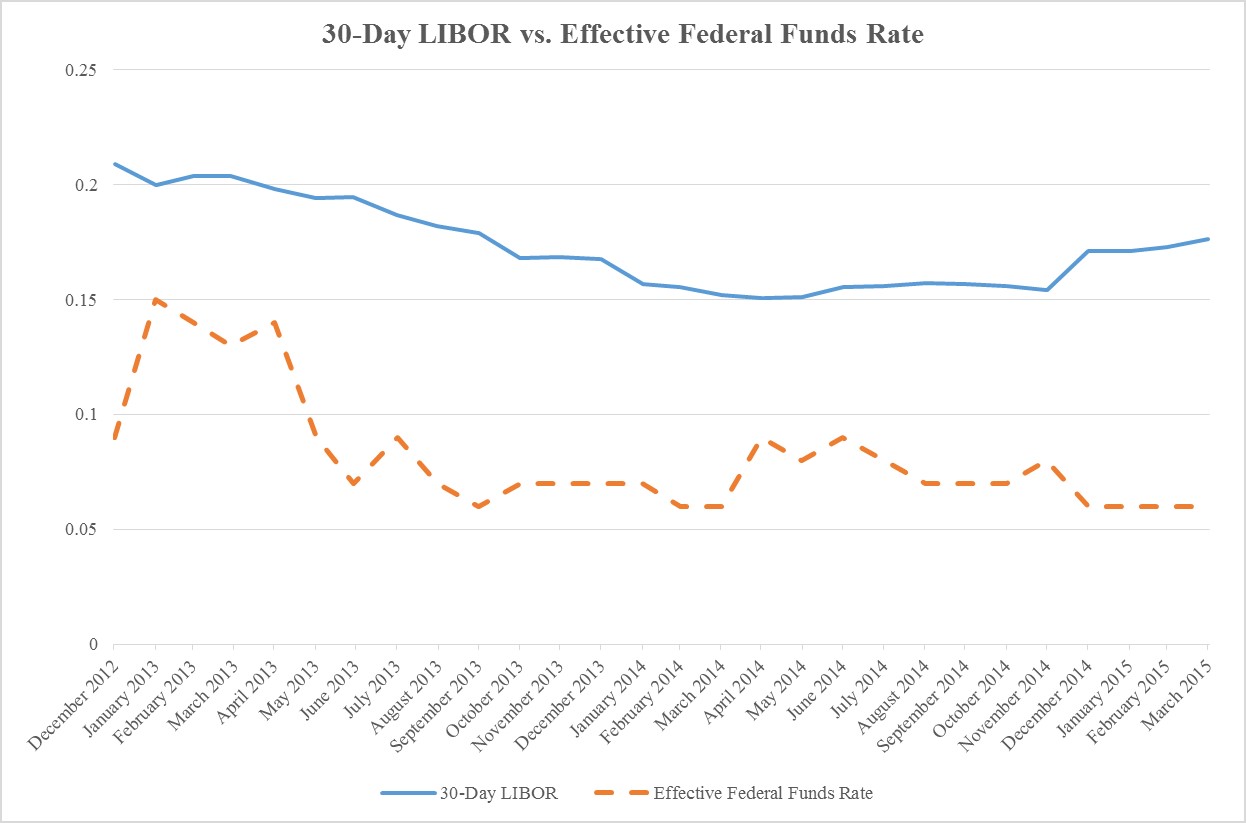
We finance the acquisition of our MBS through the use of repurchase agreements. Our repurchase agreements are secured by our MBS and bear interest rates that have historically moved in close relationship to the Federal Funds Rate and the London Interbank Offered Rate (“LIBOR”). Under these repurchase agreements, we sell MBS to a lender and agree to repurchase the same MBS in the future for a price that is higher than the original sales price. The difference between the sales price that we receive and the repurchase price that we pay represents interest paid to the lender. A repurchase agreement operates as a financing arrangement (with the exception of repurchase agreements accounted for as a component of a Linked Transaction described below) under which we pledge our MBS as collateral to secure a loan which is equal in value to a specified percentage of the estimated fair value of the pledged collateral. We retain beneficial ownership of the pledged collateral. At the maturity of a repurchase agreement, we are required to repay the loan and concurrently receive back our pledged collateral from the lender or, with the consent of the lender, we may renew such agreement at the then prevailing interest rate. The repurchase agreements may require us to pledge additional assets to the lender in the event the estimated fair value of the existing pledged collateral declines.
In addition to the repurchase agreement financing discussed above we have entered into reverse repurchase agreements with certain of our repurchase agreement counterparties. Under a typical reverse repurchase agreement, we purchase U.S. Treasury Securities from a borrower in exchange for cash and agree to sell the same securities in the future in exchange for a price that is higher than the original purchase price. The difference between the purchase price originally paid and the sale price represents interest received from the borrower. Reverse repurchase agreement receivables and repurchase agreement liabilities are presented net when they meet certain criteria, including being with the same counterparty, being governed by the same master repurchase agreement ("MRA"), settlement through the same brokerage or clearing account and maturing on the same day. We did not have any reverse repurchase agreements outstanding at March 31, 2015 or December 31, 2014.
Obligations to Return Securities Received as Collateral, at Fair Value
At certain times, we also sell to third parties the U.S. Treasury Securities received as collateral for reverse repurchase agreements and recognize the resulting obligation to return said U.S. Treasury Securities as a liability on our condensed consolidated balance sheets. Interest is recorded on the repurchase agreements, reverse repurchase agreements and U.S. Treasury Securities sold short on an accrual basis and presented as net interest expense. Both parties to the transaction have the right to make daily margin calls based on changes in the fair value of the collateral received and/or pledged. We did not have any obligations to return securities received as collateral at March 31, 2015 or December 31, 2014.
Derivatives, at Fair Value
We recognize all derivatives as either assets or liabilities at fair value on our condensed consolidated balance sheets. All changes in the fair values of our derivatives are reflected in our condensed consolidated statements of operations. We designate derivatives as hedges for tax purposes and any unrealized derivative gains or losses would not affect our distributable net taxable income.
Linked Transactions
Through December 31, 2014, the initial purchase of Non-Agency Securities and the related contemporaneous repurchase financing of such MBS with the same counterparty were considered part of the same arrangement, or a “Linked Transaction,” when certain criteria were met. Our acquisition of a Non-Agency Security and a related repurchase financing provided by the seller are generally considered to be linked if the initial transfer of and repurchase financing are contractually contingent, or there is a limited secondary market for the purchased security. The components of a Linked Transaction are evaluated on a combined basis and in totality, accounted for as a forward contract and reported as “Linked Transactions” on our balance sheets. Changes in the fair value of the Non-Agency Securities and repurchase liabilities underlying the Linked Transactions and associated interest income and expense are reported as “unrealized net gains/(losses) and net interest income (loss) from Linked Transactions” on our statements of operations and are not included in other comprehensive income (loss). When the linking criteria are no longer met, the initial transfer (i.e., the purchase of a security) and repurchase financing will no longer be treated as a Linked Transaction and will be evaluated and reported separately as a MBS purchase and repurchase financing. See Note 4, "Recent Accounting Pronouncements."
JAVELIN Mortgage Investment Corp. and Subsidiary
NOTES TO CONDENSED CONSOLIDATED FINANCIAL STATEMENTS
(in thousands, except per share amounts)
(Unaudited)
Preferred Stock
At March 31, 2015, we were authorized to issue up to 25,000 shares of preferred stock, par value $0.001 per share, with such designations, voting and other rights and preferences as may be determined from time to time by our Board of Directors ("Board") or a committee thereof. We have not issued any preferred stock to date.
Common Stock
At March 31, 2015, we were authorized to issue up to 250,000 shares of common stock, par value $0.001 per share, with such designations, voting and other rights and preferences as may be determined from time to time by our Board. We had 11,991 shares of common stock issued and outstanding at March 31, 2015 and 11,985 issued and outstanding at December 31, 2014.
Common Stock Repurchased
On March 5, 2014, our Board increased the authorization under the Repurchase Program to 3,000 shares of our common stock outstanding (the “Repurchase Program”). Under the Repurchase Program, shares may be purchased in the open market, including block trades, through privately negotiated transactions, or pursuant to a trading plan separately adopted in the future. The timing, manner, price and amount of any repurchases will be at our discretion, subject to the requirements of the Securities Exchange Act of 1934, as amended, and related rules. We are not required to repurchase any shares under the Repurchase Program and it may be modified, suspended or terminated at any time for any reason. We do not intend to purchase shares from our Board or other affiliates. Under Maryland law, such repurchased shares are treated as authorized but unissued. During the quarter ended March 31, 2015, we did not repurchase any shares of our common stock under the Repurchase Program. At March 31, 2015, there were 1,439 authorized shares remaining under our Repurchase Program.
Revenue Recognition
Interest income is earned and recognized on Agency Securities based on their unpaid principal amounts and their contractual terms. Recognition of interest income commences on the settlement date of the purchase transaction and continues through the settlement date of the sale transaction. Premiums and discounts associated with the purchase of Multi-Family MBS, which are generally not subject to prepayment, are amortized or accreted into interest income over the contractual lives of the securities using a level yield method. Premiums and discounts associated with the purchase of other Agency Securities are amortized or accreted into interest income over the actual lives of the securities, reflecting actual prepayments as they occur.
Interest income on Non-Agency Securities is recognized using the effective yield method over the life of the securities based on the future cash flows expected to be received. Future cash flow projections and related effective yields are determined for each security and updated quarterly. Other than temporary impairments, which establish a new cost basis in the security for purposes of calculating effective yields, are recognized when the fair value of a security is less than its cost basis and there has been an adverse change in the future cash flows expected to be received. Other changes in future cash flows expected to be received are recognized prospectively over the remaining life of the security.
Comprehensive Income (Loss)
Comprehensive income (loss) refers to changes in equity during a period from transactions and other events and circumstances from non-owner sources. It includes all changes in equity during a period, except those resulting from investments by owners and distributions to owners.
Note 4 - Recent Accounting Pronouncements
In June 2014, the Financial Accounting Standards Board released ASU No. 2014-11, Repurchase-to-Maturity Transactions, Repurchase Financings, and Disclosures, Transfers and Servicing (Topic 860). The amendment changed the accounting for repurchase financing transactions, that is, a transfer of a financial asset financed by a repurchase agreement with the same counterparty. In 2014, certain of these transactions were combined and accounted for as a forward contract and are reported as "Linked Transactions" on our balance sheet. Under the amendment, these arrangements are no longer presented as Linked Transactions on our condensed consolidated balance sheet but are instead accounted for from inception as purchases of Non-Agency trading securities and repurchase agreement liabilities.
JAVELIN Mortgage Investment Corp. and Subsidiary
NOTES TO CONDENSED CONSOLIDATED FINANCIAL STATEMENTS
(in thousands, except per share amounts)
(Unaudited)
The amendment also changes the accounting for repurchase-to-maturity transactions to secured borrowing accounting. We do not currently have, and do not contemplate having, repurchase-to-maturity transactions.
The accounting changes were effective for the Company beginning on January 1, 2015, early adoption was prohibited. In 2014, we continue to account for Linked Transactions and Non-Agency Securities all on a fair value basis. Accordingly, the adoption of this amendment has had no effect on our results of operations or our accumulated deficit.
The amendment also requires certain additional disclosures about repurchase agreements beginning with our second quarter 2015 condensed consolidated financial statements.
Note 5 - Fair Value of Financial Instruments
Our valuation techniques for financial instruments use observable and unobservable inputs. Observable inputs reflect readily obtainable data from third party sources, while unobservable inputs reflect management’s market assumptions. The Accounting Standards Codification Topic No. 820 “Fair Value Measurement,” classifies these inputs into the following hierarchy:
Level 1 Inputs - Quoted prices for identical instruments in active markets.
Level 2 Inputs - Quoted prices for similar instruments in active markets; quoted prices for identical or similar instruments in markets that are not active; and model-derived valuations whose inputs are observable or whose significant value drivers are observable.
Level 3 Inputs - Prices determined using significant unobservable inputs. Unobservable inputs may be used in situations where quoted prices or observable inputs are unavailable (for example, when there is little or no market activity for an investment at the end of the period). Unobservable inputs reflect management’s assumptions about the factors that market participants would use in pricing an asset or liability, and would be based on the best information available.
The following describes the valuation techniques used for our assets and liabilities measured at fair value, as well as the general classification of such instruments pursuant to the valuation hierarchy. Any transfers between levels are assumed to occur at the beginning of the reporting period.
Cash - Cash includes cash on deposit with financial institutions. The carrying amount of cash is deemed to be its fair value and is classified as Level 1. Cash balances posted by us to counterparties or posted by counterparties to us as collateral are classified as Level 2 because they are integrally related to the Company's repurchase financing and interest rate swap agreements, which are classified as Level 2.
Agency Securities, Available for Sale - Fair value for the Agency Securities in our MBS portfolio is based on obtaining a valuation for each Agency Security from third party pricing services and/or dealer quotes. The third party pricing services use common market pricing methods that may include pricing models that may incorporate such factors as coupons, prepayment speeds, spread to the Treasury curves and interest rate swap curves, duration, periodic and life caps and credit enhancement. If the fair value of an Agency Security is not available from the third party pricing services or such data appears unreliable, we obtain quotes from up to three dealers who make markets in similar Agency Securities. In general, the dealers incorporate common market pricing methods, including a spread measurement to the Treasury curve or interest rate swap curve as well as underlying characteristics of the particular Agency Security including coupon, periodic and life caps, collateral type, rate reset period and seasoning or age of the Agency Security. Management reviews pricing used to ensure that current market conditions are properly reflected. This review includes, but is not limited to, comparisons of similar market transactions or alternative third party pricing services, dealer quotes and comparisons to a third party pricing model. Fair values obtained from the third party pricing services for similar instruments are classified as Level 2 securities if the inputs to the pricing models used are consistent with the Level 2 definition. If quoted prices for a security are not reasonably available from the third party pricing service, but dealer quotes are, the security will be classified as a Level 2 security. If neither is available, management will determine the fair value based on characteristics of the security that we receive from the issuer and based on available market information received from dealers and classify it as a Level 3 security. At March 31, 2015 and December 31, 2014, all of our Agency Security fair values are classified as Level 2 based on the inputs used by our third party pricing services and dealer quotes.
Non-Agency Securities Trading - The fair value for the Non-Agency Securities in our MBS portfolio is based on estimates prepared by our Portfolio Management group, which organizationally reports to our Chief Investment Officer. In preparing the
JAVELIN Mortgage Investment Corp. and Subsidiary
NOTES TO CONDENSED CONSOLIDATED FINANCIAL STATEMENTS
(in thousands, except per share amounts)
(Unaudited)
estimates, our Portfolio Management group uses commercially available and proprietary models and data as well as market intelligence gained from discussions with, and transactions by, other market participants. We estimate the fair value of our Non-Agency Securities by estimating the future cash flows for each Non-Agency Security and then discounting those cash flows based on our estimates of current market yield for each individual security. Our estimates for future cash flows and current market yields incorporate such factors as collateral type, bond structure and priority of payments, coupons, prepayment speeds, defaults, delinquencies and severities. Quarterly, we compare our estimates of fair value of our Non-Agency Securities with pricing from third party pricing services, dealer marks received and recent purchase and financing transaction history to validate our assumptions of cash flow and market yield and calibrate our models. Fair values calculated in this manner are considered Level 3. At March 31, 2015 and December 31, 2014, all of our Non-Agency Security fair values are calculated in this manner and therefore were classified as Level 3.
Linked Transactions - Through December 31, 2014, the Non-Agency Securities underlying our Linked Transactions were valued using similar techniques to those used for our other Non-Agency Securities. The value of the underlying Non-Agency Security was then netted against the carrying amount (which approximated fair value) of the repurchase agreement at the valuation date. The fair value of Linked Transactions also included accrued interest receivable on the Non-Agency Security and accrued interest payable on the underlying repurchase agreement. Our Linked Transactions were classified as Level 3 at December 31, 2014.
Receivables and Payables for Unsettled Sales and Purchases- The carrying amount is generally deemed to be fair value because of the relatively short time to settlement. Such receivables and payables are classified as Level 2 because they are effectively secured by the related securities and could potentially be subject to counterparty credit considerations.
Repurchase Agreements - The fair value of repurchase agreements reflects the present value of the contractual cash flows discounted at the estimated LIBOR based market interest rates at the valuation date for repurchase agreements with a term equivalent to the remaining term to interest rate repricing, which may be at maturity, of our repurchase agreements. The fair value of the repurchase agreements approximates their carrying amount due to the short-term nature of these financial instruments. Our repurchase agreements are classified as Level 2.
Obligations to Return Securities Received as Collateral - The fair value of the obligations to return securities received as collateral are based upon the prices of the related U.S. Treasury Securities obtained from a third party pricing service, which are indicative of market activity. Such obligations are classified as Level 1.
Derivative Transactions - The fair values of our interest rate swap contracts and interest rate swaptions are valued using information provided by third party pricing services that may incorporate current interest rate curves, forward interest rate curves and market spreads to interest rate curves. Management compares pricing information received to dealer quotes to ensure that the current market conditions are properly reflected. The fair values of our interest rate swap contracts and our interest rate swaptions are classified as Level 2.
The following tables provide a summary of our assets and liabilities that are measured at fair value on a recurring basis at March 31, 2015 and December 31, 2014.
|
| | | | | | | | | | | | | | | |
| | Quoted Prices in Active Markets for Identical Assets (Level 1) | | Significant Observable Inputs (Level 2) | | Significant Unobservable Inputs (Level 3) | | Balance at March 31, 2015 |
| Assets at Fair Value: | |
| | |
| | |
| | |
|
| Agency Securities, available for sale | $ | — |
| | $ | 759,732 |
| | $ | — |
| | $ | 759,732 |
|
| Non-Agency Securities, trading | $ | — |
| | $ | — |
| | $ | 201,315 |
| | $ | 201,315 |
|
| Derivatives | $ | — |
| | $ | 722 |
| | $ | — |
| | $ | 722 |
|
| Liabilities at Fair Value: | | | | | |
| | |
|
| Derivatives | $ | — |
| | $ | 8,720 |
| | $ | — |
| | $ | 8,720 |
|
JAVELIN Mortgage Investment Corp. and Subsidiary
NOTES TO CONDENSED CONSOLIDATED FINANCIAL STATEMENTS
(in thousands, except per share amounts)
(Unaudited)
There were no transfers of assets or liabilities between Levels of the fair value hierarchy during the quarter ended March 31, 2015.
|
| | | | | | | | | | | | | | | |
| | Quoted Prices in Active Markets for Identical Assets (Level 1) | | Significant Observable Inputs (Level 2) | | Significant Unobservable Inputs (Level 3) | | Balance, December 31, 2014 |
| Assets at Fair Value: | |
| | |
| | |
| | |
|
| Agency Securities, available for sale | $ | — |
| | $ | 1,075,521 |
| | $ | — |
| | $ | 1,075,521 |
|
| Non-Agency Securities, trading | $ | — |
| | $ | — |
| | $ | 158,931 |
| | $ | 158,931 |
|
| Linked Transactions, net | $ | — |
| | $ | — |
| | $ | 2,532 |
| | $ | 2,532 |
|
| Derivatives | $ | — |
| | $ | 7,321 |
| | $ | — |
| | $ | 7,321 |
|
| Liabilities at Fair Value: | |
| | | | |
| | |
|
| Derivatives | $ | — |
| | $ | 2,603 |
| | $ | — |
| | $ | 2,603 |
|
There were no transfers of assets or liabilities between Levels of the fair value hierarchy during the year ended December 31, 2014.
The following tables provide a summary of the carrying values and fair values of our financial assets and liabilities not carried at fair value but for which fair value is required to be disclosed at March 31, 2015 and December 31, 2014. |
| | | | | | | | | | | | | | | | | | | |
| | March 31, 2015 | | Fair Value Measurements using: |
| | Carrying Value | | Fair Value | | Quoted Prices in Active Markets for Identical Assets (Level 1) | | Significant Observable Inputs (Level 2) | | Significant Unobservable Inputs (Level 3) |
| Financial Assets: | | | | | | | | | |
| Cash | $ | 19,505 |
| | $ | 19,505 |
| | $ | 19,505 |
| | $ | — |
| | $ | — |
|
| Cash collateral posted to counterparties | $ | 11,791 |
| | $ | 11,791 |
| | $ | — |
| | $ | 11,791 |
| | $ | — |
|
| Receivable for unsettled sales | $ | 151,130 |
| | $ | 151,130 |
| | $ | — |
| | $ | 151,130 |
| | $ | — |
|
| Accrued interest receivable | $ | 2,322 |
| | $ | 2,322 |
| | $ | — |
| | $ | 2,322 |
| | $ | — |
|
| Financial Liabilities: | | | |
| | |
| | | | — |
|
| Repurchase agreements | $ | 1,004,067 |
| | $ | 1,004,067 |
| | $ | — |
| | $ | 1,004,067 |
| | $ | — |
|
| Cash collateral posted by counterparties | $ | 524 |
| | $ | 524 |
| | $ | — |
| | $ | 524 |
| | $ | — |
|
| Accrued interest payable | $ | 586 |
| | $ | 586 |
| | $ | — |
| | $ | 586 |
| | $ | — |
|
JAVELIN Mortgage Investment Corp. and Subsidiary
NOTES TO CONDENSED CONSOLIDATED FINANCIAL STATEMENTS
(in thousands, except per share amounts)
(Unaudited)
|
| | | | | | | | | | | | | | | | | | | |
| | December 31, 2014 | | Fair Value Measurements using: |
| | Carrying Value | | Fair Value | | Quoted Prices in Active Markets for Identical Assets (Level 1) | | Significant Observable Inputs (Level 2) | | Significant Unobservable Inputs (Level 3) |
| Financial Assets: | | | | | | | | | |
| Cash | $ | 29,882 |
| | $ | 29,882 |
| | $ | 29,882 |
| | $ | — |
| | $ | — |
|
| Cash collateral posted to counterparties | $ | 3,209 |
| | $ | 3,209 |
| | $ | — |
| | $ | 3,209 |
| | $ | — |
|
| Accrued interest receivable | $ | 2,792 |
| | $ | 2,792 |
| | $ | — |
| | $ | 2,792 |
| | $ | — |
|
| Financial Liabilities: | |
| | |
| | |
| | |
| | |
|
| Repurchase agreements | $ | 1,134,387 |
| | $ | 1,134,387 |
| | $ | — |
| | $ | 1,134,387 |
| | $ | — |
|
| Cash collateral posted by counterparties | $ | 2,876 |
| | $ | 2,876 |
| | $ | — |
| | $ | 2,876 |
| | $ | — |
|
| Accrued interest payable | $ | 696 |
| | $ | 696 |
| | $ | — |
| | $ | 696 |
| | $ | — |
|
The following tables provide a summary of the changes in Level 3 assets measured at fair value on a recurring basis at March 31, 2015 and December 31, 2014.
|
| | | | | | | |
| Non-Agency Securities | For the Quarter Ended
March 31, 2015 | | For the Year Ended December 31, 2014 |
| Balance, beginning of period | $ | 158,931 |
| | $ | 143,399 |
|
| Purchases of Non-Agency Securities, at cost | 34,596 |
| | 32,397 |
|
| Principal repayments of Non-Agency Securities | (3,734 | ) | | (15,494 | ) |
| Proceeds from the sale of Non-Agency Securities | — |
| | (9,757 | ) |
| Gain on Non-Agency Securities | 2,606 |
| | 559 |
|
| Linked Transactions value of purchased Non-Agency Securities | 2,532 |
| | 7,281 |
|
| Linked Transactions liabilities recognized | 6,408 |
| | — |
|
| Discount accretion | (24 | ) | | 546 |
|
| Balance, end of period | $ | 201,315 |
| | $ | 158,931 |
|
| Gain on Non-Agency Securities | $ | 2,606 |
| | $ | 559 |
|
|
| | | | | | | |
| Linked Transactions | For the Quarter Ended
March 31, 2015 | | For the Year Ended December 31, 2014 |
| Balance, beginning of period | $ | 2,532 |
| | $ | 16,322 |
|
| Linked Transaction value of purchased Non-Agency Securities | (2,532 | ) | | (7,281 | ) |
| Cash receipts on Linked Transactions | — |
| | (16,839 | ) |
| Unrealized net gain and net interest income (loss) from Linked Transactions | — |
| | 10,330 |
|
| Balance, end of period | $ | — |
| | $ | 2,532 |
|
| Gain on Linked Transactions | $ | — |
| | $ | 10,330 |
|
JAVELIN Mortgage Investment Corp. and Subsidiary
NOTES TO CONDENSED CONSOLIDATED FINANCIAL STATEMENTS
(in thousands, except per share amounts)
(Unaudited)
The significant unobservable inputs used in the fair value measurement of our Level 3 Non-Agency Securities (inclusive of Non-Agency Securities underlying Linked Transactions though December 31, 2014) include assumptions for underlying loan collateral, cumulative default rates and loss severities in the event of default, as well as discount rates.
The following tables present the range of our estimates of cumulative default and loss severities, together with the discount rates implicit in our Level 3 Non-Agency Security fair values at March 31, 2015 and December 31, 2014 (inclusive of Non-Agency Securities underlying Linked Transactions), respectively. See Note 8, "Linked Transaction" for additional discussion of Non-Agency Securities that are accounted for as a component of Linked Transactions through December 31, 2014.
March 31, 2015
|
| | | | | | | | | |
| Unobservable Level 3 Input | | Minimum | | Weighted Average | | Maximum |
| Cumulative default | | 0.00 | % | | 21.46 | % | | 67.30 | % |
| Loss severity (life) | | 19.10 | % | | 46.44 | % | | 70.20 | % |
| Discount rate | | 3.54 | % | | 5.46 | % | | 5.50 | % |
| Delinquency (life) | | 0.00 | % | | 15.54 | % | | 53.60 | % |
| Voluntary prepayments (life) | | 1.00 | % | | 8.85 | % | | 17.56 | % |
December 31, 2014
|
| | | | | | | | | |
| Unobservable Level 3 Input | | Minimum | | Weighted Average | | Maximum |
| Cumulative default | | 0.00 | % | | 14.98 | % | | 47.89 | % |
| Loss severity (life) | | 18.80 | % | | 57.15 | % | | 100.00 | % |
| Discount rate | | 4.60 | % | | 5.44 | % | | 6.50 | % |
| Delinquency (life) | | 0.00 | % | | 13.51 | % | | 46.30 | % |
| Voluntary prepayments (life) | | 5.20 | % | | 9.02 | % | | 15.50 | % |
The tables above include the effects of the structural elements of our Non-Agency Securities (inclusive of Non-Agency Securities underlying Linked Transactions though December 31, 2014), such as subordination, over collateralization or insurance. Significant increases or decreases in any of these inputs in isolation would result in a significantly lower or higher fair value measurement. Generally, a change in the assumption used for the probability of cumulative default is accompanied by a directionally similar change in the assumption used for the loss severity and a directionally opposite change in the assumption used for voluntary prepayment rates for the life of the security. However, given the interrelationship between loss estimates and the discount rate, overall Non-Agency Security market conditions would likely have a more significant impact on our Level 3 fair values than changes in any one unobservable input.
Note 6 - Agency Securities, Available for Sale
All of our Agency Securities are classified as available for sale securities and, as such, are reported at their estimated fair value and changes in fair value reported as part of the statements of comprehensive income. At March 31, 2015, investments in Agency Securities accounted for 79.05% of our MBS portfolio. At December 31, 2014, investments in Agency Securities accounted for 87.13% of our MBS portfolio and 86.50% of our total MBS portfolio inclusive of the Non-Agency Securities underlying our Linked Transactions (see Note 8, “Linked Transactions” for additional discussion of Linked Transactions through December 31, 2014).
We evaluated our Agency Securities with unrealized losses at March 31, 2015 and March 31, 2014 and December 31, 2014, to determine whether there was an other than temporary impairment. All of our Agency Securities are issued and guaranteed by GSEs. The GSEs have a long term credit rating of AA+. At those dates, we also considered whether we intended to sell Agency Securities and whether it was more likely than not that we could meet our liquidity requirements and contractual obligations without selling Agency Securities. There was no other than temporary impairment recognized for the quarters ended March 31, 2015, March 31, 2014 and for the year ended December 31, 2014.
JAVELIN Mortgage Investment Corp. and Subsidiary
NOTES TO CONDENSED CONSOLIDATED FINANCIAL STATEMENTS
(in thousands, except per share amounts)
(Unaudited)
At March 31, 2015, we had the following securities in an unrealized gain or loss position as presented below. The components of the carrying value of our Agency Securities at March 31, 2015 are also presented below. All of our Agency Securities are fixed rate securities with a weighted average coupon of 3.24% at March 31, 2015.
March 31, 2015
|
| | | | | | | | | | | | | | | | | | | |
| | | Amortized Cost | | Gross Unrealized Loss | | Gross Unrealized Gain | | Fair Value | | Percent of Total |
| Fannie Mae | | | | | | | | | | |
| Multi-Family MBS | | $ | 155,462 |
| | $ | — |
| | $ | 5,444 |
| | $ | 160,906 |
| | 21.18 | % |
| 10 Year Fixed | | 2,329 |
| | — |
| | 43 |
| | 2,372 |
| | 0.30 |
|
| 15 Year Fixed | | 415,647 |
| | — |
| | 7,956 |
| | 423,603 |
| | 55.76 |
|
| 20 Year Fixed | | 44,813 |
| | (575 | ) | | 331 |
| | 44,569 |
| | 5.87 |
|
| Total Fannie Mae | | $ | 618,251 |
| | $ | (575 | ) | | $ | 13,774 |
| | $ | 631,450 |
| | 83.11 | % |
| | | | | | | | | | | |
| Freddie Mac | | | | | | | | | | |
| 30 Year Fixed | | $ | 128,908 |
| | $ | (626 | ) | | $ | — |
| | $ | 128,282 |
| | 16.89 | % |
| Total Freddie Mac | | $ | 128,908 |
| | $ | (626 | ) | | $ | — |
| | $ | 128,282 |
| | 16.89 | % |
| Total Agency Securities | | $ | 747,159 |
| | $ | (1,201 | ) | | $ | 13,774 |
| | $ | 759,732 |
| | 100.00 | % |
At December 31, 2014, we had the following securities in an unrealized gain or loss position as presented below. The components of the carrying value of our Agency Securities at December 31, 2014 are also presented below. All of our Agency Securities were fixed rate securities with a weighted average coupon of 3.25% at December 31, 2014.
December 31, 2014
|
| | | | | | | | | | | | | | | | | | | |
| | | Amortized Cost | | Gross Unrealized Loss | | Gross Unrealized Gain | | Fair Value | | Percent of Total |
| Fannie Mae | | | | | | | | | | |
| Multi-Family MBS | | $ | 230,799 |
| | $ | — |
| | $ | 2,903 |
| | $ | 233,702 |
| | 21.73 | % |
| 15 Year Fixed | | 790,238 |
| | (26 | ) | | 6,031 |
| | 796,243 |
| | 74.03 |
|
| 20 Year Fixed | | 45,881 |
| | (652 | ) | | 347 |
| | 45,576 |
| | 4.24 |
|
| Total Fannie Mae | | $ | 1,066,918 |
| | $ | (678 | ) | | $ | 9,281 |
| | $ | 1,075,521 |
| | 100.00 | % |
| Total Agency Securities | | $ | 1,066,918 |
| | $ | (678 | ) | | $ | 9,281 |
| | $ | 1,075,521 |
| | |
Actual maturities of Agency Securities are generally shorter than stated contractual maturities because actual maturities of Agency Securities are affected by the contractual lives of the underlying mortgages, periodic payments of principal and prepayments of principal.
JAVELIN Mortgage Investment Corp. and Subsidiary
NOTES TO CONDENSED CONSOLIDATED FINANCIAL STATEMENTS
(in thousands, except per share amounts)
(Unaudited)
The following table summarizes the weighted average lives of our Agency Securities at March 31, 2015 and December 31, 2014.
|
| | | | | | | | | | | | | | | | |
| | | March 31, 2015 | | December 31, 2014 |
| Weighted Average Life of all Agency Securities | | Fair Value | | Amortized Cost | | Fair Value | | Amortized Cost |
| Less than one year | | $ | — |
| | $ | — |
| | $ | — |
| | $ | — |
|
| Greater than or equal to one year and less than three years | | — |
| | — |
| | — |
| | — |
|
| Greater than or equal to three years and less than five years | | 440,278 |
| | 432,136 |
| | 702,485 |
| | 697,385 |
|
| Greater than or equal to five years | | 319,454 |
| | 315,023 |
| | 373,036 |
| | 369,533 |
|
| Total Agency Securities | | $ | 759,732 |
| | $ | 747,159 |
| | $ | 1,075,521 |
| | $ | 1,066,918 |
|
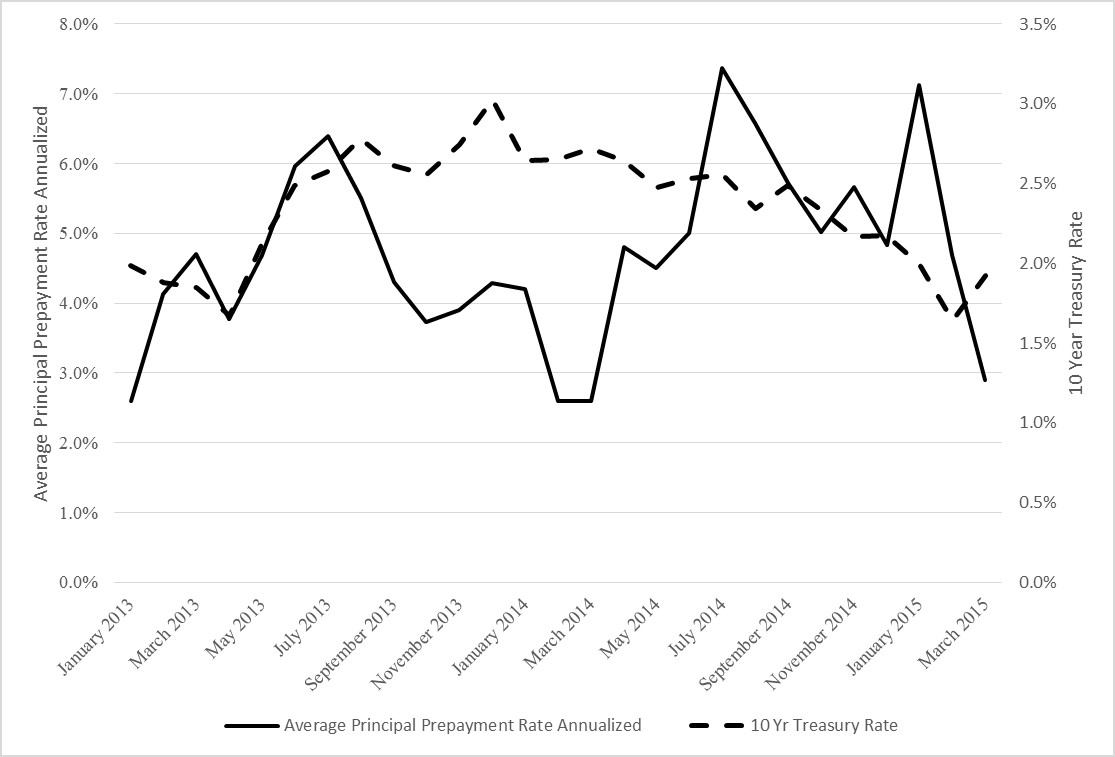
We use a third party model to calculate the weighted average lives of our Agency Securities. Weighted average life is calculated based on expectations for estimated prepayments for the underlying mortgage loans of our Agency Securities. These estimated prepayments are based on assumptions such as interest rates, current and future home prices, housing policy and borrower incentives. The weighted average lives of our Agency Securities at March 31, 2015 and December 31, 2014 in the table above are based upon market factors, assumptions, models and estimates from the third party model and also incorporate management’s judgment and experience. The actual weighted average lives of our Agency Securities could be longer or shorter than estimated.
The following table presents the unrealized losses and estimated fair value of our Agency Securities by length of time that such securities have been in a continuous unrealized loss position at March 31, 2015 and December 31, 2014.
|
| | | | | | | | | | | | | | | | | | | | | | | | |
| | | Unrealized Loss Position For: |
| | | Less than 12 Months | | 12 Months or More | | Total |
| As of | | Fair Value | | Unrealized Losses | | Fair Value | | Unrealized Losses | | Fair Value | | Unrealized Losses |
| March 31, 2015 | | $ | 128,282 |
| | $ | (626 | ) | | $ | 27,400 |
| | $ | (575 | ) | | $ | 155,682 |
| | $ | (1,201 | ) |
| December 31, 2014 | | $ | 58,363 |
| | $ | (26 | ) | | $ | 27,640 |
| | $ | (652 | ) | | $ | 86,003 |
| | $ | (678 | ) |
During the quarter ended March 31, 2015, we sold $430,852 of Agency Securities, resulting in a realized gain of $4,271. During the quarter ended March 31, 2014, we sold $743,647 of Agency Securities, resulting in a realized gain of $8,810. Sales of Agency Securities are done to reposition our securities portfolio and to reach our target level of liquidity.
Note 7 – Non-Agency Securities, Trading
All of our Non-Agency Securities are classified as trading securities and reported at their estimated fair value. Fair value changes are reported in the condensed consolidated statements of operations in the period in which they occur.
As the result of the adoption of ASU No. 2014-11, Repurchase-to-Maturity Transactions, Repurchase Financings, and Disclosures, Transfers and Servicing (Topic 860), effective January 1, 2015, we completed the purchase of Non-Agency Securities with a fair value of $8,940 that were previously treated as Linked Transactions with the recognition of related repurchase agreement borrowings and accrued interest payable of $6,408.
JAVELIN Mortgage Investment Corp. and Subsidiary
NOTES TO CONDENSED CONSOLIDATED FINANCIAL STATEMENTS
(in thousands, except per share amounts)
(Unaudited)
At March 31, 2015, investments in Non-Agency Securities accounted for 20.95% of our MBS portfolio.
The components of the carrying value of our Non-Agency Securities at March 31, 2015 are presented in the table below.
|
| | | | | | | | | | | | | | | |
| | | Non-Agency Securities |
| March 31, 2015 | | Fair Value | | Amortized Cost | | Principal Amount | | Weighted Average Coupon |
| Prime Fixed | | $ | 40,984 |
| | $ | 39,614 |
| | $ | 46,458 |
| | 5.38 | % |
| Prime Hybrid | | 15,271 |
| | 13,704 |
| | 18,052 |
| | 2.26 | % |
| Prime Floater | | 35,119 |
| | 33,960 |
| | 34,750 |
| | 4.35 | % |
| Alt-A Fixed | | 81,803 |
| | 77,482 |
| | 98,398 |
| | 5.80 | % |
| Alt-A Hybrid | | 8,144 |
| | 7,854 |
| | 9,767 |
| | 2.50 | % |
| Non-Performing | | 19,994 |
| | 19,991 |
| | 20,000 |
| | 3.50 | % |
| Total Non-Agency Securities | | $ | 201,315 |
| | $ | 192,605 |
| | $ | 227,425 |
| | 4.83 | % |
At December 31, 2014, investments in Non-Agency Securities accounted for 12.87% of our MBS portfolio and 13.50% of our total MBS portfolio inclusive of the Non-Agency Securities underlying our Linked Transactions (see Note 8, "Linked Transactions" for additional discussion of Linked Transactions).
The components of the carrying value of our Non-Agency Securities at December 31, 2014 are presented in the table below.
|
| | | | | | | | | | | | | | | |
| | | Non-Agency Securities |
| December 31, 2014 | | Fair Value | | Amortized Cost | | Principal Amount | | Weighted Average Coupon |
| Prime Fixed | | $ | 41,288 |
| | $ | 40,894 |
| | $ | 47,806 |
| | 5.43 | % |
| Prime Hybrid | | 15,592 |
| | 13,982 |
| | 18,565 |
| | 2.29 | % |
| Prime Floater | | 18,625 |
| | 19,380 |
| | 19,750 |
| | 4.22 | % |
| Alt-A Fixed | | 75,072 |
| | 70,986 |
| | 88,965 |
| | 5.99 | % |
| Alt-A Hybrid | | 8,354 |
| | 7,972 |
| | 9,998 |
| | 2.50 | % |
| Total Non-Agency Securities | | $ | 158,931 |
| | $ | 153,214 |
| | $ | 185,084 |
| | 5.09 | % |
Prime/Alt-A Non-Agency Securities at March 31, 2015 and December 31, 2014 include senior tranches in securitization trusts issued between 2004 and 2007, and are collateralized by residential mortgages originated between 2002 and 2007. The loans were originally considered to be either prime or one tier below prime credit quality. Prime mortgage loans are residential mortgage loans that are considered the highest tier with the most stringent underwriting standards within the Non-Agency mortgage market, but do not carry any credit guarantee from either a U.S. Government agency or GSE. These loans were originated during a period when underwriting standards were generally weak and housing prices have dropped significantly subsequent to their origination. As a result, there is still material credit risk embedded in these vintage tranches. Alt-A, or alternative A-paper, mortgage loans are considered riskier than prime mortgage loans and less risky than sub-prime mortgage loans and are typically characterized by borrowers with less than full documentation, lower credit scores, higher loan to value ratios and a higher percentage of investment properties. These securities were generally rated below investment grade at March 31, 2015 and December 31, 2014. The non-performing Non-Agency Securities represent new securitizations to provide senior financing for a portion of the sponsor's existing non-performing loan portfolio.
JAVELIN Mortgage Investment Corp. and Subsidiary
NOTES TO CONDENSED CONSOLIDATED FINANCIAL STATEMENTS
(in thousands, except per share amounts)
(Unaudited)
The following table summarizes the weighted average lives of our Non-Agency Securities at March 31, 2015 and December 31, 2014.
|
| | | | | | | | | | | | | | | | |
| | | March 31, 2015 | | December 31, 2014 |
| Weighted Average Life of all Non-Agency Securities | | Fair Value | | Amortized Cost | | Fair Value | | Amortized Cost |
| Less than one year | | $ | 33,232 |
| | $ | 31,814 |
| | $ | — |
| | $ | — |
|
| Greater than or equal to one year and less than three years | | 19,994 |
| | 19,991 |
| | — |
| | — |
|
| Greater than or equal to three years and less than five years | | 14,909 |
| | 14,577 |
| | 20,045 |
| | 19,866 |
|
| Greater than or equal to five years | | 133,180 |
| | 126,223 |
| | 138,886 |
| | 133,348 |
|
| Total Non-Agency Securities | | $ | 201,315 |
| | $ | 192,605 |
| | $ | 158,931 |
| | $ | 153,214 |
|
We use a third party model to calculate the weighted average lives of our Non-Agency Securities. Weighted average life is calculated based on expectations for estimated prepayments for the underlying mortgage loans of our Non-Agency Securities. These estimated prepayments are based on assumptions such as interest rates, current and future home prices, housing policy and borrower incentives. The weighted average lives of our Non-Agency Securities at March 31, 2015 and December 31, 2014 in the table above are based upon market factors, assumptions, models and estimates from the third party model and also incorporate management’s judgment and experience. The actual weighted average lives of our Non-Agency Securities could be longer or shorter than estimated.
The following table presents the unrealized losses and estimated fair value of our Non-Agency Securities by length of time that such securities have been in a continuous unrealized loss position at March 31, 2015 and March 31, 2014.
|
| | | | | | | | | | | | | | | | | | | | | | | | |
| | | Unrealized Loss Position For: |
| | | Less than 12 Months | | 12 Months or More | | Total |
| As of | | Fair Value | | Unrealized Losses | | Fair Value | | Unrealized Losses | | Fair Value | | Unrealized Losses |
| March 31, 2015 | | $ | 4,569 |
| | $ | (38 | ) | | $ | — |
| | $ | — |
| | $ | 4,569 |
| | $ | (38 | ) |
| December 31, 2014 | | $ | 19,166 |
| | $ | (1,029 | ) | | $ | 5,893 |
| | $ | (296 | ) | | $ | 25,059 |
| | $ | (1,325 | ) |
Our Non-Agency Securities are subject to risk of loss with regard to principal and interest payments and at March 31, 2015 and December 31, 2014, have generally either been assigned below investment grade ratings by rating agencies, or have not been rated. We evaluate each investment based on the characteristics of the underlying collateral and securitization structure, rather than relying on the ratings assigned by rating agencies.
In April 2014, we entered in to a long term collateral exchange agreement whereby we will receive approximately $50,000 of U.S. Treasury Securities or cash for two years (declining to $30,000 for a third year) in exchange for certain of our Non-Agency Securities. At March 31, 2015, our repurchase agreement balance on our condensed consolidated balance sheet includes borrowing against these U.S. Treasury Securities pledged to us under this agreement.
Note 8 - Linked Transactions
Through December 31, 2014, our Linked Transactions were evaluated on a combined basis, reported as forward (derivative) instruments and presented as assets on our balance sheets at fair value. The fair value of Linked Transactions reflected the value of the underlying Non-Agency MBS, linked repurchase agreement borrowings and accrued interest receivable and payable on such instruments. For the year ended December 31, 2014, our Linked Transactions were not designated as hedging instruments and, as a result, the change in the fair value and net interest income from Linked Transactions were reported in other income on our consolidated statements of operations. See Note 4, "Recent Accounting Pronouncements."
JAVELIN Mortgage Investment Corp. and Subsidiary
NOTES TO CONDENSED CONSOLIDATED FINANCIAL STATEMENTS
(in thousands, except per share amounts)
(Unaudited)
The following table presents information about our Non-Agency Securities and repurchase agreements underlying our Linked Transactions at December 31, 2014. Our Non-Agency Securities underlying our Linked Transactions represented approximately 0.72% of our overall investment in MBS at December 31, 2014.
December 31, 2014
|
| | | | | | | | | | | | | | | | | | | | | | | | |
| Linked Repurchase Agreements | | Linked Non-Agency Securities |
| Maturity or Repricing | | Balance | | Weighted Average Interest Rate | | Non-Agency MBS | | Fair Value | | Amortized Cost | | Par/Current Face | | Weighted Average Coupon Rate |
| Within 30 days | | $ | 676 |
| | 1.51 | % | | Prime | | $ | — |
| | $ | — |
| | $ | — |
| | 0.00 | % |
| 31 days to 60 days | | — |
| | 0.00 | % | | Alt-A | | 8,940 |
| | 8,854 |
| | 12,199 |
| | 6.22 | % |
| 61 days to 90 days | | 5,708 |
| | 2.01 | % | | Total | | $ | 8,940 |
| | $ | 8,854 |
| | $ | 12,199 |
| | 6.22 | % |
| Greater than 90 days | | — |
| | 0.00 | % | | | | | | | | | | |
| Total | | $ | 6,384 |
| | 1.95 | % | | | | | | | | | | |
Not included in the tables above is $24 of accrued interest payable from Linked Transactions included in our condensed consolidated balance sheet for the year ended December 31, 2014.
The following table presents certain information about the components of the unrealized net gains and net interest income from Linked Transactions included in our condensed consolidated statements of operations for the quarter ended March 31, 2015 and March 31, 2014.
|
| | | | | | | | |
| Unrealized Net Gain and Net Interest Income from Linked Transactions | | March 31, 2015 | | March 31, 2014 |
| Interest income attributable to MBS underlying Linked Transactions | | $ | — |
| | $ | 1,569 |
|
| Interest expense attributable to linked repurchase agreements underlying Linked Transactions | | — |
| | (372 | ) |
| Change in fair value of Linked Transactions included in earnings | | — |
| | 3,230 |
|
| Unrealized net gain and net interest income from Linked Transactions | | $ | — |
| | $ | 4,427 |
|
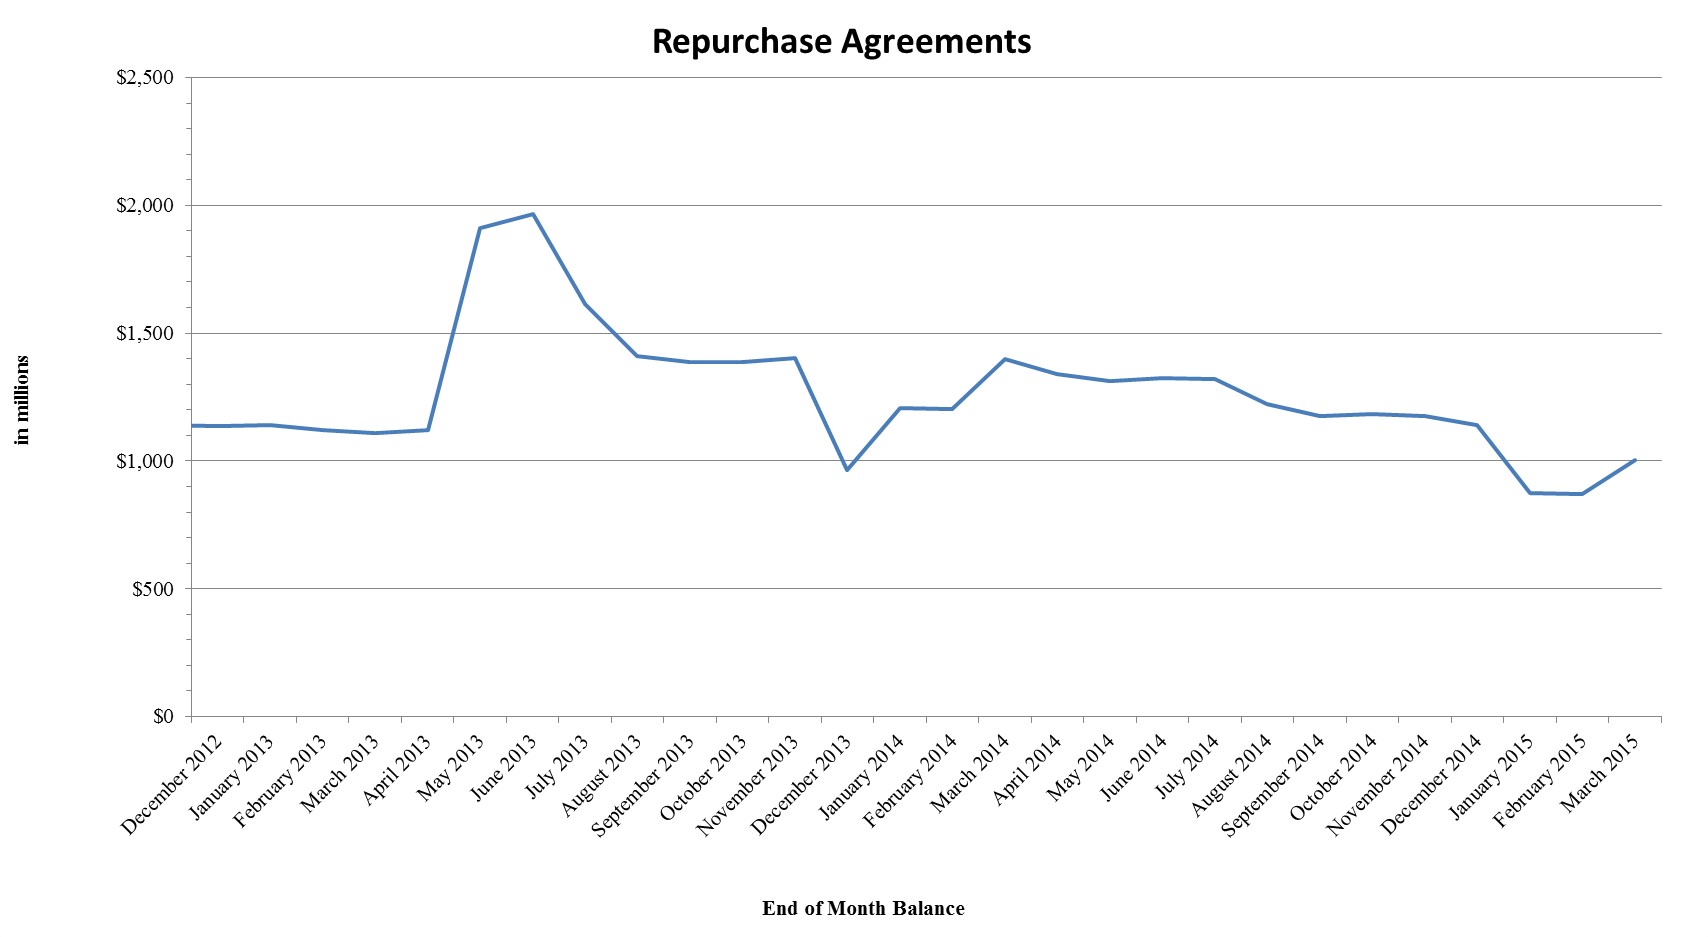
Note 9 - Repurchase Agreements
At March 31, 2015, we had MRAs with 30 counterparties and had $1,004,067 in outstanding borrowings with 19 of those counterparties. At December 31, 2014, we had MRAs with 30 counterparties and had $1,134,387 in outstanding borrowings with 20 of those counterparties. See Note 8, “Linked Transactions” for additional discussion of Linked Transactions through December 31, 2014.
The following tables represent the contractual repricing and other information regarding our repurchase agreements to finance our MBS purchases at March 31, 2015 and December 31, 2014.
|
| | | | | | | | | | | | |
| March 31, 2015 | | Repurchase Agreements | | Weighted Average Contractual Rate | | Weighted Average Maturity in days | | Haircut for Repurchase Agreements (1) |
| Agency Securities | | $ | 866,746 |
| | 0.36 | % | | 40 | | 4.88 | % |
| Non-Agency Securities | | 104,208 |
| | 1.71 | % | | 38 | | 23.51 | % |
| U.S. Treasury Securities | | 33,113 |
| | 0.11 | % | | 1 | | 0.00 | % |
| Total or Weighted Average | | $ | 1,004,067 |
| | 0.50 | % | | 38 | | 7.58 | % |
(1) The Haircut represents the weighted average margin requirement, or the percentage amount by which the collateral value must exceed the loan amount.
JAVELIN Mortgage Investment Corp. and Subsidiary
NOTES TO CONDENSED CONSOLIDATED FINANCIAL STATEMENTS
(in thousands, except per share amounts)
(Unaudited)
|
| | | | | | | | | | | | |
| December 31, 2014 | | Repurchase Agreements | | Weighted Average Contractual Rate | | Weighted Average Maturity in days | | Haircut for Repurchase Agreements (1) |
| Agency Securities | | $ | 1,020,916 |
| | 0.37 | % | | 39 | | 4.87 | % |
| Non-Agency Securities | | 70,697 |
| | 1.74 | % | | 43 | | 25.44 | % |
| U.S. Treasury Securities | | 42,774 |
| | 0.19 | % | | 2 | | 0.00 | % |
| Total or Weighted Average | | $ | 1,134,387 |
| | 0.45 | % | | 38 | | 7.56 | % |
(1) The Haircut represents the weighted average margin requirement, or the percentage amount by which the collateral value must exceed the loan amount.
|
| | | | | | | | | | | | | | |
| Maturing or Repricing | | March 31, 2015 | | Weighted Average Contractual Rate | | December 31, 2014 | | Weighted Average Contractual Rate |
| Within 30 days | | $ | 454,518 |
|
| 0.55 | % | | $ | 522,855 |
| | 0.44 | % |
| 31 days to 60 days | | 305,196 |
|
| 0.38 | % | | 289,819 |
| | 0.41 | % |
| 61 days to 90 days | | 244,353 |
|
| 0.55 | % | | 321,713 |
| | 0.49 | % |
| Greater than 90 days | | — |
|
| 0.00 | % | | — |
| | 0.00 | % |
| Total or Weighted Average | | $ | 1,004,067 |
|
| 0.50 | % | | $ | 1,134,387 |
| | 0.45 | % |
We have 7 repurchase agreement counterparties that individually account for 5% or greater of our aggregate borrowings. In total, these counterparties account for approximately 62.19% of our repurchase agreement borrowings outstanding at March 31, 2015.
The table below represents information about repurchase agreement counterparties where the amount at risk individually accounts for 5% or greater of our stockholders' equity at March 31, 2015.
|
| | | | | | |
| Repurchase Agreement Counterparty | | Amount at Risk | | Weighted Average Maturity of Repurchase Agreements in days |
| Bank of America-Merrill Lynch | | $ | 7,000 |
| | 24 |
| Royal Bank of Canada | | 10,350 |
| | 50 |
| Wells Fargo | | 6,967 |
| | 27 |
| Total | | $ | 24,317 |
| | |
Note 10 - Derivatives
We enter into derivative transactions to manage our interest rate risk exposure. These transactions include entering into interest rate swap contracts and interest rate swaptions. These transactions are designed to lock in funding costs for repurchase agreements associated with our assets in such a way to help assure the realization of net interest margins. Such transactions are based on assumptions about prepayments on our Agency Securities which, if not realized, will cause transaction results to differ from expectations.
We have agreements with our swap (including swaption) counterparties that provide for the posting of collateral based on the fair values of our interest rate swap contracts. Through this margin process, either we or our swap counterparty may be required to pledge cash or Agency Securities as collateral. Collateral requirements vary by counterparty and change over time based on the fair value; notional amount and remaining term of the contracts. Certain interest rate swap contracts provide for cross collateralization and cross default with repurchase agreements and other contracts with the same counterparty.
JAVELIN Mortgage Investment Corp. and Subsidiary
NOTES TO CONDENSED CONSOLIDATED FINANCIAL STATEMENTS
(in thousands, except per share amounts)
(Unaudited)
Interest rate swaptions generally provide us the option to enter into an interest rate swap agreement at a certain point of time in the future with a predetermined notional amount, stated term and stated rate of interest in the fixed leg and interest rate index on the floating leg.
The following tables present information about interest rate swap contracts which are included in derivatives on the accompanying condensed consolidated balance sheets at March 31, 2015 and December 31, 2014.
March 31, 2015
|
| | | | | | | | | | | | | | | | | | | |
| Derivative Type | | Remaining / Underlying Term | | Weighted Average Remaining Swap / Option Term (Months) | | Weighted Average Rate | | Notional Amount | | Asset Fair Value (1) | | Liability Fair Value (1) |
| Interest rate swap contracts | | 25-36 Months | | 28 | | 0.73 | % | | $ | 200,000 |
| | $ | 189 |
| | $ | (126 | ) |
| Interest rate swap contract | | 37-48 Months | | 38 | | 0.92 | % | | 50,000 |
| | — |
| | (321 | ) |
| Interest rate swap contracts | | 49-60 Months | | 55 | | 1.59 | % | | 60,000 |
| | — |
| | (1,298 | ) |
| Interest rate swap contracts | | 97-108 Months | | 100 | | 2.04 | % | | 156,250 |
| | — |
| | (4,947 | ) |
| Interest rate swap contracts | | 121-132 Months | | 132 | | 2.08 | % | | 225,000 |
| | 533 |
| | (2,028 | ) |
| Total or Weighted Average | | 81 | | 1.55 | % | | $ | 691,250 |
| | $ | 722 |
| | $ | (8,720 | ) |
(1) See Note 5, "Fair Value of Financial Instruments" for additional discussion.
December 31, 2014
|
| | | | | | | | | | | | | | | | | | | |
| Derivative Type | | Remaining / Underlying Term | | Weighted Average Remaining Swap / Option Term (Months) | | Weighted Average Rate | | Notional Amount | | Asset Fair Value (1) | | Liability Fair Value (1) |
| Interest rate swap contracts | | 25-36 Months | | 34 | | 0.55 | % | | $ | 50,000 |
| | $ | 611 |
| | $ | — |
|
| Interest rate swap contracts | | 37-48 Months | | 41 | | 0.92 | % | | 50,000 |
| | 241 |
| | — |
|
| Interest rate swap contracts | | 49-60 Months | | 58 | | 1.59 | % | | 60,000 |
| | — |
| | (306 | ) |
| Interest rate swap contracts | | 85-96 Months | | 93 | | 1.50 | % | | 175,000 |
| | 4,178 |
| | — |
|
| Interest rate swap contracts | | 97-108 Months | | 100 | | 1.91 | % | | 526,250 |
| | 2,291 |
| | (2,297 | ) |
| Total or Weighted Average | | 89 | | 1.67 | % | | $ | 861,250 |
| | $ | 7,321 |
| | $ | (2,603 | ) |
(1) See Note 5, "Fair Value of Financial Instruments" for additional discussion.
We have netting arrangements in place with all derivative counterparties pursuant to standard documentation developed by the International Swap and Derivatives Association. We are also required to post or hold cash collateral based upon the net underlying market value of our open positions with the counterparty.
JAVELIN Mortgage Investment Corp. and Subsidiary
NOTES TO CONDENSED CONSOLIDATED FINANCIAL STATEMENTS
(in thousands, except per share amounts)
(Unaudited)
The following tables present information about interest rate swap contracts and the potential effects of the master netting arrangements if we were to offset the assets and liabilities of these financial instruments on the accompanying condensed consolidated balance sheets. Currently, we present these financial instruments at their gross amounts and they are included in derivatives at fair value on the accompanying condensed consolidated balance sheet at March 31, 2015.
|
| | | | | | | | | | | | | | | | |
| March 31, 2015 | | | | Gross Amounts Not Offset in the Condensed Consolidated Balance Sheet | | |
| Assets | | Gross Amounts of Assets Presented in the Condensed Consolidated Balance Sheet | | Financial Instruments | | Cash Collateral Held | | Net Amount |
| Interest rate swap contracts | | $ | 722 |
| | $ | (8,720 | ) | | $ | 11,267 |
| | $ | 3,269 |
|
| Totals | | $ | 722 |
| | $ | (8,720 | ) | | $ | 11,267 |
| | $ | 3,269 |
|
|
| | | | | | | | | | | | | | | | |
| March 31, 2015 | | | | Gross Amounts Not Offset in the Condensed Consolidated Balance Sheet | | |
| Liabilities | | Gross Amounts of Liabilities Presented in the Condensed Consolidated Balance Sheet | | Financial Instruments | | Cash Collateral Posted | | Net Amount |
| Interest rate swap contracts | | $ | (8,720 | ) | | $ | 8,720 |
| | $ | — |
| | $ | — |
|
| Totals | | $ | (8,720 | ) | | $ | 8,720 |
| | $ | — |
| | $ | — |
|
The following tables present information about interest rate swap contracts and the potential effects of the master netting arrangements if we were to offset the assets and liabilities of these financial instruments on the accompanying condensed consolidated balance sheets. Currently, we present these financial instruments at their gross amounts and they are included in derivatives at fair value on the accompanying condensed consolidated balance sheet at December 31, 2014.
|
| | | | | | | | | | | | | | | | |
| December 31, 2014 | | | | Gross Amounts Not Offset in the Condensed Consolidated Balance Sheet | | |
| Assets | | Gross Amounts of Assets Presented in the Condensed Consolidated Balance Sheet | | Financial Instruments | | Cash Collateral Held | | Net Amount |
| Interest rate swap contracts | | $ | 7,321 |
| | $ | (2,603 | ) | | $ | 333 |
| | $ | 5,051 |
|
| Totals | | $ | 7,321 |
| | $ | (2,603 | ) | | $ | 333 |
| | $ | 5,051 |
|
JAVELIN Mortgage Investment Corp. and Subsidiary
NOTES TO CONDENSED CONSOLIDATED FINANCIAL STATEMENTS
(in thousands, except per share amounts)
(Unaudited)
|
| | | | | | | | | | | | | | | | |
| December 31, 2014 | | | | Gross Amounts Not Offset in the Condensed Consolidated Balance Sheet | | |
| Liabilities | | Gross Amounts of Liabilities Presented in the Condensed Consolidated Balance Sheet | | Financial Instruments | | Cash Collateral Posted | | Net Amount |
| Interest rate swap contracts | | $ | (2,603 | ) | | $ | 2,603 |
| | $ | — |
| | $ | — |
|
| Totals | | $ | (2,603 | ) | | $ | 2,603 |
| | $ | — |
| | $ | — |
|
We apply trade date accounting. We did not have unsettled purchases or sales of derivatives at March 31, 2015 or December 31, 2014.
The following table represents the location and information regarding our derivatives which are included in total Other Income (Loss) in the accompanying condensed consolidated statements of operations for the quarters ended March 31, 2015 and March 31, 2014.
|
| | | | | | | | | | |
| | | | | Income (Loss) Recognized |
| | | | | For the Quarter Ended |
| Derivatives | | Location on Condensed Consolidated Statements of Operations | | March 31, 2015 | | March 31, 2014 |
| Interest rate swap contracts: | | | | | | |
| Realized gain | | Realized loss on derivatives | | $ | 496 |
| | $ | — |
|
| Interest income | | Realized loss on derivatives | | 276 |
| | 240 |
|
| Interest expense | | Realized loss on derivatives | | (3,035 | ) | | (3,346 | ) |
| Changes in fair value | | Unrealized gain (loss) on derivatives | | (15,633 | ) | | (15,870 | ) |
| | | | | $ | (17,896 | ) | | $ | (18,976 | ) |
| Interest rate swaptions: | | | | | | |
| Changes in fair value | | Unrealized gain (loss) on derivatives | | — |
| | (4,159 | ) |
| | | | | $ | — |
| | $ | (4,159 | ) |
| Totals | | | | $ | (17,896 | ) | | $ | (23,135 | ) |
Note 11 - Commitments and Contingencies
Management Agreement with ACM
We are externally managed by ACM pursuant to a management agreement, (as amended from time to time, the “Management Agreement”). See also Note 16, "Related Party Transactions". The Management Agreement entitles ACM to receive a management fee payable monthly in arrears in an amount equal to 1/12th of (a) 1.5% of gross equity raised (including our initial public offering and private placement equity) up to $1.0 billion plus (b) 1.0% of gross equity raised in excess of $1.0 billion. Gross equity raised was $239,481 at March 31, 2015. The cost of repurchased stock and any dividend representing a return of capital for tax purposes will reduce the amount of gross equity raised used to calculate the monthly management fee. ACM is entitled to receive a termination fee from us under certain circumstances. The ACM monthly management fee is not calculated based on the performance of our portfolio. Accordingly, the payment of our monthly management fee may not decline in the event of a decline in our earnings and may cause us to incur losses.
ACM is also the external manager of ARMOUR Residential REIT, Inc. ("ARMOUR"), a publicly traded REIT, which invests in a leveraged portfolio of Agency Securities. Our executive officers also serve as the executive officers of ARMOUR.
JAVELIN Mortgage Investment Corp. and Subsidiary
NOTES TO CONDENSED CONSOLIDATED FINANCIAL STATEMENTS
(in thousands, except per share amounts)
(Unaudited)
Indemnifications and Litigation
We enter into certain contracts that contain a variety of indemnifications to third parties, principally with ACM and brokers. The maximum potential amount of future payments we could be required to make under these indemnification provisions is unknown. We have not incurred any costs to defend lawsuits or settle claims related to these indemnification agreements. As a result, the estimated fair value of these agreements is not material. Accordingly, we have no liabilities recorded for these agreements at March 31, 2015 or December 31, 2014.
We are not party to any pending, threatened or contemplated litigation.
Note 12 - Stock-Based Compensation
Stock Incentive Plan
Our 2012 Stock Incentive Plan (the "Plan") provides for grants of common stock, restricted shares of common stock, stock options, performance shares, performance units, stock appreciation rights and other equity and cash-based awards (collectively “Awards”) to eligible individuals. The maximum number of shares of common stock reserved for the grant of awards under the Plan is equal to 3.0% of the total issued and outstanding shares of common stock (on a fully diluted basis) at the time of the grant of the award (other than any shares of common stock issued or subject to awards made pursuant to the Plan). If an award granted under the Plan expires or terminates, the shares subject to any portion of the award that expires or terminates without having been exercised or paid, as the case may be, will again become available for the issuance of additional awards.
At March 31, 2015, there were 360 shares reserved for award under the Plan. No awards have been made to date.
Directors Fees
In the first quarter of 2014, we began paying to our non-employee directors a fee payable in common stock, or a combination of stock and cash (e.g. to cover estimated income taxes) at the option of the director. The number of shares issued each quarter is determined by dividing the chosen U.S. dollar amount of these fees by the closing market price for our stock at the end of each quarter.
Note 13 - Stockholders’ Equity
Dividends
The following table presents our common stock dividend transactions for the quarter ended March 31, 2015.
|
| | | | | | | | |
| Record Date | | Payment Date | | Rate per common share | | Aggregate amount paid to holders of record |
| January 15, 2015 | | January 27, 2015 | | $0.12 | | $ | 1,438.2 |
|
| February 13, 2015 | | February 27, 2015 | | $0.12 | | 1,438.2 |
|
| March 13, 2015 | | March 27, 2015 | | $0.12 | | 1,438.2 |
|
| Total dividends paid | | | | | | $ | 4,314.6 |
|
JAVELIN Mortgage Investment Corp. and Subsidiary
NOTES TO CONDENSED CONSOLIDATED FINANCIAL STATEMENTS
(in thousands, except per share amounts)
(Unaudited)
Equity Capital Raising Activities
The following table presents our equity transactions for the quarter ended March 31, 2015.
|
| | | | | | | | | | | | |
| Transaction Type | | Completion Date | | Number of Shares | | Per Share price (1) | | Net Proceeds |
| Dividend Reinvestment Plan Shares | | January 27, 2015 to March 27, 2015 | | NM | | $ | 8.59 |
| | $ | 1 |
|
(1) Weighted average price.
NM - Not meaningful
At March 31, 2015, there were 1,439 authorized shares remaining under our Repurchase Program.
Note 14 – Net Loss per Common Share
GAAP requires earnings per share to be computed based on the weighted average number of shares outstanding during the period presented, calculated on a daily basis. Net loss per common share was $(0.52) and $(0.16) based on weighted average shares outstanding of 11,985 and 11,993, respectively, for the quarters ended March 31, 2015 and March 31, 2014, respectively.
To date, we have not issued any dilutive securities.
Note 15 – Income Taxes
The following table reconciles our GAAP net loss to estimated REIT taxable income for the quarters ended March 31, 2015 and March 31, 2014.
|
| | | | | | | |
| | For the Quarter Ended |
| | March 31, 2015 | | March 31, 2014 |
| GAAP Net loss | $ | (6,185 | ) | | $ | (1,863 | ) |
| Book to tax differences: | | | |
| Net book to tax differences on Non-Agency Securities and Linked Transactions for 2014 | (2,567 | ) | | (3,696 | ) |
| Gain on sale of Agency Securities | (4,271 | ) | | (8,810 | ) |
| Amortization of deferred hedging gains (costs) | (219 | ) | | 145 |
|
| Net premium amortization differences | — |
| | (628 | ) |
| Changes in interest rate contracts | 15,136 |
| | 20,029 |
|
| Other | 1 |
| | 1 |
|
| Estimated taxable income | $ | 1,895 |
| | $ | 5,178 |
|
Interest rate contracts are treated as hedging transactions for tax purposes. Unrealized gains and losses on open interest rate contracts are not included in the determination of taxable income. Realized gains and losses on interest rate contracts terminated before their maturity are deferred and amortized over the remainder of the original term of the contract.
Net capital losses realized in 2013 and 2014 totaling $(80,509) and $(33,335), respectively, will be available to offset future capital gains realized through 2018 and 2019, respectively.
The aggregate tax basis of our assets and liabilities is less than our Total Stockholders’ Equity at March 31, 2015 by approximately $5,756, or approximately $0.48 per share (based on the 11,991 shares then outstanding).
We are required and intend to timely distribute substantially all of our REIT taxable income in order to maintain our REIT status under the Code. Total dividend payments to stockholders were $4,315 and $5,397 for the quarters ended March 31, 2015
JAVELIN Mortgage Investment Corp. and Subsidiary
NOTES TO CONDENSED CONSOLIDATED FINANCIAL STATEMENTS
(in thousands, except per share amounts)
(Unaudited)
and March 31, 2014, respectively. Our estimated REIT taxable income available to pay dividends was $1,895 and $5,178 for the quarters ended March 31, 2015 and March 31, 2014, respectively.
Our management is responsible for determining whether tax positions taken by us are more likely than not to be sustained on their merits. We have no material unrecognized tax benefits or material uncertain tax positions.
Note 16 - Related Party Transactions
We are externally managed by ACM pursuant to the Management Agreement. All of our executive officers are also employees of ACM. ACM manages our day-to-day operations, subject to the direction and oversight of the Board. The Management Agreement runs through October 5, 2017 and is thereafter automatically renewed for successive one-year terms unless terminated under certain circumstances. Either party must provide 180 days prior written notice of any such termination.
Under the terms of the Management Agreement, ACM is responsible for costs incident to the performance of its duties, such as compensation of its employees and various overhead expenses. ACM is responsible for the following primary roles:
| |
| • | Advising us with respect to, arranging for and managing the acquisition, financing, management and disposition of, elements of our investment portfolio; |
| |
| • | Evaluating the duration risk and prepayment risk within the investment portfolio and arranging borrowing and hedging strategies; |
| |
| • | Coordinating capital raising activities; |
| |
| • | Advising us on the formulation and implementation of operating strategies and policies, arranging for the acquisition of assets, monitoring the performance of those assets and providing administrative and managerial services in connection with our day-to-day operations; and |
| |
| • | Providing executive and administrative personnel, office space and other appropriate services required in rendering management services to us. |
In accordance with the Management Agreement, we incurred $901 and $912 in management fees for the quarters ended March 31, 2015 and March 31, 2014, respectively.
We are required to take actions as may be reasonably required to enable ACM to carry out its duties and obligations. We are also responsible for any costs and expenses that ACM incurred solely on behalf of us other than the various overhead expenses specified in the terms of the Management Agreement. For the quarters ended March 31, 2015 and March 31, 2014, we reimbursed ACM $52 and $84, respectively, for expenses incurred on our behalf.
Pursuant to the sub-management agreement, Staton Bell Blank Check LLC ("SBBC") provides the following services to support ACM's performance of services to us under the Management Agreement, in each case upon reasonable request by ACM: (i) serving as a consultant to ACM with respect to the periodic review of our investment guidelines; (ii) identifying for ACM potential new lines of business and investment opportunities for us; (iii) identifying for and advising ACM with respect to selection of independent contractors that provide investment banking, securities brokerage, mortgage brokerage and other financial services, due diligence services, underwriting review services, legal and accounting services, and all other services as may be required relating to our investments; (iv) advising ACM with respect to our stockholder and public relations matters; (v) advising and assisting ACM with respect to our capital structure and capital raising; and (vi) advising ACM on negotiating agreements relating to programs established by the U.S. Government. In exchange for such services, ACM pays SBBC a monthly retainer of $115 and a sub-management fee of 25% of the net management fee earned by ACM under the Management Agreement. The sub-management agreement continues in effect until it is terminated in accordance with its terms. SBBC is also the sub-manager of ARMOUR and provides ACM the services described above in connection with ACM's management of ARMOUR. In connection with the Conversion, SBBC became substantially wholly owned by ACM, effective January 1, 2015.
JAVELIN Mortgage Investment Corp. and Subsidiary
NOTES TO CONDENSED CONSOLIDATED FINANCIAL STATEMENTS
(in thousands, except per share amounts)
(Unaudited)
Note 17 - Interest Rate Risk
Our primary market risk is interest rate risk. Interest rates are highly sensitive to many factors, including governmental monetary and tax policies, domestic and international economic and political considerations and other factors beyond our control. Changes in the general level of interest rates can affect net interest income, which is the difference between the interest income earned and the interest expense incurred in connection with the liabilities, by affecting the spread between the interest-earning assets and interest-bearing liabilities. Changes in the level of interest rates also can affect the value of MBS and our ability to realize gains from the sale of these assets. A decline in the value of the MBS pledged as collateral for borrowings under repurchase agreements could result in the counterparties demanding additional collateral pledges or liquidation of some of the existing collateral to reduce borrowing levels.
Note 18 – Subsequent Events
On April 27, 2015, a cash dividend of $0.09 per outstanding common share, or $1,079 in the aggregate, was paid to holders of record on April 15, 2015. We have also declared cash dividends of $0.09 per outstanding common share payable May 27, 2015 to holders of record on May 15, 2015 and payable June 29, 2015 to holders of record on June 15, 2015.
Item 2. Management’s Discussion and Analysis of Financial Condition and Results of Operations
The following discussion of our financial condition and results of operations should be read in conjunction with our condensed consolidated financial statements and related notes included elsewhere in this report.
References to “we,” “us,” “our,” "JAVELIN" or the “Company” are to JAVELIN Mortgage Investment Corp. References to "ACM" are to ARMOUR Capital Management LP, a Delaware limited partnership, formerly known as ARMOUR Residential Management LLC. On December 19, 2014, ARMOUR Residential Management LLC, our external manager under the Management Agreement, changed its name to ARMOUR Capital Management LP and converted from a Delaware limited partnership and continued as the manager under the same Management Agreement. Refer to the Glossary of Terms for definitions of capitalized terms and abbreviations used in this report.
U.S. dollar amounts and share numbers are presented in thousands, except per share amounts or as otherwise noted.
Overview
We are an externally managed Maryland corporation incorporated on June 18, 2012 and managed by ACM, an investment advisor registered with the SEC (see Note 11 and Note 16 to the condensed consolidated financial statements). We invest primarily in fixed rate and hybrid adjustable rate mortgage backed securities. Some of these securities may be issued or guaranteed by a U.S. GSEs, such as Fannie Mae, Freddie Mac, or Ginnie Mae (collectively, Agency Securities). Other securities backed by residential mortgages in which we invest, for which the payment of principal and interest is not guaranteed by a GSE or government agency (collectively, Non-Agency Securities and together with Agency Securities, MBS), may benefit from credit enhancement derived from structural elements such as subordination, over collateralization or insurance. We also may invest in collateralized commercial mortgage backed securities and other mortgage related investments, including mortgage loans, mortgage related derivatives and mortgage servicing rights. From time to time, a portion of our assets may be invested in unsecured notes and bonds issued by GSEs, U.S. Treasuries and money market instruments, subject to certain income tests we must satisfy for our qualification as a REIT. Our investment policy permits us to invest in Agency Securities and Non-Agency Securities.
At March 31, 2015, investments in Agency Securities accounted for 79.05% of our MBS portfolio and investments in Non-Agency Securities accounted for 20.95% of our MBS portfolio. At December 31, 2014, investments in Agency Securities accounted for 87.13% of our MBS portfolio and 86.50% of our total MBS portfolio inclusive of the Non-Agency Securities underlying our Linked Transactions. At December 31, 2014, investments in Non-Agency Securities accounted for 12.87% of our MBS portfolio and 13.50% of our total MBS portfolio inclusive of the Non-Agency Securities underlying our Linked Transactions (see Note 8, "Linked Transactions" for additional discussion of Linked Transactions).
We have elected to be taxed as a REIT under the Code. We will generally not be subject to federal income tax to the extent that we distribute our taxable income to our stockholders and as long as we satisfy the ongoing REIT requirements under the Code including meeting certain asset, income and stock ownership tests.
Factors that Affect our Results of Operations and Financial Condition
Our results of operations and financial condition are affected by various factors, many of which are beyond our control, including, among other things, our net interest spread, the market value of our target assets and the supply of and demand for such assets. We invest in financial assets and markets. Recent events, such as those discussed below, may affect our business in ways that are difficult to predict. Our net interest income varies primarily as a result of changes in interest rates, borrowing costs and prepayment speeds, the behavior of which involves various risks and uncertainties. We invest across the spectrum of mortgage investments, from Agency Securities, for which the principal and interest payments are guaranteed by a GSE, to Non-Agency Securities, non-prime mortgage loans and unrated equity tranches of CMBS. As such, we expect our investments to be subject to risks arising from delinquencies and foreclosures, thereby exposing our investment portfolio to potential losses. We are exposed to changing credit spreads, which could result in declines in the fair value of our investments. We believe ACM’s in-depth investment expertise across multiple sectors of the mortgage market, prudent asset selection and our hedging strategy enable us to minimize our credit losses, our market value losses and financing costs. Prepayment rates, as reflected by the rate of principal pay downs, and interest rates vary according to the type of investment, conditions in financial markets, government actions, competition and other factors, none of which can be predicted with any certainty. In general, as prepayment rates on our target assets purchased at a premium increase, related purchase premium amortization will increase, thereby reducing the net yield on such assets. Because changes in interest rates may significantly affect our activities, our operating results depend, in large part, upon our ability to manage interest rate risks and prepayment risks effectively while maintaining our status as a REIT.
For any period during which changes in the interest rates earned on our target assets do not coincide with interest rate changes on our borrowings, such assets will tend to reprice more slowly than the corresponding liabilities. Consequently, changes in interest rates, particularly short-term interest rates, may significantly influence our net interest income. Interest rate increases tend to decrease our net interest income and the market value of our target assets and therefore, our book value. Such rate increases could possibly result in operating losses or adversely affect our ability to make distributions to our stockholders.
Prepayments on our target assets are influenced by changes in market interest rates and a variety of economic and geographic factors, policy decisions by regulators, as well as other factors beyond our control. Consequently, prepayment rates cannot be predicted with certainty. To the extent we hold assets acquired at a premium or discount to par, or face value, changes in prepayment rates may impact our anticipated yield. In periods of declining interest rates, prepayments on our target assets increase. If we are unable to reinvest the proceeds of such prepayments at comparable yields, our net interest income may decline. The recent climate of government intervention in the housing finance markets significantly increases the risk associated with prepayments.
While we use strategies to economically hedge some of our interest rate risk, we do not hedge all of our exposure to changes in interest rates and prepayment rates, as there are practical limitations on our ability to insulate our MBS portfolio from all potential negative consequences associated with changes in short-term interest rates in a manner that allows us to seek attractive net spreads on our MBS portfolio. Also, since we have not elected to use cash flow hedge accounting, earnings reported in accordance with GAAP will fluctuate even in situations where our derivatives are operating as intended. As a result of this mark-to-market accounting treatment, our results of operations are likely to fluctuate far more than if we were to designate our derivative activities as cash flow hedges. Comparisons with companies that use cash flow hedge accounting for all or part of their derivative activities may not be meaningful. For these and other reasons more fully described under the section captioned “Derivative Instruments” below, no assurance can be given that our derivatives will have the desired beneficial impact on our results of operations or financial condition.
In addition to the use of derivatives to hedge interest rate risk, a variety of other factors relating to our business may also impact our financial condition and operating performance; these factors include,
| |
| • | our access to funding and borrowing capacity; |
| |
| • | the REIT requirements under the Code; and |
| |
| • | the requirements to qualify for an exclusion under the 1940 Act and other regulatory and accounting policies related to our business. |
Our Manager
See Note 11 and Note 16 to the condensed consolidated financial statements.
Market and Interest Rate Trends and the Effect on our Portfolio
Developments at Fannie Mae and Freddie Mac
The payments we receive on the Agency Securities in which we invest depend upon a steady stream of payments by borrowers on the underlying mortgages and the fulfillment of guarantees by GSEs. There can be no assurance that the U.S. Government's intervention in Fannie Mae and Freddie Mac will continue to be adequate for the longer-term viability of these GSEs. These uncertainties may lead to concerns about the availability of and trading market for Agency Securities in the long term. Accordingly, if the GSEs defaulted on their guaranteed obligations, suffered losses or ceased to exist, the value of our Agency Securities and our business, operations and financial condition could be materially and adversely affected.
The passage of any new federal legislation affecting Fannie Mae and Freddie Mac may create market uncertainty and reduce the actual or perceived credit quality of securities issued or guaranteed by them. If Fannie Mae and Freddie Mac were reformed or wound down, it is unclear what effect, if any, this would have on the value of the existing Fannie Mae and Freddie Mac Agency Securities. The foregoing could materially adversely affect the pricing, supply, liquidity and value of the Agency Securities in which we invest and otherwise materially adversely affect our business, operations and financial condition.
U.S. Government Mortgage-Related Securities Market Intervention
In December 2013, the Fed announced the first of a series of reductions in the level of its purchases of Agency and long term U.S. Treasury Securities. The table below shows the reduced purchases announcements.The Fed announced at its March 18, 2015 meeting that it would keep the target range for the Federal Funds Rate between 0.00% and 0.25% toward its objectives of achieving maximum employment and inflation of 2%.
|
| | | | | | | | |
| Fed Meeting Date | | Agency Securities (in billions) | | Longer term U.S. Treasury Securities (in billions) |
| December 18, 2013 | | $ | 35.0 |
| | $ | 40.0 |
|
| January 29, 2014 | | $ | 30.0 |
| | $ | 35.0 |
|
| March 19, 2014 | | $ | 25.0 |
| | $ | 30.0 |
|
| April 30, 2014 | | $ | 20.0 |
| | $ | 25.0 |
|
| June 18, 2014 | | $ | 15.0 |
| | $ | 20.0 |
|
| July 30, 2014 | | $ | 10.0 |
| | $ | 15.0 |
|
| September 17, 2014 | | $ | 5.0 |
| | $ | 10.0 |
|
| October 29, 2014 | | $ | — |
| | $ | — |
|
Based on the Fed's announcement and progress and other economic factors such as GDP growth and unemployment levels, we anticipated that interest rates would return to the levels they had achieved in early 2014 or trend higher. Accordingly, we positioned our securities and derivatives portfolios to be biased toward a higher rate environment. However, rates actually trended lower throughout the year, which resulted in the decline in the aggregate net fair value of our securities and derivatives portfolios. See "Results of Operations" below.
Credit Market Disruption and Current Conditions
The residential housing and mortgage markets in the U.S. have experienced a variety of difficulties and changed economic conditions including loan defaults, credit losses and decreased liquidity. These conditions have resulted in volatility in the value of the MBS we purchase and an increase in the average collateral requirements under our repurchase agreements we have obtained. While these markets have recovered significantly, further increased volatility and deterioration in the broader residential mortgage and RMBS markets may adversely affect the performance and market value of the Agency Securities and other high quality RMBS.
Short-term Interest Rates and Funding Costs
The Fed has maintained a target range for the Federal Funds Rate of between 0.00% and 0.25%. Our funding costs, which traditionally have tracked the 30-day LIBOR have generally benefited by this monetary policy. Because of continued uncertainty in the credit markets and U.S. and global economic conditions, we expect that interest rates are likely to experience continued volatility, which will likely affect our financial results since our cost of funds is largely dependent on short-term rates.
Historically, 30-day LIBOR has closely tracked movements in the Federal Funds Rate and the Effective Federal Funds Rate. The Effective Federal Funds Rate can differ from the Federal Funds Rate in that the Effective Federal Funds Rate represents the volume weighted average of interest rates at which depository institutions lend balances at the Fed to other depository institutions overnight (actual transactions, rather than target rate).
Our borrowings in the repurchase market have also historically closely tracked the Federal Funds Rate and LIBOR. Traditionally, a lower Federal Funds rate has indicated a time of increased net interest margin and higher asset values. However, for the past several years, LIBOR and repurchase market rates have varied greatly, and often have been significantly higher than the target Federal Funds Rate. The difference between 30-day LIBOR and the Federal Funds rate has also been quite volatile, with the spread alternately returning to more normal levels and then widening out again. The continued volatility in these rates and divergence from the historical relationship among these rates could negatively impact our ability to manage our MBS portfolio. If this were to occur, our net interest margin and the value of our MBS portfolio might suffer as a result.
The following graph shows 30-day LIBOR as compared to the Effective Federal Funds Rate on a monthly basis from December 2012 to March 2015.
Results of Operations
Net Income (Loss) Summary
The following is a summary of our condensed consolidated results of operations:
|
| | | | | | | | | | | |
| | | For the Quarter Ended | | Change vs. Prior Year |
| | | March 31, 2015 | | March 31, 2014 | | 2015 |
| Net Interest Income | | $ | 6,571 |
| | $ | 9,305 |
| | (29.38 | )% |
| Total Other Loss | | $ | (11,019 | ) | | $ | (9,065 | ) | | 21.56 | % |
| Total Expenses | | $ | 1,737 |
| | $ | 2,103 |
| | (17.40 | )% |
| Net Loss | | $ | (6,185 | ) | | $ | (1,863 | ) | | 231.99 | % |
| Net loss per common share (Note 14) | | $ | (0.52 | ) | | $ | (0.16 | ) | | 225.00 | % |
| Weighted average common shares outstanding | | 11,985 |
| | 11,993 |
| | (0.07 | )% |
The main factors for the change in net loss for the quarter ended March 31, 2015 as compared to the quarter ended March 31, 2014 are the decrease in net interest income attributable to the decrease in our MBS portfolio, as well as a decrease in the gains on the sale of Agency Securities. Although the recognized loss on our derivatives decreased, it was not enough to offset the lower MBS portfolio yields. Declining net interest income in 2015 was also a factor. These factors result largely from the trend of generally falling interest rates in 2015 and 2014.
Net Interest Income
|
| | | | | | | | | | |
| | For the Quarter Ended | | Change vs. Prior Year |
| | March 31, 2015 | | March 31, 2014 | | 2015 |
| Agency Securities, net of amortization of premium | $ | 5,304 |
| | $ | 8,445 |
| | (37.19 | )% |
| Non-Agency Securities, including discount accretion | 2,697 |
| | 2,308 |
| | 16.85 | % |
| Interest expense | (1,430 | ) | | (1,448 | ) | | (1.24 | )% |
| Net Interest Income | $ | 6,571 |
| | $ | 9,305 |
| | (29.38 | )% |
Net interest income is a function of both our MBS portfolio size and net interest rate spread.
2015 vs. 2014
| |
| • | Our average MBS portfolio decreased from $1,327,581 at March 31, 2014 to $1,006,503 at March 31, 2015. |
| |
| • | Our net interest rate spread decreased from 2.04% at March 31, 2014 to 1.37% at March 31, 2015. |
At March 31, 2015 and December 31, 2014, our Agency Securities were carried at a net premium to par value with a weighted average amortized cost of 104.01% and 104.03%, respectively, because the average interest rates on these securities are higher than prevailing market rates. At March 31, 2015 and December 31, 2014, our Non-Agency Securities were carried at a net discount to par value with a weighted average amortized cost of 84.69% and 82.15%, respectively. These securities tend to trade on the basis of prices reflecting current assessments of expected credit performance in addition to relative yields.
The following table presents the components of the yield earned on our MBS portfolio (see Note 8 to the condensed consolidated financial statements for additional discussion of Linked Transactions through December 31, 2014).
|
| | | | | | | | | | | | |
| MBS | | Asset Yield | | Cost of Funds | | Net Interest Margin | | Interest Expense on Repurchase Agreements |
| Agency Securities: | | | | | | | | |
| March 31, 2015 | | 2.65 | % | | 1.76 | % | | 0.89 | % | | 0.42 | % |
| December 31, 2014 | | 2.77 | % | | 1.57 | % | | 1.20 | % | | 0.37 | % |
| September 30, 2014 | | 2.73 | % | | 1.37 | % | | 1.36 | % | | 0.36 | % |
| June 30, 2014 | | 2.85 | % | | 1.33 | % | | 1.52 | % | | 0.36 | % |
| March 31, 2014 | | 3.36 | % | | 1.56 | % | | 1.80 | % | | 0.39 | % |
| | | | | | | | | |
| Non-Agency Securities: | | | | | | | | |
| March 31, 2015 | | 5.18 | % | | 2.07 | % | | 3.11 | % | | 1.92 | % |
| December 31, 2014 (1) | | 5.09 | % | | 2.68 | % | | 2.41 | % | | 2.00 | % |
| September 30, 2014 (1) | | 4.72 | % | | 2.58 | % | | 2.14 | % | | 1.86 | % |
| June 30, 2014 (1) | | 4.37 | % | | 2.43 | % | | 1.94 | % | | 1.69 | % |
| March 31, 2014 (1) | | 4.79 | % | | 2.10 | % | | 2.69 | % | | 1.56 | % |
| | | | | | | | | |
| Total portfolio: | | | | | | | | |
| March 31, 2015 | | 3.17 | % | | 1.80 | % | | 1.37 | % | | 0.62 | % |
| December 31, 2014 (1) | | 3.25 | % | | 1.72 | % | | 1.53 | % | | 0.60 | % |
| September 30, 2014 (1) | | 3.18 | % | | 1.56 | % | | 1.62 | % | | 0.60 | % |
| June 30, 2014 (1) | | 3.20 | % | | 1.50 | % | | 1.70 | % | | 0.58 | % |
| March 31, 2014 (1) | | 3.71 | % | | 1.67 | % | | 2.04 | % | | 0.62 | % |
(1) Includes Linked Transactions
The yield on our assets is most significantly affected by the rate of repayments on our Agency Securities. The following graph shows the annualized CPR on a monthly basis.
Other Income (Loss)
|
| | | | | | | | | | | |
| | | For the Quarter Ended | | Change vs. Prior Year |
| | | March 31, 2015 | | March 31, 2014 | | 2015 |
| Realized gain on sale of Agency Securities (reclassified from Other comprehensive income (loss)) | | $ | 4,271 |
| | $ | 8,810 |
| | (51.52 | )% |
| Gain on Non-Agency Securities | | 2,606 |
| | 833 |
| | 212.85 | % |
| Unrealized net gain and net interest income from Linked Transactions | | — |
| | 4,427 |
| | (100.00 | )% |
| Subtotal | | $ | 6,877 |
| | $ | 14,070 |
| | (51.12 | )% |
| Realized loss on derivatives (1) | | (2,263 | ) | | (3,106 | ) | | (27.14 | )% |
| Unrealized loss on derivatives | | (15,633 | ) | | (20,029 | ) | | (21.95 | )% |
| Subtotal | | $ | (17,896 | ) | | $ | (23,135 | ) | | (22.65 | )% |
| Total Other Loss | | $ | (11,019 | ) | | $ | (9,065 | ) | | 21.56 | % |
(1) Interest expense related to our interest rate swap contracts is recorded in realized losses on derivatives on the statements of operations. For additional information see Note 10 to the condensed consolidated financial statements.
2015 vs. 2014
| |
| • | Gains on sale of Agency Securities resulted from the sales of Agency Securities during the quarter ended March 31, 2015 of $430,852 compared to $743,647 during the quarter ended March 31, 2014. Sales of Agency Securities in 2015, were primarily associated with increasing our investment in Non-Agency Securities. At March 31, 2015, March 31, 2014 and December 31, 2014, we also considered whether we intended to sell Agency Securities and whether it was more likely than not that we could meet our liquidity requirements and contractual obligations without selling Agency Securities. As a result of this evaluation, no other than temporary impairment was recognized for the quarters ended March 31, 2015 and March 31, 2014 and for the year ended December 31, 2014, respectively. |
| |
| • | Gain on Non-Agency Securities resulted from an increase in the fair value of these securities. |
| |
| • | Gains on Linked Transactions at March 31, 2014 resulted from an increase in the fair value of these securities. Due to a change in accounting method for Linked Transactions, at March 31, 2015, we do not have any securities considered Linked Transactions. See Note 4, "Recent Accounting Pronouncements." |
| |
| • | Losses on derivatives resulted from a combination of the following: |
| |
| ◦ | Our total interest rate swap contracts aggregate notional balance decreased from $801,250 at March 31, 2014 to $691,250 at March 31, 2015. |
| |
| ◦ | We decreased our total interest rate swaptions notional balance from $750,000 at March 31, 2014 to $0 at March 31, 2015. |
| |
| ◦ | The net loss for the quarter ended March 31, 2015 was the result of more gradual and sustained declines of interest rates. |
Expenses
|
| | | | | | | | | | | |
| | | For the Quarter Ended | | Changes vs. Prior Year |
| | | March 31, 2015 | | March 31, 2014 | | 2015 |
| Management fee | | $ | 901 |
| | $ | 912 |
| | (1.21 | )% |
| Professional fees | | 359 |
| | 742 |
| | (51.62 | )% |
| Insurance | | 99 |
| | 110 |
| | (10.00 | )% |
| Board compensation | | 179 |
| | 125 |
| | 43.20 | % |
| Other | | 199 |
| | 214 |
| | (7.01 | )% |
| Total Expenses | | $ | 1,737 |
| | $ | 2,103 |
| | (17.40 | )% |
Management fees are determined based on gross equity raised. Therefore, our management fee increases when we raise capital and declines when we repurchase previously issued stock. Gross equity raised was $239,481 and $243,282 for the quarters ended March 31, 2015 and March 31, 2014.
Professional fees include securities clearing, legal, audit and consulting costs and are generally driven by the size and complexity of our MBS portfolio, the volume of transactions we execute and the extent of research and due diligence activities we undertake on potential transactions. Also included were stockholder value advisory expenses of $187 in Q1 2014.
Insurance includes premiums for both general business and directors and officers liability coverage. Insurance policy periods do not correspond to calendar years.
Board compensation represents both cash and stock compensation for our Board. The quarter to quarter change in compensation resulted from a change that was made in Q2 2014 to provide stock-based compensation to our non-executive directors, compensate two additional non-executive board members, and provide additional compensation to our lead independent director and the chairs of our board and committees for 2014.
Other expenses include fees for market and pricing data, analytics and risk management systems and portfolio related data processing costs as well as stock exchange listing fees and similar shareholder related expenses. Year over year decrease reflects the results of our efforts to continually improve the capacity and sophistication of our portfolio management tools.
Taxable Income
As a REIT we are generally not subject to taxation. See Note 15 to the condensed consolidated financial statements.
Other Comprehensive Income (Loss)
Comprehensive income (loss) includes all changes in equity during a period except those resulting from investments by owners and distributions to owners. For the quarters ended March 31, 2015 and March 31, 2014, other comprehensive income (loss) totaled $3,970 and $(3,512), respectively, reflecting net unrealized gains or losses on available for sale Agency Securities net of amounts reclassified upon sale.
Financial Condition
Agency Securities
Security purchase and sale transactions, including purchases of "to be announced" securities, are recorded on the trade date. Gains or losses realized from the sale of securities are included in income and are determined using the specific identification method. We typically purchase Agency Securities at premium prices. Premiums and discounts associated with the purchase of Multi-Family MBS, which are generally not subject to prepayment, are amortized or accreted into interest income over the contractual lives of the securities using a level yield method. Premiums and discounts associated with the purchase of other Agency Securities are amortized or accreted into interest income over the actual lives of the securities, reflecting actual prepayments as they occur. The lower the constant prepayment rate, the lower the amount of amortization expense for a particular period. Accordingly, the yield on an asset and earnings are higher. If prepayment rates increase, the amount of amortization expense for a particular period will go up. These increased prepayment rates would act to decrease the yield on an asset and would decrease earnings.
The tables below summarize certain characteristics of our Agency Securities at March 31, 2015 and December 31, 2014.
March 31, 2015
|
| | | | | | | | | | | | | | | | | | | |
| Asset Type | | Principal Amount | | Fair Value | | Weighted Average Coupon | | CPR (1) | | Weighted Average Month to Reset or Maturity | | % of Total Agency Securities |
| Multi-Family MBS | | $ | 151,999 |
| | $ | 160,906 |
| | 3.19 | % | | 0.00 | % | | 112 | | 21.16 | % |
| 10 Year Fixed | | 2,208 |
| | 2,372 |
| | 3.50 | % | | 18.47 | % | | 119 | | 0.30 |
|
| 15 Year Fixed | | 399,870 |
| | 423,603 |
| | 3.16 | % | | 5.53 | % | | 159 | | 55.67 |
|
| 20 Year Fixed | | 42,292 |
| | 44,569 |
| | 3.43 | % | | 4.41 | % | | 198 | | 5.89 |
|
| 30 Year Fixed | | 121,953 |
| | 128,282 |
| | 3.50 | % | | 0.00 | % | | 357 | | 16.98 |
|
| Total or Weighted Average | | $ | 718,322 |
| | $ | 759,732 |
| | 3.24 | % | | 3.39 | % | | 185 | | 100.00 | % |
(1) Weighted average for all prepayments during the quarter ended March 31, 2015 including prepayments related to Agency Securities purchased during the quarter.
December 31, 2014
|
| | | | | | | | | | | | | | | | | | | |
| Asset Type | | Principal Amount | | Fair Value | | Weighted Average Coupon | | CPR (1) | | Weighted Average Month to Reset or Maturity | | % of Total Agency Securities |
| Multi-Family MBS | | $ | 225,449 |
| | $ | 233,702 |
| | 3.14 | % | | 0.00 | % | | 116 | | 21.98 | % |
| 15 Year Fixed | | 756,806 |
| | 796,243 |
| | 3.27 | % | | 7.50 | % | | 164 | | 73.80 |
|
| 20 Year Fixed | | 43,303 |
| | 45,576 |
| | 3.44 | % | | 8.62 | % | | 200 | | 4.22 |
|
| Total or Weighted Average | | $ | 1,025,558 |
| | $ | 1,075,521 |
| | 3.25 | % | | 5.90 | % | | 155 | | 100.00 | % |
(1) Weighted average for all prepayments during the year ended December 31, 2014, including prepayments related to Agency Securities purchased or sold during the year.
Our net interest income is primarily a function of the difference between the yield on our assets and the financing cost of owning those assets. Since we tend to purchase Agency Securities at a premium to par, the main item that can affect the yield on our Agency Securities after they are purchased is the rate at which the mortgage borrowers repay their loans. While the scheduled
repayments, which are the principal portion of the homeowners’ regular monthly payments, are fairly predictable, the unscheduled repayments, which are generally refinancing of the mortgage but can also result from repurchases of delinquent, defaulted, or modified loans, are less so. Being able to accurately estimate and manage these repayment rates is a critical portion of the management of our Agency Securities, not only for estimating current yield but also for considering the rate of reinvestment of those proceeds into new securities, the yields which those new securities may add to our Agency Securities and our hedging strategy.
Non-Agency Securities
We purchase Non-Agency Securities at prices which incorporate our expectations for prepayment speeds, defaults, delinquencies and severities. These expectations determine the yields we receive on our assets. If actual prepayment speeds, defaults, delinquencies and severities are different from our expectations, our actual yields could be higher or lower.
The tables below summarize certain characteristics of our Non-Agency Securities at March 31, 2015 and December 31, 2014 (including those underlying Linked Transactions through December 31, 2014).
March 31, 2015
|
| | | | | | | | | | | | | | | | |
| Asset Type | | Principal Amount | | Fair Value | | Weighted Average Coupon | | Weighted Average Month to Maturity | | % of Total Non-Agency Securities |
| Prime Fixed | | $ | 46,458 |
| | $ | 40,984 |
| | 5.38 | % | | 285 | | 20.43 | % |
| Prime Hybrid | | 18,052 |
| | 15,271 |
| | 2.26 | % | | 262 | | 7.94 |
|
| Prime Floater | | 34,750 |
| | 35,119 |
| | 4.35 | % | | 341 | | 15.28 |
|
| Alt-A Fixed | | 98,398 |
| | 81,803 |
| | 5.80 | % | | 270 | | 43.27 |
|
| Alt-A Hybrid | | 9,767 |
| | 8,144 |
| | 2.50 | % | | 253 | | 4.29 |
|
| NPL | | 20,000 |
| | 19,994 |
| | 3.50 | % | | 303 | | 8.79 |
|
| Total or Weighted Average | | $ | 227,425 |
| | $ | 201,315 |
| | 4.83 | % | | 287 | | 100.00 | % |
At March 31, 2015, our overall investment in Non-Agency Securities represented 20.95% of our total investment in MBS.
During the quarter ended March 31, 2015, we completed the purchase of Non-Agency Securities with a fair value of $8,940 that were previously treated as Linked Transactions with repayment at maturity of related repurchase agreement borrowings of $6,408.
December 31, 2014
|
| | | | | | | | | | | | | | | | |
| Asset Type | | Principal Amount | | Fair Value | | Weighted Average Coupon | | Weighted Average Month to Maturity | | % of Total Non-Agency Securities |
| Prime Fixed | | $ | 47,806 |
| | $ | 41,288 |
| | 5.43 | % | | 286 | | 24.23 | % |
| Prime Hybrid | | 18,565 |
| | 15,592 |
| | 2.29 | % | | 265 | | 9.41 |
|
| Prime Floater | | 19,750 |
| | 18,625 |
| | 4.22 | % | | 345 | | 10.01 |
|
| Alt-A Fixed | | 101,163 |
| | 84,012 |
| | 6.01 | % | | 272 | | 51.28 |
|
| Alt-A Hybrid | | 9,998 |
| | 8,354 |
| | 2.50 | % | | 254 | | 5.07 |
|
| Total or Weighted Average | | $ | 197,282 |
| | $ | 167,871 |
| | 5.15 | % | | 282 | | 100.00 | % |
As of December 31, 2014, our overall investment in Non-Agency Securities (including those underlying Linked Transactions) represented 13.50% of our total investment in MBS.
Repurchase Agreements
We have entered into repurchase agreements to finance most of our MBS. Our repurchase agreements are secured by our MBS and bear interest at rates that have historically moved in close relationship to the Federal Funds Rate and LIBOR. We have established borrowing relationships with numerous investment banking firms and other lenders, 19 of which had open repurchase agreements with us at March 31, 2015 and 20 of which had open repurchase agreements with us at December 31, 2014. We had outstanding balances under our repurchase agreements of $1,004,067 and $1,134,387 at March 31, 2015 and December 31, 2014, respectively.
Our repurchase agreements require excess collateral, known as a Haircut. At March 31, 2015, the average haircut percentage was 7.58% compared to 7.56% at December 31, 2014. See Note 9 to the condensed consolidated financial statements for a list of counterparties holding our excess collateral in excess of 5% of our total stockholders’ equity.
Derivative Instruments
We use various interest rate contracts to manage our interest rate risk as we deem prudent in light of market conditions and the associated costs with counterparties that have a high quality credit rating and with futures exchanges. We generally pay a fixed rate and receive a floating rate with the objective of fixing a portion of our borrowing costs and hedging the change in our book value to some degree. The floating rate we receive is generally the Federal Funds Rate or LIBOR. While our policies do not contain specific requirements as to the percentages or amount of interest rate risk that we are required to hedge, we maintain an overall target of hedging at least 40% of our non-adjustable rate mortgages. We also consider other metrics, including the effective duration of our derivatives, to manage our interest rate risk. At March 31, 2015, and December 31, 2014, the notional value of our derivatives was 78.33% and 69.27%, respectively, of the fair market value of our non-adjustable rate mortgages (including those underlying Linked Transactions through December 31, 2014). For interest rate risk mitigation purposes, we consider Agency Securities to be ARMs if their interest rate is either currently subject to adjustment according to prevailing rates or if they are within 18 months of the period where such adjustments will occur. No assurance can be given that our derivatives will have the desired beneficial impact on our results of operations or financial condition. We have not elected cash flow hedge accounting treatment as allowed by GAAP. Since we do not designate our derivative activities as cash flow hedges, realized as well as unrealized gains/losses from these transactions will impact our earnings.
Use of derivative instruments may fail to protect or could adversely affect us because, among other things:
| |
| • | available derivatives may not correspond directly with the interest rate risk for which protection is sought (e.g., the difference in interest rate movements for long term U.S. Treasury Securities compared to Agency Securities); |
| |
| • | the duration of the derivatives may not match the duration of the related liability; |
| |
| • | the counterparty to a derivative agreement with us may default on its obligation to pay or not perform under the terms of the agreement and the collateral posted may not be sufficient to protect against any consequent loss; |
| |
| • | we may lose collateral we have pledged to secure our obligations under a derivative agreement if the associated counterparty becomes insolvent or files for bankruptcy; |
| |
| • | we may experience a termination event under one or more of our derivative agreements related to our REIT status, equity levels and performance, which could result in a payout to the associated counterparty and a taxable loss to us; |
| |
| • | the credit-quality of the party owing money on the derivatives may be downgraded to such an extent that it impairs our ability to sell or assign our side of the hedging transaction; and |
| |
| • | the value of derivatives may be adjusted from time to time in accordance with GAAP to reflect changes in fair value; downward adjustments, or “mark-to-market losses,” would reduce our net income or increase any net loss. |
At March 31, 2015 and December 31, 2014, we had interest rate swap contracts (including swaptions) with an aggregate notional balance of $691,250 and $861,250, respectively. These derivative transactions are designed to lock in some funding costs for financing activities associated with our assets in such a way as to help assure the realization of attractive net interest margins and to vary inversely in value with a portion of our MBS portfolio. Such contracts are based on assumptions about prepayments which, if not realized, will cause results to differ from expectations.
Although we attempt to structure our derivatives to offset the changes in asset prices, they are not perfectly correlated and depend on the corresponding durations and sections of the yield curve that moves to offset each other. For the quarters ended March 31, 2015 and March 31, 2014, we recognized a net loss of $(17,896) and $(23,135), respectively, related to our derivatives. The net unrealized gain on Agency Securities for the quarters ended March 31, 2015 and March 31, 2014 was $8,241 and $5,298, respectively. The changes in the net unrealized gain on Agency Securities is due to market price fluctuations.
As required by the Dodd-Frank Act, the Commodity Futures Trading Commission has adopted rules requiring certain interest rate swap contracts to be cleared through a derivatives clearing organization. We are required to clear certain new interest rate swap contracts. Cleared interest rate swaps may have higher margin requirements than un-cleared interest rate swaps we previously had. We have established an account with a futures commission merchant for this purpose. To date, we have not entered into any cleared interest rate swap contracts.
Liquidity and Capital Resources
At March 31, 2015, we financed our MBS portfolio with $1,004,067 of borrowings under repurchase agreements and our leverage ratio was 7.54 to 1. At March 31, 2015, our liquidity totaled $32,878, consisting of $19,505 of cash plus $13,373 of unpledged securities (including securities received as collateral). Our primary sources of funds are borrowings under repurchase arrangements, monthly principal and interest payments on our investments and cash generated from our operating results. Other sources of funds may include proceeds from equity and debt offerings and asset sales. We generally maintain liquidity to pay down borrowings under repurchase arrangements to reduce borrowing costs and otherwise efficiently manage our long-term investment capital. Because the level of our borrowings can be adjusted on a daily basis, the level of cash carried on our balance sheet is significantly less important than our potential liquidity available under our borrowing arrangements. We currently believe that we have sufficient liquidity and capital resources available for the acquisition of additional investments, repayments on repurchase borrowings, reacquisition of securities to be returned to borrowers and the payment of cash dividends as required for continued qualification as a REIT.
In addition to the repurchase agreement financing discussed above, from time to time we have entered into reverse repurchase agreements with certain of our repurchase agreement counterparties. Under a typical reverse repurchase agreement, we purchase U.S. Treasury Securities from a borrower in exchange for cash and agree to sell the same securities back in the future. We then sell such U.S. Treasury Securities to third parties and recognize a liability to return the securities to the original borrower. Reverse repurchase agreement receivables and repurchase agreement liabilities are presented net when they meet certain criteria, including being with the same counterparty, being governed by the same MRA, settlement through the same brokerage or clearing account and maturing on the same day. The practical effect of these transactions is to replace a portion of our repurchase agreement financing of our MBS portfolio with short positions in U.S. Treasury Securities. We believe that this helps to reduce interest rate risk, and therefore counterparty credit and liquidity risk. Both parties to the repurchase and reverse repurchase transactions have the right to make daily margin calls based on changes in the value of the collateral obtained and/or pledged. We did not have any reverse repurchase agreements outstanding at March 31, 2015 or December 31, 2014.
Our primary uses of cash are to purchase MBS, pay interest and principal on our borrowings, fund our operations and pay dividends. During the quarter ended March 31, 2015, we purchased $163,504 of MBS using proceeds from repurchase agreements and principal repayments. During the quarter ended March 31, 2015, we received cash of $24,789 from prepayments and scheduled principal payments on our MBS. Our total repurchase indebtedness was approximately $1,004,067 at March 31, 2015, and we made cash interest payments of approximately $7,674 on our liabilities for the quarter ended March 31, 2015. Part of funding our operations includes providing margin cash to offset liability balances on our derivatives. The amount of cash collateral posted to counterparties increased by $8,582 and we decreased our liability by $2,352 for cash collateral posted by counterparties to us at March 31, 2015.
Repurchase and Related Facilities
At March 31, 2015, we had MRAs with 30 counterparties and had $1,004,067 in outstanding borrowings with 19 of those counterparties. At December 31, 2014, we had MRAs with 30 counterparties and had $1,134,387 in outstanding borrowings with 20 of those counterparties.
The following tables represent the contractual repricing and other information regarding our repurchase agreements at March 31, 2015 and our repurchase agreements and Linked Transactions through December 31, 2014 (see Note 9 to the condensed consolidated financial statements for additional discussion of repurchase agreements and Note 8 to the condensed consolidated financial statements for additional discussion of Linked Transactions for the year ended December 31, 2014).
|
| | | | | | | | | | | | |
| March 31, 2015 | | Repurchase Agreements | | Weighted Average Contractual Rate | | Weighted Average Maturity in days | | Haircut for Repurchase Agreements (1) |
| Agency Securities | | $ | 866,746 |
| | 0.36 | % | | 40 | | 4.88 | % |
| Non-Agency Securities | | 104,208 |
| | 1.71 | % | | 38 | | 23.51 | % |
| U.S. Treasury Securities | | 33,113 |
| | 0.11 | % | | 1 | | 0.00 | % |
| Total or Weighted Average | | $ | 1,004,067 |
| | 0.5 | % | | 38 | | 7.58 | % |
(1) The Haircut represents the weighted average margin requirement, or the percentage amount by which the collateral value must exceed the loan amount.
|
| | | | | | | | | | | | |
| December 31, 2014 | | Repurchase Agreements | | Weighted Average Contractual Rate | | Weighted Average Maturity in days | | Haircut for Repurchase Agreements (1) |
| Agency Securities | | $ | 1,020,916 |
| | 0.37 | % | | 39 | | 4.87 | % |
Non-Agency Securities and Linked Transactions (2) | | 77,081 |
| | 1.76 | % | | 46 | | 25.42 | % |
| U.S. Treasury Securities | | 42,774 |
| | 0.19 | % | | 2 | | 0.00 | % |
| Total or Weighted Average | | $ | 1,140,771 |
| | 0.46 | % | | 38 | | 7.64 | % |
(1) The Haircut represents the weighted average margin requirement, or the percentage amount by which the collateral value must exceed the loan amount.
(2) Includes $6,384 of repurchase agreements on Linked Transactions.
|
| | | | | | | | | | | | | |
| | March 31, 2015 | | December 31, 2014 |
| Maturing or Repricing | Repurchase Agreements | | Weighted Average Contractual Rate | | Repurchase Agreements (1) | | Weighted Average Contractual Rate |
| Within 30 days | $ | 454,518 |
| | 0.55 | % | | $ | 523,531 |
| | 0.44 | % |
| 31 days to 60 days | 305,196 |
| | 0.38 | % | | 289,819 |
| | 0.41 | % |
| 61 days to 90 days | 244,353 |
| | 0.55 | % | | 327,421 |
| | 0.52 | % |
| Greater than 90 days | — |
| | 0.00 | % | | — |
| | 0.00 | % |
| Total | $ | 1,004,067 |
| | 0.50 | % | | $ | 1,140,771 |
| | 0.46 | % |
(1) The table above includes $124,540 of repurchase agreements on Linked Transactions at December 31, 2014.
We have 7 repurchase agreement counterparties that individually account for 5% or greater of our aggregate borrowings. In total, these counterparties account for approximately 62.19% of our repurchase agreement borrowings outstanding at March 31, 2015.
The table below represents information about repurchase agreement counterparties where the amount at risk exceeds 5% of our stockholders' equity at March 31, 2015.
|
| | | | | | |
| Repurchase Agreement Counterparty | | Amount at Risk | | Weighted Average Maturity of Repurchase Agreements in days |
| Bank of America-Merrill Lynch | | $ | 7,000 |
| | 24 |
| Royal Bank of Canada | | 10,350 |
| | 50 |
| Wells Fargo | | 6,967 |
| | 27 |
| Total | | $ | 24,317 |
| | |
In April 2014, we entered in to a long term collateral exchange agreement whereby we will receive approximately $50,000 of U.S. Treasury Securities or cash for two years (declining to $30,000 for a third year) in exchange for certain of our Non-Agency Securities. At March 31, 2015, our repurchase agreement balance on our condensed consolidated balance sheet includes borrowing against these U.S. Treasury Securities pledged to us under this agreement.
Declines in the value of our MBS portfolio can trigger margin calls by our lenders under our repurchase agreements. An event of default or termination event under the standard MRA would give our counterparty the option to terminate all repurchase transactions existing with us and require any amount due to be payable immediately.
The residential mortgage market in the U.S. has experienced difficult economic conditions including:
| |
| • | increased volatility of many financial assets, including Agency Securities and other high-quality RMBS assets; |
| |
| • | increased volatility and deterioration in the broader residential mortgage and RMBS markets; and |
| |
| • | statements and actions by the Fed and other regulators impacting financing of RMBS. |
While conditions have improved, should there be a reoccurrence of difficulties in the residential mortgage market, our lenders may be forced to exit the repurchase market, become insolvent or further tighten lending standards, or increase the amount of required equity capital or Haircut, any of which could make it more difficult or costly for us to obtain financing.
Financial sector volatility can also lead to increased demand and prices for high quality debt securities, including Agency Securities. While increased prices may increase the value of our MBS, higher values may also reduce the return on reinvestment of capital, thereby lowering our future profitability.
The following graph represents the month-end outstanding balances of our repurchase agreements (before the effect of netting reverse repurchase agreements and Linked Transactions), which finance most of our MBS. The balance of repurchase agreements outstanding will fluctuate within any given month based on changes in the market value of the particular MBS pledged as collateral (including the effects of principal pay downs) and the level and timing of investment and reinvestment activity.
Effects of Margin Requirements, Leverage and Credit Spreads
Our MBS have values that fluctuate according to market conditions and, as discussed above, the market value of our MBS will decrease as prevailing interest rates or credit spreads increase. When the value of the securities pledged to secure a repurchase loan decreases to the point where the positive difference between the collateral value and the loan amount is less than the Haircut, our lenders may issue a margin call, which means that the lender will require us to pay the margin call in cash or pledge additional collateral to meet that margin call. Under our repurchase facilities, our lenders have full discretion to determine the value of the MBS we pledge to them. Most of our lenders will value securities based on recent trades in the market. Lenders also issue margin calls as the published current principal balance factors change on the pool of mortgages underlying the securities pledged as collateral when scheduled and unscheduled principal repayments are announced monthly.
We experience margin calls in the ordinary course of our business and under certain conditions, such as during a period of declining market value for MBS and we may experience margin calls monthly or as frequently as daily. In seeking to effectively manage the margin requirements established by our lenders, we maintain a position of cash and unpledged securities. We refer to this position as our liquidity. The level of liquidity we have available to meet margin calls is directly affected by our leverage levels, our Haircuts and the price changes on our securities. If interest rates increase as a result of a yield curve shift or for another reason or if credit spreads widen, the prices of our collateral (and our unpledged assets that constitute our liquidity) will decline and we may experience margin calls. We will use our liquidity to meet such margin calls. There can be no assurance that we will maintain sufficient levels of liquidity to meet any margin calls. If our Haircuts increase, our liquidity will proportionately decrease. If we increase our borrowings, our liquidity will decrease by the amount of additional Haircut on the increased level of indebtedness. In addition, certain of our MRAs contain a restriction that prohibits our leverage from exceeding twelve times our stockholders’ equity as well as termination events in the case of significant reductions in equity capital.
We intend to maintain a level of liquidity in relation to our assets that enables us to meet reasonably anticipated margin calls but that also allows us to be substantially invested in MBS. We may misjudge the appropriate amount of our liquidity by maintaining excessive liquidity, which would lower our investment returns, or by maintaining insufficient liquidity, which would force us to involuntarily liquidate assets into unfavorable market conditions and harm our results of operations and financial condition.
We generally seek to borrow (on a recourse basis) between six and ten times the amount of our total stockholders’ equity to finance the Agency Securities in which we invest and between one and three times the amount of our stockholders’ equity to finance the Non-Agency Securities in which we invest, but we are not limited to those ranges. At March 31, 2015 and December 31, 2014, our total borrowings were approximately $1,004,067 and $1,134,387 (excluding accrued interest), respectively. At March 31, 2015 and December 31, 2014, we had a leverage ratio of approximately 7.54:1 and 8.13:1, respectively.
Forward-Looking Statements Regarding Liquidity
Based on our current portfolio, leverage rate and available borrowing arrangements, we believe that our cash flow from operations and our ability to make timely portfolio adjustments, will be sufficient to enable us to meet anticipated short-term (one year or less) liquidity requirements such as to fund our investment activities, meet our financing obligations, pay fees under the Management Agreement, fund our distributions to stockholders and pay general corporate expenses.
We may increase our capital resources by obtaining long-term credit facilities or making public or private offerings of equity or debt securities, including classes of preferred stock, common stock and senior or subordinated notes to meet our long-term (greater than one year) liquidity. Such financing will depend on market conditions for capital raises and for the investment of any proceeds and there can be no assurances that we will successfully obtain any such financing.
Stockholders' Equity
See Note 13 to the condensed consolidated financial statements.
Off-Balance Sheet Arrangements
At March 31, 2015 and December 31, 2014, we had not maintained any relationships with unconsolidated entities or financial partnerships, such as entities often referred to as structured finance, or special purpose or variable interest entities, established for the purpose of facilitating off-balance sheet arrangements or other contractually narrow or limited purposes. Furthermore, at March 31, 2015 and December 31, 2014, we had not guaranteed any obligations of any unconsolidated entities or entered into any commitment or intent to provide funding to any such entities.
Critical Accounting Policies
See Note 3 to the condensed consolidated financial statements for our significant accounting policies.
Valuation of MBS and Derivatives
We carry our MBS and derivatives at fair value. Our Agency Securities are classified as available for sale, and therefore unrealized changes in fair value are reflected directly in stockholders' equity as accumulated other comprehensive income or loss. Our Non-Agency Securities are classified as trading securities, and therefore changes in fair value are reported in the condensed consolidated statements of operations as income or loss. We do not use cash flow hedge accounting for our derivatives for financial reporting purposes and therefore changes in fair value are reflected in net income as other gain or loss. To the extent that fair value changes on derivatives offset fair value changes in our MBS, the fluctuation in our stockholders' equity will be lower. For example, rising interest rates may tend to result in an overall increase in our reported net income even while our stockholders' equity declines.
Fair value for the Agency Securities in our MBS portfolio is based on obtaining a valuation for each Agency Security from third party pricing services and/or dealer quotes. The third party pricing services use common market pricing methods that may include pricing models that may incorporate such factors as coupons, prepayment speeds, spread to the Treasury curves and interest rate swap curves, duration, periodic and life caps and credit enhancement. If the fair value of an Agency Security is not available from the third party pricing services or such data appears unreliable, we obtain quotes from up to three dealers who make markets in similar Agency Securities. In general, the dealers incorporate common market pricing methods, including a spread measurement to the Treasury curve or interest rate swap curve as well as underlying characteristics of the particular Agency Security including coupon, periodic and life caps, collateral type, rate reset period and seasoning or age of the Agency Security. Management reviews pricing used to ensure that current market conditions are properly reflected. This review includes, but is not limited to, comparisons of similar market transactions or alternative third party pricing services, dealer quotes and comparisons to a third party pricing model.
The fair values of our derivatives are valued using information provided by third party pricing services that incorporate common market pricing methods that may include current interest rate curves, forward interest rate curves and market spreads to interest rate curves. Management compares pricing information received to dealer quotes to ensure that the current market conditions are properly reflected.
Fair value for the Non-Agency Securities in our MBS portfolio is based on estimates prepared by our Portfolio Management group, which organizationally reports to our Chief Investment Officer. In preparing the estimates, our Portfolio Management group uses commercially available and proprietary models and data as well as market intelligence gained from discussions with, and transactions by, other market participants. We estimate the fair value of our Non-Agency Securities by estimating the future cash flows for each Non-Agency Security and then discounting those cash flows based on our estimates of current market yield for each individual security. Our estimates for future cash flows and current market yields incorporate such factors as collateral type, bond structure and priority of payments, coupons, prepayment speeds, defaults, delinquencies and severities. Quarterly, we compare our estimates of fair value of our Non-Agency Securities with pricing from third party pricing services, dealer marks received and recent purchase and financing transaction history to validate our assumptions of cash flow and market yield and calibrate our models.
Realized Gains and Losses on Agency Securities
Security purchase and sale transactions, including purchase of "to be announced" securities, are recorded on the trade date. Gains or losses realized from the sale of securities are included in income and are determined using the specific identification method. We realize gains and losses on our Agency Securities upon their sale. At that time, previously unrealized amounts included in accumulated other comprehensive income are reclassified and reported in net income as other gain or loss. To the extent that we sell Agency Securities in later periods after changes in the fair value of those Agency Securities have occurred, we may report significant net income or net loss without a corresponding change in our total stockholders' equity.
Declines in the fair values of our Agency Securities that represent other than temporary impairments are also treated as realized losses and reported in net income as other loss. We evaluate Agency Securities for other than temporary impairment at least on a quarterly basis and more frequently when economic or market concerns warrant such evaluation. We consider an impairment to be other than temporary if we (1) have the intent to sell the Agency Securities, (2) believe it is more likely than not that we will be required to sell the securities before recovery (for example, because of liquidity requirements or contractual obligations) or (3) a credit loss exists. Impairment losses recognized establish a new cost basis for the related Agency Securities. Gains or losses on subsequent sales are determined by reference to such new cost basis.
Gains and Losses on Non-Agency Securities
We carry our Non-Agency Securities at fair value and reflect changes in those fair values in net income as other gains and losses.
Inflation
Virtually all of our assets and liabilities are interest rate-sensitive in nature. As a result, interest rates and other factors influence our performance far more than inflation. Changes in interest rates do not necessarily correlate with inflation rates or changes in inflation rates. Our condensed consolidated financial statements are prepared in accordance with GAAP and any distributions we may make will be determined by our Board based in part on our taxable REIT income as calculated according to the requirements of the Code. In each case, our activities and balance sheet are measured with reference to fair value without considering inflation.
Subsequent Events
See Note 18 to the condensed consolidated financial statements.
CAUTIONARY NOTE REGARDING FORWARD-LOOKING STATEMENTS
This report contains various “forward-looking statements.” Forward-looking statements relate to expectations, beliefs, projections, future plans and strategies, anticipated events or trends and similar expressions concerning matters that are not historical facts. In some cases, you can identify forward-looking statements by the use of forward-looking terminology such as “believes,” “expects,” “may,” “will,” “would,” “could,” “should,” “seeks,” “approximately,” “intends,” “plans,” “projects,” “estimates” or “anticipates” or the negative of these words and phrases or similar words or phrases. All forward-looking statements may be impacted by a number of risks and uncertainties, including statements regarding the following subjects:
| |
| • | our business and investment strategy; |
| |
| • | our anticipated results of operations; |
| |
| • | statements about future dividends; |
| |
| • | our ability to obtain financing arrangements; |
| |
| • | our understanding of our competition and ability to compete effectively; |
| |
| • | market, industry and economic trends; and |
The forward-looking statements in this report are based on our beliefs, assumptions and expectations of our future performance, taking into account all information currently available to us. These beliefs, assumptions and expectations are subject to risks and uncertainties and can change as a result of many possible events or factors, not all of which are known to us. If a change occurs, our business, financial condition, liquidity and results of operations may vary materially from those expressed in our forward-looking statements. You should carefully consider these risks before you make an investment decision with respect to our stock, along with the following factors that could cause actual results to vary from our forward-looking statements:
| |
| • | mortgage loan modification programs and future legislative action; |
| |
| • | actions by the Fed which could cause a flattening of the yield curve, which could materially adversely affect our business, financial condition and results of operations and our ability to pay distributions to our stockholders; |
| |
| • | the impact of the delay or failure of the U.S. Government in reaching an agreement on the national debt ceiling; |
| |
| • | availability, terms and deployment of capital; |
| |
| • | changes in economic conditions generally; |
| |
| • | changes in interest rates, interest rate spreads, the yield curve or prepayment rates; |
| |
| • | general volatility of the financial markets, including markets for MBS; |
| |
| • | the downgrade of the U.S. Government’s or certain European countries’ credit ratings and future downgrades of the U.S. Government’s or certain European countries’ credit ratings may materially adversely affect our business, financial condition and results of operations; |
| |
| • | the impact of the federal conservatorship of Fannie Mae and Freddie Mac and related efforts, along with any changes in laws and regulations affecting the relationship between Fannie Mae and Freddie Mac and the U.S. Government and the Fed; |
| |
| • | the possible material adverse effect on our business if the U.S. Congress passed legislation reforming or winding down Fannie Mae or Freddie Mac; |
| |
| • | availability of suitable investment opportunities; |
| |
| • | the degree and nature of the competition for investments in our target assets; |
| |
| • | changes in our business and investment strategy; |
| |
| • | our failure to maintain an exemption from being regulated as a commodity pool operator; |
| |
| • | our dependence on ACM and ability to find a suitable replacement if ACM was to terminate its management relationship with us; |
| |
| • | the existence of conflicts of interest in our relationship with ACM, ARMOUR, certain of our directors and our officers, which could result in decisions that are not in the best interest of our stockholders; |
| |
| • | our management’s competing duties to other affiliated entities, which could result in decisions that are not in the best interests of our stockholders. |
| |
| • | changes in personnel at ACM or the availability of qualified personnel at ACM; |
| |
| • | limitations imposed on our business by our status as a REIT under the Code; |
| |
| • | the potential burdens on our business of maintaining our exclusion from the 1940 Act and possible consequences of losing that exclusion; |
| |
| • | changes in GAAP, including interpretations thereof; and |
| |
| • | changes in applicable laws and regulations. |
We cannot guarantee future results, levels of activity, performance or achievements. You should not place undue reliance on forward-looking statements, which apply only as of the date of this report. We do not intend and disclaim any duty or obligation to update or revise any industry information or forward-looking statements set forth in this report to reflect new information, future events or otherwise, except as required under the U.S. Federal securities laws.
“Agency Securities” means securities issued or guaranteed by Fannie Mae, Freddie Mac and Ginnie Mae; interests in or obligations backed by pools of fixed rate, hybrid adjustable rate and adjustable rate mortgage loans.
“ARMOUR” means ARMOUR Residential REIT, Inc.
"ARMs" means Adjustable Rate Mortgage backed securities
"AVM" means AVM L.P.
“Board” means JAVELIN's Board of Directors
"CFO" means our Chief Financial Officer, James Mountain
"Co-CEOs" means our Co-Chief Executive Officers, Jeffrey Zimmer and Scott Ulm
"CMBS" means commercial mortgage backed securities
“Code” means the Internal Revenue Code
“CPR” means constant prepayment rate
"Dodd-Frank Act" means the Dodd-Frank Wall Street Reform and Consumer Protection Act
"Exchange Act" means the Securities Exchange Act of 1934, as amended
“Fannie Mae” means the Federal National Mortgage Association
“Fed” means the U.S. Federal Reserve
“Freddie Mac” means the Federal Home Loan Mortgage Corporation
“GAAP” means accounting principles generally accepted in the United States of America
"GDP" means gross domestic product
“Ginnie Mae” means the Government National Mortgage Administration
“GSE” means U.S. Government Sponsored Entity, such as the Federal National Mortgage Association (Fannie Mae), the Federal Home Loan Mortgage Corporation (Freddie Mac) and the Government National Mortgage Administration (Ginnie Mae).
"Haircut" means the weighted average margin requirement, or the percentage amount by which the collateral value must exceed the loan amount. Among other things, it is a measure of our unsecured credit risk to our lenders.
"Hybrid" means a mortgage that has a fixed rate for an initial term after which the rate becomes adjustable according to a specific schedule.
“LIBOR” means the London Interbank Offered Rate
“Management Agreement” means the management agreement between JMI and ACM whereby ACM performs certain services for JMI in exchange for a specified fee. The current version of the Management Agreement was filed as an exhibit to our 2014 Form 10-K and incorporated herein by reference in the exhibit index.
“MBS” means mortgage backed securities, a security representing a direct interest in a pool of mortgage loans. The pass-through issuer or servicer collects the payments on the loans in the pool and "passes through" the principal and interest to the security holders on a pro rata basis.
"MGCL" means Maryland General Corporation Law
“MRA” means master repurchase agreement. A document that outlines standard terms between the Company and counterparties for repurchase agreement transactions.
"Multi-Family MBS" means MBS issued under Fannie Mae's Delegated Underwriting System (DUS) program.
“Non-Agency Securities” means securities backed by residential mortgages in which we invest, for which the payment of principal and interest is not guaranteed by a GSE or government agency
"NYSE" means New York Stock Exchange
“REIT” means Real Estate Investment Trust. A special purpose investment vehicle that provides investors with the ability to participate directly in the ownership or financing of real-estate related assets by pooling their capital to purchase and manage mortgage loans and/or income property.
"Repurchase Program" means the Company's common stock repurchase program authorized by our Board in October 2013 for an initial authorization of up to 2,000 shares of our common stock outstanding, and increased by our Board in March 2014 to 3,000 shares of our common stock outstanding
“RMBS” means residential mortgage backed securities
“SEC” means the Securities and Exchange Commission
“SBBC” means Staton Bell Blank Check LLC
“S&P 500” means Standard and Poor's 500 Stock Index
“Sub-Management Agreement” means the sub-management agreement between JAVELIN, ACM and SBBC. ACM is responsible for the payment of a monthly sub-management fee to SBBC.
“U.S.” means United States
“1940 Act” means the Investment Company Act of 1940
Item 3. Quantitative and Qualitative Disclosures About Market Risk
We seek to manage our risks related to the credit-quality of our assets, interest rates, liquidity, prepayment speeds and market value while, at the same time, seeking to provide an opportunity to stockholders to realize attractive risk adjusted returns through ownership of our capital stock. While we do not seek to avoid risk completely, we believe the risk can be quantified from historical experience and we seek to actively manage that risk, to earn sufficient compensation to justify taking those risks and to maintain capital levels consistent with the risks we undertake. See also Item 1A. Risk Factors - Risks Related to our Business.
Interest Rate, Cap and Mismatch Risk
We invest in fixed rate, hybrid adjustable rate and adjustable rate MBS. Hybrid mortgages are ARMs that have a fixed-interest rate for an initial period of time (typically three years or greater) and then convert to an adjustable rate for the remaining loan term. Our debt obligations are generally repurchase agreements of limited duration that are periodically refinanced at current market rates.
ARM-related assets are typically subject to periodic and lifetime interest rate caps that limit the amount an ARM-related asset’s interest rate can change during any given period. ARM securities are also typically subject to a minimum interest rate payable. Our borrowings are not subject to similar restrictions. Hence, in a period of increasing interest rates, interest rates on our borrowings could increase without limitation, while the interest rates on our mortgage related assets could be limited. This exposure would be magnified to the extent we acquire fixed rate MBS or ARM securities that are not fully indexed. Further, some ARM-related assets may be subject to periodic payment caps that result in some portion of the interest being deferred and added to the principal outstanding. These factors could lower our net interest income or cause a net loss during periods of rising interest rates, which would negatively impact our liquidity, net income and our ability to make distributions to stockholders.
We fund the purchase of a substantial portion of our ARM-related assets with borrowings that have interest rates based on indices and repricing terms similar to, but of shorter maturities than, the interest rate indices and repricing terms of our mortgage assets. Thus, we anticipate that in most cases the interest rate indices and repricing terms of our mortgage assets and our funding sources will not be identical, thereby creating an interest rate mismatch between assets and liabilities. During periods of changing interest rates, such interest rate mismatches could negatively impact our net interest income, dividend yield and the market price of our stock. Most of our adjustable rate assets are based on the one-year constant maturity treasury rate and the one-year LIBOR rate and our debt obligations are generally based on LIBOR. These indices generally move in the same direction, but there can be no assurance that this will continue to occur.
Our ARM-related assets and borrowings reset at various different dates for the specific asset or obligation. In general, the repricing of our debt obligations occurs more quickly than on our assets. Therefore, on average, our cost of funds may rise or fall more quickly than does our earnings rate on our assets.
Furthermore, our net income may vary somewhat as the spread between one-month interest rates, the typical term for our repurchase agreements, and six-month and twelve-month interest rates, the typical reset term of adjustable rate MBS, varies.
Prepayment Risk
As we receive repayments of principal on our Agency Securities from prepayments and scheduled payments, premiums paid on such securities are amortized against interest income and discounts are accreted to interest income as realized. Premiums arise when we acquire Agency Securities at prices in excess of the principal balance of the mortgage loans underlying such Agency Securities. Conversely, discounts arise when we acquire Agency Securities at prices below the principal balance of the mortgage loans underlying the Agency Securities. The structural characteristics of our Non-Agency Securities make them less sensitive to variations in prepayment speeds of the underlying mortgage loans. Volatility in actual prepayment speeds will create volatility in the amount of premium amortization we recognize. Higher speeds will reduce our interest income and lower speeds will increase our interest income. At March 31, 2015 and December 31, 2014, the majority of our Agency Securities were purchased at a premium to par and all of our Non-Agency Securities were purchased at or below par.
Credit Risk for Non-Agency Securities
We purchase Non-Agency Securities at prices which incorporate our expectations for prepayment speeds, defaults, delinquencies and severities. These expectations determine the yields we receive on our assets. If actual prepayment speeds, defaults, delinquencies and severities are different from our expectations, our actual yields could be higher or lower.
Interest Rate Risk and Effect on Market Value Risk
Another component of interest rate risk is the effect changes in interest rates will have on the market value of our MBS. We face the risk that the market value of our MBS will increase or decrease at different rates than that of our liabilities, including our derivative instruments and obligations to return securities received as collateral.
We primarily assess our interest rate risk by estimating the effective duration of our assets and the effective duration of our liabilities and by estimating the time difference between the interest rate adjustment of our assets and the interest rate adjustment of our liabilities. Effective duration essentially measures the market price volatility of financial instruments as interest rates change. We generally estimate effective duration using various financial models and empirical data. Different models and methodologies can produce different effective duration estimates for the same securities.
The sensitivity analysis tables presented below reflect the estimated impact of an instantaneous parallel shift in the yield curve, up and down 50 and 100 basis points, on the market value of our interest rate-sensitive investments and net interest income, at March 31, 2015 and December 31, 2014. It assumes that the spread between the interest rates on Agency Securities and long term U.S. Treasury Securities remains constant. Actual interest rate movements over time will likely be different, and such differences may be material. When evaluating the impact of changes in interest rates, prepayment assumptions and principal reinvestment rates are adjusted based on ACM’s expectations. The analysis presented utilized assumptions, models and estimates of ACM based on ACM’s judgment and experience.
March 31, 2015
|
| | | | |
| Change in Interest Rates | | Percentage Change in Projected Net Interest Income | | Percentage Change in Projected Portfolio Value Including Derivatives |
| 1.00% | | (10.34)% | | 0.24% |
| 0.50% | | (5.14)% | | 0.15% |
| (0.50)% | | 6.25% | | (0.27)% |
| (1.00)% | | 6.29% | | (0.82)% |
December 31, 2014
|
| | | | |
| Change in Interest Rates | | Percentage Change in Projected Net Interest Income | | Percentage Change in Projected Portfolio Value Including Derivatives |
| 1.00% | | 5.96% | | 0.52% |
| 0.50% | | 3.27% | | 0.28% |
| (0.50)% | | 5.27% | | 0.40% |
| (1.00)% | | 8.34% | | (1.06)% |
While the tables above reflect the estimated immediate impact of interest rate increases and decreases on a static portfolio, we rebalance our MBS portfolio from time to time either to seek to take advantage of or reduce the impact of changes in interest rates. It is important to note that the impact of changing interest rates on market value and net interest income can change significantly when interest rates change beyond 100 basis points from current levels. Therefore, the volatility in the market value of our assets could increase significantly when interest rates change beyond amounts shown in the tables above. In addition, other factors impact the market value of and net interest income from our interest rate-sensitive investments and derivative instruments, such as the shape of the yield curve, market expectations as to future interest rate changes and other market conditions. Accordingly, interest income would likely differ from that shown above and such difference might be material and adverse to our stockholders.
The above tables quantify the potential changes in net interest income and portfolio value, which includes the value of our derivatives, should interest rates immediately change. Given the low level of interest rates at March 31, 2015 and December 31, 2014, we applied a floor of 0% for all anticipated interest rates included in our assumptions. Due to the presence of this floor, it is anticipated that any hypothetical interest rate decrease would have a limited positive impact on our funding costs beyond a certain level; however, because prepayment speeds are unaffected by this floor, it is expected that any increase in our prepayment speeds (occurring as a result of any interest rate decrease or otherwise) could result in an acceleration of our premium amortization and the reinvestment of such prepaid principal in lower yielding assets. As a result, the presence of this floor limits the positive
impact of any interest rate decrease on our funding costs. Therefore, at some point, hypothetical interest rate decreases could cause the fair value of our financial instruments and our net interest income to decline.
Market Value Risk
All of our Agency Securities are classified as available for sale securities. As such, they are reflected at fair value with the periodic adjustment to fair value (that is not considered to be an other than temporary impairment) reported as part of "Accumulated other comprehensive income (loss)" that is included in the stockholders' equity section of our condensed consolidated balance sheets.
All of our Non-Agency Securities are classified as trading securities. As such, they are reflected at fair value with the periodic adjustment to fair value reflected as part of “Other Income (Loss)” reported as part of the statements of operations.
The market value of our MBS can fluctuate due to changes in interest rates and other factors. Weakness in the mortgage market may adversely affect the performance and market value of our investments. This could negatively impact our book value. Furthermore, if our lenders are unwilling or unable to provide additional financing, we could be forced to sell our MBS at an inopportune time when prices are depressed. The principal and interest payments on our Agency Securities may be guaranteed by Fannie Mae, Freddie Mac, or Ginnie Mae.
Credit Risk
We have limited our exposure to credit losses on our Agency Securities in our MBS portfolio. The payment of principal and interest on the Fannie Mae and Freddie Mac Agency Securities are guaranteed by those respective agencies and the payment of principal and interest on the Agency Securities guaranteed by Ginnie Mae Agency are backed by the full faith and credit of the U.S. Government.
Fannie Mae and Freddie Mac remain in conservatorship of the U.S. Government. There can be no assurances as to how or when the U.S. Government will end these conservatorships or how the future profitability of Fannie Mae and Freddie Mac and any future credit rating actions may impact the credit risk associated with Agency Securities and, therefore, the value of the Agency Securities in our MBS portfolio.
We purchase Non-Agency Securities at prices which incorporate our expectations for prepayment speeds, defaults, delinquencies and severities. These expectations determine the yields we receive on our assets. If actual prepayment speeds, defaults, delinquencies and severities are different from our expectations, our actual yields could be higher or lower.
Liquidity Risk
Our primary liquidity risk arises from financing long-maturity MBS with short-term debt. The interest rates on our borrowings generally adjust more frequently than the interest rates on our adjustable rate MBS. Accordingly, in a period of rising interest rates, our borrowing costs will usually increase faster than our interest earnings from MBS.
Item 4. Controls and Procedures
Evaluation of Disclosure Controls and Procedures
Our Co-CEOs and CFO participated in an evaluation by our management of the effectiveness of our disclosure controls and procedures (as defined in Rules 13a-15(e) and 15d-15(e) under the Exchange Act) as of the end of our fiscal quarter that ended on March 31, 2015. Based on their participation in that evaluation, our Co-CEOs and CFO concluded that our disclosure controls and procedures were effective at March 31, 2015 to ensure that information required to be disclosed in our reports filed or submitted under the Exchange Act, is recorded, processed, summarized and reported within the time periods specified in the SEC’s rules and forms, and to ensure that information required to be disclosed in our reports filed or furnished under the Exchange Act, is accumulated and communicated to our management, including our Co-CEOs and CFO, as appropriate, to allow timely decisions regarding required disclosures.
Internal Control Over Financial Reporting
Our Co-CEOs and CFO also participated in an evaluation by our management of any changes in our internal control over financial reporting (as defined in Rules 13a-15(f) and 15d-15(f) under the Exchange Act) that occurred during the quarter ended March 31, 2015. That evaluation did not identify any changes during the quarter ended March 31, 2015, that have materially affected, or are reasonably likely to materially affect, our internal control over financial reporting.
PART II. OTHER INFORMATION
Item 1. Legal Proceedings
We are not currently subject to any legal proceedings, as described in Item 103 of Regulation S-K.
Item 1A. Risk Factors
There have been no material changes to the risk factors disclosed in our Annual Report on Form 10-K for the year ended December 31, 2014, filed on February 26, 2015.
Item 2. Unregistered Sales of Equity Securities and Use of Proceeds
None.
Item 3. Defaults Upon Senior Securities
None.
Item 4. Mine Safety Disclosures
Not applicable.
Item 5. Other Information
None.
Item 6. Exhibits
See Exhibit Index.
SIGNATURES
Pursuant to the requirements of the Securities and Exchange Act of 1934, the registrant has duly caused this report to be signed on its behalf by the undersigned thereunto duly authorized.
|
| |
| Date: May 4, 2015 | JAVELIN Mortgage Investment Corp. |
| | |
| | /s/ James R. Mountain |
| | James R. Mountain Chief Financial Officer, Duly Authorized Officer, Treasurer, Secretary and Principal Financial and Accounting Officer |
EXHIBIT INDEX
|
| | |
Exhibit Number | | Description |
| 10.1 | | Second Amended and Restated Management Agreement, dated February 23, 2015 between JAVELIN Mortgage Investment Corp. and ARMOUR Capital Management LP (Incorporated by reference to Exhibit 10.4 to JAVELIN's Annual Report on Form 10-K for the year ended December 31, 2014, filed with the Securities and Exchange Commission on February 26, 2015) |
| 10.2 | | First Amended and Restated Sub-Management Agreement, dated February 23, 2015 by and among Staton Bell Blank Check LLC, ARMOUR Capital Management LP and JAVELIN Mortgage Investment Corp. (Incorporated by reference to Exhibit 10.6 to JAVELIN's Annual Report on Form 10-K for the year ended December 31, 2014, filed with the Securities and Exchange Commission on February 26, 2015) |
| 31.1 | | Certification of Chief Executive Officer Pursuant to SEC Rule 13a-14(a)/15d-14(a) (1) |
| 31.2 | | Certification of Chief Executive Officer Pursuant to SEC Rule 13a-14(a)/15d-14(a) (1) |
| 31.3 | | Certification of Chief Financial Officer Pursuant to SEC Rule 13a14(a)/15d-14(a) (1) |
| 32.1 | | Certification of Chief Executive Officer Pursuant to 18 U.S.C. §1350 (2) |
| 32.2 | | Certification of Chief Executive Officer Pursuant to 18 U.S.C. §1350 (2) |
| 32.3 | | Certification of Chief Financial Officer Pursuant to 18 U.S.C. §1350 (2) |
| 101.INS | | XBRL Instance Document (1) |
| 101.SCH | | XBRL Taxonomy Extension Schema Document (1) |
| 101.CAL | | XBRL Taxonomy Extension Calculation Linkbase Document (1) |
| 101.DEF | | XBRL Taxonomy Extension Definition Linkbase Document (1) |
| 101.LAB | | XBRL Taxonomy Extension Label Linkbase Document (1) |
| 101.PRE | | XBRL Taxonomy Extension Presentation Linkbase Document (1) |