united states
securities and exchange commission
washington, d.c. 20549
form n-csr
certified shareholder report of registered management
investment companies
Investment Company Act file number 811-22718
Two Roads Shared Trust
(Exact name of registrant as specified in charter)
225 Pictoria Drive, Suite 450, Cincinnati, Ohio 45246
(Address of principal executive offices) (Zip code)
Richard Malinowski, Gemini Fund Services, LLC.
4221 North 203rd Street, Suite 100, Elkhorn, Nebraska 68022
(Name and address of agent for service)
Registrant's telephone number, including area code: 631-470-2600
Date of fiscal year end: 10/31
Date of reporting period: 10/31/20
ITEM 1. REPORTS TO SHAREHOLDERS.
 |
 |
| Anfield Universal Fixed Income Fund |
| Class A Shares (AFLEX) |
| Class C Shares (AFLKX) |
| Class I Shares (AFLIX) |
| October 31, 2020 |
| Annual Report |
| Advised by: |
| Anfield Capital Management, LLC |
| 4041 MacArthur Blvd. |
| Suite 155 |
| Newport Beach, CA 92660 |
| www.AnfieldFunds.com |
| Distributed by Northern Lights Distributors, LLC |
| Member FINRA |
Beginning on January 1, 2021, as permitted by regulations adopted by the Securities and Exchange Commission, paper copies of the Fund’s shareholder reports like this one will no longer be sent by mail, unless you specifically request paper copies of the reports. Instead, the reports will be made available on the Fund’s website www.AnfieldFunds.com, and you will be notified by mail each time a report is posted and provided with a website link to access the report.
If you already elected to receive shareholder reports electronically, you will not be affected by this change and you need not take any action. You may elect to receive shareholder reports and other communications from the Fund electronically or to continue receiving paper copies of shareholder reports, which are available free of charge by contacting your financial intermediary (such as a broker-dealer or bank) or, if you are a direct investor, by following the instructions included with paper Fund documents that have been mailed to you.

December 2020
Annual Letter to Shareholders of the Anfield Universal Fixed Income Fund (AFLIX)
General Fund Update
The Anfield Universal Fixed Income Fund (the “Fund” or “AFLIX”) finished the annual period ended October 31, 2020 with $168.2 million in assets under management. In terms of performance for the most recent fiscal year, all share classes were negative: A shares -0.49%, C shares -1.23%, I shares -0.34%, net of all fees and expenses. Benchmark performance over the same period: Bloomberg Barclays US Aggregate Bond Index (US Agg), 6.75%; Bloomberg Barclays Intermediate US Aggregate Index, 5.46%; Bloomberg Barclays US Treasury 1-3 Year Index, 3.27%; BofA Merrill Lynch US Dollar 3-Month LIBOR Constant Maturity Index, 1.38%.
Coronavirus Performance Update
The Fund’s performance for the twelve-month period was dramatically impacted by the outbreak of the coronavirus in China, which subsequently spread to the US and the rest of the world in early 2020. As a result of the outbreak and its knock-on effects, markets became increasingly volatile and saw the S&P 500 fall from its peak of 3,386.15 on February 19th, 2020 to a 2020 low of 2,237.40 on March 23rd, 2020, a fall of 33.92%, according to data from Bloomberg. Global stocks, as measured by the MSCI All Country World Index (ACWI) fell from 579.87 to 384.04 over the same period, a drop of 33.77%. From February 19th through March 23rd, the Fund fell 7.50%, while the US Agg fell 1.00%, the S&P 500 Investment Grade Corporate Bond Index fell 9.05%, and the ICE of BofAML High Yield Master II Index fell 21.45%, according to data gathered by YCharts. The sell-off in corporate bonds—especially high yield—generally corresponded to the sell-off in equity markets as investors fled to cash and high quality bonds such as US Treasury securities.
However, with the launch of several US Federal Reserve stimulus measures, including dedicated facilities to shore up corporate bond markets, both equity and credit markets recovered markedly from March 23rd through the end of October. Over this recovery period, the Fund rose 4.77%. Within the Fund itself, our credit-related positions were hit hardest in the coronavirus-driven sell-off. This includes our corporate bond, CLO, preferred equity, and bank loan positions. Our agency mortgage positions also sold off, though not to the extent of our credit-related positions, due to interest rate volatility. However, our US Treasury exposure expressed through futures contracts performed very well, helping to offset the price declines in other portfolio segments.
In addition, since the bottom of the equity markets near the end of March, the Fund has seen a meaningful recovery in our corporate credit positions. In general, our corporate bond positions have performed very well while we have seen a solid price rebound in higher quality (investment grade) CLO positions. The lower quality, high-yield rated CLO positions have also seen a solid recovery, generally rising to price ranges in the 60s and 70s from the 40s and 50s seen at the depths of the credit markets in March. We still believe there is potential price upside for these lower rated CLOs, and are anticipating the loan markets to continue their recovery.
What is the Adviser Doing within the Portfolio?
Duration Positioning – The Adviser is maintaining a 2-3 year average duration position, which we feel is prudent as interest rates have remained range bound for several months. We are generally staying shorter in maturity in the credit space, while using US Treasury futures contracts to express our duration position.
Credit Portfolio – Within our credit portfolio, the Adviser has selectively removed some riskier, more volatile positions that we believe have been materially impacted due to the coronavirus and its knock-on effects. Even prior to the outbreak, the team was lightening up on high yield rated CLOs, which proved prudent despite high quality CLOs exhibiting price volatility during the sell-off. In addition, the team exited some positions in secured airline paper, as we believe the underlying collateral is worth much less than it was just a few months ago and the risk-reward profile was skewed to the downside. Overall, the Adviser is comfortable with the portfolio’s credit profile and when there are opportunities to deploy cash in the sector, we are focusing on higher quality, short maturity paper.
1
Potential Upside in Select Agency Mortgages – We believe that some of the Fund’s agency mortgage positions have underperformed our expectations, but we believe, although there are no guarantees, that these positions will outperform in the long run, especially because they are high quality GSE paper with attractive yields. In this low interest rate environment, we believe these positions play a vital part in the Fund’s focus on high quality yield.
Current Fixed Income Investment Strategy
| ● | While maintaining a defensive position relative to interest rates, gradually increase treasury exposure and duration as we expect rates to remain within a range |
| ● | Emphasize high quality yield enhancing corporate credit / MBS / ABS fixed income allocations, taking advantage of market segments that we believe are oversold as a result of the coronavirus outbreak |
| ● | Continue to seek select opportunities in hybrid securities such as preferred shares and convertible securities |
| ● | Remain vigilant and opportunistic while monitoring stretched high yield markets |
| ● | Favor front-end of the yield curve for quality paper as we are not being compensated to extend further out. Compensation beyond 2-3 years requires taking on excess risk that we feel is not prudent unless it is a special circumstance |
On behalf of the entire staff at Anfield Capital Management, we thank you for your continued support.

David Young, CFA
CEO & Founder
The views in this report are those of the Fund’s management. This report contains certain forward-looking statements about factors that may affect the performance of the Fund in the future. These statements are based on the Fund’s management’s predictions and expectations concerning certain future events such as the performance of the economy as a whole and of specific industry sectors. Management believes these forward-looking statements are reasonable, although they are inherently uncertain and difficult to predict.
6252-NLD-12/02/2020
2
| Anfield Universal Fixed Income Fund |
| PORTFOLIO REVIEW (Unaudited) |
| October 31, 2020 |
Average Annual Total Return through October 31, 2020*, as compared to its benchmark:
| 1 Year | 5 Year | Since Inception(a) | |
| Class A | (0.49)% | 1.60% | 1.75% |
| Class A with 5.75% load | (6.22)% | 0.40% | 0.93% |
| Class C | (1.23)% | 0.84% | 0.97% |
| Class I | (0.34)% | 1.82% | 1.99% |
| BofA Merrill Lynch US Dollar 3-Month LIBOR Constant Maturity Index(b) | 1.38% | 1.50% | 1.10% |
| * | The performance data quoted here represents past performance. Current performance may be lower or higher than the performance data quoted above. Investment return and principal value will fluctuate, so that shares, when redeemed, may be worth more or less than their original cost. The returns shown do not reflect the deduction of taxes that a shareholder would pay on Fund distributions or on the redemptions of Fund shares. Past performance is no guarantee of future results. The Advisor has contractually agreed to waive fees and/or reimburse expenses to the Fund until at least March 1, 2021 so that the total annual operating expenses (excluding any front-end or contingent deferred loads; brokerage fees and commissions, acquired fund fees and expenses; borrowing costs (such as interest and dividend expense on securities sold short); taxes; and extraordinary expenses, such as litigation expenses) of the Fund do not exceed 1.50%, 2.25%, and 1.25% for Class A, Class C, and Class I shares, respectively. This agreement may be terminated by the Fund’s Board of Trustees on 60 days’ written notice to the adviser. These fee waivers and expense reimbursements by the adviser are subject to possible recoupment from the Fund in future years on a rolling three year basis (within the three years after the fees have been waived or expenses reimbursed) if such recoupment can be achieved within the foregoing expense limits. as well as any expense limitation that was in effect at the time the waiver or reimbursement was made. Without waiver or reimbursement the gross expenses and fees of the Fund are 1.41%, 2.16% and 1.16% for Class A, Class C, and Class I shares, respectively, per the most recent prospectus dated February 28, 2020. For performance information current to the most recent month-end, please call toll-free 1-866-866-4848. |
| (a) | Anfield Universal Fixed Income Fund commenced investment operations on June 28, 2013. |
| (b) | The BofA Merrill Lynch US Dollar 3-Month LIBOR Constant Maturity Index is designed to track the performance of a synthetic asset paying LIBOR to a stated maturity. The index is based on the assumed purchase at par of a synthetic instrument having exactly its stated maturity and with a coupon equal to that day’s fixing rate. That issue is assumed to be sold the following business day (priced at a yield equal to the current day fixing rate) and rolled into a new instrument. Investors cannot invest directly in an index or benchmark. Index returns are gross of any fees, brokerage commissions or other expenses of investing. |
Comparison of the Change in Value of a $100,000 Investment *
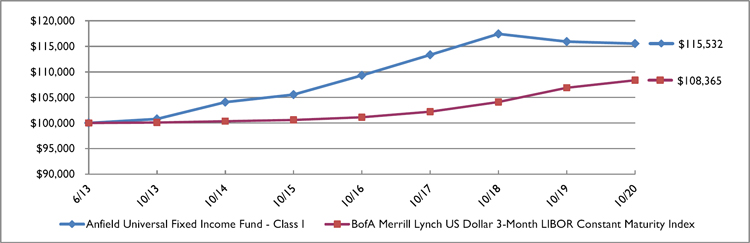
| * | Performance shown is for Class I shares. The performance of the Fund’s other classes may be greater or less than the line shown due to differences in loads and fees paid by shareholders in different share classes. |
| Top Allocations | % of Net Assets | |||
| Corporate Bonds | 42.4 | % | ||
| Asset Backed Securities | 20.9 | % | ||
| Agency Collateralized Mortgage Obligations | 15.0 | % | ||
| Term Loans | 7.3 | % | ||
| Mutual Funds | 5.9 | % | ||
| Preferred Stocks | 0.8 | % | ||
| Exchange Traded Fund | 0.2 | % | ||
| Closed End Fund | 0.1 | % | ||
| Other Assets Less Liabilities | 7.4 | % | ||
| 100.0 | % | |||
Please refer to the Schedule of Investments in this annual report for a detailed analysis of the Fund’s holdings.
3
| Anfield Universal Fixed Income Fund |
| SCHEDULE OF INVESTMENTS |
| October 31, 2020 |
| Shares | Fair Value | |||||||
| CLOSED END FUND - 0.1% | ||||||||
| DEBT FUND - 0.1% | ||||||||
| 16,099 | BlackRock Floating Rate Income Strategies Fund, Inc. | $ | 182,563 | |||||
| TOTAL CLOSED END FUND (Cost $229,827) | 182,563 | |||||||
| EXCHANGE TRADED FUND - 0.2% | ||||||||
| DEBT FUND - 0.2% | ||||||||
| 16,900 | Invesco Senior Loan ETF | 363,350 | ||||||
| TOTAL EXCHANGE TRADED FUND (Cost $413,967) | 363,350 | |||||||
| MUTUAL FUNDS - 5.9% | ||||||||
| DEBT FUNDS - 5.9% | ||||||||
| 224,117 | Fidelity Floating Rate High Income Fund - Institutional Class | 2,010,332 | ||||||
| 718,079 | Vanguard Short-Term Investment Grade Fund - Institutional Class | 7,877,324 | ||||||
| TOTAL MUTUAL FUNDS (Cost $9,835,427) | 9,887,656 | |||||||
| Par Value | Coupon Rate (%) | Maturity | Spread | Rate | ||||||||||||||
| ASSET BACKED SECURITIES - 20.9% | ||||||||||||||||||
| COLLATERALIZED LOAN OBLIGATIONS - 17.4% | ||||||||||||||||||
| $ | 850,000 | ACIS CLO 2017-7A B Ltd. ^~ | 2.0010 | 5/1/2027 | Quarterly US LIBOR | +1.75% | 837,641 | |||||||||||
| 1,000,000 | AMMC CLO XI 2012-11A CR2 Ltd. ^~ | 2.1683 | 4/30/2031 | Quarterly US LIBOR | +1.90% | 951,167 | ||||||||||||
| 2,080,274 | Arch Street CLO 2016-2A ER Ltd. ^~ | 6.5184 | 10/20/2028 | Quarterly US LIBOR | +6.30% | 1,346,058 | ||||||||||||
| 1,600,000 | Brigade Debt Funding I 2018-1A D Ltd. ^ | 6.3500 | 4/25/2036 | 1,575,966 | ||||||||||||||
| 2,000,000 | Catamaran CLO 2013-1A FR Ltd. ^~ | 7.3665 | 1/27/2028 | Quarterly US LIBOR | +7.15% | 1,290,602 | ||||||||||||
| 2,000,000 | Cathedral Lake CLO 2013-1A BR Ltd. ^~ | 2.5369 | 10/15/2029 | Quarterly US LIBOR | +2.30% | 1,878,112 | ||||||||||||
| 500,500 | Crown Point CLO IV 2018-4A B Ltd. ^~ | 1.7184 | 4/20/2031 | Quarterly US LIBOR | +1.50% | 485,368 | ||||||||||||
| 1,000,000 | Denali Capital CLO XI 2015-1A DR Ltd. ^~ | 5.8284 | 10/20/2028 | Quarterly US LIBOR | +5.61% | 772,251 | ||||||||||||
| 1,000,000 | Elevation CLO 2017-7A C Ltd. ^~ | 2.1369 | 7/15/2030 | Quarterly US LIBOR | +1.90% | 956,018 | ||||||||||||
| 1,000,000 | Fortress Credit BSL IV 2017-1A C Ltd. ^~ | 2.7147 | 10/26/2029 | Quarterly US LIBOR | +2.50% | 997,846 | ||||||||||||
| 1,000,000 | Halcyon Loan Advisors Funding 2015-1A CR Ltd. ^~ | 2.2184 | 4/20/2027 | Quarterly US LIBOR | +2.00% | 973,104 | ||||||||||||
| 1,500,000 | Halcyon Loan Advisors Funding 2015-2A E Ltd. ^~ | 5.9147 | 7/25/2027 | Quarterly US LIBOR | +5.70% | 870,466 | ||||||||||||
| 2,098,364 | Halcyon Loan Advisors Funding 2015-3A D Ltd. ^~ | 6.1678 | 10/18/2027 | Quarterly US LIBOR | +5.95% | 1,053,194 | ||||||||||||
| 2,000,000 | Jamestown CLO V 2014-5A E Ltd. ^~ | 5.3178 | 1/17/2027 | Quarterly US LIBOR | +5.10% | 1,273,030 | ||||||||||||
| 1,000,000 | KVK CLO 2016-1A B Ltd. ^~ | 2.4869 | 1/15/2029 | Quarterly US LIBOR | +2.25% | 1,000,340 | ||||||||||||
| 500,000 | KVK CLO 2018-1A B Ltd. ^~ | 1.9030 | 5/20/2029 | Quarterly US LIBOR | +1.65% | 489,952 | ||||||||||||
| 2,400,000 | Man GLG US CLO 2018-1A BR | 2.1884 | 4/22/2030 | Quarterly US LIBOR | +1.97% | 2,282,556 | ||||||||||||
| 2,542,048 | Oaktree CLO 2014-1A DR | 6.5535 | 5/13/2029 | Quarterly US LIBOR | +6.30% | 1,596,444 | ||||||||||||
| 2,000,000 | Sound Point CLO II 2013-1A A3R Ltd. ^~ | 2.0648 | 1/26/2031 | Quarterly US LIBOR | +1.85% | 1,881,120 | ||||||||||||
| 520,000 | Steele Creek CLO 2014-1RA B Ltd. ^~ | 1.7086 | 4/21/2031 | Quarterly US LIBOR | +1.50% | 493,531 | ||||||||||||
| 2,000,000 | Tralee CLO V 2018-5A C Ltd. ^~ | 2.4184 | 10/20/2028 | Quarterly US LIBOR | +2.20% | 1,915,650 | ||||||||||||
| 2,059,134 | Venture XVI CLO 2014-16A ERR Ltd. ^~ | 5.2669 | 1/15/2028 | Quarterly US LIBOR | +5.03% | 1,233,512 | ||||||||||||
| 1,851,235 | Zais CLO 1 2014-1A BR Ltd. ^~ | 2.8369 | 4/15/2028 | Quarterly US LIBOR | +2.60% | 1,714,978 | ||||||||||||
| 1,380,000 | Zais CLO 5 2016-2A A2 Ltd. ^~ | 2.6369 | 10/15/2028 | Quarterly US LIBOR | +2.40% | 1,380,428 | ||||||||||||
| 29,249,334 | ||||||||||||||||||
| COLLATERALIZED MORTGAGE OBLIGATIONS - 0.6% | ||||||||||||||||||
| 203,654 | Alternative Loan Trust 2004-35T2 | 6.0000 | 2/25/2035 | 32,677 | ||||||||||||||
| 4,753 | Banc of America Funding 2004-D Trust # | 3.5389 | 6/25/2034 | 4,841 | ||||||||||||||
| 6,987 | Banc of America Mortgage 2004-A Trust # | 3.8484 | 2/25/2034 | 6,974 | ||||||||||||||
| 11,562,787 | BCAP LLC Trust 2007-AA2 # | 0.4278 | 4/25/2037 | 147,730 | ||||||||||||||
| 17,723 | Bear Stearns ARM Trust 2003-4 # | 3.0713 | 7/25/2033 | 18,082 | ||||||||||||||
| 17,178 | Bear Stearns Asset Backed Securities Trust 2003-AC5 < | 5.5000 | 10/25/2033 | 17,830 | ||||||||||||||
| 10,908 | Chase Mortgage Finance Trust Series 2007-A1 # | 3.3846 | 2/25/2037 | 10,907 | ||||||||||||||
| 47,771 | CHL Mortgage Pass-Through Trust 2004-7 # | 3.3467 | 5/25/2034 | 48,241 | ||||||||||||||
| 13,210 | Citigroup Global Markets Mortgage Securities VII, Inc. ^ | 6.0000 | 9/25/2033 | 13,269 | ||||||||||||||
| 17,956 | Citigroup Mortgage Loan Trust 2006-4 | 0.0000 | 12/25/2035 | 21,284 | ||||||||||||||
| 11,840 | Deutsche Mortgage Securities, Inc. Mortgage Loan Trust 2004-4 ~ | 0.5992 | 6/25/2034 | Monthly US LIBOR | +0.45% | 11,162 | ||||||||||||
| 25,990 | GSR Mortgage Loan Trust 2004-14 # | 2.8126 | 12/25/2034 | 26,757 | ||||||||||||||
| 272,839 | GSR Mortgage Loan Trust 2004-2F ~ | 7.5008 | 1/25/2034 | Monthly US LIBOR | +7.65% | 29,127 | ||||||||||||
| 19,406 | GSR Mortgage Loan Trust 2004-6F | 5.5000 | 5/25/2034 | 19,257 | ||||||||||||||
| 65,062 | Impac CMB Trust Series 2004-4 ~ | 1.0492 | 9/25/2034 | Monthly US LIBOR | +0.90% | 61,504 | ||||||||||||
| 9,913 | Impac CMB Trust Series 2004-5 ~ | 1.0693 | 10/25/2034 | Monthly US LIBOR | +0.92% | 10,322 | ||||||||||||
| 58,509 | Impac CMB Trust Series 2004-6 ~ | 0.9743 | 10/25/2034 | Monthly US LIBOR | +0.83% | 60,441 | ||||||||||||
| 54,386 | JP Morgan Mortgage Trust 2005-A1# | 3.4051 | 2/25/2035 | 51,737 | ||||||||||||||
| 16,629 | MASTR Alternative Loan Trust 2003-7 | 6.5000 | 12/25/2033 | 17,762 | ||||||||||||||
| 707,793 | MASTR Alternative Loan Trust 2007-HF1 | 7.0000 | 10/25/2047 | 168,115 | ||||||||||||||
| 34,927 | Morgan Stanley Mortgage Loan Trust 2004-10AR # | 2.5958 | 11/25/2034 | 33,933 | ||||||||||||||
See accompanying notes to financial statements.
4
| Anfield Universal Fixed Income Fund |
| SCHEDULE OF INVESTMENTS (Continued) |
| October 31, 2020 |
| Par Value | Coupon Rate (%) | Maturity | Spread | Rate | Fair Value | |||||||||||||
| ASSET BACKED SECURITIES - 20.9% (Continued) | ||||||||||||||||||
| COLLATERALIZED MORTGAGE OBLIGATIONS - 0.6% (Continued) | ||||||||||||||||||
| $ | 9,939 | Morgan Stanley Mortgage Loan Trust 2004-7AR # | 2.9236 | 9/25/2034 | $ | 9,861 | ||||||||||||
| 31,540 | RAMP Series 2004-SL3 Trust | 7.5000 | 12/25/2031 | 30,925 | ||||||||||||||
| 17,853 | Structured Asset Securities Corp. # | 4.0175 | 9/25/2026 | 17,995 | ||||||||||||||
| 85,386 | Wilshire Funding Corp. # | 7.2500 | 8/25/2027 | 85,634 | ||||||||||||||
| 956,367 | ||||||||||||||||||
| HOME EQUITY - 1.9% | ||||||||||||||||||
| 64,492 | Aames Mortgage Trust 2001 1 Mortgage Pass Thr Certs Se 01 1 < | 8.0880 | 6/25/2031 | 69,664 | ||||||||||||||
| 35,015 | AFC Trust Series 2000-1 ~ | 0.8792 | 3/25/2030 | Monthly US LIBOR | +0.73% | 34,619 | ||||||||||||
| 2,471 | Ameriquest Mortgage Securities Inc Asset-Backed Pass-Through Ctfs Ser 2003-11 < | 5.0057 | 12/25/2033 | 2,586 | ||||||||||||||
| 4,910 | Amresco Residential Securities Corp. Mortgage Loan Trust 1998-1 # | 7.0000 | 1/25/2028 | 5,081 | ||||||||||||||
| 144,351 | Asset Backed Securities Corp. Home Equity Loan Trust Series 2003-HE6 ~ | 2.6242 | 11/25/2033 | Monthly US LIBOR | +2.48% | 144,603 | ||||||||||||
| 135,000 | Bear Stearns Asset Backed Securities I Trust 2004-BO1 ~ | 4.1492 | 10/25/2034 | Monthly US LIBOR | +4.00% | 136,075 | ||||||||||||
| 408,579 | Bear Stearns Asset Backed Securities I Trust 2004-FR3 ~ | 2.2493 | 9/25/2034 | Monthly US LIBOR | +2.10% | 378,846 | ||||||||||||
| 244,442 | Bear Stearns Asset Backed Securities I Trust 2004-HE7 ~ | 2.8492 | 8/25/2034 | Monthly US LIBOR | +2.70% | 234,231 | ||||||||||||
| 15,591 | Bear Stearns Asset Backed Securities Trust 2003-ABF1 ~ | 0.8893 | 1/25/2034 | Monthly US LIBOR | +0.74% | 14,383 | ||||||||||||
| 155,469 | CDC Mortgage Capital Trust 2004-HE1 ~ | 1.9492 | 6/25/2034 | Monthly US LIBOR | +1.80% | 159,326 | ||||||||||||
| 210,776 | CDC Mortgage Capital Trust 2004-HE3 ~ | 1.9492 | 11/25/2034 | Monthly US LIBOR | +1.80% | 188,096 | ||||||||||||
| 59,206 | Credit Suisse First Boston Mortgage Securities Corp. < | 6.9900 | 2/25/2031 | 60,358 | ||||||||||||||
| 37,968 | GSAA Trust < | 5.2950 | 11/25/2034 | 38,898 | ||||||||||||||
| 64,512 | Home Equity Asset Trust ~ | 2.2993 | 3/25/2034 | Monthly US LIBOR | +2.15% | 63,820 | ||||||||||||
| 455,054 | Home Equity Asset Trust 2004-4 ~ | 2.0993 | 10/25/2034 | Monthly US LIBOR | +1.95% | 453,419 | ||||||||||||
| 16,421 | Meritage Mortgage Loan Trust 2003-1 ~ | 2.4743 | 11/25/2033 | Monthly US LIBOR | +2.33% | 16,865 | ||||||||||||
| 28,884 | Meritage Mortgage Loan Trust 2003-1 ~ | 2.8492 | 11/25/2033 | Monthly US LIBOR | +2.70% | 28,595 | ||||||||||||
| 31,664 | Merrill Lynch Mortgage Investors Trust Series 2003-OPT1 ~ | 2.3243 | 7/25/2034 | Monthly US LIBOR | +2.18% | 31,004 | ||||||||||||
| 55,276 | New Century Home Equity Loan Trust ~^ | 1.2742 | 10/25/2033 | Monthly US LIBOR | +1.13% | 54,354 | ||||||||||||
| 74,341 | New Century Home Equity Loan Trust Series 2003-B ~ | 2.6242 | 11/25/2033 | Monthly US LIBOR | +2.48% | 74,681 | ||||||||||||
| 25,221 | NovaStar Mortgage Funding Trust Series 2003-4 ~ | 1.2143 | 2/25/2034 | Monthly US LIBOR | +1.07% | 25,162 | ||||||||||||
| 1,843 | NovaStar Mortgage Funding Trust Series 2004-1 ~ | 1.7242 | 6/25/2034 | Monthly US LIBOR | +1.58% | 1,799 | ||||||||||||
| 172,480 | NovaStar Mortgage Funding Trust Series 2004-2 ~ | 2.3992 | 9/25/2034 | Monthly US LIBOR | +2.25% | 170,560 | ||||||||||||
| 17,097 | Option One Mortgage Accept Corp. Asset Back Certs Ser 2003 5 ~ | 0.7892 | 8/25/2033 | Monthly US LIBOR | +0.64% | 16,367 | ||||||||||||
| 76,674 | RASC Series 2003-KS4 Trust < | 5.1100 | 6/25/2033 | 78,561 | ||||||||||||||
| 150,093 | Saxon Asset Securities Trust 2002-1 ~ | 1.9492 | 11/25/2031 | Monthly US LIBOR | +1.80% | 141,676 | ||||||||||||
| 28,740 | Saxon Asset Securities Trust 2003-3 ~ | 2.5493 | 12/25/2033 | Monthly US LIBOR | +2.40% | 28,364 | ||||||||||||
| 57,061 | Securitized Asset Backed Receivables LLC Trust 2004-OP1 ~ | 1.7993 | 2/25/2034 | Monthly US LIBOR | +1.65% | 57,477 | ||||||||||||
| 260,479 | Securitized Asset Backed Receivables LLC Trust 2004-OP1 ~ | 2.1742 | 2/25/2034 | Monthly US LIBOR | +2.03% | 253,725 | ||||||||||||
| 62,751 | Security National Mortgage Loan Trust 2007-1 ~^ | 0.4993 | 4/25/2037 | Monthly US LIBOR | +0.35% | 62,666 | ||||||||||||
| 114,759 | Terwin Mortgage Trust Series TMTS 2003-2HE ~ | 2.2993 | 7/25/2034 | Monthly US LIBOR | +2.15% | 110,258 | ||||||||||||
| 3,136,119 | ||||||||||||||||||
| MANUFACTURED HOUSING - 0.0% > | ||||||||||||||||||
| 16,237 | Conseco Finance Corp. # | 7.2200 | 3/15/2028 | 16,817 | ||||||||||||||
| RESIDENTIAL MORTGAGE - 1.0% | ||||||||||||||||||
| 9,509 | Bear Stearns Asset Backed Securities Trust 2003-SD3 ~ | 2.9993 | 10/25/2033 | Monthly US LIBOR | +2.85% | 9,504 | ||||||||||||
| 9,364 | Bravo Mortgage Asset Trust ^~ | 0.3893 | 7/25/2036 | Monthly US LIBOR | +0.24% | 9,336 | ||||||||||||
| 68,280 | Carrington Mortgage Loan Trust Series 2004-NC2 ~ | 1.9492 | 8/25/2034 | Monthly US LIBOR | +1.80% | 73,313 | ||||||||||||
| 185,489 | Countrywide Asset-Backed Certificates ~ | 0.6492 | 8/25/2034 | Monthly US LIBOR | +0.50% | 171,875 | ||||||||||||
| 79,359 | Countrywide Asset-Backed Certificates ^~ | 3.5242 | 3/25/2032 | Monthly US LIBOR | +3.38% | 82,526 | ||||||||||||
| 175,724 | Credit-Based Asset Servicing and Securitization LLC ~ | 1.8743 | 7/25/2035 | Monthly US LIBOR | +1.73% | 174,754 | ||||||||||||
| 148,449 | Credit-Based Asset Servicing and Securitization LLC ~ | 2.9243 | 3/25/2034 | Monthly US LIBOR | +2.78% | 153,508 | ||||||||||||
| 55,934 | CWABS, Inc. Asset-Backed Certificates Trust 2004-6 ~ | 1.0492 | 11/25/2034 | Monthly US LIBOR | +0.90% | 53,893 | ||||||||||||
| 38,747 | CWABS, Inc. Asset-Backed Certificates Trust 2004-6 ~ | 1.3493 | 11/25/2034 | Monthly US LIBOR | +1.20% | 37,992 | ||||||||||||
| 17,897 | Equity One Mortgage Pass-Through Trust 2002-5 < | 5.8030 | 11/25/2032 | 18,676 | ||||||||||||||
| 213,404 | Finance America Mortgage Loan Trust 2004-2 ~ | 1.1243 | 8/25/2034 | Monthly US LIBOR | +0.98% | 206,035 | ||||||||||||
| 36,293 | Finance America Mortgage Loan Trust 2004-2 ~ | 2.2493 | 8/25/2034 | Monthly US LIBOR | +2.10% | 34,731 | ||||||||||||
| 27,535 | First Franklin Mortgage Loan Trust 2002-FF1 ~ | 1.2740 | 4/25/2032 | Monthly US LIBOR | +1.13% | 27,225 | ||||||||||||
| 52,100 | Long Beach Mortgage Loan Trust 2003-2 ~ | 2.9993 | 6/25/2033 | Monthly US LIBOR | +2.85% | 52,027 | ||||||||||||
| 14,434 | Long Beach Mortgage Loan Trust 2004-1 ~ | 0.9743 | 2/25/2034 | Monthly US LIBOR | +0.83% | 14,411 | ||||||||||||
| 105,914 | Morgan Stanley ABS Capital I, Inc. Trust 2004-NC7 ~ | 1.8743 | 7/25/2034 | Monthly US LIBOR | +1.73% | 104,302 | ||||||||||||
| 215,578 | RAMP Series 2002-RS3 Trust ~ | 1.1243 | 6/25/2032 | Monthly US LIBOR | +0.98% | 177,661 | ||||||||||||
| 101,353 | Specialty Underwriting & Residential Finance Trust Series 2004-BC4 ~ | 1.3493 | 10/25/2035 | Monthly US LIBOR | +1.20% | 98,403 | ||||||||||||
| 10,518 | Structured Asset Investment Loan Trust 2004-7 ~ | 1.2742 | 8/25/2034 | Monthly US LIBOR | +1.13% | 10,500 | ||||||||||||
| 109,279 | Structured Asset Securities Corp. 2005-WF1 ~ | 2.0543 | 2/25/2035 | Monthly US LIBOR | +1.91% | 104,891 | ||||||||||||
| 143,305 | Structured Asset Securities Corp. 2005-WF1 ~ | 2.2043 | 2/25/2035 | Monthly US LIBOR | +2.06% | 122,988 | ||||||||||||
| 1,738,551 | ||||||||||||||||||
| TOTAL ASSET BACKED SECURITIES (Cost $40,827,011) | 35,097,188 | |||||||||||||||||
See accompanying notes to financial statements.
5
| Anfield Universal Fixed Income Fund |
| SCHEDULE OF INVESTMENTS (Continued) |
| October 31, 2020 |
| Par Value | Coupon Rate (%) | Maturity | Spread | Rate | Fair Value | |||||||||||||
| AGENCY COLLATERALIZED MORTGAGE OBLIGATIONS - 15.0% | ||||||||||||||||||
| $ | 801,549 | Fannie Mae Interest Strip * | 3.0000 | 11/25/2043 | $ | 100,538 | ||||||||||||
| 518,542 | Fannie Mae Interest Strip * | 3.5000 | 11/25/2041 | 46,714 | ||||||||||||||
| 2,134,568 | Fannie Mae Interest Strip * | 3.5000 | 12/25/2042 | 310,047 | ||||||||||||||
| 349,683 | Fannie Mae Interest Strip #* | 4.0000 | 7/25/2042 | 50,827 | ||||||||||||||
| 345,576 | Fannie Mae Interest Strip #* | 4.0000 | 11/25/2041 | 49,561 | ||||||||||||||
| 713,529 | Fannie Mae Interest Strip * | 4.5000 | 7/25/2037 | 99,674 | ||||||||||||||
| 242,627 | Fannie Mae Interest Strip #* | 4.5000 | 11/25/2039 | 36,637 | ||||||||||||||
| 934,805 | Fannie Mae Interest Strip #* | 4.5000 | 10/25/2040 | 170,168 | ||||||||||||||
| 725,120 | Fannie Mae Interest Strip #* | 4.5000 | 11/25/2040 | 114,419 | ||||||||||||||
| 1,040,333 | Fannie Mae Interest Strip #* | 4.5000 | 7/25/2042 | 202,751 | ||||||||||||||
| 2,682,471 | Fannie Mae Interest Strip * | 5.0000 | 12/25/2040 | 457,288 | ||||||||||||||
| 526,988 | Fannie Mae Interest Strip #* | 5.5000 | 5/25/2039 | 99,782 | ||||||||||||||
| 1,488,126 | Fannie Mae Interest Strip * | 6.0000 | 5/25/2039 | 314,062 | ||||||||||||||
| 545,802 | Fannie Mae Interest Strip #* | 6.0000 | 5/25/2039 | 111,718 | ||||||||||||||
| 14,945,484 | Fannie Mae REMICS *~ | 0.0300 | 6/25/2045 | Monthly US LIBOR | +6.20% | 22,612 | ||||||||||||
| 194,259 | Fannie Mae REMICS * | 3.0000 | 8/25/2030 | 2,604 | ||||||||||||||
| 1,648,579 | Fannie Mae REMICS * | 3.5000 | 5/25/2044 | 69,699 | ||||||||||||||
| 2,714,595 | Fannie Mae REMICS * | 3.5000 | 12/25/2044 | 135,672 | ||||||||||||||
| 2,183,330 | Fannie Mae REMICS * | 3.5000 | 11/25/2045 | 93,701 | ||||||||||||||
| 1,334,089 | Fannie Mae REMICS * | 3.5000 | 2/25/2046 | 59,132 | ||||||||||||||
| 409,277 | Fannie Mae REMICS * | 3.5000 | 10/25/2047 | 24,305 | ||||||||||||||
| 2,253,203 | Fannie Mae REMICS * | 3.5000 | 12/25/2047 | 142,983 | ||||||||||||||
| 2,870,081 | Fannie Mae REMICS * | 3.5000 | 8/25/2049 | 168,715 | ||||||||||||||
| 2,838,488 | Fannie Mae REMICS * | 4.0000 | 4/25/2041 | 132,112 | ||||||||||||||
| 1,323,286 | Fannie Mae REMICS * | 4.0000 | 10/25/2041 | 76,748 | ||||||||||||||
| 1,302,271 | Fannie Mae REMICS * | 4.0000 | 5/25/2044 | 17,250 | ||||||||||||||
| 1,115,118 | Fannie Mae REMICS * | 4.0000 | 5/25/2047 | 37,410 | ||||||||||||||
| 1,136,108 | Fannie Mae REMICS * | 4.0000 | 10/25/2047 | 59,133 | ||||||||||||||
| 3,444,815 | Fannie Mae REMICS * | 4.0000 | 3/25/2048 | 370,916 | ||||||||||||||
| 934,472 | Fannie Mae REMICS * | 4.0000 | 5/25/2048 | 76,622 | ||||||||||||||
| 919,402 | Fannie Mae REMICS * | 4.0000 | 5/25/2048 | 76,806 | ||||||||||||||
| 1,178,574 | Fannie Mae REMICS * | 4.5000 | 2/25/2043 | 129,878 | ||||||||||||||
| 675,891 | Fannie Mae REMICS * | 4.5000 | 9/25/2043 | 55,597 | ||||||||||||||
| 976,553 | Fannie Mae REMICS * | 4.5000 | 12/25/2047 | 118,127 | ||||||||||||||
| 1,686,047 | Fannie Mae REMICS * | 4.5000 | 10/25/2048 | 154,371 | ||||||||||||||
| 323,607 | Fannie Mae REMICS ~* | 4.5979 | 4/25/2045 | Monthly US LIBOR | +6.15% | 65,191 | ||||||||||||
| 474,801 | Fannie Mae REMICS * | 5.0000 | 11/25/2038 | 46,979 | ||||||||||||||
| 969,943 | Fannie Mae REMICS #* | 5.0000 | 1/25/2040 | 183,723 | ||||||||||||||
| 5,275,866 | Fannie Mae REMICS ~* | 5.8507 | 11/25/2041 | Monthly US LIBOR | +6.00% | 692,088 | ||||||||||||
| 2,940,423 | Fannie Mae REMICS ~* | 5.8507 | 10/25/2043 | Monthly US LIBOR | +6.00% | 607,639 | ||||||||||||
| 1,056,237 | Fannie Mae REMICS * | 6.0000 | 12/25/2039 | 180,008 | ||||||||||||||
| 4,695,742 | Fannie Mae REMICS * | 6.0000 | 6/25/2045 | 1,204,238 | ||||||||||||||
| 265,117 | Fannie Mae REMICS ~* | 6.0000 | 8/25/2042 | Monthly US LIBOR | +6.00% | 52,440 | ||||||||||||
| 369,550 | Fannie Mae REMICS ~* | 6.0008 | 2/25/2043 | Monthly US LIBOR | +6.15% | 66,980 | ||||||||||||
| 346,601 | Fannie Mae REMICS ~* | 6.3007 | 9/25/2037 | Monthly US LIBOR | +6.45% | 72,186 | ||||||||||||
| 305,522 | Fannie Mae REMICS ~* | 6.3007 | 12/25/2037 | Monthly US LIBOR | +6.45% | 69,936 | ||||||||||||
| 1,343,639 | Fannie Mae REMICS ~* | 6.3708 | 9/25/2037 | Monthly US LIBOR | +6.52% | 285,670 | ||||||||||||
| 530,176 | Fannie Mae REMICS ~* | 6.4007 | 6/25/2038 | Monthly US LIBOR | +6.55% | 16,317 | ||||||||||||
| 2,192,196 | Fannie Mae REMICS ~* | 6.4508 | 10/25/2040 | Monthly US LIBOR | +6.60% | 360,701 | ||||||||||||
| 938,525 | Fannie Mae REMICS ~* | 6.4807 | 11/25/2036 | Monthly US LIBOR | +6.63% | 221,547 | ||||||||||||
| 552,389 | Fannie Mae REMICS ~* | 6.5008 | 12/25/2036 | Monthly US LIBOR | +6.65% | 113,089 | ||||||||||||
| 510,824 | Fannie Mae REMICS ~* | 6.6107 | 5/25/2037 | Monthly US LIBOR | +6.76% | 108,069 | ||||||||||||
| 8,157,386 | Freddie Mac REMICS ~* | 0.1000 | 9/15/2040 | Monthly US LIBOR | +6.10% | 25,290 | ||||||||||||
| 22,883,020 | Freddie Mac REMICS #* | 0.2082 | 8/15/2044 | 201,824 | ||||||||||||||
| 1,007,459 | Freddie Mac REMICS * | 3.0000 | 6/15/2041 | 42,343 | ||||||||||||||
| 300,887 | Freddie Mac REMICS * | 3.5000 | 4/15/2033 | 15,256 | ||||||||||||||
| 1,269,252 | Freddie Mac REMICS * | 3.5000 | 3/15/2043 | 39,450 | ||||||||||||||
| 398,768 | Freddie Mac REMICS * | 3.5000 | 6/15/2043 | 10,527 | ||||||||||||||
| 884,664 | Freddie Mac REMICS * | 3.5000 | 7/15/2043 | 51,968 | ||||||||||||||
| 2,290,055 | Freddie Mac REMICS * | 3.5000 | 10/15/2043 | 63,082 | ||||||||||||||
| 379,655 | Freddie Mac REMICS * | 3.5000 | 2/15/2044 | 11,998 | ||||||||||||||
| 648,127 | Freddie Mac REMICS * | 3.5000 | 4/15/2044 | 9,982 | ||||||||||||||
| 463,216 | Freddie Mac REMICS * | 3.5000 | 4/15/2046 | 40,973 | ||||||||||||||
| 1,025,301 | Freddie Mac REMICS * | 4.0000 | 11/15/2039 | 73,048 | ||||||||||||||
| 342,579 | Freddie Mac REMICS * | 4.0000 | 12/15/2041 | 9,637 | ||||||||||||||
See accompanying notes to financial statements.
6
| Anfield Universal Fixed Income Fund |
| SCHEDULE OF INVESTMENTS (Continued) |
| October 31, 2020 |
| Par Value | Coupon Rate (%) | Maturity | Spread | Rate | Fair Value | |||||||||||||
| AGENCY COLLATERALIZED MORTGAGE OBLIGATIONS - 15.0% (Continued) | ||||||||||||||||||
| $ | 1,312,422 | Freddie Mac REMICS * | 4.0000 | 4/15/2043 | $ | 169,775 | ||||||||||||
| 2,230,769 | Freddie Mac REMICS * | 4.0000 | 8/15/2043 | 54,169 | ||||||||||||||
| 509,860 | Freddie Mac REMICS * | 4.0000 | 1/15/2044 | 11,774 | ||||||||||||||
| 159,131 | Freddie Mac REMICS * | 4.0000 | 9/15/2044 | 779 | ||||||||||||||
| 722,798 | Freddie Mac REMICS * | 4.0000 | 3/15/2045 | 89,285 | ||||||||||||||
| 1,724,094 | Freddie Mac REMICS * | 4.0000 | 12/15/2046 | 215,318 | ||||||||||||||
| 804,814 | Freddie Mac REMICS * | 4.0000 | 5/15/2048 | 71,189 | ||||||||||||||
| 2,165,805 | Freddie Mac REMICS * | 4.5000 | 12/15/2044 | 70,524 | ||||||||||||||
| 346,955 | Freddie Mac REMICS * | 4.5000 | 7/15/2046 | 8,473 | ||||||||||||||
| 2,400,902 | Freddie Mac REMICS * | 4.5000 | 9/15/2048 | 466,963 | ||||||||||||||
| 706,478 | Freddie Mac REMICS ~* | 5.4516 | 5/15/2045 | Monthly US LIBOR | +5.60% | 109,576 | ||||||||||||
| 667,948 | Freddie Mac REMICS ~* | 5.7516 | 1/15/2054 | Monthly US LIBOR | +5.90% | 134,804 | ||||||||||||
| 1,843,994 | Freddie Mac REMICS ~* | 5.8516 | 5/15/2046 | Monthly US LIBOR | +6.00% | 345,193 | ||||||||||||
| 352,452 | Freddie Mac REMICS ~* | 5.9016 | 7/15/2042 | Monthly US LIBOR | +6.05% | 79,398 | ||||||||||||
| 713,753 | Freddie Mac REMICS ~* | 5.9516 | 12/15/2044 | Monthly US LIBOR | +6.10% | 142,388 | ||||||||||||
| 423,960 | Freddie Mac REMICS * | 6.0000 | 10/15/2037 | 63,690 | ||||||||||||||
| 500,460 | Freddie Mac REMICS ~* | 6.4016 | 8/15/2042 | Monthly US LIBOR | +6.55% | 105,552 | ||||||||||||
| 2,821,834 | Freddie Mac REMICS ~* | 6.5016 | 5/15/2040 | Monthly US LIBOR | +6.65% | 168,790 | ||||||||||||
| 606,014 | Freddie Mac REMICS ~* | 7.5516 | 7/15/2034 | Monthly US LIBOR | +7.70% | 64,950 | ||||||||||||
| 82,365 | Freddie Mac REMICS ~ | 14.4649 | 12/15/2040 | Monthly US LIBOR | +14.91% | 151,085 | ||||||||||||
| 43,193 | Freddie Mac REMICS ~ | 20.5442 | 2/15/2032 | Monthly US LIBOR | +20.93% | 65,904 | ||||||||||||
| 443,179 | Freddie Mac Strips #* | 4.5000 | 12/15/2039 | 62,787 | ||||||||||||||
| 414,791 | Freddie Mac Strips #* | 4.5000 | 12/15/2040 | 64,604 | ||||||||||||||
| 651,227 | Freddie Mac Strips #* | 4.5000 | 1/15/2043 | 118,291 | ||||||||||||||
| 1,086,364 | Freddie Mac Strips * | 5.0000 | 6/15/2038 | 211,484 | ||||||||||||||
| 135,281 | Freddie Mac Strips * | 6.5000 | 4/1/2029 | 23,270 | ||||||||||||||
| 14,322,528 | Government National Mortgage Association ~* | 0.1500 | 9/16/2034 | Monthly US LIBOR | +6.70% | 66,673 | ||||||||||||
| 19,861,155 | Government National Mortgage Association #* | 0.2574 | 10/20/2043 | 157,537 | ||||||||||||||
| 2,612,600 | Government National Mortgage Association ~* | 0.5000 | 6/20/2040 | 30,003 | ||||||||||||||
| 4,807,104 | Government National Mortgage Association ~* | 1.0000 | 10/20/2045 | Monthly US LIBOR | +31.25% | 213,721 | ||||||||||||
| 1,383,302 | Government National Mortgage Association #* | 1.0000 | 7/20/2043 | 26,497 | ||||||||||||||
| 1,676,634 | Government National Mortgage Association * | 3.0000 | 6/20/2041 | 86,081 | ||||||||||||||
| 73,142 | Government National Mortgage Association * | 3.0000 | 7/20/2041 | 765 | ||||||||||||||
| 2,917,104 | Government National Mortgage Association * | 3.0000 | 8/20/2041 | 147,103 | ||||||||||||||
| 145,835 | Government National Mortgage Association * | 3.0000 | 2/20/2042 | 3,618 | ||||||||||||||
| 346,738 | Government National Mortgage Association * | 3.0000 | 7/20/2043 | 14,691 | ||||||||||||||
| 827,253 | Government National Mortgage Association * | 3.0000 | 12/20/2044 | 14,801 | ||||||||||||||
| 521,372 | Government National Mortgage Association * | 3.0000 | 4/20/2046 | 17,474 | ||||||||||||||
| 703,715 | Government National Mortgage Association * | 3.5000 | 9/20/2023 | 14,794 | ||||||||||||||
| 946,592 | Government National Mortgage Association * | 3.5000 | 10/20/2039 | 64,538 | ||||||||||||||
| 141,861 | Government National Mortgage Association * | 3.5000 | 1/20/2043 | 21,425 | ||||||||||||||
| 518,874 | Government National Mortgage Association * | 3.5000 | 5/20/2043 | 75,044 | ||||||||||||||
| 549,282 | Government National Mortgage Association * | 3.5000 | 3/20/2044 | 7,871 | ||||||||||||||
| 257,471 | Government National Mortgage Association * | 3.5000 | 4/20/2044 | 4,537 | ||||||||||||||
| 544,675 | Government National Mortgage Association * | 3.5000 | 8/20/2044 | 3,540 | ||||||||||||||
| 607,772 | Government National Mortgage Association * | 3.5000 | 4/20/2046 | 83,638 | ||||||||||||||
| 1,686,144 | Government National Mortgage Association * | 3.5000 | 9/20/2046 | 132,157 | ||||||||||||||
| 1,146,621 | Government National Mortgage Association * | 3.5000 | 3/20/2047 | 64,305 | ||||||||||||||
| 156,809 | Government National Mortgage Association * | 3.5000 | 7/20/2047 | 5,205 | ||||||||||||||
| 1,835,217 | Government National Mortgage Association * | 3.5000 | 1/20/2048 | 102,391 | ||||||||||||||
| 137,487 | Government National Mortgage Association * | 4.0000 | 12/16/2026 | 10,299 | ||||||||||||||
| 376,918 | Government National Mortgage Association * | 4.0000 | 12/20/2040 | 9,645 | ||||||||||||||
| 725,055 | Government National Mortgage Association * | 4.0000 | 3/16/2041 | 79,392 | ||||||||||||||
| 2,669,512 | Government National Mortgage Association * | 4.0000 | 11/20/2044 | 274,534 | ||||||||||||||
| 790,362 | Government National Mortgage Association * | 4.0000 | 7/20/2045 | 76,331 | ||||||||||||||
| 428,700 | Government National Mortgage Association * | 4.0000 | 6/20/2046 | 55,628 | ||||||||||||||
| 2,511,682 | Government National Mortgage Association * | 4.0000 | 11/20/2047 | 146,112 | ||||||||||||||
| 1,995,494 | Government National Mortgage Association * | 4.5000 | 8/20/2045 | 276,119 | ||||||||||||||
| 948,060 | Government National Mortgage Association * | 4.5000 | 10/16/2045 | 103,456 | ||||||||||||||
| 2,050,465 | Government National Mortgage Association * | 4.5000 | 3/20/2046 | 138,467 | ||||||||||||||
| 324,619 | Government National Mortgage Association * | 4.5000 | 4/20/2046 | 29,374 | ||||||||||||||
| 216,233 | Government National Mortgage Association * | 5.0000 | 3/20/2039 | 5,330 | ||||||||||||||
| 1,832,716 | Government National Mortgage Association * | 5.0000 | 4/20/2040 | 293,513 | ||||||||||||||
| 409,471 | Government National Mortgage Association * | 5.0000 | 10/16/2040 | 51,696 | ||||||||||||||
| 562,926 | Government National Mortgage Association * | 5.0000 | 7/20/2042 | 56,834 | ||||||||||||||
See accompanying notes to financial statements.
7
| Anfield Universal Fixed Income Fund |
| SCHEDULE OF INVESTMENTS (Continued) |
| October 31, 2020 |
| Par Value | Coupon Rate (%) | Maturity | Spread | Rate | Fair Value | |||||||||||||
| AGENCY COLLATERALIZED MORTGAGE OBLIGATIONS - 15.0% (Continued) | ||||||||||||||||||
| $ | 507,175 | Government National Mortgage Association * | 5.0000 | 1/20/2043 | $ | 58,774 | ||||||||||||
| 785,762 | Government National Mortgage Association * | 5.0000 | 11/20/2046 | 70,928 | ||||||||||||||
| 333,051 | Government National Mortgage Association * | 5.0000 | 12/20/2047 | 65,966 | ||||||||||||||
| 225,470 | Government National Mortgage Association ~* | 5.4486 | 9/20/2044 | Monthly US LIBOR | +5.60% | 40,586 | ||||||||||||
| 674,176 | Government National Mortgage Association ~* | 5.4542 | 6/16/2044 | Monthly US LIBOR | +5.60% | 137,335 | ||||||||||||
| 1,504,738 | Government National Mortgage Association * | 5.5000 | 2/20/2039 | 331,024 | ||||||||||||||
| 629,376 | Government National Mortgage Association * | 5.5000 | 9/20/2048 | 88,428 | ||||||||||||||
| 881,783 | Government National Mortgage Association * | 5.5000 | 10/20/2048 | 152,127 | ||||||||||||||
| 746,366 | Government National Mortgage Association ~* | 5.8486 | 8/20/2042 | Monthly US LIBOR | +6.00% | 150,996 | ||||||||||||
| 1,241,826 | Government National Mortgage Association ~* | 5.8986 | 2/20/2049 | Monthly US LIBOR | +6.05% | 132,345 | ||||||||||||
| 3,923,515 | Government National Mortgage Association ~* | 5.9042 | 12/16/2040 | Monthly US LIBOR | +6.05% | 804,748 | ||||||||||||
| 1,620,318 | Government National Mortgage Association ~* | 5.9486 | 3/20/2039 | Monthly US LIBOR | +6.10% | 155,359 | ||||||||||||
| 768,417 | Government National Mortgage Association ~* | 5.9486 | 10/20/2043 | Monthly US LIBOR | +6.10% | 103,678 | ||||||||||||
| 328,886 | Government National Mortgage Association ~* | 5.9486 | 11/20/2043 | Monthly US LIBOR | +6.10% | 64,427 | ||||||||||||
| 1,475,592 | Government National Mortgage Association ~* | 5.9542 | 8/16/2043 | Monthly US LIBOR | +6.10% | 260,539 | ||||||||||||
| 1,045,152 | Government National Mortgage Association ~* | 5.9986 | 7/20/2043 | Monthly US LIBOR | +6.15% | 180,409 | ||||||||||||
| 514,700 | Government National Mortgage Association * | 6.0000 | 4/20/2041 | 90,345 | ||||||||||||||
| 2,565,367 | Government National Mortgage Association ~* | 6.0042 | 7/16/2038 | Monthly US LIBOR | +6.15% | 505,661 | ||||||||||||
| 509,475 | Government National Mortgage Association ~* | 6.0486 | 12/20/2042 | Monthly US LIBOR | +6.20% | 94,172 | ||||||||||||
| 2,207,689 | Government National Mortgage Association ~* | 6.0486 | 12/20/2047 | Monthly US LIBOR | +6.20% | 401,249 | ||||||||||||
| 1,650,076 | Government National Mortgage Association ~* | 6.1586 | 2/20/2036 | Monthly US LIBOR | +6.31% | 308,756 | ||||||||||||
| 1,986,456 | Government National Mortgage Association ~* | 6.2543 | 1/16/2040 | Monthly US LIBOR | +6.40% | 288,581 | ||||||||||||
| 1,648,173 | Government National Mortgage Association ~* | 6.3542 | 8/16/2039 | Monthly US LIBOR | +6.50% | 111,581 | ||||||||||||
| 4,745,732 | Government National Mortgage Association ~* | 6.3986 | 10/20/2039 | Monthly US LIBOR | +6.55% | 1,088,266 | ||||||||||||
| 3,884,135 | Government National Mortgage Association ~* | 6.4486 | 12/20/2039 | Monthly US LIBOR | +6.60% | 244,639 | ||||||||||||
| 9,076,698 | Government National Mortgage Association ~* | 6.5386 | 10/20/2037 | Monthly US LIBOR | +6.69% | 1,923,291 | ||||||||||||
| 280,869 | Government National Mortgage Association ~* | 6.5543 | 6/16/2042 | Monthly US LIBOR | +6.70% | 52,900 | ||||||||||||
| 582,832 | Government National Mortgage Association ~* | 6.5986 | 9/20/2040 | Monthly US LIBOR | +6.75% | 26,363 | ||||||||||||
| 3,410,047 | Government National Mortgage Association ~* | 6.5986 | 3/20/2043 | Monthly US LIBOR | +6.75% | 444,233 | ||||||||||||
| 655,825 | Government National Mortgage Association ~* | 6.5986 | 12/20/2045 | Monthly US LIBOR | +6.75% | 138,041 | ||||||||||||
| 581,494 | Government National Mortgage Association ~* | 6.6043 | 3/16/2042 | Monthly US LIBOR | +6.75% | 101,782 | ||||||||||||
| 1,523,433 | Government National Mortgage Association ~* | 6.6543 | 5/16/2037 | Monthly US LIBOR | +6.80% | 368,299 | ||||||||||||
| 5,358,847 | Government National Mortgage Association ~* | 6.6986 | 7/20/2034 | Monthly US LIBOR | +6.85% | 1,095,369 | ||||||||||||
| TOTAL AGENCY COLLATERALIZED MORTGAGE OBLIGATIONS (Cost $36,510,877) | 25,247,109 | |||||||||||||||||
| CORPORATE BONDS - 42.4% | ||||||||||||||||||
| AUTOMOTIVE - 7.4% | ||||||||||||||||||
| 251,000 | Daimler Finance North America LLC ^ | 3.0000 | 2/22/2021 | 252,894 | ||||||||||||||
| 3,021,000 | Ford Motor Credit Co. LLC | 3.2000 | 1/15/2021 | 3,026,664 | ||||||||||||||
| 2,831,000 | Ford Motor Credit Co. LLC | 3.3360 | 3/18/2021 | 2,834,539 | ||||||||||||||
| 1,750,000 | Ford Motor Credit Co. LLC | 3.4700 | 4/5/2021 | 1,753,281 | ||||||||||||||
| 1,450,000 | Ford Motor Credit Co. LLC | 5.7500 | 2/1/2021 | 1,464,029 | ||||||||||||||
| 500,000 | General Motors Financial Co., Inc. | 3.1500 | 6/30/2022 | 514,481 | ||||||||||||||
| 2,500,000 | General Motors Financial Co., Inc. | 4.2000 | 11/6/2021 | 2,576,170 | ||||||||||||||
| 12,422,058 | ||||||||||||||||||
| BANKING - 12.5% | ||||||||||||||||||
| 268,000 | Bank of America Corp. # | 1.9904 | 11/18/2020 | Quarterly US LIBOR | +1.72% | 268,134 | ||||||||||||
| 500,000 | Barclays Bank PLC # | 3.0000 | 2/22/2021 | Quarterly US LIBOR | +1.25% | 503,341 | ||||||||||||
| 8,845,000 | BNP Paribas SA ^# | 7.6250 | 3/30/2021 | 5 Year Swap Rate | +6.31% | 8,961,091 | ||||||||||||
| 1,665,000 | CIT Group, Inc. | 4.1250 | 3/9/2021 | 1,679,194 | ||||||||||||||
| 4,704,000 | CIT Group, Inc. # | 5.8000 | 6/15/2022 | Quarterly US LIBOR | +3.97% | 4,639,320 | ||||||||||||
| 250,000 | Citigroup, Inc. ~ | 3.0000 | 12/15/2020 | Quarterly US LIBOR | +1.25% | 250,666 | ||||||||||||
| 2,308,000 | Citigroup, Inc. # | 5.9500 | 1/30/2023 | Quarterly US LIBOR | +4.07% | 2,395,653 | ||||||||||||
| 1,420,000 | JPMorgan Chase & Co. # | 4.0510 | 2/1/2021 | Quarterly US LIBOR | +3.80% | 1,393,808 | ||||||||||||
| 400,000 | Manufacturers & Traders Trust Co. # | 0.8860 | 12/1/2021 | Quarterly US LIBOR | +0.64% | 400,029 | ||||||||||||
| 500,000 | National Westminster Bank PLC ~ | 0.5059 | 11/29/2049 | Quarterly US LIBOR | +0.25% | 454,580 | ||||||||||||
| 20,945,816 | ||||||||||||||||||
| BEVERAGES - 0.5% | ||||||||||||||||||
| 400,000 | Coca-Cola European Partners PLC | 3.2500 | 8/19/2021 | 407,198 | ||||||||||||||
| 500,000 | Molson Coors Beverage Co. | 3.5000 | 5/1/2022 | 520,458 | ||||||||||||||
| 927,656 | ||||||||||||||||||
| BIOTECHNOLOGY & PHARMACEUTICALS - 0.6% | ||||||||||||||||||
| 1,110,000 | Teva Pharmaceutical Finance Netherlands III BV | 2.2000 | 7/21/2021 | 1,094,782 | ||||||||||||||
See accompanying notes to financial statements.
8
| Anfield Universal Fixed Income Fund |
| SCHEDULE OF INVESTMENTS (Continued) |
| October 31, 2020 |
| Par Value | Coupon Rate (%) | Maturity | Spread | Rate | Fair Value | |||||||||||||
| CORPORATE BONDS - 42.4% (Continued) | ||||||||||||||||||
| CABLE & SATELLITE - 0.2% | ||||||||||||||||||
| $ | 400,000 | Time Warner Cable LLC | 4.0000 | 9/1/2021 | $ | 407,900 | ||||||||||||
| CHEMICALS - 0.1% | ||||||||||||||||||
| 179,000 | DuPont de Nemours, Inc. | 3.7660 | 11/15/2020 | 179,203 | ||||||||||||||
| CONTAINERS & PACKAGING - 0.3% | ||||||||||||||||||
| 500,000 | Ball Corp. | 5.0000 | 3/15/2022 | 521,888 | ||||||||||||||
| DIVERSIFIED INDUSTRIALS - 1.0% | ||||||||||||||||||
| 2,000,000 | General Electric Co. # | 5.0000 | 12/29/2049 | Quarterly US LIBOR | +3.33% | 1,623,339 | ||||||||||||
| ELECTRIC UTILITIES - 0.9% | ||||||||||||||||||
| 1,438,000 | EDP Finance BV ^ | 5.2500 | 1/14/2021 | 1,454,007 | ||||||||||||||
| ENTERTAINMENT CONTENT - 0.1% | ||||||||||||||||||
| 120,000 | ViacomCBS, Inc. # | 5.8750 | 2/28/2057 | Quarterly US LIBOR | +3.90% | 121,425 | ||||||||||||
| FORESTRY, PAPER & WOOD PRODUCTS - 0.5% | ||||||||||||||||||
| 775,000 | Carter Holt Harvey Ltd. + | 9.5000 | 12/1/2024 | 839,635 | ||||||||||||||
| INSTITUTIONAL FINANCIAL SERVICES - 2.4% | ||||||||||||||||||
| 2,167,000 | Bank of New York Mellon Corp. ~ | 3.6474 | 3/20/2021 | Quarterly US LIBOR | +3.42% | 2,142,854 | ||||||||||||
| 2,000,000 | Goldman Sachs Group, Inc. # | 4.1653 | 12/21/2020 | Quarterly US LIBOR | +3.93% | 1,972,500 | ||||||||||||
| 4,115,354 | ||||||||||||||||||
| INSURANCE - 0.3% | ||||||||||||||||||
| 459,000 | MetLife, Inc. # | 3.8254 | 12/21/2020 | Quarterly US LIBOR | +3.58% | 455,271 | ||||||||||||
| INTERNET MEDIA & SERVICES - 0.5% | ||||||||||||||||||
| 495,000 | Netflix, Inc. | 5.3750 | 2/1/2021 | 500,569 | ||||||||||||||
| 279,000 | Netflix, Inc. | 5.5000 | 2/15/2022 | 293,648 | ||||||||||||||
| 794,217 | ||||||||||||||||||
| LEISURE FACILITIES & SERVICES - 0.6% | ||||||||||||||||||
| 1,000,000 | Royal Caribbean Cruises Ltd. | 2.6500 | 11/28/2020 | 997,500 | ||||||||||||||
| OIL & GAS PRODUCERS - 4.0% | ||||||||||||||||||
| 630,000 | BG Energy Capital PLC ^ | 4.0000 | 12/9/2020 | 632,297 | ||||||||||||||
| 175,000 | DCP Midstream Operating LP ^ | 4.7500 | 9/30/2021 | 176,313 | ||||||||||||||
| 300,000 | DCP Midstream Operating LP ^# | 5.8500 | 5/21/2043 | Quarterly US LIBOR | +3.85% | 224,311 | ||||||||||||
| 3,761,000 | Petrobras Global Finance BV | 5.3750 | 1/27/2021 | 3,797,670 | ||||||||||||||
| 1,213,000 | Plains All American Pipeline LP / PAA Finance Corp. | 5.0000 | 2/1/2021 | 1,213,000 | ||||||||||||||
| 650,000 | Sunoco Logistics Partners Operations LP | 4.4000 | 4/1/2021 | 658,001 | ||||||||||||||
| 6,701,592 | ||||||||||||||||||
| REAL ESTATE INVESTMENT TRUSTS (REITs) - 0.8% | ||||||||||||||||||
| 150,000 | American Tower Trust #1 ^ | 3.0700 | 3/15/2023 | 153,579 | ||||||||||||||
| 1,115,000 | SBA Tower Trust ^ | 3.7220 | 4/11/2023 | 1,151,243 | ||||||||||||||
| 1,304,822 | ||||||||||||||||||
| SOFTWARE - 0.1% | ||||||||||||||||||
| 95,000 | NortonLifeLock, Inc. | 3.9500 | 6/15/2022 | 97,731 | ||||||||||||||
| SPECIALTY FINANCE - 2.0% | ||||||||||||||||||
| 2,500,000 | AerCap Ireland Capital DAC / AerCap Global Aviation Trust | �� | 4.5000 | 5/15/2021 | 2,544,631 | |||||||||||||
| 629,000 | Ally Financial, Inc. | 4.2500 | 4/15/2021 | 638,863 | ||||||||||||||
| 500,000 | ILFC E-Capital Trust I ^# | 2.9800 | 12/21/2020 | Quarterly US LIBOR | +1.55% | 263,317 | ||||||||||||
| 3,446,811 | ||||||||||||||||||
| TECHNOLOGY HARDWARE - 2.0% | ||||||||||||||||||
| 3,374,000 | Dell, Inc. | 4.6250 | 4/1/2021 | 3,424,964 | ||||||||||||||
| TECHNOLOGY SERVICES - 0.3% | ||||||||||||||||||
| 500,000 | Nielsen Finance LLC / Nielsen Finance Co. ^ | 5.0000 | 4/15/2022 | 500,750 | ||||||||||||||
See accompanying notes to financial statements.
9
| Anfield Universal Fixed Income Fund |
| SCHEDULE OF INVESTMENTS (Continued) |
| October 31, 2020 |
| Par Value | Coupon Rate (%) | Maturity | Spread | Rate | Fair Value | |||||||||||
| CORPORATE BONDS - 42.4% (Continued) | ||||||||||||||||
| TELECOMMUNICATIONS - 2.0% | ||||||||||||||||
| $ | 1,707,000 | Sprint Corp. | 7.2500 | 9/15/2021 | $ | 1,780,111 | ||||||||||
| 1,045,750 | Sprint Spectrum Co. LLC / Sprint Spectrum Co. II LLC / Sprint Spectrum Co. III LLC ^ | 3.3600 | 9/20/2021 | 1,057,185 | ||||||||||||
| 500,000 | T-Mobile USA, Inc. | 4.0000 | 4/15/2022 | 517,300 | ||||||||||||
| 3,354,596 | ||||||||||||||||
| TOBACCO & CANNABIS - 0.3% | ||||||||||||||||
| 500,000 | Imperial Brands Finance PLC ^ | 3.5000 | 2/11/2023 | 523,877 | ||||||||||||
| TRANSPORTATION & LOGISTICS - 3.0% | ||||||||||||||||
| 41 | Continental Airlines 2000-1 Class A-1 Pass Through Trust | 8.0480 | 11/1/2020 | 41 | ||||||||||||
| 1,270,483 | Continental Airlines 2007-1 Class A Pass Through Trust | 5.9830 | 4/19/2022 | 1,239,879 | ||||||||||||
| 1,260,627 | Continental Airlines 2010-1 Class A Pass Through Trust | 4.7500 | 1/12/2021 | 1,264,944 | ||||||||||||
| 1,137,000 | Delta Air Lines, Inc. | 2.6000 | 12/4/2020 | 1,136,407 | ||||||||||||
| 1,420,322 | UAL 2007-1 Pass Through Trust | 6.6360 | 7/2/2022 | 1,354,573 | ||||||||||||
| 125,107 | United Airlines 2014-1 Class B Pass Through Trust | 4.7500 | 4/11/2022 | 122,451 | ||||||||||||
| 5,118,295 | ||||||||||||||||
| TOTAL CORPORATE BONDS (Cost $71,946,748) | 71,373,489 | |||||||||||||||
| Shares | ||||||||||||||||
| PREFERRED STOCKS - 0.8% | ||||||||||||||||
| BANKING - 0.8% | ||||||||||||||||
| 7,400 | Citigroup, Inc. # | 6.8750 | Quarterly US LIBOR | +4.13% | 205,276 | |||||||||||
| 40,000 | Citigroup, Inc. # | 7.1250 | Quarterly US LIBOR | +4.04% | 1,131,200 | |||||||||||
| TOTAL PREFERRED STOCKS (Cost $1,342,770) | 1,336,476 | |||||||||||||||
| Par Value | ||||||||||||||||
| TERM LOANS - 7.3% | ||||||||||||||||
| $ | 2,940,903 | Aramark Services, Inc. ~ | 1.8966 | 3/28/2024 | 2,828,796 | |||||||||||
| 719,048 | Cedar Fair LP ~ | 1.9111 | 4/13/2024 | 674,783 | ||||||||||||
| 990,000 | Diamond Sports Group LLC ~ | 3.4000 | 7/18/2026 | 620,814 | ||||||||||||
| 4,434,280 | Jacobs Douwe Egberts International BV ~ | 2.1875 | 10/23/2025 | 4,428,737 | ||||||||||||
| 3,933,764 | United Airlines, Inc. ~ | 1.9111 | 4/1/2024 | 3,690,382 | ||||||||||||
| TOTAL TERM LOANS (Cost $12,954,088) | 12,243,512 | |||||||||||||||
| TOTAL INVESTMENTS - 92.6% (Cost $174,060,715) | $ | 155,731,343 | ||||||||||||||
| OTHER ASSETS LESS LIABILITIES - 7.4% | 12,451,301 | |||||||||||||||
| TOTAL NET ASSETS - 100.0% | $ | 168,182,644 | ||||||||||||||
CLO - Collateralized Loan Obligation
ETF - Exchange Traded Fund
LLC - Limited Liability Company
LP - Limited Partnership
PLC - Public Limited Company
REMIC - Real Estate Mortgage Investment Conduits
| ^ | 144A Security - Security exempt from registration under Rule 144A of the Securities Act of 1933. The 144A securities represent 24.34% of total net assets. The securities may be resold in transactions exempt from registration typically only to qualified institutional buyers. Unless otherwise indicated, these securities are not considered to be illiquid. |
| ~ | Floating Rate Securities |
| # | Variable Rate Securities |
| < | STEP Securities |
| > | Represents less than 0.1% |
| * | Interest Only Securities |
| + | Fair valued determined using Level 3 measurements. As of October 31, 2020 fair valued securities had a market value of $839,635 and represented 0.50% of Total Net Assets. |
| FUTURES CONTRACTS | ||||||||||||||||
| Number of | Unrealized | |||||||||||||||
| Contracts | Maturity | Counterparty | Notional Value ** | Depreciation | ||||||||||||
| LONG FUTURES CONTRACTS | ||||||||||||||||
| 150 | US 10 Year Treasury Note Future | December 2020 | Interactive Brokers | $ | 20,732,850 | $ | (116,369 | ) | ||||||||
| 75 | US Long Bond Future | December 2020 | Interactive Brokers | 12,935,175 | (239,825 | ) | ||||||||||
| Net Unrealized Depreciation on Futures Contracts | $ | (356,194 | ) | |||||||||||||
| ** | The amounts shown are the underlying reference notional amounts to stock exchange indices and equities upon which the fair value of the futures contracts held by the Fund are based. Notional values do not represent the current fair value of, and are not necessarily indicative of the future cash flows of the Fund’s futures contracts. Further, the underlying price changes in relation to the variables specified by the notional values affects the fair value of these derivative financial instruments. The notional values as set forth within this schedule do not purport to represent economic value at risk to the Fund. |
See accompanying notes to financial statements.
10
| Anfield Universal Fixed Income Fund |
| STATEMENT OF ASSETS AND LIABILITIES |
| October 31, 2020 |
| ASSETS | ||||
| Investment securities: | ||||
| At cost | $ | 174,060,715 | ||
| At fair value | $ | 155,731,343 | ||
| Cash | 8,596,509 | |||
| Dividends and interest receivable | 1,435,382 | |||
| Deposits with brokers | 4,131,694 | |||
| Receivable for Fund shares sold | 274,565 | |||
| Prepaid expenses and other assets | 59,462 | |||
| TOTAL ASSETS | 170,228,955 | |||
| LIABILITIES | ||||
| Payable for securities purchased | 1,160,988 | |||
| Net unrealized depreciation on futures contracts | 356,194 | |||
| Investment advisory fees payable | 116,062 | |||
| Payable to related parties | 93,899 | |||
| Payable for Fund shares repurchased | 272,952 | |||
| Distribution (12b-1) fees payable | 3,397 | |||
| Accrued expenses and other liabilities | 42,819 | |||
| TOTAL LIABILITIES | 2,046,311 | |||
| NET ASSETS | $ | 168,182,644 | ||
| Composition of Net Assets: | ||||
| Paid in capital | $ | 185,866,542 | ||
| Accumulated losses | (17,683,898 | ) | ||
| NET ASSETS | $ | 168,182,644 | ||
See accompanying notes to financial statements.
11
| Anfield Universal Fixed Income Fund |
| STATEMENT OF ASSETS AND LIABILITIES (Continued) |
| October 31, 2020 |
| Net Asset Value Per Share: | ||||
| Class A Shares: | ||||
| Net Assets | $ | 10,936,778 | ||
| Shares of beneficial interest outstanding (a) | 1,150,424 | |||
| Net asset value (Net Assets ÷ Shares Outstanding), offering price and redemption price per share | $ | 9.51 | ||
| Maximum offering price per share (net asset value plus maximum sales charge of 5.75%) | $ | 10.09 | ||
| Class C Shares: | ||||
| Net Assets | $ | 1,203,471 | ||
| Shares of beneficial interest outstanding (a) | 126,584 | |||
| Net asset value (Net Assets ÷ Shares Outstanding), offering price and redemption price per share | $ | 9.51 | ||
| Class I Shares: | ||||
| Net Assets | $ | 156,042,395 | ||
| Shares of beneficial interest outstanding (a) | 16,401,404 | |||
| Net asset value (Net Assets ÷ Shares Outstanding), offering price and redemption price per share | $ | 9.51 | ||
| (a) | Unlimited number of shares of beneficial interest authorized, no par value. |
See accompanying notes to financial statements.
12
| Anfield Universal Fixed Income Fund |
| STATEMENT OF OPERATIONS |
| For the Year Ended October 31, 2020 |
| INVESTMENT INCOME | ||||
| Dividends | $ | 395,778 | ||
| Interest | 8,764,752 | |||
| TOTAL INVESTMENT INCOME | 9,160,530 | |||
| EXPENSES | ||||
| Investment advisory fees | 1,930,483 | |||
| Distribution (12b-1) fees: | ||||
| Class A | 48,792 | |||
| Class C | 13,457 | |||
| Administration fees | 327,719 | |||
| Transfer agent fees | 175,906 | |||
| Third party administration servicing fees | 122,237 | |||
| Registration fees | 78,460 | |||
| Accounting services fees | 49,133 | |||
| Printing and postage expenses | 39,613 | |||
| Custodian fees | 35,321 | |||
| Legal fees | 32,963 | |||
| Compliance officer fees | 29,663 | |||
| Audit fees | 22,900 | |||
| Insurance expense | 21,780 | |||
| Trustees fees and expenses | 15,880 | |||
| Other expenses | 49,807 | |||
| TOTAL EXPENSES | 2,994,114 | |||
| NET INVESTMENT INCOME | 6,166,416 | |||
| NET REALIZED AND UNREALIZED GAIN (LOSS) FROM INVESTMENTS | ||||
| Net realized loss from investments and options purchased | (6,760,991 | ) | ||
| Net realized gain from futures contracts | 7,050,202 | |||
| Net change in unrealized depreciation on investments | (7,395,007 | ) | ||
| Net change in unrealized depreciation on futures contracts | (615,567 | ) | ||
| NET REALIZED AND UNREALIZED LOSS FROM INVESTMENTS | (7,721,363 | ) | ||
| NET DECREASE IN NET ASSETS RESULTING FROM OPERATIONS | $ | (1,554,947 | ) | |
See accompanying notes to financial statements.
13
| Anfield Universal Fixed Income Fund |
| STATEMENTS OF CHANGES IN NET ASSETS |
| For the | For the | |||||||
| Year Ended | Year Ended | |||||||
| October 31, 2020 | October 31, 2019 | |||||||
| FROM OPERATIONS | ||||||||
| Net investment income | $ | 6,166,416 | $ | 8,226,934 | ||||
| Net realized gain (loss) from investments and options purchased | (6,760,991 | ) | 127,066 | |||||
| Net realized gain (loss) from futures contracts | 7,050,202 | (198,880 | ) | |||||
| Net change in unrealized depreciation on investments | (7,395,007 | ) | (11,770,416 | ) | ||||
| Net change in unrealized depreciation on futures contracts | (615,567 | ) | (306,884 | ) | ||||
| Net decrease in net assets resulting from operations | (1,554,947 | ) | (3,922,180 | ) | ||||
| DISTRIBUTIONS TO SHAREHOLDERS | ||||||||
| Total Distributions Paid | ||||||||
| Class A | (483,927 | ) | (819,358 | ) | ||||
| Class C | (25,699 | ) | (29,788 | ) | ||||
| Class I | (6,199,391 | ) | (8,668,095 | ) | ||||
| Total distributions to shareholders | (6,709,017 | ) | (9,517,241 | ) | ||||
| FROM SHARES OF BENEFICIAL INTEREST | ||||||||
| Proceeds from shares sold: | ||||||||
| Class A | 6,141,874 | 15,262,044 | ||||||
| Class C | 2,800 | 725,600 | ||||||
| Class I | 90,974,683 | 209,630,332 | ||||||
| Net asset value of shares issued in reinvestment of distributions: | ||||||||
| Class A | 435,546 | 738,570 | ||||||
| Class C | 25,649 | 29,708 | ||||||
| Class I | 4,075,224 | 5,422,048 | ||||||
| Payments for shares redeemed: | ||||||||
| Class A | (21,777,503 | ) | (11,981,995 | ) | ||||
| Class C | (272,654 | ) | (7,102 | ) | ||||
| Class I | (222,549,170 | ) | (119,911,525 | ) | ||||
| Net increase (decrease) in net assets from shares of beneficial interest | (142,943,551 | ) | 99,907,680 | |||||
| TOTAL INCREASE (DECREASE) IN NET ASSETS | (151,207,515 | ) | 86,468,259 | |||||
| NET ASSETS | ||||||||
| Beginning of the year | 319,390,159 | 232,921,900 | ||||||
| End of the year | $ | 168,182,644 | $ | 319,390,159 | ||||
See accompanying notes to financial statements.
14
| Anfield Universal Fixed Income Fund |
| STATEMENTS OF CHANGES IN NET ASSETS (Continued) |
| For the | For the | |||||||
| Year Ended | Year Ended | |||||||
| October 31, 2020 | October 31, 2019 | |||||||
| SHARE ACTIVITY | ||||||||
| Class A: | ||||||||
| Shares Sold | 636,952 | 1,516,466 | ||||||
| Shares Reinvested | 45,299 | 73,607 | ||||||
| Shares Redeemed | (2,255,862 | ) | (1,192,082 | ) | ||||
| Net increase (decrease) in shares of beneficial interest outstanding | (1,573,611 | ) | 397,991 | |||||
| Class C: | ||||||||
| Shares Sold | 283 | 71,816 | ||||||
| Shares Reinvested | 2,675 | 2,962 | ||||||
| Shares Redeemed | (28,044 | ) | (703 | ) | ||||
| Net increase (decrease) in shares of beneficial interest outstanding | (25,086 | ) | 74,075 | |||||
| Class I: | ||||||||
| Shares Sold | 9,365,508 | 20,779,248 | ||||||
| Shares Reinvested | 423,979 | 540,091 | ||||||
| Shares Redeemed | (22,997,813 | ) | (11,916,749 | ) | ||||
| Net increase (decrease) in shares of beneficial interest outstanding | (13,208,326 | ) | 9,402,590 | |||||
See accompanying notes to financial statements.
15
| Anfield Universal Fixed Income Fund |
| FINANCIAL HIGHLIGHTS |
| Per Share Data and Ratios for a Share of Beneficial Interest Outstanding Throughout each Year |
| Class A | ||||||||||||||||||||
| Year Ended | Year Ended | Year Ended | Year Ended | Year Ended | ||||||||||||||||
| October 31, | October 31, | October 31, | October 31, | October 31, | ||||||||||||||||
| 2020 | 2019 | 2018 | 2017 | 2016 | ||||||||||||||||
| Net asset value, beginning of year | $ | 9.82 | $ | 10.29 | $ | 10.21 | $ | 10.03 | $ | 10.00 | ||||||||||
| Activity from investment operations: | ||||||||||||||||||||
| Net investment income (1) | 0.23 | 0.26 | 0.23 | 0.16 | 0.30 | |||||||||||||||
| Net realized and unrealized gain (loss) on investments (2) | (0.28 | ) | (0.41 | ) | 0.10 | 0.19 | 0.03 | |||||||||||||
| Total from investment operations | (0.05 | ) | (0.15 | ) | 0.33 | 0.35 | 0.33 | |||||||||||||
| Less distributions from: | ||||||||||||||||||||
| Net investment income | (0.26 | ) | (0.28 | ) | (0.25 | ) | (0.17 | ) | (0.30 | ) | ||||||||||
| Net realized gains | — | (0.04 | ) | — | — | — | ||||||||||||||
| Total distributions | (0.26 | ) | (0.32 | ) | (0.25 | ) | (0.17 | ) | (0.30 | ) | ||||||||||
| Net asset value, end of year | $ | 9.51 | $ | 9.82 | $ | 10.29 | $ | 10.21 | $ | 10.03 | ||||||||||
| Total return (3) | (0.49 | )% | (1.54 | )% | 3.25 | % | 3.56 | % | 3.32 | % | ||||||||||
| Net assets, at end of year (000)s | $ | 10,937 | $ | 26,760 | $ | 23,942 | $ | 31,421 | $ | 10,988 | ||||||||||
| Ratio of gross expenses to average net assets (4)(5)(6) | 1.47 | % | 1.40 | % | 1.46 | % | 1.52 | % | 1.59 | % | ||||||||||
| Ratio of net expenses to average net assets (5)(6) | 1.47 | % | 1.40 | % | 1.38 | % | 1.20 | % | 1.20 | % | ||||||||||
| Ratio of net investment income to average net assets (5)(6) | 2.33 | % | 2.60 | % | 2.25 | % | 1.55 | % | 2.99 | % | ||||||||||
| Portfolio Turnover Rate | 33 | % | 37 | % | 50 | % | 43 | % | 45 | % | ||||||||||
| (1) | Per share amounts calculated using the average shares method, which more appropriately represents the per share data for the period. |
| (2) | Net realized and unrealized gain (loss) on investments per share are balancing amounts necessary to reconcile the change in net asset value per share for the period, and may not reconcile with aggregate gains (losses) in the statement of operations due to the share transactions for the period. |
| (3) | Total return shown excludes the effect of applicable sales charges. Total returns are historical in nature and assume changes in sale price, reinvestment of dividends and capital gain distributions. Had the advisor not waived a portion of the Fund’s expenses, total returns would have been lower. |
| (4) | Represents the ratio of expenses to average net assets absent fee waivers and/or expense reimbursements by the advisor. |
| (5) | The ratios of expenses to average net assets and net investment income (loss) to average net assets do not reflect the expenses of the underlying investment companies in which the Fund invests. |
| (6) | Ratio calculated for each share class as a whole, therefore an individual investor’s ratio may vary. |
See accompanying notes to financial statements.
16
| Anfield Universal Fixed Income Fund |
| FINANCIAL HIGHLIGHTS |
| Per Share Data and Ratios for a Share of Beneficial Interest Outstanding Throughout each Year |
| Class C | ||||||||||||||||||||
| Year Ended | Year Ended | Year Ended | Year Ended | Year Ended | ||||||||||||||||
| October 31, | October 31, | October 31, | October 31, | October 31, | ||||||||||||||||
| 2020 | 2019 | 2018 | 2017 | 2016 | ||||||||||||||||
| Net asset value, beginning of year | $ | 9.82 | $ | 10.30 | $ | 10.22 | $ | 10.04 | $ | 10.01 | ||||||||||
| Activity from investment operations: | ||||||||||||||||||||
| Net investment income (1) | 0.16 | 0.19 | 0.18 | 0.10 | 0.24 | |||||||||||||||
| Net realized and unrealized gain (loss) on investments (2) | (0.28 | ) | (0.43 | ) | 0.08 | 0.18 | 0.01 | |||||||||||||
| Total from investment operations | (0.12 | ) | (0.24 | ) | 0.26 | 0.28 | 0.25 | |||||||||||||
| Less distributions from: | ||||||||||||||||||||
| Net investment income | (0.19 | ) | (0.20 | ) | (0.18 | ) | (0.10 | ) | (0.22 | ) | ||||||||||
| Net realized gains | — | (0.04 | ) | — | — | — | ||||||||||||||
| Total distributions | (0.19 | ) | (0.24 | ) | (0.18 | ) | (0.10 | ) | (0.22 | ) | ||||||||||
| Net asset value, end of year | $ | 9.51 | $ | 9.82 | $ | 10.30 | $ | 10.22 | $ | 10.04 | ||||||||||
| Total return (3) | (1.23 | )% | (2.34 | )% | 2.59 | % | 2.80 | % | 2.52 | % | ||||||||||
| Net assets, at end of year (000)s | $ | 1,203 | $ | 1,490 | $ | 799 | $ | 77 | $ | 105 | ||||||||||
| Ratio of gross expenses to average net assets (4)(5)(6) | 2.22 | % | 2.15 | % | 2.21 | % | 2.27 | % | 2.34 | % | ||||||||||
| Ratio of net expenses to average net assets (5)(6) | 2.22 | % | 2.15 | % | 2.13 | % | 1.95 | % | 1.95 | % | ||||||||||
| Ratio of net investment income to average net assets (5)(6) | 1.59 | % | 1.88 | % | 1.72 | % | 0.98 | % | 2.45 | % | ||||||||||
| Portfolio Turnover Rate | 33 | % | 37 | % | 50 | % | 43 | % | 45 | % | ||||||||||
| (1) | Per share amounts calculated using the average shares method, which more appropriately represents the per share data for the period. |
| (2) | Net realized and unrealized gain (loss) on investments per share are balancing amounts necessary to reconcile the change in net asset value per share for the period, and may not reconcile with aggregate gains (losses) in the statement of operations due to the share transactions for the period. |
| (3) | Total returns are historical in nature and assume changes in sale price, reinvestment of dividends and capital gain distributions. Had the advisor not waived a portion of the Fund’s expenses, total returns would have been lower. |
| (4) | Represents the ratio of expenses to average net assets absent fee waivers and/or expense reimbursements by the advisor. |
| (5) | The ratios of expenses to average net assets and net investment income (loss) to average net assets do not reflect the expenses of the underlying investment companies in which the Fund invests. |
| (6) | Ratio calculated for each share class as a whole, therefore an individual investor’s ratio may vary. |
See accompanying notes to financial statements.
17
| Anfield Universal Fixed Income Fund |
| FINANCIAL HIGHLIGHTS |
| Per Share Data and Ratios for a Share of Beneficial Interest Outstanding Throughout each Year |
| Class I | ||||||||||||||||||||
| Year Ended | Year Ended | Year Ended | Year Ended | Year Ended | ||||||||||||||||
| October 31, | October 31, | October 31, | October 31, | October 31, | ||||||||||||||||
| 2020 | 2019 | 2018 | 2017 | 2016 | ||||||||||||||||
| Net asset value, beginning of year | $ | 9.83 | $ | 10.30 | $ | 10.21 | $ | 10.04 | $ | 10.01 | ||||||||||
| Activity from investment operations: | ||||||||||||||||||||
| Net investment income (1) | 0.25 | 0.29 | 0.26 | 0.19 | 0.32 | |||||||||||||||
| Net realized and unrealized gain (loss) on investments (2) | (0.28 | ) | (0.44 | ) | 0.10 | 0.18 | 0.03 | |||||||||||||
| Total from investment operations | (0.03 | ) | (0.15 | ) | 0.36 | 0.37 | 0.35 | |||||||||||||
| Less distributions from: | ||||||||||||||||||||
| Net investment income | (0.29 | ) | (0.28 | ) | (0.27 | ) | (0.20 | ) | (0.32 | ) | ||||||||||
| Net realized gains | — | (0.04 | ) | — | — | — | ||||||||||||||
| Total distributions | (0.29 | ) | (0.32 | ) | (0.27 | ) | (0.20 | ) | (0.32 | ) | ||||||||||
| Net asset value, end of year | $ | 9.51 | $ | 9.83 | $ | 10.30 | $ | 10.21 | $ | 10.04 | ||||||||||
| Total return (3) | (0.34 | )% | (1.29 | )% | 3.61 | % | 3.70 | % | 3.56 | % | ||||||||||
| Net assets, at end of year (000)s | $ | 156,042 | $ | 291,140 | $ | 208,180 | $ | 110,254 | $ | 77,921 | ||||||||||
| Ratio of gross expenses to average net assets (4)(5)(6) | 1.22 | % | 1.15 | % | 1.21 | % | 1.27 | % | 1.34 | % | ||||||||||
| Ratio of net expenses to average net assets (5)(6) | 1.22 | % | 1.15 | % | 1.13 | % | 0.95 | % | 0.95 | % | ||||||||||
| Ratio of net investment income to average net assets (5)(6) | 2.59 | % | 2.86 | % | 2.54 | % | 1.93 | % | 3.19 | % | ||||||||||
| Portfolio Turnover Rate | 33 | % | 37 | % | 50 | % | 43 | % | 45 | % | ||||||||||
| (1) | Per share amounts calculated using the average shares method, which more appropriately represents the per share data for the period. |
| (2) | Net realized and unrealized gain (loss) on investments per share are balancing amounts necessary to reconcile the change in net asset value per share for the period, and may not reconcile with aggregate gains (losses) in the statement of operations due to the share transactions for the period. |
| (3) | Total returns are historical in nature and assume changes in sale price, reinvestment of dividends and capital gain distributions. Had the advisor not waived a portion of the Fund’s expenses, total returns would have been lower. |
| (4) | Represents the ratio of expenses to average net assets absent fee waivers and/or expense reimbursements by the advisor. |
| (5) | The ratios of expenses to average net assets and net investment income (loss) to average net assets do not reflect the expenses of the underlying investment companies in which the Fund invests. |
| (6) | Ratio calculated for each share class as a whole, therefore an individual investor’s ratio may vary. |
See accompanying notes to financial statements.
18
| Anfield Universal Fixed Income Fund |
| NOTES TO FINANCIAL STATEMENTS |
| October 31, 2020 |
| 1. | ORGANIZATION |
The Anfield Universal Fixed Income Fund (the “Fund”), is a series of shares of beneficial interest of the Two Roads Shared Trust (the “Trust”), a statutory trust organized under the laws of the State of Delaware on June 8, 2012, and is registered under the Investment Company Act of 1940, as amended (the “1940 Act”), as a diversified, open-end management investment company. The Fund commenced operations on June 28, 2013. The investment objective is to seek current income.
The Fund offers Class A, Class C, and Class I shares. Class A shares are offered at net asset value (“NAV”) plus a maximum sales charge of 5.75%. Investors that purchase $1,000,000 or more of the Fund’s Class A shares will pay a 1.00% sales charge on the purchase. Class C shares of the Fund are sold at NAV without an initial sales charge. Class I shares of the Fund are sold at NAV without an initial sales charge and are not subject to 12b-1 distribution fees, but have a higher minimum initial investment than Class A and Class C shares. Each share class represents an interest in the same assets of the Fund and classes are identical except for differences in their sales charge structures and ongoing service and distribution charges. All classes of shares have equal voting privileges except that each class has exclusive voting rights with respect to its service and/or distribution plans. The Fund’s income, expenses (other than class specific distribution fees) and realized and unrealized gains and losses are allocated proportionately each day based upon the relative net assets of each class.
| 2. | SUMMARY OF SIGNIFICANT ACCOUNTING POLICIES |
The following is a summary of significant accounting policies followed by the Fund in preparation of its financial statements. These policies are in conformity with accounting principles generally accepted in the United States of America (“GAAP”). The preparation of financial statements requires management to make estimates and assumptions that affect the reported amounts of assets and liabilities and disclosure of contingent assets and liabilities at the date of the financial statements and the reported amounts of income and expenses for the period. Actual results could differ from those estimates. The Fund is an investment company and accordingly follows the investment company accounting and reporting guidance of the Financial Accounting Standards Board (“FASB”) Accounting Standard Codification Topic 946 “Financial Services – Investment Companies”.
Security Valuation – Securities listed on an exchange are valued at the last reported sale price at the close of the regular trading session of the exchange on the business day the value is being determined, or in the case of securities listed on NASDAQ at the NASDAQ Official Closing Price. In the absence of a sale such securities shall be valued at the mean between the last bid and ask prices on the day of valuation. Debt securities (other than short-term obligations) are valued each day by an independent pricing service approved by the Board of Trustees (the “Board”) using methods which include current market quotations from a major market maker in the securities and based on methods which include the consideration of yields or prices of securities of comparable quality, coupon, maturity and type. The independent pricing service does not distinguish between smaller-sized bond positions known as “odd lots” and larger institutional-sized bond positions known as “round lots”. The Fund may fair value a particular bond if the adviser does not believe that the round lot value provided by the independent pricing service reflects fair value of the Fund’s holding. Futures and future options are valued at the final settled price or, in the absence of a settled price, at the last sale price on the day of valuation. Short-term debt obligations, excluding U.S. Treasury Bills, having 60 days or less remaining until maturity, at time of purchase, may be valued at amortized cost.
The Fund may hold securities, such as private investments, interests in commodity pools, other non-traded securities or temporarily illiquid securities, for which market quotations are not readily available or are determined to be unreliable. These securities will be valued using the “fair value” procedures approved by the Board. The Board has delegated execution of these procedures to a fair value team composed of one or more representatives from each of the (i) Trust, (ii) administrator, and (iii) Advisor. The team may also enlist third party consultants such as a valuation specialist at a public accounting firm, valuation consultant or financial officer of a security issuer on an as-needed basis to assist in determining a security-specific fair value. The Board has also engaged a third party valuation firm to attend, as needed, valuation meetings held by the Trust, review minutes of such meetings and report to the Board on a quarterly basis. The Board reviews and ratifies the execution of this process and the resultant fair value prices at least quarterly to assure the process produces reliable results.
19
| Anfield Universal Fixed Income Fund |
| NOTES TO FINANCIAL STATEMENTS (Continued) |
| October 31, 2020 |
Exchange Traded Fund – The Fund may invest in exchange traded funds (“ETFs”). ETFs are a type of index fund bought and sold on a securities exchange. An ETF trades like common stock and represents a fixed portfolio of securities designed to track the performance and dividend yield of a particular domestic or foreign market index. The Fund may purchase an ETF to temporarily gain exposure to a portion of the U.S. or a foreign market. The risks of owning an ETF generally reflect the risks of owning the underlying securities they are designed to track, although the lack of liquidity on an ETF could result in it being more volatile. Additionally, ETFs have fees and expenses that reduce their value.
Futures Contracts – The Fund may purchase or sell futures contracts to gain exposure to, or hedge against, changes in the value of equities, interest rates, foreign currencies, or commodities. Initial margin deposits required upon entering into futures contracts are satisfied by the segregation of specific securities or cash as collateral for the account of the broker (the Fund’s agent in acquiring the futures position). During the period the futures contracts are open, changes in the value of the contracts are recognized as unrealized gains or losses by “marking to market” on a daily basis to reflect the market value of the contracts at the end of each day’s trading. Variation margin payments are received or made depending upon whether unrealized gains or losses are incurred. When the contracts are closed, the Fund recognizes a realized gain or loss equal to the difference between the proceeds from, or cost of, the closing transaction and the Fund’s basis in the contract. If the Fund was unable to liquidate a futures contract and/or enter into an offsetting closing transaction, the Fund would continue to be subject to market risk with respect to the value of the contracts and continue to be required to maintain the margin deposits on the futures contracts. The Fund segregates liquid securities having a value at least equal to the amount of the current obligation under any open futures contract. Risks may exceed amounts recognized in the consolidated statement of assets and liabilities. With futures, there is minimal counterparty credit risk to the Fund since futures are exchange traded and the exchange’s clearinghouse, as counterparty to all exchange traded futures, guarantees the futures against default.
Option Transactions – The Fund is subject to equity price risk in the normal course of pursuing its investment objective and may purchase or sell options to help hedge against risk. When the Fund writes a call option, an amount equal to the premium received is included in the statement of assets and liabilities as a liability. The amount of the liability is subsequently marked-to-market to reflect the current market value of the option. If an option expires on its stipulated expiration date or if the Fund enters into a closing purchase transaction, a gain or loss is realized. If a written call option is exercised, a gain or loss is realized for the sale of the underlying security and the proceeds from the sale are increased by the premium originally received. As writer of an option, the Fund has no control over whether the option will be exercised and, as a result, retains the market risk of an unfavorable change in the price of the security underlying the written option.
The Fund may purchase put and call options. Put options are purchased to hedge against a decline in the value of securities held in the Fund’s portfolio. If such a decline occurs, the put options will permit the Fund to sell the securities underlying such options at the exercise price, or to close out the options at a profit. The premium paid for a put or call option plus any transaction costs will reduce the benefit, if any, realized by the Fund upon exercise of the option, and, unless the price of the underlying security rises or declines sufficiently, the option may expire worthless to the Fund. In addition, in the event that the price of the security in connection with which an option was purchased moves in a direction favorable to the Fund, the benefits realized by the Fund as a result of such favorable movement will be reduced by the amount of the premium paid for the option and related transaction costs. Written and purchased options are non-income producing securities. With purchased options, there is minimal counterparty risk to the Fund since these options are exchange traded and the exchange’s clearinghouse, as counterparty to all exchange traded options, guarantees against a possible default.
Valuation of Fund of Fund – The Fund may invest in portfolios of open-end or closed-end investment companies (the “Underlying Funds”). The Underlying Funds value securities in their portfolios for which market quotations are readily available at their market values (generally the last reported sale price) and all other securities and assets at their fair value according to the methods established by the board of directors of the Underlying Funds.
20
| Anfield Universal Fixed Income Fund |
| NOTES TO FINANCIAL STATEMENTS (Continued) |
| October 31, 2020 |
Fair Valuation Process – The applicable investments are valued collectively via inputs from each group within the fair value team. For example, fair value determinations are required for the following securities: (i) securities for which market quotations are insufficient or not readily available on a particular business day (including securities for which there is a short and temporary lapse in the provision of a price by the regular pricing source), (ii) securities for which, in the judgment of the Advisor, the prices or values available do not represent the fair value of the instrument. Factors which may cause the Advisor to make such a judgment include, but are not limited to, the following: only a bid price or an ask price is available; the spread between bid and ask prices is substantial; the frequency of sales; the thinness of the market; the size of reported trades; and actions of the securities markets, such as the suspension or limitation of trading; (iii) securities determined to be illiquid; (iv) securities with respect to which an event that will affect the value thereof has occurred (a “significant event”) since the closing prices were established on the principal exchange on which they are traded, but prior to a Fund’s calculation of its net asset value. Specifically, interests in commodity pools or managed futures pools are valued on a daily basis by reference to the closing market prices of each futures contract or other asset held by a pool, as adjusted for pool expenses. Restricted or illiquid securities, such as private investments or non-traded securities are valued via inputs from the Advisor based upon the current bid for the security from two or more independent dealers or other parties reasonably familiar with the facts and circumstances of the security (who should take into consideration all relevant factors as may be appropriate under the circumstances). If the Advisor is unable to obtain a current bid from such independent dealers or other independent parties, the fair value team shall determine the fair value of such security using the following factors: (i) the type of security; (ii) the cost at date of purchase; (iii) the size and nature of the Fund’s holdings; (iv) the discount from market value of unrestricted securities of the same class at the time of purchase and subsequent thereto; (v) information as to any transactions or offers with respect to the security; (vi) the nature and duration of restrictions on disposition of the security and the existence of any registration rights; (vii) how the yield of the security compares to similar securities of companies of similar or equal creditworthiness; (viii) the level of recent trades of similar or comparable securities; (ix) the liquidity characteristics of the security; (x) current market conditions; and (xi) the market value of any securities into which the security is convertible or exchangeable.
Open-ended funds are valued at their respective net asset values as reported by such investment companies. The shares of many closed-end investment companies, after their initial public offering, frequently trade at a price per share, which is different than the net asset value per share. The difference represents a market premium or market discount of such shares. There can be no assurances that the market discount or market premium on shares of any closed-end investment company purchased by the Fund will not change.
The Fund utilizes various methods to measure the fair value of all of its investments on a recurring basis. GAAP establishes a hierarchy that prioritizes inputs to valuation methods. The three levels of input are:
Level 1 – Unadjusted quoted prices in active markets for identical assets and liabilities that the Fund has the ability to access.
Level 2 – Observable inputs other than quoted prices included in Level 1 that are observable for the asset or liability, either directly or indirectly. These inputs may include quoted prices for the identical instrument on an inactive market, prices for similar instruments, interest rates, prepayment speeds, credit risk, yield curves, default rates and similar data.
Level 3 – Unobservable inputs for the asset or liability, to the extent relevant observable inputs are not available, representing the Fund’s own assumptions about the assumptions a market participant would use in valuing the asset or liability, and would be based on the best information available.
The availability of observable inputs can vary from security to security and is affected by a wide variety of factors, including, for example, the type of security, whether the security is new and not yet established in the marketplace, the liquidity of markets, and other characteristics particular to the security. To the extent that valuation is based on models or inputs that are less observable or unobservable in the market, the determination of fair value requires more judgment. Accordingly, the degree of judgment exercised in determining fair value is greatest for instruments categorized in Level 3.
The inputs used to measure fair value may fall into different levels of the fair value hierarchy. In such cases, for disclosure purposes, the level in the fair value hierarchy within which the fair value measurement falls in its entirety, is determined based on the lowest level input that is significant to the fair value measurement in its entirety.
21
| Anfield Universal Fixed Income Fund |
| NOTES TO FINANCIAL STATEMENTS (Continued) |
| October 31, 2020 |
The inputs or methodology used for valuing securities are not necessarily an indication of the risk associated with investing in those securities. The following tables summarize the inputs used as of October 31, 2020, for the Fund’s assets and liabilities measured at fair value:
| Assets* | Level 1 | Level 2 | Level 3 | Total | ||||||||||||
| Closed End Fund | $ | 182,563 | $ | — | $ | — | $ | 182,563 | ||||||||
| Exchange Traded Fund | 363,350 | — | — | 363,350 | ||||||||||||
| Mutual Funds | 9,887,656 | — | — | 9,887,656 | ||||||||||||
| Asset Backed Securities | — | 35,097,188 | — | 35,097,188 | ||||||||||||
| Agency Collateralized Mortgage Obligations | — | 25,247,109 | — | 25,247,109 | ||||||||||||
| Corporate Bonds | — | 70,533,854 | 839,635 | 71,373,489 | ||||||||||||
| Preferred Stocks | 1,336,476 | — | — | 1,336,476 | ||||||||||||
| Term Loans | — | 12,243,512 | — | 12,243,512 | ||||||||||||
| Total | $ | 11,770,045 | $ | 143,121,663 | $ | 839,635 | $ | 155,731,343 | ||||||||
| Liabilities | Level 1 | Level 2 | Level 3 | Total | ||||||||||||
| Futures Contracts ** | $ | 356,194 | $ | — | $ | — | $ | 356,194 | ||||||||
| * | Refer to the Schedule of Investments for classifications. |
| ** | Represents the net unrealized appreciation (depreciation) of future contracts. |
The following table presents changes in assets classified in Level 3 of the fair value hierarchy during the year ended October 31, 2020 attributable to the following:
| Bonds & Notes | ||||
| Beginning Balance November 1, 2019 | $ | 801,660 | ||
| Total realized gain (loss) | — | |||
| Unrealized Appreciation | 21,567 | |||
| Cost of Purchases | — | |||
| Proceeds from Sales | — | |||
| Amortization | 16,408 | |||
| Net transfers in/out of level 3 | — | |||
| Ending Balance October 31, 2020 | $ | 839,635 | ||
The following table summarizes the valuation techniques and significant unobservable inputs used for the Fund’s investments that are categorized in Level 3 of the fair value hierarchy as of October 31, 2020:
| Fair Value at October 31, 2020 | Valuation Techniques | Unobservable Input | Impact to Valuation |
| $ 108.34 | Spread to comparable security adjusted for a fixed spread as of the last trade date. | 720 basis point spread to comparable security with a rate of 4.625%. | These inputs included the discount rate or yield and the term to maturity used. Significant increases (decreases) in the discount rate or yield and expected term to redemption would have a direct and proportional impact to fair value. |
22
| Anfield Universal Fixed Income Fund |
| NOTES TO FINANCIAL STATEMENTS (Continued) |
| October 31, 2020 |
Offsetting of Financial Assets and Derivative Assets
The Fund’s policy is to recognize a net asset or liability equal to the net variation margin for futures contracts. During the year ended October 31, 2020, the Fund was not subject to any master netting arrangements. The following table shows additional information regarding the offsetting of assets and liabilities at October 31, 2020 for the Fund.
| Gross Amounts Not Offset in the | ||||||||||||||||||||||||
| Liabilities: | Statement of Assets & Liabilities | |||||||||||||||||||||||
| Gross Amounts | Net Amounts of | |||||||||||||||||||||||
| Gross Amounts of | Offset in the | Liabilities Presented | ||||||||||||||||||||||
| Recognized | Statement of Assets | in the Statement of | Financial | Cash Collateral | ||||||||||||||||||||
| Description | Liabilities | & Liabilities | Assets & Liabilities | Instruments | Pledged * | Net Amount | ||||||||||||||||||
| Futures Contracts | $ | (356,194 | ) | $ | — | $ | (356,194 | ) | $ | — | $ | 356,194 | $ | — | ||||||||||
| Total | $ | (356,194 | ) | $ | — | $ | (356,194 | ) | $ | — | $ | 356,194 | $ | — | ||||||||||
| * | Collateral pledged is limited to the net outstanding amount due to/from one individual counterparty. The actual collateral amounts pledged may exceed these amounts and fluctuate in value. Total cash collateral pledged for futures contracts is $4,131,694. |
Impact of Derivatives on the Statement of Assets and Liabilities and Statements of Operations
The derivative instruments outstanding as of October 31, 2020 as disclosed in the Schedule of Investments and the amounts of realized and changes in unrealized gains and losses on derivative instruments during the period as disclosed in the Statements of Operations serve as indicators of the volume of derivative activity for the Fund.
The following is a summary of the location of derivative investments on the Fund’s Statements of Assets and Liabilities as of October 31, 2020:
| Asset Derivatives | ||||||
| Contract Type/Primary Risk Exposure | Balance Sheet Location | Fair Value | ||||
| Futures Contracts – Interest Rate Risk | Net unrealized depreciation on futures contracts | $ | (356,194 | ) | ||
The following is a summary of the location of derivative investments on the Fund’s Statements of Operations as of October 31, 2020:
| Derivative Investment Type | Location of Gain (Loss) on Derivatives | |
| Futures Contracts | Net realized gain from futures contracts; | |
| Net change in unrealized depreciation on futures contracts | ||
| Options Purchased | Net realized loss from investment and options purchased |
The following is a summary of the Fund’s realized gain (loss) and unrealized appreciation (depreciation) on derivative investments recognized in the Statements of Operations categorized by primary risk exposure for the year ended October 31, 2020:
| Realized gain/(loss) on derivatives recognized in the Statements of Operations | ||||||||||||
| Total for the Year Ended | ||||||||||||
| Derivative Investment Type | Equity Risk | Interest Rate Risk | October 31, 2020 | |||||||||
| Futures contracts | $ | 21,113 | $ | 7,029,089 | $ | 7,050,202 | ||||||
| Options Purchased | (2,660 | ) | (9,172 | ) | (11,832 | ) | ||||||
23
| Anfield Universal Fixed Income Fund |
| NOTES TO FINANCIAL STATEMENTS (Continued) |
| October 31, 2020 |
| Net change in unrealized appreciation/(depreciation) on derivatives recognized in the Statements of Operations | ||||||||
| Total for the | ||||||||
| Derivative Investment Type | Interest Rate Risk | Year Ended October 31, 2020 | ||||||
| Futures contracts | $ | (615,567 | ) | $ | (615,567 | ) | ||
Security Transactions and Related Income – Security transactions are accounted for on trade date basis. Interest income is recognized on an accrual basis. Discounts are accreted and premiums are amortized on securities purchased over the lives of the respective securities. Dividend income is recorded on the ex-dividend date. Realized gains or losses from sales of securities are determined by comparing the identified cost of the security lot sold with the net sales proceeds. Due from broker balance is comprised of margin balance held at the broker.
Dividends and Distributions to Shareholders – Dividends from net investment income are declared and distributed monthly. Distributable net realized capital gains are declared and distributed annually. Dividends from net investment income and distributions from net realized gains are recorded on ex dividend date and determined in accordance with federal income tax regulations, which may differ from GAAP. These “book/tax” differences are considered either temporary (i.e., deferred losses, capital loss carry forwards) or permanent in nature. To the extent these differences are permanent in nature, such amounts are reclassified within the composition of net assets based on their federal tax-basis treatment; temporary differences do not require reclassification.
Federal Income Taxes – It is the Fund’s policy to qualify as a regulated investment company by complying with the provisions of the Internal Revenue Code that are applicable to regulated investment companies and to distribute substantially all of its taxable income and net realized gains to shareholders. Therefore, no federal income tax provision has been recorded.
The Fund recognizes the tax benefits of uncertain tax positions only where the position is “more likely than not” to be sustained assuming examination by tax authorities. Management has analyzed the Fund’s tax positions and has concluded that no liability for unrecognized tax benefits should be recorded related to uncertain tax positions taken on returns filed for open tax years ended October 31, 2017 to October 31, 2019, or expected to be taken in the Fund’s October 31, 2020 year-end tax returns. The Fund identifies its major tax jurisdictions as U.S. Federal, Ohio and foreign jurisdictions where the Fund makes significant investments; however the Fund is not aware of any tax positions for which it is reasonably possible that the total amounts of unrecognized tax benefits will change materially in the next twelve months.
Expenses – Expenses of the Trust that are directly identifiable to a specific fund are charged to that fund. Expenses, which are not readily identifiable to a specific fund, are allocated in such a manner as deemed equitable, taking into consideration the nature and type of expense and the relative sizes of the funds in the Trust.
Indemnification – The Trust indemnifies its officers and trustees for certain liabilities that may arise from the performance of their duties to the Trust. Additionally, in the normal course of business, the Fund enters into contracts that contain a variety of representations and warranties and which provide general indemnities. The Fund’s maximum exposure under these arrangements is unknown, as this would involve future claims that may be made against the Fund that have not yet occurred. However, the Fund expects the risk of loss due to these warranties and indemnities to be remote.
24
| Anfield Universal Fixed Income Fund |
| NOTES TO FINANCIAL STATEMENTS (Continued) |
| October 31, 2020 |
| 3. | PRINCIPAL INVESTMENT RISKS |
The Fund’s investments in securities, financial instruments and derivatives expose it to various risks, certain of which are discussed in these Notes to Financial Statements. Please refer to the Fund’s prospectus and statement of additional information for a more full listing of risks associated with the Fund’s investments which include, but are not limited to: active trading risk, bank loan risk, collateralized loan obligations risk, common stock risk, convertible securities risk, counterparty credit risk, credit risk, credit spread risk, currency risk, cybersecurity risk, derivatives risk, emerging markets risks, financial sector risk, fixed income securities risk, foreign (non-U.S.) investment risk, futures contract risk, gap risk, hedging transactions risk, high yield risk, index risk, interest rate risk, issuer-specific risk, investment companies and exchange-traded funds risks, leverage risk, LIBOR risk, liquidity risk, management risk, market risk, market events risk, MLP risk, mortgage-backed and asset-backed securities risk, odd lot pricing risk, preferred securities risk, prepayment and extension risk, regulatory risk, sector risk, securities lending risk, short sales risk, swap risk, U.S. government securities risk, valuation risk, variable or floating rate securities and volatility risk.
Bank Loan Risk – The Fund’s investments in secured and unsecured participations in bank loans and assignments of such loans may create substantial risk. In making investments in such loans, which are made by banks or other financial intermediaries to borrowers, the Fund will depend primarily upon the creditworthiness of the borrower for payment of principal and interest.
Currency Risk – The risk that foreign (non-U.S.) currencies will decline in value relative to the U.S. dollar and adversely affect the value of the Fund’s investments in foreign (non-U.S.) currencies or in securities that trade in, and receive revenues in, or in derivatives that provide exposure to, foreign (non-U.S.) currencies.
Convertible Securities Risk – The market value of a convertible security performs like that of a regular debt security; that is, if market interest rates rise, the value of a convertible security usually falls. In addition, convertible securities are subject to the risk that the issuer will not be able to pay interest or dividends when due, and their market value may change based on changes in the issuer’s credit rating or the market’s perception of the issuer’s creditworthiness. Since it derives a portion of its value from the common stock into which it may be converted, a convertible security is also subject to the same types of market and issuer risks that apply to the underlying common stock.
Counterparty Credit Risk – The Fund may enter into various types of derivative contracts. Many of these derivative contracts will be privately negotiated in the over-the-counter market. These contracts also involve exposure to credit risk, since contract performance depends in part on the financial condition of the counterparty. If a privately negotiated over-the-counter contract calls for payments by the Fund, the Fund must be prepared to make such payments when due. In addition, if a counterparty’s creditworthiness declines, the Fund may not receive payments owed under the contract, or such payments may be delayed under such circumstances and the value of agreements with such counterparty can be expected to decline, potentially resulting in losses to the Fund. The Adviser considers factors such as counterparty credit ratings and financial statements among others when determining whether a counterparty is creditworthy. The Adviser regularly monitors the creditworthiness of each counterparty with which the Fund enters into a transaction. In addition, the Fund may enter into swap agreements that involve a limited number of counterparties, which may increase the Fund’s exposure to counterparty risk.
Derivatives Risk – The derivative instruments in which the Fund may invest, including futures, options, credit default swaps, total return swaps, repurchase agreements and other similar instruments, may be more volatile than other instruments. The risks associated with investments in derivatives also include leverage, liquidity, interest rate, market, credit and management risks, mispricing or improper valuation. Changes in the market value of the derivative may not correlate perfectly with the underlying asset, rate or index, and the Fund could lose more than the principal amount invested. In addition, if a derivative is being used for hedging purposes there can be no assurance given that each derivative position will achieve a perfect correlation with the security or currency against which it is being hedged, or that a particular derivative position will be available when sought by the portfolio manager.
25
| Anfield Universal Fixed Income Fund |
| NOTES TO FINANCIAL STATEMENTS (Continued) |
| October 31, 2020 |
Fixed Income Risk – Fixed income securities are subject to interest rate risk, call risk, prepayment and extension risk, credit risk, duration, and liquidity risk. In addition, current market conditions may pose heightened risks for fixed income securities. When the Fund invests in fixed income securities or derivatives, the value of your investment in the Fund will fluctuate with changes in interest rates. Typically, a rise in interest rates causes a decline in the value of fixed income securities or derivatives owned by the Fund. In general, the market price of fixed income securities with longer maturities or durations will increase or decrease more in response to changes in interest rates than shorter-term securities. Other risk factors include credit risk (the debtor may default) and prepayment risk (the debtor may pay its obligation early, reducing the amount of interest payments). These risks could affect the value of a particular investment by the Fund, possibly causing the Fund’s share price and total return to be reduced and fluctuate more than other types of investments. Moreover, new regulations applicable to and changing business practices of financial intermediaries that make markets in fixed income securities have resulted in less market making activity for certain fixed income securities, which has reduced the liquidity and may increase the volatility for such fixed income securities. The fixed-income securities market can be susceptible to increases in volatility and decreases in liquidity. Liquidity may decline unpredictably in response to overall economic conditions or credit tightening. For example, a general rise in interest rates may cause investors to move out of fixed income securities on a large scale, which could adversely affect the price and liquidity of fixed income securities and could also result in increased redemptions for the Fund. Duration risk arises when holding long duration and long maturity investments, which will magnify certain risks, including interest rate risk and credit risk. Longer-term securities may be more sensitive to interest rate changes. Given the recent, historically low interest rates and the potential for increases in those rates, a heightened risk is posed by rising interest rates to longer-term fixed income securities. Effective duration estimates price changes for relatively small changes in rates. If rates rise significantly, effective duration may tend to understate the drop in a security’s price. If rates drop significantly, effective duration may tend to overstate the rise in a security’s price.
Foreign (non-U.S.) Investment Risk – Foreign (non-U.S.) securities present greater investment risks than investing in the securities of U.S. issuers and may experience more rapid and extreme changes in value than the securities of U.S. companies, due to less information about foreign (non-U.S.) companies in the form of reports and ratings than about U.S. issuers; different accounting, auditing and financial reporting requirements; smaller markets; nationalization; expropriation or confiscatory taxation; currency blockage; or political changes or diplomatic developments. Foreign (non-U.S.) securities may also be less liquid and more difficult to value than securities of U.S. issuers.
Foreign securities include direct investments in non-U.S. dollar-denominated securities traded primarily outside of the United States and dollar-denominated securities of foreign issuers. Foreign securities also include indirect investments such as American Depositary Receipts (“ADRs”), European Depositary Receipts (“EDRs”) and Global Depositary Receipts (“GDRs”). ADRs are U.S. dollar-denominated receipts representing shares of foreign-based corporations. ADRs are receipts that are traded in the United States and entitle the holder to all dividend and capital gain distributions that are paid out on the underlying foreign shares. EDRs and GDRs are receipts that often trade on foreign exchanges. They represent ownership in an underlying foreign or U.S. security and generally are denominated in a foreign currency. Foreign government obligations may include debt obligations of supranational entities, including international organizations (such as The International Bank for Reconstruction and Development, also known as the World Bank) and international banking institutions and related government agencies.
26
| Anfield Universal Fixed Income Fund |
| NOTES TO FINANCIAL STATEMENTS (Continued) |
| October 31, 2020 |
LIBOR Risk – The Fund may invest in securities and other instruments whose interest payments are determined by references to the London Interbank Offered Rate (“LIBOR”). According to various reports, certain financial institutions, commencing as early as 2005 and throughout the global financial crisis, routinely made artificially low submissions in the LIBOR setting process, which have subsequently resulted in investigations and fines. These developments may have adversely affected the interest rates on securities whose interest payments were determined by reference to LIBOR. Any future similar developments could, in turn, reduce the value of such securities owned by the Fund. The United Kingdom Financial Conduct Authority, which regulates LIBOR, announced that after 2021 it will cease its active encouragement of banks to provide the quotations needed to sustain LIBOR. As a result, plans are underway to phase out the use of LIBOR by the end of 2021. Alternatives to LIBOR are in development in many major financial markets. For example, the U.S. Federal Reserve has begun publishing a Secured Overnight Financing Rate (SOFR), a broad measure of secured overnight U.S. Treasury repo rates, as a possible replacement for U.S. dollar LIBOR. The unavailability of LIBOR presents risks to the Fund, including the risk that any pricing or adjustments to the Fund’s investments resulting from a substitute or alternate reference rate may adversely affect the Fund’s performance and/or NAV. It remains uncertain how such changes would be implemented and the effects such changes would have on the Fund, including any negative effects on the Fund’s liquidity and valuation of the Fund’s investments, issuers of instruments in which the Fund invests and financial markets generally.
Market Risk – Overall market risk may affect the value of individual instruments in which the Fund invests. The Fund is subject to the risk that the securities markets will move down, sometimes rapidly and unpredictably, based on overall economic conditions and other factors, which may negatively affect the Fund’s performance. Factors such as domestic and foreign (non-U.S.) economic growth and market conditions, real or perceived adverse economic or political conditions, inflation, changes in interest rate levels, lack of liquidity in the markets, volatility in the securities markets, adverse investor sentiment affect the securities markets and political vents affect the securities markets. Securities markets also may experience long periods of decline in value. When the value of the Fund’s investments goes down, your investment in the Fund decreases in value and you could lose money.
Local, state, regional, national or global events such as war, acts of terrorism, the spread of infectious illness or other public health issues, recessions, or other events could have a significant impact on the Fund and its investments and could result in decreases to the Fund’s net asset value. Political, geopolitical, natural and other events, including war, terrorism, trade disputes, government shutdowns, market closures, natural and environmental disasters, epidemics, pandemics and other public health crises and related events and governments’ reactions to such events have led, and in the future may lead, to economic uncertainty, decreased economic activity, increased market volatility and other disruptive effects on U.S. and global economies and markets. Such events may have significant adverse direct or indirect effects on the Fund and its investments. For example, a widespread health crisis such as a global pandemic could cause substantial market volatility, exchange trading suspensions and closures, impact the ability to complete redemptions, and affect Fund performance. A health crisis may exacerbate other pre-existing political, social and economic risks. In addition, the increasing interconnectedness of markets around the world may result in many markets being affected by events or conditions in a single country or region or events affecting a single or small number of issuers.
An outbreak of infectious respiratory illness caused by a novel coronavirus known as COVID-19 was first detected in China in December 2019 and has now been detected globally. On March 11, 2020, the World Health Organization announced that it had made the assessment that COVID-19 can be characterized as a pandemic. COVID-19 has resulted in travel restrictions, closed international borders, enhanced health screenings at ports of entry and elsewhere, disruption of and delays in healthcare service preparation and delivery, prolonged quarantines, cancellations, business and school closings, supply chain disruptions, and lower consumer demand, as well as general concern and uncertainty. The impact of COVID-19, and other infectious illness outbreaks that may arise in the future, could adversely affect the economies of many nations or the entire global economy, individual issuers and capital markets in ways that cannot necessarily be foreseen. In addition, the impact of infectious illnesses in emerging market countries may be greater due to generally less established healthcare systems. Public health crises caused by the COVID-19 outbreak may exacerbate other pre-existing political, social and economic risks in certain countries or globally. The duration of the COVID-19 outbreak and its effects cannot be determined with certainty. The value of the Fund and the securities in which the Fund invests may be adversely affected by impacts caused by COVID-19 and other epidemics and pandemics that may arise in the future.
27
| Anfield Universal Fixed Income Fund |
| NOTES TO FINANCIAL STATEMENTS (Continued) |
| October 31, 2020 |
Mortgage-Backed and Asset-Backed Securities Risk – The risk of investing in mortgage-backed and other asset-backed securities, including prepayment risk, extension risk, interest rate risk, market risk and management risk. Mortgage-backed securities include caps and floors, inverse floaters, mortgage dollar rolls, private mortgage pass-through securities, resets and stripped mortgage securities. A systemic and persistent increase in interest rate volatility may also negatively impact a number of the Fund’s mortgage-backed and asset-backed securities holdings.
Odd Lot Pricing Risk – Bonds may be purchased and held as smaller sized bond positions known as “odd lots”. Pricing services generally value such securities based on bid prices for larger institutional sized bond positions known as “round lots”; and such round lot prices may reflect more favorable pricing than odd lot holdings. The Fund may purchase securities suitable for its investment strategies in odd lots. Special valuation considerations may apply with respect to the Fund’s odd-lot positions, as the Fund may receive different prices when it sells such positions than it would receive for sales of institutional round lot positions. The Fund may fair value a particular bond if the Adviser does not believe that the round lot value provided by the independent pricing service reflects fair value of the Fund’s holding. There can be no assurance that the Fund’s valuation procedures will result in pricing data that is completely congruent with prices that the Fund might obtain on the open market.
U.S. Government Securities Risk – Treasury obligations may differ in their interest rates, maturities, times of issuance and other characteristics. Obligations of U.S. Government agencies and authorities are supported by varying degrees of credit but generally are not backed by the full faith and credit of the U.S. Government. No assurance can be given that the U.S. Government will provide financial support to its agencies and authorities if it is not obligated by law to do so. In addition, the value of U.S. Government securities may be affected by changes in the credit rating of the U.S. Government.
Volatility Risk – The Fund may have investments that appreciate or decrease significantly in value over short periods of time. This may cause the Fund’s net asset value per share to experience significant increases or declines in value over short periods of time.
| 4. | INVESTMENT TRANSACTIONS |
The cost of purchases and proceeds from the sale of securities, other than short-term securities, for the year ended October 31, 2020, amounted to $75,847,024 and $203,687,932, respectively.
| 5. | INVESTMENT ADVISORY AGREEMENT AND TRANSACTIONS WITH RELATED PARTIES |
Advisory Fees – Anfield Capital Management, LLC serves as the Fund’s investment advisor (the “Advisor”). Pursuant to an Investment Advisory Agreement with the Fund, the Advisor, under the oversight of the Board, directs the daily operations of the Fund and supervises the performance of administrative and professional services provided by others. As compensation for its services and the related expenses borne by the Advisor, the Fund pays the Advisor an investment advisory fee, computed and accrued daily and paid monthly, at an annual rate of 0.80% of the Fund’s average daily net assets totaling $1,930,483 for the year ended October 31, 2020.
The Advisor has contractually agreed to reduce its fees and/or reimburse expenses of the Fund, until at least March 1, 2021, to ensure that total annual fund operating expenses after fee waiver and/or reimbursement (excluding any front-end or contingent deferred loads; brokerage fees and commissions, acquired fund fees and expenses; borrowing costs (such as interest and dividend expense on securities sold short); taxes; and extraordinary expenses, such as litigation expenses) do not exceed 1.50%, 2.25%, and 1.25% of the Fund’s average daily net assets for Class A, Class C, and Class I shares, respectively. This agreement may be terminated by the Fund’s Board of Trustees on 60 days’ written notice to the adviser. These fee waivers and expense reimbursements are subject to possible recoupment from the Fund in future years on a rolling three year basis (within the three years after the date such fees have been waived or reimbursed) if such recoupment can be achieved within the foregoing expense limits as well as any expense limitation that was in effect at the time the waiver or reimbursement was made. Prior to March 1, 2018, the expense limitations in effect for the Fund were 1.20%, 1.95% and 0.95% for Class A, Class C and Class I shares, respectively.
28
| Anfield Universal Fixed Income Fund |
| NOTES TO FINANCIAL STATEMENTS (Continued) |
| October 31, 2020 |
During the year period ended October 31, 2020, the Advisor did not waive any fees or expenses. The Advisor can recoup waived and reimbursed expenses of $128,740 until October 31, 2021.
The Board has adopted a Distribution Plan (the “Plan”) pursuant to Rule 12b-1 under the 1940 Act. The Plan provides that a monthly service and/or distribution fee is calculated by the Fund at an annual rate of 0.25% and 1.00% of its average daily net assets for Class A and Class C, respectively, and is paid to Northern Lights Distributors, LLC (the “Distributor” and “NLD”), an affiliate of GFS, to provide compensation for ongoing shareholder servicing and distribution-related activities or services and/or maintenance of the Fund’s shareholder accounts not otherwise required to be provided by the Advisor.
The Distributor acts as the Fund’s principal underwriter in a continuous public offering of the Fund’s shares. During the year ended October 31, 2020, the Distributor received $7,649 and $0 in underwriting commissions for sales of Class A and Class C shares, respectively, of which $1,126 and $0 was retained by the principal underwriter for Class A and Class C shares, respectively.
Class C shares and Class I shares of the Fund are not subject to an initial sales charge.
In addition, certain affiliates of the Distributor provide services to the Fund as follows:
Gemini Fund Services, LLC (“GFS”) – an affiliate of the Distributor, provides administration, fund accounting, and transfer agent services to the Trust. Pursuant to separate servicing agreements with GFS, the Fund pays GFS customary fees for providing administration, fund accounting and transfer agency services to the Fund. Certain officers of the Trust are also officers of GFS, and are not paid any fees directly by the Fund for serving in such capacities.
Northern Lights Compliance Services, LLC (“NLCS”) – an affiliate of GFS and the Distributor, provides a Chief Compliance Officer to the Trust, as well as related compliance services, pursuant to a consulting agreement between NLCS and the Trust. Under the terms of such agreement, NLCS receives customary fees from the Fund.
BluGiant, LLC (“BluGiant”) – BluGiant, an affiliate of GFS and the Distributor, provides EDGAR conversion and filing services as well as print management services for the Fund on an ad-hoc basis. For the provision of these services, BluGiant receives customary fees from GFS under the administrative servicing agreement.
| 6. | DISTRIBUTIONS TO SHAREHOLDERS AND TAX COMPONENTS OF CAPITAL |
The Statement of Assets and Liabilities represents cost for financial reporting purposes. As of October 31, 2020, aggregate cost for federal tax purposes is $174,252,748 and differs from market value by net unrealized appreciation (depreciation) consisted of:
| Gross unrealized appreciation: | $ | 4,326,535 | ||
| Gross unrealized depreciation: | (22,847,940 | ) | ||
| Net unrealized depreciation: | $ | (18,521,405 | ) |
The tax character of distributions paid during the fiscal years ended October 31, 2020 and October 31, 2019 was as follows:
| Fiscal Year Ended | Fiscal Year Ended | |||||||
| October 31, 2020 | October 31, 2019 | |||||||
| Ordinary Income | $ | 6,709,017 | $ | 9,418,535 | ||||
| Long-Term Capital Gain | — | — | ||||||
| Return of Capital | — | 98,706 | ||||||
| $ | 6,709,017 | $ | 9,517,241 | |||||
29
| Anfield Universal Fixed Income Fund |
| NOTES TO FINANCIAL STATEMENTS (Continued) |
| October 31, 2020 |
As of October 31, 2020, the components of accumulated earnings/ (deficit) on a tax basis were as follows:
| Undistributed | Undistributed | Post October Loss | Capital Loss | Other | Unrealized | Total | ||||||||||||||||||||
| Ordinary | Long-Term | and | Carry | Book/Tax | Appreciation/ | Accumulated | ||||||||||||||||||||
| Income | Gains | Late Year Loss | Forwards | Differences | (Depreciation) | Earnings/(Deficits) | ||||||||||||||||||||
| $ | 1,940,011 | $ | — | $ | — | $ | (1,102,504 | ) | $ | — | $ | (18,521,405 | ) | $ | (17,683,898 | ) | ||||||||||
The difference between book basis and tax basis undistributed net investment income, accumulated net realized loss, and unrealized depreciation from investments is primarily attributable to the tax deferral of losses on wash sales, mark-to-market on open futures and adjustments to perpetual bonds.
At October 31, 2020, the Fund had capital loss carry forwards (“CLCF”) for federal income tax purposes available to offset future capital gains as follows:
| Non-Expiring | Non-Expiring | CLCF | ||||||||||||
| Short-Term | Long-Term | Total | Utilized | |||||||||||
| $ | — | $ | 1,102,504 | $ | 1,102,504 | $ | — | |||||||
Permanent book and tax differences, primarily attributable to the book/tax basis treatment of non-deductible expenses and adjustments for prior year tax returns resulted in reclassifications for the Fund for the year ended October 31, 2020 as follows:
| Paid | ||||||
| In | Accumulated | |||||
| Capital | Earnings (Losses) | |||||
| $ | (34,934 | ) | $ | 34,934 | ||
| 7. | BENEFICIAL OWNERSHIP |
The beneficial ownership, either directly or indirectly, of more than 25% of the voting securities of a fund creates a presumption of control of the fund, under Section 2(a)(9) of the 1940 Act. As of October 31, 2020, Charles Schwab & Co., Inc. held 34.14% and may be deemed to control the Fund.
| 8. | SUBSEQUENT EVENTS |
Subsequent events after the date of the Statements of Assets and Liabilities have been evaluated through the date the financial statements were issued. Management has determined that no events or transactions occurred requiring adjustment or disclosure in the financial statements.
30
Report of Independent Registered Public Accounting Firm
To the Board of Trustees of Two Roads Shared Trust
and the Shareholders of Anfield Universal Fixed Income Fund
Opinion on the Financial Statements
We have audited the accompanying statement of assets and liabilities of Anfield Universal Fixed Income Fund (the Fund), a series of Two Roads Shared Trust, including the schedule of investments, as of October 31, 2020, the related statements of operations for the year then ended, the statements of changes in net assets for each of the two years in the period then ended, and the related notes to the financial statements (collectively, the financial statements), and the financial highlights for each of the five years in the period then ended. In our opinion, the financial statements and financial highlights present fairly, in all material respects, the financial position of the Fund as of October 31, 2020, the results of its operations for the year then ended, the changes in net assets for each of the two years in the period then ended, and the financial highlights for each of the five years in the period then ended, in conformity with accounting principles generally accepted in the United States of America.
Basis for Opinion
These financial statements are the responsibility of the Fund’s management. Our responsibility is to express an opinion on the Fund’s financial statements and financial highlights based on our audit. We are a public accounting firm registered with the Public Company Accounting Oversight Board (United States) (PCAOB) and are required to be independent with respect to the Fund in accordance with U.S. federal securities laws and the applicable rules and regulations of the Securities and Exchange Commission and the PCAOB.
We conducted our audit in accordance with the standards of the PCAOB. Those standards require that we plan and perform the audit to obtain reasonable assurance about whether the financial statements are free of material misstatement, whether due to error or fraud. The Fund is not required to have, nor were we engaged to perform, an audit of its internal control over financial reporting. As part of our audit, we are required to obtain an understanding of internal control over financial reporting but not for the purpose of expressing an opinion on the effectiveness of the Fund’s internal control over financial reporting. Accordingly, we express no such opinion.
Our audit included performing procedures to assess the risks of material misstatement of the financial statements, whether due to error or fraud, and performing procedures that respond to those risks. Such procedures included examining, on a test basis, evidence regarding the amounts and disclosures in the financial statements. Our procedures included confirmation of investments owned as of October 31, 2020, by correspondence with the custodians and brokers or by other appropriate auditing procedures where replies from brokers were not received. Our audit also included evaluating the accounting principles used and significant estimates made by management, as well as evaluating the overall presentation of the financial statements. We believe that our audit provides a reasonable basis for our opinion.
/s/ RSM US LLP
We have served as the auditor of one or more Anfield Capital Management, LLC advised investment companies since 2013.
Denver, Colorado
December 29, 2020
31
| Anfield Universal Fixed Income Fund |
| EXPENSE EXAMPLES (Unaudited) |
| October 31, 2020 |
As a shareholder of Anfield Universal Fixed Income Fund, you incur two types of costs: (1) transaction costs, including sales charges (loads) on purchases of Class A shares; (2) ongoing costs, including management fees; distribution and/or service (12b-1) fees; and other Fund expenses. This example is intended to help you understand your ongoing costs (in dollars) of investing in the Anfield Universal Fixed Income Fund and to compare these costs with the ongoing costs of investing in other mutual funds.
The example is based on an investment of $1,000 invested at the beginning of the period and held for the entire period from May 1, 2020 through October 31, 2020.
Actual Expenses
The “Actual” line in the table below provides information about actual account values and actual expenses. You may use the information below together with the amount you invested, to estimate the expenses that you paid over the period. Simply divide your account value by $1,000 (for example, an $8,600 account value divided by $1,000 = 8.6), then multiply the result by the number in the table under the heading entitled “Expenses Paid During Period” to estimate the expenses you paid on your account during this period.
Hypothetical Example for Comparison Purposes
The “Hypothetical” line in the table below provides information about hypothetical account values and hypothetical expenses based on the Anfield Universal Fixed Income Fund’s actual expense ratio and an assumed rate of return of 5% per year before expenses, which is not the Fund’s actual return. The hypothetical account values and expenses may not be used to estimate the actual ending account balances or expenses you paid for the period. You may use this information to compare this 5% hypothetical example with the 5% hypothetical examples that appear in the shareholder reports of other funds.
Please note that the expenses shown in the table are meant to highlight your ongoing costs only and do not reflect any transactional costs, such as sales charges (loads). Therefore, the table is useful in comparing ongoing costs only, and will not help you determine the relative total costs of owning different funds. In addition, if these transactional costs were included, your costs would have been higher.
| Beginning | Ending | Expenses Paid | Expense Ratio | |||||
| Account Value | Account Value | During Period* | During Period** | |||||
| Actual | 5/1/20 | 10/31/20 | 5/1/20 – 10/31/20 | 5/1/20 – 10/31/20 | ||||
| Class A | $1,000.00 | $1,018.30 | $7.46 | 1.47% | ||||
| Class C | 1,000.00 | 1,014.50 | 11.23 | 2.22 | ||||
| Class I | 1,000.00 | 1,018.50 | 6.17 | 1.22 | ||||
| Beginning | Ending | Expenses Paid | Expense Ratio | |||||
| Hypothetical | Account Value | Account Value | During Period* | During Period** | ||||
| (5% return before expenses) | 5/1/20 | 10/31/20 | 5/1/20 – 10/31/20 | 5/1/20 – 10/31/20 | ||||
| Class A | $1,000.00 | $1,017.75 | $7.45 | 1.47% | ||||
| Class C | 1,000.00 | 1,013.98 | 11.23 | 2.22 | ||||
| Class I | 1,000.00 | 1,019.02 | 6.18 | 1.22 |
| * | Expenses are equal to the average account value over the period, multiplied by the Fund’s annualized expense ratio, multiplied by the number of days in the period (184) divided by the number of days in the fiscal year (366). |
| ** | Annualized. |
32
| Anfield Universal Fixed Income Fund |
| ADDITIONAL INFORMATION (Unaudited) |
| October 31, 2020 |
LIQUIDITY RISK MANAGEMENT PROGRAM
The Fund has adopted and implemented a written liquidity risk management program as required by Rule 22e-4 (the “Liquidity Rule”) under the 1940 Act. The program is reasonably designed to assess and manage the Fund’s liquidity risk, taking into consideration, among other factors, the Fund’s investment strategy and the liquidity of its portfolio investments during normal and reasonably foreseeable stressed conditions; its short and long-term cash flow projections; and its cash holdings and access to other funding sources.
During the fiscal year ended October 31, 2020, the Trust’s Liquidity Risk Management Program Committee (the “Committee”) reviewed the Fund’s investments and determined that the Fund held adequate levels of cash and highly liquid investments to meet shareholder redemption activities in accordance with applicable requirements. Accordingly, the Committee concluded that (i) the Fund’s liquidity risk management program is reasonably designed to prevent violations of the Liquidity Rule and (ii) the Fund’s liquidity risk management program has been effectively implemented.
33
| Anfield Universal Fixed Income Fund |
| SUPPLEMENTAL INFORMATION (Unaudited) |
| October 31, 2020 |
Trustees and Officers. The Trustees and officers of the Trust, together with information as to their principal business occupations during the past five years and other information, are shown below. The address of each Trustee and Officer is 225 Pictoria Drive, Suite 450, Cincinnati, OH 45246. All correspondence to the Trustees and Officers should be directed to c/o Gemini Fund Services, LLC, P.O. Box 541150, Omaha, Nebraska 68154.
Independent Trustees *
| Name, Address, Year of Birth | Position(s) Held with Registrant | Term and Length Served | Principal Occupation(s) During Past 5 Years | Number of Portfolios Overseen In The Fund Complex** | Other Directorships Held During Past 5 Years |
| Mark Garbin Year of Birth: 1951 | Trustee | Indefinite, Since 2012 | Managing Principal, Coherent Capital Management LLC (since 2008) | 6 | Northern Lights Fund Trust (since 2013); Northern Lights Variable Trust (since 2013); Forethought Variable Insurance Trust (since 2013); OHA Mortgage Strategies Fund (offshore), Ltd. (2014-2017); Altegris KKR Commitments Master Fund (since 2014); and Carlyle Tactical Private Credit Fund (since March 2018) |
| Mark D. Gersten Year of Birth: 1950 | Chairman, Trustee | Indefinite, Since 2012 | Independent Consultant (since 2012); Senior Vice President –Global Fund Administration Mutual Funds & Alternative Funds, AllianceBernstein LP (1985 –2011) | 6 | Northern Lights Fund Trust (since 2013); Northern Lights Variable Trust (since 2013); Altegris KKR Commitments Master Fund (since 2014); previously, Ramius Archview Credit and Distressed Fund (2015-2017); and Schroder Global Series Trust (2012 to 2017) |
| Neil M. Kaufman Year of Birth: 1960 | Trustee, Audit Committee Chairman | Indefinite, Since 2012 | Managing Member, Kaufman & Associates, LLC (legal services)(Since 2016); Partner, Abrams Fensterman, Fensterman, Eisman, Formato, Ferrara & Wolf, LLP (legal services)(2010-2016) | 6 | Altegris KKR Commitments Master Fund (since 2014) |
| Anita K. Krug Year of Birth: 1969 | Trustee | Indefinite, Since 2012 | Dean (since 2019) Chicago Kent Law School; Interim Vice Chancellor for Academic Affairs (2018-2019) University of Washington Bothell; Interim Dean (2017-2018), Professor (2016-2019), Associate Professor (2014-2016); and Assistant Professor (2010-2014), University of Washington School of Law | 6 | Altegris KKR Commitments Master Fund (since 2014); Centerstone Investors Trust (since 2016) |
| * | Information is as of October 31, 2020. |
| ** | As of October 31, 2020, the Trust was comprised of 23 active portfolios managed by seven unaffiliated investment advisers and two affiliated investment advisers. The term “Fund Complex” applies only to those funds that (i) are advised by a common investment adviser or by an investment adviser that is an affiliated person of the investment adviser of any of the other funds of the Trust or (ii) hold themselves out to investors as related companies for purposes of investment and investor services. The Fund does not hold itself out as related to any other series within the Trust except for Anfield Dynamic Fixed Income ETF, Anfield Capital Diversified Alternatives ETF, Anfield Universal Fixed Income ETF and Anfield U.S. Equity Sector Rotation ETF, each of which are advised by Regents Park Funds, LLC, an affiliate of the Fund’s Adviser (“Regents”) and sub-advised by the Fund’s Adviser and; Affinity World Leaders Equity ETF, which is advised by Regents. |
10/31/2020 – Two Roads v2
34
| Anfield Universal Fixed Income Fund |
| SUPPLEMENTAL INFORMATION (Unaudited)(Continued) |
| October 31, 2020 |
Officers of the Trust*
| Name, Address, Year of Birth | Position(s) Held with Registrant | Principal Occupation(s) During Past 5 Years | Number of Portfolios Overseen In The Fund Complex** | Other Directorships Held During Past 5 Years |
| James Colantino Year of Birth: 1969 | President Since Feb. 2017 Treasurer (2012 to 2017) | Senior Vice President (2012-present); Vice President (2004 to 2012); Gemini Fund Services, LLC | N/A | N/A |
| Laura Szalyga Year of Birth: 1978 | Treasurer Since Feb. 2017 | Vice President, Gemini Fund Services, LLC (since 2015); Assistant Vice President, Gemini Fund Services, LLC (2011-2014) | N/A | N/A |
| Richard A. Malinowski Year of Birth: 1983 | Vice President Since Sep. 2018 Secretary Since 2013 | Senior Vice President and Senior Managing Counsel, Gemini Fund Services, LLC, (since February 2020); Senior Vice President Legal Administration, Gemini Fund Services, LLC (April 2017 to February 2020); Vice President and Counsel (April 2016–2017) and AVP and Staff Attorney (September 2012–March 2016). | N/A | N/A |
| William B. Kimme Year of Birth: 1962 | Chief Compliance Officer Since Inception | Senior Compliance Officer, Northern Lights Compliance Services, LLC (September 2011-present) | N/A | N/A |
| * | Information is as of October 31, 2020. |
| ** | As of October 31, 2020, the Trust was comprised of 23 active portfolios managed by seven unaffiliated investment advisers and two affiliated investment advisers. The term “Fund Complex” applies only to those funds that (i) are advised by a common investment adviser or by an investment adviser that is an affiliated person of the investment adviser of any of the other funds of the Trust or (ii) hold themselves out to investors as related companies for purposes of investment and investor services. The Fund does not hold itself out as related to any other series within the Trust except for Anfield Dynamic Fixed Income ETF, Anfield Capital Diversified Alternatives ETF, Anfield Universal Fixed Income ETF and Anfield U.S. Equity Sector Rotation ETF, each of which are advised by Regents and sub-advised by the Fund’s Adviser; and Affinity World Leaders Equity ETF, which is advised by Regents. |
The Fund’s Statement of Additional Information (“SAI”) includes additional information about the Trustees and is available free of charge, upon request, by calling toll-free at 1-866-866-4848.
10/31/2020 – Two Roads v2
35
PRIVACY NOTICE
| FACTS | WHAT DOES TWO ROADS SHARED TRUST DO WITH YOUR PERSONAL INFORMATION |
| Why? | Financial companies choose how they share your personal information. |
| Federal law gives consumers the right to limit some but not all sharing. | |
| Federal law also requires us to tell you how we collect, share, and protect your personal information. Please read this notice carefully to understand what we do. | |
| What? | THE TYPES OF PERSONAL INFORMATION WE COLLECT AND SHARE DEPENDS ON THE PRODUCT OR SERVICE THAT YOU HAVE WITH US. THIS INFORMATION CAN INCLUDE: |
| ● Social Security number and income | |
| ● Account transactions and transaction history | |
| ● Investment experience and purchase history | |
| When you are no longer our customer, we continue to share your information as described in this notice. | |
| How? | All financial companies need to share customers’ personal information to run their everyday business. In the section below, we list the reasons financial companies can share their customers’ personal information; the reason Two Roads Shared Trust chooses to share and whether you can limit this sharing. |
| Reasons we can share your personal information | Does Two Roads Shared Trust share? | Can you limit this sharing? |
| For our everyday business purposes – | ||
| such as to process your transactions, maintain your account(s), respond to court orders and legal investigations, or report to credit bureaus | YES | NO |
| For our marketing purposes – | NO | We do not share |
| to offer our products and services to you | ||
| For joint marketing with other financial companies | NO | We do not share |
| For our affiliates’ everyday business purposes – | NO | We do not share |
| information about your transactions and experiences | ||
| For our affiliates’ everyday business purposes – | NO | We do not share |
| information about your creditworthiness | ||
| For our affiliates to market to you | NO | We do not share |
| For nonaffiliates to market to you | NO | We do not share |
| Questions? | Call 1-402-895-1600 |
36
What we do
| How does Two Roads Shared Trust protect my personal information? | To protect your personal information from unauthorized access and use, we use security measures that comply with federal law.
These measures include computer safeguards and secured files and buildings. |
| Our service providers are held accountable for adhering to strict policies and procedures to prevent any misuse of your nonpublic personal information. | |
| How does Two Roads Shared Trust | We collect your personal information, for example, when you |
| collect my personal information? | |
| ● open an account or give us contact information | |
| ● provide account information or give us your income information | |
| ● make deposits or withdrawals from your account | |
| We also collect your personal information from other companies. | |
| Why can’t I limit all sharing? | Federal law gives you the right to limit only |
| ● sharing for affiliates’ everyday business purposes – information about your creditworthiness | |
| ● affiliates from using your information to market to you | |
| ● sharing for nonaffiliates to market to you | |
| State laws and individual companies may give you additional rights to limit sharing | |
| Definitions | |
| Affiliates | Companies related by common ownership or control. They can be financial and nonfinancial companies. |
| ● Two Roads Shared Trust has no affiliates. | |
| Nonaffiliates | Companies not related by common ownership or control. They can be financial and nonfinancial companies. |
| ● Two Roads Shared Trust does not share with nonaffiliates so they can market to you. | |
| Joint marketing | A formal agreement between nonaffiliates financial companies that together market financial products or services to you. |
| ● Two Roads Shared Trust does not jointly market. |
37
Proxy Voting Policy
Information regarding how the Fund votes proxies relating to portfolio securities for the twelve month period ended June 30 as well as a description of the policies and procedures that the Fund used to determine how to vote proxies is available without charge, upon request, by calling 1-866-866-4848 or by referring to the Securities and Exchange Commission’s (“SEC”) website at http://www.sec.gov.
Portfolio Holdings
The Fund files its complete schedule of portfolio holdings with the SEC for the first and third quarters of each fiscal year as an exhibit to its reports on Form N-PORT, within sixty days after the end of the period. Form N-PORT reports are available on the SEC’s website at http://www.sec.gov. The information on Form N-PORT is available without charge, upon request, by calling 1-866-866-4848.
| Adviser |
| Anfield Capital Management, LLC |
| 4041 MacArthur Blvd., Suite 155 |
| Newport Beach, CA 92660 |
| Administrator |
| Gemini Fund Services, LLC |
| 4221 North 203rd Street, Suite 100 |
| Elkhorn, NE 68022-3474 |
This report and the financial statements contained herein are submitted for the general information of shareholders and are not authorized for distribution to prospective investors unless preceded or accompanied by an effective prospectus. Nothing contained herein is to be considered an offer of sale or solicitation of an offer to buy shares of the Fund. Such an offering is made only by a prospectus, which contains information about the Fund’s investment objective, risks, fees and expenses. Investors are reminded to read the prospectus carefully before investing in the Fund.
ITEM 2. CODE OF ETHICS.
| (a) | The registrant has, as of the end of the period covered by this report, adopted a code of ethics that applies to the registrant's principal executive officer, principal financial officer, and principal accounting officer or controller, or persons performing similar functions, regardless of whether these individuals are employed by the registrant or a third party. |
| (b) | During the period covered by this report, there were no amendments to any provision of the code of ethics. |
| (c) | During the period covered by this report, there were no waivers or implicit waivers of a provision of the code of ethics. |
ITEM 3. AUDIT COMMITTEE FINANCIAL EXPERT.
| The Registrant’s board of trustees has determined that Mark Gersten is an audit committee financial expert, as defined in Item 3 of Form N-CSR. Mr. Gersten is independent for purposes of this Item 3. |
ITEM 4. PRINCIPAL ACCOUNTANT FEES AND SERVICES.
| (a) | Audit Fees. The aggregate fees billed for each of the last two fiscal years for professional services rendered by the registrant's principal accountant for the audit of the registrant's annual financial statements or services that are normally provided by the accountant in connection with statutory and regulatory filings or engagements for those fiscal years are as follows: |
| Trust Series | 2020 | 2019 | |
| Anfield Universal Fixed Income Fund | $19,400 | $19,400 |
| (b) | Audit-Related Fees. There were no fees billed in each of the last two fiscal years for assurances and related services by the principal accountant that are reasonably related to the performance of the audit of the registrant’s financial statements and are not reported under paragraph (a) of this item. |
| (c) | Tax Fees. The aggregate fees billed in each of the last two fiscal years for professional services rendered by the principal accountant for tax compliance are as follows: |
| Trust Series | 2020 | 2019 | |
| Anfield Universal Fixed Income Fund | $3,500 | $3,500 |
| (d) | All Other Fees – None |
| (e)(1) | The audit committee does not have pre-approval policies and procedures. Instead, the audit committee or audit committee chairman approves on a case-by-case basis each audit or non-audit service before the principal accountant is engaged by the registrant. |
| (e)(2) | There were no services described in each of paragraphs (b) through (d) of this Item that were approved by the audit committee pursuant to paragraph (c)(7)(i)(C) of Rule 2-01 of Regulation S-X. |
| (f) | Not applicable. The percentage of hours expended on the principal accountant's engagement to audit the registrant's financial statements for the most recent fiscal year that were attributed to work performed by persons other than the principal accountant's full-time, permanent employees was zero percent (0%). |
| (g) | All non-audit fees billed by the registrant's principal accountant for services rendered to the registrant for the fiscal years ended October 31, 2019 and 2020 respectively are disclosed in (b)-(d) above. There were no audit or non-audit services performed by the registrant's principal accountant for the registrant's adviser. |
(h) Not applicable.
ITEM 5. AUDIT COMMITTEE OF LISTED REGISTRANTS.
Not applicable
ITEM 6. SCHEDULE OF INVESTMENT
Included in annual report to shareholders filed under item 1 of this form.
ITEM 7. DISCLOSURE OF PROXY VOTING POLICIES AND PROCEDURES FOR CLOSED-END MANAGEMENT INVESTMENT COMPANIES.
Not applicable Fund is an open-end management investment company
ITEM 8. PORTFOLIO MANAGERS OF CLOSED-END MANAGEMENT INVESTMENT COMPANIES
Not applicable Fund is an open-end management investment company
ITEM 9. PURCHASES OF EQUITY SECURITIES BY CLOSED-END MANAGEMENT INVESTMENT COMPANY AND AFFILIATED PURCHASERS.
Not applicable Fund is an open-end management investment company
ITEM 10. SUBMISSION OF MATTERS TO A VOTE OF SECURITY HOLDERS.
Not applicable at this time.
ITEM 11. CONTROLS AND PROCEDURES.
| (a) | The registrant's principal executive and principal financial officers, or persons performing similar functions, have concluded that the registrant's disclosure controls and procedures (as defined in Rule 30a-3(c) under the 1940 Act, are effective, as of a date within 90 days of the filing date of this report, based on the evaluation of these controls and procedures required by Rule 30a-3(b) under the 1940 Act and Rule 15d-15(b) under the Securities Exchange Act of 1934, as amended. |
| (b) | There were no changes in the registrant's internal control over financial reporting (as defined in Rule 30a-3(d) under the 1940 Act) that occurred during the period covered by this report that have materially affected, or are reasonably likely to materially affect, the registrant's internal control over financial reporting. |
ITEM 12. DISCLOSURE OF SECURITIES LENDING ACTIVITIES FOR CLOSED-END MANAGEMENT INVESTMENT COMPANIES.
Not applicable to open-end investment companies.
ITEM 13. EXHIBITS
(a)(1) Code of Ethics for Principal Executive and Senior Financial Officers is attached hereto.
(a)(2) Certifications pursuant to Section 302 of the Sarbanes-Oxley Act of 2002 are filed herewith.
(a)(3) Not applicable for open-end investment companies.
(a)(4) Not applicable.
SIGNATURES
Pursuant to the requirements of the Securities Exchange Act of 1934 and the Investment Company Act of 1940, the registrant has duly caused this report to be signed on its behalf by the undersigned, thereunto duly authorized.
Two Roads Shared Trust
| By James Colantino | /s/ James Colantino |
| Principal Executive Officer/President, | |
| Date: January 6, 2021 | |
Pursuant to the requirements of the Securities Exchange Act of 1934 and the Investment Company Act of 1940, this report has been signed below by the following person on behalf of the registrant and in the capacities and on the date indicated.
| By Laura Szalyga | /s/ Laura Szalyga |
| Principal Financial Officer/Treasurer | |
| Date: January 6, 2021 | |