united states
securities and exchange commission
washington, d.c. 20549
form n-csr
certified shareholder report of registered management
investment companies
Investment Company Act file number 811-22718
Two Roads Shared Trust
(Exact name of registrant as specified in charter)
225 Pictoria Drive, Suite 450 Cincinnati, OH 45246
(Address of principal executive offices) (Zip code)
Richard Malinowski, Ultimus Fund Solutions, LLC.
80 Arkay Drive, Hauppauge, NY 11788
(Name and address of agent for service)
Registrant's telephone number, including area code: 631-470-2600
Date of fiscal year end: 7/31
Date of reporting period: 1/31/22
Item 1. Reports to Stockholders.
 |
| Tactical Dividend and Momentum Fund |
| (formerly, Hanlon Tactical Dividend and Momentum Fund) |
| Class A | HTDAX | |
| Class C | HTDCX | |
| Class I | HTDIX | |
| Class R | HTDRX | |
| Semi-Annual Report |
| January 31, 2022 |
| www.HanlonFunds.com |
| 1-844-828-3212 |
| Distributed by Northern Lights Distributors, LLC |
| Member FINRA |
This report and the financial statements contained herein are submitted for the general information of shareholders and are not authorized for distribution to prospective investors unless preceded or accompanied by an effective prospectus. Nothing contained herein is to be considered an offer of sale or solicitation of an offer to buy shares of the Fund. Such offering is made only by a prospectus, which contains information about the Fund’s investment objective, risks, fees and expenses. Investors are reminded to read the Fund’s prospectus carefully before investing in the Fund.
| Dear Fellow Shareholders, |
 | ||
| Sean Hanlon, CFP® | ||
| Chairman, CEO and Co-Chief Investment Officer | ||
We launched the Tactical Dividend and Momentum Fund (“TDM”, “the Fund”) with the goal of protecting our shareholders from large market drawdowns and providing positive, risk-adjusted returns; although there is no guarantee that we will meet these objectives. The Fund invests in the 11 major equity economic sectors, weighted up to their respective S&P 500 market capitalizations. Although there is no guarantee, this approach attempts to closely track the broader equity market during times when the market is steadily advancing. When a given sector displays relative weakness, we will attempt to reduce or eliminate exposure, while remaining in the other sectors. In extreme times, we may exit the markets completely and ride out the volatility in cash or short-term fixed income positions.
Thank you,

1
| Commentary |
Note: The following commentary pertains to the Fund’s semiannual reporting period from August 1, 2021 to January 31, 2022.
At the start of the semiannual period, US equity markets were wrapping up a strong summer upswing, led by a rotation back into large-cap growth stocks which had briefly fallen out of favor in the spring of 2021. Despite the resilience of the markets through the summer, there was some concern that we would experience a second wave of COVID-19 infections in the Fall of 2021, with the return to in-person schools and relaxation of safety precautions. The other major concern was stubbornly high inflation readings, which persisted despite the Federal Reserve’s (“the Fed”) insistence that inflation would be only temporary and resolved organically.
By the end of September, it was apparent that both these fears were warranted, as the world grappled with both an uptick in COVID cases, and lingering supply-chain issues and price inflation. The S&P 500’s -4.7% September decline was, at the time, the index’s worst month since the March 2020 selloff. Strong corporate earnings, however, came to the rescue and in October 2021, the S&P 500 rebounded 7.0% and was largely able to keep the rally going despite COVID and inflation remaining major red flags.
Markets topped out with new all-time highs for the S&P 500 on January 3rd, 2022 and proceeded to plunge –9.7% from that point before rebounding 4.4% on January’s final two trading days. The recent bout of volatility was driven by the Fed’s acknowledgment that it will need to reach into its policy toolkit, i.e., raise interest rates, sooner and more aggressively than originally projected. The prospect of rising interest rates, and the uncertainty over the pace and extent of the rate increases, has markets on edge, and this uncertainty will likely persist until the Fed implements the first rate increase, expected in March.
Among the US equity sectors which the Tactical Dividend and Momentum Fund invests, the best performers were largely what one would expect from an inflationary, rising rate environment. Energy was far and away the leader, gaining 36.9% in the semiannual period (8/1/2021-1/31/2022). Financials were a distant second at 8.0%, followed by defensive Consumer Staples at 7.6%. The Communication Services sector, which encompasses traditional telecoms as well as social media and streaming television, was the biggest laggard at –9.9% in the semiannual period.
Performance Update
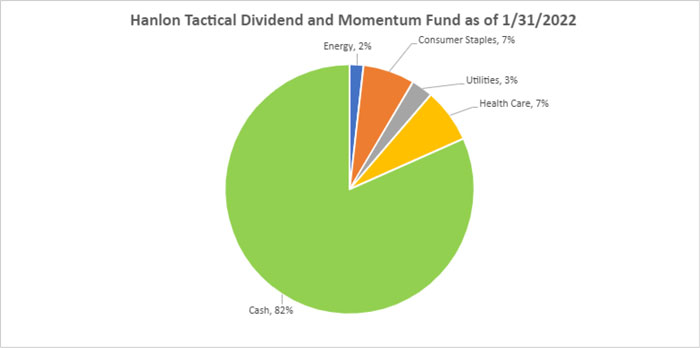
The Tactical Dividend and Momentum Fund (“TDM”, “The Fund”) began the semiannual period (8/1/2021-1/31/2022) with reduced exposure to all sectors, holding 49% cash with exposure to each of the 11 sectors at roughly 50% of their full weight. Exposure was scaled up in early October and by November the Fund was fully invested. Around 20% cash was raised again in at the beginning of December, and increased mid-January, ending the semiannual period with overweight cash exposure
2
of 82% within the Fund. The allocation to cash was able to buffer the January drawdown for the Fund, which fell –5.1% from the January 3rd peak to the January 27th trough, compared to a -9.7% decline in the S&P 500 during the same period.
For the semiannual period (8/1/2021-1/31/2022), the TDM Fund Class I shares returned –2.0%, trailing the S&P 500 Index, which returned 3.4%. For the annual period from 2/1/2021 to 1/31/2022, the TDM Fund Class I shares returned 14.0% while the S&P 500 returned 23.3%. As of January 31, 2022, the Fund had the following weightings:
The views in this report are those of the Fund’s management. This report contains certain forward-looking statements about factors that may affect the performance of the Fund in the future. These statements are based on the Fund’s management’s predictions and expectations concerning certain future events such as the performance of the economy as a whole and of specific industry sectors. Management believes these forward-looking statements are reasonable, although they are inherently uncertain and difficult to predict.
6256 NLD-03282022
3
| Tactical Dividend and Momentum Fund |
| PORTFOLIO REVIEW (Unaudited) |
| January 31, 2022 |
The Fund’s performance figures* for each period ended January 31, 2022, compared to its benchmark:
| Annualized | Annualized | |||
| Six Months | One Year | Five Year | Since Inception (a) | |
| Tactical Dividend and Momentum Fund - Class A | (2.04)% | 13.63% | 7.00% | 4.71% |
| Tactical Dividend and Momentum Fund - Class A with load | (7.69)% | 7.12% | 5.75% | 3.74% |
| Tactical Dividend and Momentum Fund - Class C | (2.36)% | 12.75% | 6.20% | 3.94% |
| Tactical Dividend and Momentum Fund - Class I | (1.98)% | 13.98% | 7.26% | 4.93% |
| Tactical Dividend and Momentum Fund - Class R | (2.15)% | 13.52% | 6.84% | 4.49% |
| S&P 500 Total Return Index (b) | 3.44% | 23.29% | 16.78% | 16.29% |
| * | The performance data quoted is historical. Past performance is no guarantee of future results. Current performance may be higher or lower than the performance data quoted. The principal value and investment return of an investment will fluctuate so that your shares, when redeemed, may be worth more or less than their original cost. The returns shown do not reflect the deduction of taxes that a shareholder would pay on Fund distributions or on the redemptions of Fund shares. Returns greater than 1 year are annualized. The total annual operating expenses as stated in the fee table of the Fund’s prospectus dated November 30, 2021 are 1.80%, 2.55%, 1.55% and 1.95% for Class A, Class C, Class I and Class R shares, respectively. The Advisor has contractually agreed to reduce the Fund’s fees and/or absorb expenses of the Fund until at least November 28, 2022 to ensure that total annual Fund operating expenses (exclusive of any front-end or contingent deferred loads; brokerage fees and commissions; expenses of other investment companies in which the Fund may invest (“acquired fund fees and expenses”); borrowing costs, such as interest and dividend expense on securities sold short; taxes; and extraordinary expenses, such as litigation expenses) of the Fund do not exceed 1.70%, 2.45%, 1.45%, and 1.85% of average daily net assets attributable to Class A, Class C, Class I, and Class R shares, respectively. This agreement may be terminated with respect to the Fund by the Board of Trustees on 60 days’ written notice to the Advisor. These expense reimbursements are subject to possible recoupment from the Fund in future years on a rolling three-year basis (within three years after the fees have been waived or reimbursed) if such recoupment can be achieved without exceeding the foregoing expense limits as well as any expense limitation that was in effect at the time the waiver or reimbursement was made. Class A shares are subject to a maximum sales charge imposed on purchases of 5.75%. Class C shares are subject to a contingent deferred sales charge of 1.00% on redemptions made within one year of purchase. For investments in Class A shares of $1 million or more, there is a contingent deferred sales charge of 1.00% on redemptions made within one year of purchase. For performance information current to the most recent month-end, please call 1-844-828-3212. |
| (a) | Inception date is September 9, 2015. |
| (b) | The S&P 500 Total Return Index is an unmanaged free-float capitalization-weighted index which measures the performance of 500 large-cap common stocks actively traded in the United States. Unlike a mutual fund, an index does not reflect any trading costs or management fees. Investors cannot directly invest in an index. |
| Portfolio Composition as of January 31, 2022 | ||||
| Holdings By Investment Type | % of Net Assets | |||
| Exchange Traded Funds - Equity | 16.5 | % | ||
| Money Market Fund | 73.8 | % | ||
| Liabilities in Excess of Other Assets | 9.7 | % | ||
| 100.0 | % | |||
Please refer to the Schedule of Investments in this semi-annual report for a detailed listing of the Fund’s holdings.
4
| TACTICAL DIVIDEND & MOMENTUM FUND |
| SCHEDULE OF INVESTMENTS (Unaudited) |
| January 31, 2022 |
| Shares | Fair Value | |||||||
| EXCHANGE-TRADED FUNDS — 16.5% | ||||||||
| EQUITY - 16.5% | ||||||||
| 113,645 | Consumer Staples Select Sector SPDR Fund | $ | 8,633,610 | |||||
| 34,923 | Energy Select Sector SPDR Fund | 2,302,124 | ||||||
| 69,074 | Health Care Select Sector SPDR Fund(a),(b) | 9,064,581 | ||||||
| 52,099 | Utilities Select Sector SPDR Fund | 3,607,856 | ||||||
| 23,608,171 | ||||||||
| TOTAL EXCHANGE-TRADED FUNDS (Cost $22,761,063) | 23,608,171 | |||||||
| SHORT-TERM INVESTMENTS — 73.8% | ||||||||
| MONEY MARKET FUND - 73.8% | ||||||||
| 105,377,488 | Morgan Stanley Institutional Liquidity Funds - Treasury Securities Portfolio, Institutional Class, 0.01% (Cost $105,377,488)(c) | 105,377,488 | ||||||
| TOTAL INVESTMENTS - 90.3% (Cost $128,138,551) | $ | 128,985,659 | ||||||
| OTHER ASSETS IN EXCESS OF LIABILITIES - 9.7% | 13,907,284 | |||||||
| NET ASSETS - 100.0% | $ | 142,892,943 | ||||||
SPDR - Standard & Poor’s Depositary Receipt
| (a) | All or a portion of the security is on loan. The total fair value of the securities on loan as of January 31, 2022 was $9,064,581. |
| (b) | Non-cash collateral received from the borrower not disclosed in the Schedule of Investments had a value of $9,201,684 as of January 31, 2022. |
| (c) | Rate disclosed is the seven day effective yield as of January 31, 2022. |
The accompanying notes are an integral part of these financial statements.
5
| TACTICAL DIVIDEND AND MOMENTUM FUND |
| STATEMENTS OF ASSETS AND LIABILITIES (Unaudited) |
| January 31, 2022 |
| ASSETS | ||||
| Investment securities: | ||||
| Investments at cost | $ | 128,138,551 | ||
| Investments at value | $ | 128,985,659 | ||
| Receivable for securities sold | 14,094,113 | |||
| Receivable for fund shares sold | 3,994 | |||
| Dividends and interest receivable | 447 | |||
| Prepaid expenses and other assets | 42,777 | |||
| TOTAL ASSETS | 143,126,990 | |||
| LIABILITIES | ||||
| Investment advisory fees payable | 124,426 | |||
| Payable to related parties | 48,889 | |||
| Payable for Fund shares repurchased | 83 | |||
| Distribution (12b-1) fees payable | 9,355 | |||
| Accrued expenses and other liabilities | 51,294 | |||
| TOTAL LIABILITIES | 234,047 | |||
| NET ASSETS | $ | 142,892,943 | ||
| COMPOSITION OF NET ASSETS: | ||||
| Paid in capital | $ | 146,509,368 | ||
| Accumulated losses | (3,616,425 | ) | ||
| NET ASSETS | $ | 142,892,943 | ||
| NET ASSET VALUE PER SHARE: | ||||
| Class A Shares: | ||||
| Net Assets | $ | 8,602,325 | ||
| Shares of beneficial interest outstanding ($0 par value, unlimited shares authorized) | 739,127 | |||
| Net asset value (Net Assets ÷ Shares Outstanding) and redemption price per share | $ | 11.64 | ||
| Maximum offering price per share (net asset value plus maximum sales charge of 5.75%) (a) | $ | 12.35 | ||
| Class C Shares: | ||||
| Net Assets | $ | 333,550 | ||
| Shares of beneficial interest outstanding ($0 par value, unlimited shares authorized) | 30,253 | |||
| Net asset value (Net Assets ÷ Shares Outstanding), offering price and redemption price per share (b) | $ | 11.03 | ||
| Class I Shares: | ||||
| Net Assets | $ | 113,430,531 | ||
| Shares of beneficial interest outstanding ($0 par value, unlimited shares authorized) | 9,847,784 | |||
| Net asset value (Net Assets ÷ Shares Outstanding), offering price and redemption price per share | $ | 11.52 | ||
| Class R Shares: | ||||
| Net Assets | $ | 20,526,537 | ||
| Shares of beneficial interest outstanding ($0 par value, unlimited shares authorized) | 1,800,655 | |||
| Net asset value (Net Assets ÷ Shares Outstanding), offering price and redemption price per share | $ | 11.40 | ||
| (a) | For investments in Class A shares of $1 million or more, there is a deferred sales charge of 1.00% of the original purchase price on redemptions made within one year of purchase. |
| (b) | Class C shares sold within one year of purchases are subject to a contingent deferred sales charge of 1.00% of the original purchase price. |
The accompanying notes are an integral part of these financial statements.
6
| TACTICAL DIVIDEND AND MOMENTUM FUND |
| STATEMENTS OF OPERATIONS (Unaudited) |
| For the Six Months Ended January 31, 2022 |
| INVESTMENT INCOME | ||||
| Dividends | $ | 847,239 | ||
| Securities lending income (net of fees) | 12,874 | |||
| Interest | 2,233 | |||
| TOTAL INVESTMENT INCOME | 862,346 | |||
| EXPENSES | ||||
| Investment advisory fees | 718,799 | |||
| Distribution (12b-1) fees: | ||||
| Class A | 11,235 | |||
| Class C | 1,739 | |||
| Class R | 41,768 | |||
| Administration fees | 80,864 | |||
| Third party administrative service fees | 51,148 | |||
| Accounting services fees | 26,236 | |||
| Registration fees | 24,148 | |||
| Transfer agent fees | 19,747 | |||
| Legal fees | 12,197 | |||
| Audit fees | 9,814 | |||
| Compliance officer fees | 7,587 | |||
| Custodian fees | 7,324 | |||
| Printing and postage expenses | 7,021 | |||
| Trustees’ fees and expenses | 6,995 | |||
| Insurance expense | 4,737 | |||
| Other expenses | 3,959 | |||
| TOTAL EXPENSES | 1,035,318 | |||
| NET EXPENSES | 1,035,318 | |||
| NET INVESTMENT LOSS | (172,972 | ) | ||
| REALIZED AND UNREALIZED GAIN (LOSS) ON INVESTMENTS | ||||
| Net realized gain from security transactions | 8,123,773 | |||
| Net change in unrealized depreciation on investments | (11,759,485 | ) | ||
| NET REALIZED AND UNREALIZED LOSS ON INVESTMENTS | (3,635,712 | ) | ||
| NET DECREASE IN NET ASSETS RESULTING FROM OPERATIONS | $ | (3,808,684 | ) | |
The accompanying notes are an integral part of these financial statements.
7
| TACTICAL DIVIDEND AND MOMENTUM FUND |
| STATEMENTS OF CHANGES IN NET ASSETS |
| For the | ||||||||
| Six Months Ended | For the | |||||||
| January 31, 2022 | Year Ended | |||||||
| (Unaudited) | July 31, 2021 | |||||||
| FROM OPERATIONS | ||||||||
| Net investment loss | $ | (172,972 | ) | $ | (132,567 | ) | ||
| Net realized gain from security transactions | 8,123,773 | 15,469,307 | ||||||
| Net change in unrealized appreciation (deprecation) on investments | (11,759,485 | ) | 7,816,235 | |||||
| Net increase (decrease) in net assets resulting from operations | (3,808,684 | ) | 23,152,975 | |||||
| DISTRIBUTIONS TO SHAREHOLDERS | ||||||||
| Distributions paid | ||||||||
| Class A | (1,143,021 | ) | — | |||||
| Class C | (45,060 | ) | — | |||||
| Class I | (15,043,206 | ) | — | |||||
| Class R | (2,704,182 | ) | — | |||||
| Net decrease in net assets resulting from distributions to shareholders | (18,935,469 | ) | — | |||||
| FROM SHARES OF BENEFICIAL INTEREST | ||||||||
| Proceeds from shares sold: | ||||||||
| Class A | 4,102,408 | 510,388 | ||||||
| Class C | 660 | 1,320 | ||||||
| Class I | 76,904,327 | 3,567,964 | ||||||
| Class R | 5,957,795 | 1,310,811 | ||||||
| Net asset value of shares issued in reinvestment of distributions: | ||||||||
| Class A | 1,143,021 | — | ||||||
| Class C | 41,677 | |||||||
| Class I | 742,993 | — | ||||||
| Class R | 2,704,182 | — | ||||||
| Payments for shares redeemed: | ||||||||
| Class A | (2,212,377 | ) | (4,251,144 | ) | ||||
| Class C | (215 | ) | (1,000,521 | ) | ||||
| Class I | (10,444,774 | ) | (31,568,108 | ) | ||||
| Class R | (1,811,269 | ) | (5,773,780 | ) | ||||
| Net increase (decrease) in net assets resulting from shares of beneficial interest | 77,128,428 | (37,203,070 | ) | |||||
| TOTAL INCREASE (DECREASE) IN NET ASSETS | 54,384,275 | (14,050,095 | ) | |||||
| NET ASSETS | ||||||||
| Beginning of Period | 88,508,668 | 102,558,763 | ||||||
| End of Period | $ | 142,892,943 | $ | 88,508,668 | ||||
| SHARE ACTIVITY | ||||||||
| Class A: | ||||||||
| Shares Sold | 308,650 | 43,732 | ||||||
| Shares Reinvested | 95,252 | — | ||||||
| Shares Redeemed | (175,465 | ) | (355,890 | ) | ||||
| Net increase (decrease) in shares of beneficial interest outstanding | 228,437 | (312,158 | ) | |||||
| Class C: | ||||||||
| Shares Sold | 52 | 114 | ||||||
| Shares Reinvested | 3,666 | — | ||||||
| Shares Redeemed | (19 | ) | (80,453 | ) | ||||
| Net increase (decrease) in shares of beneficial interest outstanding | 3,699 | (80,339 | ) | |||||
| Class I: | ||||||||
| Shares Sold | 5,792,864 | 301,406 | ||||||
| Shares Reinvested | 62,594 | — | ||||||
| Shares Redeemed | (797,866 | ) | (2,803,257 | ) | ||||
| Net increase (decrease) in shares of beneficial interest outstanding | 5,057,592 | (2,501,851 | ) | |||||
| Class R: | ||||||||
| Shares Sold | 443,844 | 110,191 | ||||||
| Shares Reinvested | 230,143 | — | ||||||
| Shares Redeemed | (140,925 | ) | (475,731 | ) | ||||
| Net increase (decrease) in shares of beneficial interest outstanding | 533,062 | (365,540 | ) | |||||
The accompanying notes are an integral part of these financial statements.
8
| TACTICAL DIVIDEND AND MOMENTUM FUND |
| FINANCIAL HIGHLIGHTS |
| Per Share Data and Ratios for a Share of Beneficial Interest Outstanding Throughout Each Period |
| Class A | ||||||||||||||||||||||||
| Six Months Ended | Year Ended | Year Ended | Year Ended | Year Ended | Year Ended | |||||||||||||||||||
| January 31, 2022 | July 31, | July 31, | July 31, | July 31, | July 31, | |||||||||||||||||||
| (Unaudtied) | 2021 | 2020 | 2019 | 2018 | 2017 | |||||||||||||||||||
| Net asset value, beginning of period | $ | 13.57 | $ | 10.54 | $ | 10.87 | $ | 11.15 | $ | 9.87 | $ | 9.58 | ||||||||||||
| Activity from investment operations: | ||||||||||||||||||||||||
| Net investment income (loss) (1) | (0.02 | ) | (0.04 | ) | (0.01 | ) (2) | 0.02 | 0.01 | 0.05 | |||||||||||||||
| Net realized and unrealized gain (loss) on investments | (0.22 | ) | 3.07 | (0.27 | ) | (0.30 | ) | 1.30 | 0.24 | |||||||||||||||
| Total from investment operations | (0.24 | ) | 3.03 | (0.28 | ) | (0.28 | ) | 1.31 | 0.29 | |||||||||||||||
| Less distributions from: | ||||||||||||||||||||||||
| Net investment income | — | — | (0.04 | ) | (0.00 | ) (3) | (0.03 | ) | — | |||||||||||||||
| Net realized gains | (1.69 | ) | — | — | — | — | — | |||||||||||||||||
| Return of capital | — | — | (0.01 | ) | (0.00 | ) (3) | (0.00 | ) (3) | — | |||||||||||||||
| Total distributions | (1.69 | ) | — | (0.05 | ) | (0.00 | ) (3) | (0.03 | ) | — | ||||||||||||||
| Net asset value, end of period | $ | 11.64 | $ | 13.57 | $ | 10.54 | $ | 10.87 | $ | 11.15 | $ | 9.87 | ||||||||||||
| Total return (4) | (2.04 | )% (5) | 28.75 | % | (2.63 | )% | (2.48 | )% | 13.28 | % | 3.03 | % | ||||||||||||
| Net assets, at end of period (000’s) | $ | 8,602 | $ | 6,928 | $ | 8,669 | $ | 12,038 | $ | 13,867 | $ | 20,812 | ||||||||||||
| Ratio of expenses to average net assets (6) | 1.63 | % (7) | 1.68 | % | 1.66 | % | 1.64 | % | 1.62 | % | 1.53 | % | ||||||||||||
| Ratio of net investment income (loss) to average net assets (6,8) | (0.37 | )% (7) | (0.30 | )% | (0.11 | )% (2) | 0.14 | % | 0.13 | % | 0.57 | % | ||||||||||||
| Portfolio Turnover Rate | 283 | % (5) | 64 | % | 293 | % | 226 | % | 48 | % | 384 | % | ||||||||||||
| (1) | Per share amounts calculated using the average shares method, which appropriately presents the per share data for the period. |
| (2) | The amount of net investment loss on investment per share for the period ended does not accord with the amounts in the Statements of Operations due to the timing of purchases and sales of Fund shares in relation to fluctuating market values. |
| (3) | Represents less than $0.005 per share. |
| (4) | Total returns are historical in nature and exclude the effect of applicable sales charges and assumes reinvestment of dividends. |
| (5) | Not annualized. |
| (6) | The ratios of expenses and net investment income to average net assets do not reflect the Fund’s proportionate share of income and expenses of underlying investment companies in which the Fund invests. |
| (7) | Annualized. |
| (8) | Recognition of net investment income by the Fund is affected by the timing and declaration of dividends by the underlying investment companies in which the Fund invests. |
The accompanying notes are an integral part of these financial statements.
9
| TACTICAL DIVIDEND AND MOMENTUM FUND |
| FINANCIAL HIGHLIGHTS |
| Per Share Data and Ratios for a Share of Beneficial Interest Outstanding Throughout Each Period |
| Class C | ||||||||||||||||||||||||
| Six Months Ended | Year Ended | Year Ended | Year Ended | Year Ended | Year Ended | |||||||||||||||||||
| January 31, 2022 | July 31, | July 31, | July 31, | July 31, | July 31, | |||||||||||||||||||
| (Unaudtied) | 2021 | 2020 | 2019 | 2018 | 2017 | |||||||||||||||||||
| Net asset value, beginning of period | $ | 12.99 | $ | 10.17 | $ | 10.53 | $ | 10.87 | $ | 9.68 | $ | 9.53 | ||||||||||||
| Activity from investment operations: | ||||||||||||||||||||||||
| Net investment loss (1) | (0.07 | ) | (0.12 | ) | (0.09 | ) (2) | (0.07 | ) (2) | (0.06 | ) (2) | (0.03 | ) (2) | ||||||||||||
| Net realized and unrealized gain (loss) on investments | (0.20 | ) | 2.94 | (0.27 | ) | (0.27 | ) | 1.25 | 0.24 | |||||||||||||||
| Total from investment operations | (0.27 | ) | 2.82 | (0.36 | ) | (0.34 | ) | 1.19 | 0.21 | |||||||||||||||
| Less distributions from: | ||||||||||||||||||||||||
| Net investment income | — | — | — | — | — | (0.06 | ) | |||||||||||||||||
| Net realized gains | (1.69 | ) | — | — | — | — | — | |||||||||||||||||
| Total distributions | (1.69 | ) | — | — | — | — | (0.06 | ) | ||||||||||||||||
| Net asset value, end of period | $ | 11.03 | $ | 12.99 | $ | 10.17 | $ | 10.53 | $ | 10.87 | $ | 9.68 | ||||||||||||
| Total return (3) | (2.36 | )% (4) | 27.73 | % | (3.42 | )% | (3.13 | )% | 12.29 | % | 2.28 | % | ||||||||||||
| Net assets, at end of period (000’s) | $ | 334 | $ | 345 | $ | 1,087 | $ | 1,529 | $ | 2,140 | $ | 2,997 | ||||||||||||
| Ratio of expenses to average net assets (5) | 2.38 | % (6) | 2.43 | % | 2.41 | % | 2.39 | % | 2.37 | % | 2.28 | % | ||||||||||||
| Ratio of net investment loss to average net assets (5,7) | (1.18 | )% (6) | (1.05 | )% | (0.88 | )% (2) | (0.64 | )% (2) | (0.61 | )% (2) | (0.31 | )% (2) | ||||||||||||
| Portfolio Turnover Rate | 283 | % (4) | 64 | % | 293 | % | 226 | % | 48 | % | 384 | % | ||||||||||||
| (1) | Per share amounts calculated using the average shares method, which appropriately presents the per share data for the period. |
| (2) | The amount of net investment loss on investment per share for the period ended does not accord with the amounts in the Statements of Operations due to the timing of purchases and sales of Fund shares in relation to fluctuating market values. |
| (3) | Total returns are historical in nature and exclude the effect of applicable sales charges and assumes reinvestment of dividends. |
| (4) | Not annualized. |
| (5) | The ratios of expenses and net investment income to average net assets do not reflect the Fund’s proportionate share of income and expenses of underlying investment companies in which the Fund invests. |
| (6) | Annualized. |
| (7) | Recognition of net investment income by the Fund is affected by the timing and declaration of dividends by the underlying investment companies in which the Fund invests. |
The accompanying notes are an integral part of these financial statements.
10
| TACTICAL DIVIDEND AND MOMENTUM FUND |
| FINANCIAL HIGHLIGHTS |
| Per Share Data and Ratios for a Share of Beneficial Interest Outstanding Throughout Each Period |
| Class I | ||||||||||||||||||||||||
| Six Months Ended | Year Ended | Year Ended | Year Ended | Year Ended | Year Ended | |||||||||||||||||||
| January 31, 2022 | July 31, | July 31, | July 31, | July 31, | July 31, | |||||||||||||||||||
| (Unaudtied) | 2021 | 2020 | 2019 | 2018 | 2017 | |||||||||||||||||||
| Net asset value, beginning of period | $ | 13.43 | $ | 10.40 | $ | 10.74 | $ | 11.02 | $ | 9.77 | $ | 9.58 | ||||||||||||
| Activity from investment operations: | ||||||||||||||||||||||||
| Net investment income (loss) (1) | (0.01 | ) | (0.00 | ) (2) | 0.01 | 0.04 | 0.04 | 0.07 | ||||||||||||||||
| Net realized and unrealized gain (loss) on investments | (0.21 | ) | 3.03 | (0.27 | ) | (0.28 | ) | 1.28 | 0.24 | |||||||||||||||
| Total from investment operations | (0.22 | ) | 3.03 | (0.26 | ) | (0.24 | ) | 1.32 | 0.31 | |||||||||||||||
| Less distributions from: | ||||||||||||||||||||||||
| Net investment income | — | — | (0.07 | ) | (0.04 | ) | (0.07 | ) | (0.12 | ) | ||||||||||||||
| Net realized gains | (1.69 | ) | — | — | — | — | — | |||||||||||||||||
| Return of capital | — | — | (0.01 | ) | (0.00 | ) (2) | (0.00 | ) (2) | — | |||||||||||||||
| Total distributions | (1.69 | ) | — | (0.08 | ) | (0.04 | ) | (0.07 | ) | (0.12 | ) | |||||||||||||
| Net asset value, end of period | $ | 11.52 | $ | 13.43 | $ | 10.40 | $ | 10.74 | $ | 11.02 | $ | 9.77 | ||||||||||||
| Total return (3) | (1.98 | )% (4) | 29.13 | % | (2.50 | )% | (2.18 | )% | 13.53 | % | 3.28 | % | ||||||||||||
| Net assets, at end of period (000’s) | $ | 113,431 | $ | 64,338 | $ | 75,871 | $ | 92,978 | $ | 110,151 | $ | 137,869 | ||||||||||||
| Ratio of expenses to average net assets (5) | 1.38 | % (6) | 1.43 | % | 1.41 | % | 1.39 | % | 1.37 | % | 1.28 | % | ||||||||||||
| Ratio of net investment income (loss) to average net assets (5,7) | (0.17 | )% (6) | (0.03 | )% | 0.13 | % | 0.38 | % | 0.39 | % | 0.81 | % | ||||||||||||
| Portfolio Turnover Rate | 283 | % (4) | 64 | % | 293 | % | 226 | % | 48 | % | 384 | % | ||||||||||||
| (1) | Per share amounts calculated using the average shares method, which appropriately presents the per share data for the period. |
| (2) | Represents less than $0.005 per share. |
| (3) | Total returns are historical in nature and exclude the effect of applicable sales charges and assumes reinvestment of dividends. |
| (4) | Not annualized. |
| (5) | The ratios of expenses and net investment income to average net assets do not reflect the Fund’s proportionate share of income and expenses of underlying investment companies in which the Fund invests. |
| (6) | Annualized. |
| (7) | Recognition of net investment income by the Fund is affected by the timing and declaration of dividends by the underlying investment companies in which the Fund invests. |
The accompanying notes are an integral part of these financial statements.
11
| TACTICAL DIVIDEND AND MOMENTUM FUND |
| FINANCIAL HIGHLIGHTS |
| Per Share Data and Ratios for a Share of Beneficial Interest Outstanding Throughout Each Period |
| Class R | ||||||||||||||||||||||||
| Six Months Ended | Year Ended | Year Ended | Year Ended | Year Ended | Year Ended | |||||||||||||||||||
| January 31, 2022 | July 31, | July 31, | July 31, | July 31, | July 31, | |||||||||||||||||||
| (Unaudtied) | 2021 | 2020 | 2019 | 2018 | 2017 | |||||||||||||||||||
| Net asset value, beginning of period | $ | 13.33 | $ | 10.37 | $ | 10.70 | $ | 10.98 | $ | 9.73 | $ | 9.53 | ||||||||||||
| Activity from investment operations: | ||||||||||||||||||||||||
| Net investment income (loss) (1) | (0.03 | ) | (0.05 | ) | (0.03 | ) (2) | (0.00 | ) (3) | (0.00 | ) (3) | 0.04 | |||||||||||||
| Net realized and unrealized gain (loss) on investments | (0.21 | ) | 3.01 | (0.27 | ) | (0.28 | ) | 1.27 | 0.23 | |||||||||||||||
| Total from investment operations | (0.24 | ) | 2.96 | (0.30 | ) | (0.28 | ) | 1.27 | 0.27 | |||||||||||||||
| Less distributions from: | ||||||||||||||||||||||||
| Net investment income | — | — | (0.02 | ) | — | (0.02 | ) | (0.07 | ) | |||||||||||||||
| Net realized gains | (1.69 | ) | — | — | — | — | — | |||||||||||||||||
| Return of capital | — | — | (0.01 | ) | — | (0.00 | ) (3) | — | ||||||||||||||||
| Total distributions | (1.69 | ) | — | (0.03 | ) | — | (0.02 | ) | (0.07 | ) | ||||||||||||||
| Net asset value, end of period | $ | 11.40 | $ | 13.33 | $ | 10.37 | $ | 10.70 | $ | 10.98 | $ | 9.73 | ||||||||||||
| Total return (4) | (2.15 | )% (5) | 28.54 | % | (2.81 | )% | (2.55 | )% | 13.03 | % | 2.85 | % | ||||||||||||
| Net assets, at end of period (000’s) | $ | 20,527 | $ | 16,898 | $ | 16,931 | $ | 22,998 | $ | 27,131 | $ | 33,952 | ||||||||||||
| Ratio of expenses to average net assets (6) | 1.78 | % (7) | 1.83 | % | 1.81 | % | 1.79 | % | 1.77 | % | 1.68 | % | ||||||||||||
| Ratio of net investment income (loss) to average net assets (6,8) | (0.53 | )% (7) | (0.43 | )% | (0.26 | )% (2) | (0.01 | )% | (0.03 | )% | 0.45 | % | ||||||||||||
| Portfolio Turnover Rate | 283 | % (5) | 64 | % | 293 | % | 226 | % | 48 | % | 384 | % | ||||||||||||
| (1) | Per share amounts calculated using the average shares method, which appropriately presents the per share data for the period. |
| (2) | The amount of net investment loss on investment per share for the period ended does not accord with the amounts in the Statements of Operations due to the timing of purchases and sales of Fund shares in relation to fluctuating market values. |
| (3) | Represents less than $0.005 per share. |
| (4) | Total returns are historical in nature and exclude the effect of applicable sales charges and assumes reinvestment of dividends. |
| (5) | Not annualized. |
| (6) | The ratios of expenses and net investment income to average net assets do not reflect the Fund’s proportionate share of income and expenses of underlying investment companies in which the Fund invests. |
| (7) | Annualized. |
| (8) | Recognition of net investment income by the Fund is affected by the timing and declaration of dividends by the underlying investment companies in which the Fund invests. |
The accompanying notes are an integral part of these financial statements.
12
| TACTICAL DIVIDEND AND MOMENTUM FUND |
| NOTES TO FINANCIAL STATEMENTS (Unaudited) |
| January 31, 2022 |
| 1. | ORGANIZATION |
The Tactical Dividend and Momentum Fund (the “Fund”) is a series of shares of beneficial interest of the Two Roads Shared Trust (the “Trust”), a statutory trust organized under the laws of the State of Delaware on June 8, 2012, and registered under the Investment Company Act of 1940, as amended (the “1940 Act”), as an open-end management investment company. The Fund commenced operations on September 9, 2015. The investment objective of the Fund is to provide capital appreciation and current income, and the Fund is diversified.
The Fund offers Class A, Class C, Class I and Class R shares. Class A shares the Fund are offered at net asset value plus a maximum sales charge of 5.75%. Class C, Class I and Class R shares of the Fund are offered at net asset value. Investments of more than $1 million in Class A shares of the Fund are subject to a contingent deferred sales charge of 1.00% of the original purchase price on redemptions made within one year of purchase. Class C shares of the Fund are subject to a contingent deferred sales charge of 1.00% of the original purchase price on redemptions made within one year of purchase. Each share class represents an interest in the same assets of the Fund and classes are identical except for differences in their fees and ongoing service and distribution charges. All classes of shares have equal voting privileges except that each class has exclusive voting rights with respect to its service and/or distribution plans. The Fund’s income, expenses (other than class specific distribution fees) and realized and unrealized gains and losses are allocated proportionately each day based upon the relative net assets of each class.
| 2. | SUMMARY OF SIGNIFICANT ACCOUNTING POLICIES |
The following is a summary of significant accounting policies followed by the Fund in preparation of its financial statements. These policies are in conformity with accounting principles generally accepted in the United States of America (“GAAP”). The preparation of financial statements in conformity with GAAP requires management to make estimates and assumptions that affect the reported amounts of assets and liabilities and disclosure of contingent assets and liabilities at the date of the financial statements and the reported amounts of increases and decreases in net assets from operations during the reporting period. Actual results could differ from those estimates. The Fund is an investment company and accordingly follows the investment company accounting and reporting guidance of the Financial Accounting Standards Board (“FASB”) Accounting Standards Codification Topic 946 “Financial Services – Investment Companies”.
Securities Valuation – Securities listed on an exchange are valued at the last reported sale price at the close of the regular trading session of the primary exchange on the business day the value is being determined, or in the case of securities listed on NASDAQ at the NASDAQ Official Closing Price (“NOCP”). In the absence of a sale, such securities shall be valued at the mean between the current bid and ask prices on the day of valuation. Futures and future options are valued at the final settled price or, in the absence of a settled price, at the last sale price on the day of valuation. Debt securities (other than short-term obligations) are valued each day by an independent pricing service approved by the Trust’s Board of Trustees (the “Board”) based on methods which include consideration of: yields or prices of securities of comparable quality, coupon, maturity and type, indications as to values from dealers, and general market conditions or market quotations from a major market maker in the securities. Investments valued in currencies other than the U.S. dollar are converted to U.S. dollars using exchange rates obtained from pricing services. Short-term debt obligations having 60 days or less remaining until maturity, at time of purchase, may be valued at amortized cost.
Valuation of Underlying Funds – The Fund may invest in portfolios of open-end or closed-end investment companies (the “Underlying Funds”). The Underlying Funds value securities in their portfolios for which market quotations are readily available at their market values (generally the last reported sale price) and all other securities and assets at their fair value to the methods established by the board of directors of the Underlying Funds.
Open-end investment companies are valued at their respective net asset values as reported by such investment companies. The shares of many closed-end investment companies, after their initial public offering, frequently trade at a price per share, which is different than the net asset value per share. The difference represents a market premium or market discount of such shares. There can be no assurance that the market discount or market premium on shares of any closed-end investment company purchased by the Fund will not change.
The Fund may hold securities, such as private investments, interests in commodity pools, other non-traded securities or temporarily illiquid securities, for which market quotations are not readily available or are determined to be unreliable. These securities will be valued using the “fair value” procedures approved by the Board. The Board has delegated execution of these procedures to a fair value committee composed of one or more representatives from each of the (i) Trust, (ii) administrator, and (iii) advisor. The
13
| TACTICAL DIVIDEND AND MOMENTUM FUND |
| NOTES TO FINANCIAL STATEMENTS (Unaudited) (Continued) |
| January 31, 2022 |
committee may also enlist third party consultants such as a valuation specialist at a public accounting firm, valuation consultant or financial officer of a security issuer on an as-needed basis to assist in determining a security-specific fair value. The Board has also engaged a third party valuation firm, as needed, to attend valuation meetings held by the Trust, review minutes of such meetings and report to the Board on a quarterly basis. The Board reviews and considers the determinations reached by the Fair Value Committee’s application of the fair valuation methodologies employed.
Fair Valuation Process – As noted above, the fair value committee is composed of one or more representatives from each of the (i) Trust, (ii) administrator, and (iii) advisor. The applicable investments are valued collectively via inputs from each of these groups. For example, fair value determinations are required for the following securities: (i) securities for which market quotations are insufficient or not readily available on a particular business day (including securities for which there is a short and temporary lapse in the provision of a price by the regular pricing source), (ii) securities for which, in the judgment of the advisor, the prices or values available do not represent the fair value of the instrument. Factors which may cause the advisor to make such a judgment include, but are not limited to, the following: only a bid price or an asked price is available; the spread between bid and asked prices is substantial; the frequency of sales; the thinness of the market; the size of reported trades; and actions of the securities markets, such as the suspension or limitation of trading; (iii) securities determined to be illiquid; (iv) securities with respect to which an event that will affect the value thereof has occurred (a “significant event”) since the closing prices were established on the principal exchange on which they are traded, but prior to the Fund’s calculation of its net asset value. Specifically, interests in commodity pools or managed futures pools are valued on a daily basis by reference to the closing market prices of each futures contract or other asset held by a pool, as adjusted for pool expenses. Restricted or illiquid securities, such as private investments or non-traded securities are valued via inputs from the advisor based upon the current bid for the security from two or more independent dealers or other parties reasonably familiar with the facts and circumstances of the security (who should take into consideration all relevant factors as may be appropriate under the circumstances). If the advisor is unable to obtain a current bid from such independent dealers or other independent parties, the fair value committee shall determine the fair value of such security using the following factors: (i) the type of security; (ii) the cost at date of purchase; (iii) the size and nature of the Fund’s holdings; (iv) the discount from market value of unrestricted securities of the same class at the time of purchase and subsequent thereto; (v) information as to any transactions or offers with respect to the security; (vi) the nature and duration of restrictions on disposition of the security and the existence of any registration rights; (vii) how the yield of the security compares to similar securities of companies of similar or equal creditworthiness; (viii) the level of recent trades of similar or comparable securities; (ix) the liquidity characteristics of the security; (x) current market conditions; and (xi) the market value of any securities into which the security is convertible or exchangeable.
The Fund utilizes various methods to measure the fair value of its investments on a recurring basis. GAAP establishes a hierarchy that prioritizes inputs to valuation methods. The three levels of input are:
Level 1 – Unadjusted quoted prices in active markets for identical assets and liabilities that the Fund has the ability to access.
Level 2 – Observable inputs other than quoted prices included in Level 1 that are observable for the asset or liability, either directly or indirectly. These inputs may include quoted prices for the identical instrument on an inactive market, prices for similar instruments, interest rates, prepayment speeds, credit risk, yield curves, default rates and similar data.
Level 3 – Unobservable inputs for the asset or liability, to the extent relevant observable inputs are not available, representing the Fund’s own assumptions about the assumptions a market participant would use in valuing the asset or liability, and would be based on the best information available.
The availability of observable inputs can vary from security to security and is affected by a wide variety of factors, including, for example, the type of security, whether the security is new and not yet established in the marketplace, the liquidity of markets, and other characteristics particular to the security. To the extent that valuation is based on models or inputs that are less observable or unobservable in the market, the determination of fair value requires more judgment. Accordingly, the degree of judgment exercised in determining fair value is greatest for instruments categorized in Level 3.
The inputs used to measure fair value may fall into different levels of the fair value hierarchy. In such cases, for disclosure purposes, the level in the fair value hierarchy within which the fair value measurement falls in its entirety, is determined based on the lowest level input that is significant to the fair value measurement in its entirety.
14
| TACTICAL DIVIDEND AND MOMENTUM FUND |
| NOTES TO FINANCIAL STATEMENTS (Unaudited) (Continued) |
| January 31, 2022 |
The inputs or methodology used for valuing securities are not necessarily an indication of the risk associated with investing in those securities. The following tables summarize the inputs used as of January 31, 2022 for the Fund’s assets and liabilities measured at fair value:
| Assets * | Level 1 | Level 2 | Level 3 | Total | ||||||||||||
| Exchange Traded Funds | $ | 23,608,171 | $ | — | $ | — | $ | 23,608,171 | ||||||||
| Short-Term Investments | 105,377,488 | — | — | 105,377,488 | ||||||||||||
| Total | $ | 128,985,659 | $ | — | $ | — | $ | 128,985,659 | ||||||||
The Fund did not hold any Level 3 securities during the period.
| * | Refer to the Schedule of Investments for industry classification. |
Security Transactions and Related Income – Security transactions are accounted for on trade date basis. Interest income is recognized on an accrual basis. Discounts are accreted and premiums are amortized on securities purchased over the lives of the respective securities. Dividend income is recorded on the ex-dividend date. Realized gains or losses from sales of securities are determined by comparing the identified cost of the security lot sold with the net sales proceeds.
Dividends and Distributions to Shareholders – Dividends from net investment income are declared and distributed monthly to the Fund. Distributable net realized capital gains are declared and distributed annually. Dividends from net investment income and distributions from net realized gains are recorded on ex dividend date and determined in accordance with federal income tax regulations, which may differ from GAAP. These “book/tax” differences are considered either temporary (i.e., deferred losses, capital loss carry forwards) or permanent in nature. To the extent these differences are permanent in nature, such amounts are reclassified within the composition of net assets based on their federal tax-basis treatment; temporary differences do not require reclassification.
Federal Income Taxes – It is the Fund’s policy to qualify as a regulated investment company by complying with the provisions of the Internal Revenue Code that are applicable to regulated investment companies and to distribute substantially all of its taxable income and net realized gains to shareholders. Therefore, no federal income tax provision is required.
The Fund recognizes the tax benefits of uncertain tax positions only where the position is “more likely than not” to be sustained assuming examination by tax authorities. Management has analyzed the Fund’s tax positions and has concluded that no liability for unrecognized tax benefits should be recorded related to uncertain tax positions taken on returns filed for the open tax years ended 2019-2021, or expected to be taken in the Fund’s July 31, 2022 tax return. The Fund identifies its major tax jurisdictions as U.S. Federal and Ohio (Nebraska in years prior to 2019), and foreign jurisdictions where the Fund makes significant investments. The Fund is not aware of any tax positions for which it is reasonably possible that the total amounts of unrecognized tax benefits will change materially in the next twelve months.
Expenses – Expenses of the Trust that are directly identifiable to a specific fund are charged to that fund. Expenses, which are not readily identifiable to a specific fund, are allocated in such a manner as deemed equitable, taking into consideration the nature and type of expense and the relative sizes of the funds in the Trust.
Indemnification – The Trust indemnifies its officers and trustees for certain liabilities that may arise from the performance of their duties to the Trust. Additionally, in the normal course of business, the Fund enters into contracts that contain a variety of representations and warranties and which provide general indemnities. The Fund’s maximum exposure under these arrangements is unknown, as this would involve future claims that may be made against the Fund that have not yet occurred. However, the Fund expects the risk of loss due to these warranties and indemnities to be remote.
| 3. | PRINCIPAL INVESTMENT RISKS |
The Fund’s investments expose the Fund to various risks, certain of which are discussed below. The Fund’s prospectus and statement of additional information (“SAI”) include a full listing of risks associated with the Fund’s investments. These risks include but are not limited to cash positions risk, cybersecurity risk, emerging markets risk, equity risk, fixed income securities risk, focus risk, foreign (non-U.S.) investment risk, healthcare sector risk, hedging transactions risk, high-yield risk, investment companies and ETFs risk, issuer-specific risk, leveraging risk, LIBOR risk, large capitalization risk, liquidity risk, management risk, market events risk, market risk, portfolio turnover risk, real estate securities risk, REIT risk, rules-based strategy risk, sector risk, securities lending risk, short sales risk, technology securities risk and volatility risk.
15
| TACTICAL DIVIDEND AND MOMENTUM FUND |
| NOTES TO FINANCIAL STATEMENTS (Unaudited) (Continued) |
| January 31, 2022 |
Equity Risk – Equity securities are susceptible to general market fluctuations and volatile increases and decreases in value as market confidence in and perceptions of their issuers change. Factors that may influence the price of equity securities include developments affecting a specific company or industry, or the changing economic, political or market conditions.
| ● | Dividend-Yielding Companies Risk. A company that has historically paid regular dividends to shareholders may decrease or eliminate dividend payments in the future, which could result in a decrease in the value of the company’s stock and lower performance of the Fund. |
| ● | Momentum Investing Risk. An investment in securities with positive momentum entails investing in securities that have had above-average recent returns. These securities may experience greater price volatility than other equity securities, which may negatively impact the investment performance of the Fund. |
Cash Positions Risk – The Fund may hold a significant position in cash, cash equivalent securities or U.S. treasury investments. When the Fund’s investment in cash, cash equivalent securities or U.S. treasury investments increases, the Fund may not participate in market advances or declines to the same extent that it would if the Fund were more fully invested.
Investment Companies and ETFs Risk – When the Fund invests in other investment companies, including ETFs, it will bear additional expense based upon its pro rata share of the other investment company’s or ETF’s operating expense, including management fees in addition to those paid by the Fund. The risk of owning an investment company or ETF generally reflects the risks of owning the underlying investments held by the investment company or ETF. the Fund also will incur brokerage costs when it purchases and sells closed end funds and ETFs.
Securities Lending Risk – The Fund may lend portfolio securities to institutions, such as banks and certain broker -dealers. the Fund may experience a loss or delay in the recovery of its securities if the borrowing institution breaches its agreement with the Fund. In certain market conditions, the portfolio of the Fund’s securities on loan may be significant and may magnify the risk of such a loss or delay. The risks associated with lending portfolio securities, as with other extensions of secured credit, include, but are not limited to, possible delays in receiving additional collateral or in the recovery of the securities loaned, possible loss of rights in the collateral should the borrower fail financially, as well as risk of loss in the value of the collateral or the value of the investments made with the collateral. In certain market conditions, the portion of the fund’s securities on loan may be significant and may magnify the risk of such a loss of delay.
Volatility Risk – The Fund or an underlying fund may have investments that appreciate or decrease significantly in value over short periods of time. The value of an investment in the Fund’s portfolio may fluctuate due to events or factors that affect markets generally or that affect a particular investment industry or sector. The value of an investment in the Fund’s portfolio may also be more volatile than the market as a whole. This volatility may affect the Fund’s net asset value per share, including by causing it to experience significant increases or declines in value over short periods of time. Events or financial circumstances affecting individual investments, industries or sectors may increase the volatility of the Fund.
Market Risk – Overall market risk may affect the value of individual instruments in which the Fund invest. The Fund is subject to the risk that the securities markets will move down, sometimes rapidly and unpredictably, based on overall economic conditions and other factors, which may negatively affect the Fund’s performance. Factors such as domestic and foreign (non-U.S.) economic growth and market conditions, real or perceived adverse economic or political conditions, inflation, changes in interest rate levels, lack of liquidity in the bond and other markets, volatility in the securities markets, adverse investor sentiment affect the securities markets and political events affect the securities markets. Securities markets also may experience long periods of decline in value. When the value of the Fund’s investments goes down, your investment in the Fund decreases in value and you could lose money.
Local, state, regional, national or global events such as war, acts of terrorism, the spread of infectious illness or other public health issues, recessions, or other events could have a significant impact on the Fund and its investments and could result in decreases to the Fund’s net asset value. Political, geopolitical, natural and other events, including war, terrorism, trade disputes, government shutdowns, market closures, natural and environmental disasters, epidemics, pandemics and other public health crises and related events and governments’ reactions to such events have led, and in the future may lead, to economic uncertainty, decreased economic activity, increased market volatility and other disruptive effects on U.S. and global economies and markets. Such events may have significant adverse direct or indirect effects on the Fund and its investments. For example, a widespread health crisis such as a global pandemic could cause substantial market volatility, exchange trading suspensions and closures, impact the ability to complete redemptions, and affect Fund performance. A health crisis may exacerbate other pre-existing political, social and economic risks. In
16
| TACTICAL DIVIDEND AND MOMENTUM FUND |
| NOTES TO FINANCIAL STATEMENTS (Unaudited) (Continued) |
| January 31, 2022 |
addition, the increasing interconnectedness of markets around the world may result in many markets being affected by events or conditions in a single country or region or events affecting a single or small number of issuers.
COVID-19 has resulted in travel restrictions, closed international borders, enhanced health screenings at ports of entry and elsewhere, disruption of and delays in healthcare service preparation and delivery, prolonged quarantines, cancellations, business and school closings, supply chain disruptions, and lower consumer demand, as well as general concern and uncertainty. The impact of COVID-19, and other infectious illness outbreaks that may arise in the future, could adversely affect the economies of many nations or the entire global economy, individual issuers and capital markets in ways that cannot necessarily be foreseen.
| 4. | INVESTMENT TRANSACTIONS |
The cost of purchases and proceeds from the sale of securities, other than short-term investments, for the six months ended January 31, 2022, amounted to $268,086,632 and $285,888,310, respectively.
| 5. | INVESTMENT ADVISORY AGREEMENT AND TRANSACTIONS WITH RELATED PARTIES |
Hanlon Investment Management, Inc. serves as the Fund’s Investment Advisor (the “Advisor”). Pursuant to an Investment Advisory Agreement with the Fund, the Advisor, under the oversight of the Board, directs the daily operations of the Fund and supervises the performance of administrative and professional services provided by others. As compensation for its services and the related expenses borne by the Advisor, the Fund pays the Advisor an investment advisory fee, computed and accrued daily and paid monthly, at an annual rate of 1.00% of the Fund’s average daily net assets. For the six months ended January 31, 2022, the Advisor earned advisory fees of $718,799.
The Advisor has contractually agreed to reduce its fees and/or absorb expenses of the Fund (the “Waiver Agreement”), until at least November 28, 2022, to ensure that total annual operating expenses of the Fund after fee waiver and/or reimbursement (exclusive of any front-end or contingent deferred loads; brokerage fees and commissions; expenses of other investment companies in which the Fund may invest (“acquired fund fees and expenses”); borrowing costs, such as interest and dividend expense on securities sold short; taxes; and extraordinary expenses, such as litigation expenses) will not exceed 1.70%, 2.45%, 1.45% and 1.85% of the Fund’s average daily net assets for Class A, Class C, Class I and Class R shares, respectively. This Waiver Agreement may be terminated with respect to the Fund by the Board of Trustees on 60 days’ written notice to the Advisor. These expense reimbursements are subject to possible recoupment from the Fund in future years on a rolling three-year basis (within three years after the fees have been waived or reimbursed) if such recoupment can be achieved without exceeding the foregoing expense limits as well as any expense limitation that was in effect at the time the waiver or reimbursement was made. No recoupment will be paid to the Advisor in any fiscal quarter unless the Board has determined in advance that such recoupment is in the best interest of the Fund and its shareholders. As of January 31, 2022 there are no previously waived fees available for recoupment.
Distributor – The distributor of the Fund is Northern Lights Distributors, LLC (the “Distributor”). The Board has adopted, on behalf of the Fund, the Trust’s Master Distribution and Shareholder Servicing Plans for Class A, Class C, and Class R shares (the “Plans”), as amended, pursuant to Rule 12b-1 under the 1940 Act, to pay for certain distribution activities and shareholder services. Under the Plans, the Fund may pay 0.25% per year of the average daily net assets of Class A shares, 1.00% of the average daily net assets for Class C shares and 0.40% of the average daily net assets for Class R shares for such distribution and shareholder service activities. For the six months ended January 31, 2022, the Tactical Dividend and Momentum Fund incurred distribution fees of $11,235, $1,739 and $41,768 for Class A, Class C and Class R shares, respectively.
The Distributor acts as the Fund’s principal underwriter in a continuous public offering of the Fund’s shares. During the six months ended January 31, 2022, the Distributor did not receive any underwriting commissions for sales of the Fund’s shares.
In addition, certain affiliates of the Distributor provide services to the Fund as follows:
Ultimus Fund Services, LLC (“UFS”) – UFS, an affiliate of the Distributor, provides administration, fund accounting, and transfer agent services to the Trust. Pursuant to separate servicing agreements with UFS, the Fund pays UFS customary fees for providing administration, fund accounting and transfer agency services to the Fund. Certain officers of the Trust are also officers of UFS, and are not paid any fees directly by the Fund for serving in such capacities.
17
| TACTICAL DIVIDEND AND MOMENTUM FUND |
| NOTES TO FINANCIAL STATEMENTS (Unaudited) (Continued) |
| January 31, 2022 |
Northern Lights Compliance Services, LLC (“NLCS”) – NLCS, an affiliate of UFS and the Distributor, provides a Chief Compliance Officer to the Trust, as well as related compliance services, pursuant to a consulting agreement between NLCS and the Trust. Under the terms of such agreement, NLCS receives customary fees from the Fund.
BluGiant, LLC (“BluGiant”), an affiliate of UFS and the Distributor, provides EDGAR conversion and filing services as well as print management services for the Fund on an ad-hoc basis. For the provision of these services, BluGiant receives customary fees from the Fund.
| 6. | AGGREGATE UNREALIZED APPRECIATION AND DEPRECIATION – TAX BASIS |
| Gross | Gross | Net Unrealized | ||||||||||||
| Tax | Unrealized | Unrealized | Appreciation | |||||||||||
| Cost | Appreciation | Depreciation | (Depreciation) | |||||||||||
| $ | 128,792,764 | $ | 1,056,503 | $ | (863,608 | ) | $ | 192,895 | ||||||
| 7. | DISTRIBUTIONS TO SHAREHOLDERS AND TAX COMPONENTS OF CAPITAL |
The tax character of distributions paid for the years ended July 31, 2021 and July 31, 2020 was as follows:
| For the year ended July 31, 2021: | ||||||||||||||||||
| Ordinary | Long-Term | Return | Tax-Exempt | |||||||||||||||
| Income | Capital Gains | of Capital | Income | Total | ||||||||||||||
| $ | — | $ | — | $ | — | $ | — | $ | — | |||||||||
| For the year ended July 31, 2020: | ||||||||||||||
| Ordinary | Long-Term | Return | ||||||||||||
| Income | Capital Gains | of Capital | Total | |||||||||||
| $ | 652,658 | $ | — | $ | 69,309 | $ | 721,967 | |||||||
As of July 31, 2021, the components of accumulated earnings/(deficit) on a tax basis were as follows:
| Undistributed | Undistributed | Undistributed | Post October Loss | Capital Loss | Other | Unrealized | Total | |||||||||||||||||||||||
| Ordinary | Ordinary | Long-Term | and | Carry | Book/Tax | Appreciation/ | Accumulated | |||||||||||||||||||||||
| Tax-Exempt Income | Income | Capital Gains | Late Year Loss | Forwards | Differences | (Depreciation) | Earnings/(Deficits) | |||||||||||||||||||||||
| $ | — | $ | — | $ | 7,376,173 | $ | (200,825 | ) | $ | — | $ | — | $ | 11,952,380 | $ | 19,127,728 | ||||||||||||||
The difference between book basis and tax basis unrealized appreciation/(depreciation), accumulated net investment loss and accumulated net realized losses from investments is primarily attributable to the tax deferral of losses on wash sales.
Late year losses incurred after December 31 within the fiscal year are deemed to arise on the first business day of the following fiscal year for tax purposes. The Fund incurred and elected to defer such late year losses of $200,825.
At July 31, 2021, the Fund had capital loss carry forwards for federal income tax purposes available to offset future capital gains and utilized capital loss carryforwards as follows:
| Non-Expiring | ||||||||||||||
| Short-Term | Long-Term | Total | CLCF Utilized | |||||||||||
| $ | — | $ | — | $ | — | $ | 3,369,166 | |||||||
18
| TACTICAL DIVIDEND AND MOMENTUM FUND |
| NOTES TO FINANCIAL STATEMENTS (Unaudited) (Continued) |
| January 31, 2022 |
Permanent book and tax differences, primarily attributable to the book/tax basis treatment of net operating losses and tax return updates of return of capital distributions from underlying investment companies, resulted in reclassifications for the fiscal year ended July 31, 2021 as follows:
| Paid | ||||||
| In | Accumulated | |||||
| Capital | Earnings (Losses) | |||||
| $ | (553,188 | ) | $ | 553,188 | ||
| 8. | CONTROL OWNERSHIP |
The beneficial ownership, either directly or indirectly, of more than 25% of the voting securities of the Fund creates a presumption of control of the Fund, under Section 2(a)9 of the 1940 Act. As of January 31, 2022, Pershing LLC held 75.34% of the voting securities of the Fund for the benefit of others.
| 9. | SECURITIES LENDING |
Under an agreement with the BNY Mellon Corp. (“BNY Mellon”), the Fund can lend their portfolio securities to brokers, dealers and other financial institutions approved by the Board to earn additional income. Loans are collateralized by cash, in an amount at least equal to the market value of the securities loaned plus accrued interest, which is invested in highly liquid, short-term instruments such as repurchase agreements collateralized by U.S. Government securities and money market funds in accordance with the Fund’s security lending procedures. A portion of the income generated by the investment in the collateral, net of any rebates paid by BNY Mellon to the borrowers is remitted to BNY Mellon as lending agent, and the remainder is paid to the Fund. The Fund continue to receive interest or dividends on the securities loaned. The Fund has the right under the Master Securities Lending Agreement to recover the securities from the borrower on demand; if the borrower fails to deliver the securities on a timely basis, the Fund could experience delays or losses on recovery. Additionally, the Fund is subject to the risk of loss from investments made with the cash received as collateral. The Fund manages credit exposure arising from these lending transactions by, in appropriate circumstances, entering into master netting agreements and collateral agreements with third party borrowers that provide in the event of default (such as bankruptcy or a borrower’s failure to pay or perform), the right to net a third party borrower’s rights and obligations under such agreement and liquidate and set off collateral against the net amount owed by the counterparty.
At January 31, 2022, the Fund had loaned securities and received collateral for the loan. The Fund received compensation relating to the lending of the Fund’s securities.
The market values of loaned securities and collateral and percentage of total investment income the Fund received from the investment of cash collateral retained by the lending agent, BNY Mellon, were as follows:
| Market Value of | Market Value of | Percentage of Total | ||||||
| Loaned Securities | Collateral | Investment Income | ||||||
| $ | 9,064,581 | $ | 9,201,684 | 1.49% | ||||
The following table sets forth the remaining contractual maturity of the collateral held as of January 31, 2022:
| Remaining Contractual Maturity of the Collateral Held as of January 31, 2022 | ||||||||||||||||||||
| Overnight and | Up to | Greater than | ||||||||||||||||||
| Continuous | 30 Days | 30-90 days | 90 days | Total | ||||||||||||||||
| U.S. Government | $ | — | $ | — | $ | — | $ | 9,201,684 | $ | 9,201,684 | ||||||||||
| Total securities lending collateral | $ | — | $ | — | $ | — | $ | 9,201,684 | $ | 9,201,684 | ||||||||||
The fair value of the securities loaned for the Fund totaled $9,065,581 at January 31, 2022. The securities loaned are noted in the Schedules of Investments. At January 31, 2022, the Fund received non-cash collateral of $9,201,684.
19
| TACTICAL DIVIDEND AND MOMENTUM FUND |
| NOTES TO FINANCIAL STATEMENTS (Unaudited) (Continued) |
| January 31, 2022 |
| 10. | UNDERLYING INVESTMENT IN OTHER INVESTMENT COMPANIES |
The Fund currently invests a portion of its assets in the Morgan Stanley Institutional Liquidity Funds - Treasury Securities Portfolio (“Morgan Stanley Portfolio”). The Fund may redeem its investments from the Morgan Stanley Portfolio at any time if the Adviser determines that it is in the best interest of the Fund and its shareholders to do so. The performance of the Fund will be directly affected by the performance of the Morgan Stanley Portfolio. The financial statements of the Morgan Stanley Portfolio, including the portfolios of investments, can be found at the Securities and Exchange Commission’s website www.sec.gov and should be read in conjunction with the Fund’s financial statements. As of January 31, 2022, the percentage of the Fund’s net assets invested in the Morgan Stanley Portfolio was 73.8%.
| 11. | SUBSEQUENT EVENTS |
Subsequent events after the date of the Statements of Assets and Liabilities have been evaluated through the date the financial statements were issued. Management has determined that no events or transactions occurred requiring adjustment or disclosure in the financial statements.
20
| Tactical Dividend and Momentum |
| EXPENSE EXAMPLE (Unaudited) |
| January 31, 2022 |
As a shareholder of the Fund, you incur two types of costs: (1) transaction costs, including sales charges (loads) on purchases and deferred sales charges on certain redemptions; (2) ongoing costs, including management fees; distribution and/or service (12b-1) fees; and other Fund expenses. This example is intended to help you understand your ongoing costs (in dollars) of investing in the Fund and to compare these costs with the ongoing costs of investing in other mutual funds.
The example is based on an investment of $1,000 invested at the beginning of the period and held for the entire period from August 1, 2021 through January 31, 2022.
Actual Expenses
The “Actual Expenses” line in the table below provides information about actual account values and actual expenses. You may use the information below; together with the amount you invested, to estimate the expenses that you paid over the period. Simply divide your account value by $1,000 (for example, an $8,600 account value divided by $1,000 = 8.6), then multiply the result by the number in the table under the heading entitled “Expenses Paid During Period” to estimate the expenses you paid on your account during this period.
Hypothetical Example for Comparison Purposes
The “Hypothetical” line in the table below provides information about hypothetical account values and hypothetical expenses based on the Fund’s actual expense ratio and an assumed rate of return of 5% per year before expenses, which is not the Fund’s actual return. The hypothetical account values and expenses may not be used to estimate the actual ending account balances or expenses you paid for the period. You may use this information to compare this 5% hypothetical example with the 5% hypothetical examples that appear in the shareholder reports of other funds.
Please note that the expenses shown in the table are meant to highlight your ongoing costs only and do not reflect any transactional costs, such as sales charges (loads), or redemption fees. Therefore, the table is useful in comparing ongoing costs only, and will not help you determine the relative total costs of owning different funds. In addition, if these transactional costs were included, your costs would have been higher.
| Hypothetical | ||||||||||||||
| Actual | (5% return before expenses) | |||||||||||||
| Fund’s | Beginning | Ending | Ending | |||||||||||
| Annualized | Account | Account | Expenses | Account | Expenses | |||||||||
| Expense | Value | Value | Paid During | Value | Paid During | |||||||||
| Ratio | 8/1/21 | 1/31/22 | Period * | 1/31/22 | Period * | |||||||||
| Tactical Dividend and Momentum Fund – Class A | 1.63% | $1,000.00 | $979.60 | $8.13 | $1,016.99 | $8.29 | ||||||||
| Tactical Dividend and Momentum Fund – Class C | 2.38% | $1,000.00 | $976.40 | $11.86 | $1,013.21 | $12.08 | ||||||||
| Tactical Dividend and Momentum Fund – Class I | 1.38% | $1,000.00 | $980.20 | $6.89 | $1,018.25 | $7.02 | ||||||||
| Tactical Dividend and Momentum Fund – Class R | 1.78% | $1,000.00 | $978.50 | $8.88 | $1,016.23 | $9.05 | ||||||||
| * | Expenses are equal to the Fund’s annualized expense ratio, multiplied by the number of days in the period (184) divided by the number of days in the fiscal year (365). |
21
PROXY VOTING POLICY
Information regarding how the Funds voted proxies relating to portfolio securities for the most recent twelve month period ended June 30 as well as a description of the policies and procedures that the Fund uses to determine how to vote proxies is available without charge, upon request, by calling 1-844-828-3212 or by referring to the Securities and Exchange Commission’s (“SEC”) website at http://www.sec.gov.
PORTFOLIO HOLDINGS
The Fund files its complete schedule of portfolio holdings with the SEC for the first and third quarters of each fiscal year as an exhibit to its reports on Form N-PORT within sixty days after the end of the period. Form N-PORT reports are available on the SEC’s website at http://www.sec.gov. The information on reports and Form N-PORT is available without charge, upon request, by calling 1-844-828-3212.
| INVESTMENT ADVISOR |
| Hanlon Investment Management, Inc. |
| 3393 Bargaintown Road |
| Egg Harbor Township, NJ 08234 |
| ADMINISTRATOR |
| Ultimus Fund Solutions, LLC |
| 225 Pictoria Dr, Suite 450 |
| Cincinnati, Ohio 45246 |
| TD&M-SAR22 |
(a) Include a copy of the report transmitted to stockholders pursuant to Rule 30e-1 under the Act (17 CFR 270.30e-1).
(b) Include a copy of each notice transmitted to stockholders in reliance on Rule 30e-3 under the Act (17 CFR 270.30e-3) that contains disclosures specified by paragraph (c)(3) of that rule.
Item 2. Code of Ethics. Not applicable.
Item 3. Audit Committee Financial Expert. Not applicable.
Item 4. Principal Accountant Fees and Services. Not applicable.
Item 5. Audit Committee of Listed Registrants. Not applicable to open-end investment companies.
Item 6. Investments. Schedule of investments in securities of unaffiliated issuers is included under Item 1.
Item 7. Disclosure of Proxy Voting Policies and Procedures for Closed-End Management Investment Companies. Not applicable to open-end investment companies.
Item 8. Portfolio Managers of Closed-End Management Investment Companies. Not applicable to open-end investment companies.
Item 9. Purchases of Equity Securities by Closed-End Management Investment Company and Affiliated Purchasers. Not applicable to open-end investment companies.
Item 10. Submission of Matters to a Vote of Security Holders. None
Item 11. Controls and Procedures.
(a) Based on an evaluation of the Registrant’s disclosure controls and procedures as of a date within 90 days of filing date of this Form N-CSR, the principal executive officer and principal financial officer of the Registrant have concluded that the disclosure controls and procedures of the Registrant are reasonably designed to ensure that the information required in filings on Form N-CSR is recorded, processed, summarized, and reported by the filing date, including that information required to be disclosed is accumulated and communicated to the Registrant’s management, including the Registrant’s principal executive officer and principal financial officer, as appropriate to allow timely decisions regarding required disclosure.
(b) There were no significant changes in the Registrant’s internal control over financial reporting that occurred during the Registrant’s last fiscal half-year that have materially affected, or are reasonably likely to materially affect, the Registrant’s internal control over financial reporting.
Item 12. Disclosure of Securities Lending Activities for Closed-End Management Investment Companies.
Not applicable to open-end investment companies.
Item 13. Exhibits.
(a)(1) Not applicable.
(a)(3) Not applicable for open-end investment companies.
SIGNATURES
Pursuant to the requirements of the Securities Exchange Act of 1934 and the Investment Company Act of 1940, the registrant has duly caused this report to be signed on its behalf by the undersigned, thereunto duly authorized.
(Registrant) Two Roads Shared Trust
By (Signature and Title)
/s/ James Colantino
James Colantino, Principal Executive Officer/President
Date 4/6/22
Pursuant to the requirements of the Securities Exchange Act of 1934 and the Investment Company Act of 1940, this report has been signed below by the following persons on behalf of the registrant and in the capacities and on the dates indicated.
By (Signature and Title)
/s/ James Colantino
James Colantino, Principal Executive Officer/President
Date 4/6/22
By (Signature and Title)
/s/ Laura Szalyga
Laura Szalyga, Principal Financial Officer/Treasurer
Date 4/6/22