united states
securities and exchange commission
washington, d.c. 20549
form n-csr
certified shareholder report of registered management
investment companies
Investment Company Act file number 811-22718
Two Roads Shared Trust
(Exact name of registrant as specified in charter)
225 Pictoria Drive, Suite 450 Cincinnati, OH 45246
(Address of principal executive offices) (Zip code)
Richard Malinowski, Gemini Fund Services, LLC.
4221 North 203rd St. Suite 100 Elkhorn, Nebraska 68022-3474
(Name and address of agent for service)
Registrant's telephone number, including area code: 631-470-2719
Date of fiscal year end: 4/30
Date of reporting period: 4/30/22
ITEM 1. REPORTS TO SHAREHOLDERS.
HOLBROOK INCOME FUND

Class I Shares (HOBIX)
Investor Class Shares (HOBEX)
Class A Shares (HOBAX)
| Annual Report |
| April 30, 2022 |
Advised by:
Holbrook Holdings, Inc.
1032 Windy Elm Drive
Smyrna, GA 30082
www.holbrookholdings.com
1-877-345-8646
Distributed by Northern Lights Distributors, LLC
Member FINRA
Holbrook Income Fund Annual Shareholder Letter
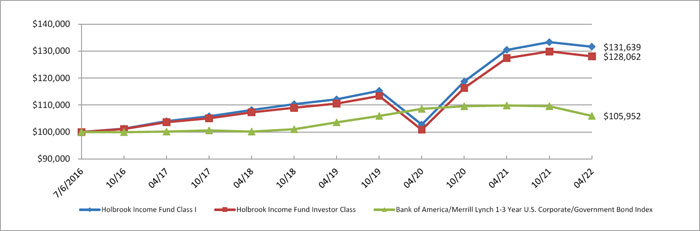
The Holbrook Income Fund (the “Fund”) remains committed to pursuing its investment objectives of providing its shareholders current income and capital preservation in a rising interest rate environment. To these ends, our trailing performance is as follows: For the 12-month reporting period ended April 30, 2022, the Holbrook Income Fund Class I had a one-year return of .92% net of fees versus its benchmark, the Bank of America/Merrill Lynch 1-3 Year U.S. Corporate/Government Bond Index1, which returned -3.56% over the same time-period. From its inception date of July 6, 2016 to April 30, 2022, the Holbrook Income Fund had an annualized gain of 4.84% versus its benchmark which had an annualized return of 1.00% for that same period.
Inflation and a hawkish pivot by the Federal Reserve drove the performance of most asset classes over the last year. We began the fiscal year with most macro forecasters and Federal Reserve members viewing inflation as temporary and transitory. By the end of the year that view had changed and the Fed indicated that its near-term mandate was to fight inflation. As such, yields across the curve were higher, and considerably so. The two-year treasury yield increased from 16 bps to 271 bps over the course of the year: the five- year yield increased 210 bps, the ten-year 130 bps, and the thirty-year 170 bps. High yield corporate spreads (as measured by the Bloomberg US Corporate High Yield Average OAS Index) were wider – increasing from 2.91% at the beginning of the year to 3.79% on April 30, 2022. Investment grade corporate spreads increased from 0.88% to 1.35%. Given higher treasury yields and wider corporate spreads it was a difficult year for corporate bonds. Nevertheless, our higher coupons and exposure to floating rate securities enabled us to finish the year positive and outperform our benchmark by 459 bps.
Looking forward, it’s our opinion that the U.S. economy is in its middle stages of recovery and will likely experience average growth over the next 12 months. Structurally, we believe that inflation will be higher over the next ten years relative to the last couple of decades, but that near-term higher inflation readings are the result of supply chain disruptions emanating from the Covid-19 Global shutdown and the Russo-Ukrainian War. Much of the recent spike is transitory and the fixed income markets have priced-in an overly-hawkish Fed. We expect the Federal Reserve to hike the Fed Funds rate to 2% and then pause prior to midterm elections. We also expect inflation to begin to moderate as supply lines re-open and high food and energy prices create demand destruction in discretionary spending. These trends will likely allow the Federal Reserve to tighten more gradually. Meanwhile, the first $2 Trillion in Central Bank Balance Sheet contraction will be sterilized by decreases in their Reverse Repo program, which has already removed liquidity from the market, in our opinion. We will continue to gravitate towards highly-rated Collateralized Loan Obligation (CLO) tranches that are amortizing quickly and have short weighted average lives. In the corporate bond market, we are finding investment grade issues with three-to- four-year maturities that offer attractive yields. And finally, our high yield exposure is, and will continue to be, in commodity related industries, specifically coal and oil and gas, where cash flow metrics continue to improve.
Thank you for your support of the Holbrook Income Fund,

Scott Carmack
CEO Holbrook Holdings Inc.
Portfolio Manager
The views in this report are those of the Fund’s management. This report contains certain forward-looking statements about factors that may affect the performance of the Fund in the future. These statements are based on the Fund’s management’s predictions and expectations concerning certain future events such as the performance of the economy as a whole and of specific industry sectors. Management believes these forward-looking statements are reasonable, although they are inherently uncertain and difficult to predict.
| 1 | The Bank of America /Merrill Lynch 1-3 Year U.S. Corporate/Government Bond Index - The Bank of America /Merrill Lynch 1-3 Year U.S. Corporate/Government Bond Index is a subset of the Bank of America Merrill Lynch U.S. Government/Corporate Index and tracks the performance of investment-grade debt securities with a remaining term to final maturity of less than 3 years. Investors cannot invest directly in an index. Index returns are gross of any fees, brokerage commissions or other expenses of investing. |
499-NLD-05312022
1
| Holbrook Income Fund |
| Portfolio Review (Unaudited) |
| April 30, 2022 |
The Fund’s performance figures* for each period ended April 30, 2022, compared to its benchmark:
| Annualized | Annualized | Annualized | ||
| 1 year | 5 Year Return | Since Inception (a) | Since Inception (b) | |
| Class I | 0.92% | 4.82% | 4.84% | N/A |
| Investor Class | 0.52% | 4.33% | 4.34% | N/A |
| Class A | N/A | N/A | N/A | -0.84% |
| Class A with load | N/A | N/A | N/A | -2.12% |
| Bank of America/Merrill Lynch 1-3 Year U.S. Corporate/Government Bond Index (c) | -3.56% | 1.13% | 1.00% | -3.64% |
| * | The performance data quoted here represents past performance. Current performance may be lower or higher than the performance data quoted above. Investment return and principal value will fluctuate, so that shares, when redeemed, may be worth more or less than their original cost. The returns shown do not reflect the deduction of taxes that a shareholder would pay on Fund distributions or on the redemptions of Fund shares. Past performance is no guarantee of future results. Per the fee table in the prospectus dated August 31, 2021 the Fund’s total annual operating expenses are 1.14% for Class I, 1.64% for Investor Class and 1.39% for Class A shares. The Fund’s advisor has contractually agreed to reduce the Fund’s fees and/or absorb expenses of the Fund until at least September 1, 2022 to ensure that total annual Fund operating expenses after fee waiver and reimbursement (exclusive of any front-end or contingent deferred loads; brokerage fees and commissions; acquired fund fees and expenses, borrowing costs (such as interest and dividend expense on securities sold short); taxes; and extraordinary expenses (such as litigation) will not exceed 1.30%, 1.80% and 1.55% of average daily net assets attributable to Class I shares, Investor Class shares and Class A shares, respectively. This agreement may be terminated by the Fund’s Board of Trustees on 60 days’ written notice to the advisor. These fee waivers and expense reimbursements are subject to possible recoupment from the Fund in future years on a rolling three year basis (within the three years after the fees have been waived or reimbursed) if such recapture can be achieved within the foregoing expense limits as well as any expense limitation that was in effect at the time the waiver or reimbursement was made. For performance information current to the most recent month-end, please call toll-free 1-877-345-8646 or visit www.holbrookholdings.com. |
| (a) | Inception date is July 6, 2016 for Class I and Investor Class. |
| (b) | Inception date is July 23, 2021 for Class A. |
| (c) | Bank of America/Merrill Lynch 1-3 Year U.S. Corporate/Government Bond Index : The index is a subset of the Bank of America Merrill Lynch U.S. Government/Corporate Index and tracks the performance of investment-grade debt securities with a remaining term to final maturity of less than 3 years. Investors cannot invest directly in an index. Index returns are gross of any fees, brokerage commissions or other expenses of investing. |
Comparison of the Change in Value of a $100,000 Investment
| Top 10 Holdings by Industry | % of Net Assets | |||
| Asset Management | 27.4 | % | ||
| CLO | 13.1 | % | ||
| Non Agency CMBS | 12.8 | % | ||
| Specialty Finance | 12.4 | % | ||
| Oil & Gas Producers | 3.8 | % | ||
| Other ABS | 3.4 | % | ||
| Commercial Support Services | 3.0 | % | ||
| Metals & Mining | 2.8 | % | ||
| Institutional Financial Services | 2.4 | % | ||
| Real Estate Services | 2.1 | % | ||
| Other Assets Less Liabilities | 16.8 | % | ||
| 100.0 | % | |||
Please refer to the Schedule of Investments in this report for a detailed analysis of the Fund’s holdings.
2
| Holbrook Income Fund |
| Schedule of Investments |
| April 30, 2022 |
| Shares | Spread | Coupon % | Maturity | Fair Value | ||||||||||
| PREFERRED STOCK - 3.3% | ||||||||||||||
| ASSET MANAGEMENT - 0.4% | ||||||||||||||
| 75,200 | Gladstone Investment Corp. | 5.000 | 5/1/2026 | $ | 1,864,960 | |||||||||
| 40,413 | RiverNorth Specialty Finance Corp. | 5.875 | 10/31/2024 | 1,033,765 | ||||||||||
| 2,898,725 | ||||||||||||||
| INDUSTRIAL INTERMEDIATE PRODUCTS - 0.2% | ||||||||||||||
| 76,303 | Steel Partners Holdings, L.P. | 6.000 | 2/7/2026 | 1,825,931 | ||||||||||
| REAL ESTATE SERVICES - 2.1% | ||||||||||||||
| 200,000 | Greystone SDOF Preferred Equity, LLC ** | 6.750 | 12/23/2025 | 5,000,000 | ||||||||||
| 6,680 | UIRC-GSA International LLC ** | 6.000 | ++ | Perpetual | 6,947,200 | |||||||||
| 3,000 | UIRC-GSA International LLC ** | 6.500 | ++ | Perpetual | 3,120,000 | |||||||||
| 15,067,200 | ||||||||||||||
| REIT - 0.4% | ||||||||||||||
| 122,000 | Vinebrook Homes Trust, Inc. **^ | 6.500 | 10/7/2027 | 3,092,700 | ||||||||||
| SPECIALTY FINANCE - 0.2% | ||||||||||||||
| 12,000 | Priority Income Fund, Inc. | 6.250 | 6/30/2026 | 295,201 | ||||||||||
| 35,000 | Priority Income Fund, Inc. | 6.000 | 12/31/2026 | 867,475 | ||||||||||
| 1,162,676 | ||||||||||||||
| TOTAL PREFERRED STOCK (Cost - $23,712,970) | 24,047,232 | |||||||||||||
| Principal | ||||||||||||||
| ASSET BACKED SECURITIES - 33.6% | ||||||||||||||
| AUTO LOAN - 0.4% | ||||||||||||||
| $ | 1,714,041 | Luxury Lease Partners Auto Lease Trust 2019-ARC1 ** | 8.000 | 12/15/2026 | 1,713,895 | |||||||||
| 1,250,000 | Luxury Lease Partners Auto Lease Trust 2021-ARC2 ** | 7.000 | 7/15/2027 | 1,210,903 | ||||||||||
| 2,924,798 | ||||||||||||||
| CLO - 13.1% | ||||||||||||||
| 400,000 | Anchorage Capital CLO 2019-11A E Ltd. ** | 3 Month LIBOR + 7.050% | 8.186 | + | 7/22/2032 | 387,068 | ||||||||
| 2,500,000 | Avery Point IV CLO 2014-1AD Ltd. ** | 3 Month LIBOR + 5.200% | 4.684 | + | 4/25/2026 | 2,501,158 | ||||||||
| 10,000,000 | Brightwood Capital MM CLO 2021-2A B2 Ltd. ** | 2.800 | 11/15/2030 | 9,576,340 | ||||||||||
| 3,000,000 | Brightwood Capital MM CLO 2021-2A C1 Ltd. ** | 3 Month LIBOR + 2.900% | 3.944 | + | 11/15/2030 | 2,976,588 | ||||||||
| 1,000,000 | Brightwood Capital MM CLO 2021-2A D Ltd. ** | 3 Month LIBOR + 4.000% | 5.044 | + | 11/15/2030 | 985,015 | ||||||||
| 3,000,000 | Brightwood Capital MM CLO 2020-1A C2 Ltd.** | 4.290 | 12/15/2028 | 2,838,021 | ||||||||||
| 6,500,000 | Brightwood Capital MM CLO 2020-1A D Ltd.** | 3 Month LIBOR + 5.400% | 6.226 | + | 12/15/2028 | 6,429,846 | ||||||||
| 5,000,000 | Catamaran CLO 2014-1A BR Ltd.** | 3 Month LIBOR + 2.160% | 3.296 | + | 4/22/2030 | 4,875,520 | ||||||||
| 1,000,000 | Gallatin CLO IX 2017-1A ER Ltd.** | 3 Month LIBOR + 6.920% | 7.964 | + | 7/15/2031 | 942,583 | ||||||||
| 6,000,000 | Greywolf CLO II 2013-1A DRR Ltd.** | 3 Month LIBOR + 7.050% | 8.094 | + | 4/15/2034 | 5,758,548 | ||||||||
| 939,061 | Halcyon Loan Advisors Funding 2014-1A D Ltd.** | 3 Month LIBOR + 3.500% | 4.544 | + | 4/18/2026 | 939,681 | ||||||||
| 2,000,000 | Halcyon Loan Advisors Funding 2017-2A B Ltd.** | 3 Month LIBOR + 2.100% | 3.144 | + | 1/17/2030 | 1,986,580 | ||||||||
| 1,000,000 | KKR CLO 13 ER Ltd. ** | 3 Month LIBOR + 4.950% | 5.994 | + | 1/16/2028 | 983,897 | ||||||||
| 7,100,000 | Mount Logan Funding LP 2018-1A DR ** | 3 Month LIBOR + 4.500% | 5.636 | + | 1/22/2033 | 6,775,892 | ||||||||
| 1,825,000 | PennantPark CLO 2020-2A D Ltd. ** | 3 Month LIBOR + 6.500% | 7.544 | + | 1/15/2032 | 1,789,341 | ||||||||
| 2,250,000 | PennantPark CLO 2021-3A DLtd. ** | 3 Month LIBOR + 4.100% | 5.236 | + | 10/22/2032 | 2,198,993 | ||||||||
| 5,000,000 | Saranac CLO III 2014-3A CR Ltd. ** | 3 Month LIBOR + 2.350% | 3.284 | + | 6/22/2030 | 4,953,325 | ||||||||
| 5,000,000 | Saranac Clo VII 2014-2A CR Ltd.** | 3 Month LIBOR + 2.250% | 2.730 | + | 11/20/2029 | 4,952,410 | ||||||||
| 3,000,000 | Saratoga Investment Corp. CLO 2013-1A DR3 Ltd.** | 3 Month LIBOR + 4.000% | 5.063 | + | 4/20/2033 | 2,976,942 | ||||||||
| 4,000,000 | Saratoga Investment Corp. CLO 2013-1A ER3 Ltd.** | 3 Month LIBOR + 7.500% | 8.563 | + | 4/20/2033 | 3,836,764 | ||||||||
| 2,750,000 | SP 2021-1A C ** | 3 Month LIBOR + 3.000% | 4.044 | + | 10/15/2032 | 2,693,581 | ||||||||
| 1,000,000 | Symphony CLO XIV 2014-14A E Ltd. ** | 3 Month LIBOR + 4.600% | 5.638 | + | 7/14/2026 | 981,570 | ||||||||
| 2,000,000 | TIAA CLO III 2017-2A B Ltd.** | 3 Month LIBOR + 1.500% | 2.544 | + | 1/16/2031 | 1,991,898 | ||||||||
| 3,000,000 | Venture XVII CLO 2014-17A CRR Ltd. ** | 3 Month LIBOR + 1.850% | 2.894 | + | 4/15/2027 | 2,975,076 | ||||||||
| 5,800,000 | Venture XXIII CLO 2016-23A ER2 Ltd.** | 3 Month LIBOR + 7.550% | 8.594 | + | 7/19/2034 | 5,491,510 | ||||||||
| 3,000,000 | Z Capital Credit Partners CLO 2019-1A CR Ltd.** | 3 Month LIBOR + 2.900% | 3.944 | + | 7/16/2031 | 2,977,425 | ||||||||
| 1,500,000 | Zais CLO 3 2015-3A BR Ltd.** | 3 Month LIBOR + 2.650% | 3.694 | + | 7/15/2031 | 1,471,875 | ||||||||
| 7,500,000 | Zais CLO 9 2018-2A C Ltd.** | 3 Month LIBOR + 2.350% | 3.413 | + | 7/20/2031 | 7,311,345 | ||||||||
| 2,000,000 | Zais CLO 17 2021-17A C Ltd.** | 3 Month LIBOR + 2.680% | 3.743 | + | 10/20/2033 | 1,983,636 | ||||||||
| 96,542,428 | ||||||||||||||
| CMO - 2.0% | ||||||||||||||
| 5,000,000 | Cascade Funding Mortgage Trust 2022-AB2 M3, LLC ** | 2.000 | + | 2/25/2052 | 3,777,720 | |||||||||
| 1,675,000 | Cascade Funding Mortgage Trust 2022-EBO2 M3, LLC ** | 5.328 | + | 7/25/2054 | 1,675,000 | |||||||||
| 1,000,000 | CHNGE Mortgage Trust 2022-1 B2 ** | 4.570 | + | 1/25/2067 | 866,781 | |||||||||
| 3,446,128 | Farmer Mac Agricultural Real Estate Trust 2021-1 B ** | 3.247 | + | 1/25/2051 | 3,051,512 | |||||||||
| 2,350,000 | PRPM 2020-6 A2, LLC ** | 4.703 | ++ | 11/25/2025 | 2,282,298 | |||||||||
| 3,000,000 | VCAT 2021-NPL5 A2, LLC ** | 3.844 | ++ | 9/25/2051 | 2,822,509 | |||||||||
| 14,475,820 | ||||||||||||||
The accompanying notes are an integral part of these financial statements.
3
| Holbrook Income Fund |
| Schedule of Investments (Continued) |
| April 30, 2022 |
| Principal | Spread | Coupon % | Maturity | Fair Value | ||||||||||
| ASSET BACKED SECURITIES - 33.6% (Continued) | ||||||||||||||
| NON AGENCY CMBS - 12.8% | ||||||||||||||
| $ | 2,200,000 | BB-UBS 2012-TFT B ** | 3.678 | + | 6/5/2030 | $ | 2,099,006 | |||||||
| 750,000 | Capital Funding Mortgage Trust 2021-21B ** | 1 Month LIBOR + 12.250% | 13.250 | + | 11/15/2023 | 747,378 | ||||||||
| 458,952 | Capital Funding Mortgage Trust 2022-27 B ** | SOFR30A + 9.91% | 10.910 | + | 2/11/2025 | 458,952 | ||||||||
| 1,453,500 | Capital Funding Mortgage Trust 2022-P01 B ** | TSR1M + 13.700% | 14.700 | + | 6/20/2024 | 1,453,500 | ||||||||
| 4,695,000 | COMM 2012-CCRE5 Mortgage Trust ** | 4.462 | + | 12/10/2045 | 3,777,845 | |||||||||
| 3,965,000 | COMM 2013-GAM B ** | 3.531 | + | 2/10/2028 | 3,848,350 | |||||||||
| 2,415,000 | CSMC 2014-USA OA, LLC ** | 4.185 | 9/15/2037 | 2,251,305 | ||||||||||
| 6,000,000 | GS Mortgage Securities Corp Trust 2018-3PCK B ** | 1 Month LIBOR + 2.500% | 3.054 | + | 9/15/2031 | 5,995,572 | ||||||||
| 3,000,000 | GS Mortgage Securities Corp Trust 2018-3PCK C ** | 1 Month LIBOR + 3.250% | 3.804 | + | 9/15/2031 | 2,865,461 | ||||||||
| 1,420,753 | GS Mortgage Securities Corporation II 2018-SRP5 A ** | 1 Month LIBOR + 1.550% | 2.104 | + | 9/15/2031 | 1,275,645 | ||||||||
| 944,053 | GS Mortgage Securities Corporation II 2018-SRP5 B ** | 1 Month LIBOR + 2.750% | 3.304 | + | 9/15/2031 | 774,949 | ||||||||
| 1,920,821 | GS Mortgage Securities Corporation II 2018-SRP5 C ** | 1 Month LIBOR + 4.000% | 4.554 | + | 9/15/2031 | 718,970 | ||||||||
| 1,387,238 | GS Mortgage Securities Trust 2011-GC5 AS ** | 5.209 | + | 8/10/2044 | 1,386,026 | |||||||||
| 1,000,000 | GS Mortgage Securities Trust 2012-GCJ7 D ** | 5.511 | + | 5/10/2045 | 990,598 | |||||||||
| 6,225,000 | Hudsons Bay Simon JV Trust 2015-HBS10 A10 ** | 4.155 | 8/5/2034 | 5,693,098 | ||||||||||
| 1,000,000 | Impact Funding Affordable Multifamily Housing Mortgage Loan Trust 2010-1 D** | 6.353 | + | 1/25/2051 | 954,371 | |||||||||
| 3,072,000 | JPMBB Commercial Mortgage Securities Trust 2013-C12 D | 4.228 | + | 7/15/2045 | 2,915,878 | |||||||||
| 4,503,000 | JPMBB Commercial Mortgage Securities Trust 2014-C18 C | 4.947 | + | 2/15/2047 | 4,239,160 | |||||||||
| 4,550,000 | Morgan Stanley Bank of America Merrill Lynch Trust 2013-C9 D ** | 4.244 | + | 5/15/2046 | 4,231,495 | |||||||||
| 2,300,000 | Morgan Stanley Capital I Trust 2016-+PSQ D ** | 3.954 | + | 1/10/2038 | 1,978,448 | |||||||||
| 10,681,000 | Morgan Stanley Capital I Trust 2019-BPR B** | 1 Month LIBOR + 2.100% | 2.654 | + | 5/15/2036 | 10,418,104 | ||||||||
| 7,576,000 | Morgan Stanley Capital I Trust 2019-BPR C** | 1 Month LIBOR + 3.050% | 3.604 | + | 5/15/2036 | 7,269,276 | ||||||||
| 2,000,000 | Capital Funding Multifamily Mortgage Trust 2022-MF03 B ** | TSFR1M + 9.380 | 9.687 | + | 4/1/2025 | 2,000,000 | ||||||||
| 2,000,000 | Capital Funding Multifamily Mortgage Trust 2022-PM01 B ** | TSFR1M + 9.500 | 9.690 | + | 3/1/2025 | 2,000,000 | ||||||||
| 2,000,000 | WFRBS Commercial Mortgage Trust 2012-C8 F** | 5.012 | + | 8/15/2045 | 1,959,799 | |||||||||
| 7,616,702 | WFRBS Commercial Mortgage Trust 2012-C9 D ** | 4.971 | + | 11/15/2045 | 7,424,042 | |||||||||
| 7,231,000 | WFRBS Commercial Mortgage Trust 2012-C9 E** | 4.971 | + | 11/15/2045 | 6,823,582 | |||||||||
| 2,000,000 | WFRBS Commercial Mortgage Trust 2013-C16 D** | 5.152 | + | 9/15/2046 | 1,901,884 | |||||||||
| 471,250 | XCALI 2020-1-10 B1 Mortgage Trust ** | 1 Month LIBOR + 8.000% | 9.000 | + | 5/26/2024 | 470,113 | ||||||||
| 3,000,000 | XCALI 2020--5 A Mortgage Trust ** | 1 Month LIBOR + 3.250% | 4.250 | + | 10/15/2023 | 2,995,928 | ||||||||
| 1,000,000 | XCALI 2020-5B 1 Mortgage Trust ** | 1 Month LIBOR + 8.250% | 9.250 | + | 10/15/2023 | 999,539 | ||||||||
| 1,000,000 | X-Caliber Funding 2021-7 B1, LLC ** | 1 Month LIBOR + 6.000% | 7.000 | + | 1/6/2026 | 967,260 | ||||||||
| 93,885,534 | ||||||||||||||
| OTHER ABS - 3.4% | ||||||||||||||
| 6,385,900 | Coinstar Funding, LLC Series 2017-1A A2 ** | 5.216 | 4/25/2047 | 6,353,956 | ||||||||||
| 2,000,000 | FMC GMSR Issuer Trust 2022-GT1 A ** | 6.190 | + | 4/25/2027 | 2,000,000 | |||||||||
| 2,400,012 | HRR Funding 2021-1A A, LLC** | 4.582 | 12/20/2036 | 2,400,012 | ||||||||||
| 2,430,060 | HRR Funding 2021-1A B, LLC** | 9.000 | 12/20/2036 | 2,404,107 | ||||||||||
| 2,996,031 | New Residential Mortgage,2020-FNT1 A, LLC ** | 5.437 | 6/25/2025 | 2,963,232 | ||||||||||
| 1,529,632 | New Residential Mortgage 2020-FNT2 A, LLC ** | 5.437 | 7/25/2025 | 1,512,945 | ||||||||||
| 4,432,945 | NRZ Excess Spread-Collateralized Notes Series 2020-PLS1 ** | 3.844 | 12/25/2025 | 4,283,544 | ||||||||||
| 2,926,314 | Purewest Funding 2021-1 A1, LLC ** | 4.091 | 12/22/2036 | 2,830,578 | ||||||||||
| 24,748,374 | ||||||||||||||
| RESIDENTIAL MORTGAGE - 1.9% | ||||||||||||||
| 7,500,000 | VCAT 2021-NPL1 A2, LLC ** | 4.826 | ++ | 12/26/2050 | 7,193,816 | |||||||||
| 5,000,000 | VCAT 2021-NPL6 A2 Asset Securitization, LLC ** | 3.967 | ++ | 9/25/2051 | 4,637,380 | |||||||||
| 2,500,000 | VOLT XCIV 2021-NPL3 A2, LLC ** | 4.949 | ++ | 2/27/2051 | 2,406,283 | |||||||||
| 14,237,479 | ||||||||||||||
| TOTAL ASSET BACKED SECURITIES (Cost - $251,360,685) | 246,814,433 | |||||||||||||
| CORPORATE BONDS - 61.7% | ||||||||||||||
| ASSET MANAGEMENT - 27.0% | ||||||||||||||
| 13,020,000 | Apollo Investment Corp. | 5.250 | 3/3/2025 | 12,898,068 | ||||||||||
| 24,550 | B. Riley Financial, Inc. | 6.750 | 5/31/2024 | 619,887 | ||||||||||
| 314,006 | B. Riley Financial, Inc. | 5.500 | 3/31/2026 | 7,799,909 | ||||||||||
| 20,000 | B. Riley Financial, Inc. | 6.500 | 9/30/2026 | 507,000 | ||||||||||
| 5,100,000 | Capital Southwest Corp. | 3.375 | 10/1/2026 | 4,725,635 | ||||||||||
| 10,435,000 | Capital Southwest Corp. | 4.500 | 1/31/2026 | 10,185,708 | ||||||||||
| 156,775 | Capitala Finance Corp. | 5.750 | 5/31/2022 | 3,952,298 | ||||||||||
| 12,000,000 | Fidus Investment Corp. | 4.750 | 1/31/2026 | 11,789,040 | ||||||||||
| 33,459 | First Eagle Alternative Capital BDC, Inc. | 5.000 | 5/25/2026 | 827,776 | ||||||||||
| 15,780,000 | Gladstone Capital Corp. | 5.125 | 1/31/2026 | 15,582,750 | ||||||||||
| 86,806 | Great Elm Capital Corp. | 6.750 | 1/31/2025 | 2,174,490 | ||||||||||
| 474,024 | Great Elm Capital Corp. | 5.875 | 6/30/2026 | 11,898,002 | ||||||||||
| 211,342 | Hennessy Advisors, Inc. | 4.875 | 12/31/2026 | 5,222,261 | ||||||||||
The accompanying notes are an integral part of these financial statements.
4
| Holbrook Income Fund |
| Schedule of Investments (Continued) |
| April 30, 2022 |
| Principal | Spread | Coupon % | Maturity | Fair Value | ||||||||||
| CORPORATE BONDS - 61.7% (Continued) | ||||||||||||||
| ASSET MANAGEMENT - 27.0% (Continued) | ||||||||||||||
| $ | 267,840 | Horizon Technology Finance Corp. | 4.875 | 3/30/2026 | $ | 6,661,181 | ||||||||
| 7,059,000 | Investcorp Credit Management BDC, Inc. | 4.875 | 4/1/2026 | 6,863,642 | ||||||||||
| 5,000,000 | Main Street Capital Corp. | 3.000 | 7/14/2026 | 4,558,550 | ||||||||||
| 2,000,000 | Medallion Financial Corp.** | 7.500 | 12/30/2027 | 1,990,000 | ||||||||||
| 11,185,000 | Monroe Capital Corp. | 4.750 | 2/15/2026 | 10,651,308 | ||||||||||
| 124,730 | Newtek Business Services Corp. | 5.750 | 8/1/2024 | 3,143,196 | ||||||||||
| 369,154 | Newtek Business Services Corp. | 5.500 | 2/1/2026 | 9,450,342 | ||||||||||
| 10,000 | OFS Credit Co., Inc. | 6.125 | 4/30/2026 | 253,100 | ||||||||||
| 27,594 | Oxford Square Capital Corp. | 6.250 | 4/30/2026 | 687,091 | ||||||||||
| 12,445,000 | PennantPark Floating Rate Capital Ltd. | 4.250 | 4/1/2026 | 11,787,406 | ||||||||||
| 5,500,000 | PennantPark Investment Corp. | 4.000 | 11/1/2026 | 5,100,553 | ||||||||||
| 10,042,000 | PennantPark Investment Corp. | 4.500 | 5/1/2026 | 9,610,501 | ||||||||||
| 69,014 | PhenixFIN Corp. | 6.125 | 3/30/2023 | 1,756,406 | ||||||||||
| 188,000 | Saratoga Investment Corp. | 6.000 | 2/28/2026 | 4,700,000 | ||||||||||
| 15,400,000 | Saratoga Investment Corp. | 4.375 | 2/28/2026 | 14,835,024 | ||||||||||
| 6,000,000 | Saratoga Investment Corp. | 4.350 | 2/28/2027 | 5,645,132 | ||||||||||
| 463,500 | Trinity Capital, Inc. | 7.000 | 1/16/2025 | 12,137,906 | ||||||||||
| 198,014,162 | ||||||||||||||
| BANKING - 0.4% | ||||||||||||||
| 459,000 | Citigroup, Inc. | 4*(USISDA30-USISDA02) | 5.600 | + | 10/31/2034 | 335,070 | ||||||||
| 1,785,000 | Citigroup, Inc. | 10*(USISDA30-USISDA02) | 4.749 | + | 4/30/2035 | 1,249,500 | ||||||||
| 1,485,000 | Credit Suisse AG | 7*(USISDA30-USISDA02) | 10.000 | + | 8/28/2030 | 1,113,750 | ||||||||
| 2,698,320 | ||||||||||||||
| CHEMICALS - 0.2% | ||||||||||||||
| 1,810,000 | C3 Nano, Inc.** | 6.500 | 2/15/2024 | 1,812,444 | ||||||||||
| COMMERCIAL SUPPORT SERVICES - 3.0% | ||||||||||||||
| 929,634 | Charah Solutions, Inc. | 8.500 | 8/31/2026 | 21,734,843 | ||||||||||
| ELECTRICAL EQUIPMENT - 0.4% | ||||||||||||||
| 112,758 | Babcock & Wilcox Enterprises, Inc. | 8.125 | 2/28/2026 | 2,887,732 | ||||||||||
| ENTERTAINMENT CONTENT - 0.8% | ||||||||||||||
| 232,322 | Chicken Soup For The Soul Entertainment, Inc. | 9.500 | 7/31/2025 | 5,756,939 | ||||||||||
| INSTITUTIONAL FINANCIAL SERVICES - 2.4% | ||||||||||||||
| 79,800 | Arlington Asset Investment Corp. | 6.000 | 8/1/2026 | 1,953,504 | ||||||||||
| 20,000 | B Riley Financial, Inc. | 5.000 | 12/31/2026 | 466,800 | ||||||||||
| 2,000,000 | Cowen, Inc. | 7.250 | 5/6/2024 | 2,051,962 | ||||||||||
| 4,334,000 | Jefferies Group LLC | 10*(USISDA10-USISDA02) | 0.000 | + | 6/30/2037 | 3,510,540 | ||||||||
| 1,713,000 | Jefferies Group LLC | 8*(USISDA10-USISDA02) | 0.000 | + | 9/30/2037 | 1,233,360 | ||||||||
| 3,312,000 | Jefferies Group LLC | 10*(USISDA10-USISDA02) | 0.000 | + | 10/31/2037 | 2,682,720 | ||||||||
| 1,938,000 | Morgan Stanley | 5*(USISDA30-USISDA02) | 0.380 | + | 7/20/2025 | 1,782,960 | ||||||||
| 151,000 | Morgan Stanley | 5*(USISDA30-USISDA02) | 1.685 | + | 8/30/2028 | 120,800 | ||||||||
| 2,269,000 | Morgan Stanley | 5*(USISDA30-USISDA02) | 1.685 | + | 8/30/2028 | 1,815,200 | ||||||||
| 57,000 | Morgan Stanley | 4*(USISDA30-USISDA02) | 0.000 | + | 4/30/2030 | 52,155 | ||||||||
| 254,000 | Morgan Stanley | 5*(USISDA30-USISDA02) | 0.000 | + | 9/30/2030 | 190,500 | ||||||||
| 161,000 | Morgan Stanley | 5*(USISDA30-USISDA02) | 0.000 | + | 10/30/2030 | 120,750 | ||||||||
| 266,000 | Morgan Stanley | 10*(USISDA30-USISDA02) | 0.000 | + | 11/30/2030 | 199,500 | ||||||||
| 543,000 | Morgan Stanley | 4*(USISDA30-USISDA02) | 0.000 | + | 2/28/2034 | 374,670 | ||||||||
| 965,000 | Morgan Stanley^ | 4*(USISDA30-USISDA02) | 0.000 | + | 3/31/2034 | 665,850 | ||||||||
| 302,000 | Morgan Stanley | 4*(USISDA30-USISDA02) | 0.000 | + | 4/30/2034 | 208,380 | ||||||||
| 599,000 | Morgan Stanley | 4*(USISDA30-USISDA02) | 0.000 | + | 5/30/2034 | 413,310 | ||||||||
| 17,842,961 | ||||||||||||||
| INSURANCE - 1.4% | ||||||||||||||
| 9,554,000 | AmTrust Financial Services, Inc. | 6.125 | 8/15/2023 | 9,529,974 | ||||||||||
| 1,588,001 | Atlas Financial Holdings, Inc. | 6.625 | 4/7/2027 | 682,535 | ||||||||||
| 10,212,509 | ||||||||||||||
| INTERNET MEDIA & SERVICES - 0.7% | ||||||||||||||
| 5,000,000 | Real Estate Exchange, Inc. ** | 6.000 | 3/15/2025 | 5,037,500 | ||||||||||
| MACHINERY - 0.0% | ||||||||||||||
| 2,500,000 | Briggs & Stratton Corp. # | 6.875 | 12/15/2020 | 37,500 | ||||||||||
The accompanying notes are an integral part of these financial statements.
5
| Holbrook Income Fund |
| Schedule of Investments (Continued) |
| April 30, 2022 |
| Principal | Spread | Coupon % | Maturity | Fair Value | ||||||||||
| CORPORATE BONDS - 61.7% (Continued) | ||||||||||||||
| METALS & MINING - 2.8% | ||||||||||||||
| $ | 10,806,000 | Alliance Resource Operating Partners LP ** | 7.500 | 5/1/2025 | $ | 10,848,846 | ||||||||
| 356,843 | Ramaco Resources, Inc. | 9.000 | 7/30/2026 | 9,492,024 | ||||||||||
| 20,340,870 | ||||||||||||||
| OIL & GAS PRODUCERS - 3.8% | ||||||||||||||
| 13,114,000 | Talos Production, Inc. | 12.000 | 1/15/2026 | 14,117,549 | ||||||||||
| 13,500,000 | W&T Offshore, Inc. ** | 9.750 | 11/1/2023 | 13,427,708 | ||||||||||
| 27,545,257 | ||||||||||||||
| OIL & GAS SERVICES & EQUIPMENT - 0.7% | ||||||||||||||
| 5,347,000 | Exterran Energy Solutions, L.P. | 8.125 | 5/1/2025 | 5,367,934 | ||||||||||
| REAL ESTATE SERVICES - 0.7% | ||||||||||||||
| 5,000,000 | Carrington HLDG Company LLC ** | 8.000 | 1/1/2026 | 5,047,244 | ||||||||||
| REIT - 1.5% | ||||||||||||||
| 313,828 | Gladstone Land Corp. | 5.000 | 1/31/2026 | 7,949,263 | ||||||||||
| 110,500 | HC Government Realty Trust, Inc. ** | 7.000 | 8/14/2027 | 2,790,125 | ||||||||||
| 10,739,388 | ||||||||||||||
| SOFTWARE - 2.0% | ||||||||||||||
| 8,000,000 | Blast Motion, Inc.** | 5.500 | 2/15/2025 | 8,020,000 | ||||||||||
| 119,628 | Synchronoss Technologies, Inc. | 8.375 | 6/30/2026 | 2,428,448 | ||||||||||
| 4,000,000 | Tigo Energy, Inc. ** | 5.500 | 1/15/2025 | 4,030,000 | ||||||||||
| 14,478,448 | ||||||||||||||
| SPECIALTY FINANCE - 12.2% | ||||||||||||||
| 6,000,000 | ACRES Commercial Realty Corp. | 5.750 | 8/15/2026 | 5,881,435 | ||||||||||
| 1,500,000 | Broadmark Realty Capital, Inc. ** | 5.000 | 11/15/2026 | 1,418,148 | ||||||||||
| 1,000,000 | Dakota Financial, LLC ** | 5.000 | 9/30/2026 | 928,110 | ||||||||||
| 2,000,000 | First Help Financial, LLC ** | 6.000 | 11/15/2026 | 1,903,276 | ||||||||||
| 4,000,000 | InvestCo, LLC ** | 5.125 | 8/13/2026 | 3,691,327 | ||||||||||
| 3,250,000 | Medallion Financial Corp. ** | 7.250 | 2/26/2026 | 3,193,125 | ||||||||||
| 4,000,000 | National Funding, Inc. ** | 5.750 | 8/31/2026 | 3,853,133 | ||||||||||
| 13,530,000 | Nexpoint Real Estate Finance, Inc. | 5.750 | 5/1/2026 | 13,456,803 | ||||||||||
| 5,000,000 | OWS Cre Funding I, LLC ** | 1 Month LIBOR + 4.900% | 5.355 | + | 9/15/2023 | 4,933,548 | ||||||||
| 5,000,000 | PDOF MSN Issuer, LLC ** | SOFRATE + 4.50% | 4.780 | + | 3/1/2025 | 5,003,307 | ||||||||
| 321,605 | Ready Capital Corp. | 7.000 | 8/15/2023 | 8,336,002 | ||||||||||
| 670,999 | Ready Capital Corp. | 5.750 | 2/15/2026 | 16,640,775 | ||||||||||
| 2,000,000 | Regent Capital Corp. ** | 6.000 | 12/28/2026 | 1,923,921 | ||||||||||
| 60,680 | Sachem Capital Corp. | 7.125 | 6/30/2024 | 1,532,455 | ||||||||||
| 77,468 | Sachem Capital Corp. | 6.875 | 12/30/2024 | 1,950,635 | ||||||||||
| 79,630 | Sachem Capital Corp. | 7.750 | 9/30/2025 | 2,019,425 | ||||||||||
| 61,300 | Sachem Capital Corp. | 6.000 | 12/30/2026 | 1,501,212 | ||||||||||
| 20,000 | Sachem Capital Corp. | 6.000 | 3/30/2027 | 496,798 | ||||||||||
| 3,000,000 | Synergy One Lending, Inc. ** | 5.500 | 10/14/2026 | 2,910,793 | ||||||||||
| 500,000 | X-Caliber Funding, LLC ** | 11.000 | 9/24/2024 | 501,639 | ||||||||||
| 3,000,000 | X-Caliber Funding, LLC ** | 5.000 | 9/24/2024 | 2,826,486 | ||||||||||
| 1,000,000 | X-Caliber Funding, LLC ** | 11.000 | 3/1/2025 | 1,000,000 | ||||||||||
| 2,000,000 | X-Caliber Funding, LLC ** | 5.000 | 3/1/2025 | 2,000,000 | ||||||||||
| 2,000,000 | X-Caliber Funding, LLC ** | 1 Month LIBOR + 3.000% | 4.000 | + | 10/1/2024 | 1,971,826 | ||||||||
| 89,874,179 | ||||||||||||||
| TECHNOLOGY HARDWARE - 0.5% | ||||||||||||||
| 4,000,000 | Dragonfly Energy Corp.** | 5.500 | 11/15/2024 | 4,020,000 | ||||||||||
| WHOLESALE - CONSUMER STAPLES - 1.2% | ||||||||||||||
| 9,000,000 | Cooks Venture, Inc. ** | 5.500 | 1/15/2025 | 9,067,500 | ||||||||||
| TOTAL CORPORATE BONDS (Cost - $463,236,505) | 452,515,730 | |||||||||||||
The accompanying notes are an integral part of these financial statements.
6
| Holbrook Income Fund |
| Schedule of Investments (Continued) |
| April 30, 2022 |
| Shares | ||||||||
| SHORT-TERM INVESTMENTS - 1.0% | ||||||||
| MONEY MARKET - 1.0% | ||||||||
| 7,246,650 | First American Government Obligations Portfolio, Class X, 0.22% * | |||||||
| TOTAL SHORT-TERM INVESTMENTS (Cost - $7,246,650) | $ | 7,246,650 | ||||||
| TOTAL INVESTMENTS - 99.6% (Cost - $745,556,810) | $ | 730,624,045 | ||||||
| OTHER ASSETS LESS LIABILITIES - 0.4% | 2,951,886 | |||||||
| NET ASSETS - 100.0% | $ | 733,575,931 | ||||||
| + | Variable rate security, rate shown represents the rate at April 30, 2022. |
| ++ | Step rate, rate shown represents the rate at April 30, 2022. |
| * | Rate shown represents the 7 day yield rate as of April 30, 2022 and is subject to change and resets daily. |
| ** | Securities exempt from registration under Rule 144A of Securities Act of 1933. These securities may be resold in transactions exempt from registration to qualified institutional buyers. At April 30, 2022, these securities amounted to $361,969,301 or 49.3% of net assets. |
| ^ | The security is illiquid; total illiquid securities represent 0.5% of net assets. |
| # | Defaulted security. |
Perpetual - Perpetual preferred stock are securities without defined maturity dates
LIBOR - London Interbank Offered Rate
CMS2 - Constant Maturity Swap 2 Year Rate
CMS30 - Constant Maturity Swap 30 Year Rate
USISDA02 - 2 Year USD ICE Swap Rate
USISDA10 - 10 Year USD ICE Swap Rate
USISDA30 - 30 Year USD ICE Swap Rate
SOFRATE - Secured Overnight Financing Rate
TSFR1M - 1 Month Secured Financing Rate
The accompanying notes are an integral part of these financial statements.
7
| Holbrook Income Fund |
| Statement of Assets and Liabilities |
| April 30, 2022 |
| ASSETS | ||||
| Investment securities: | ||||
| At cost | $ | 745,556,810 | ||
| At fair value | $ | 730,624,045 | ||
| Dividends and Interest receivable | 6,659,444 | |||
| Receivable for Fund shares sold | 1,840,032 | |||
| Receivable for securities sold | 10,016,250 | |||
| Prepaid expenses and other assets | 107,363 | |||
| TOTAL ASSETS | 749,247,134 | |||
| LIABILITIES | ||||
| Payable for securities purchased | $ | 1,166,094 | ||
| Payable for Fund shares redeemed | 13,238,801 | |||
| Dividends payable | 622,048 | |||
| Investment advisory fees payable | 483,798 | |||
| Distribution (12b-1) fees payable | 50,073 | |||
| Payable to related parties | 43,634 | |||
| Accrued expenses and other liabilities | 66,755 | |||
| TOTAL LIABILITIES | 15,671,203 | |||
| NET ASSETS | $ | 733,575,931 | ||
| NET ASSETS CONSIST OF: | ||||
| Paid in capital | $ | 752,498,702 | ||
| Accumulated losses | (18,922,771 | ) | ||
| NET ASSETS | $ | 733,575,931 | ||
| NET ASSET VALUE PER SHARE: | ||||
| Class I Shares: | ||||
| Net Assets | $ | 606,759,018 | ||
| Shares of beneficial interest outstanding [$0 par value, unlimited shares authorized] | 59,076,210 | |||
| Net asset value (Net Assets ÷ Shares Outstanding) and redemption price per share | $ | 10.27 | ||
| Investor Class Shares: | ||||
| Net Assets | $ | 114,782,742 | ||
| Shares of beneficial interest outstanding [$0 par value, unlimited shares authorized] | 11,127,524 | |||
| Net asset value (Net Assets ÷ Shares Outstanding) and redemption price per share | $ | 10.32 | ||
| Class A Shares: | ||||
| Net Assets | $ | 12,034,171 | ||
| Shares of beneficial interest outstanding [$0 par value, unlimited shares authorized] | 1,171,416 | |||
| Net asset value (Net Assets ÷ Shares Outstanding) and redemption price per share | $ | 10.27 | ||
| Maximum offering price per share (net asset value plus maximum sales charge of 1.25%) | $ | 10.40 | ||
The accompanying notes are an integral part of these financial statements.
8
| Holbrook Income Fund |
| Statement of Operations |
| For the Year Ended April 30, 2022 |
| INVESTMENT INCOME | ||||
| Dividend | $ | 9,050,462 | ||
| Interest | 21,999,972 | |||
| TOTAL INVESTMENT INCOME | 31,050,434 | |||
| EXPENSES | ||||
| Investment advisory fees | 4,617,072 | |||
| Distribution (12b-1) fees: | ||||
| Investor Class | 500,217 | |||
| Class A | 11,189 | |||
| Administrative services fees | 460,859 | |||
| Third party Administration servicing fees | 588,947 | |||
| Transfer agent fees | 142,408 | |||
| Registration fees | 106,460 | |||
| Accounting services fees | 83,985 | |||
| Legal fees | 63,400 | |||
| Custodian fees | 54,119 | |||
| Printing and postage expenses | 50,866 | |||
| Compliance officer fees | 31,115 | |||
| Audit fees | 23,632 | |||
| Trustees fees and expenses | 13,530 | |||
| Insurance expense | 17,583 | |||
| Other expenses | 37,313 | |||
| TOTAL EXPENSES | 6,802,695 | |||
| NET INVESTMENT INCOME | 24,247,739 | |||
| REALIZED AND UNREALIZED GAIN /(LOSS) ON INVESTMENTS | ||||
| Net realized gain from: | ||||
| Investments | 1,968,340 | |||
| Realized gain on investments | 1,968,340 | |||
| Net change in unrealized depreciation on: | ||||
| Investments | (25,179,014 | ) | ||
| Unrealized depreciation on investments | (25,179,014 | ) | ||
| NET REALIZED AND UNREALIZED LOSS ON INVESTMENTS | (23,210,674 | ) | ||
| NET INCREASE IN NET ASSETS RESULTING FROM OPERATIONS | $ | 1,037,065 | ||
The accompanying notes are an integral part of these financial statements.
9
| Holbrook Income Fund |
| Statements of Changes in Net Assets |
| For the | For the | |||||||
| Year Ended | Year Ended | |||||||
| April 30, 2022 | April 30, 2021 | |||||||
| FROM OPERATIONS | ||||||||
| Net investment income | $ | 24,247,739 | $ | 8,752,674 | ||||
| Net realized gain from investments | 1,968,340 | 1,348,300 | ||||||
| Unrealized appreciation (depreciation) from investments | (25,179,014 | ) | 27,541,970 | |||||
| Net increase in net assets resulting from operations | 1,037,065 | 37,642,944 | ||||||
| DISTRIBUTIONS TO SHAREHOLDERS | ||||||||
| From return of capital: | ||||||||
| Class I | (668,236 | ) | — | |||||
| Investor Class | (140,640 | ) | — | |||||
| Class A(1) | (8,311 | ) | — | |||||
| Total Distributions paid: | ||||||||
| Class I | (22,260,745 | ) | (8,534,645 | ) | ||||
| Investor Class | (4,161,291 | ) | (1,939,810 | ) | ||||
| Class A(1) | (210,114 | ) | — | |||||
| Net decrease in net assets resulting from distributions to shareholders | (27,449,337 | ) | (10,474,455 | ) | ||||
| FROM SHARES OF BENEFICIAL INTEREST | ||||||||
| Proceeds from shares sold: | ||||||||
| Class I | 549,615,625 | 189,935,932 | ||||||
| Investor Class | 90,889,737 | 54,905,200 | ||||||
| Class A(1) | 14,094,880 | — | ||||||
| Net asset value of shares issued in reinvestment of distributions: | ||||||||
| Class I | 18,940,021 | 8,246,571 | ||||||
| Investor Class | 4,175,184 | 1,898,334 | ||||||
| Class A(1) | 181,840 | — | ||||||
| Payments for shares redeemed: | ||||||||
| Class I | (207,225,324 | ) | (50,230,323 | ) | ||||
| Investor Class | (44,640,879 | ) | (15,978,818 | ) | ||||
| Class A(1) | (1,893,032 | ) | — | |||||
| Net increase in net assets from shares of beneficial interest | 424,138,052 | 188,776,896 | ||||||
| TOTAL INCREASE IN NET ASSETS | 397,725,780 | 215,945,385 | ||||||
| NET ASSETS | ||||||||
| Beginning of Year | 335,850,151 | 119,904,766 | ||||||
| End of Year | $ | 733,575,931 | $ | 335,850,151 | ||||
| SHARE ACTIVITY | ||||||||
| Class I: | ||||||||
| Shares Sold | 51,992,257 | 18,307,979 | ||||||
| Shares Reinvested | 1,797,308 | 808,618 | ||||||
| Shares Redeemed | (19,759,142 | ) | (5,032,227 | ) | ||||
| Net increase in shares of beneficial interest outstanding | 34,030,423 | 14,084,370 | ||||||
| Investor Class: | ||||||||
| Shares Sold | 8,521,005 | 5,282,228 | ||||||
| Shares Reinvested | 394,438 | 185,390 | ||||||
| Shares Redeemed | (4,204,292 | ) | (1,539,328 | ) | ||||
| Net increase in shares of beneficial interest outstanding | 4,711,151 | 3,928,290 | ||||||
| Class A(1): | ||||||||
| Shares Sold | 1,336,941 | — | ||||||
| Shares Reinvested | 17,411 | — | ||||||
| Shares Redeemed | (182,936 | ) | — | |||||
| Net increase in shares of beneficial interest outstanding | 1,171,416 | — | ||||||
| (1) | Class A commenced investment operations on July 23, 2021. |
The accompanying notes are an integral part of these financial statements.
10
| Holbrook Income Fund |
| Financial Highlights |
| Per Share Data and Ratios for a Share of Beneficial Interest Outstanding Throughout each Year |
| Class I | ||||||||||||||||||||
| Year Ended | Year Ended | Year Ended | Year Ended | Year Ended | ||||||||||||||||
| April 30, 2022 | April 30, 2021 | April 30, 2020 | April 30, 2019 | April 30, 2018 | ||||||||||||||||
| Net asset value, beginning of year | $ | 10.67 | $ | 8.91 | $ | 10.13 | $ | 10.18 | $ | 10.15 | ||||||||||
| Activity from investment operations: | ||||||||||||||||||||
| Net investment income (1) | 0.45 | 0.51 | 0.37 | 0.38 | 0.41 | |||||||||||||||
| Net realized and unrealized gain (loss) on investments | (0.34 | ) | 1.86 | (1.20 | ) | (0.01 | ) | (0.02 | ) (6) | |||||||||||
| Total from investment operations | 0.11 | 2.37 | (0.83 | ) | 0.37 | 0.39 | ||||||||||||||
| Less distributions from: | ||||||||||||||||||||
| Net investment income | (0.49 | ) | (0.61 | ) | (0.39 | ) | (0.39 | ) | (0.36 | ) | ||||||||||
| Net realized gains | (0.01 | ) | — | — | (0.03 | ) | (0.00 | ) * | ||||||||||||
| Return of Capital | (0.01 | ) | — | — | — | — | ||||||||||||||
| Total distributions | (0.51 | ) | (0.61 | ) | (0.39 | ) | (0.42 | ) | (0.36 | ) | ||||||||||
| Net asset value, end of year | $ | 10.27 | $ | 10.67 | $ | 8.91 | $ | 10.13 | $ | 10.18 | ||||||||||
| Total return (2) | 0.92 | % | 27.10 | % (7) | (8.45 | )% (7) | 3.66 | % | 4.00 | % | ||||||||||
| Net assets, at end of year (000s) | $ | 606,759 | $ | 267,123 | $ | 97,721 | $ | 40,723 | $ | 13,956 | ||||||||||
| Ratio of gross expenses to average net assets (3) | 1.09 | % | 1.13 | % | 1.16 | % (4) | 1.66 | % | 4.39 | % | ||||||||||
| Ratio of net expenses to average net assets | 1.09 | % | 1.28 | % (8) | 1.30 | % (4,8) | 1.30 | % | 1.30 | % | ||||||||||
| Ratio of net investment income to average net assets | 4.28 | % | 4.98 | % | 3.76 | % (4,5) | 3.78 | % | 4.02 | % | ||||||||||
| Portfolio Turnover Rate | 70 | % | 74 | % | 106 | % | 78 | % | 138 | % | ||||||||||
| Investor Class | ||||||||||||||||||||
| Year Ended | Year Ended | Year Ended | Year Ended | Year Ended | ||||||||||||||||
| April 30, 2022 | April 30, 2021 | April 30, 2020 | April 30, 2019 | April 30, 2018 | ||||||||||||||||
| Net asset value, beginning of year | $ | 10.71 | $ | 8.92 | $ | 10.13 | $ | 10.19 | $ | 10.15 | ||||||||||
| Activity from investment operations: | ||||||||||||||||||||
| Net investment income (1) | 0.40 | 0.46 | 0.33 | 0.33 | 0.34 | |||||||||||||||
| Net realized and unrealized gain (loss) on investments | (0.33 | ) | 1.85 | (1.20 | ) | (0.02 | ) | 0.01 | ||||||||||||
| Total from investment operations | 0.07 | 2.31 | (0.87 | ) | 0.31 | 0.35 | ||||||||||||||
| Less distributions from: | ||||||||||||||||||||
| Net investment income | (0.44 | ) | (0.52 | ) | (0.34 | ) | (0.34 | ) | (0.31 | ) | ||||||||||
| Net realized gains | (0.01 | ) | — | — | (0.03 | ) | (0.00 | ) * | ||||||||||||
| Return of Capital | (0.01 | ) | — | — | — | — | ||||||||||||||
| Total distributions | (0.46 | ) | (0.52 | ) | (0.34 | ) | (0.37 | ) | (0.31 | ) | ||||||||||
| Net asset value, end of year | $ | 10.32 | $ | 10.71 | $ | 8.92 | $ | 10.13 | $ | 10.19 | ||||||||||
| Total return (2) | 0.52 | % | 26.37 | % | (8.81 | )% | 3.05 | % | 3.53 | % | ||||||||||
| Net assets, at end of year (000s) | $ | 114,783 | $ | 68,727 | $ | 22,184 | $ | 6,166 | $ | 158 | ||||||||||
| Ratio of gross expenses to average net assets (3) | 1.59 | % | 1.63 | % | 1.66 | % (4) | 2.16 | % | 4.89 | % | ||||||||||
| Ratio of net expenses to average net assets | 1.59 | % | 1.78 | % (8) | 1.80 | % (4,8) | 1.80 | % | 1.80 | % | ||||||||||
| Ratio of net investment income to average net assets | 3.77 | % | 4.50 | % | 3.38 | % (4,5) | 3.23 | % | 3.30 | % | ||||||||||
| Portfolio Turnover Rate | 70 | % | 74 | % | 106 | % | 78 | % | 138 | % | ||||||||||
| (1) | The net investment income per share data was determined using the average shares outstanding throughout each year. |
| (2) | Total returns are historical in nature and assume changes in share price, reinvestment of dividends and capital gains distributions, if any. Had the Advisor not absorbed a portion of Fund expenses, total returns would have been lower. |
| (3) | Represents the ratio of expenses to average net assets absent fee waivers and/or expense reimbursements by the Advisor. |
| (4) | Does not include expenses of other investment companies in which the Fund invests. |
| (5) | Recognition of net investment income by the Fund is affected by the timing of declaration of dividends by underlying investment companies in which the Fund invests. |
| (6) | Realized and unrealized gains per share in this caption are balancing amounts necessary to reconcile the change in net asset value per share and may not reconcile with the aggregate gains and losses in the statement of operations due to the timing of share transactions. |
| (7) | Includes adjustments in accordance with accounting principles generally accepted in the United States and, consequently, the net asset values for financial reporting purposes and the returns based upon those net asset values may differ from the net asset values and returns for shareholder transactions. Adjustments may apply to some but not all years and classes. |
| (8) | Inclusive of Advisor’s recapture of waived/reimbursed fees from prior periods. |
| * | Per share amount represents less than $0.01 per share. |
The accompanying notes are an integral part of these financial statements.
11
| Holbrook Income Fund |
| Financial Highlights |
| Per Share Data and Ratios for a Share of Beneficial Interest Outstanding Throughout the Period |
| Class A | ||||
| Period Ended | ||||
| April 30, 2022 (1) | ||||
| Net asset value, beginning of period | $ | 10.68 | ||
| Activity from investment operations: | ||||
| Net investment income (2) | 0.34 | |||
| Net realized and unrealized (loss) on investments | (0.42 | ) | ||
| Total from investment operations | (0.08 | ) | ||
| Less distributions from: | ||||
| Net investment income | (0.31 | ) | ||
| Net realized gains | (0.01 | ) | ||
| Return of capital | (0.01 | ) | ||
| Total distributions | (0.33 | ) | ||
| Net asset value, end of period | $ | 10.27 | ||
| Total return (3) | (0.84 | )% (4) | ||
| Net assets, at end of period (000s) | $ | 12,034 | ||
| Ratio of net expenses to average net assets | 1.36 | % (5) | ||
| Ratio of net investment income to average net assets | 4.21 | % (5) | ||
| Portfolio Turnover Rate | 70 | % (4) | ||
| (1) | Class A commenced investment operations on July 23, 2021. |
| (2) | The net investment income per share data was determined using the average shares outstanding throughout each period. |
| (3) | Total returns are historical in nature and assume changes in share price, reinvestment of dividends and capital gains distributions, if any. Had the Advisor not absorbed a portion of Fund expenses, total returns would have been lower. |
| (4) | Not Annualized. |
| (5) | Annualized. |
The accompanying notes are an integral part of these financial statements.
12
| Holbrook Income Fund |
| Notes to Financial Statements |
| April 30, 2022 |
| 1. | ORGANIZATION |
The Holbrook Income Fund (the “Fund”) is a series of shares of beneficial interest of the Two Roads Shared Trust (the “Trust”), a statutory trust organized under the laws of the State of Delaware on June 8, 2012, and is registered under the Investment Company Act of 1940, as amended (the “1940 Act”), as a diversified, open-end management investment company. Class I and Investor Class shares commenced investment operations on July 6, 2016. Class A shares commenced investment operations on July 23, 2021. The investment objective is to provide current income, with a secondary objective of capital preservation in a rising interest rate environment.
The Fund offers Class I, Investor Class and Class A shares. Class A shares are offered at net asset value (“NAV”) plus a maximum sales charge of 1.25%. All other classes of shares are sold at net asset value without an initial sales charge. Class I shares are not subject to 12b-1 distribution fees and have a higher minimum initial investment than the Investor Class and Class A shares. Each share class represents an interest in the same assets of the Fund and classes are identical except for differences in their ongoing service and distribution charges. All classes of shares have equal voting privileges except that each class has exclusive voting rights with respect to its service and/or distribution plans. The Fund’s income, expenses (other than class specific distribution fees) and realized and unrealized gains and losses are allocated proportionately each day based upon the relative net assets of each class.
| 2. | SUMMARY OF SIGNIFICANT ACCOUNTING POLICIES |
The following is a summary of significant accounting policies followed by the Fund in preparation of its financial statements. These policies are in conformity with accounting principles generally accepted in the United States of America (“GAAP”). The preparation of financial statements requires management to make estimates and assumptions that affect the reported amounts of assets and liabilities and disclosure of contingent assets and liabilities at the date of the financial statements and the reported amounts of increases and decreases in net assets from operations during the reporting period. Actual results could differ from those estimates. The Fund is an investment company and accordingly follows the investment company accounting and reporting guidance of the Financial Accounting Standards Board (“FASB”) Accounting Standards Codification Topic 946 “Financial Services – Investment Companies”.
Security Valuation – Securities listed on an exchange are valued at the last reported sale price at the close of the regular trading session of the exchange on the business day the value is being determined, or in the case of securities listed on NASDAQ at the NASDAQ Official Closing Price (“NOCP”). In the absence of a sale such securities shall be valued at the mean between the last bid and ask prices on the day of valuation. Debt securities (other than short -term obligations) are valued each day by an independent pricing service approved by the Trust’s Board of Trustees (the “Board”) based on methods which include consideration of: yields or prices of securities of comparable quality, coupon, maturity and type, indications as to values from dealers, and general market conditions or market quotations from a major market maker in the securities. The independent pricing service does not distinguish between smaller-sized bond positions known as “odd lots” and larger institutional-sized bond positions known as “round lots”. Short-term debt obligations having 60 days or less remaining until maturity, at time of purchase, may be valued at amortized cost. Investments in open-end investment companies are valued at net asset value.
The Fund may hold securities, such as private investments, interests in commodity pools, other non-traded securities or temporarily illiquid securities, for which market quotations are not readily available or are determined to be unreliable. These securities will be valued using the “fair value” procedures approved by the Board. The Board has delegated execution of these procedures to a Fair Value Committee composed of one or more representatives from each of the (i) Trust, (ii) administrator, and (iii) advisor. The committee may also enlist third party consultants such a valuation specialist at a public accounting firm, valuation consultant or financial officer of a security issuer on an as-needed basis to assist in determining a security-specific fair value. The Board has also engaged a third party valuation firm to, as needed, attend valuation meetings held by the Trust, review minutes of such meetings and report to the Board on a quarterly basis. The Board reviews and ratifies the execution of this process and the resultant fair value prices at least quarterly to assure the process produces reliable results.
13
| Holbrook Income Fund |
| Notes to Financial Statements (Continued) |
| April 30, 2022 |
Fair Valuation Process. The applicable investments are valued collectively via inputs from each group. For example, fair value determinations are required for the following securities: (i) securities for which market quotations are insufficient or not readily available on a particular business day (including securities for which there is a short and temporary lapse in the provision of a price by the regular pricing source); (ii) securities for which, in the judgment of the advisor, the prices or values available do not represent the fair value of the instrument; factors which may cause the advisor to make such a judgment include, but are not limited to, the following: only a bid price or an asked price is available; the spread between bid and asked prices is substantial; the frequency of sales; the thinness of the market; the size of reported trades; and actions of the securities markets, such as the suspension or limitation of trading; (iii) securities determined to be illiquid; and (iv) securities with respect to which an event that will affect the value thereof has occurred (a “significant event”) since the closing prices were established on the principal exchange on which they are traded, but prior to a Fund’s calculation of its net asset value. Specifically, interests in commodity pools or managed futures pools are valued on a daily basis by reference to the closing market prices of each futures contract or other asset held by a pool, as adjusted for pool expenses. Restricted or illiquid securities, such as private investments or non-traded securities are valued via inputs from the advisor based upon the current bid for the security from two or more independent dealers or other parties reasonably familiar with the facts and circumstances of the security (who should take into consideration all relevant factors as may be appropriate under the circumstances). If the advisor is unable to obtain a current bid from such independent dealers or other independent parties, the Fair Value Committee shall determine the fair value of such security using the following factors: (i) the type of security; (ii) the cost at date of purchase; (iii) the size and nature of the Fund’s holdings; (iv) the discount from market value of unrestricted securities of the same class at the time of purchase and subsequent thereto; (v) information as to any transactions or offers with respect to the security; (vi) the nature and duration of restrictions on disposition of the security and the existence of any registration rights; (vii) how the yield of the security compares to similar securities of companies of similar or equal creditworthiness; (viii) the level of recent trades of similar or comparable securities; (ix) the liquidity characteristics of the security; (x) current market conditions; and (xi) the market value of any securities into which the security is convertible or exchangeable.
The Fund utilizes various methods to measure the fair value of all of its investments on a recurring basis. GAAP establishes a hierarchy that prioritizes inputs to valuation methods. The three levels of input are:
Level 1 – Unadjusted quoted prices in active markets for identical assets and liabilities that the Fund has the ability to access.
Level 2 – Observable inputs other than quoted prices included in Level 1 that are observable for the asset or liability, either directly or indirectly. These inputs may include quoted prices for the identical instrument on an inactive market, prices for similar instruments, interest rates, prepayment speeds, credit risk, yield curves, default rates and similar data.
Level 3 – Unobservable inputs for the asset or liability, to the extent relevant observable inputs are not available, representing the Fund’s own assumptions about the assumptions a market participant would use in valuing the asset or liability, and would be based on the best information available.
The availability of observable inputs can vary from security to security and is affected by a wide variety of factors, including, for example, the type of security, whether the security is new and not yet established in the marketplace, the liquidity of markets, and other characteristics particular to the security. To the extent that valuation is based on models or inputs that are less observable or unobservable in the market, the determination of fair value requires more judgment. Accordingly, the degree of judgment exercised in determining fair value is greatest for instruments categorized in Level 3.
The inputs used to measure fair value may fall into different levels of the fair value hierarchy. In such cases, for disclosure purposes, the level in the fair value hierarchy within which the fair value measurement falls in its entirety, is determined based on the lowest level input that is significant to the fair value measurement in its entirety.
14
| Holbrook Income Fund |
| Notes to Financial Statements (Continued) |
| April 30, 2022 |
The inputs or methodology used for valuing securities are not necessarily an indication of the risk associated with investing in those securities. The following tables summarize the inputs used as of April 30, 2022, for the Fund’s assets and liabilities measured at fair value:
| Assets * | Level 1 | Level 2 | Level 3 | Total | ||||||||||||
| Preferred Stock | $ | 5,019,857 | $ | 19,027,375 | $ | — | $ | 24,047,232 | ||||||||
| Asset Backed Securities | — | 246,814,433 | — | 246,814,433 | ||||||||||||
| Corporate Bonds | 133,121,128 | 319,394,602 | — | 452,515,730 | ||||||||||||
| Short-Term Investments | 7,246,650 | — | — | 7,246,650 | ||||||||||||
| Total Assets | $ | 145,387,635 | $ | 585,236,410 | $ | — | $ | 730,624,045 | ||||||||
| * | Refer to the Schedule of Investments for classifications. |
The Fund did not hold any Level 3 securities during the period.
Security Transactions and Related Income – Security transactions are accounted for on a trade date basis. Interest income is recognized on an accrual basis. Discounts are accreted and premiums are amortized on securities purchased over the lives of the respective securities using the effective yield method. Dividend income is recorded on the ex-dividend date. Realized gains or losses from sales of securities are determined by comparing the identified cost of the security lot sold with the net sales proceeds.
Dividends and Distributions to Shareholders – Dividends from net investment income are declared daily and distributed monthly. Distributable net realized capital gains are declared and distributed annually. Dividends from net investment income and distributions from net realized gains are recorded on ex dividend date and determined in accordance with federal income tax regulations, which may differ from GAAP. These “book/tax” differences are considered either temporary (i.e., deferred losses, capital loss carry forwards) or permanent in nature. To the extent these differences are permanent in nature, such amounts are reclassified within the composition of net assets based on their federal tax-basis treatment; temporary differences do not require reclassification.
Federal Income Taxes – It is the Fund’s policy to qualify as a regulated investment company by complying with the provisions of the Internal Revenue Code that are applicable to regulated investment companies and to distribute substantially all of its taxable income and net realized gains to shareholders. Therefore, no federal income tax provision has been recorded.
The Fund recognizes the tax benefits of uncertain tax positions only where the position is “more likely than not” to be sustained assuming examination by tax authorities. Management has analyzed the Fund’s tax positions and has concluded that no liability for unrecognized tax benefits should be recorded related to uncertain tax positions taken for open tax years 2019-2021 or expected to be taken in the Fund’s April 30, 2022 tax returns. The Fund identifies its major tax jurisdictions as U.S. Federal, Ohio and foreign jurisdictions where the Fund makes significant investments; however, the Fund is not aware of any tax positions for which it is reasonably expected that the total amounts of unrecognized tax benefits will change materially in the next twelve months. The Fund recognizes interest and penalties, if any, related to unrecognized tax benefits, as income tax expense in the Statement of Operations. As of April 30, 2022, the Fund did not incur any interest or penalties.
| 3. | PRINCIPAL INVESTMENT RISKS |
The Fund’s investments in securities, financial instruments and derivatives expose it to various risks, certain of which are discussed below. The Fund’s prospectus and statement of additional information include further information regarding the of risks associated with the Fund’s investments which include, but are not limited to: Baby Bond Risk, Business Development Company (“BDC”) Risk, Closed End Fund Risk, Collateralized Loan Obligations Risk, Credit Risk, Currency Risk,
15
| Holbrook Income Fund |
| Notes to Financial Statements (Continued) |
| April 30, 2022 |
Cybersecurity Risk, Derivatives Risk, Emerging Markets Risk, Financial Services Sector Risk, Fixed Income Securities Risk, Foreign (Non-U.S.) Investment Risk, Gap Risk, High Yield Risk, Industry Concentration Risk, Investment Companies and Exchange-Traded Funds (“ETFs”) Risk, LIBOR Risk, Liquidity Risk, Management Risk, Market Risk, Market Events Risk, Portfolio Turnover Risk, Preferred Stock Risk, Quantitative Investing Risk, Treasury Inflation Protected Securities Risk, Underlying Fund Risk, U.S. Government Securities Risk, Valuation Risk and Volatility Risk.
Baby Bonds Risk – The primary risk associated with the Fund’s investments in baby bonds is that the issuer or insurer of a baby bond may default on principal and/or interest payments when due on the baby bond. Such a default would have the effect of lessening the income generated by the Fund and/or the value of the baby bonds. Baby bonds are also subject to typical credit ratings risks associated with other fixed-income instruments. Baby bond securities are classified as Corporate Bonds on the Schedule of Investments.
Collateralized Loan Obligations Risk – The Fund is subject to certain risks as a result of its investments in CLOs. The CLO’s performance is linked to the expertise of the CLO manager and its ability to manage the CLO portfolio. The experience of a CLO manager plays an important role in the rating and risk assessment of CLO debt securities. One of the primary risks to investors of a CLO is the potential change in CLO manager, over which the Fund will have no control. The Fund may be adversely affected by new (or revised) laws or regulations that may be imposed by government regulators or self-regulatory organizations that supervise the financial markets. Changes in the regulation of CLOs may adversely affect the value of the investments held by the Fund and the ability of the Fund to execute its investment strategy. CLO debt securities are limited recourse obligations of their issuers. CLO investors must rely solely on distributions from the underlying assets for payments on the CLO debt they hold. CLO debt is not guaranteed by the issuer or any other party. If income from the underlying loans is insufficient to make payments on the CLO debt, no other assets will be available for payment. CLO debt securities may be subject to redemption. In the event of an early redemption, holders of the CLO debt being redeemed will be repaid earlier than the stated maturity of the debt. The timing of redemptions may adversely affect the returns on CLO debt. The CLO manager may not find suitable assets in which to invest during the reinvestment period or to replace assets that the manager has determined are no longer suitable for investment. Additionally, there is a risk that the reinvestment period may terminate early if, for example, the CLO defaults on payments on the securities which it issues or if the CLO manager determines that it can no longer reinvest in underlying assets. Early termination of the reinvestment period could adversely affect a CLO investment.
Fixed Income Securities Risk – Fixed income securities are subject to interest rate risk, call risk, prepayment and extension risk, credit risk, duration, and liquidity risk. In addition, current market conditions may pose heightened risks for fixed income securities. When the Fund invests in fixed income securities or derivatives, the value of your investment in the Fund will fluctuate with changes in interest rates. Typically, a rise in interest rates causes a decline in the value of fixed income securities or derivatives owned by the Fund. Moreover, new regulations applicable to and changing business practices of financial intermediaries that make markets in fixed income securities have resulted in less market making activity for certain fixed income securities, which has reduced the liquidity and may increase the volatility for such fixed income securities. The fixed-income securities market can be susceptible to increases in volatility and decreases in liquidity. Liquidity may decline unpredictably in response to overall economic conditions or credit tightening. Longer-term securities may be more sensitive to interest rate changes.
LIBOR Risk – The Fund may invest in securities and other instruments whose interest payments are determined by references to the London Interbank Offered Rate (“LIBOR”).
The United Kingdom Financial Conduct Authority, which regulates LIBOR, announced its intention to cease its active encouragement of banks to provide the quotations needed to sustain LIBOR after 2021. ICE Benchmark Administration Limited, the administrator of LIBOR ceased publication of certain LIBOR settings on a representative basis at the end of 2021 and is expected to cease publication of the remaining LIBOR settings on a representative basis after June 30, 2023. The U.S. Federal Reserve has begun publishing Secured Overnight Financing Rate (SOFR), a broad measure of secured overnight U.S. Treasury repo rates, that is intended to replace USD LIBOR. The unavailability of LIBOR presents risks to the Fund, including the risk that any pricing or adjustments to the Fund’s investments resulting from a substitute or alternate
16
| Holbrook Income Fund |
| Notes to Financial Statements (Continued) |
| April 30, 2022 |
reference rate may adversely affect the Fund’s performance and/or NAV. It remains uncertain how such changes would be implemented and the effects such changes would have on the Fund, including any negative effects on the Fund’s liquidity and valuation of the Fund’s investments, issuers of instruments in which the Fund invests and financial markets generally.
Market Risk – Overall market risk may affect the value of individual instruments in which the Fund invests. The Fund is subject to the risk that the securities markets will move down, sometimes rapidly and unpredictably, based on overall economic conditions and other factors, which may negatively affect the Fund’s performance. Factors such as domestic and foreign (non-U.S.) economic growth and market conditions, real or perceived adverse economic or political conditions, inflation, changes in interest rate levels, lack of liquidity in the bond and other markets, volatility in the securities markets, adverse investor sentiment affect the securities markets and political events effect the securities markets. U.S. and foreign stock markets have experienced periods of substantial price volatility in the past and may do so again in the future. Securities markets also may experience long periods of decline in value. When the value of the Fund’s investments goes down, your investment in the Fund decreases in value and you could lose money.
Local, state, regional, national or global events such as war, acts of terrorism, the spread of infectious illness or other public health issues, recessions, or other events could have a significant impact on the Fund and its investments and could result in decreases to the Fund’s net asset value. Political, geopolitical, natural and other events, including war, terrorism, trade disputes, government shutdowns, market closures, natural and environmental disasters, epidemics, pandemics and other public health crises and related events and governments’ reactions to such events have led, and in the future may lead, to economic uncertainty, decreased economic activity, increased market volatility and other disruptive effects on U.S. and global economies and markets. Such events may have significant adverse direct or indirect effects on the Fund and its investments. For example, a widespread health crisis such as a global pandemic could cause substantial market volatility, exchange trading suspensions and closures, impact the ability to complete redemptions, and affect Fund performance. A health crisis may exacerbate other pre-existing political, social and economic risks. In addition, the increasing interconnectedness of markets around the world may result in many markets being affected by events or conditions in a single country or region or events affecting a single or small number of issuers.
COVID-19 has resulted in travel restrictions, closed international borders, enhanced health screenings at ports of entry and elsewhere, disruption of and delays in healthcare service preparation and delivery, prolonged quarantines, cancellations, business and school closings, supply chain disruptions, and lower consumer demand, as well as general concern and uncertainty. The impact of COVID-19, and other infectious illness outbreaks that may arise in the future, could adversely affect the economies of many nations or the entire global economy, individual issuers and capital markets in ways that cannot necessarily be foreseen.
Preferred Stock Risk – The value of preferred stocks will fluctuate with changes in interest rates. Typically, a rise in interest rates causes a decline in the value of preferred stock. Preferred stocks are also subject to credit risk, which is the possibility that an issuer of preferred stock will fail to make its dividend payments. Preferred stock prices tend to move more slowly upwards than common stock prices. Convertible preferred stock tends to be more volatile than non-convertible preferred stock, because its value is related to the price of the issuer’s common stock as well as the dividends payable on the preferred stock. The value of preferred stocks will usually react more strongly than bonds and other debt securities to actual or perceived changes in issuer’s financial condition or prospects and may be less liquid than common stocks.
Expenses – Expenses of the Trust that are directly identifiable to a specific fund are charged to that fund. Expenses, which are not readily identifiable to a specific fund, are allocated in such a manner as deemed equitable, taking into consideration the nature and type of expense and the relative sizes of the funds in the Trust.
Indemnification – The Trust indemnifies its officers and trustees for certain liabilities that may arise from the performance of their duties to the Trust. Additionally, in the normal course of business, the Fund enters into contracts that contain a variety of representations and warranties and which provide general indemnities. The Fund’s maximum exposure under these arrangements is unknown, as this would involve future claims that may be made against the Fund that have not yet occurred. However, the Fund expects the risk of loss due to these warranties and indemnities to be remote.
17
| Holbrook Income Fund |
| Notes to Financial Statements (Continued) |
| April 30, 2022 |
| 4. | INVESTMENT TRANSACTIONS |
The cost of purchases and proceeds from the sale of securities, other than short-term investments, for the year ended April 30, 2022, amounted to $801,887,628 and $390,671,269, respectively.
| 5. | INVESTMENT ADVISORY AGREEMENT AND TRANSACTIONS WITH RELATED PARTIES |
Advisory Fees – Holbrook Holdings, Inc. serves as the Fund’s Investment Advisor (the “Advisor”). Pursuant to an Investment Advisory Agreement with the Fund, the Advisor, under the oversight of the Board, directs the daily operations of the Fund and supervises the performance of administrative and professional services provided by others. As compensation for its services and the related expenses borne by the Advisor, the Fund pays the Advisor an investment advisory fee, computed and accrued daily and paid monthly, at an annual rate of 0.80% of the Fund’s average daily net assets.
The Advisor has contractually agreed to reduce its fees and/or absorb expenses of the Fund (The “Waiver Agreement”), until at least September 1, 2022, to ensure that Total Annual Fund Operating Expenses after fee waiver and/or reimbursement (exclusive of any front -end or contingent deferred loads; brokerage fees and commissions; acquired fund fees and expenses; borrowing costs (such as interest and dividend expense on securities sold short); taxes; and extraordinary expenses (such as litigation)) will not exceed 1.30%, 1.80% and 1.55% of the Fund’s average daily net assets for Class I, Investor Class and Class A shares, respectively, subject to possible recoupment (or recapture) from the Fund in future years on a rolling three year basis (within the three years after the fees have been waived or reimbursed) if such recoupment (or recapture) can be achieved within the foregoing expense limits as well as any expense limitation that was in effect at the time the waiver or reimbursement was made.
If the Advisor waives any fee or reimburses any expense pursuant to the Waiver Agreement, and within three years of such waiver or reimbursement, the Fund’s Operating Expenses are subsequently less than 1.30%, 1.80% and 1.55% of average daily net assets attributable to Class I, Investor Class and Class A shares, respectively, the Advisor shall be entitled to recoupment or recapture from the Fund for such waived fees or reimbursed expenses provided that such recoupment (or recapture) does not cause the Fund’s expenses to exceed 1.30%, 1.80% and 1.55% of average daily net assets for Class I, Investor Class and Class A shares, respectively. If Fund Operating Expenses attributable to Class I, Investor Class and Class A shares subsequently exceed 1.30%, 1.80% and 1.55% per annum of the average daily net assets, the recoupment (or recapture) shall be suspended. During the year ended April 30, 2022, the Advisor did not waive or recoup any expenses.
The Board has adopted the Trust’s Master Distribution and Shareholder Servicing Plan (the “Plan”) pursuant to Rule 12b-1 under the 1940 Act. The Plan provides that a monthly service and/or distribution fee is calculated by the Fund at an annual of 0.50% of its average daily net assets for Class A and the Investor Class. Currently, the Fund’s Trustees have set the 12b-1 fee level at 0.25% for the Fund’s Class A shares. These fees are paid to Northern Lights Distributors, LLC (the “Distributor”) to provide compensation for ongoing shareholder servicing and distribution-related activities or services and/or maintenance of the Fund’s shareholder accounts not otherwise required to be provided by the Advisor. For the year ended April 30, 2022, pursuant to the Plan, the Investor Class paid $500,217 and Class A paid $11,189.
The Distributor acts as the Fund’s principal underwriter in a continuous public offering of the Fund’s Class I, Investor Class and Class A shares. For the year ended April 30, 2022, the Distributor received $0, $0 and $66,938 in underwriting commissions for sales of Class I, Investor Class and Class A shares, respectively, of which $0, $0 and $16,639 was retained by the principal underwriter or other affiliated broker-dealers for Class I, Investor Class and Class A shares, respectively.
In addition, certain affiliates of the Distributor provide services to the Fund as follows:
Ultimus Funds Solutions, LLC (“UFS”) – UFS, an affiliate of the Distributor, provides administration, fund accounting, and transfer agent services to the Trust. Pursuant to separated servicing agreements with UFS, the Fund pays UFS customary fees for providing administration, fund accounting and transfer agency services to the Fund. Certain officers of the Trust are also officers of UFS and are not paid any fees directly by the Fund for serving in such capacities.
18
| Holbrook Income Fund |
| Notes to Financial Statements (Continued) |
| April 30, 2022 |
Northern Lights Compliance Services, LLC (“NLCS”) – NLCS, an affiliate of UFS and the Distributor, provides a Chief Compliance Officer to the Trust, as well as related compliance services, pursuant to a consulting agreement between NLCS and the Trust. Under the terms of such agreement, NLCS receives customary fees from the Fund.
Blu Giant, LLC (“Blu Giant”) – Blu Giant, an affiliate of UFS and the Distributor, provides EDGAR conversion and filing services as well as print management services for the Fund on an ad-hoc basis. For the provision of these services, Blu Giant receives customary fees from the Fund.
| 6. | AGGREGATE UNREALIZED APPRECIATION AND DEPRECIATION – TAX BASIS |
| Gross | Gross | Net Unrealized | ||||||||||||
| Tax | Unrealized | Unrealized | Appreciation/ | |||||||||||
| Cost | Appreciation | Depreciation | (Depreciation) | |||||||||||
| $ | 746,283,560 | $ | 5,111,900 | $ | (20,771,415 | ) | $ | (15,659,515 | ) | |||||
| 7. | DISTRIBUTIONS TO SHAREHOLDERS AND TAX COMPONENTS OF CAPITAL |
The tax character of distributions paid during the years ended April 30, 2022 and April 30, 2021 was as follows:
| Fiscal Year Ended | Fiscal Year Ended | |||||||
| April 30, 2022 | April 30, 2021 | |||||||
| Ordinary Income | $ | 23,891,898 | $ | 10,346,421 | ||||
| Long-Term Capital Gain | 1,435,199 | — | ||||||
| Return of Capital | 817,187 | — | ||||||
| $ | 26,144,284 | $ | 10,346,421 | |||||
As of April 30, 2022, the components of accumulated earnings/ (deficit) on a tax basis were as follows:
| Undistributed | Undistributed | Post October Loss | Capital Loss | Other | Unrealized | Total | ||||||||||||||||||||
| Ordinary | Long-Term | and | Carry | Book/Tax | Appreciation/ | Accumulated | ||||||||||||||||||||
| Income | Gains | Late Year Loss | Forwards | Differences | (Depreciation) | Earnings/(Deficits) | ||||||||||||||||||||
| $ | — | $ | — | $ | (2,641,208 | ) | $ | — | $ | (622,048 | ) | $ | (15,659,515 | ) | $ | (18,922,771 | ) | |||||||||
The difference between book basis and tax basis undistributed net investment income/(loss), accumulated net realized losses, and unrealized depreciation from investments is primarily attributable to the tax deferral of losses on wash sales, contingent debt payment instruments, deemed dividend distributions, trust preferred securities, partnerships and adjustments for accrued dividends payable.
Capital losses incurred after October 31 within the fiscal year are deemed to arise on the first business day of the following fiscal year for tax purposes. The Fund incurred and elected to defer such capital losses of $2,641,208.
At April 30, 2022, the Fund utilized capital loss carry forwards of $1,850,839 to offset current fiscal year ended net capital gains.
| Non-Expiring | Non-Expiring | |||||||||||||
| Short-Term | Long-Term | Total | CLCF Utilized | |||||||||||
| $ | — | $ | — | $ | — | $ | 1,850,839 | |||||||
19
| Holbrook Income Fund |
| Notes to Financial Statements (Continued) |
| April 30, 2022 |
| 8. | CONTROL OWNERSHIP |
The beneficial ownership, either directly or indirectly, of more than 25% of the voting securities of a fund creates presumption of control of the fund, under Section 2(a)(9) of the 1940 Act. As of April 30, 2022, Charles Schwab & Co., Inc. held approximately 51% of the voting securities of the Holbrook Income Fund.
| 9. | NEW REGULATORY UPDATES |
In March 2020, FASB issued ASU 2020-04, Reference Rate Reform (Topic 848): Facilitation of the Effects of Reference Rate Reform on Financial Reporting (’‘ASU 2020-04’’). The amendments in ASU 2020-04 provide optional temporary financial reporting relief from the effect of certain types of contract modifications due to the planned discontinuation of LIBOR and other interbank-offered based reference rates as of the end of 2021. ASU 2020-04 is effective for certain reference rate-related contract modifications that occur during the period March 12, 2020 through December 31, 2022. Management is currently evaluating the impact if any, of applying this ASU.
In October 2020, the Securities and Exchange Commission (the “SEC”) adopted new regulations governing the use of derivatives by registered investment companies (“Rule 18f-4”). The Funds will be required to comply with Rule 18f-4 by August 19, 2022. Once implemented, Rule 18f-4 will impose limits on the amount of derivatives a fund can enter into, eliminate the asset segregation framework currently used by funds to comply with Section 18 of the 1940 Act, treat derivatives as senior securities and require funds whose use of derivatives is more than a limited specified exposure amount to establish and maintain a comprehensive derivatives risk management program and appoint a derivatives risk manager. The Fund is currently evaluating the impact, if any, of this provision.
| 10. | SUBSEQUENT EVENTS |
Subsequent events after the date of the Statement of Assets and Liabilities have been evaluated through the date the financial statements were issued. Management has determined that no events or transactions occurred requiring adjustment or disclosure in the financial statements.
20

REPORT OF INDEPENDENT REGISTERED PUBLIC ACCOUNTING FIRM
To the Shareholders and Board of Trustees of
Two Roads Shared Trust
Opinion on the Financial Statements
We have audited the accompanying statement of assets and liabilities, including the schedule of investments, of Holbrook Income Fund (the “Fund”), a series of Two Roads Shared Trust, as of April 30, 2022, and the related statements of operations and changes in net assets, the related notes, and the financial highlights for the year then ended (collectively referred to as the “financial statements”). In our opinion, the financial statements present fairly, in all material respects, the financial position of the Fund as of April 30, 2022, the results of its operations, changes in net assets, and the financial highlights for the year then ended, in conformity with accounting principles generally accepted in the United States of America.
The Fund’s financial statements and financial highlights for the years ended April 30, 2021, and prior, were audited by other auditors whose report dated June 29, 2021, expressed an unqualified opinion on those financial statements and financial highlights.
Basis for Opinion
These financial statements are the responsibility of the Fund’s management. Our responsibility is to express an opinion on the Fund’s financial statements based on our audit. We are a public accounting firm registered with the Public Company Accounting Oversight Board (United States) (“PCAOB”) and are required to be independent with respect to the Fund in accordance with the U.S. federal securities laws and the applicable rules and regulations of the Securities and Exchange Commission and the PCAOB.
We conducted our audit in accordance with the standards of the PCAOB. Those standards require that we plan and perform the audit to obtain reasonable assurance about whether the financial statements are free of material misstatement whether due to error or fraud.
Our audit included performing procedures to assess the risks of material misstatement of the financial statements, whether due to error or fraud, and performing procedures that respond to those risks. Such procedures included examining, on a test basis, evidence regarding the amounts and disclosures in the financial statements. Our procedures included confirmation of securities owned as of April 30, 2022, by correspondence with the custodian and brokers; when replies were not received from brokers, we performed other auditing procedures. Our audit also included evaluating the accounting principles used and significant estimates made by management, as well as evaluating the overall presentation of the financial statements. We believe that our audit provides a reasonable basis for our opinion.
We have served as the Fund’s auditor since 2022.

COHEN & COMPANY, LTD.
Cleveland, Ohio
June 29, 2022
COHEN & COMPANY, LTD.
800.229.1099 | 866.818.4535 fax | cohencpa.com
Registered with the Public Company Accounting Oversight Board
21
| Holbrook Income Fund |
| Change in Accountants (Unaudited) |
| April 30, 2022 |
On April 5, 2022, the Audit Committee of Two Roads Shared Trust (“Committee”) approved and formally engaged Cohen & Company, Ltd. (“Cohen”) as the Fund’s independent registered public accounting firm for the fiscal year ending April 30, 2022, in replacement of Grant Thornton LLP (“GT”) who were dismissed as the independent registered public accounting firm for the Fund.
GT reports on the Fund’s financial statements for either of the past two years did not contain an adverse opinion or a disclaimer of opinion, nor were such reports qualified or modified as to uncertainty, audit scope or accounting principles.
During the fiscal years of the Fund ended April 30, 2020 and April 30, 2021 and during the subsequent interim period ended November 30, 2021 , (i) there were no disagreements between the Funds and GT on any matter of accounting principles or practices, financial statement disclosure, or auditing scope or procedure, which disagreements, if not resolved to the satisfaction of GT, would have caused it to make reference to the subject matter of the disagreement in its report on the financial statements for such period and (ii) there were no reportable events (as defined in Item 304(a)(1)(v) of Regulation S-K).
During the fiscal years of the Fund ended April 30, 2020 and April 30, 2021, and during the subsequent interim period ended April 5, 2022, neither the registrant, nor anyone acting on its behalf, consulted with Cohen on behalf of the Fund regarding the application of accounting principles to a specified transaction (either completed or proposed), the type of audit opinion that might be rendered on the Fund’s financial statements, or any matter that was either: (i) the subject of a “disagreement,” as described in Item 304(a)(1)(iv) of Regulation S-K and the instructions thereto; or (ii) a “reportable event,” as defined in Item 304(a)(1)(v) of Regulation S-K.
22
| Holbrook Income Fund |
| Supplemental Information (Unaudited) |
| April 30, 2022 |
Approval of Advisory Agreement
Holbrook Income Fund
At a meeting held on March 8-9, 2022 (the “Meeting”), the Board of Trustees (the “Board”) of Two Roads Shared Trust (the “Trust”), each of whom is not an “interested person” of the Trust (the “Independent Trustees” or the “Trustees”), as such term is defined under Section 2(a)(19) of the Investment Company Act of 1940, as amended (the “1940 Act”), considered the reapproval of the investment advisory agreement (the “Advisory Agreement”) between Holbrook Holdings, LLC (“Holbrook” or the “Adviser”) and the Trust, on behalf of the Holbrook Income Fund (“the Fund”).
In connection with the Board’s consideration of the Advisory Agreement, the Board received written materials in advance of the Meeting, which included information regarding: (i) the nature, extent, and quality of services to be provided to the Fund by Holbrook; (ii) a description of the Adviser’s investment management personnel; (iii) an overview of the Adviser’s operations and financial condition; (iv) a description of the Adviser’s brokerage practices (including any soft dollar arrangements); (v) a comparison of the Fund’s advisory fees and overall expenses with those of comparable mutual funds; (vi) the anticipated level of profitability from the Adviser’s fund-related operations; (vii) the Adviser’s compliance policies and procedures, including policies and procedures for personal securities transactions, business continuity and information security and (viii) information regarding the performance record of the Fund as compared to other mutual funds with similar investment strategies.
Throughout the process, including at the meeting, the Board had numerous opportunities to ask questions of and request additional materials from Holbrook. During the Meeting, the Board was advised by, and met in executive session with, the Board’s independent legal counsel, and received a memorandum from such independent counsel regarding their responsibilities under applicable law. The Board also noted that the evaluation process with respect to the Adviser was an ongoing one and that in this regard, the Board took into account discussions with management and information provided to the Board at prior meetings with respect to the services provided by the Adviser, including quarterly performance reports prepared by management. The Board noted that the information received and considered by the Board in connection with the Meeting and throughout the year was both written and oral.
Matters considered by the Board in connection with its approval of the Advisory Agreement included, among others, the following:
Nature, Extent and Quality of Services. The Board reviewed materials provided by Holbrook related to the Advisory Agreement with the Trust on behalf of the Fund, including: the Advisory Agreement; a description of the manner in which investment decisions are made and executed; a review of the financial condition of Holbrook; an overview of the personnel that perform advisory, compliance, and operational services for the Fund; a quarterly written report containing Holbrook’s performance commentary; Holbrook’s compliance program, including its business continuity policy and information systems security policy, and a code of ethics containing provisions reasonably necessary to prevent Access Persons, as that term is defined in Rule 17j-1 under the Investment Company Act of 1940 Act, from engaging in conduct prohibited by Rule 17j-1(b); information regarding risk management processes and liquidity management; an annual review of the operation of Holbrook’s compliance program; information regarding the Adviser’s compliance and regulatory history; and an independent report prepared by Broadridge analyzing the performance record, fees and expenses of the Fund as compared to other mutual funds with similar investment strategies.
In reaching its conclusions with respect to the nature and quality of services to be provided by Holbrook under the Advisory Agreement, the Board considered the level and sophistication of Holbrook’s employees’ asset management, risk management, operations and compliance experience. The Board considered that Holbrook had continued to add staff to support operations.
23
| Holbrook Income Fund |
| Supplemental Information (Unaudited) (Continued) |
| April 30, 2022 |
The Board noted that it was satisfied with the portfolio manager’s expertise and ability to manage the Fund’s portfolio in accordance with its investment objectives and strategy, and also noted that Holbrook had reported that it had extensive contact with its clients throughout the COVID-19 pandemic in order to manage client expectations. The Board also noted that on a regular basis it received and reviewed information from the Trust’s Chief Compliance Officer (CCO) regarding the Fund’s compliance policies and procedures established pursuant to Rule 38a-1 under the 1940 Act, which included evaluating the regulatory compliance systems of Holbrook and procedures reasonably designed to ensure compliance with federal securities laws. The Board noted that Holbrook appeared to have adequate capacity to operate both its investment and compliance program. The Board also noted that Holbrook had adopted cybersecurity and business continuity policies and procedures and was attentive to enhancing those areas commensurate with its growth. The Board also considered the significant risks assumed by the Adviser in connection with the services provided to the Fund, including entrepreneurial risk and ongoing risks including investment, operational, enterprise, litigation, regulatory and compliance risks with respect to the Fund.
The Board considered the financial condition and operations of the Adviser during the COVID-19 pandemic and noted that there had been no material disruption of the Adviser’s service to the Fund and that the Adviser had continued to provide the same level, quality and extent of services to the Fund.
In considering the nature, extent, and quality of the services provided by Holbrook, the Board also took into account its knowledge, acquired through discussions and reports during the preceding year and in past years, of Holbrook’s management and the quality of the performance of Holbrook’s duties. The Board concluded that Holbrook had sufficient quality and depth of personnel, resources, investment methods, and compliance policies and procedures to perform its duties under the Advisory Agreement and that the nature, overall quality and extent of the advisory services provided by Holbrook to the Fund were satisfactory and reliable.
Performance. In considering the Fund’s performance, the Board noted that it reviewed at its regularly scheduled meetings information about the Fund’s performance results. Among other data, the Board considered the performance of the Fund for the one-year, three-year, five-year and since inception periods ended January 31, 2022 as compared to the Fund’s benchmark index (Bank of America/Merrill Lynch 1-3 Year U.S. Corporate & Government Bond Index) and against the performance of a group of peer funds (the “Peer Group”) provided by Broadridge, an independent third-party data provider. The Board noted that while it found the data provided by the independent third -party generally useful it recognized its limitations, including in particular that the data may vary depending on the end date selected and that the results of the performance comparisons may vary depending on the selection of the peer group. The Board considered that the Fund’s return exceeded its Peer Group median, Morningstar category median and benchmark returns for each of the one-year, three-year and five-year periods, and for the since inception period, the Fund exceeded its Morningstar category median and benchmark returns. The Board considered that for the one-year period the Fund ranked first in its Peer Group. The Board also took into account a peer group prepared by Holbrook that Holbrook believed was comprised of funds more closely aligned with the Holbrook Fund’s investment strategy, and similarly found that the Holbrook Fund outperformed the mean of the adviser-selected peers for each period measured.
The Board also took into account management’s discussion of the Fund’s performance, including the quarterly written report containing Holbrook’s performance commentary, as well as the factors that contributed to the Fund’s performance. The Board concluded that the Fund’s overall performance was satisfactory and that Holbrook was expected to obtain acceptable level of investment returns for shareholders of the Fund.
Fees and Expenses. Regarding the costs of the services provided by Holbrook with respect to the Fund, the Board considered a comparison of the Fund’s contractual advisory fee and net expense ratio to those of the funds within the Peer Group and to its Morningstar category. The Board noted that the Fund’s contractual advisory fee was above the median of the Peer Group and its Morningstar category but was not the highest of its Morningstar category. The Board also considered that the net operating expenses of the Fund were above the median of its Peer
24
| Holbrook Income Fund |
| Supplemental Information (Unaudited) (Continued) |
| April 30, 2022 |
Group and Morningstar category but were not the highest of its Peer Group or Morningstar category.
The Board also took into account a peer group prepared by Holbrook that Holbrook believed was comprised of funds more closely aligned with the Holbrook Fund’s investment strategy, and found that the Holbrook Fund’s advisory fee was lower than the mean of the peers and that the Holbrook Fund’s net expenses were also lower than the mean of the peers. The Board also took into account that the Holbrook had agreed to waive its fees and/or reimburse Fund expenses to limit total annual operating expenses (exclusive of (i) any front-end or contingent deferred loads; (ii) taxes; (iii) interest; (iv) brokerage commissions; (v) expenses incurred in connection with any merger or reorganization; (vi) underlying fund fees and expenses; or (vii) extraordinary expenses such as litigation) to 1.30%, 1.80% and 1.55% for Class I, Investor Class and Class A shares, respectively, although the Fund had operated below these expense limits in the prior year. The Board also considered the sophistication of the portfolio management with respect to the Fund’s strategy and based on the factors above, the Board concluded that the advisory fee of the Fund was not unreasonable.
Profitability. The Board considered Holbrook’s profitability and whether these profits were reasonable in light of the services provided to the Fund. The Board reviewed a profitability analysis prepared by Holbrook based on current asset levels of the Fund. The Board noted the direct and indirect costs of operating the Fund in that analysis, and that factoring all applicable costs, Holbrook’s net profitability from the Advisory Agreement and related to the Fund as a whole were not unreasonable. The Board concluded that Holbrook’s profitability from its relationship with the Fund was not excessive.
Economies of Scale. The Board considered whether Holbrook would realize economies of scale with respect to its management of the Fund as the Fund grows and whether fee levels reflected these economies of scale for the benefit of shareholders. The Board noted that the advisory fee did not currently have breakpoints. The Board considered the profitability analysis provided by Holbrook and the Adviser’s discussion of the same, including both direct and indirect costs borne by the Adviser in managing the Fund, as well as the Adviser’s discussion of the current fee structure. The Board noted that it would revisit whether economies of scale exist in the future once the Fund has achieved sufficient size.
Other Benefits. The Board also considered the character and amount of any other direct and incidental benefits received by Holbrook from its association with the Fund. The Board considered that Holbrook did not anticipate receiving any direct, indirect or ancillary material “fall-out” benefits from its relationship with the Fund, although the Board noted that certain reputational benefits may result from the relationship as well as the use of soft dollars. The Board concluded that these potential benefits are reasonable.
Conclusion. The Board, having requested and received such information from Holbrook as it believed reasonably necessary to evaluate the terms of the Advisory Agreement, and having been advised by independent counsel that the Board had appropriately considered and weighed all relevant factors, determined that approval of Advisory Agreement for an additional one-year term was in the best interests of the Fund and its shareholders.
In considering the Advisory Agreement renewal, the Board considered a variety of factors, including those discussed above, and also considered other factors (including conditions and trends prevailing generally in the economy, the securities markets, and the industry). The Board did not identify any one factor as determinative, and each Independent Trustee may have weighed each factor differently. The Board’s conclusions may be based in part on its consideration of the advisory arrangements in prior years and on the Board’s ongoing regular review of fund performance and operations throughout the year.
25
| Holbrook Income Fund |
| Expense Example (Unaudited) |
| April 30, 2022 |
As a shareholder of the Holbrook Income Fund (the “Fund”), you incur two types of costs: (1) transaction costs, including sales charges (loads) on purchases, contingent deferred sales charges (CDSCs) and redemption fees; and (2) ongoing costs, including management fees, distribution and/or service (12b-1) fees, and other Fund expenses. This example is intended to help you understand your ongoing costs (in dollars) of investing in the Holbrook Income Fund and to compare these costs with the ongoing costs of investing in other mutual funds.
The example is based on an investment of $1,000 invested at the beginning of the period and held for the six month period from November 1, 2021, through April 30, 2022.
Actual Expenses
The “Actual Expenses” line in the table below provides information about actual account values and actual expenses. You may use the information below, together with the amount you invested, to estimate the expenses that you paid over the period. Simply divide your account value by $1,000 (for example, an $8,600 account value divided by $1,000 = 8.6), then multiply the result by the number in the table under the heading entitled “Expenses Paid During Period” to estimate the expenses you paid on your account during this period.
Hypothetical Example for Comparison Purposes
The “Hypothetical” line in the table below provides information about hypothetical account values and hypothetical expenses based on the Fund’s actual expense ratio and an assumed rate of return of 5% per year before expenses, which is not the Fund’s actual return. The hypothetical account values and expenses may not be used to estimate the actual ending account balances or expenses you paid for the period. You may use this information to compare this 5% hypothetical example with the 5% hypothetical examples that appear in the shareholder reports of other funds.
Please note that the expenses shown in the table are meant to highlight your ongoing costs only and do not reflect any transactional costs, such as redemption fees. Therefore, the table is useful in comparing ongoing costs only, and will not help you determine the relative total costs of owning different funds. In addition, if these transactional costs were included, your costs would have been higher.
| Beginning | Annualized | Ending | Expenses | |||||||||||||
| Account | Expense Ratio | Account | Paid During | |||||||||||||
| Value 11/01/2021 | For the period | Value 4/30/2022 | the Period* | |||||||||||||
| Actual | ||||||||||||||||
| Class I | $ | 1,000.00 | 1.11 | % | $ | 987.10 | $ | 5.46 | ||||||||
| Investor Class | 1,000.00 | 1.61 | % | 985.70 | 7.92 | |||||||||||
| Class A | 1,000.00 | 1.36 | % | 985.80 | 6.68 | |||||||||||
| Beginning | Annualized | Ending | Expenses | |||||||||||||
| Account | Expense Ratio | Account | Paid During | |||||||||||||
| Value 11/01/2021 | For the period | Value 4/30/2022 | the Period* | |||||||||||||
| Hypothetical | ||||||||||||||||
| Class I | $ | 1,000.00 | 1.11 | % | $ | 1,019.30 | $ | 5.55 | ||||||||
| Investor Class | 1,000.00 | 1.61 | % | 1,016.82 | 8.04 | |||||||||||
| Class A | 1,000.00 | 1.36 | % | 1,018.06 | 6.79 | |||||||||||
| * | Expenses are equal to the Fund’s annualized expense ratio, multiplied by the number of days in the period (181) divided by the number of days in the fiscal year (365). |
26
| Holbrook Income Fund |
| SUPPLEMENTAL INFORMATION (Unaudited) |
| April 30, 2022 |
Trustees and Officers. The Trustees and officers of the Trust, together with information as to their principal business occupations during the past five years and other information, are shown below. Unless otherwise noted, the address of each Trustee and Officer is 225 Pictoria Drive, Suite 450, Cincinnati, OH 45246.
Independent Trustees *
| Name, Address, Year of Birth | Position(s) Held with Registrant | Term and Length Served | Principal Occupation(s) During Past 5 Years | Number of Portfolios Overseen In The Fund Complex** | Other Directorships Held During Past 5 Years |
| Mark Garbin Year of Birth: 1951 | Trustee | Indefinite, Since 2012 | Managing Principal, Coherent Capital Management LLC (since 2008) | 1 | Northern Lights Fund Trust (since 2013); Northern Lights Variable Trust (since 2013); Forethought Variable Insurance Trust (since 2013); OHA Mortgage Strategies Fund (offshore), Ltd. (2014 -2017); iCapital KKR Private Markets Fund (since 2014); and Carlyle Tactical Private Credit Fund (since March 2018) |
| Mark D. Gersten Year of Birth: 1950 | Chairman, Trustee | Indefinite, Since 2012 | Independent Consultant (since 2012); Senior Vice President – Global Fund Administration Mutual Funds & Alternative Funds, AllianceBernstein LP (1985 – 2011) | 1 | Northern Lights Fund Trust (since 2013); Northern Lights Variable Trust (since 2013); iCapital KKR Private Markets Fund (since 2014); previously, Ramius Archview Credit and Distressed Fund (2015-2017); and Schroder Global Series Trust (2012 to 2017) |
| Neil M. Kaufman Year of Birth: 1960 | Trustee, Audit Committee Chairman | Indefinite, Since 2012 | Managing Member, Kaufman, McGowan PLLC (legal services)(Since 2016); Partner, Abrams Fensterman, Fensterman, Eisman, Formato, Ferrara & Wolf, LLP (legal services)(2010-2016) | 1 | iCapital KKR Private Markets Fund (since 2014) |
| Anita K. Krug Year of Birth: 1969 | Trustee | Indefinite, Since 2012 | Dean and Professor (since 2019) Illinois Institute of Technology; Interim Vice Chancellor for Academic Affairs (2018-2019) University of Washington Bothell; Interim Dean (2017- 2018), Professor (2016-2019), Associate Professor (2014-2016); and Assistant Professor (2010-2014), University of Washington School of Law | 1 | iCapital KKR Private Markets Fund (since 2014); Centerstone Investors Trust (2016-2021) |
04/30/22 – Two Roads v1
27
| Holbrook Income Fund |
| SUPPLEMENTAL INFORMATION (Unaudited)(Continued) |
| April 30, 2022 |
Officers of the Trust*
| Name, Address, Year of Birth | Position(s) Held with Registrant | Principal Occupation(s) During Past 5 Years | Number of Portfolios Overseen In The Fund Complex** | Other Directorships Held During Past 5 Years |
| James Colantino 80 Arkay Drive Hauppauge, NY 11788 Year of Birth: 1969 | President Since Feb. 2017 Treasurer (2012 to 2017) | Senior Vice President (2012- present); Vice President (2004 to 2012); Ultimus Fund Solutions LLC | N/A | N/A |
| Laura Szalyga 80 Arkay Drive Hauppauge, NY 11788 Year of Birth: 1978 | Treasurer Since Feb. 2017 | Vice President, Ultimus Fund Solutions LLC (since 2015); Assistant Vice President, Ultimus Fund Solutions LLC (2011-2014) | N/A | N/A |
| Richard A. Malinowski 80 Arkay Drive Hauppauge, NY 11788 Year of Birth: 1983 | Vice President Since Sep. 2018 Secretary Since 2013 | Senior Vice President and Senior Managing Counsel, Ultimus Fund Solutions LLC, (since February 2020); Senior Vice President Legal Administration, Ultimus Fund Solutions LLC (April 2017 to February 2020); Vice President and Counsel (April 2016 – 2017) and AVP and Staff Attorney (September 2012 – March 2016). | N/A | N/A |
| William B. Kimme Year of Birth: 1962 | Chief Compliance Officer Since Inception | Senior Compliance Officer, Northern Lights Compliance Services, LLC (September 2011 - present) | N/A | N/A |
| * | Information is as of April 30, 2022. |
| ** | As of April 30, 2022, the Trust was comprised of 25 active portfolios managed by seven unaffiliated investment advisers and two affiliated investment advisers. The term “Fund Complex” applies only to those funds that (i) are advised by a common investment adviser or by an investment adviser that is an affiliated person of the investment adviser of any of the other funds in the Trust or (ii) hold themselves out to investors as related companies for purposes of investment and investor services. As of April 30, 2022, the Fund did not share the same investment adviser with any other series of the Trust or hold itself out as related to any other series of the Trust for investment purposes. |
The Fund’s Statement of Additional Information (“SAI”) includes additional information about the Trustees and is available free of charge, upon request, by calling toll-free at 1-877-345-8648.
04/30/22 – Two Roads v1
28
PRIVACY NOTICE
| FACTS | WHAT DOES TWO ROADS SHARED TRUST DO WITH YOUR PERSONAL INFORMATION |
| Why? | Financial companies choose how they share your personal information. |
| Federal law gives consumers the right to limit some but not all sharing. | |
| Federal law also requires us to tell you how we collect, share, and protect your personal information. Please read this notice carefully to understand what we do. | |
| What? | THE TYPES OF PERSONAL INFORMATION WE COLLECT AND SHARE DEPENDS ON THE PRODUCT OR SERVICE THAT YOU HAVE WITH US. THIS INFORMATION CAN INCLUDE: |
| ● Social Security number and income | |
| ● Account transactions and transaction history | |
| ● Investment experience and purchase history | |
| When you are no longer our customer, we continue to share your information as described in this notice. | |
| How? | All financial companies need to share customers’ personal information to run their everyday business. In the section below, we list the reasons financial companies can share their customers’ personal information; the reason Two Roads Shared Trust chooses to share and whether you can limit this sharing. |
| Reasons we can share your personal information | Does Two Roads Shared Trust share? | Can you limit this sharing? |
| For our everyday business purposes – | ||
| such as to process your transactions, maintain your account(s), respond to court orders and legal investigations, or report to credit bureaus | YES | NO |
| For our marketing purposes – | NO | We do not share |
| to offer our products and services to you | ||
| For joint marketing with other financial companies | NO | We do not share |
| For our affiliates’ everyday business purposes – | NO | We do not share |
| information about your transactions and experiences | ||
| For our affiliates’ everyday business purposes – | NO | We do not share |
| information about your creditworthiness | ||
| For our affiliates to market to you | NO | We do not share |
| For nonaffiliates to market to you | NO | We do not share |
| Questions? | Call 1-402-895-1600 |
29
What we do
| How does Two Roads Shared Trust protect my personal information? | To protect your personal information from unauthorized access and use, we use security measures that comply with federal law. |
| Our service providers are held accountable for adhering to strict policies and procedures to prevent any misuse of your nonpublic personal information. | |
| How does Two Roads Shared Trust | We collect your personal information, for example, when you |
| collect my personal information? | |
| ● open an account or give us contact information | |
| ● provide account information or give us your income information | |
| ● make deposits or withdrawals from your account | |
| We also collect your personal information from other companies. | |
| Why can’t I limit all sharing? | Federal law gives you the right to limit only |
| ● sharing for affiliates’ everyday business purposes – information about your creditworthiness | |
| ● affiliates from using your information to market to you | |
| ● sharing for nonaffiliates to market to you | |
| State laws and individual companies may give you additional rights to limit sharing | |
| Definitions | |
| Affiliates | Companies related by common ownership or control. They can be financial and nonfinancial companies. |
| ● Two Roads Shared Trust has no affiliates. | |
| Nonaffiliates | Companies not related by common ownership or control. They can be financial and nonfinancial companies. |
| ● Two Roads Shared Trust does not share with nonaffiliates so they can market to you. | |
| Joint marketing | A formal agreement between nonaffiliates financial companies that together market financial products or services to you. |
| ● Two Roads Shared Trust does not jointly market. |
30
Proxy Voting Policy
Information regarding how the Fund votes proxies relating to portfolio securities for the 12 month period ended June 30th as well as a description of the policies and procedures that the Fund used to determine how to vote proxies is available without charge, upon request, by calling 1-877-345-8646 or by referring to the Securities and Exchange Commission’s (“SEC”) website at http://www.sec.gov.
Portfolio Holdings
The Fund files its complete schedule of portfolio holdings with the SEC for the first and third quarters of each fiscal year on Form N-PORT. Form N-PORT is available on the SEC’s website at http://www.sec.gov. The information on Form N-PORT is available without charge, upon request, by calling 1-877-345-8646.
This report and the financial statements contained herein are submitted for the general information of shareholders and are not authorized for distribution to prospective investors unless preceded or accompanied by an effective prospectus, which contains information about the Fund’s investment objective, risks, fees and expenses. Investors are reminded to read the prospectus carefully before investing in the Fund.
| Investment Advisor |
| Holbrook Holdings Inc |
| 1032 Windy Elm Drive |
| Smyrna, GA 30082 |
| Administrator |
| Ultimus Fund Solutions, LLC |
| 225 Pictoria Drive, Suite 450 |
| Cincinnati, OH 45246 |
| Holbrook-A22 |
ITEM 2. CODE OF ETHICS.
| (a) | The registrant has, as of the end of the period covered by this report, adopted a code of ethics that applies to the registrant's principal executive officer, principal financial officer, and principal accounting officer or controller, or persons performing similar functions, regardless of whether these individuals are employed by the registrant or a third party. |
| (c) | During the period covered by this report, there were no amendments to any provision of the code of ethics. |
| (d) | During the period covered by this report, there were no waivers or implicit waivers of a provision of the code of ethics. |
ITEM 3. AUDIT COMMITTEE FINANCIAL EXPERT.
| The registrant’s Board of Trustees has determined that Mark Gersten is an audit committee financial expert, as defined in Item 3 of Form N-CSR. Mr. Gersten is independent for purposes of this Item 3. |
ITEM 4. PRINCIPAL ACCOUNTANT FEES AND SERVICES.
| (a) | Audit Fees. The aggregate fees billed for each of the last two fiscal years for professional services rendered by the registrant's principal accountant for the audit of the registrant's annual financial statements or services that are normally provided by the accountant in connection with statutory and regulatory filings or engagements for those fiscal years are as follows:
|
| Trust Series | 2022 | 2021 |
| Holbrook Income Fund | 16,500 | 17,250 |
| (b) | Audit-Related Fees. There were no fees billed in each of the last two fiscal years for assurances and related services by the principal accountant that are reasonably related to the performance of the audit of the registrant’s financial statements and are not reported under paragraph (a) of this item. |
| (c) | Tax Fees. The aggregate fees billed in each of the last two fiscal years for professional services rendered by the principal accountant for tax compliance are as follows: |
| Trust Series | 2022 | 2021 |
| Holbrook Income Fund | 3,200 | 2,950 |
| (d) | All Other Fees. The aggregate fees billed in each of the last two fiscal years for products and services provided by the registrant’s principal accountant, other than the services reported in paragraphs (a) through (c) of this Item were $0 and $0 for the fiscal years ended April 30, 2022 and 2021, respectively. |
| (e)(1) | The audit committee does not have pre-approval policies and procedures. Instead, the audit committee or audit committee chairman approves on a case-by-case basis each audit or non-audit service before the principal accountant is engaged by the registrant. |
| (e)(2) | There were no services described in each of paragraphs (b) through (d) of this Item that were approved by the audit committee pursuant to paragraph (c)(7)(i)(C) of Rule 2-01 of Regulation S-X. |
| (f) | Not applicable. The percentage of hours expended on the principal accountant's engagement to audit the registrant's financial statements for the most recent fiscal year that were attributed to work performed by persons other than the principal accountant's full-time, permanent employees was zero percent (0%). |
| (g) | All non-audit fees billed by the registrant's principal accountant for services rendered to the registrant for the fiscal years ended April 30, 2022 and 2021, respectively, are disclosed in (b)-(d) above. There were no audit or non-audit services performed by the registrant's principal accountant for the registrant's adviser. |
| (h) | Not applicable. |
(i) (j) | Not applicable. Not applicable. |
ITEM 5. AUDIT COMMITTEE OF LISTED REGISTRANTS. Not applicable to open-end investment companies.
ITEM 6. INVESTMENTS. - Schedule of investments in securities of unaffiliated issuers is included under Item 1.
ITEM 7. DISCLOSURE OF PROXY VOTING POLICIES AND PROCEDURES FOR CLOSED-END MANAGEMENT INVESTMENT COMPANIES.
Not applicable to open-end management investment company
ITEM 8. PORTFOLIO MANAGERS OF CLOSED-END MANAGEMENT INVESTMENT COMPANIES
Not applicable to open-end management investment company
ITEM 9. PURCHASES OF EQUITY SECURITIES BY CLOSED-END MANAGEMENT INVESTMENT COMPANY AND AFFILIATED PURCHASERS.
Not applicable to open-end management investment company
ITEM 10. SUBMISSION OF MATTERS TO A VOTE OF SECURITY HOLDERS.
Not applicable at this time.
ITEM 11. CONTROLS AND PROCEDURES.
| (a) | Based on an evaluation of the Registrant’s disclosure controls and procedures as of a date within 90 days of filing date of this Form N-CSR, the principal executive officer and principal financial officer of the Registrant have concluded that the disclosure controls and procedures of the Registrant are reasonably designed to ensure that the information required in filings on Form N-CSR is recorded, processed, summarized, and reported by the filing date, including that information required to be disclosed is accumulated and communicated to the Registrant’s management, including the Registrant’s principal executive officer and principal financial officer, as appropriate to allow timely decisions regarding required disclosure. |
| (b) | There were no changes in the Registrant’s internal control over financial reporting that occurred during the Registrant’s last fiscal half-year that have materially affected, or are reasonably likely to materially affect, the Registrant’s internal control over financial reporting. |
ITEM 12. DISCLOSURE OF SECURITIES LENDING ACTIVITIES FOR CLOSED-END MANAGEMENT INVESTMENT COMPANIES
Not applicable to open-end management investment company
ITEM 13. EXHIBITS
(a)(1) Code of Ethics for Principal Executive and Senior Financial Officers is attached hereto.
(a)(3) Not applicable.
SIGNATURES
Pursuant to the requirements of the Securities Exchange Act of 1934 and the Investment Company Act of 1940, the registrant has duly caused this report to be signed on its behalf by the undersigned, thereunto duly authorized.
Two Roads Shared Trust
| By James Colantino | /s/ James Colantino |
| Principal Executive Officer/President | |
| Date: July 7, 2022 | |
Pursuant to the requirements of the Securities Exchange Act of 1934 and the Investment Company Act of 1940, this report has been signed below by the following person on behalf of the registrant and in the capacities and on the date indicated.
| By Laura Szalyga | /s/ Laura Szalyga |
| Principal Financial Officer/Treasurer | |
| Date: July 7, 2022 | |