united states
securities and exchange commission
washington, d.c. 20549
form n-csr
certified shareholder report of registered management
investment companies
Investment Company Act file number 811-22718
Two Roads Shared Trust
(Exact name of registrant as specified in charter)
225 Pictoria Drive, Suite 450, Cincinnati, Ohio 45246
(Address of principal executive offices) (Zip code)
The Corporation Trust Company
1209 Orange Street, Wilmington, DE 19801
(Name and address of agent for service)
Registrant's telephone number, including area code: 631-490-4300
Date of fiscal year end: 7/31
Date of reporting period: 7/31/23
ITEM 1. REPORTS TO SHAREHOLDERS.
 |
| Anfield Universal Fixed Income ETF |
| AFIF |
| July 31, 2023 |
| Annual Report |
| Advised by: |
| Regents Park Funds, LLC |
| 4041 MacArthur Blvd., Suite 155 |
| Newport Beach, CA 92660 |
| RegentsParkFunds.com |
| 1-866-866-4848 |
| Distributed by Northern Lights Distributors, LLC |
| Member FINRA |
 |  |
August 2023
Annual Letter to Shareholders of the Anfield Universal Fixed Income ETF (AFIF)
General Fund Update
The Anfield Universal Fixed Income ETF (“AFIF” or “the Fund”) continued to navigate a rising rate environment throughout the fiscal year ended July 31st, 2023. Since mid-March 2022, the U.S. Federal Reserve has tightened a cumulative 525 bps, taking the Federal Funds Rate from a range of 0.00-0.25% to the current range of 5.25-5.50%, the highest rate in over 20 years.
Update on Performance
The Fund returned 4.83% net of all fees and expenses for the fiscal year ended July 31st, 2023. The Bloomberg U.S. Aggregate Bond Index returned -3.37%, the Bloomberg Intermediate U.S. Aggregate Bond Index returned -2.57%, the Bloomberg Global Aggregate Bond Index returned -2.71%, and the ICE BofAML US Dollar Libor 3 Month Constant Maturity Indexed returned 3.91%. AFIF’s performance beat all 4 indices, though the Fund is not managed to any benchmark. The Fund benefited from a lower duration positioning, 1-3 years, versus the aggregate bond indices mentioned previously which have a duration ranging from 6-7 years, though past performance does not guarantee future results.
In mid-October 2022, the Fund slumped to its lowest point of the period -2.54% net of all fees from the start of the fiscal year, due to a general bond market sell-off as the U.S. Federal Reserve began raising rates. Following the initial slump, Fund performance turned around and showed positive returns for the next ~4 months as fixed income markets normalized. From February 2023 to late March 2023, the Fund lost ~1.65% net of all fees before beginning yet another climb that would see the Fund end the fiscal year up 4.83% net of all fees.
Current Positioning
As of July 31, 2023, the Fund holds a majority of its assets in Corporate Bonds (50%), Collateralized Loan Obligations (25%), and Collateralized Mortgage Obligations (9%). Looking forward, we continue to emphasize high quality, yield-enhancing corporate credit (low BBB / high BB), mortgage-backed, and asset-backed security allocations while favoring the front-end of the yield curve as we do not believe the Fund will be compensated appropriately to extend further out and take on additional risk. We also believe the shape of the yield curve(flat to inverted), which we expect to persist for the next 6-12 months, makes floating rate instruments particularly attractive, with coupons well north of 8%. In AFIF, these positions make up ~35% of the portfolio. The Fund’s non-conformance with traditional fixed income benchmark-specific guidelines allows the portfolio managers to express their outlook fully; allowing them to take greater exposure in areas where they see opportunity, and avoid certain markets altogether. In the current fixed-income market environment, we believe the risk / reward tradeoff is more favorable to credit rather than interest rate / duration.
On behalf of the entire staff at Anfield Capital Management, we thank you for your continued support.

David Young, CFA
CEO & Founder
1
The views in this report are those of the Fund’s management. This report contains certain forward-looking statements about factors that may affect the performance of the Fund in the future. These statements are based on the Fund’s management’s predictions and expectations concerning certain future events such as the performance of the economy as a whole and of specific industry sectors. Management believes these forward-looking statements are reasonable, although they are inherently uncertain and difficult to predict.
6391-NLD-0818223
2
Anfield Universal Fixed Income ETF
PORTFOLIO REVIEW (Unaudited)
July 31, 2023
The Fund’s performance figures* for the periods ended July 31, 2023, as compared to its benchmark:
| Inception *** | ||
| One Year | through July 31, 2023 | |
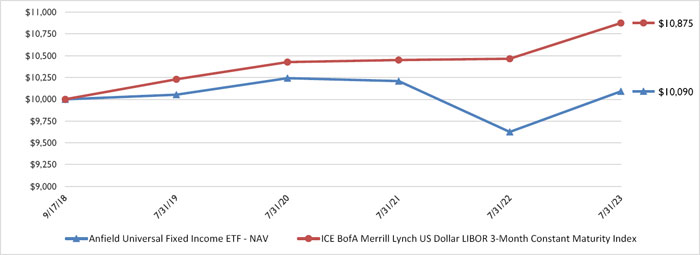
| Anfield Universal Fixed Income ETF - NAV | 4.83% | 0.18% |
| Anfield Universal Fixed Income ETF - Market Price | 4.72% | 0.11% |
| ICE BofA Merrill Lynch US Dollar LIBOR 3-Month Constant Maturity Index ** | 3.91% | 1.74% |
| * | The performance data quoted here represents past performance. Current performance may be lower or higher than the performance data quoted above. Investment return and principal value will fluctuate, so that shares, when redeemed, may be worth more or less than their original cost. The returns shown do not reflect the deduction of taxes that a shareholder would pay on Fund distributions or on the redemptions of Fund shares. Past performance is no guarantee of future results. Performance figures for periods less than 1 year are not annualized. The Fund’s adviser has contractually agreed to reduce the Fund’s fees and/or absorb expenses of the Fund until at least November 30, 2023 to ensure that total annual Fund operating expenses after fee waiver and reimbursement (exclusive of any taxes, interest, brokerage commissions, expenses incurred in connection with any merger or reorganization, indirect expenses, expenses of other investment companies in which the Fund may invest, or extraordinary expenses such as litigation) will not exceed 1.50% of average daily net assets. This agreement may be terminated by the Fund’s Board of Trustees on 60 days’ written notice to the adviser. These fee waivers and expense reimbursements are subject to possible recoupment from the Fund in future years on a rolling three year basis (within the three years after the fees have been waived or reimbursed) if such recoupment can be achieved without exceeding the foregoing expense limits as well as any expense limitation that was in effect at the time the waiver or reimbursement was made. The Fund’s total annual operating expenses (including underlying fund fees) after fee waiver and expense reimbursement is 1.00% and without waiver or reimbursement the gross operating expenses (including underlying fund fees) is 1.00%, per the most recent prospectus. Please review the Fund’s most recent prospectus for more detail on the expense waiver. |
The Fund’s per share net asset value or “NAV” is the value of one share of the Fund as calculated in accordance with the standard formula for valuing exchange traded fund shares. The NAV return is based on the NAV of the Fund and the market return is based on the Market Price per share of the Fund. The price used to calculate market return (“Market Price”) is determined by using the midpoint between the highest bid and the lowest offer on the primary stock exchange on which shares of the Fund are listed for trading, as of the time that the Fund’s NAV is calculated. Beginning November 2, 2020, Market Price returns are calculated using the closing price and account for distributions from the Fund. Prior to November 2, 2020, Market Price returns were calculated using the midpoint price and accounted for distributions from the Fund. Market Price and NAV returns assume that dividends and capital gain distributions have been reinvested in the Fund at Market Price and NAV, respectively.
| ** | The ICE BofA Merrill Lynch US Dollar LIBOR 3-Month Constant Maturity Index is designed to track the performance of a synthetic asset paying LIBOR to a stated maturity. The index is based on the assumed purchase at par of a synthetic instrument having exactly its stated maturity and with a coupon equal to that day’s fixing rate. That issue is assumed to be sold the following business day (priced at a yield equal to the current day fixing rate) and rolled into a new instrument. Investors cannot invest directly in an index or benchmark. Index returns are gross of any fees, brokerage commissions or other expenses of investing. |
| *** | As of the close of business on the day of commencement of trading on September 18, 2018. |
Comparison of the Change in Value of a $10,000 Investment
Portfolio Composition as of July 31, 2023:
| Top 10 Industry/Asset Class Allocations | % of Net Assets | |||
| Asset Backed Securities - CLO | 24.9 | % | ||
| Corporate Bonds - Banking | 11.6 | % | ||
| Collateralized Mortgage Obligations | 9.2 | % | ||
| Exchange-Traded Funds - Fixed Income | 6.1 | % | ||
| Corporate Bonds - Automotive | 6.0 | % | ||
| Corporate Bonds - Specialty Finance | 5.2 | % | ||
| Corporate Bonds - Real Estate Investment Trusts | 4.4 | % | ||
| Corporate Bonds - Telecommunications | 4.4 | % | ||
| Corporate Bonds - Asset Management | 3.3 | % | ||
| Term Loans - Transportation & Logistics | 2.9 | % | ||
| Other Assets Less Liabilities | 22.0 | % | ||
| 100.0 | % | |||
Please refer to the Schedule of Investments in this Annual Report for a detailed analysis of the Fund’s holdings.
3
| Anfield Universal Fixed Income ETF |
| SCHEDULE OF INVESTMENTS |
| July 31, 2023 |
| Shares | Fair Value | |||||||||||||
| EXCHANGE-TRADED FUNDS — 6.1% | ||||||||||||||
| FIXED INCOME - 6.1% | ||||||||||||||
| 169,500 | Invesco Fundamental High Yield Corporate Bond ETF | $ | 2,979,810 | |||||||||||
| 28,100 | SPDR Blackstone Senior Loan ETF | 1,178,514 | ||||||||||||
| 31,800 | SPDR Bloomberg High Yield Bond ETF | 2,949,450 | ||||||||||||
| 7,107,774 | ||||||||||||||
| TOTAL EXCHANGE-TRADED FUNDS (Cost $7,614,357) | 7,107,774 | |||||||||||||
| Principal | Coupon Rate | |||||||||||||
| Amount ($) | Spread | (%) | Maturity | Fair Value | ||||||||||
| ASSET BACKED SECURITIES — 25.0% | ||||||||||||||
| CLO — 24.9% | ||||||||||||||
| 2,000,000 | Apidos CLO XV Series 2013-15A DRR(a),(b) | TSFR3M + 2.962% | 8.2880 | 04/20/31 | 1,873,648 | |||||||||
| 500,000 | Ares XXXIIR CLO Ltd. Series 2014-32RA C(a),(b) | TSFR3M + 2.900% | 8.2210 | 05/15/30 | 469,497 | |||||||||
| 2,000,000 | Benefit Street Partners Clo XII Ltd. Series 2017-12A C(a),(b) | TSFR3M + 3.312% | 8.6200 | 10/15/30 | 1,940,532 | |||||||||
| 2,000,000 | BlueMountain Fuji US CLO II Ltd. Series 2017-2A C(a),(b) | TSFR3M + 3.262% | 8.5880 | 10/20/30 | 1,801,068 | |||||||||
| 250,000 | Carlyle Global Market Strategies CLO Ltd. Series 2013-4A CRR(a),(b) | TSFR3M + 2.012% | 7.3200 | 01/15/31 | 243,729 | |||||||||
| 2,000,000 | Carlyle US CLO Ltd. Series 2018-2A C(a),(b) | TSFR3M + 2.900% | 8.4700 | 10/15/31 | 1,887,899 | |||||||||
| 1,400,000 | Cedar Funding IX CLO Ltd. Series 2018-9A D(a),(b) | TSFR3M + 2.862% | 8.1880 | 04/20/31 | 1,336,371 | |||||||||
| 1,000,000 | Columbia Cent CLO Ltd. Series 2018-28A C(a),(b) | TSFR3M + 3.420% | 8.7440 | 11/07/30 | 845,554 | |||||||||
| 1,500,000 | Dryden 37 Senior Loan Fund Series 2015-37A ER(a),(b) | TSFR3M + 5.412% | 10.7200 | 01/15/31 | 1,204,862 | |||||||||
| 1,600,000 | Dryden 55 CLO Ltd. Series 2018-55A D(a),(b) | TSFR3M + 3.112% | 8.4200 | 04/15/31 | 1,458,846 | |||||||||
| 1,500,000 | Greenwood Park CLO Ltd. Series 2018-1A D(a),(b) | TSFR3M + 2.762% | 8.0700 | 04/15/31 | 1,386,340 | |||||||||
| 2,000,000 | Mountain View CLO IX Ltd. Series 2015-9A CR(a),(b) | TSFR3M + 3.382% | 8.6900 | 07/15/31 | 1,773,268 | |||||||||
| 1,000,000 | Oaktree CLO Ltd. Series 2019-1A D(a),(b) | TSFR3M + 4.062% | 9.4070 | 04/22/30 | 941,895 | |||||||||
| 2,000,000 | Octagon Investment Partners Ltd. Series 2018-18A D(a),(b) | TSFR3M + 5.772% | 11.0800 | 04/16/31 | 1,649,406 | |||||||||
| 2,150,000 | OZLM XXIV Ltd. Series 2019-24A C2(a),(b) | TSFR3M + 4.522% | 9.8480 | 07/20/32 | 1,938,317 | |||||||||
| 1,500,000 | Rockford Tower CLO Ltd. Series 2017-1A DR2B(a),(b) | TSFR3M + 5.242% | 10.5680 | 04/20/34 | 1,515,582 | |||||||||
| 1,750,000 | Shackleton CLO Ltd. Series 2014-5RA D(a),(b) | TSFR3M + 3.150% | 8.4740 | 05/07/31 | 1,605,756 | |||||||||
| 1,000,000 | Sound Point CLO VIII-R, Ltd. Series 2015-1RA E(a),(b) | TSFR3M + 6.862% | 12.1700 | 04/15/30 | 590,397 | |||||||||
| 2,025,000 | Steele Creek CLO Ltd. Series 2014-1RA D(a),(b) | TSFR3M + 3.062% | 8.3950 | 04/21/31 | 1,792,103 | |||||||||
| 2,000,000 | Venture XV CLO Ltd. Series 2013-15A DR2(a),(b) | TSFR3M + 4.182% | 9.4900 | 07/15/32 | 1,876,810 | |||||||||
| 1,000,000 | Zais Matrix CDO I Series 2022-18A D1(a),(b) | TSFR3M + 4.670% | 10.0210 | 01/25/35 | 953,780 | |||||||||
| 29,085,660 | ||||||||||||||
| COLLATERALIZED MORTGAGE OBLIGATIONS — 0.1% | ||||||||||||||
| 53,385 | Alternative Loan Trust Series 2007-J1 3A2(c) | 3.9920 | 11/25/36 | 49,177 | ||||||||||
See accompanying notes to financial statements.
4
| Anfield Universal Fixed Income ETF |
| SCHEDULE OF INVESTMENTS (Continued) |
| July 31, 2023 |
| Principal | Coupon Rate | |||||||||||||
| Amount ($) | Spread | (%) | Maturity | Fair Value | ||||||||||
| ASSET BACKED SECURITIES — 25.0% (Continued) | ||||||||||||||
| COLLATERALIZED MORTGAGE OBLIGATIONS — 0.1% (Continued) | ||||||||||||||
| 2,375,643 | BCAP, LLC Trust Series 2007-AA2 21IO(b),(d) | 0.4260 | 04/25/37 | $ | 27,278 | |||||||||
| 76,455 | ||||||||||||||
| TOTAL ASSET BACKED SECURITIES (Cost $31,944,274) | 29,162,115 | |||||||||||||
| Principal | Coupon Rate | |||||||||||||
| Amount ($) | Spread | (%) | Maturity | Fair Value | ||||||||||
| COLLATERALIZED MORTGAGE OBLIGATIONS — 9.2% | ||||||||||||||
| 181,383 | Fannie Mae Interest Strip Series 291 2(d) | 8.0000 | 11/25/27 | 16,307 | ||||||||||
| 88,233 | Fannie Mae Interest Strip Series 343 6(d) | 5.0000 | 10/25/33 | 10,583 | ||||||||||
| 103,758 | Fannie Mae Interest Strip Series 346 2(d) | 5.5000 | 12/25/33 | 19,180 | ||||||||||
| 62,804 | Fannie Mae Interest Strip Series 355 12(b),(d) | 6.0000 | 07/25/34 | 8,973 | ||||||||||
| 346,661 | Fannie Mae Interest Strip Series 364 2(d) | 4.5000 | 09/25/35 | 55,668 | ||||||||||
| 542,710 | Fannie Mae Interest Strip Series 365 4(d) | 5.0000 | 04/25/36 | 88,888 | ||||||||||
| 153,444 | Fannie Mae Interest Strip Series 384 28(b),(d) | 6.0000 | 05/25/36 | 28,630 | ||||||||||
| 84,783 | Fannie Mae Interest Strip Series 370 2(d) | 6.0000 | 06/25/36 | 19,534 | ||||||||||
| 778,689 | Fannie Mae Interest Strip Series 378 4(d) | 5.0000 | 07/25/36 | 150,508 | ||||||||||
| 571,119 | Fannie Mae Interest Strip Series 371 2(d) | 6.5000 | 07/25/36 | 121,752 | ||||||||||
| 142,386 | Fannie Mae Interest Strip Series 377 2(d) | 5.0000 | 10/25/36 | 26,131 | ||||||||||
| 1,673,766 | Fannie Mae Interest Strip Series 395 7(d) | 5.5000 | 11/25/36 | 330,509 | ||||||||||
| 88,420 | Fannie Mae Interest Strip Series 383 20(d) | 5.5000 | 07/25/37 | 15,070 | ||||||||||
| 451,126 | Fannie Mae Interest Strip Series 385 3(d) | 5.0000 | 01/25/38 | 77,292 | ||||||||||
| 503,459 | Fannie Mae Interest Strip Series 407 40(d) | 6.0000 | 01/25/38 | 99,596 | ||||||||||
| 854,013 | Fannie Mae Interest Strip Series 398 C9(d) | 6.0000 | 05/25/39 | 258,359 | ||||||||||
| 253,046 | Fannie Mae Interest Strip Series 396 2(d) | 4.5000 | 06/25/39 | 36,450 | ||||||||||
| 372,594 | Fannie Mae Interest Strip Series 399 2(d) | 5.5000 | 11/25/39 | 80,740 | ||||||||||
| 1,034,279 | Fannie Mae Interest Strip Series 408 C4(d) | 5.5000 | 11/25/40 | 197,840 | ||||||||||
| 379,567 | Fannie Mae Interest Strip Series 409 C18(d) | 4.0000 | 04/25/42 | 70,141 | ||||||||||
| 78,220 | Fannie Mae REMICS Series 2001-32 SA(b),(d) | SOFR30A + 7.836% | 2.7670 | 07/25/31 | 3,293 | |||||||||
| 476,581 | Fannie Mae REMICS Series 2003-7 SN(b),(d) | SOFR30A + 7.636% | 2.5670 | 02/25/33 | 49,640 | |||||||||
| 145,461 | Fannie Mae REMICS Series 2003-43 IY(d) | 6.0000 | 05/25/33 | 18,245 | ||||||||||
| 223,222 | Fannie Mae REMICS Series 2004-62 TP(b),(d) | SOFR30A + 38.500% | 5.5000 | 07/25/33 | 30,194 | |||||||||
| 283,341 | Fannie Mae REMICS Series 2004-70 XJ(b),(d) | 5.0000 | 10/25/34 | 46,640 | ||||||||||
| 209,182 | Fannie Mae REMICS Series 2004-91 DS(b),(d) | SOFR30A + 6.536% | 1.4670 | 12/25/34 | 13,640 | |||||||||
See accompanying notes to financial statements.
5
| Anfield Universal Fixed Income ETF |
| SCHEDULE OF INVESTMENTS (Continued) |
| July 31, 2023 |
| Principal | Coupon Rate | |||||||||||||
| Amount ($) | Spread | (%) | Maturity | Fair Value | ||||||||||
| COLLATERALIZED MORTGAGE OBLIGATIONS 9.2% (Continued) | ||||||||||||||
| 71,311 | Fannie Mae REMICS Series 2005-87 SE(b),(d) | SOFR30A + 5.936% | 0.8670 | 10/25/35 | $ | 3,916 | ||||||||
| 123,000 | Fannie Mae REMICS Series 2005-89 S(b),(d) | SOFR30A + 6.586% | 1.5170 | 10/25/35 | 8,149 | |||||||||
| 176,091 | Fannie Mae REMICS Series 2007-28 LS(b),(d) | SOFR30A + 6.511% | 1.4420 | 01/25/36 | 13,822 | |||||||||
| 22,250 | Fannie Mae REMICS Series 2006-8 WN(b),(d) | SOFR30A + 6.586% | 1.5170 | 03/25/36 | 1,955 | |||||||||
| 50,684 | Fannie Mae REMICS Series 2006-8 HL(b),(d) | SOFR30A + 6.586% | 1.5170 | 03/25/36 | 3,938 | |||||||||
| 1,428,962 | Fannie Mae REMICS Series 2007-18 BF(b),(d) | SOFR30A + 0.495% | 5.5630 | 04/25/36 | 211,280 | |||||||||
| 1,470,307 | Fannie Mae REMICS Series 2007-28 CF(b),(d) | SOFR30A + 0.505% | 5.5730 | 07/25/36 | 226,568 | |||||||||
| 129,495 | Fannie Mae REMICS Series 2006-101 SA(b),(d) | SOFR30A + 6.466% | 1.3970 | 10/25/36 | 11,136 | |||||||||
| 116,444 | Fannie Mae REMICS Series 2006-116 S(b),(d) | SOFR30A + 6.486% | 1.4170 | 12/25/36 | 8,767 | |||||||||
| 52,124 | Fannie Mae REMICS Series 2006-125 SM(b),(d) | SOFR30A + 7.086% | 2.0170 | 01/25/37 | 4,591 | |||||||||
| 218,125 | Fannie Mae REMICS Series 2007-36 SN(b),(d) | SOFR30A + 6.656% | 1.5870 | 04/25/37 | 20,023 | |||||||||
| 801,530 | Fannie Mae REMICS Series 2007-55 S(b),(d) | SOFR30A + 6.646% | 1.5770 | 06/25/37 | 41,187 | |||||||||
| 88,473 | Fannie Mae REMICS Series 2007-72 EK(b),(d) | SOFR30A + 6.286% | 1.2170 | 07/25/37 | 7,498 | |||||||||
| 108,914 | Fannie Mae REMICS Series 2007-66 AS(b),(d) | SOFR30A + 6.486% | 1.4170 | 07/25/37 | 7,060 | |||||||||
| 698,104 | Fannie Mae REMICS Series 2007-88 MI(b),(d) | SOFR30A + 6.406% | 1.3370 | 09/25/37 | 56,939 | |||||||||
| 105,880 | Fannie Mae REMICS Series 2007-106 SN(b),(d) | SOFR30A + 6.296% | 1.2270 | 11/25/37 | 8,225 | |||||||||
| 196,024 | Fannie Mae REMICS Series 2007-109 DI(b),(d) | SOFR30A + 6.286% | 1.2170 | 12/25/37 | 17,937 | |||||||||
| 296,878 | Fannie Mae REMICS Series 2007-117 SM(b),(d) | SOFR30A + 6.186% | 1.1170 | 01/25/38 | 20,251 | |||||||||
| 5,485,062 | Fannie Mae REMICS Series 2010-89 AI(b),(d) | SOFR30A + 6.336% | 0.1500 | 02/25/38 | 19,635 | |||||||||
| 39,194 | Fannie Mae REMICS Series 2008-24 SP(b) | SOFR30A + 23.283% | 4.2770 | 02/25/38 | 38,019 | |||||||||
| 1,840,597 | Fannie Mae REMICS Series 2008-58 SE(b),(d) | SOFR30A + 5.886% | 0.8170 | 07/25/38 | 125,106 | |||||||||
| 334,129 | Fannie Mae REMICS Series 2009-66 SH(b),(d) | SOFR30A + 5.936% | 0.8670 | 09/25/39 | 15,372 | |||||||||
| 100,618 | Fannie Mae REMICS Series 2009-112 ST(b),(d) | SOFR30A + 6.136% | 1.0670 | 01/25/40 | 7,641 | |||||||||
| 97,082 | Fannie Mae REMICS Series 2010-126 UI(d) | 5.5000 | 10/25/40 | 12,936 | ||||||||||
| 300,259 | Fannie Mae REMICS Series 2010-130 HI(d) | 6.0000 | 11/25/40 | 60,339 | ||||||||||
| 377,600 | Fannie Mae REMICS Series 2010-139 SA(b),(d) | SOFR30A + 5.916% | 0.8470 | 12/25/40 | 28,103 | |||||||||
| 73,315 | Fannie Mae REMICS Series 2011-11 PI(d) | 4.0000 | 03/25/41 | 9,246 | ||||||||||
| 268,499 | Fannie Mae REMICS Series 2017-87 KI(d) | 5.0000 | 06/25/41 | 43,708 | ||||||||||
| 424,200 | Fannie Mae REMICS Series 2011-96 SA(b),(d) | SOFR30A + 6.436% | 1.3670 | 10/25/41 | 29,086 | |||||||||
| 2,558,067 | Fannie Mae REMICS Series 2012-30 CI(d) | 5.0000 | 10/25/41 | 313,363 | ||||||||||
| 1,592,587 | Fannie Mae REMICS Series 2011-122 DS(b),(d) | SOFR30A + 6.406% | 1.3370 | 12/25/41 | 170,259 | |||||||||
| 802,500 | Fannie Mae REMICS Series 2012-68 NS(b),(d) | SOFR30A + 6.586% | 1.5170 | 03/25/42 | 38,971 | |||||||||
| 904,585 | Fannie Mae REMICS Series 2012-89 SA(b),(d) | SOFR30A + 5.436% | 0.3670 | 08/25/42 | 42,658 | |||||||||
| 1,438,309 | Fannie Mae REMICS Series 2012-103 TI(d) | 5.0000 | 09/25/42 | 257,830 | ||||||||||
See accompanying notes to financial statements.
6
| Anfield Universal Fixed Income ETF |
| SCHEDULE OF INVESTMENTS (Continued) |
| July 31, 2023 |
| Principal | Coupon Rate | |||||||||||||
| Amount ($) | Spread | (%) | Maturity | Fair Value | ||||||||||
| COLLATERALIZED MORTGAGE OBLIGATIONS 9.2% (Continued) | ||||||||||||||
| 99,740 | Fannie Mae REMICS Series 2014-68 IB(d) | 4.5000 | 02/25/43 | $ | 10,266 | |||||||||
| 283,760 | Fannie Mae REMICS Series 2013-103 JS(b),(d) | SOFR30A + 5.886% | 0.8170 | 10/25/43 | 21,881 | |||||||||
| 371,723 | Fannie Mae REMICS Series 2014-38 QI(d) | 5.5000 | 12/25/43 | 66,062 | ||||||||||
| 1,179,918 | Fannie Mae REMICS Series 2014-87 MS(b),(d) | SOFR30A + 6.136% | 1.0670 | 01/25/45 | 85,191 | |||||||||
| 251,916 | Fannie Mae REMICS Series 2015-33 OI(d) | 5.0000 | 06/25/45 | 32,493 | ||||||||||
| 456,492 | Fannie Mae REMICS Series 2016-39 LS(b),(d) | SOFR30A + 5.886% | 0.8170 | 07/25/46 | 55,574 | |||||||||
| 1,566,055 | Fannie Mae REMICS Series 2017-97 SW(b),(d) | SOFR30A + 6.086% | 1.0170 | 12/25/47 | 159,336 | |||||||||
| 1,017,560 | Fannie Mae REMICS Series 2017-108 SA(b),(d) | SOFR30A + 6.036% | 0.9670 | 01/25/48 | 113,803 | |||||||||
| 3,179,662 | Fannie Mae REMICS Series 2018-54 SA(b),(d) | SOFR30A + 6.136% | 1.0670 | 08/25/48 | 231,870 | |||||||||
| 525,492 | Fannie Mae REMICS Series 2018-58 IO(d) | 5.5000 | 08/25/48 | 89,480 | ||||||||||
| 121,850 | Fannie Mae REMICS Series 2018-74 MI(d) | 4.5000 | 10/25/48 | 23,552 | ||||||||||
| 425,484 | Fannie Mae REMICS Series 2019-41 SB(b),(d) | SOFR30A + 5.936% | 0.8670 | 08/25/49 | 42,895 | |||||||||
| 1,142,908 | Fannie Mae REMICS Series 2020-10 S(b),(d) | SOFR30A + 5.936% | 0.8670 | 05/25/59 | 115,958 | |||||||||
| 99,175 | Freddie Mac REMICS Series 2367 SG(b),(d) | SOFR30A + 7.766% | 2.6980 | 06/15/31 | 8,759 | |||||||||
| 1,088,480 | Freddie Mac REMICS Series 5112 IB(d) | 6.5000 | 05/15/32 | 147,577 | ||||||||||
| 81,498 | Freddie Mac REMICS Series 2444 TI(b),(d) | 6.5000 | 05/15/32 | 10,899 | ||||||||||
| 234,143 | Freddie Mac REMICS Series 2463 SB(b),(d) | SOFR30A + 7.886% | 2.8180 | 06/15/32 | 17,040 | |||||||||
| 38,000 | Freddie Mac REMICS Series 2524 SX(b),(d) | SOFR30A + 7.786% | 2.7180 | 11/15/32 | 3,656 | |||||||||
| 51,364 | Freddie Mac REMICS Series 2616 SC(b),(d) | SOFR30A + 7.886% | 2.8180 | 12/15/32 | 3,471 | |||||||||
| 570,623 | Freddie Mac REMICS Series 2802 SI(b),(d) | SOFR30A + 5.886% | 0.8180 | 05/15/34 | 29,113 | |||||||||
| 287,734 | Freddie Mac REMICS Series 2980 SL(b),(d) | SOFR30A + 6.586% | 1.5180 | 11/15/34 | 21,920 | |||||||||
| 311,357 | Freddie Mac REMICS Series 2950 SN(b),(d) | SOFR30A + 5.936% | 0.8680 | 03/15/35 | 14,749 | |||||||||
| 836,105 | Freddie Mac REMICS Series 3055 MS(b),(d) | SOFR30A + 6.486% | 1.4180 | 10/15/35 | 69,043 | |||||||||
| 54,523 | Freddie Mac REMICS Series 3117 JS(b),(d) | SOFR30A + 6.586% | 1.5180 | 02/15/36 | 4,474 | |||||||||
| 231,581 | Freddie Mac REMICS Series 3149 SM(b),(d) | SOFR30A + 6.536% | 1.4680 | 05/15/36 | 15,332 | |||||||||
| 105,688 | Freddie Mac REMICS Series 3239 SI(b),(d) | SOFR30A + 6.536% | 1.4680 | 11/15/36 | 8,864 | |||||||||
| 214,962 | Freddie Mac REMICS Series 3303 SG(b),(d) | SOFR30A + 5.986% | 0.9180 | 04/15/37 | 15,353 | |||||||||
| 209,843 | Freddie Mac REMICS Series 3355 BI(b),(d) | SOFR30A + 5.936% | 0.8680 | 08/15/37 | 13,008 | |||||||||
| 210,657 | Freddie Mac REMICS Series 3368 AI(b),(d) | SOFR30A + 5.916% | 0.8480 | 09/15/37 | 15,369 | |||||||||
| 169,639 | Freddie Mac REMICS Series 4340 TI(d) | 5.5000 | 07/15/39 | 11,869 | ||||||||||
| 157,873 | Freddie Mac REMICS Series 3572 VS(b),(d) | SOFR30A + 6.616% | 1.5480 | 09/15/39 | 15,383 | |||||||||
| 222,170 | Freddie Mac REMICS Series 4451 DI(d) | 3.5000 | 10/15/39 | 13,095 | ||||||||||
| 2,319,140 | Freddie Mac REMICS Series 3652 CS(b),(d) | SOFR30A + 6.436% | 1.3680 | 03/15/40 | 234,040 | |||||||||
| 157,729 | Freddie Mac REMICS Series 3758 S(b),(d) | SOFR30A + 5.916% | 0.8480 | 11/15/40 | 10,947 | |||||||||
See accompanying notes to financial statements.
7
| Anfield Universal Fixed Income ETF |
| SCHEDULE OF INVESTMENTS (Continued) |
| July 31, 2023 |
| Principal | Coupon Rate | |||||||||||||
| Amount ($) | Spread | (%) | Maturity | Fair Value | ||||||||||
| COLLATERALIZED MORTGAGE OBLIGATIONS — 9.2% (Continued) | ||||||||||||||
| 775,710 | Freddie Mac REMICS Series 3935 SH(b),(d) | SOFR30A + 6.486% | 1.4180 | 12/15/40 | $ | 18,652 | ||||||||
| 102,250 | Freddie Mac REMICS Series 4139 PO(e) | — | 08/15/42 | 65,999 | ||||||||||
| 146,661 | Freddie Mac REMICS Series 4091 TS(b),(d) | SOFR30A + 6.436% | 1.3680 | 08/15/42 | 15,316 | |||||||||
| 416,373 | Freddie Mac REMICS Series 4471 JI(d) | 4.5000 | 09/15/43 | 75,671 | ||||||||||
| 1,301,865 | Freddie Mac REMICS Series 4995 KI(d) | 5.5000 | 12/25/43 | 233,418 | ||||||||||
| 180,195 | Freddie Mac REMICS Series 4456 IA(d) | 4.0000 | 03/15/45 | 26,949 | ||||||||||
| 9,003,562 | Freddie Mac REMICS Series 4583 TI(b),(d) | SOFR30A + 5.986% | 0.1000 | 05/15/46 | 29,208 | |||||||||
| 241,377 | Freddie Mac REMICS Series 4583 ST(b),(d) | SOFR30A + 5.886% | 0.8180 | 05/15/46 | 20,703 | |||||||||
| 406,329 | Freddie Mac REMICS Series 4618 SA(b),(d) | SOFR30A + 5.886% | 0.8180 | 09/15/46 | 47,367 | |||||||||
| 766,242 | Freddie Mac REMICS Series 5007 SK(b),(d) | SOFR30A + 5.986% | 0.9170 | 08/25/50 | 87,574 | |||||||||
| 567,065 | Freddie Mac REMICS Series 5136 IJ(d) | 2.5000 | 02/25/51 | 68,185 | ||||||||||
| 1,012,536 | Freddie Mac REMICS Series 5086 HI(d) | 4.5000 | 03/25/51 | 187,395 | ||||||||||
| 1,081,170 | Freddie Mac REMICS Series 5174 NI(d) | 3.5000 | 12/25/51 | 197,297 | ||||||||||
| 234,222 | Freddie Mac REMICS Series 4291 MS(b),(d) | SOFR30A + 5.786% | 0.7180 | 01/15/54 | 16,106 | |||||||||
| 120,058 | Freddie Mac Strips Series 221 IO(d) | 7.0000 | 03/15/32 | 21,946 | ||||||||||
| 3,930,649 | Freddie Mac Strips Series 324 C17(d) | 3.5000 | 12/15/33 | 419,767 | ||||||||||
| 270,318 | Freddie Mac Strips Series 238 8(d) | 5.0000 | 04/15/36 | 42,286 | ||||||||||
| 310,945 | Freddie Mac Strips Series 240 IO(d) | 5.5000 | 07/15/36 | 64,043 | ||||||||||
| 52,806 | Freddie Mac Strips Series 239 IO(d) | 6.0000 | 08/15/36 | 9,222 | ||||||||||
| 458,625 | Freddie Mac Strips Series 247 24(d) | 5.0000 | 09/15/36 | 77,907 | ||||||||||
| 758,610 | Freddie Mac Strips Series 244 IO(d) | 5.5000 | 12/15/36 | 123,851 | ||||||||||
| 350,051 | Freddie Mac Strips Series 303 105(b),(d) | 4.0000 | 01/15/43 | 51,391 | ||||||||||
| 1,253,814 | Freddie Mac Strips Series 324 C24(d) | 5.0000 | 12/15/43 | 234,472 | ||||||||||
| 732,132 | Freddie Mac Strips Series 365 121(b),(d) | 4.0000 | 10/15/47 | 111,050 | ||||||||||
| 651,587 | Freddie Mac Strips Series 365 C10(d) | 3.5000 | 06/15/49 | 116,839 | ||||||||||
| 1,042,636 | Freddie Mac Strips Series 367 116(b),(d) | 3.5000 | 06/15/50 | 160,410 | ||||||||||
| 630,767 | Government National Mortgage Association Series 2021-78 QI(d) | 5.0000 | 05/20/34 | 80,831 | ||||||||||
| 405,961 | Government National Mortgage Association Series 2004-46 S(b),(d) | TSFR1M + 6.986% | 1.7310 | 06/20/34 | 23,880 | |||||||||
| 25,919 | Government National Mortgage Association Series 2004-106 HW(b) | TSFR1M + 26.928% | 0.8190 | 12/16/34 | 22,782 | |||||||||
| 136,079 | Government National Mortgage Association Series 2007-40 SW(b),(d) | TSFR1M + 4.066% | 0.0001 | 07/20/37 | 723 | |||||||||
| 153,346 | Government National Mortgage Association Series 2008-2 SM(b),(d) | TSFR1M + 6.386% | 1.1640 | 01/16/38 | 9,570 | |||||||||
| 87,341 | Government National Mortgage Association Series 2008-6 SD(b),(d) | TSFR1M + 6.346% | 1.0910 | 02/20/38 | 146 | |||||||||
| 1,107,836 | Government National Mortgage Association Series 2008-15 CI(b),(d) | TSFR1M + 6.376% | 1.1210 | 02/20/38 | 33,397 | |||||||||
| 131,503 | Government National Mortgage Association Series 2008-27 SI(b),(d) | TSFR1M + 6.356% | 1.1010 | 03/20/38 | 3,221 | |||||||||
See accompanying notes to financial statements.
8
| Anfield Universal Fixed Income ETF |
| SCHEDULE OF INVESTMENTS (Continued) |
| July 31, 2023 |
| Principal | Coupon Rate | |||||||||||||
| Amount ($) | Spread | (%) | Maturity | Fair Value | ||||||||||
| COLLATERALIZED MORTGAGE OBLIGATIONS — 9.2% (Continued) | ||||||||||||||
| 109,342 | Government National Mortgage Association Series 2008-36 SB(b),(d) | TSFR1M + 6.156% | 0.9010 | 04/20/38 | $ | 57 | ||||||||
| 160,822 | Government National Mortgage Association Series 2008-51 SE(b),(d) | TSFR1M + 6.136% | 0.9140 | 06/16/38 | 9,237 | |||||||||
| 134,936 | Government National Mortgage Association Series 2008-51 SC(b),(d) | TSFR1M + 6.136% | 0.8810 | 06/20/38 | 6,352 | |||||||||
| 65,894 | Government National Mortgage Association Series 2008-95 DS(b),(d) | TSFR1M + 7.186% | 1.9310 | 12/20/38 | 2,153 | |||||||||
| 114,560 | Government National Mortgage Association Series 2009-43 SA(b),(d) | TSFR1M + 5.836% | 0.5810 | 06/20/39 | 3,055 | |||||||||
| 110,630 | Government National Mortgage Association Series 2010-19 SD(b),(d) | TSFR1M + 6.436% | 1.2140 | 07/16/39 | 1,319 | |||||||||
| 395,868 | Government National Mortgage Association Series 2013-170 ID(b),(d) | 3.3550 | 02/20/40 | 37,418 | ||||||||||
| 76,102 | Government National Mortgage Association Series 2010-113 BS(b),(d) | TSFR1M + 5.886% | 0.6310 | 09/20/40 | 6,104 | |||||||||
| 1,179,208 | Government National Mortgage Association Series 2010-133 SB(b),(d) | TSFR1M + 5.906% | 0.6840 | 10/16/40 | 96,613 | |||||||||
| 133,516 | Government National Mortgage Association Series 2010-152 SA(b),(d) | TSFR1M + 5.936% | 0.7140 | 11/16/40 | 11,198 | |||||||||
| 440,942 | Government National Mortgage Association Series 2012-77 DI(d) | 4.0000 | 01/20/41 | 32,620 | ||||||||||
| 151,873 | Government National Mortgage Association Series 2012-69 QI(d) | 4.0000 | 03/16/41 | 18,593 | ||||||||||
| 370,128 | Government National Mortgage Association Series 2011-148 SN(b),(d) | TSFR1M + 6.576% | 1.3540 | 11/16/41 | 37,165 | |||||||||
| 1,123,253 | Government National Mortgage Association Series 2013-4 ID(d) | 5.5000 | 05/16/42 | 221,202 | ||||||||||
| 932,571 | Government National Mortgage Association Series 2012-126 IO(d) | 3.5000 | 10/20/42 | 150,406 | ||||||||||
| 127,626 | Government National Mortgage Association Series 2013-5 BI(d) | 3.5000 | 01/20/43 | 21,460 | ||||||||||
| 274,286 | Government National Mortgage Association Series 2013-53 OI(d) | 3.5000 | 04/20/43 | 26,055 | ||||||||||
| 1,208,885 | Government National Mortgage Association Series 2015-179 BI(d) | 4.0000 | 08/20/43 | 98,503 | ||||||||||
| 94,300 | Government National Mortgage Association Series 2013-181 SA(b),(d) | TSFR1M + 5.986% | 0.7310 | 11/20/43 | 9,261 | |||||||||
| 202,965 | Government National Mortgage Association Series 2014-58 SA(b),(d) | TSFR1M + 5.986% | 0.7310 | 04/20/44 | 18,874 | |||||||||
| 364,657 | Government National Mortgage Association Series 2014-91 SB(b),(d) | TSFR1M + 5.486% | 0.2640 | 06/16/44 | 24,445 | |||||||||
| 90,175 | Government National Mortgage Association Series 2016-81 IM(d) | 4.0000 | 10/20/44 | 6,993 | ||||||||||
| 1,506,697 | Government National Mortgage Association Series 2014-146 EI(d) | 5.0000 | 10/20/44 | 296,906 | ||||||||||
| 1,365,338 | Government National Mortgage Association Series 2017-56 IE(d) | 4.0000 | 11/20/44 | 128,530 | ||||||||||
| 576,869 | Government National Mortgage Association Series 2019-22 SA(b),(d) | TSFR1M + 5.486% | 0.2310 | 02/20/45 | 47,926 | |||||||||
| 346,709 | Government National Mortgage Association Series 2015-36 MI(d) | 5.5000 | 03/20/45 | 64,240 | ||||||||||
| 495,660 | Government National Mortgage Association Series 2015-64 SG(b),(d) | TSFR1M + 5.486% | 0.2310 | 05/20/45 | 34,010 | |||||||||
| 85,902 | Government National Mortgage Association Series 2016-27 IA(d) | 4.0000 | 06/20/45 | 10,138 | ||||||||||
| 313,608 | Government National Mortgage Association Series 2017-99 DI(d) | 4.0000 | 07/20/45 | 24,155 | ||||||||||
| 574,920 | Government National Mortgage Association Series 2015-144 SA(b),(d) | TSFR1M + 6.086% | 0.8310 | 10/20/45 | 62,420 | |||||||||
| 336,152 | Government National Mortgage Association Series 2016-84 IG(d) | 4.5000 | 11/16/45 | 65,812 | ||||||||||
| 494,594 | Government National Mortgage Association Series 2016-4 SM(b),(d) | TSFR1M + 5.536% | 0.2810 | 01/20/46 | 33,299 | |||||||||
| 200,948 | Government National Mortgage Association Series 2016-9 SA(b),(d) | TSFR1M + 5.986% | 0.7310 | 01/20/46 | 16,133 | |||||||||
| 1,006,279 | Government National Mortgage Association Series 2016-121 JS(b),(d) | TSFR1M + 5.986% | 0.7310 | 09/20/46 | 81,167 | |||||||||
See accompanying notes to financial statements.
9
| Anfield Universal Fixed Income ETF |
| SCHEDULE OF INVESTMENTS (Continued) |
| July 31, 2023 |
| Principal | Coupon Rate | |||||||||||||
| Amount ($) | Spread | (%) | Maturity | Fair Value | ||||||||||
| COLLATERALIZED MORTGAGE OBLIGATIONS — 9.2% (Continued) | ||||||||||||||
| 204,315 | Government National Mortgage Association Series 2016-145 UI(d) | 3.5000 | 10/20/46 | $ | 35,824 | |||||||||
| 202,884 | Government National Mortgage Association Series 2017-68 CI(d) | 5.5000 | 05/16/47 | 40,835 | ||||||||||
| 326,028 | Government National Mortgage Association Series 2018-8 IO(d) | 4.0000 | 01/20/48 | 54,775 | ||||||||||
| 20,836,789 | Government National Mortgage Association Series 2020-86 TK(b),(d) | TSFR1M + 6.086% | 0.1500 | 08/20/48 | 110,202 | |||||||||
| 200,688 | Government National Mortgage Association Series 2018-120 JI(d) | 5.5000 | 09/20/48 | 29,385 | ||||||||||
| 303,835 | Government National Mortgage Association Series 2018-154 IT(d) | 5.5000 | 10/20/48 | 55,947 | ||||||||||
| 508,998 | Government National Mortgage Association Series 2019-6 SA(b),(d) | TSFR1M + 5.936% | 0.6810 | 01/20/49 | 41,692 | |||||||||
| 1,541,054 | Government National Mortgage Association Series 2020-47 MI(d) | 3.5000 | 04/20/50 | 258,547 | ||||||||||
| 731,701 | Government National Mortgage Association Series 2020-167 NS(b),(d) | TSFR1M + 6.186% | 0.9310 | 11/20/50 | 75,643 | |||||||||
| 2,807,647 | Government National Mortgage Association Series 2019-H16 CI(b),(d) | 0.5370 | 10/20/69 | 100,135 | ||||||||||
| TOTAL COLLATERALIZED MORTGAGE OBLIGATIONS (Cost $14,891,654) | 10,696,017 | |||||||||||||
| Principal | Coupon Rate | |||||||||||||
| Amount ($) | Spread | (%) | Maturity | Fair Value | ||||||||||
| CORPORATE BONDS — 49.5% | ||||||||||||||
| AEROSPACE & DEFENSE — 0.7% | ||||||||||||||
| 500,000 | Boeing Company (The) | 1.9500 | 02/01/24 | 490,069 | ||||||||||
| 321,000 | Howmet Aerospace, Inc. | 5.1250 | 10/01/24 | 318,132 | ||||||||||
| 808,201 | ||||||||||||||
| ASSET MANAGEMENT — 3.3% | ||||||||||||||
| 750,000 | Ares Capital Corporation | 3.2500 | 07/15/25 | 699,991 | ||||||||||
| 600,000 | Blackstone Secured Lending Fund | 3.6250 | 01/15/26 | 555,670 | ||||||||||
| 1,480,000 | FS KKR Capital Corporation | 4.1250 | 02/01/25 | 1,417,984 | ||||||||||
| 1,250,000 | Icahn Enterprises, L.P. / Icahn Enterprises Finance Corporation | 4.7500 | 09/15/24 | 1,210,541 | ||||||||||
| 3,884,186 | ||||||||||||||
| AUTOMOTIVE — 6.0% | ||||||||||||||
| 1,325,000 | Ford Motor Credit Company, LLC | 3.3700 | 11/17/23 | 1,312,897 | ||||||||||
| 850,000 | Ford Motor Credit Company, LLC | 3.8100 | 01/09/24 | 839,998 | ||||||||||
| 475,000 | Ford Motor Credit Company, LLC | 5.5840 | 03/18/24 | 472,034 | ||||||||||
| 764,000 | Ford Motor Credit Company, LLC | 3.6640 | 09/08/24 | 741,130 | ||||||||||
| 777,000 | Ford Motor Credit Company, LLC | 4.6870 | 06/09/25 | 753,907 | ||||||||||
| 500,000 | Ford Motor Credit Company, LLC | 5.1250 | 06/16/25 | 487,297 | ||||||||||
| 1,083,000 | Ford Motor Credit Company, LLC | 3.3750 | 11/13/25 | 1,013,528 | ||||||||||
See accompanying notes to financial statements.
10
| Anfield Universal Fixed Income ETF |
| SCHEDULE OF INVESTMENTS (Continued) |
| July 31, 2023 |
| Principal | Coupon Rate | |||||||||||||
| Amount ($) | Spread | (%) | Maturity | Fair Value | ||||||||||
| CORPORATE BONDS — 49.5% (Continued) | ||||||||||||||
| AUTOMOTIVE — 6.0% (Continued) | ||||||||||||||
| 500,000 | General Motors Financial Company, Inc. | 1.2000 | 10/15/24 | $ | 474,057 | |||||||||
| 980,000 | Nissan Motor Acceptance Company, LLC(a) | 1.1250 | 09/16/24 | 923,042 | ||||||||||
| 7,017,890 | ||||||||||||||
| BANKING — 11.6% | ||||||||||||||
| 287,000 | Bank of America Corporation | 4.2000 | 08/26/24 | 282,185 | ||||||||||
| 485,000 | Bank of Ireland Group plc(a) | 4.5000 | 11/25/23 | 481,305 | ||||||||||
| 500,000 | Bank of Montreal(c) | 1.5000 | 06/26/24 | 477,279 | ||||||||||
| 500,000 | Bank of Montreal | 5.1000 | 01/31/25 | 487,841 | ||||||||||
| 500,000 | BNP Paribas S.A. | 4.2500 | 10/15/24 | 489,756 | ||||||||||
| 1,002,000 | BNP Paribas S.A.(a) | 4.3750 | 09/28/25 | 968,069 | ||||||||||
| 400,000 | BPCE S.A.(a) | 5.7000 | 10/22/23 | 398,761 | ||||||||||
| 850,000 | BPCE S.A.(a) | 5.1500 | 07/21/24 | 837,762 | ||||||||||
| 500,000 | BPCE S.A.(a) | 4.5000 | 03/15/25 | 482,438 | ||||||||||
| 628,000 | Citigroup, Inc.(b) | TSFR3M + 4.330% | 9.6990 | 07/30/2167 | 632,238 | |||||||||
| 500,000 | Credit Agricole S.A.(a) | 4.3750 | 03/17/25 | 484,554 | ||||||||||
| 750,000 | Credit Suisse A.G. | 4.7500 | 08/09/24 | 737,180 | ||||||||||
| 630,000 | Danske Bank A/S(a) | 3.8750 | 09/12/23 | 628,024 | ||||||||||
| 400,000 | Deutsche Bank A.G.(b) | SOFRRATE + 2.159% | 2.2220 | 09/18/24 | 397,250 | |||||||||
| 645,000 | Discover Bank | 2.4500 | 09/12/24 | 615,834 | ||||||||||
| 500,000 | Fifth Third Bancorp | 3.6500 | 01/25/24 | 494,496 | ||||||||||
| 1,000,000 | First Citizens BancShares, Inc.(a),(b) | US0003M + 3.972% | 9.5240 | 06/15/2170 | 997,049 | |||||||||
| 250,000 | JPMorgan Chase & Company(b) | SOFRRATE + 0.600% | 0.6530 | 09/16/24 | 248,752 | |||||||||
| 500,000 | Manufacturers & Traders Trust Company | 2.9000 | 02/06/25 | 475,950 | ||||||||||
| 750,000 | Natwest Group plc | 3.8750 | 09/12/23 | 748,305 | ||||||||||
| 500,000 | NatWest Markets plc(a) | 0.8000 | 08/12/24 | 474,466 | ||||||||||
| 140,000 | Societe Generale S.A.(a) | 5.0000 | 01/17/24 | 138,967 | ||||||||||
| 800,000 | Societe Generale S.A.(a) | 4.2500 | 04/14/25 | 771,620 | ||||||||||
| 381,000 | Sumitomo Mitsui Financial Group, Inc.(a) | 4.4360 | 04/02/24 | 376,446 | ||||||||||
| 500,000 | Swedbank A.B.(a) | 0.6000 | 09/25/23 | 495,981 | ||||||||||
| 13,622,508 | ||||||||||||||
| BIOTECH & PHARMA — 1.2% | ||||||||||||||
| 750,000 | Teva Pharmaceutical Finance Netherlands III BV | 6.0000 | 04/15/24 | 747,347 | ||||||||||
| 300,000 | Teva Pharmaceutical Finance Netherlands III BV | 6.0000 | 04/15/24 | 298,939 | ||||||||||
See accompanying notes to financial statements.
11
| Anfield Universal Fixed Income ETF |
| SCHEDULE OF INVESTMENTS (Continued) |
| July 31, 2023 |
| Principal | Coupon Rate | |||||||||||||
| Amount ($) | Spread | (%) | Maturity | Fair Value | ||||||||||
| CORPORATE BONDS — 49.5% (Continued) | ||||||||||||||
| BIOTECH & PHARMA — 1.2% (Continued) | ||||||||||||||
| 375,000 | Teva Pharmaceutical Finance Netherlands III BV | 7.1250 | 01/31/25 | $ | 377,273 | |||||||||
| 1,423,559 | ||||||||||||||
| CHEMICALS — 0.2% | ||||||||||||||
| 200,000 | Air Liquide Finance S.A.(a) | 2.2500 | 09/27/23 | 198,886 | ||||||||||
| COMMERCIAL SUPPORT SERVICES — 2.2% | ||||||||||||||
| 2,595,000 | Aramark Services, Inc.(a) | 6.3750 | 05/01/25 | 2,597,254 | ||||||||||
| CONTAINERS & PACKAGING — 0.3% | ||||||||||||||
| 350,000 | Ball Corporation | 4.0000 | 11/15/23 | 347,216 | ||||||||||
| DIVERSIFIED INDUSTRIALS — 0.3% | ||||||||||||||
| 345,000 | General Electric Company(b) | US0003M + 3.330% | 8.8820 | 06/15/2169 | 346,500 | |||||||||
| ELECTRIC UTILITIES — 0.8% | ||||||||||||||
| 250,000 | Consolidated Edison, Inc. | 0.6500 | 12/01/23 | 245,919 | ||||||||||
| 150,000 | FirstEnergy Corporation | 2.0500 | 03/01/25 | 141,793 | ||||||||||
| 265,000 | Pennsylvania Electric Company(a) | 4.1500 | 04/15/25 | 255,722 | ||||||||||
| 250,000 | Public Service Enterprise Group, Inc. | 2.8750 | 06/15/24 | 243,739 | ||||||||||
| 887,173 | ||||||||||||||
| FOOD — 0.4% | ||||||||||||||
| 500,000 | Danone S.A.(a) | 2.5890 | 11/02/23 | 495,975 | ||||||||||
| INSTITUTIONAL FINANCIAL SERVICES — 1.6% | ||||||||||||||
| 1,000,000 | Bank of New York Mellon Corporation (The) Series H(b) | H15T5Y + 3.352% | 3.7000 | 03/20/2170 | 909,437 | |||||||||
| 750,000 | Goldman Sachs Group, Inc. (The) | 3.3750 | 12/21/23 | 741,318 | ||||||||||
| 200,000 | Morgan Stanley(b) | SOFRRATE + 0.509% | 0.7910 | 01/22/25 | 195,001 | |||||||||
| 1,845,756 | ||||||||||||||
| LEISURE FACILITIES & SERVICES — 1.7% | ||||||||||||||
| 1,576,000 | Carnival Corporation | 7.2000 | 10/01/23 | 1,581,445 | ||||||||||
| 364,000 | Hyatt Hotels Corporation | 1.3000 | 10/01/23 | 361,264 | ||||||||||
| 1,942,709 | ||||||||||||||
See accompanying notes to financial statements.
12
| Anfield Universal Fixed Income ETF |
| SCHEDULE OF INVESTMENTS (Continued) |
| July 31, 2023 |
| Principal | Coupon Rate | |||||||||||||
| Amount ($) | Spread | (%) | Maturity | Fair Value | ||||||||||
| CORPORATE BONDS — 49.5% (Continued) | ||||||||||||||
| OIL & GAS PRODUCERS — 1.3% | ||||||||||||||
| 500,000 | Eni SpA(a) | 4.0000 | 09/12/23 | $ | 498,597 | |||||||||
| 1,000,000 | Plains All American Pipeline, L.P. / PAA Finance Corporation | 3.8500 | 10/15/23 | 995,450 | ||||||||||
| 1,494,047 | ||||||||||||||
| REAL ESTATE INVESTMENT TRUSTS — 4.4% | ||||||||||||||
| 500,000 | American Tower Corporation | 5.0000 | 02/15/24 | 497,407 | ||||||||||
| 677,000 | Crown Castle International Corporation | 3.2000 | 09/01/24 | 657,688 | ||||||||||
| 440,000 | Office Properties Income Trust | 4.2500 | 05/15/24 | 414,993 | ||||||||||
| 1,960,000 | Service Properties Trust | 4.6500 | 03/15/24 | 1,927,800 | ||||||||||
| 1,705,000 | VICI Properties, L.P. / VICI Note Company, Inc.(a) | 4.6250 | 06/15/25 | 1,657,209 | ||||||||||
| 5,155,097 | ||||||||||||||
| RETAIL - DISCRETIONARY — 1.3% | ||||||||||||||
| 1,605,000 | Penske Automotive Group, Inc. | 3.5000 | 09/01/25 | 1,532,329 | ||||||||||
| SOFTWARE — 0.3% | ||||||||||||||
| 300,000 | Oracle Corporation | 2.4000 | 09/15/23 | 298,841 | ||||||||||
| SPECIALTY FINANCE — 5.2% | ||||||||||||||
| 500,000 | AerCap Ireland Capital DAC / AerCap Global Aviation Trust | 1.1500 | 10/29/23 | 493,883 | ||||||||||
| 610,000 | Ally Financial, Inc. | 1.4500 | 10/02/23 | 605,075 | ||||||||||
| 500,000 | Ally Financial, Inc. | 3.8750 | 05/21/24 | 489,746 | ||||||||||
| 468,000 | American Express Company | 2.5000 | 07/30/24 | 453,565 | ||||||||||
| 545,000 | Aviation Capital Group, LLC(a) | 4.3750 | 01/30/24 | 537,315 | ||||||||||
| 650,000 | Aviation Capital Group, LLC(a) | 4.8750 | 10/01/25 | 625,290 | ||||||||||
| 500,000 | Capital One Financial Corporation(b) | SOFRRATE + 0.690% | 1.3430 | 12/06/24 | 489,934 | |||||||||
| 1,021,000 | Credit Acceptance Corporation(a) | 5.1250 | 12/31/24 | 1,000,452 | ||||||||||
| 500,000 | ILFC E-Capital Trust I(a),(b) | + 1.550% | 7.0640 | 12/21/65 | 351,947 | |||||||||
| 1,025,000 | OneMain Finance Corporation | 6.1250 | 03/15/24 | 1,023,307 | ||||||||||
| 6,070,514 | ||||||||||||||
| TELECOMMUNICATIONS — 4.4% | ||||||||||||||
| 500,000 | British Telecommunications plc | 4.5000 | 12/04/23 | 497,465 | ||||||||||
| 1,502,000 | Sprint Corporation | 7.8750 | 09/15/23 | 1,504,519 | ||||||||||
| 530,000 | Sprint Corporation | 7.1250 | 06/15/24 | 535,458 | ||||||||||
| 2,650,000 | Telecom Italia SpA(a) | 5.3030 | 05/30/24 | 2,600,301 | ||||||||||
| 5,137,743 | ||||||||||||||
See accompanying notes to financial statements.
13
| Anfield Universal Fixed Income ETF |
| SCHEDULE OF INVESTMENTS (Continued) |
| July 31, 2023 |
| Principal | Coupon Rate | |||||||||||||
| Amount ($) | Spread | (%) | Maturity | Fair Value | ||||||||||
| CORPORATE BONDS — 49.5% (Continued) | ||||||||||||||
| TOBACCO & CANNABIS — 0.4% | ||||||||||||||
| 500,000 | Imperial Brands Finance plc(a) | 3.1250 | 07/26/24 | $ | 485,350 | |||||||||
| TRANSPORTATION & LOGISTICS — 1.9% | ||||||||||||||
| 914,776 | American Airlines 2015-2 Class B Pass Through Trust | 4.4000 | 09/22/23 | 910,369 | ||||||||||
| 1,175,000 | Delta Air Lines, Inc. | 2.9000 | 10/28/24 | 1,129,836 | ||||||||||
| 200,000 | Penske Truck Leasing Company Lp / PTL Finance Corporation(a) | 4.1250 | 08/01/23 | 200,000 | ||||||||||
| 2,240,205 | ||||||||||||||
| TOTAL CORPORATE BONDS (Cost $59,002,872) | 57,831,939 | |||||||||||||
| Principal | Coupon Rate | |||||||||||||
| Amount ($) | Spread | (%) | Maturity | Fair Value | ||||||||||
| TERM LOANS — 7.9% | ||||||||||||||
| COMMERCIAL SUPPORT SERVICES — 0.8% | ||||||||||||||
| 876,858 | Aramark Services, Inc.(b) | TSFR1M + 2.615% | 7.9330 | 04/06/28 | 876,967 | |||||||||
| LEISURE FACILITIES & SERVICES — 1.1% | ||||||||||||||
| 984,772 | Carnival Corporation(b) | US0006M + 3.000% | 8.4330 | 06/30/25 | 985,264 | |||||||||
| 247,500 | Scientific Games Corporation(b) | TSFR1M + 3.100% | 8.3020 | 04/14/29 | 247,480 | |||||||||
| 1,232,744 | ||||||||||||||
| RETAIL - DISCRETIONARY — 1.7% | ||||||||||||||
| 1,982,500 | Great Outdoors Group, LLC(b) | US0001M + 3.750% | 9.1830 | 03/05/28 | 1,980,637 | |||||||||
| SEMICONDUCTORS — 0.4% | ||||||||||||||
| 496,250 | MKS Instruments, Inc.(b) | TSFR1M + 2.850% | 8.1550 | 08/17/29 | 496,367 | |||||||||
| SOFTWARE — 1.0% | ||||||||||||||
| 1,234,375 | Sunshine Software Merger Sub, Inc.(b) | US0001M + 3.750% | 4.2500 | 10/15/28 | 1,146,814 | |||||||||
| TRANSPORTATION & LOGISTICS — 2.9% | ||||||||||||||
| 950,000 | AAdvantage Loyalty IP Ltd.(b) | US0003M + 4.750% | 10.3380 | 04/20/28 | 985,226 | |||||||||
| 990,000 | Air Canada(b) | US0003M + 3.500% | 8.8390 | 08/11/28 | 991,767 | |||||||||
| 1,557,970 | United Airlines, Inc.(b) | US0001M + 3.750% | 9.3770 | 04/21/28 | 1,562,839 | |||||||||
| 3,539,832 | ||||||||||||||
See accompanying notes to financial statements.
14
| Anfield Universal Fixed Income ETF |
| SCHEDULE OF INVESTMENTS (Continued) |
| July 31, 2023 |
| Principal | Coupon Rate | |||||||||||||
| Amount ($) | Spread | (%) | Maturity | Fair Value | ||||||||||
| TERM LOANS — 7.9% (Continued) | ||||||||||||||
| TOTAL TERM LOANS (Cost $9,330,935) | $ | 9,273,361 | ||||||||||||
| Principal | Coupon Rate | |||||||||||||
| Amount ($) | (%) | Maturity | Fair Value | |||||||||||
| U.S. GOVERNMENT & AGENCIES — 0.9% | ||||||||||||||
| U.S. TREASURY BILLS — 0.9% | ||||||||||||||
| 1,000,000 | United States Treasury Bill(e) | — | 08/01/23 | 1,000,000 | ||||||||||
| TOTAL U.S. GOVERNMENT & AGENCIES (Cost $1,000,000) | 1,000,000 | |||||||||||||
| TOTAL INVESTMENTS - 98.6% (Cost $123,784,092) | $ | 115,071,206 | ||||||||||||
| OTHER ASSETS IN EXCESS OF LIABILITIES- 1.4% | 1,707,026 | |||||||||||||
| NET ASSETS - 100.0% | $ | 116,778,232 | ||||||||||||
| A/S | - Anonim Sirketi |
| CLO | - Collateralized Loan Obligations |
| ETF | - Exchange-Traded Fund |
| LLC | - Limited Liability Company |
| Lp | - Limited Partnership |
| Ltd. | - Limited Company |
| plc | - Public Limited Company |
| REMIC | - Real Estate Mortgage Investment Conduit |
| S.A. | - Société Anonyme |
| SPDR | - Standard & Poor’s Depositary Receipt |
| H15T5Y | US Treasury Yield Curve Rate T Note Constant Maturity 5 Year |
| SOFRR30A | United States SOFR Secured Overnight Financing Rate Over A Rolling 30-Day Period |
| SOFRRATE | United States SOFR Secured Overnight Financing Rate |
| TSFR1M | TSFR1M |
| TSFR3M | TSFR3M |
| US0001M | ICE LIBOR USD 1 Month |
| US0003M | ICE LIBOR USD 3 Month |
| US0006M | ICE LIBOR USD 6 Month |
| (a) | Security exempt from registration under Rule 144A or Section 4(2) of the Securities Act of 1933. The security may be resold in transactions exempt from registration, normally to qualified institutional buyers. As of July 31, 2023 the total market value of 144A securities is $49,048,442 or 42.0% of net assets. |
| (b) | Variable or floating rate security, the interest rate of which adjusts periodically based on changes in current interest rates and prepayments on the underlying pool of assets. |
| (c) | Step bond. Coupon rate is fixed rate that changes on a specified date. The rate shown is the current rate at July 31, 2023. |
| (d) | Interest only securities. |
| (e) | Zero coupon bond. |
See accompanying notes to financial statements.
15
| Anfield Universal Fixed Income ETF |
| STATEMENT OF ASSETS AND LIABILITIES |
| July 31, 2023 |
| ASSETS | ||||
| Investment securities: | ||||
| At cost | $ | 123,784,092 | ||
| At fair value | $ | 115,071,206 | ||
| Cash | 1,410,381 | |||
| Dividends and interest receivable | 1,089,580 | |||
| Deposits for futures contracts | 320,660 | |||
| TOTAL ASSETS | 117,891,827 | |||
| LIABILITIES | ||||
| Payable for securities purchased | 1,000,000 | |||
| Investment advisory fees payable | 72,492 | |||
| Payable to related parties | 19,930 | |||
| Accrued expenses and other liabilities | 21,173 | |||
| TOTAL LIABILITIES | 1,113,595 | |||
| NET ASSETS | $ | 116,778,232 | ||
| Composition of Net Assets: | ||||
| Paid in capital | $ | 129,724,785 | ||
| Accumulated losses | (12,946,553 | ) | ||
| NET ASSETS | $ | 116,778,232 | ||
| Net Asset Value Per Share: | ||||
| Net Assets | $ | 116,778,232 | ||
| Shares of beneficial interest outstanding (a) | 13,125,000 | |||
| Net asset value (Net Assets ÷ Shares Outstanding), offering price and redemption price per share | $ | 8.90 |
| (a) | Unlimited number of shares of beneficial interest authorized, no par value. |
See accompanying notes to financial statements.
16
| Anfield Universal Fixed Income ETF |
| STATEMENT OF OPERATIONS |
| For the Year Ended July 31, 2023 |
| INVESTMENT INCOME | ||||
| Interest | $ | 6,603,504 | ||
| Dividends | 423,912 | |||
| TOTAL INVESTMENT INCOME | 7,027,416 | |||
| EXPENSES | ||||
| Investment advisory fees | 870,099 | |||
| Administration fees | 215,552 | |||
| Custodian fees | 25,619 | |||
| Compliance officer fees | 23,933 | |||
| Legal fees | 20,345 | |||
| Audit fees | 19,998 | |||
| Printing and postage expenses | 15,541 | |||
| Trustees fees and expenses | 12,885 | |||
| Transfer agent fees | 12,001 | |||
| Insurance expense | 9,125 | |||
| Other expenses | 8,464 | |||
| TOTAL EXPENSES | 1,233,562 | |||
| NET INVESTMENT INCOME | 5,793,854 | |||
| NET REALIZED AND UNREALIZED GAIN (LOSS) FROM INVESTMENTS | ||||
| Net realized loss from investments | (1,042,763 | ) | ||
| Net realized gain from redemptions in-kind | 63,438 | |||
| Distributions of realized gains by underlying investment companies | 271 | |||
| Net change in unrealized appreciation on investments | 459,564 | |||
| NET REALIZED AND UNREALIZED LOSS FROM INVESTMENTS | (519,490 | ) | ||
| NET INCREASE IN NET ASSETS RESULTING FROM OPERATIONS | $ | 5,274,364 |
See accompanying notes to financial statements.
17
| Anfield Universal Fixed Income ETF |
| STATEMENTS OF CHANGES IN NET ASSETS |
| For the | For the | |||||||
| Year Ended | Year Ended | |||||||
| July 31, 2023 | July 31, 2022 | |||||||
| FROM OPERATIONS | ||||||||
| Net investment income | $ | 5,793,854 | $ | 3,081,423 | ||||
| Net realized loss from investments and options purchased | (1,042,763 | ) | (458,234 | ) | ||||
| Net realized gain (loss) from redemptions in-kind | 63,438 | (144,757 | ) | |||||
| Distributions of realized gains by underlying investment companies | 271 | — | ||||||
| Net realized loss from futures contracts | — | (1,277,681 | ) | |||||
| Net change in unrealized appreciation (depreciation) on investments | 459,564 | (8,925,040 | ) | |||||
| Net increase (decrease) in net assets resulting from operations | 5,274,364 | (7,724,289 | ) | |||||
| DISTRIBUTIONS TO SHAREHOLDERS | ||||||||
| Total distributions paid | (5,707,888 | ) | (3,064,798 | ) | ||||
| Net decrease in net assets from distribution to shareholders | (5,707,888 | ) | (3,064,798 | ) | ||||
| FROM SHARES OF BENEFICIAL INTEREST | ||||||||
| Proceeds from shares sold | 14,342,119 | 19,413,823 | ||||||
| Payments for shares redeemed | (18,264,082 | ) | (16,669,551 | ) | ||||
| Net increase (decrease) in net assets from shares of beneficial interest | (3,921,963 | ) | 2,744,272 | |||||
| TOTAL DECREASE IN NET ASSETS | (4,355,487 | ) | (8,044,815 | ) | ||||
| NET ASSETS | ||||||||
| Beginning of the year | 121,133,719 | 129,178,534 | ||||||
| End of the year | $ | 116,778,232 | $ | 121,133,719 | ||||
| SHARE ACTIVITY | ||||||||
| Shares sold | 1,625,000 | 2,075,000 | ||||||
| Shares redeemed | (2,075,000 | ) | (1,825,000 | ) | ||||
| Net increase (decrease) in shares of beneficial interest outstanding | (450,000 | ) | 250,000 | |||||
See accompanying notes to financial statements.
18
| Anfield Universal Fixed Income ETF |
| FINANCIAL HIGHLIGHTS |
Per Share Data and Ratios for a Share of Beneficial Interest Outstanding Throughout the Years/Period
| For the | For the | For the | For the | For the | ||||||||||||||||
| Year Ended | Year Ended | Year Ended | Year Ended | Period Ended | ||||||||||||||||
| July 31, 2023 | July 31, 2022 | July 31, 2021 | July 31, 2020 | July 31, 2019 * | ||||||||||||||||
| Net asset value, beginning of year/period | $ | 8.92 | $ | 9.69 | $ | 9.86 | $ | 9.84 | $ | 10.00 | ||||||||||
| Activity from investment operations: | ||||||||||||||||||||
| Net investment income (a) | 0.44 | 0.22 | 0.13 | 0.12 | 0.22 | |||||||||||||||
| Net realized and unrealized gain (loss) on investments | (0.03 | ) | (0.80 | ) | (0.16 | ) | 0.01 | (0.17 | ) | |||||||||||
| Total from investment operations | 0.41 | (0.58 | ) | (0.03 | ) | 0.13 | 0.05 | |||||||||||||
| Less distributions from: | ||||||||||||||||||||
| Net investment income | (0.43 | ) | (0.19 | ) | (0.14 | ) | (0.11 | ) | (0.20 | ) | ||||||||||
| Net realized gains | — | — | — | — | (0.01 | ) | ||||||||||||||
| Total distributions | (0.43 | ) | (0.19 | ) | (0.14 | ) | (0.11 | ) | (0.21 | ) | ||||||||||
| Net asset value, end of year/period | $ | 8.90 | $ | 8.92 | $ | 9.69 | $ | 9.86 | $ | 9.84 | ||||||||||
| Market price, end of year/period | $ | 8.87 | $ | 8.90 | $ | 9.70 | $ | 9.86 | $ | 9.88 | ||||||||||
| Total return (b)(c) | 4.83 | % | (5.73 | )% | (0.32 | )% | 1.88 | % | 0.52 | % (i)(j) | ||||||||||
| Market price total return | 4.72 | % | (6.03 | )% | (0.22 | )% | 1.47 | % | 0.53 | % (i) | ||||||||||
| Net assets, at end of year/period (000)s | $ | 116,778 | $ | 121,134 | $ | 129,179 | $ | 121,756 | $ | 27,801 | ||||||||||
| Ratio of gross expenses to average net assets (d)(e) | 1.06 | % | 0.98 | % | 1.00 | % | 1.23 | % | 1.30 | % (k) | ||||||||||
| Ratio of net expenses to average net assets (e)(f) | 1.06 | % | 0.98 | % | 1.00 | % | 1.21 | % | 0.95 | % (k) | ||||||||||
| Ratio of net investment income to average net assets (g) | 4.98 | % | 2.37 | % | 1.35 | % | 1.21 | % | 2.56 | % (k) | ||||||||||
| Portfolio Turnover Rate (h) | 31 | % | 53 | % | 135 | % | 227 | % | 330 | % (i) | ||||||||||
| * | The Anfield Universal Fixed Income ETF commenced operations on September 17, 2018. |
| (a) | Per share amounts calculated using the average shares method, which more appropriately represents the per share data for the year/period. |
| (b) | Total return is calculated assuming a purchase of shares at net asset value on the first day and a sale at net asset value on the last day of the period. Distributions are assumed, for the purpose of this calculation, to be reinvested at the ex-dividend date net asset value per share on their respective payment dates. Total return would have been lower absent fee waiver/expense reimbursement. |
| (c) | Includes adjustments in accordance with accounting principles generally accepted in the United States and, consequently, the net asset value for financial reporting purposes and the returns based upon those net asset values may differ from the net asset values and returns for shareholder transactions. |
| (d) | Represents the ratio of expenses to average net assets absent fee waivers and/or expense reimbursements by the Adviser. |
| (e) | Does not include the expenses of other investment companies in which the fund invests. |
| (f) | Represents the ratio of expenses to average net assets inclusive of fee waivers and/or expense reimbursements by the Adviser. |
| (g) | Recognition of net investment income by the Fund is affected by the timing of the declaration of dividends by the underlying investment companies in which the Fund invests. |
| (h) | Portfolio turnover rate excludes securities received or delivered from in-kind transactions. |
| (i) | Not annualized. |
| (j) | Represents total return based on net asset values per share from commencement of investment operations on September 17, 2018 through July 31, 2019. Total return based on net asset value per share, as of the close of business on the day of commencement of trading on the BATS on September 18, 2018 through July 31, 2019 was 0.52%. |
| (k) | Annualized. |
See accompanying notes to financial statements.
19
| Anfield Universal Fixed Income ETF |
| NOTES TO FINANCIAL STATEMENTS |
| July 31, 2023 |
| 1. | ORGANIZATION |
The Anfield Universal Fixed Income ETF (the “Fund”) is a series of shares of beneficial interest of the Two Roads Shared Trust (the “Trust”), a statutory trust organized under the laws of the State of Delaware on June 8, 2012, and is registered under the Investment Company Act of 1940, as amended (the “1940 Act”), as a diversified, open-end management investment company. The Fund commenced operations on September 17, 2018. The Fund’s investment objective is to seek current income. The Fund is an actively managed ETF that normally invests at least 80% of its net assets, including any borrowings for investment purposes, in a diversified portfolio of fixed income instruments.
| 2. | SUMMARY OF SIGNIFICANT ACCOUNTING POLICIES |
The following is a summary of significant accounting policies followed by the Fund in preparation of its financial statements. These policies are in conformity with accounting principles generally accepted in the United States of America (“GAAP”). The preparation of financial statements requires management to make estimates and assumptions that affect the reported amounts of assets and liabilities and disclosure of contingent assets and liabilities at the date of the financial statements and the reported amounts of income and expenses for the period. Actual results could differ from those estimates. The Fund is an investment company and accordingly follows the investment company accounting and reporting guidance of the Financial Accounting Standards Board’s (“FASB”) Accounting Standard Codification Topic 946 “Financial Services – Investment Companies”.
Security Valuation – Securities listed on an exchange are valued at the last reported sale price at the close of the regular trading session of the exchange on the business day the value is being determined, or in the case of securities listed on NASDAQ at the NASDAQ Official Closing Price (“NOCP”). In the absence of a sale such securities shall be valued at the mean between the last bid and ask prices on the day of valuation. Debt securities (other than short-term obligations) are valued each day by an independent pricing service approved by the Board of Trustees (the “Board”) using methods which include current market quotations from a major market maker in the securities and based on methods which include the consideration of yields or prices of securities of comparable quality, coupon, maturity and type. Futures and future options are valued at the final settled price or, in the absence of a settled price, at the last sale price on the day of valuation. The independent pricing service does not distinguish between smaller-sized bond positions known as “odd lots” and larger institutional-sized bond positions known as “round lots”. The Fund may fair value a particular bond if the adviser does not believe that the round lot value provided by the independent pricing service reflects fair value of the Fund’s holding. Short-term debt obligations having 60 days or less remaining until maturity, at time of purchase, may be valued at amortized cost.
The Fund may hold securities, such as private investments, interests in commodity pools, other non-traded securities or temporarily illiquid securities, for which market quotations are not readily available or are determined to be unreliable. These securities are valued using the “fair value” procedures approved by the Board. The Board has designated the adviser as its valuation designee (the “Valuation Designee”) to execute these procedures. The Board may also enlist third party consultants such a valuation specialist at a public accounting firm, valuation consultant or financial officer of a security issuer on an as-needed basis to assist the Valuation Designee in determining a security-specific fair value. The Board is responsible for reviewing and approving fair value methodologies utilized by the Valuation Designee, approval of which shall be based upon whether the Valuation Designee followed the valuation procedures established by the Board.
Exchange Traded Funds (“ETFs”) – The Fund may invest in ETFs. ETFs are a type of index fund bought and sold on a securities exchange. An ETF trades like common stock and represents a fixed portfolio of securities designed to track the performance and dividend yield of a particular domestic or foreign market index. The Fund may purchase an ETF to temporarily gain exposure to a portion of the U.S. or a foreign market. The risks of owning an ETF generally reflect the risks of owning the underlying securities they are designed to track, although the lack of liquidity on an ETF could result in it being more volatile. Additionally, ETFs have fees and expenses that reduce their value.
20
| Anfield Universal Fixed Income ETF |
| NOTES TO FINANCIAL STATEMENTS (Continued) |
| July 31, 2023 |
Futures Contracts – The Fund may purchase or sell futures contracts to gain exposure to, or hedge against, changes in the value of equities, interest rates, foreign currencies, or commodities. Initial margin deposits required upon entering into futures contracts are satisfied by the segregation of specific securities or cash as collateral for the account of the broker (the Fund’s agent in acquiring the futures position). During the period the futures contracts are open, changes in the value of the contracts are recognized as unrealized gains or losses by “marking to market” on a daily basis to reflect the market value of the contracts at the end of each day’s trading. Variation margin payments are received or made depending upon whether unrealized gains or losses are incurred. When the contracts are closed, the Fund recognizes a realized gain or loss equal to the difference between the proceeds from, or cost of, the closing transaction and the Fund’s basis in the contract. If the Fund was unable to liquidate a futures contract and/or enter into an offsetting closing transaction, the Fund would continue to be subject to market risk with respect to the value of the contracts and continue to be required to maintain the margin deposits on the futures contracts. The Fund segregates liquid securities having a value at least equal to the amount of the current obligation under any open futures contract. Risks may exceed amounts recognized in the consolidated statement of assets and liabilities. With futures, there is minimal counterparty credit risk to the Fund since futures are exchange traded and the exchange’s clearinghouse, as counterparty to all exchange traded futures, guarantees the futures against default.
Option Transactions – The Fund is subject to equity price risk in the normal course of pursuing its investment objective and may purchase or sell options to help hedge against risk. When the Fund writes a call option, an amount equal to the premium received is included in the statement of assets and liabilities as a liability. The amount of the liability is subsequently marked-to-market to reflect the current market value of the option. If an option expires on its stipulated expiration date or if the Fund enters into a closing purchase transaction, a gain or loss is realized. If a written call option is exercised, a gain or loss is realized for the sale of the underlying security and the proceeds from the sale are increased by the premium originally received. As writer of an option, the Fund has no control over whether the option will be exercised and, as a result, retains the market risk of an unfavorable change in the price of the security underlying the written option.
The Fund may purchase put and call options. Put options are purchased to hedge against a decline in the value of securities held in the Fund’s portfolio. If such a decline occurs, the put options will permit the Fund to sell the securities underlying such options at the exercise price, or to close out the options at a profit. The premium paid for a put or call option plus any transaction costs will reduce the benefit, if any, realized by the Fund upon exercise of the option, and, unless the price of the underlying security rises or declines sufficiently, the option may expire worthless to the Fund. In addition, in the event that the price of the security in connection with which an option was purchased moves in a direction favorable to the Fund, the benefits realized by the Fund as a result of such favorable movement will be reduced by the amount of the premium paid for the option and related transaction costs. Written and purchased options are non-income producing securities. With purchased options, there is minimal counterparty risk to the Fund since these options are exchange traded and the exchange’s clearinghouse, as counterparty to all exchange traded options, guarantees against a possible default.
21
| Anfield Universal Fixed Income ETF |
| NOTES TO FINANCIAL STATEMENTS (Continued) |
| July 31, 2023 |
Fair Valuation Process – The applicable investments are valued by the Valuation Designee pursuant to valuation procedures established by the Board. For example, fair value determinations are required for the following securities: (i) securities for which market quotations are insufficient or not readily available on a particular business day (including securities for which there is a short and temporary lapse in the provision of a price by the regular pricing source); (ii) securities for which, in the judgment of the Valuation Designee, the prices or values available do not represent the fair value of the instrument; factors which may cause the Valuation Designee to make such a judgment include, but are not limited to, the following: only a bid price or an asked price is available; the spread between bid and asked prices is substantial; the frequency of sales; the thinness of the market; the size of reported trades; and actions of the securities markets, such as the suspension or limitation of trading; (iii) securities determined to be illiquid; and (iv) securities with respect to which an event that affects the value thereof has occurred (a “significant event”) since the closing prices were established on the principal exchange on which they are traded, but prior to a Fund’s calculation of its net asset value. Specifically, interests in commodity pools or managed futures pools are valued on a daily basis by reference to the closing market prices of each futures contract or other asset held by a pool, as adjusted for pool expenses. Restricted or illiquid securities, such as private investments or non-traded securities are valued based upon the current bid for the security from two or more independent dealers or other parties reasonably familiar with the facts and circumstances of the security (who should take into consideration all relevant factors as may be appropriate under the circumstances). If a current bid from such independent dealers or other independent parties is unavailable, the Valuation Designee shall determine the fair value of such security using the following factors: (i) the type of security; (ii) the cost at date of purchase; (iii) the size and nature of the Fund’s holdings; (iv) the discount from market value of unrestricted securities of the same class at the time of purchase and subsequent thereto; (v) information as to any transactions or offers with respect to the security; (vi) the nature and duration of restrictions on disposition of the security and the existence of any registration rights; (vii) how the yield of the security compares to similar securities of companies of similar or equal creditworthiness; (viii) the level of recent trades of similar or comparable securities; (ix) the liquidity characteristics of the security; (x) current market conditions; and (xi) the market value of any securities into which the security is convertible or exchangeable.
Valuation of Underlying Funds – The Fund may invest in portfolios of open-end or closed-end investment companies (the “Underlying Funds”). The Underlying Funds value securities in their portfolios for which market quotations are readily available at their market values (generally the last reported sale price) and all other securities and assets at their fair value according to the methods established by the board of directors of the Underlying Funds.
Open-ended funds are valued at their respective net asset values as reported by such investment companies. The shares of many closed-end investment companies, after their initial public offering, frequently trade at a price per share, which is different than the net asset value per share. The difference represents a market premium or market discount of such shares. There can be no assurances that the market discount or market premium on shares of any closed-end investment company purchased by the Fund will not change.
The Fund utilizes various methods to measure the fair value of all of its investments on a recurring basis. GAAP establishes a hierarchy that prioritizes inputs to valuation methods. The three levels of input are:
Level 1 – Unadjusted quoted prices in active markets for identical assets and liabilities that the Fund has the ability to access.
Level 2 – Observable inputs other than quoted prices included in Level 1 that are observable for the asset or liability, either directly or indirectly. These inputs may include quoted prices for the identical instrument on an inactive market, prices for similar instruments, interest rates, prepayment speeds, credit risk, yield curves, default rates and similar data.
Level 3 – Unobservable inputs for the asset or liability, to the extent relevant observable inputs are not available, representing the Fund’s own assumptions about the assumptions a market participant would use in valuing the asset or liability, and would be based on the best information available.
The availability of observable inputs can vary from security to security and is affected by a wide variety of factors, including, for example, the type of security, whether the security is new and not yet established in the marketplace, the liquidity of markets, and other characteristics particular to the security. To the extent that valuation is based on models or inputs that are less observable or unobservable in the market, the determination of fair value requires more judgment. Accordingly, the degree of judgment exercised in determining fair value is greatest for instruments categorized in Level 3.
22
| Anfield Universal Fixed Income ETF |
| NOTES TO FINANCIAL STATEMENTS (Continued) |
| July 31, 2023 |
The inputs used to measure fair value may fall into different levels of the fair value hierarchy. In such cases, for disclosure purposes, the level in the fair value hierarchy within which the fair value measurement falls in its entirety, is determined based on the lowest level input that is significant to the fair value measurement in its entirety.
The inputs or methodology used for valuing securities are not necessarily an indication of the risk associated with investing in those securities. The following tables summarize the inputs used as of July 31, 2023, for the Fund’s assets and liabilities measured at fair value:
| Assets* | Level 1 | Level 2 | Level 3 | Total | ||||||||||||
| Exchange-Traded Funds | $ | 7,107,774 | $ | — | $ | — | $ | 7,107,774 | ||||||||
| Asset Backed Securities | — | 29,162,115 | — | 29,162,115 | ||||||||||||
| Collateralized Mortgage Obligations | — | 10,696,017 | — | 10,696,017 | ||||||||||||
| Corporate Bonds | — | 57,831,939 | — | 57,831,939 | ||||||||||||
| Term Loans | — | 9,273,361 | — | 9,273,361 | ||||||||||||
| U.S. Government & Agencies | — | 1,000,000 | — | 1,000,000 | ||||||||||||
| Total | $ | 7,107,774 | $ | 107,963,432 | $ | — | $ | 115,071,206 | ||||||||
The Fund did not hold any Level 3 securities during the year.
| * | Refer to the Schedule of Investments for classifications. |
Security Transactions and Related Income – Security transactions are accounted for on trade date basis. Interest income is recognized on an accrual basis. Discounts are accreted and premiums are amortized on securities purchased over the lives of the respective securities. Dividend income is recorded on the ex-dividend date. Realized gains or losses from sales of securities are determined by comparing the identified cost of the security lot sold with the net sales proceeds. Due from broker, if any, balance is comprised of margin balance held at the broker.
Dividends and Distributions to Shareholders – Dividends from net investment income are declared and distributed monthly. Distributable net realized capital gains are declared and distributed annually. Dividends from net investment income and distributions from net realized gains are recorded on ex dividend date and determined in accordance with federal income tax regulations, which may differ from GAAP. These “book/tax” differences are considered either temporary (i.e., deferred losses, capital loss carry forwards) or permanent in nature. To the extent these differences are permanent in nature, such amounts are reclassified within the composition of net assets based on their federal tax-basis treatment; temporary differences do not require reclassification.
Federal Income Taxes – The Fund intends to continue to comply with the requirements of the Internal Revenue Code applicable to regulated investment companies and to distribute all of its taxable income to its shareholders. Therefore, no provision for federal income tax is required. The Fund recognizes the tax benefits of uncertain tax positions only where the position is “more likely than not” to be sustained assuming examination by tax authorities. Management has analyzed the Fund’s tax positions and has concluded that no liability for unrecognized tax benefits should be recorded related to uncertain tax positions taken on return filed for open tax years July 31, 2020 through July 31, 2022, or expected to be taken in the Fund’s July 31, 2023 tax returns. The Fund identified its major tax jurisdictions as U.S. Federal, Ohio and foreign jurisdictions where the Fund makes significant investments. The Fund is not aware of any tax positions for which it is reasonably possible that the total amounts of unrecognized tax benefits will change materially in the next twelve months.
Expenses – Expenses of the Trust that are directly identifiable to a specific fund are charged to that fund. Expenses, which are not readily identifiable to a specific fund, are allocated in such a manner as deemed equitable, taking into consideration the nature and type of expense and the relative sizes of the funds in the Trust.
23
| Anfield Universal Fixed Income ETF |
| NOTES TO FINANCIAL STATEMENTS (Continued) |
| July 31, 2023 |
Indemnification – The Trust indemnifies its officers and trustees for certain liabilities that may arise from the performance of their duties to the Trust. Additionally, in the normal course of business, the Fund enters into contracts that contain a variety of representations and warranties and which provide general indemnities. The Fund’s maximum exposure under these arrangements is unknown, as this would involve future claims that may be made against the Fund that have not yet occurred. However, the Fund expects the risk of loss due to these warranties and indemnities to be remote.
| 3. | INVESTMENT TRANSACTIONS |
For the year ended July 31, 2023, cost of purchases and proceeds from sales of portfolio securities (excluding in-kind transactions, short-term investments and U.S. government obligations) for the Fund amounted to $36,706,031 and $35,527,332, respectively. For the year ended July 31, 2023, cost of purchases and proceeds from sales of in-kind transactions for the Fund amounted to $5,254,800, and $6,766,464, respectively.
| 4. | INVESTMENT ADVISORY AGREEMENT AND TRANSACTIONS WITH RELATED PARTIES |
Regents Park Funds, LLC serves as the Fund’s investment adviser (the “Adviser”). Pursuant to an Investment Advisory Agreement with the Fund, the Adviser, subject to the authority of the Board, is responsible for managing the day to day operations of the Fund, including: selecting the overall investment strategies; monitoring and evaluating Sub-Adviser (as defined below) performance; and providing related administrative services and facilities. Anfield Group, LLC (“Anfield Group”), which is wholly owned by the David Young and Sandra G. Glain Family Trust, wholly owns the Adviser. As compensation for its services, the Fund pays to the Adviser an advisory fee (computed daily and paid monthly) at an annual rate of 0.75% of its average daily net assets. For the year ended July 31, 2023 the Fund incurred advisory fees of $870,099.
The Adviser has engaged Anfield Capital Management, LLC (“Anfield” or the “Sub-Adviser”) to serve as Sub-Adviser to the Fund. Anfield Group owns a majority interest in Anfield. The Sub-Adviser is an affiliate of the Adviser. The Sub-Adviser, with respect to the portion of the Fund’s assets allocated to the Sub-Adviser, is responsible for selecting investments and assuring that investments are made in accordance with the Fund’s investment objective, policies and restrictions. The Adviser compensates the Sub-Adviser for its services from the management fees received from the Fund, which are computed and accrued daily and paid monthly and does not impact the financial statements of the Fund.
The Adviser, pursuant to an Expense Limitation Agreement (the “Agreement”) has contractually agreed to reduce the Fund’s fees and/or absorb expenses of the Fund until at least November 30, 2023 to ensure that total annual Fund operating expenses after fee waiver and reimbursement (exclusive of any taxes, interest, brokerage commissions, expenses incurred in connection with any merger or reorganization, indirect expenses, expenses of other investment companies in which the Fund may invest, or extraordinary expenses such as litigation) will not exceed 1.50% of average daily net assets. This Agreement may be terminated by the Fund’s Board of Trustees on 60 days’ written notice to the Adviser. These fee waivers and expense reimbursements are subject to possible recoupment from the Fund in future years on a rolling three-year basis (within the three years after the fees have been waived or reimbursed) if such recoupment can be achieved without exceeding the foregoing expense limit as well as any expense limitation that was in effect at the time the waiver or reimbursement was made. If the Adviser waives any fee or reimburses any expense pursuant to its Agreement, and the Fund’s operating expenses are subsequently less than 1.50% of average daily net assets, the Adviser will be entitled to recoupment from the Fund for such waived fees or reimbursed expenses provided that such recoupment does not cause the Fund’s expenses to exceed the expense limitation in effect at the time of the waiver or reimbursement by the Adviser, which was 1.30% for the period prior to September 1, 2021 and 1.50% on or after September 1, 2021. If the Fund’s operating expenses subsequently exceed 1.50% per annum of average daily net assets recoupments shall be suspended. No recoupment amount will be paid to the Adviser in any fiscal quarter unless the Board has determined in advance that such recoupment is in the best interest of the Fund and its shareholders.
During the year ended July 31, 2023, the Adviser did not waive management fees or reimburse expenses.
The Trust, with respect to the Fund, has adopted a distribution and service plan (“Plan”) pursuant to Rule 12b-1 under the 1940 Act. Under the Plan, the Fund is authorized to pay distribution fees to Northern Lights Distributors (“NLD” or “the Distributor”) and other firms that provide distribution and shareholder services (“Service Providers”). If a Service Provider provides these services, the Fund may pay fees at an annual rate not to exceed 0.25% of average daily net assets, pursuant to Rule 12b-1 under the 1940 Act.
24
| Anfield Universal Fixed Income ETF |
| NOTES TO FINANCIAL STATEMENTS (Continued) |
| July 31, 2023 |
No distribution or service fees are currently paid by the Fund and there are no current plans to impose these fees. In the event Rule 12b-1 fees were charged, over time they would increase the cost of an investment in the Fund.
In addition, certain affiliates of the Distributor provide services to the Fund as follows:
Ultimus Fund Solutions, LLC (“UFS”), an affiliate of the Distributor, provides administration, fund accounting, and transfer agent services to the Trust. Pursuant to separate servicing agreements with UFS, the Fund pays UFS customary fees for providing administration, fund accounting and transfer agency services to the Fund. Certain officers of the Trust are also officers of UFS and are not paid any fees directly by the Fund for servicing in such capacities.
BluGiant, LLC (“BluGiant”), BluGiant, an affiliate of UFS and the Distributor, provides EDGAR conversion and filing services as well as print management services for the Fund on an ad-hoc basis. For the provision of these services, BluGiant receives customary fees from the Fund.
Northern Lights Compliance Services, LLC (“NLCS”), an affiliate of UFS and the Distributor, provides a Chief Compliance Officer to the Trust, as well as related compliance services, pursuant to a consulting agreement between NLCS and the Trust. Under the terms of such agreement, NLCS receives customary fees from the Fund.
| 5. | CAPITAL SHARE TRANSACTIONS |
Shares are not individually redeemable and may be redeemed by the Fund at NAV only in large blocks known as “Creation Units.” Shares are created and redeemed by the Fund only in Creation Unit size aggregations of 25,000 shares. Only Authorized Participants or transactions done through an Authorized Participant are permitted to purchase or redeem Creation Units from the Fund. An Authorized Participant is either (i) a broker-dealer or other participant in the clearing process through the Continuous Net Settlement System of the National Securities Clearing Corporation or (ii) a DTC participant and, in each case, must have executed a Participant Agreement with the Distributor. Such transactions are principally in exchange for a deposit of a specified cash payment, plus a transaction fee, but may also be permitted on an in-kind basis, with a balancing cash component to equate the transaction to the NAV per share of the Fund on the transaction date. In addition, the Fund may impose transaction fees on purchases and redemptions of Fund shares to cover the custodial and other costs incurred by the Funds in effecting trades. A fixed fee payable to the Custodian may be imposed on each creation and redemption transaction regardless of the number of Creation Units involved in the transaction (“Fixed Fee”). Purchases and redemptions of Creation Units for cash or involving cash-in-lieu are required to pay an additional variable charge to compensate the Fund and its ongoing shareholders for brokerage and market impact expenses relating to Creation Unit transactions (“Variable Charge,” and together with the Fixed Fee, the “Transaction Fees”). Transactions in capital shares for the Fund are disclosed in the Statements of Changes in Net Assets.
The Transaction Fees for the Fund are listed in the table below:
| Minimum Additional | Maximum Additional | |
| Fee for In-Kind and | Variable Charge for | Variable Charge for |
| Cash Purchases | Cash Purchases* | Cash Purchases* |
| $150 | 20 bps | 200 bps |
| * | As a percentage of the amount invested. |
25
| Anfield Universal Fixed Income ETF |
| NOTES TO FINANCIAL STATEMENTS (Continued) |
| July 31, 2023 |
| 6. | PRINCIPAL INVESTMENT RISKS |
The Fund’s investments in securities, financial instruments and derivatives expose it to various risks, certain of which are discussed below. Please refer to the Fund’s prospectus and statement of additional information for further information regarding the risks associated with the Fund’s investments which include, but are not limited to active trading risk, authorized participant concentration risk, bank loan risk, cash redemption risk, collateralized loan obligations risk, common stock risk, convertible securities risk, counterparty credit risk, credit risk, credit spread risk, currency risk, cybersecurity risk, derivatives risk, emerging markets risks, energy sector risk, ETF structure risks, financial sector risk, fixed income securities risk, fluctuation of net asset value risk, foreign (non-U.S.) investment risk, futures contract risk, gap risk, hedging transactions risk, high yield risk, index risk, investment companies and exchange-traded funds risk, issuer-specific risk, leveraging risk, LIBOR risk, liquidity risk, management risk, market risk, market events risk, MLP risk, mortgage-backed and asset-backed securities risk, odd lot pricing risk, portfolio turnover risk, prepayment and extension risk, regulatory risk, sector risk, securities lending risk, swap risk, underlying fund risk, U.S. government securities risk, valuation risk, variable or floating rate securities risk and volatility risk.
Investment Companies and ETFs Risks – When the Fund invests in other investment companies, including closed-end funds and ETFs, it will bear additional expenses based on its pro rata share of other investment company’s or ETF’s operating expenses, including management fees in addition to those paid by the Fund. The risk of owning an investment company or ETF generally reflects the risks of owning the underlying investments held by the investment company or ETF. The Fund will also incur brokerage costs when it purchases and sells closed-end funds or ETFs. The Fund may invest in inverse ETFs, which may result in increased volatility and will magnify the Fund’s losses or gains. During periods of market volatility, inverse ETFs may not perform as expected.
Underlying Fund Risk – The Fund’s investment performance and its ability to achieve its investment objective are directly related to the performance of the underlying funds in which it invests. There can be no assurance that the Fund’s investments in the underlying funds will achieve their respective investment objectives. The Fund is subject to the risks of the underlying funds in direct proportion to the allocation of its assets among the underlying funds.
Collateralized Loan Obligations Risk – The Fund is subject to certain risks as a result of its investments in Collateralized Loan Obligations (“CLOs”). The CLO’s performance is linked to the expertise of the CLO manager. One of the primary risks to investors of a CLO is the potential change in CLO manager, over which the Fund will have no control. The Fund may be adversely affected by new (or revised) laws or regulations that may be imposed by government regulators or self-regulatory organizations that supervise the financial markets. CLO debt securities are limited recourse obligations of their issuers. If income from the underlying loans is insufficient to make payments on the CLO debt, no other assets will be available for payment. In the event of an early redemption, holders of the CLO debt being redeemed will be repaid earlier than the stated maturity of the debt. The timing of redemptions may adversely affect the returns on CLO debt. The CLO manager may not find suitable assets in which to invest during the reinvestment period or to replace assets that the manager has determined are no longer suitable for investment. Additionally, there is a risk that the reinvestment period may terminate early if, for example, the CLO defaults on payments on the securities which it issues or if the CLO manager determines that it can no longer reinvest in underlying assets.
Convertible Securities Risk – The market value of a convertible security performs like that of a regular debt security; that is, if market interest rates rise, the value of a convertible security usually falls. In addition, convertible securities are subject to the risk that the issuer will not be able to pay interest or dividends when due, and their market value may change based on changes in the issuer’s credit rating or the market’s perception of the issuer’s creditworthiness. Since it derives a portion of its value from the common stock into which it may be converted, a convertible security is also subject to the same types of market and issuer risks that apply to the underlying common stock.
26
| Anfield Universal Fixed Income ETF |
| NOTES TO FINANCIAL STATEMENTS (Continued) |
| July 31, 2023 |
Derivatives Risk – The derivative instruments in which the Fund may invest, including futures, options, credit default swaps, total return swaps, repurchase agreements and other similar instruments, may be more volatile than other instruments and may be subject to unanticipated market movements, which are potentially unlimited. The risks associated with investments in derivatives also include liquidity, interest rate, market, credit and management risks, mispricing or improper valuation. The use of derivative instruments involves risks different from, or possibly greater than, the risks associated with investing directly in securities and other traditional investments, and certain derivatives may create a risk of loss greater than the amount invested. These risks include (i) the risk that the counterparty to a derivative transaction may not fulfill its contractual obligations; (ii) risk of mispricing or improper valuation; and (iii) the risk that changes in the value of the derivative may not correlate perfectly with the underlying asset, rate or index. The risks associated with investments in derivatives also include leverage, liquidity, interest rate, market, credit and management risks. In addition, if a derivative is being used for hedging purposes there can be no assurance given that each derivative position will achieve a perfect correlation with the security or currency against which it is being hedged, or that a particular derivative position will be available when sought by the portfolio manager. Derivative prices are highly volatile and may fluctuate substantially during a short period of time. Such prices are influenced by numerous factors that affect the markets, including, but not limited to: changing supply and demand relationships; government programs and policies; and national and international political and economic events, changes in interest rates, and inflation and deflation. Trading derivative instruments involves risks different from, or possibly greater than, the risks associated with investing directly in securities and other more traditional investments, and certain derivatives may create a risk of loss greater than the amount invested.
ETF Structure Risks – The Fund is structured as an ETF and as a result is subject to special risks. Shares are not individually redeemable and may be redeemed by the Fund at NAV only in large blocks known as “Creation Units.” Trading in Shares on the Cboe BZX Exchange, Inc. (the “Exchange”) may be halted due to market conditions or for reasons that, in the view of the Exchange, make trading in Shares inadvisable, such as extraordinary market volatility. There can be no assurance that Shares will continue to meet the listing requirements of the Exchange. An active trading market for the Fund’s shares may not be developed or maintained. If the Fund’s shares are traded outside a collateralized settlement system, the number of financial institutions that can act as authorized participants that can post collateral on an agency basis is limited, which may limit the market for the Fund’s shares. The market prices of Shares will fluctuate in response to changes in NAV and supply and demand for Shares and will include a “bid-ask spread” charged by the exchange specialists, market makers or other participants that trade the particular security. There may be times when the market price and the NAV vary significantly, particularly during times of market stress, with the result that investors may pay significantly more or significantly less for Fund shares than the Fund’s NAV, which is reflected in the bid and ask price for Fund shares or in the closing price. If a shareholder purchases shares at a time when the market price is at a premium to the NAV or sells shares at a time when the market price is at a discount to NAV, the shareholder may sustain losses if the shares are sold at a price that is less than the price paid by the shareholder for the shares. When all or a portion of an ETFs underlying securities trade in a market that is closed when the market for the Fund’s shares is open, there may be changes from the last quote of the closed market and the quote from the Fund’s domestic trading day, which could lead to differences between the market value of the Fund’s shares and the Fund’s NAV. In stressed market conditions, the market for the Fund’s shares may become less liquid in response to the deteriorating liquidity of the Fund’s portfolio. This adverse effect on the liquidity of the Fund’s shares may, in turn, lead to differences between the market value of the Fund’s shares and the Fund’s NAV.
Fixed Income Securities Risk – Fixed income securities are subject to interest rate risk, call risk, prepayment and extension risk, credit risk, duration, and liquidity risk. In addition, current market conditions may pose heightened risks for fixed income securities. When the Fund invests in fixed income securities or derivatives, the value of your investment in the Fund will fluctuate with changes in interest rates. Typically, a rise in interest rates causes a decline in the value of fixed income securities or derivatives owned by the Fund. Risks associated with rising interest rates are heightened given that interest rates in the U.S. currently remain near historic lows, but have recently risen and are expected to rise further. Moreover, new regulations applicable to and changing business practices of financial intermediaries that make markets in fixed income securities have resulted in less market making activity for certain fixed income securities, which has reduced the liquidity and may increase the volatility for such fixed income securities. The fixed-income securities market can be susceptible to increases in volatility and decreases in liquidity. Liquidity may decline unpredictably in response to overall economic conditions or credit tightening. Duration risk arises when holding long duration and long maturity investments, which will magnify certain risks, including interest rate risk and credit risk. Longer-term securities may be more sensitive to interest rate changes.
27
| Anfield Universal Fixed Income ETF |
| NOTES TO FINANCIAL STATEMENTS (Continued) |
| July 31, 2023 |
Fluctuation of Net Asset Value Risk – The NAV of the Fund’s shares will generally fluctuate with changes in the market value of the Fund’s holdings. The market prices of the shares will generally fluctuate in accordance with changes in NAV as well as the relative supply of and demand for the shares on the Exchange. The Fund’s Sub- Adviser cannot predict whether the shares will trade below, at or above their NAV. Price differences may be due, in large part, to the fact that supply and demand forces at work in the secondary trading market for the shares will be closely related to, but not identical to, the same forces influencing the prices of the Fund’s holdings trading individually or in the aggregate at any point in time. In addition, unlike conventional ETFs, the Fund is not an index fund. The Fund is actively managed and does not seek to replicate the performance of a specified Index. Actively managed ETFs have a limited trading history and, therefore, there can be no assurance as to whether and/or the extent to which the Shares will trade at premiums or discounts to NAV.
Market Risk – Overall market risk may affect the value of individual instruments in which the Fund invests. The Fund is subject to the risk that the securities markets will move down, sometimes rapidly and unpredictably, based on overall economic conditions and other factors, which may negatively affect the Fund’s performance. Factors such as domestic and foreign (non-U.S.) economic growth and market conditions, real or perceived adverse economic or political conditions, military conflict, acts of terrorism, social unrest, natural disasters, recessions, inflation, changes in interest rate levels, supply chain disruptions, sanctions, the spread of infectious illness or other public health threats, lack of liquidity in the bond and other markets, volatility in the securities markets, adverse investor sentiment affect the securities markets and political events affect the securities markets. U.S. and foreign stock markets have experienced periods of substantial price volatility in the past and may do so again in the future. Securities markets also may experience long periods of decline in value. When the value of the Fund’s investments goes down, your investment in the Fund decreases in value and you could lose money.
Local, state, regional, national or global events such as war, acts of terrorism, the spread of infectious illness or other public health issues, recessions, or other events could have a significant impact on the Fund and its investments and could result in decreases to the Fund’s net asset value. Political, geopolitical, natural and other events, including war, terrorism, trade disputes, government shutdowns, market closures, natural and environmental disasters, epidemics, pandemics and other public health crises and related events and governments’ reactions to such events have led, and in the future may lead, to economic uncertainty, decreased economic activity, increased market volatility and other disruptive effects on U.S. and global economies and markets. Such events may have significant adverse direct or indirect effects on the Fund and its investments. For example, a widespread health crisis such as a global pandemic could cause substantial market volatility, exchange trading suspensions and closures, impact the ability to complete redemptions, and affect Fund performance. A health crisis may exacerbate other pre-existing political, social and economic risks. In addition, the increasing interconnectedness of markets around the world may result in many markets being affected by events or conditions in a single country or region or events affecting a single or small number of issuers.
Mortgage-Backed and Asset-Backed Securities Risk – The risk of investing in mortgage-backed and other asset-backed securities, includes prepayment risk, extension risk, interest rate risk, market risk and management risk. Mortgage-backed securities include caps and floors, inverse floaters, mortgage dollar rolls, private mortgage pass-through securities, resets and stripped mortgage securities. A systemic and persistent increase in the interest rate volatility may also negatively impact a number of the Fund’s mortgage-backed and asset-backed securities holdings. The Fund will invest less than 25% of its net assets in asset-backed securities or mortgage-backed securities that are below-investment grade.
LIBOR Risk – The Fund may invest in securities and other instruments whose interest payments are determined by references to the London Interbank Offered Rate (“LIBOR”). The United Kingdom Financial Conduct Authority, which regulates LIBOR, previously announced that after 2021 it would cease its active encouragement of banks to provide the quotations needed to sustain LIBOR. ICE Benchmark Administration Limited, the administrator of LIBOR, ceased publication of most LIBOR settings on a representative basis at the end of 2021 and was scheduled to be discontinued after June 30, 2023 and the publication of the remaining LIBOR settings on a representative basis has ceased. The U.S. Federal Reserve, based on the recommendations of the New York Federal Reserve’s Alternative Reference Rate Committee (comprised of major derivative market participants and their regulators), has begun publishing Secured Overnight Financing Rate (SOFR), a broad measure of secured overnight U.S. Treasury repo rates, that is intended to replace U.S. dollar LIBOR. Actions by regulators have resulted in the establishment of alternative reference rates to LIBOR in most major currencies. Markets are developing in response to these new rates, but questions around liquidity in these rates and how to appropriately adjust these rates to eliminate any economic value transfer at the time of transition remain a significant concern.
28
| Anfield Universal Fixed Income ETF |
| NOTES TO FINANCIAL STATEMENTS (Continued) |
| July 31, 2023 |
The unavailability of LIBOR presents risks to the Fund, including the risk that any pricing or adjustments to the Fund’s investments resulting from a substitute or alternate reference rate may adversely affect the Fund’s performance and/or NAV. The utilization of an alternative reference rate, or the transition process to an alternative reference rate, may adversely affect the Fund’s performance. It remains uncertain how such changes would be implemented and the effects such changes would have on the Fund, including any negative effects on the Fund’s liquidity and valuation of the Fund’s investments, issuers of instruments in which the Fund invests and financial markets generally.
Volatility Risk – The Fund or an underlying fund may have investments that appreciate or decrease significantly in value over short periods of time. The value of an investment in the Fund’s portfolio may fluctuate due to factors that affect markets generally or that affect a particular industry or sector. The value of an investment in the Fund’s portfolio may also be more volatile than the market as a whole. This volatility may affect the Fund’s NAV per share, including by causing it to experience significant increases or declines in value over short periods of time. Events or financial circumstances affecting individual investments, industries or sectors may increase the volatility of the Fund.
| 7. | DISTRIBUTIONS TO SHAREHOLDERS AND TAX COMPONENTS OF CAPITAL |
The Statement of Assets and Liabilities represents cost for financial reporting purposes. As of the year ended July 31, 2023, aggregate cost for federal tax purposes is $123,904,924 for the Fund, and differs from market value by net unrealized appreciation (depreciation) which consisted of:
| Gross unrealized appreciation: | $ | 1,186,787 | ||
| Gross unrealized depreciation: | (10,020,505 | ) | ||
| Net unrealized depreciation: | $ | (8,833,718 | ) |
The tax character of Fund distributions paid for the fiscal years ended July 31, 2023 and July 31, 2022 was as follows:
| Fiscal Year Ended | Fiscal Year Ended | |||||||
| July 31, 2023 | July 31, 2022 | |||||||
| Ordinary Income | $ | 5,707,888 | $ | 3,064,798 | ||||
| Long-Term Capital Gain | — | — | ||||||
| Return of Capital | — | — | ||||||
| $ | 5,707,888 | $ | 3,064,798 | |||||
As of July 31, 2023, the components of accumulated earnings/ (deficit) on a tax basis were as follows:
| Undistributed | Undistributed | Post October Loss | Capital Loss | Other | Unrealized | Total | ||||||||||||||||||||
| Ordinary | Long-Term | and | Carry | Book/Tax | Appreciation/ | Distributable Earnings/ | ||||||||||||||||||||
| Income | Gains | Late Year Loss | Forwards | Differences | (Depreciation) | (Accumulated Deficit) | ||||||||||||||||||||
| $ | 367,403 | $ | — | $ | (538,877 | ) | $ | (3,941,361 | ) | $ | — | $ | (8,833,718 | ) | $ | (12,946,553 | ) | |||||||||
The difference between book basis and tax basis undistributed net investment income/(loss), accumulated net realized gain/(loss), and unrealized appreciation/(depreciation) from investments is primarily attributable to tax deferral of losses on wash sales and adjustments for perpetual bonds.
Capital losses incurred after October 31 within the fiscal year are deemed to arise on the first business day of the following fiscal year for tax purposes. The Fund incurred and elected to defer such capital losses of $538,877.
At July 31, 2023, the Fund had capital loss carry forwards for federal income tax purposes available to offset future capital gains along with capital loss carryforwards utilized as follows:
| Short-Term | Long-Term | Total | CLCF Utilized | |||||||||||
| $ | 2,172,901 | $ | 1,768,460 | $ | 3,941,361 | $ | — | |||||||
29
| Anfield Universal Fixed Income ETF |
| NOTES TO FINANCIAL STATEMENTS (Continued) |
| July 31, 2023 |
Permanent book and tax differences, primarily attributable to tax adjustments for realized gain/(loss) on in-kind redemptions resulted in reclassification for the year ended July 31, 2023 as follows:
| Paid | ||||||
| In | Accumulated | |||||
| Capital | Deficit | |||||
| $ | 52,205 | $ | (52,205 | ) | ||
| 8. | SUBSEQUENT EVENTS |
Subsequent events after the date of the Statement of Assets and Liabilities have been evaluated through the date the financial statements were issued. Management has determined that no events or transactions occurred requiring adjustment or disclosure in the financial statements.
30
 | Deloitte & Touche LLP
695 Town Center Drive
Tel: 714 436 7100 |
REPORT OF INDEPENDENT REGISTERED PUBLIC ACCOUNTING FIRM
To the shareholders and the Board of Trustees of Two Roads Shared Trust
Opinion on the Financial Statements and Financial Highlights
We have audited the accompanying statement of assets and liabilities, including the schedule of investments, of Anfield Universal Fixed Income ETF, one of the funds constituting the Two Roads Shared Trust (the “Fund”), as of July 31, 2023, the related statement of operations for the year then ended, the statements of changes in net assets for each of the two years in the period then ended, the financial highlights for each of the two years in the period then ended, and the related notes. In our opinion, the financial statements and financial highlights present fairly, in all material respects, the financial position of the Fund as of July 31, 2023, and the results of its operations for the year then ended, the changes in its net assets for each of the two years in the period then ended, and the financial highlights for each of the two years in the period then ended in conformity with accounting principles generally accepted in the United States of America. The financial highlights for each of the two years in the period ended July 31, 2021 and for the period from September 17, 2018 (commencement of operations) through July 31, 2019, were audited by other auditors whose report, dated September 29, 2021, expressed an unqualified opinion on those statements.
Basis for Opinion
These financial statements and financial highlights are the responsibility of the Fund’s management. Our responsibility is to express an opinion on the Fund’s financial statements and financial highlights based on our audits. We are a public accounting firm registered with the Public Company Accounting Oversight Board (United States) (PCAOB) and are required to be independent with respect to the Fund in accordance with the U.S. federal securities laws and the applicable rules and regulations of the Securities and Exchange Commission and the PCAOB.
We conducted our audits in accordance with the standards of the PCAOB. Those standards require that we plan and perform the audit to obtain reasonable assurance about whether the financial statements and financial highlights are free of material misstatement, whether due to error or fraud. The Fund is not required to have, nor were we engaged to perform, an audit of its internal control over financial reporting. As part of our audits we are required to obtain an understanding of internal control over financial reporting but not for the purpose of expressing an opinion on the effectiveness of the Fund’s internal control over financial reporting. Accordingly, we express no such opinion.
Our audits included performing procedures to assess the risks of material misstatement of the financial statements and financial highlights, whether due to error or fraud, and performing procedures that respond to those risks. Such procedures included examining, on a test basis, evidence regarding the amounts and disclosures in the financial statements and financial highlights. Our audits also included evaluating the accounting principles used and significant estimates made by management, as well as evaluating the overall presentation of the financial statements and financial highlights. Our procedures included confirmation of securities owned as of July 31, 2023, by correspondence with the custodian and brokers; when replies were not received from brokers, we performed other auditing procedures. We believe that our audits provide a reasonable basis for our opinion.

Costa Mesa, California
September 28, 2023
We have served as the auditor of one or more Regents Park Funds, LLC investment companies since 2022.
31
| Anfield Universal Fixed Income ETF |
| ADDITIONAL INFORMATION (Unaudited) |
| July 31, 2023 |
Approval of Advisory Agreement
Regents Park Funds, LLC and Anfield Capital Management, LLC for the Anfield Universal Fixed Income ETF
At a meeting held on March 27–28, 2023 (the “Meeting”), the Board of Trustees (the “Board”) of Two Roads Shared Trust (the “Trust”), each of whom is not an “interested person” of the Trust (the “Independent Trustees” or the “Trustees”), as such term is defined under Section 2(a)(19) of the Investment Company Act of 1940, as amended (the “1940 Act”), considered the renewal (i) of the investment advisory agreement (the “Advisory Agreement”) between Regents Park Funds, LLC (“Regents Park” or the “Adviser”) and the Trust, on behalf of Anfield Universal Fixed Income ETF (the “Anfield ETF” or the “Fund”) and (ii) of the sub-advisory agreement (the “Sub-Advisory Agreement” together with the Advisory Agreement, the “Agreements”) among Regents Park, Anfield Capital Management, LLC (“Anfield” or the “Sub-Adviser”) and the Trust, on behalf of the Anfield ETF.
In connection with the Board’s consideration of the Advisory Agreement and the Sub-Advisory Agreement, the Board received written materials in advance of the Meeting, which included information regarding: (i) the nature, extent, and quality of services provided to the Anfield ETF by the Adviser and the Sub-Adviser; (ii) a description of the Adviser’s and the Sub-Adviser’s investment management personnel; (iii) an overview of the Adviser’s and the Sub-Adviser’s respective operations and financial condition; (iv) a description of the Adviser’s and the Sub-Adviser’s brokerage practices (including any soft dollar arrangements); (v) a comparison of the Anfield ETF’s advisory fee and overall expenses with those of comparable mutual funds; (vi) the level of profitability from the Adviser’s and the Sub-Adviser’s fund-related operations; (vii) the Adviser’s and the Sub-Adviser’s compliance policies and procedures, including policies and procedures for personal securities transactions, business continuity and information security and (viii) information regarding the performance record of the Fund as compared to other mutual funds with similar investment strategies.
Throughout the process, including at the Meeting, the Board had numerous opportunities to ask questions of and request additional materials from Regents Park and Anfield. The Board was advised by, and met, in executive sessions with, the Board’s independent legal counsel, and received a memorandum from such independent counsel regarding their responsibilities under applicable law. The Board also noted that the evaluation process with respect to the Adviser and the Sub-Adviser is an ongoing one and that in this regard, the Board took into account discussions with management and information provided to the Board at prior meetings with respect to the services provided by the Adviser and the Sub-Adviser, including quarterly performance reports prepared by management. The Board noted that the information received and considered by the Board in connection with the Meeting and throughout the year was both written and oral.
32
| Anfield Universal Fixed Income ETF |
| ADDITIONAL INFORMATION (Unaudited) (Continued) |
| July 31, 2023 |
Matters considered by the Board in connection with its approval of the Agreements with respect to the Fund included, among others, the following:
Nature, Extent and Quality of Services. The Board reviewed materials provided by Regents Park related to the Advisory Agreement with respect to the Fund, including: the Advisory Agreement; a description of the manner in which investment decisions are made and executed; an overview of the personnel that perform services for the Fund and their background and experience; a review of the financial condition of Regents Park; information regarding risk management processes and liquidity management; the compliance policies and procedures of Regents Park, including its business continuity and cybersecurity policies and a code of ethics that contained provisions reasonably necessary to prevent Access Persons, as that term is defined in Rule 17j-1 under the 1940 Act, from engaging in conduct prohibited by Rule 17j-1(b); Regents Park’s compliance resources and practices; information regarding Regents Park’s compliance and regulatory history; and an independent report prepared by Broadridge analyzing the performance record, fees and expenses of the Fund as compared to those of a peer group of other mutual funds with similar investment strategies as selected by Broadridge.
The Board also noted that on a regular basis it received and reviewed information from the Trust’s Chief Compliance Officer (“CCO”) regarding the Fund’s compliance policies and procedures established pursuant to Rule 38a-1 under the 1940 Act, which included evaluating the regulatory compliance systems of the Adviser and procedures reasonably designed to ensure compliance with the federal securities laws. The Board also considered the Adviser’s policies and procedures relating to business continuity and cybersecurity, including the review and evaluation of the Trust’s CCO of these policies and procedures.
The Board took into account that Regents Park and Anfield are affiliates under common control and share many, but not all, key personnel with each other, and considered the expansion in staffing of the Adviser in different areas. The Board considered the differing functions of each firm with respect to managing either the operations and/or the portfolio for the Fund, any potential conflicts of interest for the Fund that the arrangement served, and the Adviser’s mitigation of such conflicts.
The Board noted no significant disruption or impact to the services provided by the Adviser as a result of the COVID-19 pandemic and that the Adviser had continued to provide the same level, quality and extent of services to the Fund. The Board also considered the significant risks assumed by the Adviser in connection with the services provided to the Fund, including entrepreneurial risk and ongoing risks including investment, operational, enterprise, litigation, regulatory, and compliance risks with respect to the Fund.
The Board considered Regents Park’s role as the investment adviser to the Anfield ETF and Regents Park’s retention of a sub-adviser to manage day-to–day investment decisions for the Fund. The Board considered the oversight and supervisory role performed by Regents Park for the Fund, and noted that Regents Park provided overall management and oversight of the Fund’s operations and expenses, competitor analysis, and compliance and operational support and operated a Sub-Adviser Oversight Committee to monitor the Sub-Adviser of the Fund, among other services provided to the Fund. The Board considered that Regents Park received daily reports from the Sub-Adviser in connection with Regents Park’s oversight of the Sub-Adviser. In addition, the Board considered its familiarity with Regents Park’s personnel obtained from the Board’s
33
| Anfield Universal Fixed Income ETF |
| ADDITIONAL INFORMATION (Unaudited) (Continued) |
| July 31, 2023 |
oversight of the Fund and of other funds in the Trust advised by Regents Park, as well as the affiliation between Regents Park and Anfield and any potential conflicts of interest with the Sub-Adviser.
In considering the nature, extent, and quality of the services provided by Regents Park, the Board also took into account its knowledge, acquired through discussions and reports during the preceding year and in past years, of Regents Park’s management and the quality of the performance of its duties. The Board concluded that the management of Regents Park had the skills, experience and sophistication necessary to effectively oversee the Sub-Adviser and concluded that Regents Park had sufficient quality and depth of personnel, resources, and compliance policies and procedures for performing its duties and that the nature, overall quality and extent of the services provided by Regents Park were satisfactory and reliable.
The Board reviewed materials provided by Anfield related to the Sub-Advisory Agreement with respect to the Anfield ETF, including: the Sub-Advisory Agreement; a description of the manner in which investment decisions are made and executed; an overview of the personnel that perform services for the Anfield ETF and their background and experience; information relating to the financial condition of the Sub-Adviser; a written report containing the Sub-Adviser’s performance commentaries for the prior quarterly period; the Sub-Adviser’s compliance policies and procedures, including its business continuity and cybersecurity policies, a code of ethics containing provisions reasonably necessary to prevent Access Persons, as that term is defined in Rule 17j-1 under the 1940 Act, from engaging in conduct prohibited by Rule 17j-1(b); information regarding risk management processes and liquidity management; an annual review of the operation of the Sub-Adviser’s compliance program; information regarding the Sub-Adviser’s compliance and regulatory history; and an independent report prepared by Broadridge, an independent third party data provider, analyzing the performance record of the Anfield ETF and the fees and expenses of the Anfield ETF as compared to other mutual funds with similar investment strategies, as applicable.
In considering the nature, extent, and quality of the services provided by Anfield in its capacity as a sub-adviser, the Board also took into account its knowledge of Anfield’s management and the quality of the performance of its duties as adviser and as a sub-adviser, acquired through discussions and reports during the preceding year and in past years. The Board noted no significant disruption or impact to the services provided by the Sub-Adviser as a result of the COVID-19 pandemic and that the Sub-Adviser had continued to provide the same level, quality and extent of services to the Fund. The Board reviewed the background information on Anfield’s key personnel, taking into consideration their education, financial industry experience, and fixed income experience. The Board noted the continued retention of an outside CCO and found that Anfield continued to operate an effective compliance program and had no significant compliance matters reported over the past year. The Board concluded that Anfield had sufficient quality and depth of personnel, resources, investment methodologies and compliance policies and procedures to perform its duties under the Sub-Advisory Agreement with respect to the Anfield ETF and that the nature, overall quality and extent of the services provided by Anfield were satisfactory and reliable.
34
| Anfield Universal Fixed Income ETF |
| ADDITIONAL INFORMATION (Unaudited) (Continued) |
| July 31, 2023 |
Performance. In considering the Fund’s performance, the Board noted that it reviews information about the Fund’s performance results at its regularly scheduled meetings. Among other data, the Board considered the Fund’s performance as compared to a broad-based index and against the performance of a group of peer funds provided by Broadridge, an independent third-party data provider (the “Peer Group”). The Board noted that while it found the data provided by the independent third-party generally useful, it recognized its limitations, including in particular that data may vary depending on the selected end date and that the results of the performance comparisons may vary depending on the selection of the Peer Group. The Board also noted differences in the investment strategies of the Fund relative to its Peer Group. The Board also received discount/premium information.
The Board also took into account management’s discussion of the performance of the Anfield ETF, including the quarterly written reports containing the Adviser’s and Sub-Adviser’s respective performance commentaries. The Board also noted that each of the Adviser and Sub-Adviser was actively monitoring the performance of the Fund.
With respect to the Anfield Universal Fixed Income ETF, the Board noted that Anfield is responsible for the day-to-day management of the Fund’s investment portfolio and considered, among other data, the performance of the Fund for the one-year, three-year, and since inception periods ended December 31, 2022 as compared to the Fund’s benchmark index, Peer Group, and Morningstar category. The Board considered that the Fund outperformed the median of its Peer Group and Morningstar category for the one-year period, outperformed the median of its Peer Group for the three-year period, performed equally to the median of its Morningstar category for the three-year period, performed equally to the median of its Peer Group for the since inception period, and underperformed the median of its Morningstar category for the since inception period. The Board also considered that the Fund underperformed the benchmark index for the one-year, three-year, and since inception periods. The Board took into account Regents Park’s discussion of the Fund’s performance, including relative to the benchmark and took into account the Fund’s outperformance in recent years, including for the three-year period, relative to the Peer Group and Morningstar category. The Board concluded that the Fund’s overall performance was satisfactory. and the Adviser and Sub -Adviser have shown the ability to manage the Fund in accordance with the strategies set forth in the prospectus.
Fees and Expenses. Regarding the costs of the services provided by the Adviser and Sub-Adviser, the Board considered, among other expense data, a comparison prepared by Broadridge of the Fund’s advisory fee and operating expenses compared to the advisory fee and expenses of the funds in its Peer Group and Morningstar category. The Board noted that while it found the data provided by the independent third-party generally useful, it recognized its limitations, including potential differences in the investment strategies of the Fund relative to its Peer Group, as well as the level, quality and nature of the services provided by the Adviser and Sub-Adviser with respect to the Fund. The Board also took into account the Adviser’s discussion with respect to the fees and expenses relating to the Fund.
The Board noted that, with respect to the Anfield Universal Fixed Income ETF, the Fund’s contractual advisory fee was above the median of the Peer Group and Morningstar category, but
35
| Anfield Universal Fixed Income ETF |
| ADDITIONAL INFORMATION (Unaudited) (Continued) |
| July 31, 2023 |
not the highest among the Peer Group or Morningstar category. The Board also noted that the Fund’s net total expenses were above the median of its Peer Group and Morningstar category. The Board took into account that the Adviser had agreed to reimburse expenses to limit net annual operating expenses to 1.50% of the Fund’s average net assets (exclusive of any taxes, interest, brokerage commissions, expenses incurred in connection with any merger or reorganization, indirect expenses, expenses of other investment companies in which the Fund may invest, or extraordinary expenses such as litigation) and that at present the Fund’s gross expenses were below its expense limitation.
With respect to the sub-advisory fees relating to the Fund, the Board considered that the Fund pays an advisory fee to the Adviser and that, in turn, the Adviser pays a portion of its advisory fee to the Sub-Adviser. The Board also took into account the amount of the advisory fee to be retained by Regents Park and the services to be provided with respect to the Fund by the Adviser and the Sub-Adviser. In considering the level of the Fund’s advisory and sub-advisory fee, the Board also took into account the fees charged by the Adviser and Sub-Adviser to other accounts managed with a similar investment strategy, if any, noting that differences were attributable to the differences in the management of these different kinds of accounts. The Board also noted any reimbursement of Fund expenses by the Sub-Adviser.
Based on the factors above, the Board concluded that the advisory fee and sub-advisory fee of the Fund was not unreasonable.
Profitability. The Board considered the profitability of each of Regents Park and Anfield and their respective affiliates with respect to the Fund, as applicable, and whether these profits were reasonable in light of the services provided to the Fund. The Board reviewed profitability analyses prepared by Regents Park and Anfield based on the Fund’s asset levels and considered the total profits of each of the Adviser and the Sub-Adviser, respectively, from its relationship with the Fund and in the aggregate with certain other funds managed by the Adviser in the Trust. The Board concluded that each of Regents Park and Anfield’s profitability, if any, from its respective relationship with the Fund, after taking into account a reasonable allocation of costs, was not excessive.
Economies of Scale. The Board considered whether any of Regents Park or Anfield would realize economies of scale with respect to the advisory or sub-advisory services provided to the Fund. The Board considered the profitability analyses provided by the Adviser and Sub-Adviser and noted that expenses of managing the Fund as a percentage of assets under management were expected to decrease as the Fund’s assets continue to grow. The Board noted that at current asset levels, economies of scale were not a relevant consideration and that it would revisit whether economies of scale exist in the future once the Fund had achieved sufficient size.
Other Benefits . The Board also considered the character and amount of other direct and incidental benefits to be received by each of Regents Park and Anfield from its respective relationship with the Fund. The Board noted that neither of Regents Park or Anfield believed it would receive any direct, indirect or ancillary material “fall-out” benefits from its relationship with the Fund, other than certain reputational benefits that may result from these relationships. The
36
| Anfield Universal Fixed Income ETF |
| ADDITIONAL INFORMATION (Unaudited) (Continued) |
| July 31, 2023 |
Board concluded that such benefits are reasonable.
Conclusion. The Board, having requested and received such information from each of Regents Park and Anfield as it believed reasonably necessary to evaluate the terms of the Advisory Agreement and Sub-Advisory Agreement with respect to the Fund and having been advised by independent counsel that it had appropriately considered and weighed all relevant factors, determined that approval of Advisory Agreement and Sub-Advisory Agreement with respect to the Fund for an additional one-year term was in the best interests of the Fund and its shareholders.
In considering the renewal of the Advisory Agreement and Sub-Advisory Agreement with respect to the Fund, the Board considered a variety of factors, including those discussed above, and also considered other factors (including conditions and trends prevailing generally in the economy, the securities markets, and the industry). The Board did not identify any one factor as determinative, and each Independent Trustee may have weighed each factor differently. The Board’s conclusions may be based in part on its consideration of the advisory arrangements in prior years and on the Board’s ongoing regular review of Fund performance and operations throughout the year.
37
| Anfield Universal Fixed Income ETF |
| EXPENSE EXAMPLES (Unaudited) |
| July 31, 2023 |
As a shareholder of the Fund, you incur two types of costs: (1) transaction costs for purchasing and selling shares, including brokerage commissions on purchases and sales of Fund shares (which are not reflected in the example below); and (2) ongoing costs, including management fees and other fund expenses. This example is intended to help you understand your ongoing costs (in dollars) of investing in the Fund and to compare these costs with the ongoing costs of investing in other mutual funds.
The Example is based on an investment of $1,000 invested at the beginning of the period and held for the entire period from February 1, 2023 to July 31, 2023 (the ’‘period’’).
Actual Expenses
The first line of the table below provides information about actual account values and actual expenses. You may use the information in this line, together with the amount you invested, to estimate the expenses that you paid over the period. Simply divide your account value by $1,000 (for example, an $8,600 account value divided by $1,000 = 8.6), then multiply the result by the number in the first line under the heading entitled ’‘Expenses Paid During the Period’’ to estimate the expenses you paid on your account during this period.
Hypothetical Example for Comparison Purposes
The second line of the table below provides information about hypothetical account values and hypothetical expenses based on the Fund’s actual expense ratio and an assumed rate of return of 5% per year before expenses, which is not the Fund’s actual return. The hypothetical account values and expenses may not be used to estimate the actual ending account balance or expenses you paid for the period. You may use this information to compare the ongoing costs of investing in the Fund and other funds. To do so, compare this 5% hypothetical example with the 5% hypothetical examples that appear in the shareholder reports of the other funds. Please note that the expenses shown in the table are meant to highlight your ongoing costs only and do not reflect any transactional costs, such as brokerage commissions on purchases or sales of Fund shares. Therefore, the second line of the table is useful in comparing ongoing costs only and will not help you determine the relative total costs of owning different funds. In addition, if these transactional costs were included, your costs would have been higher.
| Beginning | Ending | Expenses Paid | Expense Ratio | |
| Account Value | Account Value | During Period | During the Period | |
| Actual | 2/1/23 | 7/31/23 | 2/1/23-7/31/23* | 2/1/23-7/31/23 |
| $1,000.00 | $1,028.60 | $5.33 | 1.06% | |
| Beginning | Ending | Expenses Paid | Expense Ratio | |
| Hypothetical | Account Value | Account Value | During Period | During the Period |
| (5% return before expenses) | 2/1/23 | 7/31/23 | 2/1/23-7/31/23* | 2/1/23-7/31/23 |
| $1,000.00 | $1,019.54 | $5.31 | 1.06% |
| * | Expenses are equal to the average account value over the period, multiplied by the Fund’s annualized expense ratio, multiplied by the number of days in the period (181) divided by the number of days in the fiscal year (365). |
38
| Anfield Universal Fixed Income ETF |
| ADDITIONAL INFORMATION (Unaudited) |
| July 31, 2023 |
LIQUIDITY RISK MANAGEMENT PROGRAM
The Fund has adopted and implemented a written liquidity risk management program as required by Rule 22e-4 (the “Liquidity Rule”) under the 1940 Act. The program is reasonably designed to assess and manage the Fund’s liquidity risk, taking into consideration, among other factors, the Fund’s investment strategy and the liquidity of its portfolio investments during normal and reasonably foreseeable stressed conditions; its short and long-term cash flow projections; and its cash holdings and access to other funding sources.
During the year ended July 31, 2023, the Trust’s Liquidity Risk Management Program Committee (the “Committee”) reviewed the Fund’s investments and determined that the Fund held adequate levels of cash and highly liquid investments to meet shareholder redemption activities in accordance with applicable requirements. Accordingly, the Committee concluded that (i) the Fund’s liquidity risk management program is reasonably designed to prevent violations of the Liquidity Rule and (ii) the Fund’s liquidity risk management program has been effectively implemented.
39
| Anfield Universal Fixed Income ETF |
| SUPPLEMENTAL INFORMATION (Unaudited) |
| July 31, 2023 |
Trustees and Officers. The Trustees and officers of the Trust, together with information as to their principal business occupations during the past five years and other information, are shown below. Unless otherwise noted, the address of each Trustee and Officer is 225 Pictoria Drive, Suite 450, Cincinnati, OH 45246.
Independent Trustees *
| Name, Address, Year of Birth | Position(s) Held with Registrant | Term and Length Served | Principal Occupation(s) During Past 5 Years | Number of Portfolios Overseen In The Fund Complex** | Other Directorships Held During Past 5 Years |
| Mark Garbin Year of Birth: 1951 | Trustee | Indefinite, Since 2012 | Managing Principal, Coherent Capital Management LLC (since 2008), Independent Director, OCHEE LP (2021- present) | 7 | Northern Lights Fund Trust (since 2013); Northern Lights Variable Trust (since 2013); Forethought Variable Insurance Trust (since 2013); iDirect Private Markets Fund (since 2014); Carlyle Tactical Private Credit Fund (since March 2018) and OHA CLO Enhanced Equity II Genpar LLP (since 2021) |
| Mark D. Gersten Year of Birth: 1950 | Chairman, Trustee | Indefinite, Since 2012 | Independent Consultant (since 2012); Senior Vice President – Global Fund Administration Mutual Funds & Alternative Funds, AllianceBernstein LP (1985 – 2011) | 7 | Northern Lights Fund Trust (since 2013); Northern Lights Variable Trust (since 2013); iDirect Private Markets Fund (since 2014); previously, Ramius Archview Credit and Distressed Fund (2015-2017); and Schroder Global Series Trust (2012 to 2017) |
| Neil M. Kaufman Year of Birth: 1960 | Trustee, Audit Committee Chairman | Indefinite, Since 2012 | Managing Member, Kaufman McGowan PLLC (legal services)(Since 2016) | 7 | iDirect Private Markets Fund (since 2014) |
| Anita K. Krug Year of Birth: 1969 | Trustee | Indefinite, Since 2012 | Dean and Professor (since 2019) of Chicago-Kent College of Law, Illinois Institute of Technology; Interim Vice Chancellor for Academic Affairs (2018-2019) University of Washington Bothell; Interim Dean (2017- 2018), Professor (2016-2019), Associate Professor (2014-2016); and Assistant Professor (2010-2014), University of Washington School of Law | 7 | iDirect Private Markets Fund (since 2014); Centerstone Investors Trust (2016-2021) |
| * | Information as of July 31, 2023. |
| ** | As of July 31, 2023, the Trust was comprised of 26 active portfolios managed by eleven unaffiliated investment advisers and three affiliated investment advisers. The term “Fund Complex” applies only to those funds that (i) are advised by a common investment adviser or by an investment adviser that is an affiliated person of the investment adviser of any of the other funds in the Trust or (ii) hold themselves out to investors as related companies for purposes of investment and investor services. The Fund does not hold itself out as related to any other series within the Trust except for Anfield Diversified Alternatives ETF, Anfield Dynamic Fixed Income ETF, Anfield U.S. Equity Sector Rotation ETF and Regents Park Hedged Market Strategy ETF, each of which is advised by Regents and sub-advised by the Fund’s Sub-Adviser; Anfield Universal Fixed Income Fund, which is advised by the Fund’s Sub-Adviser; and Affinity World Leaders Equity ETF, which is advised by Regents. |
7/31/23 – Two Roads v2
40
Anfield Universal Fixed Income ETF |
| SUPPLEMENTAL INFORMATION (Unaudited)(Continued) |
| July 31, 2023 |
Officers of the Trust*
| Name, Address, Year of Birth | Position(s) Held with Registrant | Principal Occupation(s) During Past 5 Years | Number of Portfolios Overseen In The Fund Complex** | Other Directorships Held During Past 5 Years |
| James Colantino Year of Birth: 1969 | President Since Feb. 2017 Treasurer (2012 to 2017) | Senior Vice President (2012 – present); Vice President (2004 to 2012); Ultimus Fund Solutions LLC | N/A | N/A |
| Laura Szalyga Year of Birth: 1978 | Treasurer Since Feb. 2017 | Vice President, Ultimus Fund Solutions LLC (since 2015); Assistant Vice President, Ultimus Fund Solutions LLC (2011-2014) | N/A | N/A |
| Timothy Burdick Year of Birth: 1986 | Vice President Since Aug. 2022 Secretary Since Aug. 2022 | Vice President and Managing Counsel, Ultimus Fund Solutions, LLC (2022 – present); Assistant Vice President and Counsel, Ultimus Fund Solutions, LLC (2019 – 2022); Senior Program Compliance Manager, CJ Affiliate (2016 – 2019). | N/A | N/A |
| William B. Kimme Year of Birth: 1962 | Chief Compliance Officer Since Inception | Senior Compliance Officer, Northern Lights Compliance Services, LLC (September 2011 – present) | N/A | N/A |
| * | Information is as of July 31, 2023. |
| ** | As of July 31, 2023, the Trust was comprised of 26 active portfolios managed by eleven unaffiliated investment advisers and three affiliated investment advisers. The term “Fund Complex” applies only to those funds that (i) are advised by a common investment adviser or by an investment adviser that is an affiliated person of the investment adviser of any of the other funds in the Trust or (ii) hold themselves out to investors as related companies for purposes of investment and investor services. The Fund does not hold itself out as related to any other series within the Trust except for Anfield Diversified Alternatives ETF, Anfield Dynamic Fixed Income ETF, Anfield U.S. Equity Sector Rotation ETF and Regents Park Hedged Market Strategy ETF, each of which are advised by Regents and sub-advised by the Fund’s Sub-Adviser; Anfield Universal Fixed Income Fund, which is advised by the Fund’s Sub-Adviser; and Affinity World Leaders Equity ETF, which is advised by Regents. |
The Fund’s Statement of Additional Information (“SAI”) includes additional information about the Trustees and is available free of charge, upon request, by calling toll-free at 1-866-866-4848.
7/31/23 – Two Roads v2
41
PRIVACY NOTICE
| FACTS | WHAT DOES TWO ROADS SHARED TRUST DO WITH YOUR PERSONAL INFORMATION |
| Why? | Financial companies choose how they share your personal information. |
| Federal law gives consumers the right to limit some but not all sharing. | |
| Federal law also requires us to tell you how we collect, share, and protect your personal information. Please read this notice carefully to understand what we do. | |
| What? | THE TYPES OF PERSONAL INFORMATION WE COLLECT AND SHARE DEPENDS ON THE PRODUCT OR SERVICE THAT YOU HAVE WITH US. THIS INFORMATION CAN INCLUDE: |
| ● Social Security number and income | |
| ● Account transactions and transaction history | |
| ● Investment experience and purchase history | |
| When you are no longer our customer, we continue to share your information as described in this notice. | |
| How? | All financial companies need to share customers’ personal information to run their everyday business. In the section below, we list the reasons financial companies can share their customers’ personal information; the reason Two Roads Shared Trust chooses to share and whether you can limit this sharing. |
| Reasons we can share your personal information | Does Two Roads Shared Trust share? | Can you limit this sharing? |
| For our everyday business purposes – | ||
| such as to process your transactions, maintain your account(s), respond to court orders and legal investigations, or report to credit bureaus | YES | NO |
| For our marketing purposes – | NO | We do not share |
| to offer our products and services to you | ||
| For joint marketing with other financial companies | NO | We do not share |
| For our affiliates’ everyday business purposes – | NO | We do not share |
| information about your transactions and experiences | ||
| For our affiliates’ everyday business purposes – | NO | We do not share |
| information about your creditworthiness | ||
| For our affiliates to market to you | NO | We do not share |
| For nonaffiliates to market to you | NO | We do not share |
| Questions? | Call 1-631-490-4300 |
42
What we do
| How does Two Roads Shared Trust protect my personal information? | To protect your personal information from unauthorized access and use, we use security measures that comply with federal law. |
| Our service providers are held accountable for adhering to strict policies and procedures to prevent any misuse of your nonpublic personal information. | |
| How does Two Roads Shared Trust | We collect your personal information, for example, when you |
| collect my personal information? | |
| ● open an account or give us contact information | |
| ● provide account information or give us your income information | |
| ● make deposits or withdrawals from your account | |
| We also collect your personal information from other companies. | |
| Why can’t I limit all sharing? | Federal law gives you the right to limit only |
| ● sharing for affiliates’ everyday business purposes – information about your creditworthiness | |
| ● affiliates from using your information to market to you | |
| ● sharing for nonaffiliates to market to you | |
| State laws and individual companies may give you additional rights to limit sharing | |
| Definitions | |
| Affiliates | Companies related by common ownership or control. They can be financial and nonfinancial companies. |
| ● Two Roads Shared Trust has no affiliates. | |
| Nonaffiliates | Companies not related by common ownership or control. They can be financial and nonfinancial companies. |
| ● Two Roads Shared Trust does not share with nonaffiliates so they can market to you. | |
| Joint marketing | A formal agreement between nonaffiliates financial companies that together market financial products or services to you. |
| ● Two Roads Shared Trust does not jointly market. |
43
Proxy Voting Policy
Information regarding how the Fund votes proxies relating to portfolio securities for the twelve month period ended June 30 as well as a description of the policies and procedures that the Fund used to determine how to vote proxies is available without charge, upon request, by calling 1-866-866-4848 or by referring to the Securities and Exchange Commission’s (“SEC”) website at http://www.sec.gov.
Portfolio Holdings
The Fund files its complete schedule of portfolio holdings with the SEC for the first and third quarters of each fiscal year as an exhibit to its reports on Form N-PORT, within sixty days after the end of the period. Form N-PORT reports are available on the SEC’s website at http://www.sec.gov. The information on Form N-PORT is available without charge, upon request, by calling 1-866-866-4848.
| Adviser |
| Regents Park Funds, LLC |
| 4041 MacArthur Blvd., Suite 155 |
| Newport Beach, CA 92660 |
| Administrator |
| Ultimus Fund Solutions, LLC |
| 225 Pictoria Drive, Suite 450 |
| Cincinnati, OH 45246 |
This report and the financial statements contained herein are submitted for the general information of shareholders and are not authorized for distribution to prospective investors unless preceded or accompanied by an effective prospectus. Nothing contained herein may be considered an offer of sale or solicitation of an offer to buy shares of the Fund. Such offering is made only by prospectus, which contains information about the Fund’s investment objective, risks, fees and expenses. Investors are reminded to read the prospectus carefully before investing in the Fund.
AUE-AR23
(b) Not applicable
ITEM 2. CODE OF ETHICS.
| (a) | The registrant has, as of the end of the period covered by this report, adopted a code of ethics that applies to the registrant's principal executive officer, principal financial officer, and principal accounting officer or controller, or persons performing similar functions, regardless of whether these individuals are employed by the registrant or a third party. |
| (c) | During the period covered by this report, there were no amendments to any provision of the code of ethics. |
| (d) | During the period covered by this report, there were no waivers or implicit waivers of a provision of the code of ethics. |
ITEM 3. AUDIT COMMITTEE FINANCIAL EXPERT.
(a)(1) The registrant’s board of trustees has determined that Mark Gersten and Neil M. Kaufman are audit committee financial experts, as defined in Item 3 of Form N-CSR. Mr. Gersten and Mr. Kaufman are independent for purposes of this Item.
(a)(2) Not applicable.
(a)(3) Not applicable.
ITEM 4. PRINCIPAL ACCOUNTANT FEES AND SERVICES.
| (a) | Audit Fees. The aggregate fees billed for each of the last two fiscal years for professional services rendered by the registrant's principal accountant for the audit of the registrant's annual financial statements or services that are normally provided by the accountant in connection with statutory and regulatory filings or engagements for those fiscal year are as follows: |
| Trust Series | 2023 | 2022 |
| Anfield Universal Fixed Income ETF | $20,000 | $20,000 |
| (b) | Audit-Related Fees. There were no fees billed in each of the last two fiscal years for assurance and related services by the principal accountant that are reasonably related to the performance of the audit of the registrant’s financial statements and are not reported under paragraph (a) of this item. |
| (c) | Tax Fees. The aggregate fees billed in each of the last two fiscal years for professional services rendered by the principal accountant for tax compliance, tax advice, and tax planning are as follows: |
| Trust Series | 2023 | 2022 |
| Anfield Universal Fixed Income ETF | $4,400 | $4,400 |
| (d) | All Other Fees – The aggregate fees billed in each of the last two fiscal years for products and services provided by the registrant’s principal accountant, other than the services reported in paragraphs (a) through (c) of this item were $0 for the fiscal year ended July 31, 2023. |
| (e)(1) | The audit committee does not have pre-approval policies and procedures. Instead, the audit committee or audit committee chairman approves on a case-by-case basis each audit or non-audit service before the principal accountant is engaged by the registrant. |
| (e)(2) | There were no services described in each of paragraphs (b) through (d) of this Item that were approved by the audit committee pursuant to paragraph (c)(7)(i)(C) of Rule 2-01 of Regulation S-X. |
| (f) | Not applicable. The percentage of hours expended on the principal accountant's engagement to audit the registrant's financial statements for the most recent fiscal year that were attributed to work performed by persons other than the principal accountant's full-time, permanent employees was zero percent (0%). |
| (g) | All non-audit fees billed by the registrant's principal accountant for services rendered to the registrant for the fiscal years ended July 31, 2023 and 2022 are disclosed in (b)-(d) above. There were no audit or non-audit services performed by the registrant's principal accountant for the registrant's adviser. |
(h) Not applicable.
(i) Not applicable.
(j) Not applicable.
ITEM 5. AUDIT COMMITTEE OF LISTED REGISTRANTS.
The registrant is an issuer as defined in Rule 10A-3 under the Securities Exchange Act of 1934, as amended (the “Exchange Act”) and has a separately-designated standing audit committee established in
accordance with Section 3(a)(58)A of the Exchange Act. The registrant’s audit committee members are Mark Garbin, Mark Gersten, Neil M. Kaufman and Anita K. Krug.
ITEM 6. INVESTMENTS
Included in annual report to shareholders filed under Item 1 of this form.
ITEM 7. DISCLOSURE OF PROXY VOTING POLICIES AND PROCEDURES FOR CLOSED-END MANAGEMENT INVESTMENT COMPANIES.
Not applicable to open-end management investment companies.
ITEM 8. PORTFOLIO MANAGERS OF CLOSED-END MANAGEMENT INVESTMENT COMPANIES
Not applicable to open-end management investment companies.
ITEM 9. PURCHASES OF EQUITY SECURITIES BY CLOSED-END MANAGEMENT INVESTMENT COMPANY AND AFFILIATED PURCHASERS.
Not applicable to open-end management investment companies.
ITEM 10. SUBMISSION OF MATTERS TO A VOTE OF SECURITY HOLDERS.
Not applicable at this time.
ITEM 11. CONTROLS AND PROCEDURES.
(a) Based on an evaluation of the registrant's disclosure controls and procedures (as defined in Rule 30a-3(c) under the 1940 Act), as of a date within 90 days of the filing date of this Form N-CSR, the principal executive officer and principal financial officer of the registrant have concluded that the disclosure controls and procedures of the registrant are reasonably designed to ensure that the information required in filings on Form N-CSR is recorded, processed, summarized, and reported by the filing date, including that information required to be disclosed is accumulated and communicated to the registrant’s management, including the registrant’s principal executive officer and principal financial officer, as appropriate to allow timely decisions regarding required disclosure.
(b) There were no changes in the registrant’s internal control over financial reporting (as defined in Rule 30a(d) under the 1940 Act) that occurred during the period covered by this report that have materially affected, or are reasonably likely to materially affect, the registrant’s internal control over financial reporting.
ITEM 12. DISCLOSURE OF SECURITIES LENDING ACTIVITIES FOR CLOSED-END MANAGEMENT INVESTMENT COMPANIES.
Not applicable to open-end management investment companies.
ITEM 13. EXHIBITS
(a)(1) Code of Ethics for Principal Executive and Senior Financial Officers is attached hereto.
(a)(3) Not applicable.
(a)(4) Change in registrant’s independent public accountant is filed herewith
| (b) | Certifications required by Section 906 of the Sarbanes-Oxley Act of 2002 (and Item 13(b) of Form N-CSR) are filed herewith. |
SIGNATURES
Pursuant to the requirements of the Securities Exchange Act of 1934 and the Investment Company Act of 1940, the registrant has duly caused this report to be signed on its behalf by the undersigned, thereunto duly authorized.
Two Roads Shared Trust
| By James Colantino | /s/ James Colantino |
| Principal Executive Officer/President, | |
| Date: October 4, 2023 | |
Pursuant to the requirements of the Securities Exchange Act of 1934 and the Investment Company Act of 1940, this report has been signed below by the following person on behalf of the registrant and in the capacities and on the date indicated.
| By Laura Szalyga | /s/ Laura Szalyga |
| Principal Financial Officer/Treasurer | |
| Date: October 4, 2023 | |