united states
securities and exchange commission
washington, d.c. 20549
form n-csr
certified shareholder report of registered management
investment companies
Investment Company Act file number 811-22718
Two Roads Shared Trust
(Exact name of registrant as specified in charter)
225 Pictoria Drive, Suite 450 Cincinnati, OH 45246
(Address of principal executive offices) (Zip code)
The Corporation Trust Company
1209 Orange Street, Wilmington, DE 19801
(Name and address of agent for service)
Registrant's telephone number, including area code: 631-490-4300
Date of fiscal year end: 7/31
Date of reporting period: 1/31/24
Item 1. Reports to Shareholders.
(a) Include a copy of the report transmitted to stockholders pursuant to Rule 30e-1 under the Act (17 CFR 270.30e-1).

Tactical Dividend and Momentum Fund
| Class A | HTDAX |
| Class C | HTDCX |
| Class I | HTDIX |
| Class R | HTDRX |
Semi-Annual Report
January 31, 2024
www.HanlonFunds.com
1-844-828-3212
Distributed by Foreside Financial Services, LLC
Member FINRA
This report and the financial statements contained herein are submitted for the general information of shareholders and are not authorized for distribution to prospective investors unless preceded or accompanied by an effective prospectus. Nothing contained herein is to be considered an offer of sale or solicitation of an offer to buy shares of the Fund. Such offering is made only by a prospectus, which contains information about the Fund’s investment objective, risks, fees and expenses. Investors are reminded to read the Fund’s prospectus carefully before investing in the Fund.
Dear Fellow Shareholders,

Sean Hanlon, CFP®
Chairman, CEO and Co-Chief Investment Officer
We launched the Tactical Dividend and Momentum Fund (“TDM”, “the Fund”) with the goal of protecting our shareholders from large market drawdowns and providing positive, risk-adjusted returns; although there is no guarantee that we will meet these objectives. The Fund invests in the 11 major equity economic sectors, weighted up to their respective S&P 500 market capitalizations. Although there is no guarantee, this approach attempts to closely track the broader equity market during times when the market is steadily advancing. When a given sector displays relative weakness, we will attempt to reduce or eliminate exposure, while remaining in the other sectors. In extreme times, we may exit the markets completely and ride out the volatility in cash or short-term fixed income positions.
Thank you,

1
Commentary
Note: The following commentary pertains to the Fund’s semiannual reporting period from August 1, 2023, to January 31, 2024.
Equity markets began the Fund’s semiannual period (August 1, 2023 – Jan 31, 2024) on uneasy footing amidst uncertainty over the path of inflation and the possibility of further interest rate hikes from the Federal Reserve (the “Fed”). Those fears were somewhat resolved by the November 1st Federal Reserve Open Market Committee announcement, which hinted that rate hikes were likely complete. Since the Fed’s November announcement, markets have been locked in a steady uptrend that has propelled the S&P 500 to a new all-time high.
The ability of the market to maintain the momentum of the present uptrend will likely require an expansion of market breadth, meaning more evenly distributed returns among the underlying stocks. Market breadth was quite strong in November and December but has faded in early 2024 and once again most of the market gains have been attributable to price increases in shares of a handful of the largest market capitalization stocks, of which most are in the Technology sector.
With rate hikes complete, the debate among investors now centers on when the interest rate cuts will commence. Early in 2024, the market consensus was for a March interest rate cut but Fed Chair Jerome Powell pushed back against that expectation, and now the market is looking towards May-July while the Fed has suggested the second half of 2024 is more likely. The combination of inflation data showing steady progress towards the Fed’s 2% target and surprisingly strong GDP and jobs data has given the Fed confidence to hold rates at current levels and let the lagging effects of its rate hike campaign work through the economy. The biggest risk to this approach, in our opinion, would be to the regional banking sector, which holds considerable exposure to interest rate sensitive assets such as commercial real estate, and has enormous unrealized losses in fixed income portfolios.
Performance Update
The Tactical Dividend and Momentum Fund (“TDM”, the “Fund”) began the semiannual period (8/1/2023-1/31/2024) fully invested. During early August, a discretionary move to cash was made due to concerns over market risks associated with regional bank ratings downgrades and deteriorating market breadth. The Fund remained fully defensive until early September, at which point we re-entered all sectors at 1/3 their respective market capitalization weightings. The Fund moved back to fully defensive at the end of September as market conditions deteriorated and interest rates turned sharply higher, putting all tactical sector signals on a Sell. The Fund remained defensive until November 2nd, when we re-entered the Energy and Communication Services sectors, followed by Consumer Staples.
2
On November 14th, the Fund scaled up to 48% invested, and incrementally continued to scale into equity positions, reaching fully invested levels on December 15th.
For the semiannual period (8/1/2023-1/31/2024), the TDM Fund Class I shares returned 2.96%, underperforming the S&P 500 Index, which returned 6.43%. As of January 31, 2024, the Fund had the following weightings:
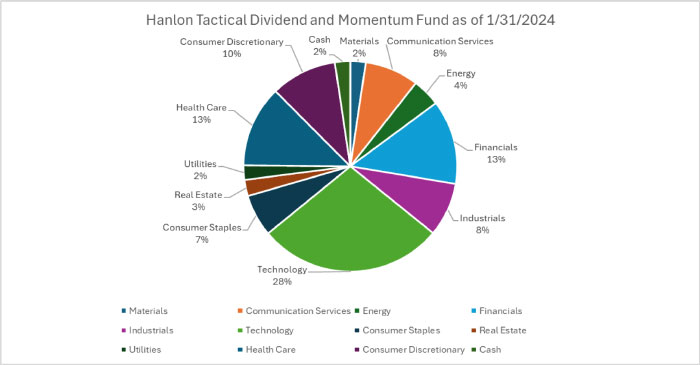
Insert 1
The views in this report are those of the Fund’s management. This report contains certain forward - looking statements about factors that may affect the performance of the Fund in the future. These statements are based on the Fund’s management’s predictions and expectations concerning certain future events such as the performance of the economy as a whole and of specific industry sectors. Management believes these forward-looking statements are reasonable, although they are inherently uncertain and difficult to predict.
3
TACTICAL DIVIDEND AND MOMENTUM FUND
PORTFOLIO REVIEW (Unaudited)
January 31, 2024
The Fund’s performance figures* for each period ended January 31, 2024, compared to its benchmark:
| Annualized | Annualized | |||
| Six Months | One Year | Five Year | Since Inception (a) | |
| Tactical Dividend and Momentum Fund - Class A | 2.85% | 9.79% | 5.29% | 3.47% |
| Tactical Dividend and Momentum Fund - Class A with load | (3.10)% | 3.50% | 4.06% | 2.74% |
| Tactical Dividend and Momentum Fund - Class C | 2.51% | 8.94% | 4.49% | 2.70% |
| Tactical Dividend and Momentum Fund - Class I | 2.96% | 10.18% | 5.54% | 3.69% |
| Tactical Dividend and Momentum Fund - Class R | 2.77% | 9.67% | 5.14% | 3.26% |
| S&P 500 Total Return Index (b) | 6.43% | 20.82% | 14.30% | 13.58% |
| * | The performance data quoted is historical. Past performance is no guarantee of future results. Current performance may be higher or lower than the performance data quoted. The principal value and investment return of an investment will fluctuate so that your shares, when redeemed, may be worth more or less than their original cost. For performance information current to the most recent month-end, please call 1-844-828-3212. The returns shown do not reflect the deduction of taxes that a shareholder would pay on Fund distributions or on the redemptions of Fund shares. Returns greater than 1 year are annualized. The total annual operating expenses as stated in the fee table of the Fund’s prospectus dated November 30, 2023 are 1.85%, 2.60%, 1.60% and 2.00% for Class A, Class C, Class I and Class R shares, respectively. Hanlon Investment Management, Inc. (the “Adviser”) has contractually agreed to reduce the Fund’s fees and/or absorb expenses of the Fund until at least November 30, 2024 to ensure that total annual Fund operating expenses (exclusive of any front-end or contingent deferred loads; brokerage fees and commissions; expenses of other investment companies in which the Fund may invest (“acquired fund fees and expenses”); borrowing costs, such as interest and dividend expense on securities sold short; taxes; and extraordinary expenses, such as litigation expenses) of the Fund do not exceed 1.70%, 2.45%, 1.45%, and 1.85% of average daily net assets attributable to Class A, Class C, Class I, and Class R shares, respectively. This agreement may be terminated with respect to the Fund by the Board of Trustees on 60 days’ written notice to the Adviser. These expense reimbursements are subject to possible recoupment from the Fund in future years on a rolling three-year basis (within three years after the fees have been waived or reimbursed) if such recoupment can be achieved without exceeding the foregoing expense limits as well as any expense limitation that was in effect at the time the waiver or reimbursement was made. Class A shares are subject to a maximum sales charge imposed on purchases of 5.75%. Class C shares are subject to a contingent deferred sales charge of 1.00% on redemptions made within one year of purchase. For investments in Class A shares of $1 million or more, there is a contingent deferred sales charge of 1.00% on redemptions made within one year of purchase. |
| (a) | Inception date is September 9, 2015. |
| (b) | The S&P 500 Total Return Index is an unmanaged free-float capitalization-weighted index which measures the performance of 500 large-cap common stocks actively traded in the United States. Unlike a mutual fund, an index does not reflect any trading costs or management fees. Investors cannot directly invest in an index. |
| Portfolio Composition as of January 31, 2024 | ||||
| Holdings By Investment Type | % of Net Assets | |||
| Exchange Traded Funds | 95.8 | % | ||
| Collateral For Securities Loaned | 3.7 | % | ||
| Money Market Fund | 2.3 | % | ||
| Common Stocks | 1.9 | % | ||
| Liabilities in Excess of Other Assets | (3.7 | )% | ||
| 100.0 | % | |||
Please refer to the Schedule of Investments in this semi-annual report for a detailed listing of the Fund’s holdings.
4
| TACTICAL DIVIDEND AND MOMENTUM FUND |
| SCHEDULE OF INVESTMENTS (Unaudited) |
| January 31, 2024 |
| Shares | Fair Value | |||||||
| COMMON STOCKS — 1.9% | ||||||||
| GAMING REITS - 1.9% | ||||||||
| 35,000 | Gaming and Leisure Properties, Inc. | $ | 1,597,750 | |||||
| TOTAL COMMON STOCKS (Cost $1,589,995) | 1,597,750 | |||||||
| EXCHANGE-TRADED FUNDS — 95.8% | ||||||||
| EQUITY - 95.8% | ||||||||
| 73,040 | Communication Services Select Sector SPDR Fund(a) | 5,542,275 | ||||||
| 38,916 | Consumer Discretionary Select Sector SPDR Fund | 6,651,523 | ||||||
| 76,283 | Consumer Staples Select Sector SPDR Fund(a) | 5,562,556 | ||||||
| 44,187 | Energy Select Sector SPDR Fund | 3,685,638 | ||||||
| 211,959 | Financial Select Sector SPDR Fund | 8,215,531 | ||||||
| 51,745 | Health Care Select Sector SPDR Fund(a) | 7,263,963 | ||||||
| 63,087 | Industrial Select Sector SPDR Fund(a) | 7,121,891 | ||||||
| 50,409 | Invesco S&P 500 Equal Weight Communication Services ETF | 1,504,205 | ||||||
| 42,730 | Invesco S&P 500 Equal Weight Consumer Discretionary ETF | 1,983,954 | ||||||
| 49,512 | Invesco S&P 500 Equal Weight Financials ETF(a) | 2,942,746 | ||||||
| 117,014 | Invesco S&P 500 Equal Weight Health Care ETF | 3,518,611 | ||||||
| 221,733 | Invesco S&P 500 Equal Weight Technology ETF | 7,250,669 | ||||||
| 24,418 | Materials Select Sector SPDR Fund | 2,007,404 | ||||||
| 14,547 | Real Estate Select Sector SPDR Fund | 554,677 | ||||||
| 85,825 | Technology Select Sector SPDR Fund | 16,965,886 | ||||||
| 31,334 | Utilities Select Sector SPDR Fund(a) | 1,925,474 | ||||||
| 82,697,003 | ||||||||
| TOTAL EXCHANGE-TRADED FUNDS (Cost $78,517,780) | 82,697,003 | |||||||
| SHORT-TERM INVESTMENTS — 6.0% | ||||||||
| COLLATERAL FOR SECURITIES LOANED - 3.7% | ||||||||
| 3,138,677 | Dreyfus Government Cash Management, Institutional Class, 5.15% (Cost $3,138,677)(b)(c) | 3,138,677 | ||||||
The accompanying notes are an integral part of these financial statements.
5
| TACTICAL DIVIDEND AND MOMENTUM FUND |
| SCHEDULE OF INVESTMENTS (Unaudited) (Continued) |
| January 31, 2024 |
| Shares | Fair Value | |||||||
| SHORT-TERM INVESTMENTS — 6.0% (Continued) | ||||||||
| MONEY MARKET FUND - 2.3% | ||||||||
| 2,016,229 | Morgan Stanley Institutional Liquidity Funds - Treasury Securities Portfolio, Institutional Class, 5.18% (Cost $2,016,229)(c) | $ | 2,016,229 | |||||
| TOTAL SHORT-TERM INVESTMENTS (Cost $5,154,906) | 5,154,906 | |||||||
| TOTAL INVESTMENTS - 103.7% (Cost $85,262,681) | $ | 89,449,659 | ||||||
| LIABILITIES IN EXCESS OF OTHER ASSETS - (3.7)% | (3,169,617 | ) | ||||||
| NET ASSETS - 100.0% | $ | 86,280,042 | ||||||
| ETF | - Exchange-Traded Fund |
| REIT | - Real Estate Investment Trust |
| SPDR | - Standard & Poor’s Depositary Receipt |
| (a) | All or a portion of the security is on loan. The total fair value of the securities on loan as of January 31, 2024 was $16,671,957. |
| (b) | Security was purchased with cash received as collateral for securities on loan at January 31, 2024. Total collateral had a value of $3,138,677 at January 31, 2024. Additional non-cash collateral received from the borrower not disclosed in the Schedule of Investments had a value of $14,095,766. |
| (c) | Rate disclosed is the seven day effective yield as of January 31, 2024. |
The accompanying notes are an integral part of these financial statements.
6
| TACTICAL DIVIDEND AND MOMENTUM FUND |
| STATEMENT OF ASSETS AND LIABILITIES (Unaudited) |
| January 31, 2024 |
| Assets | ||||
| Investment securities | ||||
| At cost | $ | 85,262,681 | ||
| At value* | $ | 89,449,659 | ||
| Receivable for fund shares sold | 69,619 | |||
| Dividends and interest receivable | 3,234 | |||
| Prepaid expenses and other assets | 30,412 | |||
| Total Assets | 89,552,924 | |||
| Liabilities | ||||
| Collateral on securities loaned | 3,138,677 | |||
| Accrued advisory fees | 66,720 | |||
| Payable to Related Parties | 21,676 | |||
| Distribution (12b-1) fees payable | 6,617 | |||
| Payable for fund shares redeemed | 92 | |||
| Other accrued expenses | 39,100 | |||
| Total Liabilities | 3,272,882 | |||
| Net Assets | $ | 86,280,042 | ||
| Composition of Net Assets: | ||||
| Paid-in capital | $ | 93,349,358 | ||
| Accumulated losses | (7,069,316 | ) | ||
| Net Assets | $ | 86,280,042 | ||
| Net Asset Value Per Share | ||||
| Class A | ||||
| Net Assets | $ | 5,724,789 | ||
| Shares outstanding ($0 par value, unlimited shares authorized) | 503,990 | |||
| Net asset value (Net Assets / Shares Outstanding) and redemption price per share | $ | 11.36 | ||
| Maximum offering price per share (maximum sales charge of 5.75%)(a) | $ | 12.05 | ||
| Class C | ||||
| Net Assets | $ | 247,690 | ||
| Shares outstanding ($0 par value, unlimited shares authorized) | 23,231 | |||
| Net asset value (Net Assets / Shares Outstanding) and redemption price per share (b) | $ | 10.66 | ||
| Class I | ||||
| Net Assets | $ | 64,970,734 | ||
| Shares outstanding ($0 par value, unlimited shares authorized) | 5,769,081 | |||
| Net asset value (Net Assets / Shares Outstanding) and redemption price per share | $ | 11.26 | ||
| Class R | ||||
| Net Assets | $ | 15,336,829 | ||
| Shares outstanding ($0 par value, unlimited shares authorized) | 1,381,229 | |||
| Net asset value (Net Assets / Shares Outstanding) and redemption price per share | $ | 11.10 | ||
| * | Includes fair value of securities loaned $16,671,957. |
| (a) | For investments in Class A shares of $1 million or more, there is a deferred sales charge of 1.00% of the original purchase price on redemptions made within one year. |
| (b) | Class C shares sold within one year of purchase are subject to a contingent deferred sales charge of 1.00% of the original purchase price. |
The accompanying notes are an integral part of these financial statements.
7
| TACTICAL DIVIDEND AND MOMENTUM FUND |
| STATEMENTS OF OPERATIONS (Unaudited) |
| For the Six Months Ended January 31, 2024 |
| Investment Income | ||||
| Dividend income | $ | 493,293 | ||
| Interest income | 1,406,088 | |||
| Income from securities loaned | 7,688 | |||
| Total Investment Income | 1,907,069 | |||
| Expenses | ||||
| Investment advisor fees | 483,177 | |||
| Distribution (12b-1) fees: | ||||
| Class A | 7,897 | |||
| Class C | 1,186 | |||
| Class R | 30,411 | |||
| Administration fees | 51,115 | |||
| Third party administrative service fees | 48,318 | |||
| Registration and filing fees | 30,079 | |||
| Transfer agent fees | 28,048 | |||
| Fund accounting fees | 24,011 | |||
| Legal fees | 13,990 | |||
| Compliance officer fees | 12,066 | |||
| Audit fees | 8,548 | |||
| Custody fees | 7,541 | |||
| Trustees’ fees | 7,541 | |||
| Printing expense | 6,339 | |||
| Insurance expense | 3,345 | |||
| Other expenses | 2,568 | |||
| Total Expenses | 766,180 | |||
| Less: Fees waived/expenses reimbursed by the Adviser | (26,895 | ) | ||
| Net Expenses | 739,285 | |||
| Net Investment Income | 1,167,784 | |||
| Net Realized and Unrealized Gain (Loss) on Investments | ||||
| Net Realized Gain: | ||||
| Investments | 5,892,979 | |||
| Net Change in Unrealized Depreciation: | ||||
| Investments | (4,864,848 | ) | ||
| Net Realized and Unrealized Gain on Investments | 1,028,131 | |||
| Net Increase in Net Assets Resulting From Operations | $ | 2,195,915 | ||
The accompanying notes are an integral part of these financial statements.
8
| TACTICAL DIVIDEND AND MOMENTUM FUND |
| STATEMENTS OF CHANGES IN NET ASSETS |
| Six Months Ended | ||||||||
| January 31, 2024 | Year Ended | |||||||
| (Unaudited) | July 31, 2023 | |||||||
| Operations | ||||||||
| Net investment income | $ | 1,167,784 | $ | 1,149,475 | ||||
| Net realized gain (loss) from investment transactions | 5,892,979 | (11,830,935 | ) | |||||
| Net change in unrealized appreciation (depreciation) on investment transactions | (4,864,848 | ) | 9,051,826 | |||||
| Net increase (decrease) in net assets resulting from operations | 2,195,915 | (1,629,634 | ) | |||||
| Distributions to Shareholders | ||||||||
| Distributions paid: | ||||||||
| Class A | (102,816 | ) | — | |||||
| Class C | (2,535 | ) | — | |||||
| Class I | (1,299,605 | ) | — | |||||
| Class R | (231,558 | ) | — | |||||
| Net Decrease in Net Assets from Distributions to Shareholders | (1,636,514 | ) | — | |||||
| Shares of Beneficial Interest | ||||||||
| Proceeds from shares sold: | ||||||||
| Class A | 98,183 | 478,295 | ||||||
| Class C | 3,160 | 1,320 | ||||||
| Class I | 1,768,052 | 8,534,740 | ||||||
| Class R | 1,069,045 | 1,740,424 | ||||||
| Reinvestment of distributions: | ||||||||
| Class A | 101,945 | — | ||||||
| Class C | 2,270 | — | ||||||
| Class I | 80,441 | — | ||||||
| Class R | 231,558 | — | ||||||
| Cost of shares redeemed: | ||||||||
| Class A | (1,210,488 | ) | (940,316 | ) | ||||
| Class C | (100 | ) | (68,302 | ) | ||||
| Class I | (22,383,178 | ) | (22,581,388 | ) | ||||
| Class R | (1,777,662 | ) | (4,862,113 | ) | ||||
| Net Decrease in Net Assets Resulting From Beneficial Interest Transactions | (22,016,774 | ) | (17,697,340 | ) | ||||
| Total Decrease in Net Assets | $ | (21,457,373 | ) | $ | (19,326,974 | ) | ||
The accompanying notes are an integral part of these financial statements.
9
| TACTICAL DIVIDEND AND MOMENTUM FUND |
| STATEMENTS OF CHANGES IN NET ASSETS (Continued) |
| Six Months Ended | ||||||||
| January 31, 2024 | Year Ended | |||||||
| (Unaudited) | July 31, 2023 | |||||||
| Net Assets | ||||||||
| Beginning of period | $ | 107,737,415 | $ | 127,064,389 | ||||
| End of period | $ | 86,280,042 | $ | 107,737,415 | ||||
| Share Activity: | ||||||||
| Class A | ||||||||
| Shares Sold | 8,853 | 44,518 | ||||||
| Shares Reinvested | 9,192 | — | ||||||
| Shares Redeemed | (109,258 | ) | (88,522 | ) | ||||
| Net Decrease in Total Shares Outstanding | (91,213 | ) | (44,004 | ) | ||||
| Class C | ||||||||
| Shares Sold | 298 | 132 | ||||||
| Shares Reinvested | 218 | — | ||||||
| Shares Redeemed | (10 | ) | (6,869 | ) | ||||
| Net Increase (Decrease) in Total Shares Outstanding | 506 | (6,737 | ) | |||||
| Class I | ||||||||
| Shares Sold | 161,216 | 818,992 | ||||||
| Shares Reinvested | 7,313 | — | ||||||
| Shares Redeemed | (2,040,030 | ) | (2,146,177 | ) | ||||
| Net Decrease in Total Shares Outstanding | (1,871,501 | ) | (1,327,185 | ) | ||||
| Class R | ||||||||
| Shares Sold | 99,661 | 169,000 | ||||||
| Shares Reinvested | 21,342 | — | ||||||
| Shares Redeemed | (165,656 | ) | (465,962 | ) | ||||
| Net Decrease in Total Shares Outstanding | (44,653 | ) | (296,962 | ) | ||||
The accompanying notes are an integral part of these financial statements.
10
| Tactical Dividend And Momentum Fund – Class A |
| Financial Highlights |
| (For Per Share Data and Ratios for a Share of Beneficial Interest Outstanding Throughout Each Period Presented) |
| Six Months | ||||||||||||||||||||||||
| Ended | Year | Year | Year | Year | Year | |||||||||||||||||||
| January 31, | Ended | Ended | Ended | Ended | Ended | |||||||||||||||||||
| 2024 | July 31, | July 31, | July 31, | July 31, | July 31, | |||||||||||||||||||
| (Unaudited) | 2023 | 2022 | 2021 | 2020 | 2019 | |||||||||||||||||||
| Selected Per Share Data: | ||||||||||||||||||||||||
| Net asset value, beginning of period | $ | 11.23 | $ | 11.31 | $ | 13.57 | $ | 10.54 | $ | 10.87 | $ | 11.15 | ||||||||||||
| Investment operations: | ||||||||||||||||||||||||
| Net investment income (loss) (a) | 0.12 | 0.09 | (0.09 | ) | (0.04 | ) | (0.01 | ) (b) | 0.02 | |||||||||||||||
| Net realized and unrealized gain (loss) on investments | 0.20 | (0.17 | ) | (0.48 | ) | 3.07 | (0.27 | ) | (0.30 | ) | ||||||||||||||
| Total from investment operations | 0.32 | (0.08 | ) | (0.57 | ) | 3.03 | (0.28 | ) | (0.28 | ) | ||||||||||||||
| Less distributions to shareholders from: | ||||||||||||||||||||||||
| Net investment income | (0.19 | ) | — | — | — | (0.04 | ) | — | (c) | |||||||||||||||
| Net realized gains | — | — | (1.69 | ) | — | — | — | |||||||||||||||||
| Return of capital | — | — | — | — | (0.01 | ) | — | (c) | ||||||||||||||||
| Total distributions | (0.19 | ) | — | (1.69 | ) | — | (0.05 | ) | — | (c) | ||||||||||||||
| Net asset value, end of period | $ | 11.36 | $ | 11.23 | $ | 11.31 | $ | 13.57 | $ | 10.54 | $ | 10.87 | ||||||||||||
| Total Return (d) | 2.85 | % (h) | (0.71 | )% | (4.89 | )% (e) | 28.75 | % (e) | (2.63 | )% | (2.48 | )% | ||||||||||||
| Ratios and Supplemental Data: | ||||||||||||||||||||||||
| Net assets, end of period (000 omitted) | $ | 5,725 | $ | 6,682 | $ | 7,229 | $ | 6,928 | $ | 8,669 | $ | 12,038 | ||||||||||||
| Ratio of expenses to: | ||||||||||||||||||||||||
| average net assets, before reimbursement(f) | 1.76 | % (i) | 1.70 | % | 1.56 | % | 1.68 | % | 1.66 | % | 1.64 | % | ||||||||||||
| average net assets, net of reimbursement(f) | 1.70 | % (i) | 1.70 | % | 1.56 | % | 1.68 | % | 1.66 | % | 1.64 | % | ||||||||||||
| Ratio of net investment income (loss) to average net assets (f),(g) | 2.24 | % (i) | 0.86 | % | (0.72 | )% | (0.30 | )% | (0.11 | )% | 0.14 | % | ||||||||||||
| Portfolio turnover rate | 244 | % (h) | 385 | % | 406 | % | 64 | % | 293 | % | 226 | % | ||||||||||||
| (a) | Per share amounts are calculated using the average shares method, which appropriately presents the per share data for the year. |
| (b) | The amount of net investment loss on investment per share for the period ended does not accord with the amounts in the Statements of Operations due to the timing of purchases and sales of Fund shares in relation to fluctuating market values. |
| (c) | Rounds to less than $0.005 per share. |
| (d) | Total returns are historical in nature and assume changes in share price, reinvestment of dividends and capital gains distributions, if any. |
| (e) | Includes adjustments in accordance with accounting principles generally accepted in the United States and, consequently, the net asset value for financial reporting purposes and the returns based upon those net asset values may differ from the net asset values and returns for shareholder transactions. |
| (f) | The ratios of expenses and net investment income/(loss) to average net assets do not reflect the Fund’s proportionate share of expenses of underlying investment companies in which the Fund invests. |
| (g) | Recognition of net investment income (loss) by the Fund is affected by the timing and declaration of dividends by the underlying investment companies in which the Fund invests. |
| (h) | Not annualized. |
| (i) | Annualized. |
The accompanying notes are an integral part of these financial statements.
11
| Tactical Dividend And Momentum Fund – Class C |
| Financial Highlights |
| (For Per Share Data and Ratios for a Share of Beneficial Interest Outstanding Throughout Each Period Presented) |
| Six Months | ||||||||||||||||||||||||
| Ended | Year | Year | Year | Year | Year | |||||||||||||||||||
| January 31, | Ended | Ended | Ended | Ended | Ended | |||||||||||||||||||
| 2024 | July 31, | July 31, | July 31, | July 31, | July 31, | |||||||||||||||||||
| (Unaudited) | 2023 | 2022 | 2021 | 2020 | 2019 | |||||||||||||||||||
| Selected Per Share Data: | ||||||||||||||||||||||||
| Net asset value, beginning of period | $ | 10.51 | $ | 10.67 | $ | 12.99 | $ | 10.17 | $ | 10.53 | $ | 10.87 | ||||||||||||
| Investment operations: | ||||||||||||||||||||||||
| Net investment income (loss) (a) | 0.07 | 0.01 | (0.18 | ) | (0.12 | ) | (0.09 | ) (b) | (0.07 | ) (b) | ||||||||||||||
| Net realized and unrealized gain (loss) on investments | 0.19 | (0.17 | ) | (0.45 | ) | 2.94 | (0.27 | ) | (0.27 | ) | ||||||||||||||
| Total from investment operations | 0.26 | (0.16 | ) | (0.63 | ) | 2.82 | (0.36 | ) | (0.34 | ) | ||||||||||||||
| Less distributions to shareholders from: | ||||||||||||||||||||||||
| Net investment income | (0.11 | ) | — | — | — | — | — | |||||||||||||||||
| Net realized gains | — | — | (1.69 | ) | — | — | — | |||||||||||||||||
| Total distributions | (0.11 | ) | — | (1.69 | ) | — | — | — | ||||||||||||||||
| Net asset value, end of period | $ | 10.66 | $ | 10.51 | $ | 10.67 | $ | 12.99 | $ | 10.17 | $ | 10.53 | ||||||||||||
| Total Return (c) | 2.51 | % (g) | (1.50 | )% | (5.62 | )% (d) | 27.73 | % (d) | (3.42 | )% | (3.13 | )% | ||||||||||||
| Ratios and Supplemental Data: | ||||||||||||||||||||||||
| Net assets, end of period (000 omitted) | $ | 248 | $ | 239 | $ | 314 | $ | 345 | $ | 1,087 | $ | 1,529 | ||||||||||||
| Ratio of expenses to: | ||||||||||||||||||||||||
| average net assets, before reimbursement (e) | 2.51 | % (h) | 2.45 | % | 2.32 | % | 2.43 | % | 2.41 | % | 2.39 | % | ||||||||||||
| average net assets, net of reimbursement (e) | 2.45 | % (h) | 2.45 | % | 2.32 | % | 2.43 | % | 2.41 | % | 2.39 | % | ||||||||||||
| Ratio of net investment income (loss) to average net assets (e)(f) | 1.41 | % (h) | 0.14 | % | (1.52 | )% | (1.05 | )% | (0.88 | )% | (0.64 | )% (b) | ||||||||||||
| Portfolio turnover rate | 244 | % (g) | 385 | % | 406 | % | 64 | % | 293 | % | 226 | % | ||||||||||||
| (a) | Per share amounts are calculated using the average shares method, which appropriately presents the per share data for the year. |
| (b) | The amount of net investment loss on investment per share for the period ended does not accord with the amounts in the Statements of Operations due to the timing of purchases and sales of Fund shares in relation to fluctuating market values. |
| (c) | Total returns are historical in nature and assume changes in share price, reinvestment of dividends and capital gains distributions, if any. |
| (d) | Includes adjustments in accordance with accounting principles generally accepted in the United States and, consequently, the net asset value for financial reporting purposes and the returns based upon those net asset values may differ from the net asset values and returns for shareholder transactions. |
| (e) | The ratios of expenses and net investment income/(loss) to average net assets do not reflect the Fund’s proportionate share of expenses of underlying investment companies in which the Fund invests. |
| (f) | Recognition of net investment income (loss) by the Fund is affected by the timing and declaration of dividends by the underlying investment companies in which the Fund invests. |
| (g) | Not annualized. |
| (h) | Annualized. |
The accompanying notes are an integral part of these financial statements.
12
| Tactical Dividend And Momentum Fund – Class I |
| Financial Highlights |
| (For Per Share Data and Ratios for a Share of Beneficial Interest Outstanding Throughout Each Period Presented) |
| Six Months | ||||||||||||||||||||||||
| Ended | Year | Year | Year | Year | Year | |||||||||||||||||||
| January 31, | Ended | Ended | Ended | Ended | Ended | |||||||||||||||||||
| 2024 | July 31, | July 31, | July 31, | July 31, | July 31, | |||||||||||||||||||
| (Unaudited) | 2023 | 2022 | 2021 | 2020 | 2019 | |||||||||||||||||||
| Selected Per Share Data: | ||||||||||||||||||||||||
| Net asset value, beginning of period | $ | 11.15 | $ | 11.20 | $ | 13.43 | $ | 10.40 | $ | 10.74 | $ | 11.02 | ||||||||||||
| Investment operations: | ||||||||||||||||||||||||
| Net investment income (loss) (a) | 0.14 | 0.12 | (0.07 | ) | — | (b) | 0.01 | 0.04 | ||||||||||||||||
| Net realized and unrealized gain (loss) on investments | 0.19 | (0.17 | ) | (0.47 | ) | 3.03 | (0.27 | ) | (0.28 | ) | ||||||||||||||
| Total from investment operations | 0.33 | (0.05 | ) | (0.54 | ) | 3.03 | (0.26 | ) | (0.24 | ) | ||||||||||||||
| Less distributions to shareholders from: | ||||||||||||||||||||||||
| Net investment income | (0.22 | ) | — | — | — | (0.07 | ) | (0.04 | ) | |||||||||||||||
| Net realized gains | — | — | (1.69 | ) | — | — | — | |||||||||||||||||
| Return of capital | — | — | — | — | (0.01 | ) | — | (b) | ||||||||||||||||
| Total distributions | (0.22 | ) | — | (1.69 | ) | — | (0.08 | ) | (0.04 | ) | ||||||||||||||
| Net asset value, end of period | $ | 11.26 | $ | 11.15 | $ | 11.20 | $ | 13.43 | $ | 10.40 | $ | 10.74 | ||||||||||||
| Total Return (c) | 2.96 | % (f) | (0.45 | )% | (4.70 | )% | 29.13 | % | (2.50 | )% | (2.18 | )% | ||||||||||||
| Ratios and Supplemental Data: | ||||||||||||||||||||||||
| Net assets, end of period (000 omitted) | $ | 64,971 | $ | 85,173 | $ | 100,451 | $ | 64,338 | $ | 75,871 | $ | 92,978 | ||||||||||||
| Ratio of expenses to: | ||||||||||||||||||||||||
| average net assets, before reimbursement (d) | 1.51 | % (g) | 1.45 | % | 1.40 | % | 1.43 | % | 1.41 | % | 1.39 | % | ||||||||||||
| average net assets, net of reimbursement (d) | 1.45 | % (g) | 1.45 | % | 1.40 | % | 1.43 | % | 1.41 | % | 1.39 | % | ||||||||||||
| Ratio of net investment income (loss) to average net assets (d)(e) | 2.52 | % (g) | 1.11 | % | (0.56 | )% | (0.03 | )% | 0.13 | % | 0.38 | % | ||||||||||||
| Portfolio turnover rate | 244 | % (f) | 385 | % | 406 | % | 64 | % | 293 | % | 226 | % | ||||||||||||
| (a) | Per share amounts are calculated using the average shares method, which appropriately presents the per share data for the year. |
| (b) | Rounds to less than $0.005 per share. |
| (c) | Total returns are historical in nature and assume changes in share price, reinvestment of dividends and capital gains distributions, if any. |
| (d) | The ratios of expenses and net investment income/(loss) to average net assets do not reflect the Fund’s proportionate share of expenses of underlying investment companies in which the Fund invests. |
| (e) | Recognition of net investment income (loss) by the Fund is affected by the timing and declaration of dividends by the underlying investment companies in which the Fund invests. |
| (f) | Not annualized. |
| (g) | Annualized. |
The accompanying notes are an integral part of these financial statements.
13
| Tactical Dividend And Momentum Fund – Class R |
| Financial Highlights |
| (For Per Share Data and Ratios for a Share of Beneficial Interest Outstanding Throughout Each Period Presented) |
| Six Months | ||||||||||||||||||||||||
| Ended | Year | Year | Year | Year | Year | |||||||||||||||||||
| January 31, | Ended | Ended | Ended | Ended | Ended | |||||||||||||||||||
| 2024 | July 31, | July 31, | July 31, | July 31, | July 31, | |||||||||||||||||||
| (Unaudited) | 2023 | 2022 | 2021 | 2020 | 2019 | |||||||||||||||||||
| Selected Per Share Data: | ||||||||||||||||||||||||
| Net asset value, beginning of period | $ | 10.97 | $ | 11.07 | $ | 13.33 | $ | 10.37 | $ | 10.70 | $ | 10.98 | ||||||||||||
| Investment operations: | ||||||||||||||||||||||||
| Net investment income (loss) (a) | 0.11 | 0.07 | (0.11 | ) | (0.05 | ) | (0.03 | ) (b) | — | (c) | ||||||||||||||
| Net realized and unrealized gain (loss) on investments | 0.19 | (0.17 | ) | (0.46 | ) | 3.01 | (0.27 | ) | (0.28 | ) | ||||||||||||||
| Total from investment operations | 0.30 | (0.10 | ) | (0.57 | ) | 2.96 | (0.30 | ) | (0.28 | ) | ||||||||||||||
| Less distributions to shareholders from: | ||||||||||||||||||||||||
| Net investment income | (0.17 | ) | — | — | — | (0.02 | ) | — | ||||||||||||||||
| Net realized gains | — | — | (1.69 | ) | — | — | — | |||||||||||||||||
| Return of capital | — | — | — | — | (0.01 | ) | — | |||||||||||||||||
| Total distributions | (0.17 | ) | — | (1.69 | ) | — | (0.03 | ) | — | |||||||||||||||
| Net asset value, end of period | $ | 11.10 | $ | 10.97 | $ | 11.07 | $ | 13.33 | $ | 10.37 | $ | 10.70 | ||||||||||||
| Total Return (d) | 2.77 | % (g) | (0.90 | )% | (4.98 | )% | 28.54 | % | (2.81 | )% | (2.55 | )% | ||||||||||||
| Ratios and Supplemental Data: | ||||||||||||||||||||||||
| Net assets, end of period (000 omitted) | $ | 15,337 | $ | 15,643 | $ | 19,070 | $ | 16,898 | $ | 16,931 | $ | 22,998 | ||||||||||||
| Ratio of expenses to: | ||||||||||||||||||||||||
| average net assets, before reimbursement (e) | 1.91 | % (h) | 1.85 | % | 1.72 | % | 1.83 | % | 1.81 | % | 1.79 | % | ||||||||||||
| average net assets, net of reimbursement (e) | 1.85 | % (h) | 1.85 | % | 1.72 | % | 1.83 | % | 1.81 | % | 1.79 | % | ||||||||||||
| Ratio of net investment income (loss) to average net assets (e)(f) | 2.03 | % (h) | 0.70 | % | (0.90 | )% | (0.43 | )% | (0.26 | )% (b) | (0.01 | )% | ||||||||||||
| Portfolio turnover rate | 244 | % (g) | 385 | % | 406 | % | 64 | % | 293 | % | 226 | % | ||||||||||||
| (a) | Per share amounts are calculated using the average shares method, which appropriately presents the per share data for the year. |
| (b) | The amount of net investment loss on investment per share for the period ended does not accord with the amounts in the Statements of Operations due to the timing of purchases and sales of Fund shares in relation to fluctuating market values. |
| (c) | Rounds to less than $0.005 per share. |
| (d) | Total returns are historical in nature and assume changes in share price, reinvestment of dividends and capital gains distributions, if any. |
| (e) | The ratios of expenses and net investment income/(loss) to average net assets do not reflect the Fund’s proportionate share of expenses of underlying investment companies in which the Fund invests. |
| (f) | Recognition of net investment income (loss) by the Fund is affected by the timing and declaration of dividends by the underlying investment companies in which the Fund invests. |
| (g) | Not annualized. |
| (h) | Annualized. |
The accompanying notes are an integral part of these financial statements.
14
| TACTICAL DIVIDEND AND MOMENTUM FUND |
| NOTES TO FINANCIAL STATEMENTS (Unaudited) |
| January 31, 2024 |
| 1. | ORGANIZATION |
The Tactical Dividend and Momentum Fund (formerly, Hanlon Tactical Dividend and Momentum Fund) (the “Fund”) is a series of shares of beneficial interest of the Two Roads Shared Trust (the “Trust”), a statutory trust organized under the laws of the State of Delaware on June 8, 2012, and registered under the Investment Company Act of 1940, as amended (the “1940 Act”), as an open-end management investment company. The Fund commenced operations on September 9, 2015. The investment objective of the Fund is to provide capital appreciation and current income, and the Fund is diversified. The Tactical Dividend and Momentum Fund is a “fund of funds”, in that the Fund will generally invest in other investment companies.
The Fund offers Class A, Class C, Class I and Class R shares. Class A shares of the Fund are offered at net asset value plus a maximum sales charge of 5.75%. Class C, Class I and Class R shares of the Fund are offered at net asset value. There is a 1.00% contingent deferred sales charge (“CDSC”) on Class A shares for investments of $1 million or more on shares sold within 1-year of purchase, unless you are otherwise eligible to purchase Class A shares without an initial sales charge or are eligible for a waiver of the CDSC. Class C shares of the Fund are subject to a contingent deferred sales charge of 1.00% of the original purchase price on redemptions made within one year of purchase. Each share class represents an interest in the same assets of the Fund and classes are identical except for differences in their fees and ongoing service and distribution charges. All classes of shares have equal voting privileges except that each class has exclusive voting rights with respect to its service and/or distribution plans. The Fund’s income, expenses (other than class specific distribution fees) and realized and unrealized gains and losses are allocated proportionately each day based upon the relative net assets of each class.
| 2. | SUMMARY OF SIGNIFICANT ACCOUNTING POLICIES |
The following is a summary of significant accounting policies followed by the Fund in preparation of its financial statements. These policies are in conformity with accounting principles generally accepted in the United States of America (“GAAP”). The preparation of financial statements in conformity with GAAP requires management to make estimates and assumptions that affect the reported amounts of assets and liabilities and disclosure of contingent assets and liabilities at the date of the financial statements and the reported amounts of increases and decreases in net assets from operations during the reporting period. Actual results could differ from those estimates. The Fund is an investment company and accordingly follows the investment company accounting and reporting guidance of the Financial Accounting Standards Board (“FASB”) Accounting Standards Codification Topic 946 “Financial Services – Investment Companies”.
Securities Valuation – Securities listed on an exchange are valued at the last quoted sale price at the close of the regular trading session of the primary exchange on the business day the value is being determined or, in the case of securities listed on NASDAQ, at the NASDAQ Official Closing Price (“NOCP”). In the absence of a sale, such securities shall be valued at the mean between the current bid and ask prices on the day of valuation. Futures and future options are valued at the final settled price or, in the absence of a settled price, at the last sale price on the day of valuation. Debt securities (other than short-term obligations) are valued each day by an independent pricing service approved by the Trust’s Board of Trustees (the “Board”) based on methods which include consideration of: yields or prices of securities of comparable quality, coupon, maturity and type, indications as to values from dealers, and general market conditions or market quotations from a major market maker in the securities. Investments valued in currencies other than the U.S. dollar are converted to U.S. dollars using exchange rates obtained from pricing services. Short-term debt obligations having 60 days or less remaining until maturity, at time of purchase, may be valued at amortized cost. Securities that are not traded or dealt in any securities exchange (whether domestic or foreign) and for which over-the-counter market quotations are readily available generally shall be valued at the last sale price or, in the absence of a sale, at the mean between the current bid and ask price on such over-the-counter market. Debt securities not traded on an exchange may be valued at prices supplied by a pricing agent(s) based on broker or dealer supplied valuations or matrix pricing, a method of valuing securities by reference to the value of other securities with similar characteristics, such as rating, interest rate and maturity.
The Fund may hold securities for which market quotations are not readily available or are determined to be unreliable. These securities will be valued using the “fair value” procedures approved by the Board. The Board has appointed execution of these procedures to the Adviser as its valuation designee (the “Valuation Designee”) for all fair value determinations and responsibilities other than overseeing pricing service providers used by the Trust. This designation is subject to Board oversight and certain reporting and other requirements designed to facilitate the Board’s ability effectively to oversee the designee’s fair value determinations. The Valuation Designee may also enlist third party consultants such a valuation specialist at a public accounting firm, valuation consultant or financial officer of a security issuer on an as-needed basis to assist the Valuation Designee in determining a security-specific fair value. The Board is responsible for reviewing and approving fair value methodologies utilized by the Valuation Designee, approval of which shall be based upon whether the Valuation Designee followed the valuation procedures approved by the Board.
15
| TACTICAL DIVIDEND AND MOMENTUM FUND |
| NOTES TO FINANCIAL STATEMENTS (Unaudited) (Continued) |
| January 31, 2024 |
Valuation of Underlying Funds – The Fund may invest in portfolios of open-end or closed-end investment companies (the “Underlying Funds”). The Underlying Funds value securities in their portfolios for which market quotations are readily available at their market values (generally the last reported sale price) and all other securities and assets at their fair value to the methods established by the board of directors of the Underlying Funds.
Open-end investment companies are valued at their respective net asset values as reported by such investment companies. The shares of many closed-end investment companies and exchange-traded funds (“ETFs”), after their initial public offering, frequently trade at a price per share, which is different than the net asset value per share. The difference represents a market premium or market discount of such shares. There can be no assurance that the market discount or market premium on shares of any closed-end investment company or ETF purchased by the Fund will not change.
Fair Valuation Process – The applicable investments are valued by the Valuation Designee pursuant to valuation procedures approved by the Board. For example, fair value determinations are required for the following securities: (i) securities for which market quotations are insufficient or not readily available on a particular business day (including securities for which there is a short and temporary lapse in the provision of a price by the regular pricing source); (ii) securities for which, in the judgment of the Valuation Designee, the prices or values available do not represent the fair value of the instrument; factors which may cause the Valuation Designee to make such a judgment include, but are not limited to, the following: only a bid price or an asked price is available; the spread between bid and asked prices is substantial; the frequency of sales; the thinness of the market; the size of reported trades; and actions of the securities markets, such as the suspension or limitation of trading; (iii) securities determined to be illiquid; and (iv) securities with respect to which an event that will affect the value thereof has occurred (a “significant event”) since the closing prices were established on the principal exchange on which they are traded, but prior to the Fund’s calculation of its net asset value. Specifically, interests in commodity pools or managed futures pools are valued on a daily basis by reference to the closing market prices of each futures contract or other asset held by a pool, as adjusted for pool expenses. Restricted or illiquid securities, such as private investments or non-traded securities are valued based upon the current bid for the security from two or more independent dealers or other parties reasonably familiar with the facts and circumstances of the security (who should take into consideration all relevant factors as may be appropriate under the circumstances). If a current bid from such independent dealers or other independent parties is unavailable, the Valuation Designee shall determine the fair value of such security using the following factors: (i) the type of security; (ii) the cost at date of purchase; (iii) the size and nature of the Fund’s holdings; (iv) the discount from market value of unrestricted securities of the same class at the time of purchase and subsequent thereto; (v) information as to any transactions or offers with respect to the security; (vi) the nature and duration of restrictions on disposition of the security and the existence of any registration rights; (vii) how the yield of the security compares to similar securities of companies of similar or equal creditworthiness; (viii) the level of recent trades of similar or comparable securities; (ix) the liquidity characteristics of the security; (x) current market conditions; and (xi) the market value of any securities into which the security is convertible or exchangeable.
The Fund utilizes various methods to measure the fair value of its investments on a recurring basis. GAAP establishes a hierarchy that prioritizes inputs to valuation methods. The three levels of input are:
Level 1 – Unadjusted quoted prices in active markets for identical assets and liabilities that the Fund has the ability to access.
Level 2 – Observable inputs other than quoted prices included in Level 1 that are observable for the asset or liability, either directly or indirectly. These inputs may include quoted prices for the identical instrument on an inactive market, prices for similar instruments, interest rates, prepayment speeds, credit risk, yield curves, default rates and similar data.
Level 3 – Unobservable inputs for the asset or liability, to the extent relevant observable inputs are not available, representing the Fund’s own assumptions about the assumptions a market participant would use in valuing the asset or liability, and would be based on the best information available.
The availability of observable inputs can vary from security to security and is affected by a wide variety of factors, including, for example, the type of security, whether the security is new and not yet established in the marketplace, the liquidity of markets, and other characteristics particular to the security. To the extent that valuation is based on models or inputs that are less observable or unobservable in the market, the determination of fair value requires more judgment. Accordingly, the degree of judgment exercised in determining fair value is greatest for instruments categorized in Level 3.
The inputs used to measure fair value may fall into different levels of the fair value hierarchy. In such cases, for disclosure purposes, the level in the fair value hierarchy within which the fair value measurement falls in its entirety, is determined based on the lowest level input that is significant to the fair value measurement in its entirety.
16
| TACTICAL DIVIDEND AND MOMENTUM FUND |
| NOTES TO FINANCIAL STATEMENTS (Unaudited) (Continued) |
| January 31, 2024 |
The inputs or methodology used for valuing securities are not necessarily an indication of the risk associated with investing in those securities. The following tables summarize the inputs used as of January 31, 2024 for the Fund’s assets and liabilities measured at fair value:
| Assets | Level 1 | Level 2 | Level 3 | Total | ||||||||||||
| Common Stocks | $ | 1,597,750 | $ | — | $ | — | $ | 1,597,750 | ||||||||
| Exchange-Traded Funds | 82,697,003 | — | — | 82,697,003 | ||||||||||||
| Collateral For Securities Loaned | 3,138,677 | — | — | 3,138,677 | ||||||||||||
| Money Market Fund | 2,016,229 | — | — | 2,016,229 | ||||||||||||
| Total | $ | 89,449,659 | $ | — | $ | — | $ | 89,449,659 | ||||||||
The Fund did not hold any Level 3 securities during the period.
Security Transactions and Related Income – Security transactions are accounted for on trade date basis. Interest income is recognized on an accrual basis. Dividend income is recorded on the ex-dividend date. Realized gains or losses from sales of securities are determined by comparing the identified cost of the security lot sold with the net sales proceeds.
Dividends and Distributions to Shareholders – Dividends from net investment income are declared and distributed annually. Distributable net realized capital gains are declared and distributed annually. Dividends from net investment income and distributions from net realized gains are recorded on the ex-dividend date and determined in accordance with federal income tax regulations, which may differ from GAAP. These “book/tax” differences are considered either temporary (i.e., deferred losses, capital loss carry forwards) or permanent in nature. To the extent these differences are permanent in nature, such amounts are reclassified within the composition of net assets based on their federal tax-basis treatment; temporary differences do not require reclassification.
Federal Income Taxes – It is the Fund’s policy to qualify as a regulated investment company by complying with the provisions of the Internal Revenue Code that are applicable to regulated investment companies and to distribute substantially all of its taxable income and net realized gains to shareholders. Therefore, no federal income tax provision is required.
The Fund recognizes the tax benefits of uncertain tax positions only where the position is “more likely than not” to be sustained assuming examination by tax authorities. Management has analyzed the Fund’s tax positions and has concluded that no liability for unrecognized tax benefits should be recorded related to uncertain tax positions taken on returns filed for the open tax year 2021-2023, or expected to be taken in the Fund’s July 31, 2024 tax return. The Fund recognizes interest and penalties, if any, related to unrecognized tax benefits as income tax expense in the Statement of Operations. During the year, the Fund did not incur any interest or penalties. The Fund identifies its major tax jurisdictions as U.S. Federal and Ohio and foreign jurisdictions where the Fund makes significant investments. The Fund is not aware of any tax positions for which it is reasonably possible that the total amounts of unrecognized tax benefits will change materially in the next twelve months.
Expenses – Expenses of the Trust that are directly identifiable to a specific fund are charged to that fund. Expenses, which are not readily identifiable to a specific fund, are allocated in such a manner as deemed equitable, taking into consideration the nature and type of expense and the relative sizes of the funds in the Trust.
Indemnification – The Trust indemnifies its officers and trustees for certain liabilities that may arise from the performance of their duties to the Trust. Additionally, in the normal course of business, the Fund enters into contracts that contain a variety of representations and warranties and which provide general indemnities. The Fund’s maximum exposure under these arrangements is unknown, as this would involve future claims that may be made against the Fund that have not yet occurred. However, the Fund expects the risk of loss due to these warranties and indemnities to be remote.
| 3. | PRINCIPAL INVESTMENT RISKS |
The Fund’s investments expose the Fund to various risks, certain of which are discussed below. The Fund’s prospectus and statement of additional information (“SAI”) include further information regarding the risks associated with the Fund’s investments. These risks include but are not limited to cash positions risk, cybersecurity risk, equity risk, fixed income risk, focus risk, healthcare sector risk, high yield risk, investment companies and ETFs risk, issuer-specific risk, large capitalization risk, liquidity risk, management risk,
17
| TACTICAL DIVIDEND AND MOMENTUM FUND |
| NOTES TO FINANCIAL STATEMENTS (Unaudited) (Continued) |
| January 31, 2024 |
market events risk, market risk, portfolio turnover risk, real estate securities risk, rules-based strategy risk, sector risk, securities lending risk, technology securities risk and volatility risk.
Equity Risk – Equity securities are susceptible to general market fluctuations, volatile increases and decreases in value as market confidence in and perceptions of their issuers change and unexpected trading activity among retail investors. Factors that may influence the price of equity securities include developments affecting a specific company or industry, or the changing economic, political or market conditions.
| ● | Dividend-Yielding Companies Risk. A company that has historically paid regular dividends to shareholders may decrease or eliminate dividend payments in the future, which could result in a decrease in the value of the company’s stock and lower performance of the Fund. |
| ● | Momentum Investing Risk. An investment in securities with positive momentum entails investing in securities that have had above-average recent returns. These securities may experience greater price volatility than other equity securities, which may negatively impact the investment performance of the Fund. |
Cash Positions Risk – The Fund may hold a significant position in cash, cash equivalent securities or U.S. treasury investments. When the Fund’s investment in cash, cash equivalent securities or U.S. treasury investments increases, the Fund may not participate in market advances or declines to the same extent that it would if the Fund were more fully invested.
Investment Companies Risk – When the Fund invests in other investment companies, including closed-end funds or ETFs, it will bear additional expense based upon its pro rata share of the other investment company’s operating expense, including the management fees in addition to those paid by the Fund. The risk of owning an investment company generally reflects the risks of owning the underlying investments held by the investment company. The Fund may also incur brokerage costs when it purchases and sells shares of investment companies. In addition, the market value of shares of ETFs or closed end funds may differ from their net asset value. Accordingly, there may be times when closed-end fund or ETF shares trade at a premium or discount to net asset value. For ETFs, this difference in price may be due to the fact that the supply and demand in the market for fund shares at any point in time is not always identical to the supply and demand in the market for the underlying basket of securities. During periods of market volatility, inverse ETFs may not perform as expected.
Securities Lending Risk – The Fund may lend portfolio securities to institutions, such as banks and certain broker-dealers. The Fund may experience a loss or delay in the recovery of its securities if the borrowing institution breaches its agreement with the Fund. In certain market conditions, the portfolio of the Fund’s securities on loan may be significant and may magnify the risk of such a loss or delay. The risks associated with lending portfolio securities, as with other extensions of secured credit, include, but are not limited to, possible delays in receiving additional collateral or in the recovery of the securities loaned, possible loss of rights in the collateral should the borrower fail financially, as well as risk of loss in the value of the collateral or the value of the investments made with the collateral. In certain market conditions, the portion of the Fund’s securities on loan may be significant and may magnify the risk of such a loss of delay.
Volatility Risk – The Fund or an underlying fund may have investments that appreciate or decrease significantly in value over short periods of time. The value of an investment in the Fund’s portfolio may fluctuate due to events or factors that affect markets generally or that affect a particular investment industry or sector. The value of an investment in the Fund’s portfolio may also be more volatile than the market as a whole. This volatility may affect the Fund’s net asset value per share, including by causing it to experience significant increases or declines in value over short periods of time. Events or financial circumstances affecting individual investments, industries or sectors may increase the volatility of the Fund.
Market Risk – Overall market risk may affect the value of individual instruments in which the Fund invest. The Fund is subject to the risk that the securities markets will move down, sometimes rapidly and unpredictably, based on overall economic conditions and other factors, which may negatively affect the Fund’s performance. Factors such as domestic and foreign (non-U.S.) economic growth and market conditions, real or perceived adverse economic or political conditions, military conflict, acts of terrorism, social unrest, natural disasters, recessions, inflation, changes in interest rate levels, supply chain disruptions, sanctions, the spread of infectious illness or other public health threats, lack of liquidity in the bond and other markets, volatility in the securities markets, adverse investor sentiment and political events affect the securities markets. U.S. and foreign stock markets have experienced periods of substantial price volatility in the past and may do so again in the future. Securities markets also may experience long periods of decline in value. A change in financial condition or other event affecting a single issuer or market may adversely impact securities markets as a whole.
18
| TACTICAL DIVIDEND AND MOMENTUM FUND |
| NOTES TO FINANCIAL STATEMENTS (Unaudited) (Continued) |
| January 31, 2024 |
Rates of inflation have recently risen. The value of assets or income from an investment may be worth less in the future as inflation decreases the value of money. When the value of the Fund’s investments goes down, your investment in the Fund decreases in value and you could lose money.
Local, state, regional, national or global events such as war, acts of terrorism, the spread of infectious illness or other public health issues, recessions, or other events could have a significant impact on the Fund and its investments and could result in decreases to the Fund’s net asset value. Political, geopolitical, natural and other events, including war, terrorism, trade disputes, government shutdowns, market closures, natural and environmental disasters, epidemics, pandemics and other public health crises and related events and governments’ reactions to such events have led, and in the future may lead, to economic uncertainty, decreased economic activity, increased market volatility and other disruptive effects on U.S. and global economies and markets. Such events may have significant adverse direct or indirect effects on the Fund and its investments. For example, a widespread health crisis such as a global pandemic could cause substantial market volatility, exchange trading suspensions and closures, impact the ability to complete redemptions, and affect Fund performance. A health crisis may exacerbate other pre-existing political, social and economic risks. In addition, the increasing interconnectedness of markets around the world may result in many markets being affected by events or conditions in a single country or region or events affecting a single or small number of issuers.
Fixed Income Securities Risk – Fixed income securities are subject to interest rate risk, call risk, prepayment and extension risk, credit risk, duration risk, and liquidity risk. In addition, current market conditions may pose heightened risks for fixed income securities. When the Fund invests in fixed income securities or derivatives, the value of your investment in the Fund will fluctuate with changes in interest rates. Typically, a rise in interest rates causes a decline in the value of fixed income securities or derivatives owned by the Fund. In general, the market price of fixed income securities with longer maturities or durations will increase or decrease more in response to changes in interest rates than shorter-term securities. Other risk factors include credit risk (the debtor may default) and prepayment risk (the debtor may pay its obligation early, reducing the amount of interest payments). These risks could affect the value of a particular investment by the Fund, possibly causing the Fund’s share price and total return to be reduced and fluctuate more than other types of investments. Moreover, new regulations applicable to and changing business practices of financial intermediaries that make markets in fixed income securities have resulted in less market making activity for certain fixed income securities, which has reduced the liquidity.
Sector Risk – The risk that if the Fund invests a significant portion of its total assets in certain issuers within the same economic sector, an adverse economic, business or political development or natural or other event, including war, terrorism, natural and environmental disasters, epidemics, pandemics and other public health crises, affecting that sector may affect the value of the Fund’s investments more than if the Fund’s investments were not so concentrated. Economic, legislative or regulatory developments may occur that significantly affect an entire sector. This may cause the Fund’s NAV to fluctuate more than that of a fund that does not focus in a particular sector. While the Fund may not concentrate in any one industry, the Fund may invest without limitation in a particular sector.
Technology Sector Risk – The Fund may invest a substantial portion of its assets directly or indirectly in securities issued by technology companies. Securities of technology companies may be subject to greater price volatility than securities of companies in other sectors. These securities may fall in and out of favor with investors rapidly, which may cause sudden selling and dramatically lower market prices. Technology securities also may be affected adversely by changes in technology, consumer and business purchasing patterns, government regulation and/or obsolete products or services. In addition, a rising interest rate environment tends to negatively affect technology companies.
| 4. | INVESTMENT TRANSACTIONS |
The cost of purchases and proceeds from the sale of securities, other than short-term investments, for the six months ended January 31, 2024, amounted to $124,324,707 and $148,304,921, respectively.
| 5. | INVESTMENT ADVISORY AGREEMENT AND TRANSACTIONS WITH RELATED PARTIES |
Hanlon Investment Management, Inc. serves as the Fund’s Investment Adviser (the “Adviser”). Pursuant to an Investment Advisory Agreement with the Fund, the Adviser, under the oversight of the Board, directs the daily operations of the Fund and supervises the performance of administrative and professional services provided by others. As compensation for its services and the related expenses borne by the Adviser, the Fund pays the Adviser an investment advisory fee, computed and accrued daily and paid monthly, at an annual rate of 1.00% of the Fund’s average daily net assets. For the six months ended January 31, 2024, the Adviser earned advisory fees of $483,177.
19
| TACTICAL DIVIDEND AND MOMENTUM FUND |
| NOTES TO FINANCIAL STATEMENTS (Unaudited) (Continued) |
| January 31, 2024 |
The Adviser has contractually agreed to reduce its fees and/or absorb expenses of the Fund (the “Waiver Agreement”), until at least November 30, 2024, to ensure that total annual operating expenses of the Fund after fee waiver and/or reimbursement (exclusive of any front-end or contingent deferred loads; brokerage fees and commissions; expenses of other investment companies in which the Fund may invest (“acquired fund fees and expenses”); borrowing costs, such as interest and dividend expense on securities sold short; taxes; and extraordinary expenses, such as litigation expenses) will not exceed 1.70%, 2.45%, 1.45% and 1.85% of the Fund’s average daily net assets for Class A, Class C, Class I and Class R shares, respectively. This Waiver Agreement may be terminated with respect to the Fund by the Board of Trustees on 60 days’ written notice to the Adviser. These expense reimbursements are subject to possible recoupment from the Fund in future years on a rolling three-year basis (within three years after the fees have been waived or reimbursed) if such recoupment can be achieved without exceeding the foregoing expense limits as well as any expense limitation that was in effect at the time the waiver or reimbursement was made. No recoupment will be paid to the Adviser in any fiscal quarter unless the Board has determined in advance that such recoupment is in the best interest of the Fund and its shareholders. During the six months ended January 31, 2024 the adviser waived $26,895 in advisory fees. As of January 31, 2024, the total amount of previously waived fees available for recapture is $169, which is recapturable by July 31, 2026.
Distributor – The distributor of the Fund is Foreside Fund Services, LLC (the “Distributor”) . The Board has adopted, on behalf of the Fund, the Trust’s Master Distribution and Shareholder Servicing Plans for Class A, Class C, and Class R shares (the “Plans”), as amended, pursuant to Rule 12b-1 under the 1940 Act, to pay for certain distribution activities and shareholder services. Under the Plans, the Fund may pay 0.25% per year of the average daily net assets of Class A shares, 1.00% of the average daily net assets for Class C shares and 0.40% of the average daily net assets for Class R shares for such distribution and shareholder service activities. For the six months ended January 31, 2024, the Tactical Dividend and Momentum Fund incurred distribution fees of $7,897, $1,186 and $30,411 for Class A, Class C and Class R shares, respectively.
The Distributor acts as the Fund’s principal underwriter in a continuous public offering of the Fund’s shares. During the six months ended January 31, 2024, the Distributor did not receive any underwriting commissions for sales of the Fund’s shares.
In addition, the following affiliated entities provide services to the Fund:
Ultimus Fund Solutions, LLC (“UFS”) – UFS provides administration, fund accounting, and transfer agent services to the Trust. Pursuant to separate servicing agreements with UFS, the Fund pays UFS customary fees for providing administration, fund accounting and transfer agency services to the Fund. Certain officers of the Trust are also officers of UFS, and are not paid any fees directly by the Fund for serving in such capacities.
Northern Lights Compliance Services, LLC (“NLCS”) – NLCS, an affiliate of UFS, provides a Chief Compliance Officer to the Trust, as well as related compliance services, pursuant to a consulting agreement between NLCS and the Trust. Under the terms of such agreement, NLCS receives customary fees from the Fund.
BluGiant, LLC (“BluGiant”), an affiliate of UFS, provides EDGAR conversion and filing services as well as print management services for the Fund on an ad-hoc basis. For the provision of these services, BluGiant receives customary fees from the Fund.
| 6. | AGGREGATE UNREALIZED APPRECIATION AND DEPRECIATION – TAX BASIS |
| Gross | Gross | Net Unrealized | ||||||||||||
| Tax | Unrealized | Unrealized | Appreciation | |||||||||||
| Cost | Appreciation | Depreciation | (Depreciation) | |||||||||||
| $ | 85,267,329 | $ | 4,431,264 | $ | (248,934 | ) | $ | 4,182,330 | ||||||
| 7. | DISTRIBUTIONS TO SHAREHOLDERS AND TAX COMPONENTS OF CAPITAL |
The tax character of distributions paid for the year ended July 31, 2023, and July 31,2022, was as follows:
| Fiscal Year Ended | Fiscal Year Ended | |||||||
| July 31, 2023 | July 31, 2022 | |||||||
| Ordinary Income | $ | — | $ | — | ||||
| Long-Term Capital Gain | — | 18,935,469 | ||||||
| Return of Capital | — | — | ||||||
| $ | — | $ | 18,935,469 | |||||
20
| TACTICAL DIVIDEND AND MOMENTUM FUND |
| NOTES TO FINANCIAL STATEMENTS (Unaudited) (Continued) |
| January 31, 2024 |
As of July 31, 2023, the components of accumulated earnings/(deficit) on a tax basis were as follows:
| Undistributed | Undistributed | Post October Loss | Capital Loss | Other | Unrealized | Total | ||||||||||||||||||||
| Ordinary | Long-Term | and | Carry | Book/Tax | Appreciation/ | Distributable Earnings/ | ||||||||||||||||||||
| Income | Gains | Late Year Loss | Forwards | Differences | (Depreciation) | (Accumulated Deficit) | ||||||||||||||||||||
| $ | 293,460 | $ | — | $ | (7,333,058 | ) | $ | (9,636,297 | ) | $ | — | $ | 9,047,178 | $ | (7,628,717 | ) | ||||||||||
The difference between book basis and tax basis undistributed net investment income/(loss), accumulated net realized gain/(loss), and unrealized appreciation/(depreciation) from investments is primarily attributable to the tax deferral of losses on wash sales.
Capital losses incurred after October 31 within the fiscal year are deemed to arise on the first business day of the following fiscal year for tax purposes. The Fund incurred and elected to defer such capital losses of $7,333,058.
As of July 31, 2023, the Fund had capital loss carry forwards for federal income tax purposes available to offset future capital gains, as follows:
| Short-Term | Long-Term | Total | CLCF Utilized | |||||||||||
| $ | 9,636,297 | $ | — | $ | 9,636,297 | $ | — | |||||||
| 8. | SECTOR CONCENTRATION |
If a Fund has significant investments in the securities of issuers in industries within a particular sector, any development affecting that sector will have a greater impact on the value of the net assets of the Fund than would be the case if the Fund did not have significant investments in that sector. In addition, this may increase the risk of loss of an investment in the Fund and increase the volatility of the Fund’s NAV per share. From time to time, circumstances may affect a particular sector and the companies within such sector. For instance, economic or market factors, regulation or deregulation, and technological or other developments may negatively impact all companies in a particular sector and therefore the value of a Fund’s portfolio will be adversely affected. As of January 31, 2024, the Fund had 28.1% of the value of its net assets invested within the Technology sector.
| 9. | CONTROL OWNERSHIP |
The beneficial ownership, either directly or indirectly, of more than 25% of the voting securities of the Fund creates a presumption of control of the Fund, under Section 2(a)9 of the 1940 Act. As of January 31, 2024, Pershing LLC held 69.8% of the voting securities of the Fund for the benefit of others.
| 10. | SECURITIES LENDING |
Under an agreement with the BNY Mellon Corp. (“BNY Mellon”), the Fund can lend its portfolio securities to brokers, dealers and other financial institutions approved by the Board to earn additional income. Loans are collateralized by cash, in an amount at least equal to the market value of the securities loaned plus accrued interest, which is invested in highly liquid, short-term instruments such as repurchase agreements collateralized by U.S. Government securities and money market funds in accordance with the Fund’s security lending procedures. A portion of the income generated by the investment in the collateral, net of any rebates paid by BNY Mellon to the borrowers is remitted to BNY Mellon as lending agent, and the remainder is paid to the Fund. The Fund continues to receive interest or dividends on the securities loaned. The Fund has the right under the Master Securities Lending Agreement to recover the securities from the borrower on demand; if the borrower fails to deliver the securities on a timely basis, the Fund could experience delays or losses on recovery. Additionally, the Fund is subject to the risk of loss from investments made with the cash received as collateral. The Fund manages credit exposure arising from these lending transactions by, in appropriate circumstances, entering into master netting agreements and collateral agreements with third party borrowers that provide in the event of default (such as bankruptcy or a borrower’s failure to pay or perform), the right to net a third party borrower’s rights and obligations under such agreement and liquidate and set off collateral against the net amount owed by the counterparty.
As of January 31, 2024, the Fund had loaned securities and received collateral for the loan. The Fund received cash collateral which was invested in the Dreyfus Government Cash Management as shown in the Schedule of Investments. The Fund receives compensation relating to the lending of the Fund’s securities.
21
| TACTICAL DIVIDEND AND MOMENTUM FUND |
| NOTES TO FINANCIAL STATEMENTS (Unaudited) (Continued) |
| January 31, 2024 |
The market values of loaned securities and collateral and percentage of total investment income the Fund received from the investment of cash collateral retained by the lending agent, BNY Mellon, were as follows:
| Fund | Loaned Securities | Collateral | Investment Income | |||||||
| Tactical Dividend and Momentum Fund | $ | 16,671,957 | $ | 17,234,443 | 0.40% | |||||
| Gross Amounts Not Offset in | ||||||||||||||||||||||||
| the Statement of Assets and | ||||||||||||||||||||||||
| Net Amounts | Liabilities | |||||||||||||||||||||||
| Gross | Gross Amounts | of Assets | ||||||||||||||||||||||
| Amounts of | Offset in the | Presented in | Financial | Cash | ||||||||||||||||||||
| Recognized | Statement of Assets | the Statement of | Instruments | Collateral | Net Amount | |||||||||||||||||||
| Assets | Assets | and Liabilities | Assets & Liabilities | Pledged* | Pledged | of Assets | ||||||||||||||||||
| Tactical Dividend and Momentum Fund | ||||||||||||||||||||||||
| Description: | ||||||||||||||||||||||||
| Securities Loaned | $ | 16,671,957 | $ | — | $ | 16,671,957 | $ | 13,533,280 | $ | 3,138,677 | $ | — | ||||||||||||
* The amount is limited to the asset balance and accordingly does not include excess collateral pledged. Non-cash collateral is not reflected in the Fund’s records as the Fund does not have control of this collateral.
The following table sets forth the remaining contractual maturity of the collateral held as of January 31, 2024:
| Remaining Contractual Maturity of the Collateral Held as of January 31, 2024 | ||||||||||||||||||||
| Overnight and | Up to | Greater than | ||||||||||||||||||
| Continuous | 30 Days | 30-90 days | 90 days | Total | ||||||||||||||||
| Dreyfus Government Cash Management Institutional Class | $ | 3,138,677 | $ | — | $ | — | $ | — | $ | 3,138,677 | ||||||||||
| U.S. Government | — | — | — | 14,095,766 | 14,095,766 | |||||||||||||||
| Total securities lending collateral | $ | 3,138,677 | $ | — | $ | — | $ | 14,095,766 | $ | 17,234,443 | ||||||||||
The fair value of the securities loaned for the Fund totaled $16,671,957 at January 31, 2024. The securities loaned are noted in the Schedule of Investments. The fair value of the “Collateral for Securities Loaned” on the Schedule of Investments includes only cash collateral received and reinvested that totaled $3,138,677 for the Fund at January 31, 2024. These amounts are offset by a liability recorded as “Securities lending collateral.” As of January 31, 2024, the Fund had received non-cash collateral of $14,095,766.
| 11. | RECENT REGULATORY UPDATES |
On January 24, 2023, the SEC adopted rule and form amendments to require mutual funds and ETFs to transmit concise and visually engaging streamlined annual and semiannual reports to shareholders that highlight key information. Other information, including financial statements, will not appear in a streamlined shareholder report but must be available online, delivered free of charge upon request, and filed on a semiannual basis on Form N-CSR. The rule and form amendments have a compliance date of July 24, 2024. At this time, management is evaluating the impact of these amendments on the shareholder reports for the Fund.
| 12. | SUBSEQUENT EVENTS |
Subsequent events after the date of the Statement of Assets and Liabilities have been evaluated through the date the financial statements were issued. Management has determined that no events or transactions occurred requiring adjustment or disclosure in the financial statements.
22
| TACTICAL DIVIDEND AND MOMENTUM FUND |
| EXPENSE EXAMPLE (Unaudited) |
| January 31, 2024 |
As a shareholder of the Fund, you incur two types of costs: (1) transaction costs, including sales charges (loads) on purchases and deferred sales charges on certain redemptions; (2) ongoing costs, including management fees; distribution and/or service (12b-1) fees; and other Fund expenses. This example is intended to help you understand your ongoing costs (in dollars) of investing in the Fund and to compare these costs with the ongoing costs of investing in other mutual funds.
The example is based on an investment of $1,000 invested at the beginning of the period and held for the entire period from August 1, 2023 through January 31, 2024.
Actual Expenses
The “Actual Expenses” line in the table below provides information about actual account values and actual expenses. You may use the information below; together with the amount you invested, to estimate the expenses that you paid over the period. Simply divide your account value by $1,000 (for example, an $8,600 account value divided by $1,000 = 8.6), then multiply the result by the number in the table under the heading entitled “Expenses Paid During Period” to estimate the expenses you paid on your account during this period.
Hypothetical Example for Comparison Purposes
The “Hypothetical” line in the table below provides information about hypothetical account values and hypothetical expenses based on the Fund’s actual expense ratio and an assumed rate of return of 5% per year before expenses, which is not the Fund’s actual return. The hypothetical account values and expenses may not be used to estimate the actual ending account balances or expenses you paid for the period. You may use this information to compare this 5% hypothetical example with the 5% hypothetical examples that appear in the shareholder reports of other funds.
Please note that the expenses shown in the table are meant to highlight your ongoing costs only and do not reflect any transactional costs, such as sales charges (loads), or redemption fees. Therefore, the table is useful in comparing ongoing costs only, and will not help you determine the relative total costs of owning different funds. In addition, if these transactional costs were included, your costs would have been higher.
| Hypothetical | ||||||||||||||
| Actual | (5% return before expenses) | |||||||||||||
| Fund’s | Beginning | Ending | Ending | |||||||||||
| Annualized | Account | Account | Expenses | Account | Expenses | |||||||||
| Expense | Value | Value | Paid During | Value | Paid During | |||||||||
| Ratio | 8/1/23 | 1/31/24 | Period * | 1/31/24 | Period * | |||||||||
| Tactical Dividend and Momentum Fund – Class A | 1.70% | $1,000.00 | $1,028.50 | $8.67 | $1,016.55 | $8.62 | ||||||||
| Tactical Dividend and Momentum Fund – Class C | 2.45% | $1,000.00 | $1,025.10 | $12.47 | $1,012.82 | $12.40 | ||||||||
| Tactical Dividend and Momentum Fund – Class I | 1.45% | $1,000.00 | $1,029.60 | $7.40 | $1,017.85 | $7.35 | ||||||||
| Tactical Dividend and Momentum Fund – Class R | 1.85% | $1,000.00 | $1,027.70 | $9.43 | $1,015.84 | $8.37 | ||||||||
| * | Expenses are equal to the Fund’s annualized expense ratio, multiplied by the number of days in the period (184) divided by the number of days in the fiscal year (366). |
23
PRIVACY NOTICE
| FACTS | WHAT DOES TWO ROADS SHARED TRUST DO WITH YOUR PERSONAL INFORMATION |
| Why? | Financial companies choose how they share your personal information. Federal law gives consumers the right to limit some but not all sharing. Federal law also requires us to tell you how we collect, share, and protect your personal information. Please read this notice carefully to understand what we do. |
| What? | THE TYPES OF PERSONAL INFORMATION WE COLLECT AND SHARE DEPENDS ON THE PRODUCT OR SERVICE THAT YOU HAVE WITH US. THIS INFORMATION CAN INCLUDE:
● Social Security number and income
● Account transactions and transaction history
● Investment experience and purchase history
When you are no longer our customer, we continue to share your information as described in this notice. |
| How? | All financial companies need to share customers’ personal information to run their everyday business. In the section below, we list the reasons financial companies can share their customers’ personal information; the reason Two Roads Shared Trust chooses to share and whether you can limit this sharing. |
| Reasons we can share your personal information | Does Two Roads Shared Trust share? | Can you limit this sharing? |
| For our everyday business purposes – such as to process your transactions, maintain your account(s), respond to court orders and legal investigations, or report to credit bureaus | YES | NO |
| For our marketing purposes – to offer our products and services to you | NO | We do not share |
| For joint marketing with other financial companies | NO | We do not share |
| For our affiliates’ everyday business purposes – information about your transactions and experiences | NO | We do not share |
| For our affiliates’ everyday business purposes – information about your creditworthiness | NO | We do not share |
| For our affiliates to market to you | NO | We do not share |
| For nonaffiliates to market to you | NO | We do not share |
| Questions? | Call 1-631-490-4300 | |
24
What we do
| How does Two Roads Shared Trust protect my personal information? | To protect your personal information from unauthorized access and use, we use security measures that comply with federal law. These measures include computer safeguards and secured files and buildings.
Our service providers are held accountable for adhering to strict policies and procedures to prevent any misuse of your nonpublic personal information. |
| How does Two Roads Shared Trust collect my personal information? | We collect your personal information, for example, when you
● open an account or give us contact information
● provide account information or give us your income information
● make deposits or withdrawals from your account
We also collect your personal information from other companies. |
| Why can’t I limit all sharing? | Federal law gives you the right to limit only
● sharing for affiliates’ everyday business purposes – information about your creditworthiness
● affiliates from using your information to market to you
● sharing for nonaffiliates to market to you
State laws and individual companies may give you additional rights to limit sharing. |
Definitions
| Affiliates | Companies related by common ownership or control. They can be financial and nonfinancial companies.
● Two Roads Shared Trust has no affiliates. |
| Nonaffiliates | Companies not related by common ownership or control. They can be financial and nonfinancial companies.
● Two Roads Shared Trust does not share with nonaffiliates so they can market to you. |
| Joint marketing | A formal agreement between nonaffiliates financial companies that together market financial products or services to you.
● Two Roads Shared Trust does not jointly market. |
25
PROXY VOTING POLICY
Information regarding how the Funds voted proxies relating to portfolio securities for the most recent twelve month period ended June 30 as well as a description of the policies and procedures that the Fund uses to determine how to vote proxies is available without charge, upon request, by calling 1-844-828-3212 or by referring to the Securities and Exchange Commission’s (“SEC”) website at http://www.sec.gov.
PORTFOLIO HOLDINGS
The Fund files its complete schedule of portfolio holdings with the SEC for the first and third quarters of each fiscal year as an exhibit to its reports on Form N-PORT within sixty days after the end of the period. Form N-PORT reports are available on the SEC’s website at http://www.sec.gov. The information on reports and Form N-PORT is available without charge, upon request, by calling 1-844-828-3212.
| INVESTMENT ADVISOR |
| Hanlon Investment Management, Inc. |
| 3393 Bargaintown Road |
| Egg Harbor Township, NJ 08234 |
| ADMINISTRATOR |
| Ultimus Fund Solutions, LLC |
| 225 Pictoria Dr, Suite 450 |
| Cincinnati, Ohio 45246 |
| TD&M-SAR24 |
(b) Include a copy of each notice transmitted to stockholders in reliance on Rule 30e-3 under the Act (17 CFR 270.30e-3) that contains disclosures specified by paragraph (c)(3) of that rule.
Item 2. Code of Ethics. Not applicable.
Item 3. Audit Committee Financial Expert. Not applicable.
Item 4. Principal Accountant Fees and Services. Not applicable.
Item 5. Audit Committee of Listed Registrants. Not applicable.
Item 6. Investments. Included in semi-annual report to shareholders filed under Item 1 of this form..
Item 7. Disclosure of Proxy Voting Policies and Procedures for Closed-End Management Investment Companies. Not applicable to open-end management investment companies.
Item 8. Portfolio Managers of Closed-End Management Investment Companies. Not applicable to open-end management investment companies.
Item 9. Purchases of Equity Securities by Closed-End Management Investment Company and Affiliated Purchasers. Not applicable to open-end management investment companies.
Item 10. Submission of Matters to a Vote of Security Holders. Not applicable at this time.
Item 11. Controls and Procedures.
(a) Based on an evaluation of the registrant’s disclosure controls and procedures (as defined in Rule 30a-3(c) under the 1940 Act), as of a date within 90 days of the filing date of this Form N-CSR, the principal executive officer and principal financial officer of the registrant have concluded that the disclosure controls and procedures required by Rule 30a-3(b) under the 1940 Act and Rules 13a-(b) or 15d-15(b) under the Securities and Exchange Act of 1934, as amended of the registrant are reasonably designed to ensure that the information required in filings on Form N-CSR is recorded, processed, summarized, and reported by the filing date, including that information required to be disclosed is accumulated and communicated to the registrant’s management, including the registrant’s principal executive officer and principal financial officer, as appropriate to allow timely decisions regarding required disclosure.
(b) There were no changes in the registrant's internal control over financial reporting (as defined in Rule 30a-3(d) under the 1940 Act) that occurred during the period covered by this report that have materially affected, or are reasonably likely to materially affect, the registrant's internal control over financial reporting.
Item 12. Disclosure of Securities Lending Activities for Closed-End Management Investment Companies.
Not applicable to open-end management investment companies.
Item 13. Exhibits.
(a)(1) Not applicable.
(a)(3) Not applicable for open-end investment companies.
(a)(4) Disclosure regarding change in registrant’s independent registered public accountant is filed herewith.
SIGNATURES
Pursuant to the requirements of the Securities Exchange Act of 1934 and the Investment Company Act of 1940, the registrant has duly caused this report to be signed on its behalf by the undersigned, thereunto duly authorized.
(Registrant) Two Roads Shared Trust
By (Signature and Title)
/s/ James Colantino
James Colantino, Principal Executive Officer/President
Date 4/5/24
Pursuant to the requirements of the Securities Exchange Act of 1934 and the Investment Company Act of 1940, this report has been signed below by the following persons on behalf of the registrant and in the capacities and on the dates indicated.
By (Signature and Title)
/s/ James Colantino
James Colantino, Principal Executive Officer/President
Date 4/5/24
By (Signature and Title)
/s/ Laura Szalyga
Laura Szalyga, Principal Financial Officer/Treasurer
Date 4/5/24