
13 29 93 204 223 234 255 153 0 0 116 173 20 157 197 231 240 245 104 203 241 238 235 236 0 116 173 www.cyrusone.com Second Quarter 2013 Financial Results August 7, 2013

13 29 93 204 223 234 255 153 0 0 116 173 20 157 197 231 240 245 104 203 241 238 235 236 0 116 173 www.cyrusone.com Safe Harbor 2 This presentation contains forward-looking statements regarding future events and our future results that are subject to the “safe harbor” provisions of the Private Securities Litigation Reform Act of 1995. All statements, other than statements of historical facts, are statements that could be deemed forward-looking statements. These statements are based on current expectations, estimates, forecasts, and projections about the industries in which we operate and the beliefs and assumptions of our management. Words such as “expects,” “anticipates,” “predicts,” “projects,” “intends,” “plans,” “believes,” “seeks,” “estimates,” “continues,” “endeavors,” “strives,” “may,” variations of such words and similar expressions are intended to identify such forward-looking statements. In addition, any statements that refer to projections of our future financial performance, our anticipated growth and trends in our businesses, and other characterizations of future events or circumstances are forward-looking statements. Readers are cautioned these forward-looking statements are based on current expectations and assumptions that are subject to risks and uncertainties, which could cause our actual results to differ materially and adversely from those reflected in the forward-looking statements. Factors that could cause or contribute to such differences include, but are not limited to, those discussed in this release and those discussed in other documents we file with the Securities and Exchange Commission (SEC). More information on potential risks and uncertainties is available in our recent filings with the SEC, including CyrusOne’s Form 10-K and Form 8-Ks. Actual results may differ materially and adversely from those expressed in any forward-looking statements. We undertake no obligation to revise or update any forward-looking statements for any reason.

13 29 93 204 223 234 255 153 0 0 116 173 20 157 197 231 240 245 104 203 241 238 235 236 0 116 173 www.cyrusone.com Highlights • Revenue of $63.6M an increase of 18% from Q2 2012 • Signed leases for 37,000 CSF (1) in Q2 2013, compared to 19,000 CSF (1) in Q2 2012 • In July, signed 5 year lease with a customer for all remaining power and space at San Antonio facility for approximately 19,500 CSF and 5MW, including final data hall to be completed in Q3 2013 • Gaining customer traction with CyrusOne Internet Exchange (IX) as 68% of new leases included incremental IX services • Completed the purchase of three previously leased facilities for $28.2M with a combined annualized rent of $20.5 million for June • As of the end of the second quarter 2013, the company’s owned facilities accounted for 70% of NOI and 77% of CSF Second Quarter 2013 Note: 1. Colocation square feet (CSF) represents NRSF currently leased or available for lease as colocation space, where customers locate their servers and other IT equipment. Net rentable square feet (NRSF) represent the total square feet of a building currently leased or available for lease based on engineers’ drawings and estimates but does not include space held for development or space used by CyrusOne. 3
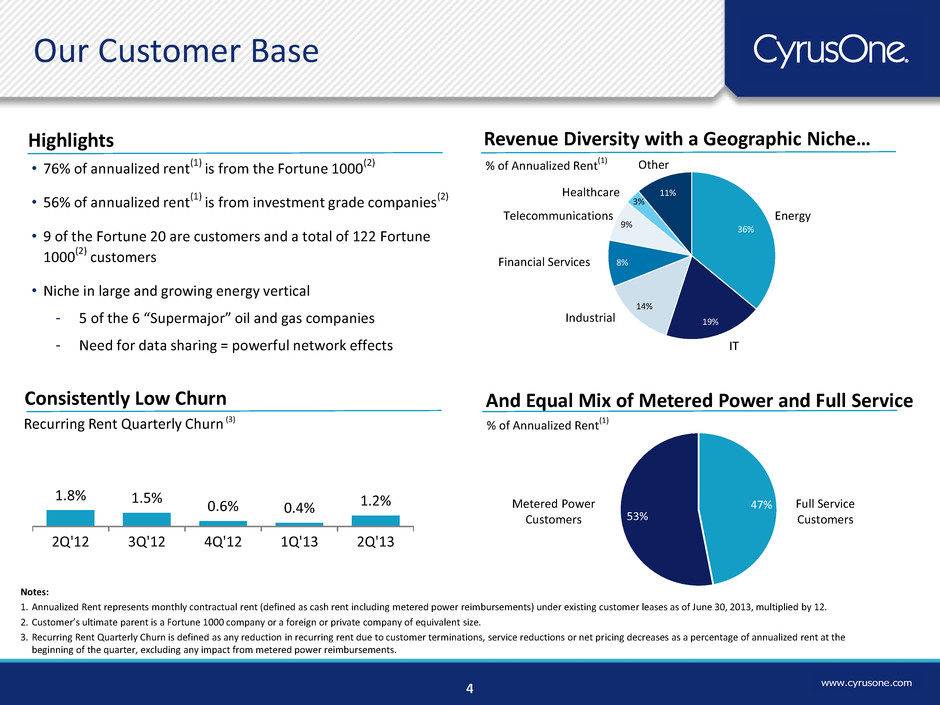
13 29 93 204 223 234 255 153 0 0 116 173 20 157 197 231 240 245 104 203 241 238 235 236 0 116 173 www.cyrusone.com 36% 19% 14% 8% 9% 3% 11% 47% 53% • 76% of annualized rent(1) is from the Fortune 1000(2) • 56% of annualized rent(1) is from investment grade companies(2) • 9 of the Fortune 20 are customers and a total of 122 Fortune 1000(2) customers • Niche in large and growing energy vertical - 5 of the 6 “Supermajor” oil and gas companies - Need for data sharing = powerful network effects Notes: 1. Annualized Rent represents monthly contractual rent (defined as cash rent including metered power reimbursements) under existing customer leases as of June 30, 2013, multiplied by 12. 2. Customer’s ultimate parent is a Fortune 1000 company or a foreign or private company of equivalent size. 3. Recurring Rent Quarterly Churn is defined as any reduction in recurring rent due to customer terminations, service reductions or net pricing decreases as a percentage of annualized rent at the beginning of the quarter, excluding any impact from metered power reimbursements. Revenue Diversity with a Geographic Niche… Energy Other Telecommunications Financial Services Healthcare IT Our Customer Base Full Service Customers Metered Power Customers % of Annualized Rent (1) And Equal Mix of Metered Power and Full Service % of Annualized Rent (1) 1.8% 1.5% 0.6% 0.4% 1.2% 2Q'12 3Q'12 4Q'12 1Q'13 2Q'13 Consistently Low Churn Recurring Rent Quarterly Churn (3) 4 Industrial Highlights

13 29 93 204 223 234 255 153 0 0 116 173 20 157 197 231 240 245 104 203 241 238 235 236 0 116 173 www.cyrusone.com Sales and Marketing Initiatives Internal Sales Staff • 34 people on sales team in Q213 compared to 19 people in Q212 • Takes 9 – 12 months to realize full sales potential • Regional focus and selling across all industry verticals Marketing • Driving increased brand awareness and higher quality sales leads • Website traffic up approximately 2x vs. year ago • Optimized online marketing, focused events, and PR activities Indirect Channels 64 partners as of June 30, 2013 providing leads and leases at 2x historical rates • Traditional R.E. Brokers • Value Added Resellers • Systems Integrators • Distribution • Hosting 5
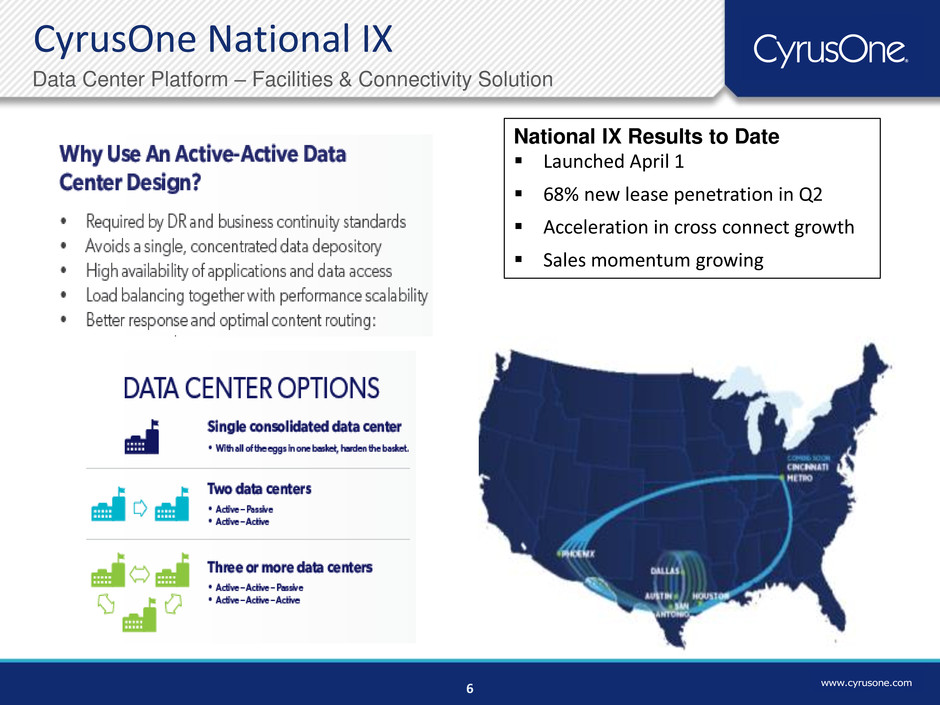
13 29 93 204 223 234 255 153 0 0 116 173 20 157 197 231 240 245 104 203 241 238 235 236 0 116 173 www.cyrusone.com CyrusOne National IX Data Center Platform – Facilities & Connectivity Solution National IX Results to Date Launched April 1 68% new lease penetration in Q2 Acceleration in cross connect growth Sales momentum growing 6

13 29 93 204 223 234 255 153 0 0 116 173 20 157 197 231 240 245 104 203 241 238 235 236 0 116 173 www.cyrusone.com Portfolio Update 21% increase in capacity provides inventory for growth Powered shell of 806 thousand NRSF(1) available for incremental development across all markets in addition to existing inventory and 172 acres of land held for development 7 (1) (1) Notes 1. Colocation square feet (CSF) represents NRSF currently leased or available for lease as colocation space, where customers locate their servers and other IT equipment. Net rentable square feet (NRSF) represent the total square feet of a building currently leased or available for lease based on engineers’ drawings and estimates but does not include space held for development or space used by CyrusOne. 2. Utilization is calculated by dividing CSF under signed leases for available space (whether or not the contract has commenced billing) by total CSF. As of June 30,2013 As of June 30, 2012 Market CSF Capacity(1) (Sq Ft) % Utilized(2) CSF Capacity(1) (Sq Ft) % Utilized(2) Cincinnati 400,562 91% 414,109 91% Dallas 173,100 84% 124,214 87% Houston 230,780 82% 173,655 95% Austin 57,078 41% 57,078 31% Phoenix 36,222 43% - 0% San Antonio 35,765 67% - 0% Chicago 23,298 53% 23,278 59% International 13,200 78% 8,200 24% Total Footprint 970,005 81% 800,534 85% Utilization(2) Highlights • 21% increase in available CSF capacity (1) compared to June 30, 2012 • Utilization(2) improved from March 2013 to 81% • South Ellis Street (Phoenix) is 43% utilized and has only been open for 6 months • Houston is 82% utilized; additional capacity of 42,000 CSF(1) added in a new building at Houston West in April 2013 • The first data hall in the Carrollton facility is 64% utilized and construction is underway on the second data hall • In July, signed lease with a customer for all remaining power and space at San Antonio facility including the remaining data hall to be completed in Q3 2013 • In August, acquired 22 additional acres in San Antonio for next data center facility

13 29 93 204 223 234 255 153 0 0 116 173 20 157 197 231 240 245 104 203 241 238 235 236 0 116 173 www.cyrusone.com Second Quarter Review

13 29 93 204 223 234 255 153 0 0 116 173 20 157 197 231 240 245 104 203 241 238 235 236 0 116 173 www.cyrusone.com $54.0 $63.6 2Q'12 2Q'13 Revenue Second Quarter ($MM) 9 1.8% 1.5% 0.6% 0.4% 1.2% 2Q'12 3Q'12 4Q'12 1Q'13 2Q'13 Consistently Low Churn Recurring Rent Quarterly Churn (1) Notes: 1. Recurring Rent Quarterly Churn is defined as any reduction in recurring rent due to customer terminations, service reductions or net pricing decreases as a percentage of annualized rent at the beginning of the quarter, excluding any impact from metered power reimbursements. 2. Annualized Rent represents monthly contractual rent (defined as cash rent including metered power reimbursements) under existing customer leases as of June 30, 2013, multiplied by 12. 3. Colocation square feet (CSF) represents NRSF currently leased or available for lease as colocation space, where customers locate their servers and other IT equipment. Net rentable square feet (NRSF) represent the total square feet of a building currently leased or available for lease based on engineers’ drawings and estimates but does not include space held for development or space used by CyrusOne. Leased 37,000 CSF(3) in the quarter as compared to 19,000 CSF(3) in Q2 2012 • New leasing volume almost doubled Q2 2012 • 65% of CSF(3) was leased to metered power customers with a weighted average lease term of 65 months • 78% of new leases have escalators at a weighted average of 1.5% Renewed 15,000 CSF in Q2 2013 • Rates renewed at consistent levels • Weighted average lease term of 37 months • 81% of renewals have escalators at a weighted average of 2.2% Revenue growth of 18% was driven by • Expansion of customer base to 573 customers, an increase of 80 from Q2 2012 • Annualized rent (2) increased 15% from Q2 2012 • Existing customers drove 52% of growth

13 29 93 204 223 234 255 153 0 0 116 173 20 157 197 231 240 245 104 203 241 238 235 236 0 116 173 www.cyrusone.com Year over Year P&L Analysis Property expenses: • $3.0M of increase is from new facilities • $1.3M of higher electricity • $1.2M for interconnection platform • Remaining increase due to maintenance, operating taxes, and other Sales and Marketing: • Expanded sales force and advertising spend General and Administrative: • Non-cash compensation increase combined with incremental headcount and public company costs Normalized FFO: • $4.6M tax benefit recorded in Q2 2012 as CyrusOne was part of a C-Corporation • Excluding tax benefit, flat to 2012 as higher Adjusted EBITDA was offset by higher interest expense Q2 2013 Q2 2012 $ % Revenue 63.6$ 54.0$ 9.6$ 18% Property operating expenses 24.6 18.1 (6.5) (36%) Net Operating Income (NOI) 39.0 35.9 3.1 9% NOI Margin 61.3% 66.5% Sales and Marketing 2.9 1.8 (1.1) (61%) General and Administrative (1) 7.1 6.0 (1.1) (18%) are added back to get to adj ebitda Total SG&A Expenses 10.0 7.8 (2.2) (28%) less Non-cash Compensation (1.8) (0.4) 1.4 n/m Adjusted EBITDA 30.8$ 28.5$ 2.3$ 8% Adjusted EBITDA M rgin 48.4% 52.8% Normalized FFO 16.0$ 20.5$ (4.5)$ (22%) AFFO 14.8$ 14.4$ 0.4$ 3% Three Months Ended Fav/(Unfav) Notes: 1. 2012 presentation includes Management fees charged by Cincinnati Bell; no fees were charged in 2013. 2. Definition of Normalized FFO revised to exclude gains/losses on extinguishment of debt - $1.3M in Q2 2013 (2) (2) 10

13 29 93 204 223 234 255 153 0 0 116 173 20 157 197 231 240 245 104 203 241 238 235 236 0 116 173 www.cyrusone.com Sequential P&L Analysis Property expenses: • $1.1M of increase is from new facilities • $1.4M of higher electricity at existing facilities • $0.5M for interconnection platform • Remaining increase due to maintenance and timing of other expenses Sales and Marketing: • Expanded sales force and advertising spend General and Administrative: • Non-cash compensation increase offset by lower legal and consulting costs Normalized FFO: Decrease primarily due to lower Adjusted EBITDA and higher non-cash compensation AFFO: Decrease from higher leasing commissions and deferred revenue and straight line rent adjustments Q2 2013 Q1 2013 $ % Revenue 63.6$ 60.1$ 3.5$ 6% Property operating expenses 24.6 20.1 (4.5) (22%) Net Operating Income (NOI) 39.0 40.0 (1.0) (3%) NOI Margin 61.3% 66.6% Sales and Marketing 2.9 2.8 (0.1) (4%) General and Administrative 7.1 6.9 (0.2) (3%) Total SG&A Expenses 10.0 9.7 (0.3) (3%) Excluding Non-cash Compensation (1.8) (1.2) (0.6) 50% Adjusted EBITDA 30.8$ 31.5$ (0.7)$ (2%) Adjusted EBITDA Ma gi 48.4% 52.4% Normalized FFO 16.0$ 17.2$ (1.2)$ (7%) AFFO 14.8$ 17.5$ (2.7)$ (15%) Three Months Ended Fav/(Unfav) (1) (1) Notes: 1. Definition of Normalized FFO revised to exclude gains/losses on extinguishment of debt - $1.3M in Q2 2013 11
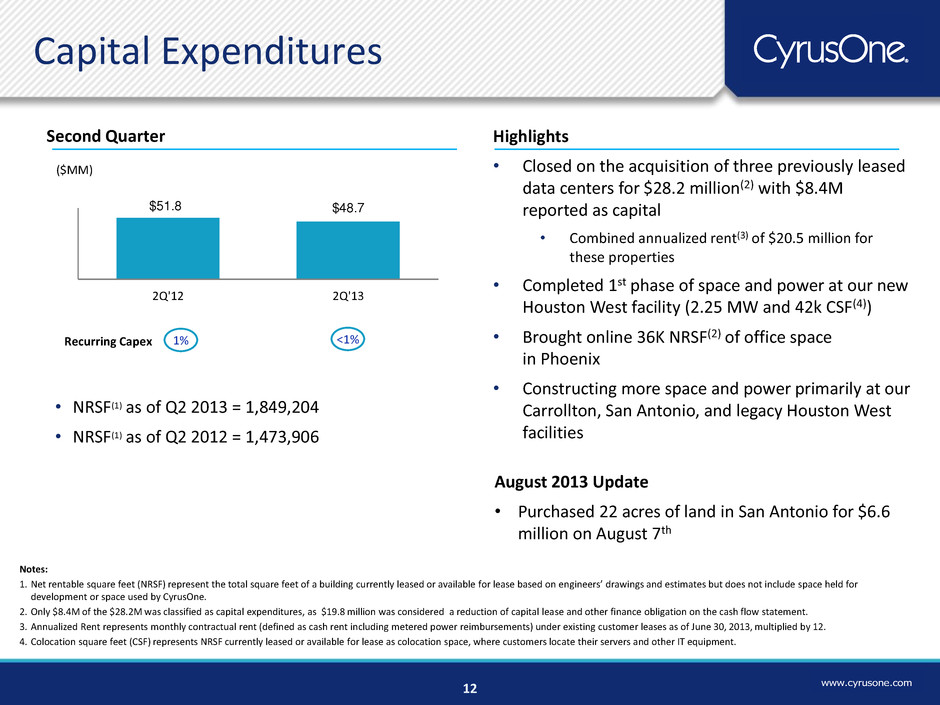
13 29 93 204 223 234 255 153 0 0 116 173 20 157 197 231 240 245 104 203 241 238 235 236 0 116 173 www.cyrusone.com Capital Expenditures (87%) (88%) (88%) (78%) (2) Second Quarter ($MM) $51.8 $48.7 2Q'12 2Q'13 1% Recurring Capex 12 Highlights • Closed on the acquisition of three previously leased data centers for $28.2 million(2) with $8.4M reported as capital • Combined annualized rent(3) of $20.5 million for these properties • Completed 1st phase of space and power at our new Houston West facility (2.25 MW and 42k CSF(4)) • Brought online 36K NRSF(2) of office space in Phoenix • Constructing more space and power primarily at our Carrollton, San Antonio, and legacy Houston West facilities <1% • NRSF(1) as of Q2 2013 = 1,849,204 • NRSF(1) as of Q2 2012 = 1,473,906 August 2013 Update • Purchased 22 acres of land in San Antonio for $6.6 million on August 7th Notes: 1. Net rentable square feet (NRSF) represent the total square feet of a building currently leased or available for lease based on engineers’ drawings and estimates but does not include space held for development or space used by CyrusOne. 2. Only $8.4M of the $28.2M was classified as capital expenditures, as $19.8 million was considered a reduction of capital lease and other finance obligation on the cash flow statement. 3. Annualized Rent represents monthly contractual rent (defined as cash rent including metered power reimbursements) under existing customer leases as of June 30, 2013, multiplied by 12. 4. Colocation square feet (CSF) represents NRSF currently leased or available for lease as colocation space, where customers locate their servers and other IT equipment.
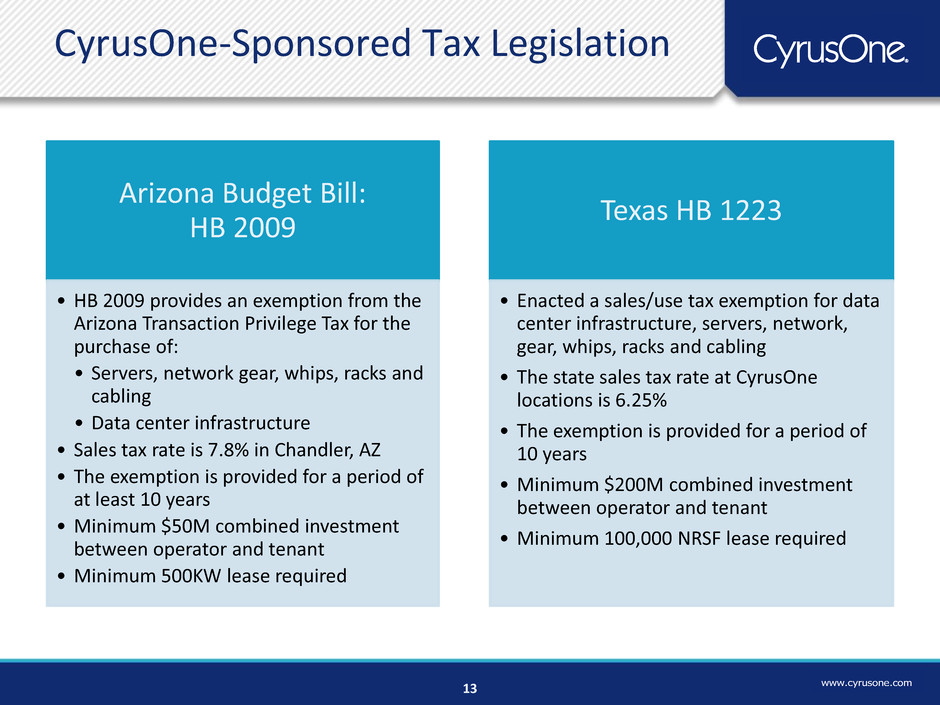
13 29 93 204 223 234 255 153 0 0 116 173 20 157 197 231 240 245 104 203 241 238 235 236 0 116 173 www.cyrusone.com CyrusOne-Sponsored Tax Legislation Arizona Budget Bill: HB 2009 • HB 2009 provides an exemption from the Arizona Transaction Privilege Tax for the purchase of: • Servers, network gear, whips, racks and cabling • Data center infrastructure • Sales tax rate is 7.8% in Chandler, AZ • The exemption is provided for a period of at least 10 years • Minimum $50M combined investment between operator and tenant • Minimum 500KW lease required Texas HB 1223 • Enacted a sales/use tax exemption for data center infrastructure, servers, network, gear, whips, racks and cabling • The state sales tax rate at CyrusOne locations is 6.25% • The exemption is provided for a period of 10 years • Minimum $200M combined investment between operator and tenant • Minimum 100,000 NRSF lease required 13

13 29 93 204 223 234 255 153 0 0 116 173 20 157 197 231 240 245 104 203 241 238 235 236 0 116 173 www.cyrusone.com Net Debt and Market Capitalization 11 June 30, 2013 6.375% Senior Unsecured Notes due 2022 $525.0 Capital lease obligations 19.8 Less: Cash and cash equivalents (267.1) Net debt $277.7 Liquidity $492.1 14 ($MM) Notes: 1. Calculated as net debt as of June 30, 2013 divided by Adjusted EBITDA for the last quarter annualized. $MM (except for Market Prices) Shares or Equivalents Outstanding Market Price as of June 30, 2013 Market Value Equivalents Common Shares 22.1 $20.74 $458.8 Operating Partnership Units 42.6 20.74 883.3 Total Equity Value $1,342.1 Net Debt $277.7 Total Enterprise Value (TEV) $1,619.8 • Net leverage of 2.3x (1) • CyrusOne Inc. paid a dividend of $0.16 per share and share equivalent on July 15, 2013

13 29 93 204 223 234 255 153 0 0 116 173 20 157 197 231 240 245 104 203 241 238 235 236 0 116 173 www.cyrusone.com Guidance Category 2013 Guidance Revenue $260 - $270 Adjusted EBITDA $133 - $137 Normalized FFO per diluted common share or common share equivalent(1) $1.15 - $1.25 Capital Expenditures Development $170 - $180 Recurring $5 - $10 Acquisition of leased facilities(2) $20 - $35 Acquisition of land for future development $20 - $25 15 CyrusOne reaffirms its guidance for the remainder of 2013: ($MM) except per share amounts Notes: 1. Calculated as if all diluted common shares and common share equivalents were issued and outstanding on January 1, 2013. 2. Of the $28.2 million paid for the acquisition of previously leased properties, $8.4 million is presented as capital expenditures in the GAAP cash flow statement with $19.8 million presented as repayment of debt The annual guidance provided above represents forward-looking projections, which are based on current economic conditions, internal assumptions about our existing customer base and the supply and demand dynamics of the markets in which CyrusOne operates. Further, the guidance does not include the impact of any future financing, investment or disposition activities. CyrusOne has revised the definition of Normalized FFO to exclude gains or losses on extinguishment of debt as these are non-recurring charges that are not representative of the ongoing operations and performance of the business
13 29 93 204 223 234 255 153 0 0 116 173 20 157 197 231 240 245 104 203 241 238 235 236 0 116 173 www.cyrusone.com . . See Earnings Release Supplement at www.cyrusone.com for reconciliations of Non-GAAP financial measures
13 29 93 204 223 234 255 153 0 0 116 173 20 157 197 231 240 245 104 203 241 238 235 236 0 116 173 www.cyrusone.com


