First Quarter 2014 Earnings Presentation May 7, 2014
CyrusOne First Quarter 2014 Earnings Presentation www.cyrusone.com 2 Forward-looking statements Safe Harbor This presentation contains forward-looking statements regarding future events and our future results that are subject to the “safe harbor” provisions of the Private Securities Litigation Reform Act of 1995. All statements, other than statements of historical facts, are statements that could be deemed forward-looking statements. These statements are based on current expectations, estimates, forecasts, and projections about the industries in which we operate and the beliefs and assumptions of our management. Words such as “expects,” “anticipates,” “predicts,” “projects,” “intends,” “plans,” “believes,” “seeks,” “estimates,” “continues,” “endeavors,” “strives,” “may,” variations of such words and similar expressions are intended to identify such forward-looking statements. In addition, any statements that refer to projections of our future financial performance, our anticipated growth and trends in our businesses, and other characterizations of future events or circumstances are forward-looking statements. Readers are cautioned these forward-looking statements are based on current expectations and assumptions that are subject to risks and uncertainties, which could cause our actual results to differ materially and adversely from those reflected in the forward- looking statements. Factors that could cause or contribute to such differences include, but are not limited to, those discussed in this release and those discussed in other documents we file with the Securities and Exchange Commission (SEC). More information on potential risks and uncertainties is available in our recent filings with the SEC, including CyrusOne’s Form 10-K and Form 8-Ks. Actual results may differ materially and adversely from those expressed in any forward-looking statements. We undertake no obligation to revise or update any forward-looking statements for any reason.
CyrusOne First Quarter 2014 Earnings Presentation www.cyrusone.com 3 First Quarter 2014 Highlights First quarter revenue of $77.5 million increased 29% over the first quarter of 2013 First quarter Normalized FFO of $27.2 million and AFFO of $27.5 million increased 58% and 57%, respectively, over the first quarter of 2013 First quarter Adjusted EBITDA of $41.7 million increased 32% over the first quarter of 2013 Launched CyrusOne Solutions, a product line tailored to solving unique customer requirements for large-scale and cutting-edge deployments of mission-critical IT assets through innovative engineering solutions Leased a record 100,000 colocation square feet(1), including 41,000 square feet with a custom CyrusOne Solutions data hall build at the Phoenix facility Added six Fortune 1000(2) companies as new customers, increasing total number of Fortune 1000 customers to 135 Note: 1. Colocation square feet (CSF) represents NRSF currently leased or available for lease as colocation space, where customers locate their servers and other IT equipment. Net rentable square feet (NRSF) represents the total square feet of a building currently leased or available for lease, based on engineers’ drawings and estimates but does not include space held for development or space used by CyrusOne. 2. Customer’s ultimate parent is a Fortune 1000 company or a foreign or private company of equivalent size.
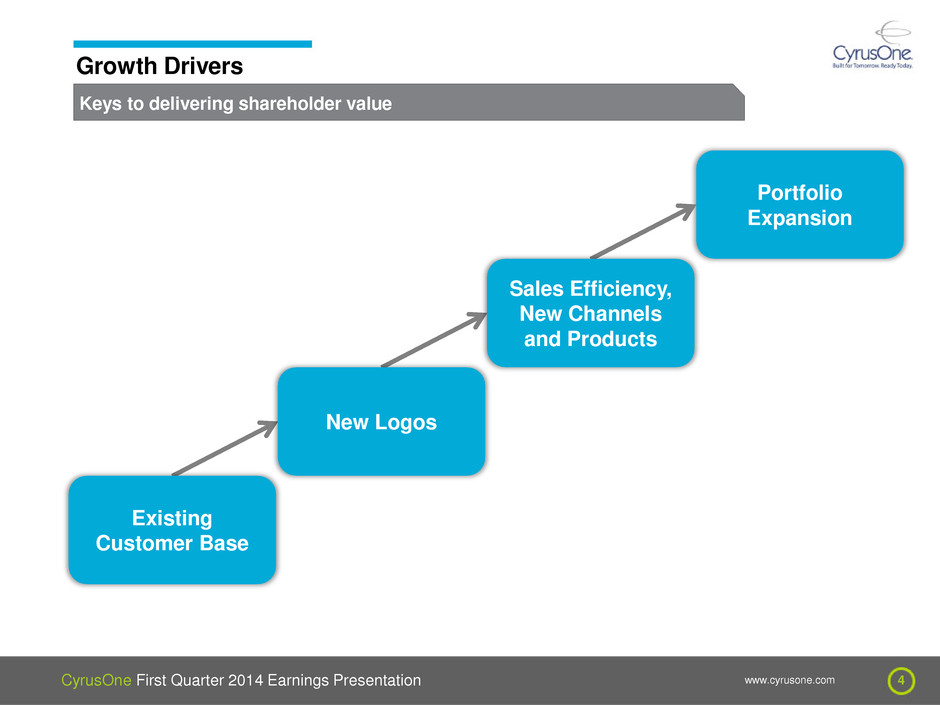
CyrusOne First Quarter 2014 Earnings Presentation www.cyrusone.com 4 Keys to delivering shareholder value Growth Drivers Portfolio Expansion Existing Customer Base New Logos Sales Efficiency, New Channels and Products
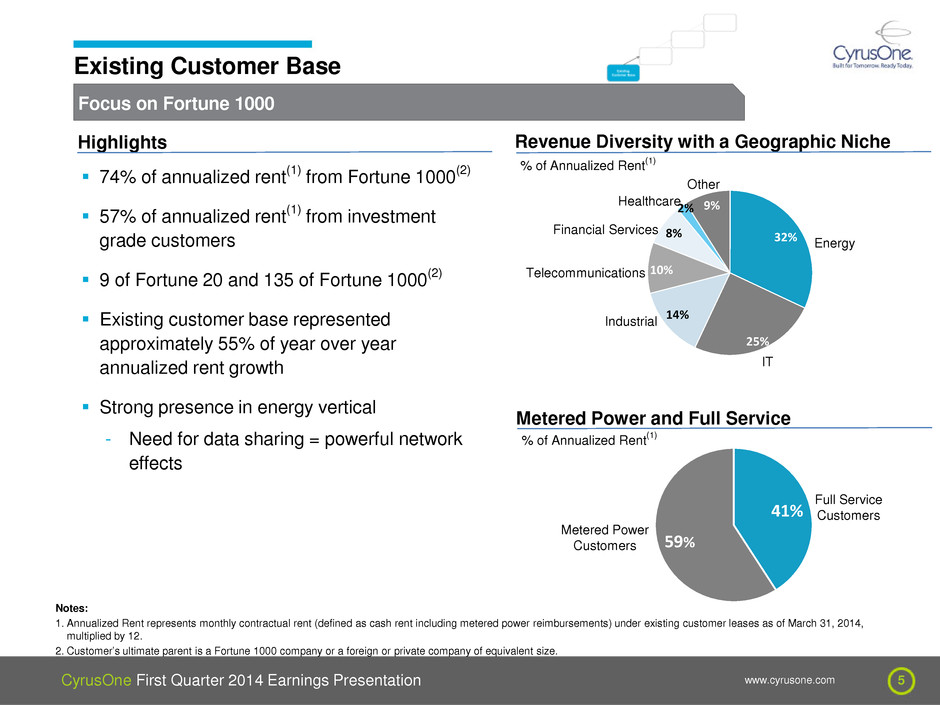
CyrusOne First Quarter 2014 Earnings Presentation www.cyrusone.com 5 Focus on Fortune 1000 Existing Customer Base 32% 25% 14% 10% 8% 2% 9% 41% 59% 74% of annualized rent(1) from Fortune 1000(2) 57% of annualized rent(1) from investment grade customers 9 of Fortune 20 and 135 of Fortune 1000(2) Existing customer base represented approximately 55% of year over year annualized rent growth Strong presence in energy vertical - Need for data sharing = powerful network effects Revenue Diversity with a Geographic Niche Energy Other Telecommunications Financial Services Healthcare IT Full Service Customers Metered Power Customers % of Annualized Rent(1) Metered Power and Full Service % of Annualized Rent(1) Industrial Highlights Notes: 1. Annualized Rent represents monthly contractual rent (defined as cash rent including metered power reimbursements) under existing customer leases as of March 31, 2014, multiplied by 12. 2. Customer’s ultimate parent is a Fortune 1000 company or a foreign or private company of equivalent size.
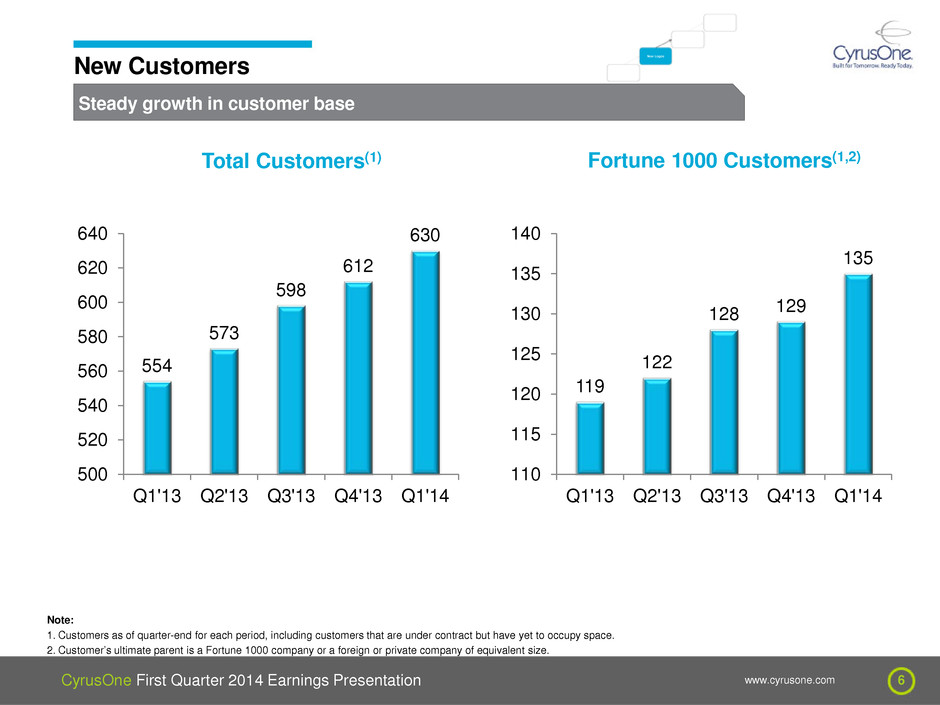
CyrusOne First Quarter 2014 Earnings Presentation www.cyrusone.com 6 Steady growth in customer base New Customers 554 573 598 612 630 Q1'13 Q2'13 Q3'13 Q4'13 Q1'14 500 520 540 560 580 600 620 640 119 122 128 129 135 Q1'13 Q2'13 Q3'13 Q4'13 Q1'14 110 115 120 125 130 135 140 Total Customers(1) Note: 1. Customers as of quarter-end for each period, including customers that are under contract but have yet to occupy space. 2. Customer’s ultimate parent is a Fortune 1000 company or a foreign or private company of equivalent size. Fortune 1000 Customers(1,2)
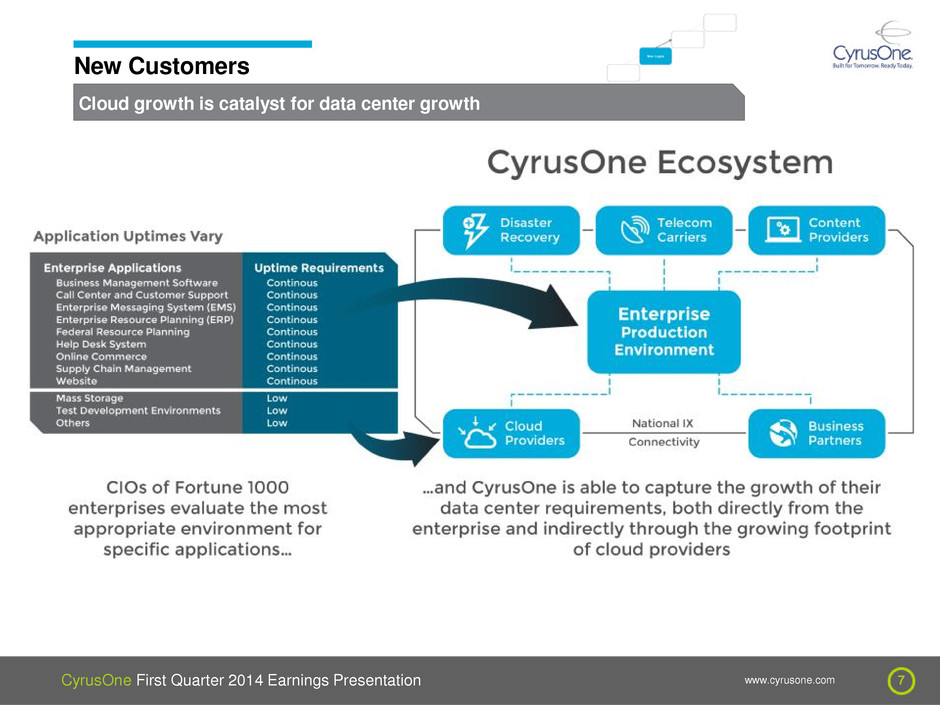
CyrusOne First Quarter 2014 Earnings Presentation www.cyrusone.com 7 Cloud growth is catalyst for data center growth New Customers
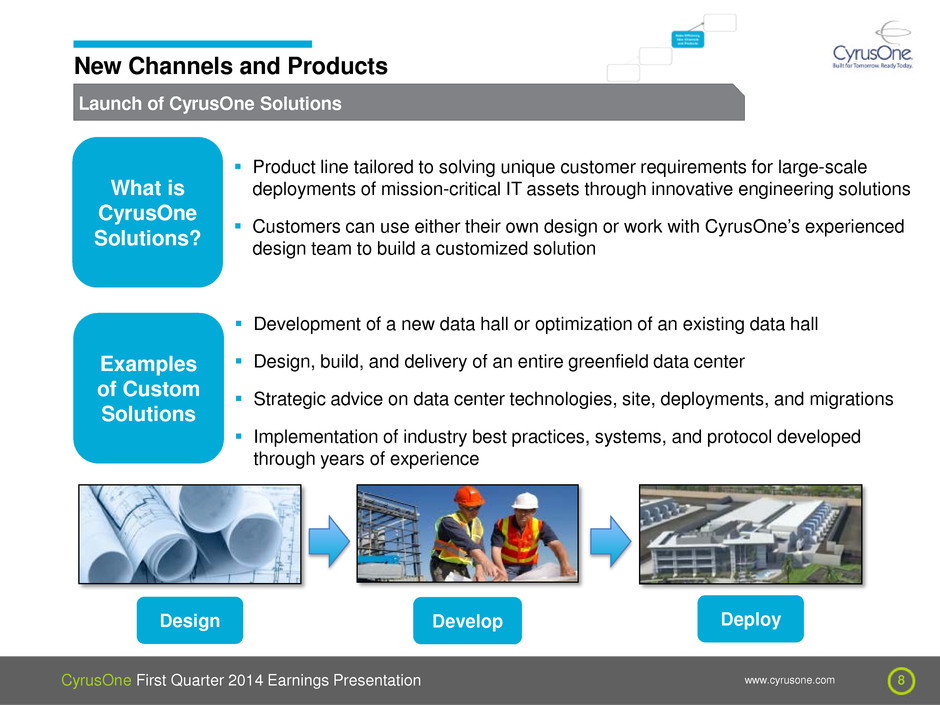
CyrusOne First Quarter 2014 Earnings Presentation www.cyrusone.com 8 Launch of CyrusOne Solutions New Channels and Products What is CyrusOne Solutions? Product line tailored to solving unique customer requirements for large-scale deployments of mission-critical IT assets through innovative engineering solutions Customers can use either their own design or work with CyrusOne’s experienced design team to build a customized solution Examples of Custom Solutions Development of a new data hall or optimization of an existing data hall Design, build, and delivery of an entire greenfield data center Strategic advice on data center technologies, site, deployments, and migrations Implementation of industry best practices, systems, and protocol developed through years of experience Design Develop Deploy
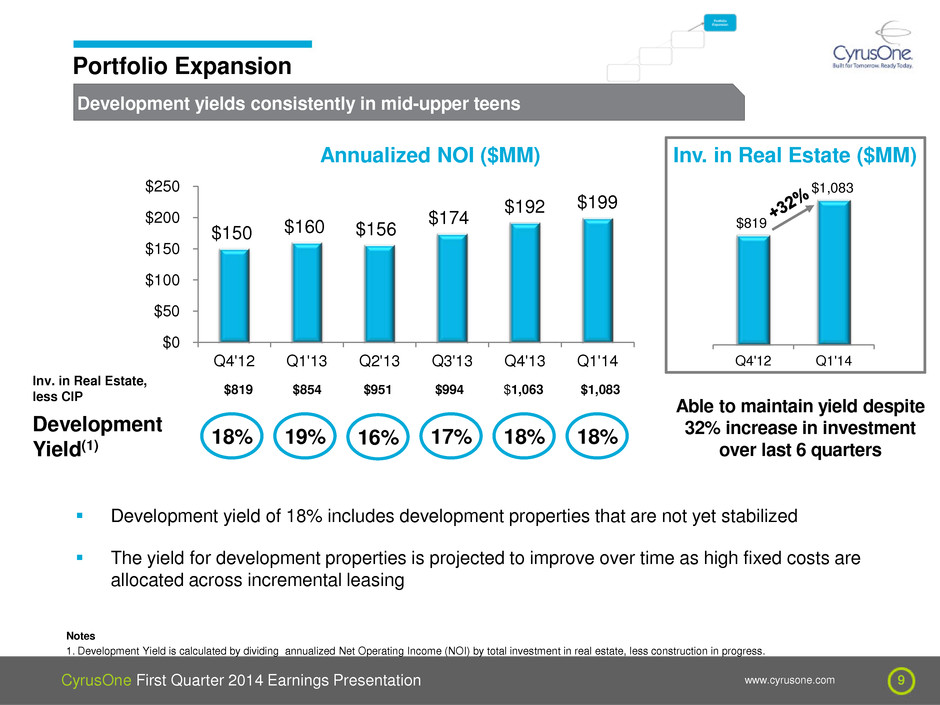
CyrusOne First Quarter 2014 Earnings Presentation www.cyrusone.com 9 16% Development yields consistently in mid-upper teens Portfolio Expansion $150 $160 $156 $174 $192 $199 Q4'12 Q1'13 Q2'13 Q3'13 Q4'13 Q1'14 $0 $50 $100 $150 $200 $250 Annualized NOI ($MM) Development Yield(1) Inv. in Real Estate, less CIP $951 $994 $1,063 17% 18% 18% $1,083 Development yield of 18% includes development properties that are not yet stabilized The yield for development properties is projected to improve over time as high fixed costs are allocated across incremental leasing Notes 1. Development Yield is calculated by dividing annualized Net Operating Income (NOI) by total investment in real estate, less construction in progress. $854 $819 19% 18% Q4'12 Q1'14 $1,083 $819 Able to maintain yield despite 32% increase in investment over last 6 quarters Inv. in Real Estate ($MM)
First Quarter 2014 Financial Review
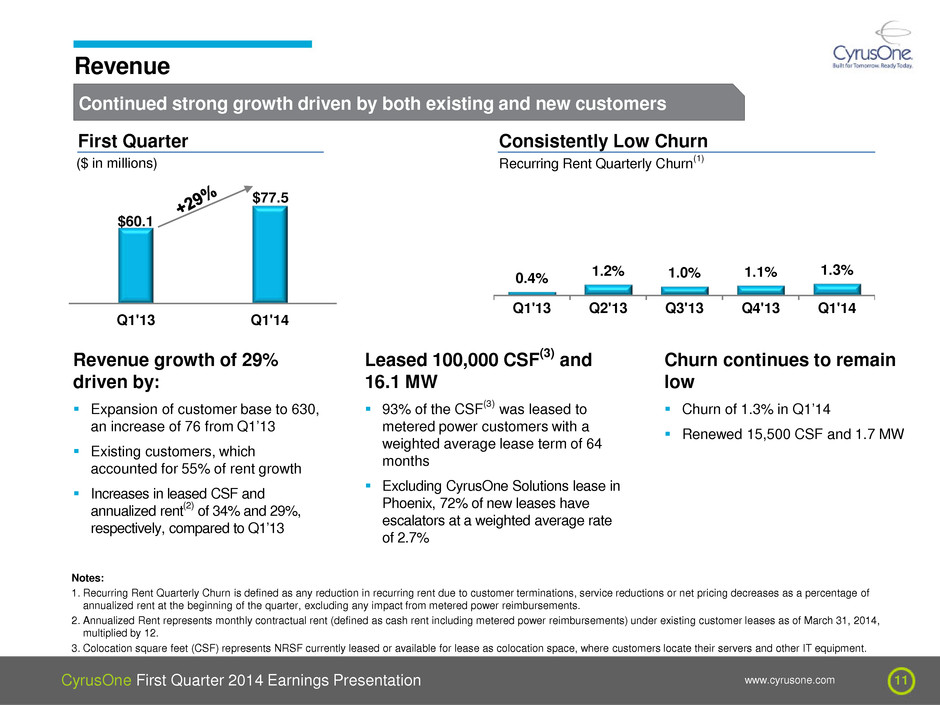
CyrusOne First Quarter 2014 Earnings Presentation www.cyrusone.com 11 $60.1 $77.5 Q1'13 Q1'14 0.4% 1.2% 1.0% 1.1% 1.3% Q1'13 Q2'13 Q3'13 Q4'13 Q1'14 Continued strong growth driven by both existing and new customers Revenue First Quarter ($ in millions) Consistently Low Churn Recurring Rent Quarterly Churn(1) Revenue growth of 29% driven by: Expansion of customer base to 630, an increase of 76 from Q1’13 Existing customers, which accounted for 55% of rent growth Increases in leased CSF and annualized rent(2) of 34% and 29%, respectively, compared to Q1’13 Leased 100,000 CSF(3) and 16.1 MW 93% of the CSF(3) was leased to metered power customers with a weighted average lease term of 64 months Excluding CyrusOne Solutions lease in Phoenix, 72% of new leases have escalators at a weighted average rate of 2.7% Notes: 1. Recurring Rent Quarterly Churn is defined as any reduction in recurring rent due to customer terminations, service reductions or net pricing decreases as a percentage of annualized rent at the beginning of the quarter, excluding any impact from metered power reimbursements. 2. Annualized Rent represents monthly contractual rent (defined as cash rent including metered power reimbursements) under existing customer leases as of March 31, 2014, multiplied by 12. 3. Colocation square feet (CSF) represents NRSF currently leased or available for lease as colocation space, where customers locate their servers and other IT equipment. Churn continues to remain low Churn of 1.3% in Q1’14 Renewed 15,500 CSF and 1.7 MW
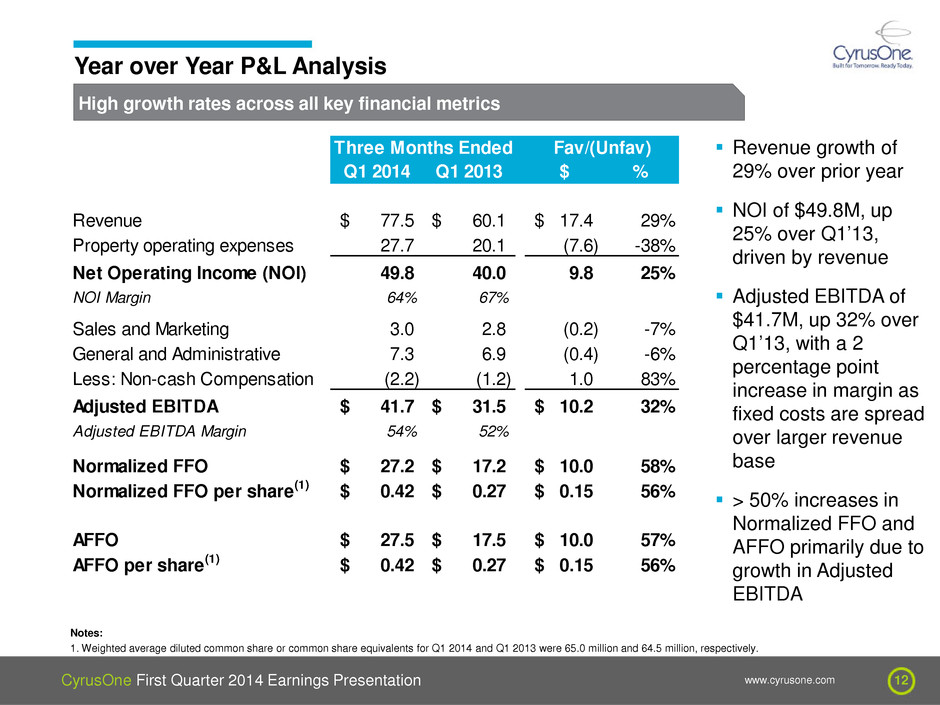
CyrusOne First Quarter 2014 Earnings Presentation www.cyrusone.com 12 High growth rates across all key financial metrics Year over Year P&L Analysis Notes: 1. Weighted average diluted common share or common share equivalents for Q1 2014 and Q1 2013 were 65.0 million and 64.5 million, respectively. Revenue growth of 29% over prior year NOI of $49.8M, up 25% over Q1’13, driven by revenue Adjusted EBITDA of $41.7M, up 32% over Q1’13, with a 2 percentage point increase in margin as fixed costs are spread over larger revenue base > 50% increases in Normalized FFO and AFFO primarily due to growth in Adjusted EBITDA Q1 2014 Q1 2013 $ % Revenue 77.5$ 60.1$ 17.4$ 29% Property operating expenses 27.7 20.1 (7.6) -38% Net Operating Income (NOI) 49.8 40.0 9.8 25% NOI Margin 64% 67% Sales and Marketing 3.0 2.8 (0.2) -7% General and Administrative 7.3 6.9 (0.4) -6% Less: Non-cash Compensation (2.2) (1.2) 1.0 83% Adjusted EBITDA 41.7$ 31.5$ 10.2$ 32% Adjusted EBITDA Margin 54% 52% Normalized FFO 27.2$ 17.2$ 10.0$ 58% Normalized FFO per share(1) 0.42$ 0.27$ 0.15$ 56% AFFO 27.5$ 17.5$ 10.0$ 57% AFFO per share(1) 0.42$ 0.27$ 0.15$ 56% Three Months Ended Fav/(Unfav)
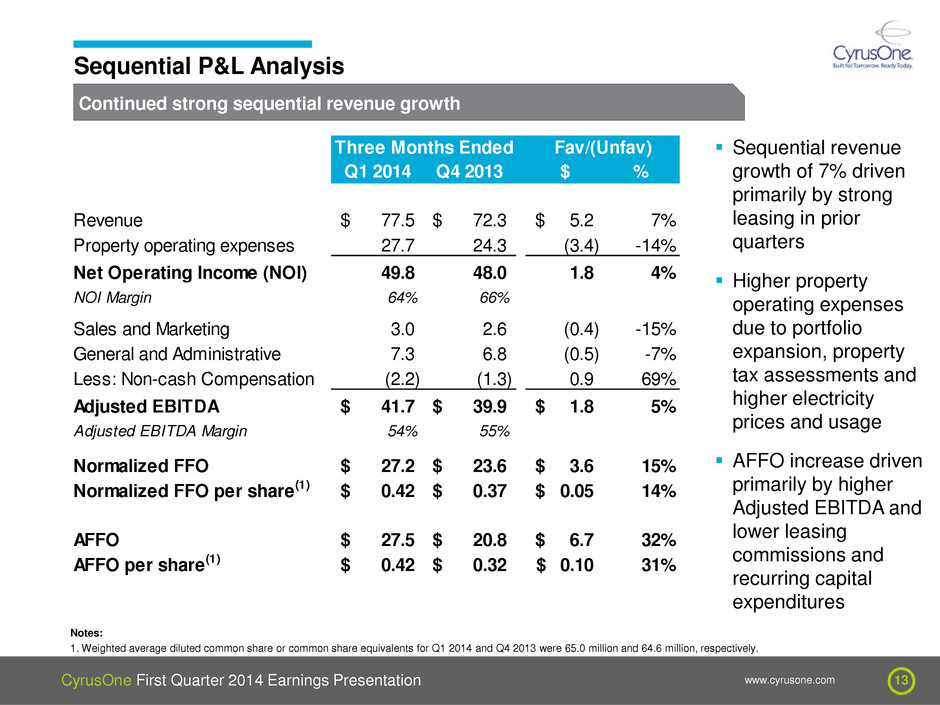
CyrusOne First Quarter 2014 Earnings Presentation www.cyrusone.com 13 Continued strong sequential revenue growth Sequential P&L Analysis Notes: 1. Weighted average diluted common share or common share equivalents for Q1 2014 and Q4 2013 were 65.0 million and 64.6 million, respectively. Sequential revenue growth of 7% driven primarily by strong leasing in prior quarters Higher property operating expenses due to portfolio expansion, property tax assessments and higher electricity prices and usage AFFO increase driven primarily by higher Adjusted EBITDA and lower leasing commissions and recurring capital expenditures Q1 2014 Q4 2013 $ % Revenue 77.5$ 72.3$ 5.2$ 7% Property operating expenses 27.7 24.3 (3.4) -14% Net Operating Income (NOI) 49.8 48.0 1.8 4% NOI Margin 64% 66% Sales and Marketing 3.0 2.6 (0.4) -15% General and Administrative 7.3 6.8 (0.5) -7% Less: Non-cash Compensation (2.2) (1.3) 0.9 69% Adjusted EBITDA 41.7$ 39.9$ 1.8$ 5% Adjusted EBITDA Margin 54% 55% Normalized FFO 27.2$ 23.6$ 3.6$ 15% Normalized FFO per share(1) 0.42$ 0.37$ 0.05$ 14% AFFO 27.5$ 20.8$ 6.7$ 32% AFFO per share(1) 0.42$ 0.32$ 0.10$ 31% Three Months Ended Fav/(Unfav)
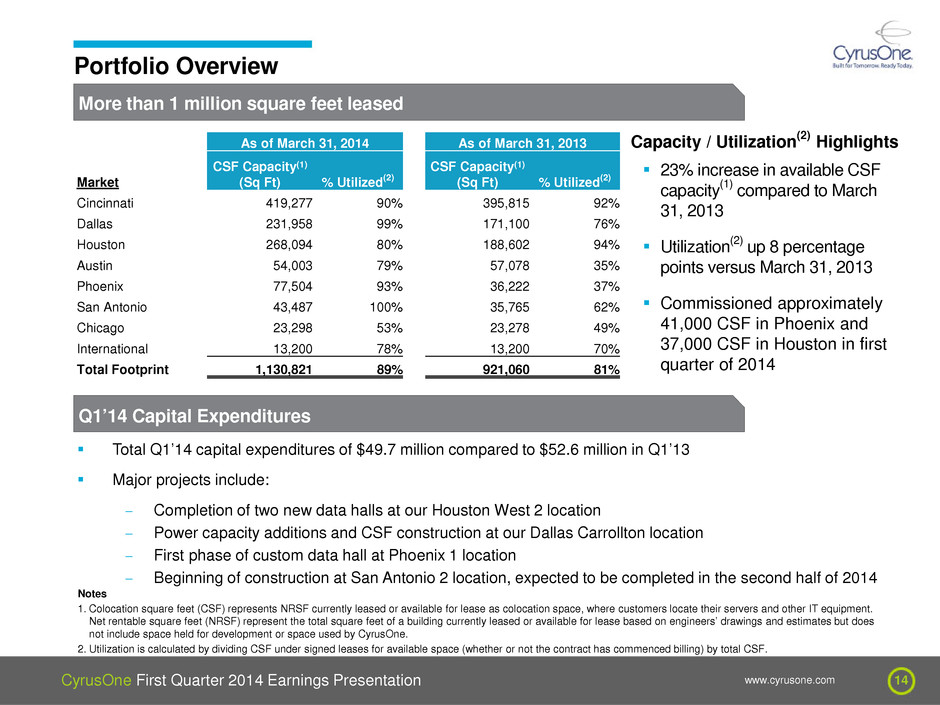
CyrusOne First Quarter 2014 Earnings Presentation www.cyrusone.com 14 More than 1 million square feet leased Portfolio Overview As of March 31, 2014 As of March 31, 2013 Market CSF Capacity(1) (Sq Ft) % Utilized(2) CSF Capacity(1) (Sq Ft) % Utilized(2) Cincinnati 419,277 90% 395,815 92% Dallas 231,958 99% 171,100 76% Houston 268,094 80% 188,602 94% Austin 54,003 79% 57,078 35% Phoenix 77,504 93% 36,222 37% San Antonio 43,487 100% 35,765 62% Chicago 23,298 53% 23,278 49% International 13,200 78% 13,200 70% Total Footprint 1,130,821 89% 921,060 81% Capacity / Utilization(2) Highlights 23% increase in available CSF capacity(1) compared to March 31, 2013 Utilization(2) up 8 percentage points versus March 31, 2013 Commissioned approximately 41,000 CSF in Phoenix and 37,000 CSF in Houston in first quarter of 2014 Q1’14 Capital Expenditures Total Q1’14 capital expenditures of $49.7 million compared to $52.6 million in Q1’13 Major projects include: - Completion of two new data halls at our Houston West 2 location - Power capacity additions and CSF construction at our Dallas Carrollton location - First phase of custom data hall at Phoenix 1 location - Beginning of construction at San Antonio 2 location, expected to be completed in the second half of 2014 Notes 1. Colocation square feet (CSF) represents NRSF currently leased or available for lease as colocation space, where customers locate their servers and other IT equipment. Net rentable square feet (NRSF) represent the total square feet of a building currently leased or available for lease based on engineers’ drawings and estimates but does not include space held for development or space used by CyrusOne. 2. Utilization is calculated by dividing CSF under signed leases for available space (whether or not the contract has commenced billing) by total CSF.
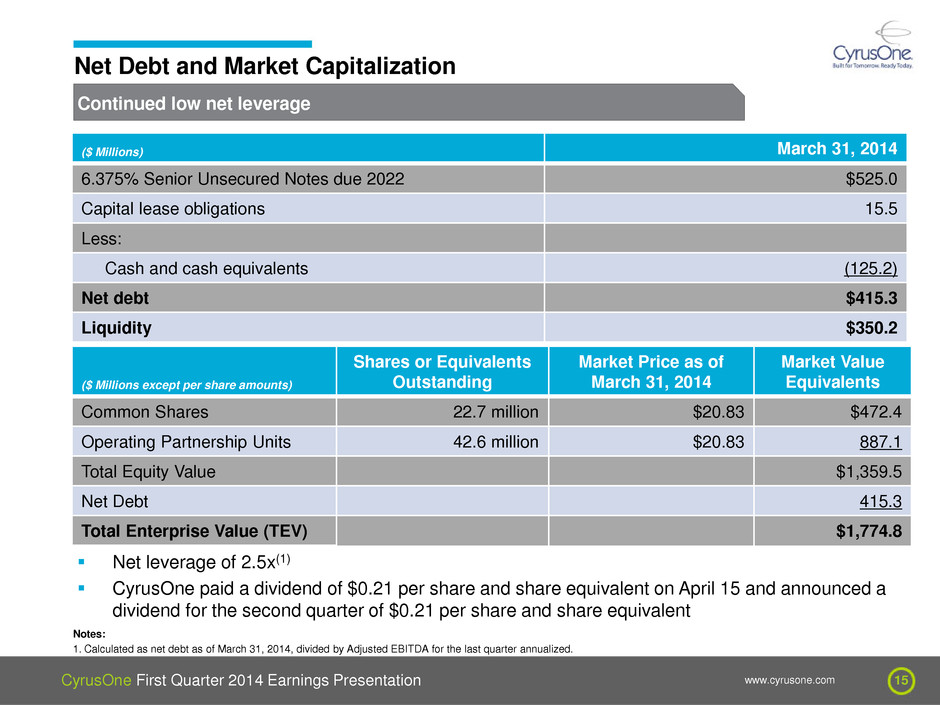
CyrusOne First Quarter 2014 Earnings Presentation www.cyrusone.com 15 Continued low net leverage Net Debt and Market Capitalization ($ Millions except per share amounts) Shares or Equivalents Outstanding Market Price as of March 31, 2014 Market Value Equivalents Common Shares 22.7 million $20.83 $472.4 Operating Partnership Units 42.6 million $20.83 887.1 Total Equity Value $1,359.5 Net Debt 415.3 Total Enterprise Value (TEV) $1,774.8 ($ Millions) March 31, 2014 6.375% Senior Unsecured Notes due 2022 $525.0 Capital lease obligations 15.5 Less: Cash and cash equivalents (125.2) Net debt $415.3 Liquidity $350.2 Net leverage of 2.5x(1) CyrusOne paid a dividend of $0.21 per share and share equivalent on April 15 and announced a dividend for the second quarter of $0.21 per share and share equivalent Notes: 1. Calculated as net debt as of March 31, 2014, divided by Adjusted EBITDA for the last quarter annualized.
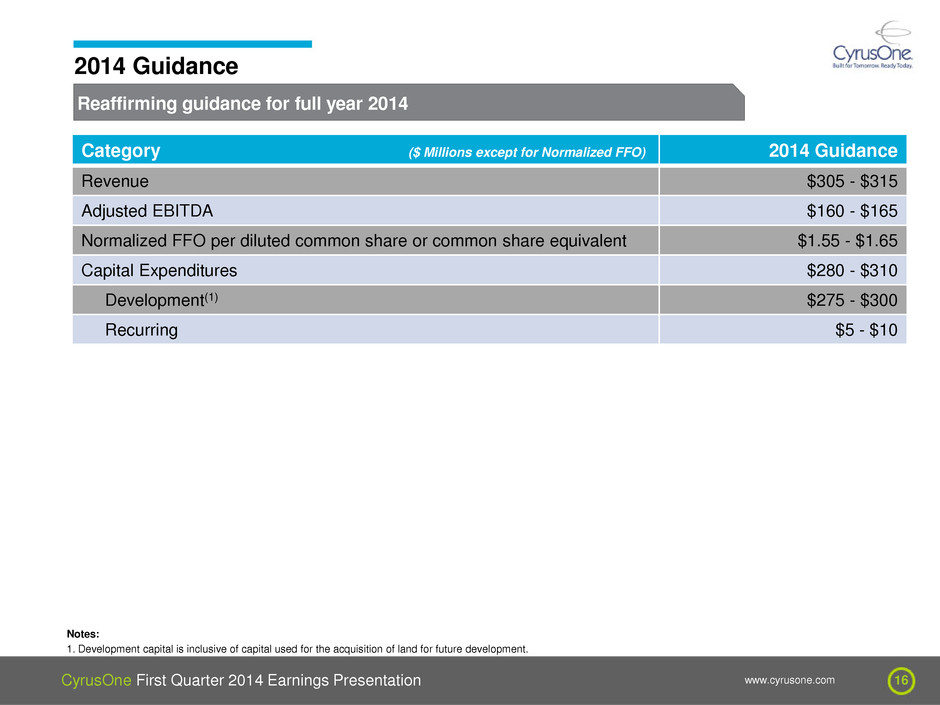
CyrusOne First Quarter 2014 Earnings Presentation www.cyrusone.com 16 Reaffirming guidance for full year 2014 2014 Guidance Category ($ Millions except for Normalized FFO) 2014 Guidance Revenue $305 - $315 Adjusted EBITDA $160 - $165 Normalized FFO per diluted common share or common share equivalent $1.55 - $1.65 Capital Expenditures $280 - $310 Development(1) $275 - $300 Recurring $5 - $10 Notes: 1. Development capital is inclusive of capital used for the acquisition of land for future development.
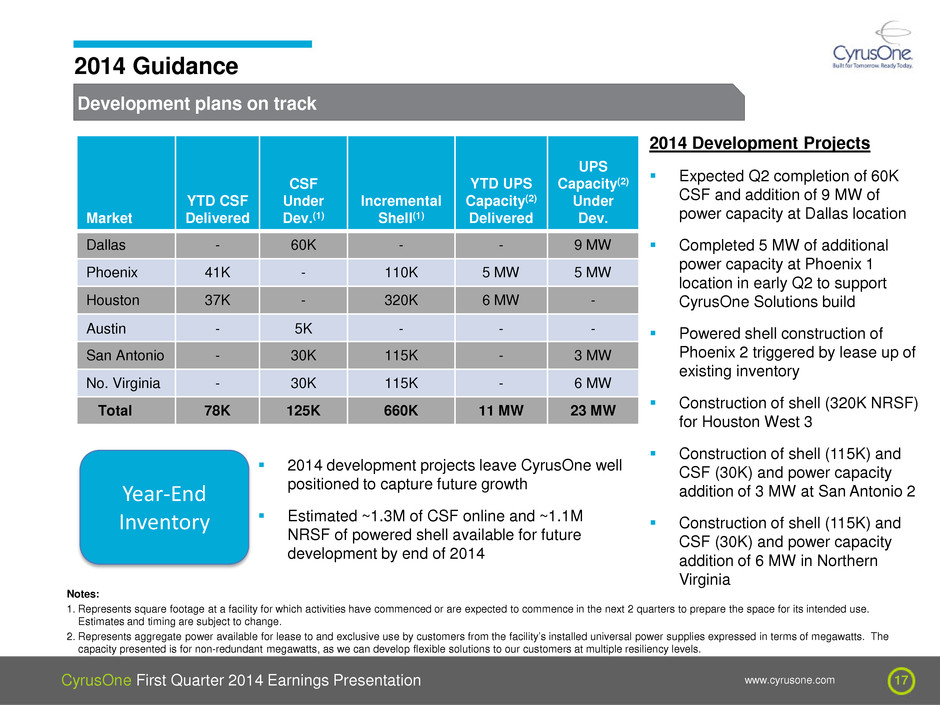
CyrusOne First Quarter 2014 Earnings Presentation www.cyrusone.com 17 Development plans on track 2014 Guidance Market YTD CSF Delivered CSF Under Dev.(1) Incremental Shell(1) YTD UPS Capacity(2) Delivered UPS Capacity(2) Under Dev. Dallas - 60K - - 9 MW Phoenix 41K - 110K 5 MW 5 MW Houston 37K - 320K 6 MW - Austin - 5K - - - San Antonio - 30K 115K - 3 MW No. Virginia - 30K 115K - 6 MW Total 78K 125K 660K 11 MW 23 MW Notes: 1. Represents square footage at a facility for which activities have commenced or are expected to commence in the next 2 quarters to prepare the space for its intended use. Estimates and timing are subject to change. 2. Represents aggregate power available for lease to and exclusive use by customers from the facility’s installed universal power supplies expressed in terms of megawatts. The capacity presented is for non-redundant megawatts, as we can develop flexible solutions to our customers at multiple resiliency levels. 2014 Development Projects Expected Q2 completion of 60K CSF and addition of 9 MW of power capacity at Dallas location Completed 5 MW of additional power capacity at Phoenix 1 location in early Q2 to support CyrusOne Solutions build Powered shell construction of Phoenix 2 triggered by lease up of existing inventory Construction of shell (320K NRSF) for Houston West 3 Construction of shell (115K) and CSF (30K) and power capacity addition of 3 MW at San Antonio 2 Construction of shell (115K) and CSF (30K) and power capacity addition of 6 MW in Northern Virginia Year-End Inventory 2014 development projects leave CyrusOne well positioned to capture future growth Estimated ~1.3M of CSF online and ~1.1M NRSF of powered shell available for future development by end of 2014
Appendix Non-GAAP Reconciliations
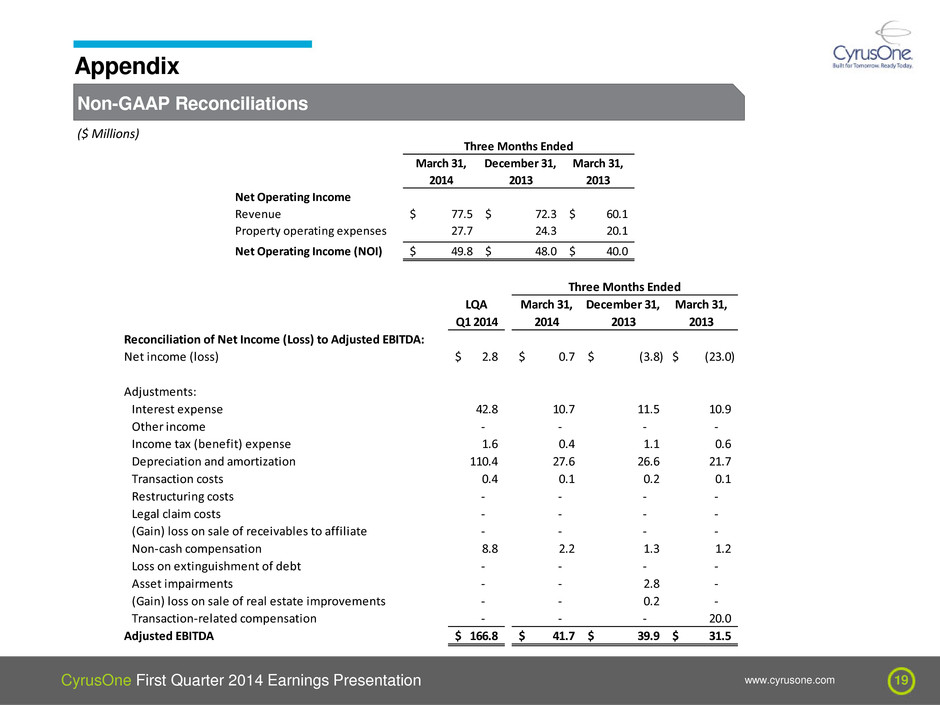
CyrusOne First Quarter 2014 Earnings Presentation www.cyrusone.com 19 Non-GAAP Reconciliations Appendix ($ Millions) LQA Q1 2014 Reconciliation of Net Income (Loss) to Adjusted EBITDA: Net income (loss) 2.8$ 0.7$ (3.8)$ (23.0)$ Adjustments: Interest expense 42.8 10.7 11.5 10.9 Other income - - - - Income tax (benefit) expense 1.6 0.4 1.1 0.6 Depreciation and amortization 110.4 27.6 26.6 21.7 Transaction costs 0.4 0.1 0.2 0.1 Restructuring costs - - - - Legal claim costs - - - - (Gain) loss on sale of receivables to affiliate - - - - Non-cash compensation 8.8 2.2 1.3 1.2 Loss on extinguishment of debt - - - - Asset impairments - - 2.8 - (Gain) loss on sale of real estate improvements - - 0.2 - Transaction-related compensation - - - 20.0 Adjusted EBITDA 166.8$ 41.7$ 39.9$ 31.5$ March 31, 2013 Three Months Ended December 31, 2013 March 31, 2014 Net Operating Income Revenue 77.5$ 72.3$ 60.1$ Property operating expenses 27.7 24.3 20.1 Net Operating Income (NOI) 49.8$ 48.0$ 40.0$ Three Months Ended March 31, 2014 December 31, 2013 March 31, 2013
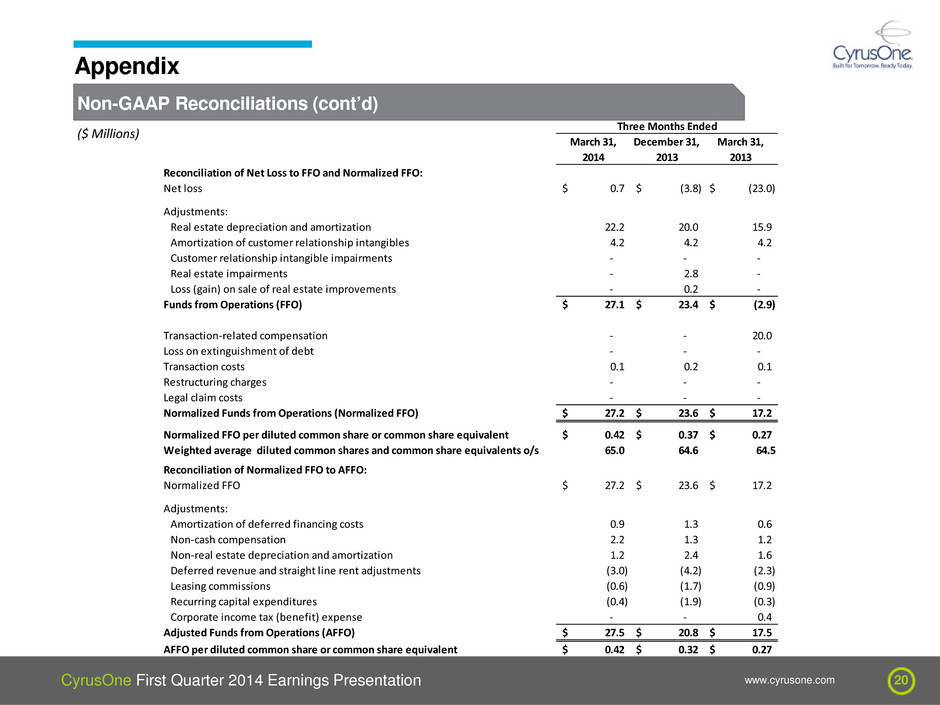
CyrusOne First Quarter 2014 Earnings Presentation www.cyrusone.com 20 Non-GAAP Reconciliations (cont’d) Appendix ($ Millions) Reconciliation of Net Loss to FFO and Normalized FFO: Net loss 0.7$ (3.8)$ (23.0)$ Adjustments: Real estate depreciation and amortization 22.2 20.0 15.9 Amortization of customer relationship intangibles 4.2 4.2 4.2 Customer relationship intangible impairments - - - Real estate impairments - 2.8 - Loss (gain) on sale of real estate improvements - 0.2 - Funds from Operations (FFO) 27.1$ 23.4$ (2.9)$ Transaction-related compensation - - 20.0 Loss on extinguishment of debt - - - Transaction costs 0.1 0.2 0.1 Restructuring charges - - - Legal claim costs - - - Normalized Funds from Operations (Normalized FFO) 27.2$ 23.6$ 17.2$ Normalized FFO per diluted common share or common share equivalent 0.42$ 0.37$ 0.27$ Weighted average diluted common shares and common share equivalents o/s 65.0 64.6 64.5 Reconciliation of Normalized FFO to AFFO: Normalized FFO 27.2$ 23.6$ 17.2$ Adjustments: Amortization of deferred financing costs 0.9 1.3 0.6 Non-cash compensation 2.2 1.3 1.2 Non-real estate depreciation and amortization 1.2 2.4 1.6 Deferred revenue and straight line rent adjustments (3.0) (4.2) (2.3) Leasing commissions (0.6) (1.7) (0.9) Recurring capital expenditures (0.4) (1.9) (0.3) Corporate income tax (benefit) expense - - 0.4 Adjusted Funds from Operations (AFFO) 27.5$ 20.8$ 17.5$ AFFO per diluted common share or common share equivalent 0.42$ 0.32$ 0.27$ March 31, 2014 March 31, 2013 December 31, 2013 Three Months Ended


