Exhibit 99.1
CyrusOne Reports Second Quarter 2015 Earnings
Year-over-Year Normalized FFO Growth of 30% and AFFO Growth of 44%
DALLAS (August 5, 2015) - Global data center service provider CyrusOne Inc. (NASDAQ: CONE), which specializes in providing highly reliable enterprise-class, carrier-neutral data center properties to the Fortune 1000, today announced second quarter 2015 earnings.
Highlights
| |
| • | Second quarter Normalized FFO of $33.4 million and AFFO of $36.5 million increased 30% and 44%, respectively, over the second quarter of 2014 |
| |
| • | Second quarter Adjusted EBITDA of $47.1 million increased 15% over the second quarter of 2014 |
| |
| • | Second quarter revenue of $89.1 million increased 9% over the second quarter of 2014 |
| |
| • | Leased 48,000 colocation square feet totaling $13 million in annualized GAAP revenue, with utilization increasing to 90%, including 98% at Northern Virginia facility brought online in the first quarter and 100% in Phoenix |
| |
| • | Added five Fortune 1000 companies as new customers, increasing the total number of Fortune 1000 customers to 151 as of the end of the quarter |
| |
| • | Subsequent to the end of the quarter, announced the closing of the acquisition of Cervalis |
“Our results this quarter reflect continued strong financial and operating performance, and the success we have had in attracting new Fortune 1000 customers is a validation of our reputation for serving the needs of large enterprises,” said Gary Wojtaszek, president and chief executive officer of CyrusOne. “Our revised guidance highlights the continued strength of our core business as well as the immediate accretion associated with the Cervalis acquisition.”
Second Quarter 2015 Financial Results
Revenue was $89.1 million for the second quarter, compared to $81.7 million for the same period in 2014, an increase of 9%. Operating income of $2.6 million decreased $4.8 million from the second quarter of 2014, driven by an $8.8 million increase in transaction costs primarily related to the Cervalis acquisition, as well as increases in depreciation and amortization of $1.6 million, property operating expenses of $1.0 million, and selling, general and administrative expenses of $0.8 million, partially offset by a $7.4 million increase in revenue. Net loss was $6.5 million for the second quarter, compared to net loss of $3.6 million for the same period in 2014. The $2.9 million increase in net loss was driven by the decrease in operating income, partially offset by a $2.0 million reduction in interest expense.
Net operating income (NOI)1 was $56.3 million for the second quarter, compared to $49.9 million in the same period in 2014, an increase of 13%. The increase in NOI was driven by the increase in revenue, partially offset by additional property operating costs from new facilities and expansions at existing facilities. Adjusted EBITDA2 was $47.1 million for the second quarter, compared to $40.8 million in the same period in 2014, an increase of 15%. The Adjusted EBITDA margin of 52.9% in the second quarter increased from 49.9% in the same period in 2014.
Normalized Funds From Operations (Normalized FFO)3 was $33.4 million for the second quarter, compared to $25.6 million in the same period in 2014, an increase of 30%. The increase in Normalized FFO was driven by the growth in Adjusted EBITDA and the decrease in interest expense, partially offset by a $0.3 million increase in stock-based compensation. Normalized FFO per diluted common share or common share equivalent4 was $0.51 in the second quarter of 2015. Adjusted Funds From Operations (AFFO)5 was $36.5 million for the second quarter, compared to $25.3 million in the same period in 2014, an increase of 44%.
Leasing Activity
CyrusOne leased approximately 48,000 colocation square feet (CSF), or 4.8 MW of power, in the second quarter. Leases signed in the second quarter represent approximately $1.1 million in monthly recurring rent inclusive of the monthly impact of installation charges, or approximately $13 million in annualized contracted GAAP revenue6 excluding estimates for pass-through power. The Company added five new Fortune 10007 customers in the second quarter, bringing the total to 151 customers in the Fortune 1000 and 697 customers in total as of June 30, 2015. The weighted average lease term of the new leases based on square footage is 90 months, and approximately 79% of the CSF was leased to metered customers with the remainder leased on a full service basis. Recurring rent churn8 for the second quarter of 2015 was 0.6%, compared to 1.4% for the second quarter of 2014.
Portfolio Utilization and Development
As of June 30, 2015, CyrusOne had approximately 1,354,000 CSF across 27 facilities, an increase of approximately 160,000, or 13%, from the same period in 2014. CSF utilization9 as of the end of the second quarter was 90%, up from 86% in the same period in 2014. CSF utilization at our Northern Virginia facility, which was commissioned in the first quarter, was 98% as of the end of the second quarter. In the second quarter of 2015, the Company commissioned new data halls at its Carrollton facility in Dallas and its Phoenix 2 facility, adding a total of approximately 92,000 CSF. CyrusOne currently has development projects underway in Austin, Houston, Northern Virginia, and San Antonio that will add 182,000 CSF. Additionally, the Company has begun construction on a new facility in Phoenix that will add 150,000 NRSF.
Balance Sheet and Liquidity
As of June 30, 2015, the Company had $729.8 million of long term debt, cash of $413.5 million, and $245.0 million available under its unsecured revolving credit facility. The cash balance includes $373.3 million in net proceeds from the Company’s June common stock offering. Of the proceeds, $170.3 million was used to acquire 5,995,000 operating partnership units from a subsidiary of Cincinnati Bell on July 1, 2015. In addition, the Company used the remaining $203.0 million of proceeds from the common stock offering to partially finance the acquisition of Cervalis, to pay fees and expenses related to the acquisition, and for general corporate purposes. On July 1, 2015, to complete the Cervalis acquisition, the Company borrowed an additional $150 million under the term loan and closed a private offering of $100 million aggregate principal amount of their 6.375% senior notes due 2022. After giving effect to the additional borrowing on July 1, 2015, the Company had $445.0 million available under its unsecured revolving credit facility.
Dividend and Distribution
On May 7, 2015, the Company announced a dividend and distribution of $0.315 per share of common stock and common stock equivalent for the second quarter of 2015. The dividend and distribution was paid on July 15, 2015, to stockholders of record at the close of business on June 26, 2015.
Additionally, today the Company is announcing a dividend and distribution of $0.315 per share of common stock and common stock equivalent for the third quarter of 2015. The dividend and distribution will be paid on October 15, 2015, to stockholders of record at the close of business on September 25, 2015.
Guidance
CyrusOne is updating guidance for full year 2015, including the impact of the Cervalis acquisition, which closed on July 1.
The annual guidance provided below represents forward-looking statements, which are based on current economic conditions, internal assumptions about the Company's existing customer base and the supply and demand dynamics of the markets in which CyrusOne operates.
|
| | | | | |
| Category | Original 2015 CyrusOne Guidance | Revised 2015 CyrusOne Guidance | 2015 Cervalis Guidance | | 2015 Combined Guidance |
| Total Revenue | $370 - $385 million | $361 - $365 million | $37 - $39 million | | $398 - $404 million |
| Base Revenue | $322 - $332 million | $322 - $325 million | $33 - $34 million | | $355 - $359 million |
| Metered Power Reimbursements | $48 - $53 million | $39 - $40 million | $4 - $5 million | | $43 - $45 million |
| Adjusted EBITDA | $185 - $195 million | $191 - $193 million | $18 - $20 million | | $209 - $213 million |
Normalized FFO per diluted common share or common share equivalent* | $1.90 - $2.00 | — | — | | $2.07 - $2.13 |
| Capital Expenditures | $215 - $240 million | $225 - $235 million | $35 - $40 million | | $260 - $275 million |
Development** | $210 - $230 million | $221 - $227 million | $34 - $38 million | | $255 - $265 million |
| Recurring | $5 - $10 million | $4 - $8 million | $1 - $2 million | | $5 - $10 million |
* Combined guidance assumes weighted average diluted common share or common share equivalents for 2015 of approximately 69.5 million, which includes the impact of the June equity offering.
** Development capital is inclusive of capital used for the acquisition of land for future development.
|
| |
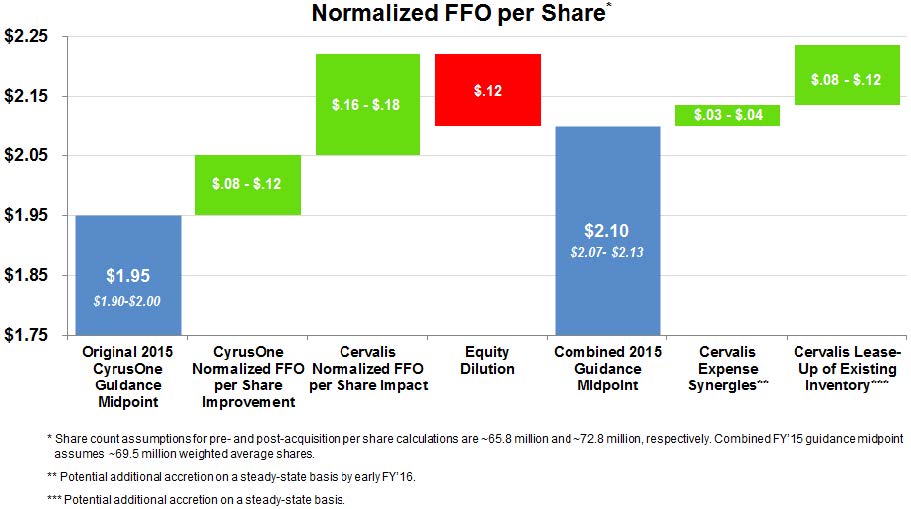
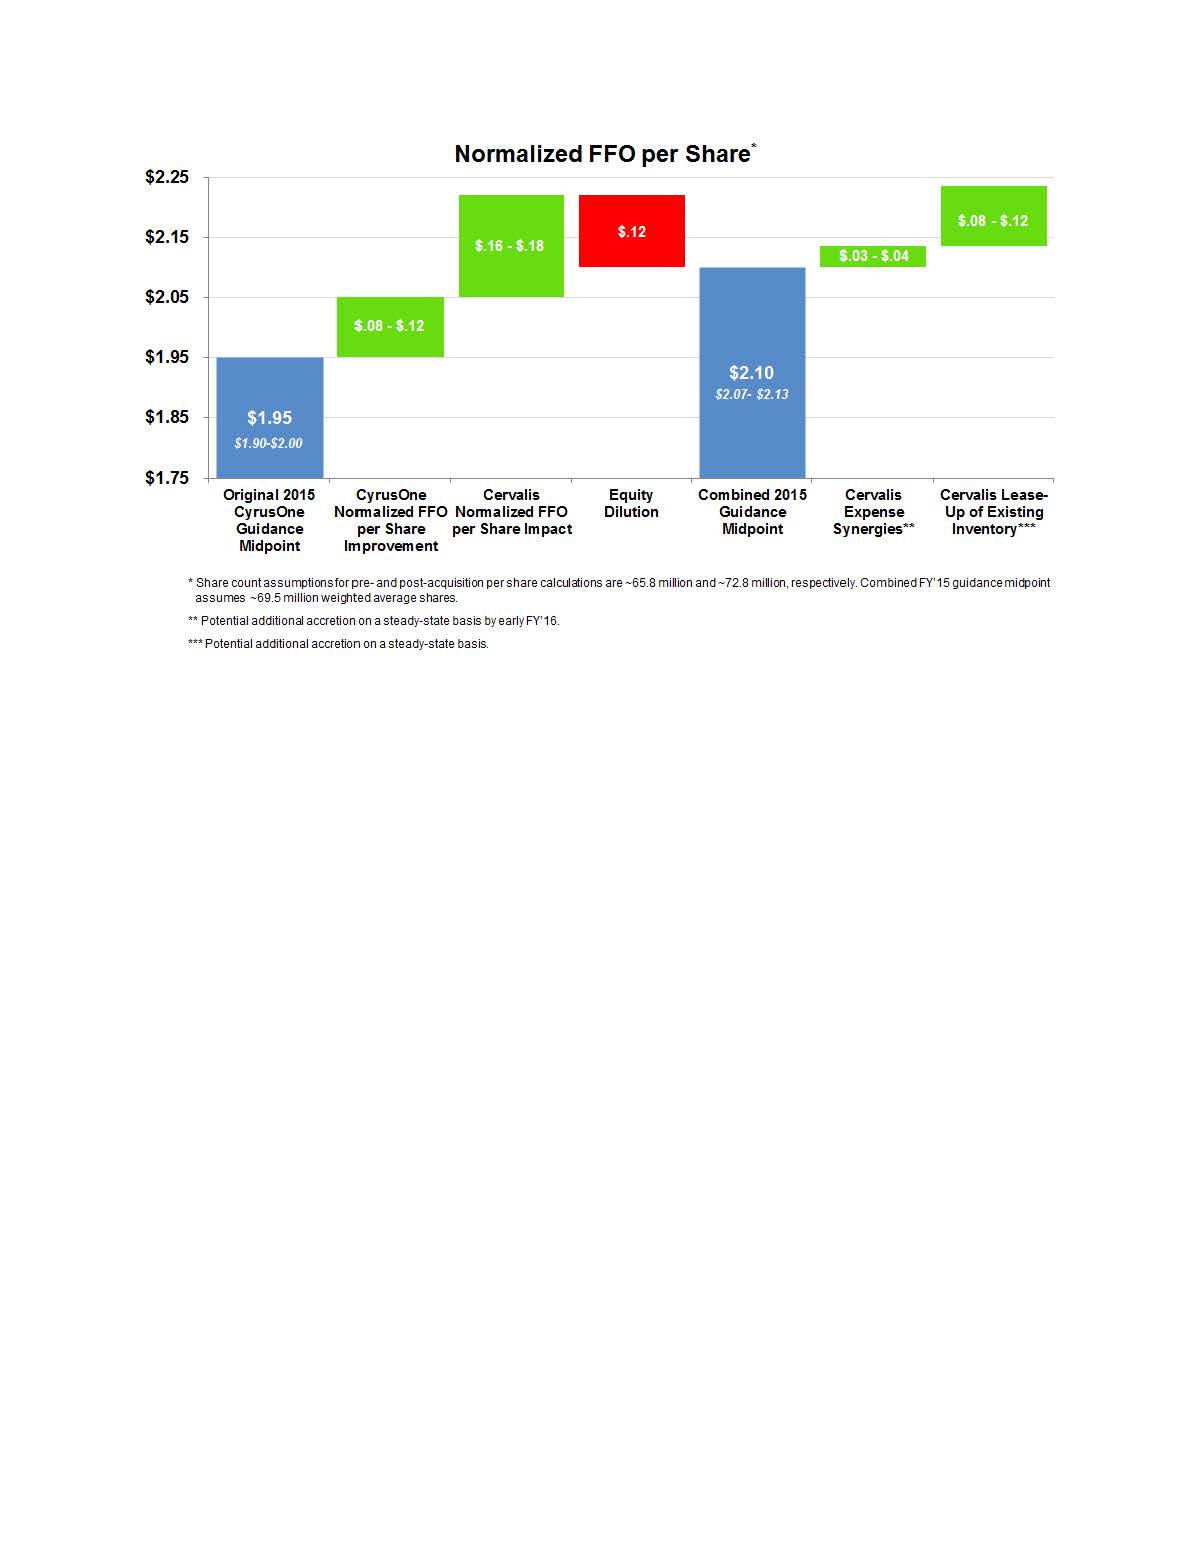
| Normalized FFO per Share* |
| | |
| Original 2015 CyrusOne Guidance Midpoint | $1.95 |
| CyrusOne Normalized FFO per Share Improvement | $.08 - $.12 |
| Cervalis Normalized FFO per Share Impact | $.11 - $.13 |
| Equity Dilution | ($0.07) |
| 2015 Combined Guidance Midpoint | $2.10 |
| | |
| Additional Cervalis Run-Rate Synergy Benefit: | |
| Expense** | $.03 - $.04 |
| Lease-Up of Existing Inventory*** | $.08 - $.12 |
| | |
| *Share count assumptions for pre- and post-acquisition per share calculations |
| are ~65.8 million and ~72.8 million, respectively. Combined FY'15 guidance |
| midpoint assumes ~69.5 million. | |
| **Potential additional accretion on a steady-state basis by early FY'16. |
| ***Potential additional accretion on a steady-state basis. | |
Acquisition of Cervalis
On July 1, 2015, CyrusOne closed the acquisition of Cervalis. Pursuant to the terms of the transaction, a subsidiary of CyrusOne acquired Cervalis for approximately $400 million, excluding transaction-related expenses, in an all cash transaction. The acquisition was financed through proceeds from the Company's common stock and senior notes offerings as well as drawings under its senior unsecured credit facility.
Cervalis is an operator of four Tier 3+ data center facilities and two work area recovery facilities (collectively, the “Facilities”) serving the New York metropolitan area. The Cervalis Facilities currently comprise more than 500,000 gross square feet of space, including more than 130,000 colocation square feet and over 100,000 square feet of work area recovery space. As of the end of the second quarter, 79% of the colocation square feet within the Cervalis Facilities was utilized. In addition to the currently available raised floor space, it currently has capacity under shell to deliver an incremental 50,000 colocation square feet.
In addition to being immediately accretive, the transaction is expected to provide the following strategic benefits to CyrusOne:
| |
| • | Enhanced Geographic Diversification: The combination will greatly enhance CyrusOne’s geographic diversification, establishing a presence in the Northeast with the addition of a platform that includes 4 data centers in the New York metropolitan market. |
| |
| • | Access to a High Quality Enterprise Customer Base: Cervalis serves approximately 220 enterprise customers, with a particular niche servicing some of the world’s largest financial institutions, including several Fortune 1000 companies. Approximately two-thirds of its second quarter 2015 revenue came from customers within the financial services industry. |
| |
| • | Strengthened Product Portfolio: The transaction provides a set of interconnected data centers in one of the world’s largest internet hubs, further enhancing the attractiveness of CyrusOne’s National IX platform. Access to a high-end managed services offering provides a platform that can be selectively leveraged across CyrusOne’s existing customer base to accelerate growth. |
Upcoming Conferences and Events
| |
| • | Cowen Communications Infrastructure Summit on August 12 in Boulder, Colorado |
| |
| • | BofAML Global Real Estate Conference on September 16-17 in New York City |
| |
| • | Morgan Stanley Data Center Corporate Access Day on October 7 in New York City |
| |
| • | Evercore ISI Real Estate Conference on October 8 in New York City |
Conference Call Details
CyrusOne will host a conference call on August 5, 2015, at 12:00 PM Eastern Time (11:00 AM Central Time) to discuss its results for the second quarter of 2015. A live webcast of the conference call will be available under the “Investor Relations” tab in the “Events and Presentations” section of the Company's website at http://investor.cyrusone.com/events.cfm. The U.S. conference call dial-in number is 1-866-652-5200, and the international dial-in number is 1-412-317-6060. A replay will be available one hour after the conclusion of the earnings call on August 5, 2015, until 9:00 AM Eastern Time (8:00 AM Central Time) on August 17, 2015. The U.S. toll-free replay dial-in number is 1-877-344-7529 and the international replay dial-in number is 1-412-317-0088. The replay access code is 10068979.
Safe Harbor
This release and the documents incorporated by reference herein contain forward-looking statements regarding future events and our future results that are subject to the "safe harbor" provisions of the Private Securities Litigation Reform Act of 1995. All statements, other than statements of historical facts, are statements that could be deemed forward-looking statements. These statements are based on current expectations, estimates, forecasts, and projections about the industries in which we operate and the beliefs and assumptions of our management. Words such as "expects," "anticipates," "predicts," "projects," "intends," "plans," "believes," "seeks," "estimates," "continues," "endeavors," "strives," "may," variations of such words and similar expressions are intended to identify such forward-looking statements. In addition, any statements that refer to projections of our future financial performance, our anticipated growth and trends in our businesses, and other characterizations of future events or circumstances are forward-looking statements, including statements about the potential financial and other benefits of our acquisition of Cervalis. Readers are cautioned these forward-looking statements are based on current expectations and assumptions that are subject to risks and uncertainties, which could cause our actual results to differ materially and adversely from those reflected in the forward-looking statements. Factors that could cause or contribute to such differences include, but are not limited to, those discussed in this release, risks related to our acquisition of Cervalis, which include, but are not limited to, the risk that the expected increased revenues, funds from operations, net income and cost savings and other synergies from the transaction may not be fully realized or may take longer to realize than expected, and those discussed in other documents we file with the Securities and Exchange Commission (SEC). More information on potential risks and uncertainties is available in our recent filings with the SEC, including CyrusOne's Form 10-K report, Form 10-Q reports, and Form 8-K reports. Actual results may differ materially and adversely from those expressed in any forward-looking statements. We undertake no obligation to revise or update any forward-looking statements for any reason.
Use of Non-GAAP Financial Measures
This press release contains certain non-GAAP financial measures that management believes are helpful in understanding the Company's business, as further discussed within this press release. These financial measures, which include Funds From Operations, Normalized Funds From Operations, Adjusted EBITDA, Net Operating Income, Adjusted Net Operating Income, and Net Debt should not be construed as being more important than comparable GAAP measures. Detailed reconciliations of these non-GAAP financial measures to comparable GAAP financial measures have been included in the tables that accompany this release and are available in the Investor Relations section of www.cyrusone.com.
Management uses FFO, Normalized FFO, Adjusted EBITDA, NOI, Adjusted NOI, and AFFO as supplemental performance measures because they provide performance measures that, when compared year over year, capture trends in occupancy rates, rental rates and operating costs. The Company also believes that, as widely recognized measures of the performance of real estate investment trusts (REITs) and other companies, these measures will be used by investors as a basis to compare its operating performance with that of other companies. Other companies may not calculate these measures in the same manner, and, as presented, they may not be comparable to others. Therefore, FFO, Normalized FFO, NOI, Adjusted NOI, AFFO and Adjusted EBITDA should be considered only as supplements to net income as measures of our performance. FFO, Normalized FFO, NOI, Adjusted NOI, AFFO and Adjusted EBITDA should not be used as measures of liquidity or as indicative of funds available to fund the Company's cash needs, including the ability to make distributions. These measures also should not be used as substitutes for cash flow from operating activities computed in accordance with U.S. GAAP.
1Net Operating Income (NOI) is defined as revenue less property operating expenses. Amortization of deferred leasing costs is presented in depreciation and amortization, which is excluded from NOI. CyrusOne has not historically incurred any tenant improvement costs. Our sales and marketing costs consist of salaries and benefits for our internal sales staff, travel and entertainment, office supplies, marketing and advertising costs. General and administrative costs include salaries and benefits of our senior management and support functions, legal and consulting costs, and other administrative costs. Marketing and advertising costs are not property-specific, rather these costs support our entire portfolio. As a result, we have excluded these marketing and advertising costs from our NOI calculation, consistent with the treatment of general and administrative costs, which also support our entire portfolio. From time to time, there may be non-recurring costs in property operating expenses, and as a result the Company may present Adjusted Net Operating Income (Adjusted NOI) to exclude the impacts of those costs.
2Adjusted EBITDA is defined as net income (loss) as defined by U.S. GAAP before noncontrolling interests plus interest expense, income tax (benefit) expense, depreciation and amortization, non-cash compensation, transaction costs and transaction-related compensation, including acquisition pursuit costs, restructuring costs, loss on extinguishment of debt, asset impairments, (gain) loss on sale of real estate improvements, and other special items. Other companies may not calculate Adjusted EBITDA in the same manner. Accordingly, the Company's Adjusted EBITDA as presented may not be comparable to others.
3Normalized Funds From Operations (Normalized FFO) is defined as Funds From Operations (FFO) plus transaction costs, including acquisition pursuit costs, transaction-related compensation, (gain) loss on extinguishment of debt, restructuring costs and other special items. FFO is net (loss) income computed in accordance with U.S. GAAP before noncontrolling interests, (gain) loss from sales of real estate improvements, real estate-related depreciation and amortization, amortization of customer relationship intangibles, and real estate and customer relationship intangible impairments. Because the value of the customer relationship intangibles is inextricably connected to the real estate acquired,
CyrusOne believes the amortization and impairments of such intangibles is analogous to real estate depreciation and impairments; therefore, the Company adds the customer relationship intangible amortization and impairments back for similar treatment with real estate depreciation and impairments. CyrusOne's customer relationship intangibles are primarily associated with the acquisition of Cyrus Networks in 2010 and, at the time of acquisition, represented 22% of the value of the assets acquired. The Company believes its Normalized FFO calculation provides a comparable measure to that used by others in the industry.
4Normalized FFO per diluted common share or common share equivalent is defined as Normalized FFO divided by the average diluted common shares and common share equivalents outstanding for the quarter, which were 66,012,745 for the second quarter of 2015.
5Adjusted Funds From Operations (AFFO) is defined as Normalized FFO plus amortization of deferred financing costs, non-cash compensation, and non-real estate depreciation and amortization, less deferred revenue and straight line rent adjustments, leasing commissions, recurring capital expenditures, and non-cash corporate income tax benefit and expense.
6Annualized GAAP revenue is equal to monthly recurring rent, defined as average monthly contractual rent during the term of the lease plus the monthly impact of installation charges, multiplied by 12. It can be shown both inclusive and exclusive of the Company’s estimate of customer reimbursements for metered power.
7Fortune 1000 customers include subsidiaries whose ultimate parent is a Fortune 1000 company or a foreign or private company of equivalent size.
8Recurring rent churn is calculated as any reduction in recurring rent due to customer terminations, service reductions or net pricing decreases as a percentage of rent at the beginning of the period, excluding any impact from metered power reimbursements or other usage-based billing.
9Utilization is calculated by dividing CSF under signed leases for available space (whether or not the contract has commenced billing) by total CSF. Utilization rate differs from percent leased presented in the Data Center Portfolio table because utilization rate excludes office space and supporting infrastructure net rentable square footage and includes CSF for signed leases that have not commenced billing. Management uses utilization rate as a measure of CSF leased.
10Net debt provides a useful measure of liquidity and financial health. The Company defines Net Debt as long-term debt and capital lease obligations, offset by cash, cash equivalents, and temporary cash investments.
11Liquidity is calculated as cash, cash equivalents, and temporary cash investments on hand, plus the undrawn capacity on CyrusOne's revolving credit facility.
About CyrusOne
CyrusOne (NASDAQ: CONE) specializes in highly reliable enterprise-class, carrier-neutral data center properties. The Company provides mission-critical data center facilities that protect and ensure the continued operation of IT infrastructure for more than 900 customers, including nine of the Fortune 20 and 166 of the Fortune 1000 companies.
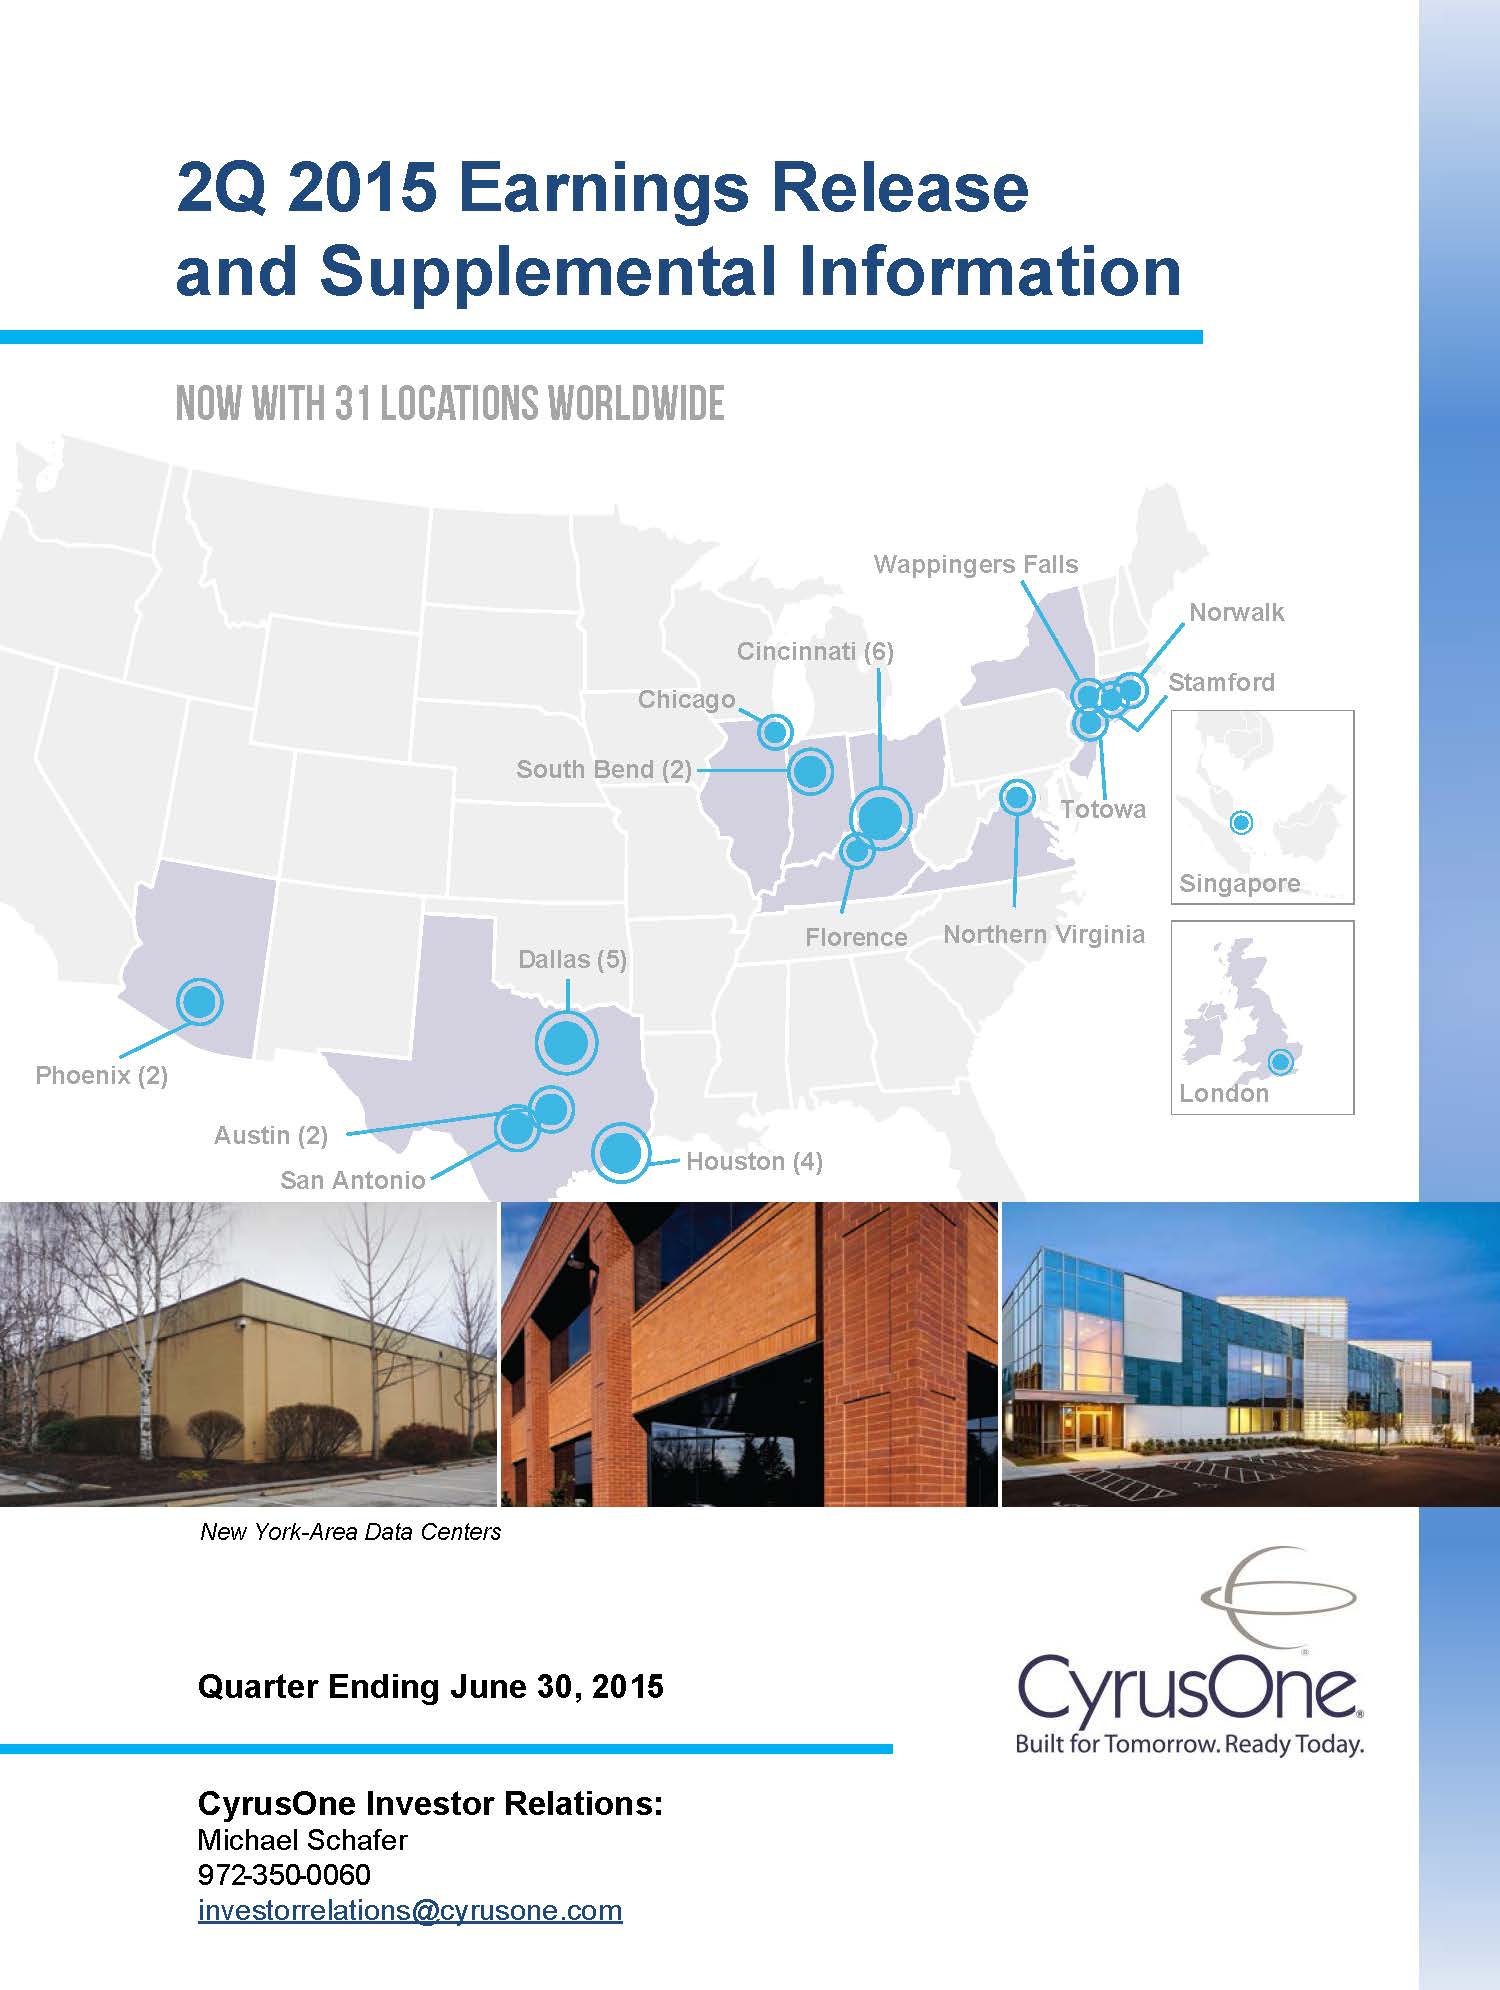
CyrusOne's data center offerings provide the flexibility, reliability, and security that enterprise customers require and are delivered through a tailored, customer service-focused platform designed to foster long-term relationships. CyrusOne is committed to full transparency in communication, management, and service delivery throughout its 31 data centers worldwide.
# # #
Investor Relations:
Michael Schafer
972-350-0060
investorrelations@cyrusone.com
CyrusOne Inc.
Condensed Consolidated Statements of Operations
(Dollars in millions, except per share amounts)
(Unaudited)
|
| | | | | | | | | | | | | | | | | | | | | | | | | | | | | | |
| | | Three Months Ended June 30, | | | | | | Six Months Ended June 30, | | | | |
| | | Change | | Change |
| | | 2015 | | 2014 | | $ | | % | | 2015 | | 2014 | | $ | | % |
| Revenue | | $ | 89.1 |
| | $ | 81.7 |
| | $ | 7.4 |
| | 9 | % | | $ | 174.8 |
| | $ | 159.2 |
| | $ | 15.6 |
| | 10 | % |
| Costs and expenses: | | | | | | | | | | | | | | | | |
| Property operating expenses | | 32.8 |
| | 31.8 |
| | 1.0 |
| | 3 | % | | 65.1 |
| | 59.5 |
| | 5.6 |
| | 9 | % |
| Sales and marketing | | 2.8 |
| | 3.5 |
| | (0.7 | ) | | (20 | )% | | 5.7 |
| | 6.5 |
| | (0.8 | ) | | (12 | )% |
| General and administrative | | 9.9 |
| | 8.4 |
| | 1.5 |
| | 18 | % | | 19.0 |
| | 15.7 |
| | 3.3 |
| | 21 | % |
| Depreciation and amortization | | 31.4 |
| | 29.8 |
| | 1.6 |
| | 5 | % | | 62.5 |
| | 57.4 |
| | 5.1 |
| | 9 | % |
| Transaction costs | | 9.6 |
| | 0.8 |
| | 8.8 |
| | n/m |
| | 9.7 |
| | 0.9 |
| | 8.8 |
| | n/m |
|
| Asset impairments | | — |
| | — |
| | — |
| | — | % | | 8.6 |
| | — |
| | 8.6 |
| | n/m |
|
| Total costs and expenses | | 86.5 |
| | 74.3 |
| | 12.2 |
| | 16 | % | | 170.6 |
| | 140.0 |
| | 30.6 |
| | 22 | % |
| Operating income | | 2.6 |
| | 7.4 |
| | (4.8 | ) | | (65 | )% | | 4.2 |
| | 19.2 |
| | (15.0 | ) | | (78 | )% |
| Interest expense | | 8.7 |
| | 10.7 |
| | (2.0 | ) | | (19 | )% | | 17.1 |
| | 21.4 |
| | 4.3 |
| | 20 | % |
| Net loss before income taxes | | (6.1 | ) | | (3.3 | ) | | (2.8 | ) | | 85 | % | | (12.9 | ) | | (2.2 | ) | | (10.7 | ) | | n/m |
|
| Income tax expense | | (0.4 | ) | | (0.3 | ) | | (0.1 | ) | | 33 | % | | (0.8 | ) | | (0.7 | ) | | (0.1 | ) | | 14 | % |
| Net loss | | (6.5 | ) | | (3.6 | ) | | (2.9 | ) | | 81 | % | | (13.7 | ) | | (2.9 | ) | | (10.8 | ) | | n/m |
|
| Noncontrolling interest in net loss | | (1.0 | ) | | (2.5 | ) | | 1.5 |
| | (60 | )% | | (3.9 | ) | | (2.0 | ) | | (1.9 | ) | | 95 | % |
| Net loss attributed to common stockholders | | $ | (5.5 | ) | | $ | (1.1 | ) | | $ | (4.4 | ) | | n/m |
| | $ | (9.8 | ) | | $ | (0.9 | ) | | $ | (8.9 | ) | | n/m |
|
| Loss per common share - basic and diluted | | $ | (0.11 | ) | | $ | (0.06 | ) | | $ | (0.05 | ) | | n/m |
| | $ | (0.23 | ) | | $ | (0.06 | ) | | $ | (0.17 | ) | | n/m |
|
CyrusOne Inc.
Condensed Consolidated Balance Sheets
(Dollars in millions)
(Unaudited)
|
| | | | | | | | | | | | | | | |
| | | June 30, | | December 31, | | Change |
| | | 2015 | | 2014 | | $ | | % |
| Assets | | | | | | | | |
| Investment in real estate: | | | | | | | | |
| Land | | $ | 93.0 |
| | $ | 89.7 |
| | $ | 3.3 |
| | 4 | % |
| Buildings and improvements | | 824.2 |
| | 812.6 |
| | 11.6 |
| | 1 | % |
| Equipment | | 423.4 |
| | 349.1 |
| | 74.3 |
| | 21 | % |
| Construction in progress | | 125.8 |
| | 127.0 |
| | (1.2 | ) | | (1 | )% |
| Subtotal | | 1,466.4 |
| | 1,378.4 |
| | 88.0 |
| | 6 | % |
| Accumulated depreciation | | (375.4 | ) | | (327.0 | ) | | (48.4 | ) | | 15 | % |
| Net investment in real estate | | 1,091.0 |
| | 1,051.4 |
| | 39.6 |
| | 4 | % |
| Cash and cash equivalents | | 413.5 |
| | 36.5 |
| | 377.0 |
| | n/m |
|
| Rent and other receivables | | 56.3 |
| | 60.9 |
| | (4.6 | ) | | (8 | )% |
| Goodwill | | 276.2 |
| | 276.2 |
| | — |
| | — | % |
| Intangible assets, net | | 61.6 |
| | 68.9 |
| | (7.3 | ) | | (11 | )% |
| Due from affiliates | | 1.7 |
| | 0.8 |
| | 0.9 |
| | 113 | % |
| Other assets | | 91.4 |
| | 91.8 |
| | (0.4 | ) | | — | % |
| Total assets | | $ | 1,991.7 |
| | $ | 1,586.5 |
| | $ | 405.2 |
| | 26 | % |
| Liabilities and Equity | | | | | |
| |
|
| Accounts payable and accrued expenses | | $ | 90.0 |
| | $ | 69.9 |
| | $ | 20.1 |
| | 29 | % |
| Deferred revenue | | 66.5 |
| | 65.7 |
| | 0.8 |
| | 1 | % |
| Due to affiliates | | 174.9 |
| | 7.3 |
| | 167.6 |
| | n/m |
|
| Capital lease obligations | | 12.1 |
| | 13.4 |
| | (1.3 | ) | | (10 | )% |
| Long-term debt | | 729.8 |
| | 659.8 |
| | 70.0 |
| | 11 | % |
| Other financing arrangements | | 52.8 |
| | 53.4 |
| | (0.6 | ) | | (1 | )% |
| Total liabilities | | 1,126.1 |
| | 869.5 |
| | 256.6 |
| | 30 | % |
| Shareholders’ Equity: | |
| | | |
| |
|
| Preferred stock, $.01 par value, 100,000,000 authorized; no shares issued or outstanding | | — |
| | — |
| | — |
| | — | % |
Common stock, $.01 par value, 500,000,000 shares authorized and 66,268,923 and
38,651,517 shares issued and outstanding at June 30, 2015 and December 31, 2014, respectively | | 0.6 |
| | 0.4 |
| | 0.2 |
| | 50 | % |
| Additional paid in capital | | 908.3 |
| | 516.5 |
| | 391.8 |
| | 76 | % |
| Accumulated deficit | | (98.9 | ) | | (55.9 | ) | | (43.0 | ) | | 77 | % |
| Accumulated other comprehensive loss | | (0.3 | ) | | (0.3 | ) | | — |
| | — | % |
| Total shareholders’ equity | | 809.7 |
| | 460.7 |
| | 349.0 |
| | 76 | % |
| Noncontrolling interest | | 55.9 |
| | 256.3 |
| | (200.4 | ) | | (78 | )% |
| Total equity | | 865.6 |
| | 717.0 |
| | 148.6 |
| | 21 | % |
| Total liabilities and shareholders’ equity | | $ | 1,991.7 |
| | $ | 1,586.5 |
| | $ | 405.2 |
| | 26 | % |
CyrusOne Inc.
Condensed Consolidated Statements of Operations
(Dollars in millions, except per share amounts)
(Unaudited)
|
| | | | | | | | | | | | | | | | | | | | |
| For the three months ended: | | June 30, | | March 31, | | December 31, | | September 30, | | June 30, |
| | | 2015 | | 2015 | | 2014 | | 2014 | | 2014 |
| Revenue: | | | | | | | | | | |
| Base revenue | | $ | 78.8 |
| | $ | 75.9 |
| | $ | 75.4 |
| | $ | 73.9 |
| | $ | 71.4 |
|
| Metered Power reimbursements | | 10.3 |
| | 9.8 |
| | 11.5 |
| | 10.9 |
| | 10.3 |
|
| Total revenue | | 89.1 |
| | 85.7 |
| | 86.9 |
| | 84.8 |
| | 81.7 |
|
| Costs and expenses: | | | | | | | | | | |
| Property operating expenses | | 32.8 |
| | 32.3 |
| | 32.0 |
| | 33.0 |
| | 31.8 |
|
| Sales and marketing | | 2.8 |
| | 2.9 |
| | 3.1 |
| | 3.2 |
| | 3.5 |
|
| General and administrative | | 9.9 |
| | 9.1 |
| | 9.9 |
| | 9.0 |
| | 8.4 |
|
| Depreciation and amortization | | 31.4 |
| | 31.1 |
| | 30.6 |
| | 30.0 |
| | 29.8 |
|
| Transaction costs | | 9.6 |
| | 0.1 |
| | 0.1 |
| | — |
| | 0.8 |
|
| Asset impairments | | — |
| | 8.6 |
| | — |
| | — |
| | — |
|
| Total costs and expenses | | 86.5 |
| | 84.1 |
| | 75.7 |
| | 75.2 |
| | 74.3 |
|
| Operating income | | $ | 2.6 |
| | $ | 1.6 |
| | $ | 11.2 |
| | $ | 9.6 |
| | $ | 7.4 |
|
| Interest expense | | 8.7 |
| | 8.4 |
| | 9.1 |
| | 9.0 |
| | 10.7 |
|
| Loss on extinguishment of debt | | — |
| | — |
| | 13.6 |
| | — |
| | — |
|
| Net (loss) income before income taxes | | (6.1 | ) | | (6.8 | ) | | (11.5 | ) | | 0.6 |
| | (3.3 | ) |
| Income tax expense | | (0.4 | ) | | (0.4 | ) | | (0.3 | ) | | (0.4 | ) | | (0.3 | ) |
| Net (loss) income from continuing operations | | (6.5 | ) | | (7.2 | ) |
| (11.8 | ) | | 0.2 |
| | (3.6 | ) |
| Noncontrolling interest in net (loss) income | | (1.0 | ) | | (2.9 | ) | | (4.8 | ) | | 0.1 |
| | (2.5 | ) |
| Net (loss) income attributed to common stockholders | | $ | (5.5 | ) | | $ | (4.3 | ) | | $ | (7.0 | ) | | $ | 0.1 |
| | $ | (1.1 | ) |
| Loss per common share - basic and diluted | | $ | (0.11 | ) | | $ | (0.12 | ) | | $ | (0.19 | ) | | $ | — |
| | $ | (0.06 | ) |
CyrusOne Inc.
Condensed Consolidated Balance Sheets
(Dollars in millions)
(Unaudited)
|
| | | | | | | | | | | | | | | | | | | | |
| | | June 30,
2015 | | March 31, 2015 | | December 31, 2014 | | September 30, 2014 | | June 30, 2014 |
| Assets | | | | | | | | | | |
| Investment in real estate: | | | | | | | | | | |
| Land | | $ | 93.0 |
| | $ | 93.0 |
| | $ | 89.7 |
| | $ | 89.7 |
| | $ | 89.7 |
|
| Buildings and improvements | | 824.2 |
| | 820.8 |
| | 812.6 |
| | 796.6 |
| | 791.7 |
|
| Equipment | | 423.4 |
| | 382.7 |
| | 349.1 |
| | 312.5 |
| | 298.8 |
|
| Construction in progress | | 125.8 |
| | 121.0 |
| | 127.0 |
| | 120.9 |
| | 59.5 |
|
| Subtotal | | 1,466.4 |
| | 1,417.5 |
| | 1,378.4 |
| | 1,319.7 |
| | 1,239.7 |
|
| Accumulated depreciation | | (375.4 | ) | | (350.1 | ) | | (327.0 | ) | | (303.5 | ) | | (280.6 | ) |
| Net investment in real estate | | 1,091.0 |
| | 1,067.4 |
| | 1,051.4 |
| | 1,016.2 |
| | 959.1 |
|
| Cash and cash equivalents | | 413.5 |
| | 26.0 |
| | 36.5 |
| | 30.4 |
| | 49.3 |
|
| Rent and other receivables | | 56.3 |
| | 53.9 |
| | 60.9 |
| | 59.1 |
| | 61.5 |
|
| Goodwill | | 276.2 |
| | 276.2 |
| | 276.2 |
| | 276.2 |
| | 276.2 |
|
| Intangible assets, net | | 61.6 |
| | 65.3 |
| | 68.9 |
| | 73.2 |
| | 77.4 |
|
| Due from affiliates | | 1.7 |
| | 1.4 |
| | 0.8 |
| | 1.3 |
| | 0.5 |
|
| Other assets | | 91.4 |
| | 86.4 |
| | 91.8 |
| | 81.6 |
| | 82.1 |
|
| Total assets | | $ | 1,991.7 |
| | $ | 1,576.6 |
| | $ | 1,586.5 |
| | $ | 1,538.0 |
| | $ | 1,506.1 |
|
| Liabilities and Equity | | | | | | | | | | |
| Accounts payable and accrued expenses | | $ | 90.0 |
| | $ | 67.1 |
| | $ | 69.9 |
| | $ | 100.2 |
| | $ | 83.9 |
|
| Deferred revenue | | 66.5 |
| | 65.5 |
| | 65.7 |
| | 66.1 |
| | 66.7 |
|
| Due to affiliates | | 174.9 |
| | 9.1 |
| | 7.3 |
| | 7.4 |
| | 7.4 |
|
| Capital lease obligations | | 12.1 |
| | 12.6 |
| | 13.4 |
| | 14.2 |
| | 15.0 |
|
| Long-term debt | | 729.8 |
| | 679.8 |
| | 659.8 |
| | 555.0 |
| | 525.0 |
|
| Other financing arrangements | | 52.8 |
| | 51.3 |
| | 53.4 |
| | 55.1 |
| | 57.1 |
|
| Total liabilities | | 1,126.1 |
| | 885.4 |
| | 869.5 |
| | 798.0 |
| | 755.1 |
|
| Shareholders’ Equity: | | | | | | | | | | |
| Preferred stock, $.01 par value, 100,000,000 authorized; no shares issued or outstanding | | — |
| | — |
| | — |
| | — |
| | — |
|
| Common stock, $.01 par value, 500,000,000 shares authorized | | 0.6 |
| | 0.4 |
| | 0.4 |
| | 0.4 |
| | 0.4 |
|
| Additional paid in capital | | 908.3 |
| | 518.9 |
| | 516.5 |
| | 513.7 |
| | 511.1 |
|
| Accumulated deficit | | (98.9 | ) | | (72.5 | ) | | (55.9 | ) | | (40.8 | ) | | (32.7 | ) |
| Accumulated other comprehensive loss | | (0.3 | ) | | (0.6 | ) | | (0.3 | ) | | — |
| | — |
|
| Total shareholders’ equity | | 809.7 |
| | 446.2 |
| | 460.7 |
| | 473.3 |
| | 478.8 |
|
| Noncontrolling interest | | 55.9 |
| | 245.0 |
| | 256.3 |
| | 266.7 |
| | 272.2 |
|
| Total shareholders' equity | | 865.6 |
| | 691.2 |
| | 717.0 |
| | 740.0 |
| | 751.0 |
|
| Total liabilities and shareholders’ equity | | $ | 1,991.7 |
| | $ | 1,576.6 |
| | $ | 1,586.5 |
| | $ | 1,538.0 |
| | $ | 1,506.1 |
|
CyrusOne Inc.
Condensed Consolidated Statements of Cash Flow
(Dollars in millions)
(Unaudited)
|
| | | | | | | | | | | | | | | | |
| | | Six Months Ended June 30, 2015 | | Six Months Ended June 30, 2014 | | Three Months Ended June 30, 2015 | | Three Months Ended June 30, 2014 |
| Cash flows from operating activities: | | | | | | | �� | |
| Net loss | | $ | (13.7 | ) | | $ | (2.9 | ) | | $ | (6.5 | ) | | $ | (3.6 | ) |
| Adjustments to reconcile net loss to net cash provided by operating activities: | | | | | | | | |
| Depreciation and amortization | | 62.5 |
| | 57.4 |
| | 31.4 |
| | 29.8 |
|
| Noncash interest expense | | 1.4 |
| | 1.8 |
| | 0.7 |
| | 0.9 |
|
| Stock-based compensation expense | | 6.2 |
| | 5.0 |
| | 3.2 |
| | 2.8 |
|
| Provision for bad debt write off | | 0.2 |
| | 0.6 |
| | 0.2 |
| | 0.6 |
|
| Asset impairments | | 8.6 |
| | — |
| | — |
| | — |
|
| Change in operating assets and liabilities: | | | | | | | | |
| Rent receivables and other assets | | (7.8 | ) | | (31.4 | ) | | (9.6 | ) | | (24.7 | ) |
| Accounts payable and accrued expenses | | 5.4 |
| | 2.5 |
| | 8.3 |
| | (1.9 | ) |
| Deferred revenues | | 0.8 |
| | 10.8 |
| | 1.0 |
| | 1.9 |
|
| Due to affiliates | | (1.9 | ) | | 0.2 |
| | (0.3 | ) | | 0.3 |
|
| Net cash provided by operating activities | | 61.7 |
| | 44.0 |
| | 28.4 |
| | 6.1 |
|
| Cash flows from investing activities: | | | | | | | | |
| Capital expenditures – acquisitions of real estate | | (17.3 | ) | | — |
| | — |
| | — |
|
| Capital expenditures – other development | | (74.2 | ) | | (116.8 | ) | | (42.3 | ) | | (67.1 | ) |
| Net cash used in investing activities | | (91.5 | ) | | (116.8 | ) | | (42.3 | ) | | (67.1 | ) |
| Cash flows from financing activities: | | | | | |
| | |
| Issuance of common stock | | 799.3 |
| | 355.9 |
| | 799.3 |
| | 355.9 |
|
| Stock issuance costs | | (0.6 | ) | | (0.5 | ) | | (0.6 | ) | | (0.5 | ) |
| Acquisition of operating partnership units | | (426.0 | ) | | (355.9 | ) | | (426.0 | ) | | (355.9 | ) |
| Dividends paid | | (33.8 | ) | | (24.0 | ) | | (20.3 | ) | | (13.6 | ) |
| Borrowings from revolving credit agreement | | 70.0 |
| | — |
| | (1.0 | ) | | — |
|
| Payments on capital leases and other financing arrangements | | (2.1 | ) | | (2.2 | ) | | 50.0 |
| | (0.8 | ) |
| Net cash provided by (used in) financing activities | | 406.8 |
| | (26.7 | ) | | 401.4 |
| | (14.9 | ) |
| Net increase (decrease) in cash and cash equivalents | | 377.0 |
| | (99.5 | ) | | 387.5 |
| | (75.9 | ) |
| Cash and cash equivalents at beginning of period | | 36.5 |
| | 148.8 |
| | 26.0 |
| | 125.2 |
|
| Cash and cash equivalents at end of period | | $ | 413.5 |
| | $ | 49.3 |
| | $ | 413.5 |
| | $ | 49.3 |
|
| | | | | | |
| | |
| | | Six Months Ended June 30, 2015 | | Six Months Ended June 30, 2014 | | Three Months Ended June 30, 2015 | | Three Months Ended June 30, 2014 |
| Supplemental disclosures of cash flow information | | | | | |
| | |
| Cash paid for interest | | $ | 18.5 |
| | $ | 20.5 |
| | $ | 15.7 |
| | $ | 18.9 |
|
| Cash paid for income taxes | | 1.9 |
| | 0.3 |
| | 0.8 |
| | — |
|
| Supplemental disclosures of noncash investing and financing activities | | | | | | | | |
| Capitalized interest | | 2.5 |
| | 0.9 |
| | 1.2 |
| | 0.4 |
|
| Acquisition of property in accounts payable and other liabilities | | 27.2 |
| | 45.0 |
| | 27.2 |
| | 45.0 |
|
| Dividends declared | | 25.3 |
| | 13.7 |
| | 25.3 |
| | 13.7 |
|
| Forward contract for purchase of operating partnership units | | 170.3 |
| | — |
| | 170.3 |
| | — |
|
| Stock issuance costs | | — |
| | 0.8 |
| | — |
| | 0.8 |
|
| Debt issuance costs | | 3.1 |
| | — |
| | 3.1 |
| | — |
|
| Taxes on vesting of shares | | 0.7 |
| | — |
| | 0.7 |
| | — |
|
CyrusOne Inc.
Net Operating Income and Reconciliation of Net Income (Loss) to Adjusted EBITDA
(Dollars in millions)
(Unaudited)
|
| | | | | | | | | | | | | | | | | | | | | | | | | | | | | | | | | | |
| | | Six Months ended | | | | | | Three Months Ended |
| | | June 30, | | Change | | June 30, | | March 31, | | December 31, | | September 30 | | June 30, |
| | | 2015 | | 2014 | | $ | | % | | 2015 | | 2015 | | 2014 | | 2014 | | 2014 |
| Net Operating Income | | | | | | | | | | | | | | | | | | |
| Revenue | | $ | 174.8 |
| | $ | 159.2 |
| | $ | 15.6 |
| | 10% | | $ | 89.1 |
| | $ | 85.7 |
| | $ | 86.9 |
| | $ | 84.8 |
| | $ | 81.7 |
|
| Property operating expenses | | 65.1 |
| | 59.5 |
| | 5.6 |
| | 9% | | 32.8 |
| | 32.3 |
| | 32.0 |
| | 33.0 |
| | 31.8 |
|
| Net Operating Income (NOI) | | 109.7 |
| | 99.7 |
| | 10.0 |
| | 10% | | 56.3 |
| | 53.4 |
| | 54.9 |
| | 51.8 |
| | 49.9 |
|
| Add Back: Lease exit costs | | 0.7 |
| | — |
| | 0.7 |
| | n/m | | — |
| | 0.7 |
| | — |
| | — |
| | — |
|
| Adjusted Net Operating Income (Adjusted NOI) | | $ | 110.4 |
| | $ | 99.7 |
| | $ | 10.7 |
| | 11% | | $ | 56.3 |
| | $ | 54.1 |
| | $ | 54.9 |
| | $ | 51.8 |
| | $ | 49.9 |
|
| Adjusted NOI as a % of Revenue | | 63.2 | % | | 62.6 | % | | | | | | 63.2 | % | | 63.1 | % | | 63.2 | % | | 61.1 | % | | 61.1 | % |
| Reconciliation of Net (Loss) Income to Adjusted EBITDA: | | | | | | | | | | | | | | | | | | |
| Net (loss) income | | (13.7 | ) | | $ | (2.9 | ) | | $ | (10.8 | ) | | n/m | | $ | (6.5 | ) | | $ | (7.2 | ) | | $ | (11.8 | ) | | $ | 0.2 |
| | $ | (3.6 | ) |
| Adjustments: | | | | | | | |
| | | | | | | | 9. | | |
| Interest expense | | 17.1 |
| | 21.4 |
| | (4.3 | ) | | (20)% | | 8.7 |
| | 8.4 |
| | 9.1 |
| | 9.0 |
| | 10.7 |
|
| Income tax expense | | 0.8 |
| | 0.7 |
| | 0.1 |
| | 14% | | 0.4 |
| | 0.4 |
| | 0.3 |
| | 0.4 |
| | 0.3 |
|
| Depreciation and amortization | | 62.5 |
| | 57.4 |
| | 5.1 |
| | 9% | | 31.4 |
| | 31.1 |
| | 30.6 |
| | 30.0 |
| | 29.8 |
|
| Transaction costs | | 9.7 |
| | 0.9 |
| | 8.8 |
| | n/m | | 9.6 |
| | 0.1 |
| | 0.1 |
| | — |
| | 0.8 |
|
| Legal claim costs | | 0.3 |
| | — |
| | 0.3 |
| | | | 0.3 |
| | — |
| | — |
| | — |
| | — |
|
| Stock-based compensation | | 6.2 |
| | 5.0 |
| | 1.2 |
| | 24% | | 3.2 |
| | 3.0 |
| | 2.7 |
| | 2.6 |
| | 2.8 |
|
| Loss on extinguishment of debt | | — |
| | — |
| | — |
| | n/m | | — |
| | — |
| | 13.6 |
| | — |
| | — |
|
| Lease exit costs | | 0.7 |
| | — |
| | 0.7 |
| |
| | — |
| | 0.7 |
| | — |
| | — |
| | — |
|
| Asset impairments | | 8.6 |
| | — |
| | 8.6 |
| | n/m | | — |
| | 8.6 |
| | — |
| | — |
| | — |
|
| Adjusted EBITDA | | $ | 92.2 |
| | $ | 82.5 |
| | $ | 9.7 |
| | 12% | | $ | 47.1 |
| | $ | 45.1 |
| | $ | 44.6 |
| | $ | 42.2 |
| | $ | 40.8 |
|
| Adjusted EBITDA as a % of Revenue | | 52.7 | % | | 51.8 | % | | | | | | 52.9 | % | | 52.6 | % | | 51.3 | % | | 49.8 | % | | 49.9 | % |
CyrusOne Inc.
Reconciliation of Net Income (Loss) to FFO, Normalized FFO, and AFFO
(Dollars in millions)
(Unaudited)
|
| | | | | | | | | | | | | | | | | | | | | | | | | | | | | | | | | | | |
| | | Six Months ended | | | | | | Three Months Ended |
| | | June 30, | | Change | | June 30, 2015 | | March 31, 2015 | | December 31, 2014 | | September 30, 2014 | | June 30, 2014 |
| 2015 | | 2014 | | $ | | % | |
| Reconciliation of Net (Loss) Income to FFO and Normalized FFO: | | | | | | | | | | | | | | | | | | |
| Net (loss) income | | $ | (13.7 | ) | | $ | (2.9 | ) | | $ | (10.8 | ) | | n/m |
| | $ | (6.5 | ) | | $ | (7.2 | ) | | $ | (11.8 | ) | | $ | 0.2 |
| | $ | (3.6 | ) |
| Adjustments: | | | | | | | | | | | | | | | | | | |
| Real estate depreciation and amortization | | 52.3 |
| | 46.3 |
| | 6.0 |
| | 13 | % | | 26.3 |
| | 26.0 |
| | 25.1 |
| | 24.5 |
| | 24.1 |
|
| Amortization of customer relationship intangibles | | 7.3 |
| | 8.5 |
| | (1.2 | ) | | (14 | )% | | 3.7 |
| | 3.6 |
| | 4.2 |
| | 4.2 |
| | 4.3 |
|
| Real estate impairments | | 8.6 |
| | — |
| | 8.6 |
| | n/m |
| | — |
| | 8.6 |
| | — |
| | — |
| | — |
|
| Funds from Operations (FFO) | | $ | 54.5 |
| | $ | 51.9 |
| | $ | 2.6 |
| | 5 | % | | $ | 23.5 |
| | $ | 31.0 |
| | $ | 17.5 |
| | $ | 28.9 |
| | $ | 24.8 |
|
| Loss on extinguishment of debt | | — |
| | — |
| | — |
| | n/m |
| | — |
| | — |
| | 13.6 |
| | — |
| | — |
|
| Transaction costs | | 9.7 |
| | 0.9 |
| | 8.8 |
| | n/m |
| | 9.6 |
| | 0.1 |
| | 0.1 |
| | — |
| | 0.8 |
|
| Legal claim costs | | 0.3 |
| | — |
| | 0.3 |
| | n/m |
| | 0.3 |
| | — |
| | — |
| | — |
| | — |
|
| Lease exit costs | | 0.8 |
| | — |
| | 0.8 |
| | n/m |
| | — |
| | 0.8 |
| | — |
| | — |
| | — |
|
| Normalized Funds from Operations (Normalized FFO) | | $ | 65.3 |
| | $ | 52.8 |
| | $ | 12.5 |
| | 24 | % | | $ | 33.4 |
| | $ | 31.9 |
| | $ | 31.2 |
| | $ | 28.9 |
| | $ | 25.6 |
|
| Normalized FFO per diluted common share or common share equivalent | | $ | 0.99 |
| | $ | 0.81 |
| | $ | 0.18 |
| | 22 | % | | $ | 0.50 |
| | $ | 0.49 |
| | $ | 0.48 |
| | $ | 0.44 |
| | $ | 0.39 |
|
| Weighted Average diluted common share and common share equivalent outstanding | | 65.7 |
| | 65.2 |
| | 0.5 |
| | 1 | % | | 66.0 |
| | 65.5 |
| | 65.3 |
| | 65.3 |
| | 65.3 |
|
| Reconciliation of Normalized FFO to AFFO: | | | | | | | | | | | | | | | | | | |
| Normalized FFO | | $ | 65.3 |
| | $ | 52.8 |
| | $ | 12.5 |
| | 24 | % | | $ | 33.4 |
| | $ | 31.9 |
| | $ | 31.2 |
| | $ | 28.9 |
| | $ | 25.6 |
|
| Adjustments: | | | | | | | | | | | | | | | | | | |
| Amortization of deferred financing costs | | 1.4 |
| | 1.8 |
| | (0.4 | ) | | (22 | )% | | 0.7 |
| | 0.7 |
| | 0.7 |
| | 0.9 |
| | 0.9 |
|
| Stock-based compensation | | 6.1 |
| | 5.0 |
| | 1.1 |
| | 22 | % | | 3.1 |
| | 3.0 |
| | 2.7 |
| | 2.6 |
| | 2.8 |
|
| Non-real estate depreciation and amortization | | 2.9 |
| | 2.6 |
| | 0.3 |
| | 12 | % | | 1.4 |
| | 1.5 |
| | 1.4 |
| | 1.2 |
| | 1.4 |
|
| Deferred revenue and straight line rent adjustments | | (1.7 | ) | | (6.7 | ) | | 5.0 |
| | (75 | )% | | (0.3 | ) | | (1.4 | ) | | (2.3 | ) | | (1.5 | ) | | (3.7 | ) |
| Leasing commissions | | (2.0 | ) | | (2.0 | ) | | — |
| | — | % | | (1.5 | ) | | (0.5 | ) | | (2.9 | ) | | (0.9 | ) | | (1.4 | ) |
| Recurring capital expenditures | | (0.5 | ) | | (0.7 | ) | | 0.2 |
| | (29 | )% | | (0.3 | ) | | (0.2 | ) | | (1.0 | ) | | (2.1 | ) | | (0.3 | ) |
| Adjusted Funds from Operations (AFFO) | | $ | 71.5 |
| | $ | 52.8 |
| | $ | 18.7 |
| | 35 | % | | $ | 36.5 |
| | $ | 35.0 |
| | $ | 29.8 |
| | $ | 29.1 |
| | $ | 25.3 |
|
CyrusOne Inc.
Colocation Square Footage (CSF) and Utilization
(Unaudited)
|
| | | | | | | | | | | | | | | | | | |
| | | As of June 30, 2015 | | As of December 31, 2014 | | As of June 30, 2014 |
| Market | | Colocation
Space (CSF)(a) | | CSF
Utilized(b) | | Colocation
Space (CSF)(a) | | CSF
Utilized(b) | | Colocation
Space (CSF)(a) | | CSF
Utilized(b) |
| Cincinnati | | 420,223 |
| | 91 | % | | 420,223 |
| | 90 | % | | 419,301 |
| | 90 | % |
| Dallas | | 350,946 |
| | 85 | % | | 294,969 |
| | 86 | % | | 294,873 |
| | 78 | % |
| Houston | | 255,094 |
| | 86 | % | | 255,094 |
| | 85 | % | | 268,094 |
| | 88 | % |
| Phoenix | | 149,620 |
| | 100 | % | | 114,026 |
| | 100 | % | | 77,528 |
| | 98 | % |
| Austin | | 59,995 |
| | 94 | % | | 59,995 |
| | 87 | % | | 54,003 |
| | 84 | % |
| San Antonio | | 43,843 |
| | 100 | % | | 43,843 |
| | 100 | % | | 43,843 |
| | 100 | % |
| Northern Virginia | | 37,485 |
| | 98 | % | | — |
| | n/a |
| | — |
| | n/a |
|
| Chicago | | 23,298 |
| | 55 | % | | 23,298 |
| | 58 | % | | 23,298 |
| | 53 | % |
| International | | 13,200 |
| | 80 | % | | 13,200 |
| | 80 | % | | 13,200 |
| | 80 | % |
| Total Footprint | | 1,353,704 |
| | 90 | % | | 1,224,648 |
| | 88 | % | | 1,194,140 |
| | 86 | % |
| |
| (a) | CSF represents the NRSF at an operating facility that is currently leased or readily available for lease as colocation space, where customers locate their servers and other IT equipment. |
| |
| (b) | Utilization is calculated by dividing CSF under signed leases for colocation space (whether or not the customer has occupied the space) by total CSF. |
CyrusOne Inc.
2015 Guidance
|
| | | | |
| Category | Original 2015 CyrusOne Guidance | Revised 2015 CyrusOne Guidance | 2015 Cervalis Guidance | 2015 Combined Guidance |
| Total Revenue | $370 - $385 million | $361 - $365 million | $37 - $39 million | $398 - $404 million |
| Base Revenue | $322 - $332 million | $322 - $325 million | $33 - $34 million | $355 - $359 million |
| Metered Power Reimbursements | $48 - $53 million | $39 -$40 million | $4 - $5 million | $43 - $45 million |
| Adjusted EBITDA | $185 - $195 million | $191 - $193 million | $18 - $20 million | $209 -$213 million |
| Normalized FFO per diluted common share or common share equivalent* | $1.90 - $2.00 | - | - | $2.07 - $2.13 |
| Capital Expenditures | $215 - $240 million | $225 - $235 million | $35 - $40 million | $260 - $275 million |
Development** | $210 - $230 million | $221 - $227 million | $34 - $38 million | $255 -$265 million |
| Recurring | $5 - $10 million | $4 -$8 million | $1 -$2 million | $5 -$10 million |
|
| |
| * | Combined guidance assumes weighted average diluted common share or common share equivalents for 2015 of ~69.5 million, which includes the impact of the June equity offering. |
| ** | Development capital is inclusive of capital used for the acquisition of land for future development |
CyrusOne Inc.
Data Center Portfolio
As of June 30, 2015
(Unaudited)
|
| | | | | | | | | | | | | | | | | | | | | | | | | | | | | | | | |
| | | | | | Operating Net Rentable Square Feet (NRSF)(a) | Powered Shell Available for Future Development (NRSF)(j) | | Available UPS Capacity (MW)(k) |
| Facilities | Metro Area | | Annualized Rent(b) | | Colocation Space (CSF)(c) | | CSF Leased(d) | | CSF
Utilized(e) | | Office & Other(f) | | Office & Other Leased (g) | | Supporting
Infrastructure
(h) | | Total(i) | |
| Westway Park Blvd., Houston, TX (Houston West 1) | Houston | | $ | 50,120,319 |
| | 112,133 |
| | 96 | % | | 96 | % | | 10,563 |
| | 98 | % | | 36,756 |
| | 159,452 |
| | 3,000 |
| | 28 |
|
| West Seventh St., Cincinnati, OH (7th Street)*** | Cincinnati | | 39,841,018 |
| | 212,664 |
| | 93 | % | | 94 | % | | 5,744 |
| | 100 | % | | 171,561 |
| | 389,969 |
| | 37,000 |
| | 13 |
|
| S. State Highway 121 Business Lewisville, TX (Lewisville)* | Dallas | | 38,765,999 |
| | 108,687 |
| | 96 | % | | 96 | % | | 11,374 |
| | 97 | % | | 59,345 |
| | 179,406 |
| | — |
| | 18 |
|
| W. Frankford, Carrollton, TX (Frankford) | Dallas | | 29,031,224 |
| | 226,604 |
| | 74 | % | | 80 | % | | 23,935 |
| | 89 | % | | 70,181 |
| | 320,720 |
| | 272,000 |
| | 18 |
|
| Southwest Fwy., Houston, TX (Galleria) | Houston | | 26,631,518 |
| | 63,469 |
| | 75 | % | | 76 | % | | 23,259 |
| | 51 | % | | 24,927 |
| | 111,655 |
| | — |
| | 14 |
|
| Kingsview Dr., Lebanon, OH (Lebanon) | Cincinnati | | 23,294,731 |
| | 65,303 |
| | 76 | % | | 87 | % | | 44,886 |
| | 72 | % | | 52,950 |
| | 163,139 |
| | 65,000 |
| | 14 |
|
| South Ellis Street Chandler, AZ (Phoenix 1) | Phoenix | | 23,144,664 |
| | 77,504 |
| | 100 | % | | 100 | % | | 34,501 |
| | 11 | % | | 39,129 |
| | 151,134 |
| | 31,000 |
| | 27 |
|
| Westover Hills Blvd, San Antonio, TX (San Antonio 1) | San Antonio | | 20,207,945 |
| | 43,843 |
| | 100 | % | | 100 | % | | 5,989 |
| | 83 | % | | 45,606 |
| | 95,438 |
| | 11,000 |
| | 12 |
|
| Industrial Rd., Florence, KY (Florence) | Cincinnati | | 15,033,622 |
| | 52,698 |
| | 100 | % | | 100 | % | | 46,848 |
| | 87 | % | | 40,374 |
| | 139,920 |
| | — |
| | 9 |
|
| Westway Park Blvd., Houston, TX (Houston West 2) | Houston | | 15,540,148 |
| | 79,492 |
| | 78 | % | | 80 | % | | 3,355 |
| | 62 | % | | 55,018 |
| | 137,865 |
| | 12,000 |
| | 12 |
|
| Metropolis Dr., Austin, TX (Austin 2) | Austin | | 12,061,694 |
| | 43,772 |
| | 92 | % | | 96 | % | | 1,821 |
| | 100 | % | | 22,430 |
| | 68,023 |
| | — |
| | 5 |
|
| Knightsbridge Dr., Hamilton, OH (Hamilton)* | Cincinnati | | 9,433,581 |
| | 46,565 |
| | 77 | % | | 78 | % | | 1,077 |
| | 100 | % | | 35,336 |
| | 82,978 |
| | — |
| | 10 |
|
| South Ellis Street Chandler, AZ (Phoenix 2) | Phoenix | | 6,567,253 |
| | 72,116 |
| | 51 | % | | 100 | % | | 5,618 |
| | 38 | % | | 25,516 |
| | 103,250 |
| | 4,000 |
| | 12 |
|
| Parkway Dr., Mason, OH (Mason) | Cincinnati | | 5,896,601 |
| | 34,072 |
| | 100 | % | | 100 | % | | 26,458 |
| | 98 | % | | 17,193 |
| | 77,723 |
| | — |
| | 4 |
|
| E. Ben White Blvd., Austin, TX (Austin 1)**** | Austin | | 5,875,218 |
| | 16,223 |
| | 87 | % | | 87 | % | | 21,476 |
| | 100 | % | | 7,517 |
| | 45,216 |
| | — |
| | 2 |
|
| Midway Rd., Carrollton, TX (Midway)** | Dallas | | 5,408,662 |
| | 8,390 |
| | 100 | % | | 100 | % | | — |
| | — | % | | — |
| | 8,390 |
| | — |
| | 1 |
|
| Kestral Way (London)** | London | | 4,004,573 |
| | 10,000 |
| | 99 | % | | 99 | % | | — |
| | — | % | | 514 |
| | 10,514 |
| | — |
| | 1 |
|
| Springer St., Lombard, IL (Lombard) | Chicago | | 2,277,899 |
| | 13,516 |
| | 72 | % | | 73 | % | | 4,115 |
| | 100 | % | | 12,230 |
| | 29,861 |
| | 29,000 |
| | 3 |
|
| Marsh Lane, Carrollton, TX (Marsh Ln)** | Dallas | | 2,296,022 |
| | 4,245 |
| | 100 | % | | 100 | % | | — |
| | — | % | | — |
| | 4,245 |
| | — |
| | 1 |
|
| Goldcoast Dr., Cincinnati, OH (Goldcoast) | Cincinnati | | 1,493,607 |
| | 2,728 |
| | 100 | % | | 100 | % | | 5,280 |
| | 100 | % | | 16,481 |
| | 24,489 |
| | 14,000 |
| | 1 |
|
| Bryan St., Dallas, TX (Bryan St)** | Dallas | | 934,154 |
| | 3,020 |
| | 51 | % | | 51 | % | | — |
| | — | % | | — |
| | 3,020 |
| | — |
| | 1 |
|
| Westway Park Blvd., Houston, TX (Houston West 3) | Houston | | 423,504 |
| | — |
| | — | % | | — | % | | 8,564 |
| | 100 | % | | 5,304 |
| | 13,868 |
| | — |
| | — |
|
| McAuley Place, Blue Ash, OH (Blue Ash)* | Cincinnati | | 531,436 |
| | 6,193 |
| | 39 | % | | 39 | % | | 6,950 |
| | 100 | % | | 2,166 |
| | 15,309 |
| | — |
| | 1 |
|
| E. Monroe St., South Bend, IN (Monroe St.) | South Bend | | 488,599 |
| | 6,350 |
| | 24 | % | | 24 | % | | — |
| | — | % | | 6,478 |
| | 12,828 |
| | 4,000 |
| | 1 |
|
| Crescent Circle, South Bend, IN (Blackthorn)* | South Bend | | 413,359 |
| | 3,432 |
| | 32 | % | | 40 | % | | — |
| | — | % | | 5,125 |
| | 8,557 |
| | 11,000 |
| | 1 |
|
| Jurong East (Singapore)** | Singapore | | 302,005 |
| | 3,200 |
| | 19 | % | | 19 | % | | — |
| | — | % | | — |
| | 3,200 |
| | — |
| | 1 |
|
| Ridgetop Circle, Sterling, VA (Northern Virginia) | Sterling | | 644,933 |
| | 37,485 |
| | 85 | % | | 98 | % | | 1,160 |
| | 100 | % | | 38,118 |
| | 76,763 |
| | 6,000 |
| | 6 |
|
| Total | | | $ | 340,664,288 |
| | 1,353,704 |
| | 84 | % | | 90 | % | | 292,973 |
| | 76 | % | | 790,255 |
| | 2,436,932 |
| | 499,000 |
| | 210 |
|
| |
| * | Indicates properties in which we hold a leasehold interest in the building shell and land. All data center infrastructure has been constructed by us and owned by us. |
| |
| ** | Indicates properties in which we hold a leasehold interest in the building shell, land, and all data center infrastructure. |
| |
| *** | The information provided for the West Seventh Street (7th St.) property includes data for two facilities, one of which we lease and one of which we own. |
**** For the quarter ended March 31, 2015, we recognized an impairment of $8.6 million related to the exit of Austin 1, which is a leased facility.
| |
| (a) | Represents the total square feet of a building under lease or available for lease based on engineers' drawings and estimates but does not include space held for development or space used by CyrusOne. |
| |
| (b) | Represents monthly contractual rent (defined as cash rent including customer reimbursements for metered power) under existing customer leases as of June 30, 2015, multiplied by 12. For the month of June 2015, customer reimbursements were $41.5 million annualized and consisted of reimbursements by customers across all facilities with separately metered power. Customer reimbursements under leases with separately metered power vary from month-to-month based on factors such as our customers' utilization of power and the suppliers' pricing of power. From April 1, 2013 through June 30, 2015, customer reimbursements under leases with separately metered power constituted between 8.9% and 14.2% of annualized rent. After giving effect to abatements, free rent and other straight-line adjustments, our annualized effective rent as of |
June 30, 2015 was $350.2 million. Our annualized effective rent was greater than our annualized rent as of June 30, 2015 because our positive straight-line and other adjustments and amortization of deferred revenue exceeded our negative straight-line adjustments due to factors such as the timing of contractual rent escalations and customer prepayments for services.
| |
| (c) | CSF represents the NRSF at an operating facility that is currently leased or readily available for lease as colocation space, where customers locate their servers and other IT equipment. |
| |
| (d) | Percent leased is determined based on CSF being billed to customers under signed leases as of June 30, 2015 divided by total CSF. Leases signed but not commenced as of June 30, 2015 are not included. |
| |
| (e) | Utilization is calculated by dividing CSF under signed leases for colocation space (whether or not the customer has occupied the space) by total CSF. |
| |
| (f) | Represents the NRSF at an operating facility that is currently leased or readily available for lease as space other than CSF, which is typically office and other space. |
| |
| (g) | Percent leased is determined based on Office & Other space being billed to customers under signed leases as of June 30, 2015 divided by total Office & Other space. Leases signed but not commenced as of June 30, 2015 are not included. |
| |
| (h) | Represents infrastructure support space, including mechanical, telecommunications and utility rooms, as well as building common areas. |
| |
| (i) | Represents the NRSF at an operating facility that is currently leased or readily available for lease. This excludes existing vacant space held for development. |
| |
| (j) | Represents space that is under roof that could be developed in the future for operating NRSF, rounded to the nearest 1,000. |
| |
| (k) | UPS capacity (also referred to as critical load) represents the aggregate power available for lease and exclusive use by customers from the facility’s installed universal power supplies (UPS) expressed in terms of megawatts. The capacity reported is for non-redundant megawatts, as we can develop flexible solutions to our customers at multiple resiliency levels. Does not sum to total due to rounding. |
CyrusOne Inc.
NRSF Under Development
As of June 30, 2015
(Dollars in millions)
(Unaudited)
|
| | | | | | | | | | | | | | | | | | | | | | | | |
| | | NRSF Under Development(a) | | | | Under Development Costs(b) |
| Facilities | Metropolitan Area | Colocation Space (CSF) | | Office & Other | | Supporting Infrastructure | | Powered Shell(c) | | Total | | UPS MW Capacity(d) | | Actual to Date(e) | Estimated Costs to Completion | Total |
| Westover Hills Blvd. (San Antonio 2) | San Antonio | 30,000 |
| | 20,000 |
| | 25,000 |
| | 49,000 |
| | 124,000 |
| | 3.0 |
| | 28 |
| 12-15 | 40-43 |
| Westway Park Blvd. (Houston West 3) | Houston | 53,000 |
| | — |
| | 32,000 |
| | 213,000 |
| | 298,000 |
| | 6.0 |
| | 32 |
| 21-24 | 53-56 |
| Phoenix 3 | Phoenix | — |
| | — |
| | — |
| | 150,000 |
| | 150,000 |
| | — |
| | 1 |
| 10-12 | 11-13 |
| Metropolis Drive (Austin 4) | Austin | 62,000 |
| | 15,000 |
| | 22,000 |
| | 67,000 |
| | 166,000 |
| | 3.0 |
| | 21 |
| 20-24 | 41-45 |
| Ridgetop Circle, Sterling, VA (Northern Virginia) | Northern Virginia | 37,000 |
| | — |
| | 15,000 |
| | — |
| | 52,000 |
| | — |
| | 6 |
| 6-9 | 12-15 |
| Total | | 182,000 |
| | 35,000 |
| | 94,000 |
| | 479,000 |
| | 790,000 |
| | 12.0 |
| | $ | 88 |
| $69-84 | $157-172 |
| |
| (a) | Represents NRSF at a facility for which activities have commenced or are expected to commence in the next 2 quarters to prepare the space for its intended use. Estimates and timing are subject to change. |
| |
| (b) | Represents management’s estimate of the total costs required to complete the current NRSF under development. There may be an increase in costs if customers require greater power density. |
| |
| (c) | Represents NRSF under construction that, upon completion, will be powered shell available for future development into operating NRSF. |
| |
| (d) | UPS Capacity (also referred to as critical load) represents the aggregate power available for lease to and exclusive use by customers from the facility’s installed universal power supplies (UPS) expressed in terms of megawatts. The capacity presented is for non-redundant megawatts, as we can develop flexible solutions to our customers at multiple resiliency levels. |
| |
| (e) | Actual to date is the cash investment as of June 30, 2015. There may be accruals above this amount for work completed, for which cash has not yet been paid. |
CyrusOne Inc.
Land Available for Future Development (Acres)
As of June 30, 2015
(Unaudited)
|
| | | |
| | | As of |
| Market | | June 30, 2015 |
| Cincinnati | | 98 |
|
| Dallas | | — |
|
| Houston | | 20 |
|
| Virginia | | 10 |
|
| Austin | | 22 |
|
| Phoenix | | 32 |
|
| San Antonio | | 13 |
|
| Chicago | | — |
|
| International | | — |
|
| Total Available | | 195 |
|
CyrusOne Inc.
Leasing Statistics - Lease Signings
As of June 30, 2015
(Dollars in thousands)
(Unaudited)
|
| | | | | | | | | | |
| Period | | Number of Leases(a) | | Total CSF Signed(b) | | Total kW Signed(c) | | Total MRR Signed ($000)(d) | | Weighted Average Lease Term(e) |
| Q2'15 | | 372 | | 48,000 | | 4,758 | | $1,049 | | 90 |
| Prior 4Q Avg. | | 306 | | 49,000 | | 8,951 | | $1,116 | | 81 |
| Q1'15 | | 326 | | 60,000 | | 9,759 | | $1,383 | | 83 |
| Q4'14 | | 335 | | 44,000 | | 5,262 | | $950 | | 69 |
| Q3'14 | | 287 | | 33,000 | | 3,410 | | $694 | | 79 |
| Q2'14 | | 275 | | 59,000 | | 17,374 | | $1,435 | | 91 |
| |
| (a) | Number of leases represents each agreement with a customer. A lease agreement could include multiple spaces, and a customer could have multiple leases. |
| |
| (b) | CSF represents the NRSF at an operating facility that is leased as colocation space, where customers locate their servers and other IT equipment. |
| |
| (c) | Represents maximum contracted kW that customers may draw during lease period. Additionally, we can develop flexible solutions for our customers at multiple resiliency levels, and the kW signed is unadjusted for this factor. |
| |
| (d) | Monthly recurring rent is defined as the average monthly contractual rent during the term of the lease. It excludes estimates for pass-through power and installation charges. |
| |
| (e) | Calculated on a CSF-weighted basis. |
CyrusOne Inc.
New MRR Signed - Existing vs. New Customers
As of June 30, 2015
(Dollars in thousands)
(Unaudited)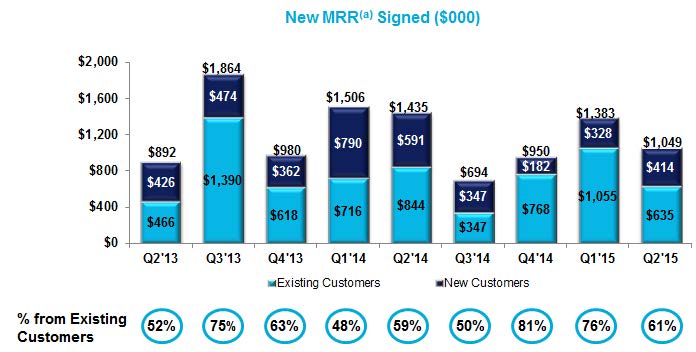
| |
| (a) | Monthly recurring rent is defined as average monthly contractual rent during the term of the lease. It excludes estimates for pass-through power and installation charges. |
CyrusOne Inc.
Customer Diversification(a)
As of June 30, 2015
(Unaudited)
|
| | | | | | | | | | | | | |
| | Principal Customer Industry | | Number of
Locations | | Annualized
Rent(b) | | Percentage of
Portfolio
Annualized
Rent(c) | | Weighted
Average
Remaining
Lease Term in
Months(d) |
| 1 | Information Technology | | 3 | | $ | 16,768,167 |
| | 4.9 | % | | 36.2 |
|
| 2 | Energy | | 1 | | 15,387,719 |
| | 4.5 | % | | 36.1 |
|
| 3 | Telecommunication Services | | 2 | | 15,226,014 |
| | 4.5 | % | | 35.1 |
|
| 4 | Information Technology | | 1 | | 14,608,719 |
| | 4.3 | % | | 45.0 |
|
| 5 | Research and Consulting Services | | 3 | | 14,010,584 |
| | 4.1 | % | | 28.7 |
|
| 6 | Energy | | 5 | | 13,233,348 |
| | 3.9 | % | | 23.1 |
|
| 7 | Telecommunications (CBI)(e) | | 7 | | 12,153,999 |
| | 3.6 | % | | 21.7 |
|
| 8 | Industrials | | 3 | | 8,687,906 |
| | 2.6 | % | | 19.5 |
|
| 9 | Information Technology | | 2 | | 7,971,772 |
| | 2.3 | % | | 24.8 |
|
| 10 | Financials | | 1 | | 6,600,225 |
| | 1.9 | % | | 59.0 |
|
| 11 | Information Technology | | 1 | | 6,564,853 |
| | 1.9 | % | | 113.0 |
|
| 12 | Information Technology | | 1 | | 6,306,022 |
| | 1.9 | % | | 5.9 |
|
| 13 | Financials | | 8 | | 5,651,666 |
| | 1.7 | % | | 59.8 |
|
| 14 | Telecommunication Services | | 5 | | 5,475,204 |
| | 1.6 | % | | 46.0 |
|
| 15 | Energy | | 3 | | 5,441,010 |
| | 1.6 | % | | 12.9 |
|
| 16 | Energy | | 2 | | 5,084,334 |
| | 1.5 | % | | 27.8 |
|
| 17 | Consumer Staples | | 1 | | 5,053,152 |
| | 1.5 | % | | 82.5 |
|
| 18 | Information Technology | | 1 | | 4,868,320 |
| | 1.4 | % | | 68.0 |
|
| 19 | Energy | | 1 | | 4,549,982 |
| | 1.3 | % | | 13.2 |
|
| 20 | Information Technology | | 3 | | 4,202,206 |
| | 1.2 | % | | 57.6 |
|
| | | | | | $ | 177,845,202 |
| | 52.2 | % | | 37.8 |
|
| |
| (b) | Represents monthly contractual rent (defined as cash rent including customer reimbursements for metered power) under existing customer leases as of June 30, 2015, multiplied by 12. For the month of June 2015, our total portfolio annualized rent was $340.7 million, and customer reimbursements were $41.5 million annualized, consisting of reimbursements by customers across all facilities with separately metered power. Customer reimbursements under leases with separately metered power vary from month-to-month based on factors such as our customers’ utilization of power and the suppliers’ pricing of power. From April 1, 2013 through June 30, 2015, customer reimbursements under leases with separately metered power constituted between 8.9% and 14.2% of annualized rent. After giving effect to abatements, free rent and other straight-line adjustments, our annualized effective rent for our total portfolio as of June 30, 2015 was $350.2 million. Our annualized effective rent was greater than our annualized rent as of June 30, 2015 because our positive straight-line and other adjustments and amortization of deferred revenue exceeded our negative straight-line adjustments due to factors such as the timing of contractual rent escalations and customer prepayments for services. |
| |
| (c) | Represents the customer’s total annualized rent divided by the total annualized rent in the portfolio as of June 30, 2015, which was approximately $340.7 million. |
| |
| (d) | Weighted average based on customer’s percentage of total annualized rent expiring and is as of June 30, 2015, assuming that customers exercise no renewal options and exercise all early termination rights that require payment of less than 50% of the remaining rents. Early termination rights that require payment of 50% or more of the remaining lease payments are not assumed to be exercised because such payments approximate the profitability margin of leasing that space to the customer, such that we do not consider early termination to be economically detrimental to us. |
| |
| (e) | Includes information for both Cincinnati Bell Technology Solutions (CBTS) and Cincinnati Bell Telephone and two customers that have contracts with CBTS. We expect the contracts for these two customers to be assigned to us, but the consents for such assignments have not yet been obtained. Excluding these customers, Cincinnati Bell Inc. and subsidiaries represented 2.5% of our annualized rent as of June 30, 2015. During the second quarter, a subsidiary of one of the customers with contracts with CBTS had the contracts assigned to us. |
CyrusOne Inc.
Lease Distribution
As of June 30, 2015
(Unaudited)
|
| | | | | | | | | | | | | | | | | | | |
NRSF Under Lease(a) | | Number of Customers(b) | | Percentage of All Customers | | Total Leased NRSF(c) | | Percentage of Portfolio Leased NRSF | | Annualized Rent(d) | | Percentage of Annualized Rent |
| 0-999 | | 510 |
| | 74 | % | | 102,346 |
| | 5 | % | | $ | 42,828,735 |
| | 13 | % |
| 1,000-2,499 | | 66 |
| | 9 | % | | 104,560 |
| | 5 | % | | 21,400,298 |
| | 6 | % |
| 2,500-4,999 | | 39 |
| | 6 | % | | 139,884 |
| | 7 | % | | 28,055,610 |
| | 8 | % |
| 5,000-9,999 | | 28 |
| | 4 | % | | 208,318 |
| | 10 | % | | 50,794,258 |
| | 15 | % |
| 10,000+ | | 46 |
| | 7 | % | | 1,479,348 |
| | 73 | % | | 197,585,388 |
| | 58 | % |
| Total | | 689 |
| | 100 | % | | 2,034,456 |
| | 100 | % | | $ | 340,664,289 |
| | 100 | % |
| |
| (a) | Represents all leases in our portfolio, including colocation, office and other leases. |
| |
| (b) | Represents the number of customers occupying data center, office and other space as of June 30, 2015. This may vary from total customer count as some customers may be under contract, but have yet to occupy space. |
| |
| (c) | Represents the total square feet at a facility under lease and that has commenced billing, excluding space held for development or space used by CyrusOne. A customer’s leased NRSF is estimated based on such customer’s direct CSF or office and light-industrial space plus management’s estimate of infrastructure support space, including mechanical, telecommunications and utility rooms, as well as building common areas. |
| |
| (d) | Represents monthly contractual rent (defined as cash rent including customer reimbursements for metered power) under existing customer leases as of June 30, 2015, multiplied by 12. For the month of June 2015, customer reimbursements were $41.5 million annualized and consisted of reimbursements by customers across all facilities with separately metered power. Customer reimbursements under leases with separately metered power vary from month-to-month based on factors such as our customers’ utilization of power and the suppliers’ pricing of power. From April 1, 2013 through June 30, 2015, customer reimbursements under leases with separately metered power constituted between 8.9% and 14.2% of annualized rent. After giving effect to abatements, free rent and other straight-line adjustments, our annualized effective rent as of June 30, 2015 was $350.2 million. Our annualized effective rent was greater than our annualized rent as of June 30, 2015 because our positive straight-line and other adjustments and amortization of deferred revenue exceeded our negative straight-line adjustments due to factors such as the timing of contractual rent escalations and customer prepayments for services. |
CyrusOne Inc.
Lease Expirations
As of June 30, 2015
(Unaudited)
|
| | | | | | | | | | | | | | | | | | | | | | |
Year(a) | Number of
Leases
Expiring(b) | | Total Operating
NRSF Expiring | | Percentage of
Total NRSF | | Annualized
Rent(c) | | Percentage of
Annualized Rent | | Annualized Rent
at Expiration(d) | | Percentage of
Annualized Rent
at Expiration |
| Available | | | 402,476 |
| | 17 | % | | | | | | | | |
| Month-to-Month | 208 |
| | 23,871 |
| | 1 | % | | $ | 5,809,309 |
| | 2 | % | | $ | 6,013,918 |
| | 2 | % |
| 2015 | 435 |
| | 266,719 |
| | 11 | % | | 31,023,817 |
| | 9 | % | | 31,125,072 |
| | 9 | % |
| 2016 | 772 |
| | 238,810 |
| | 10 | % | | 63,177,418 |
| | 18 | % | | 63,980,541 |
| | 17 | % |
| 2017 | 830 |
| | 352,332 |
| | 15 | % | | 58,273,926 |
| | 17 | % | | 60,193,362 |
| | 16 | % |
| 2018 | 542 |
| | 299,489 |
| | 12 | % | | 73,151,523 |
| | 21 | % | | 75,872,942 |
| | 21 | % |
| 2019 | 221 |
| | 338,380 |
| | 14 | % | | 48,126,761 |
| | 14 | % | | 53,592,511 |
| | 15 | % |
| 2020 | 150 |
| | 249,268 |
| | 10 | % | | 26,965,414 |
| | 8 | % | | 31,097,587 |
| | 9 | % |
| 2021 | 134 |
| | 76,525 |
| | 3 | % | | 15,417,933 |
| | 5 | % | | 16,375,773 |
| | 4 | % |
| 2022 | 11 |
| | 33,167 |
| | 1 | % | | 3,647,627 |
| | 1 | % | | 3,929,246 |
| | 1 | % |
| 2023 | 46 |
| | 59,750 |
| | 2 | % | | 6,255,504 |
| | 2 | % | | 8,570,688 |
| | 2 | % |
| 2024 - Thereafter | 20 |
| | 96,145 |
| | 4 | % | | 8,815,056 |
| | 3 | % | | 13,522,558 |
| | 4 | % |
| Total | 3,369 |
| | 2,436,932 |
| | 100 | % | | $ | 340,664,288 |
| | 100 | % | | $ | 364,274,198 |
| | 100 | % |
| |
| (a) | Leases that were auto-renewed prior to June 30, 2015 are shown in the calendar year in which their current auto-renewed term expires. Unless otherwise stated in the footnotes, the information set forth in the table assumes that customers exercise no renewal options and exercise all early termination rights that require payment of less than 50% of the remaining rents. Early termination rights that require payment of 50% or more of the remaining lease payments are not assumed to be exercised. |
| |
| (b) | Number of leases represents each agreement with a customer. A lease agreement could include multiple spaces and a customer could have multiple leases. |
| |
| (c) | Represents monthly contractual rent (defined as cash rent including customer reimbursements for metered power) under existing customer leases as of June 30, 2015, multiplied by 12. For the month of June 2015, our total portfolio annualized rent was $340.7 million, customer reimbursements were $41.5 million annualized and consisted of reimbursements by customers across all facilities with separately metered power. Customer reimbursements under leases with separately metered power vary from month-to-month based on factors such as our customers’ utilization of power and the suppliers’ pricing of power. From April 1, 2013 through June 30, 2015, customer reimbursements under leases with separately metered power constituted between 8.9% and 14.2% of annualized rent. After giving effect to abatements, free rent and other straight-line adjustments, our annualized effective rent as of June 30, 2015 was $350.2 million. Our annualized effective rent was greater than our annualized rent as of June 30, 2015 because our positive straight-line and other adjustments and amortization of deferred revenue exceeded our negative straight-line adjustments due to factors such as the timing of contractual rent escalations and customer prepayments for services. |
| |
| (d) | Represents the final monthly contractual rent under existing customer leases that had commenced as of June 30, 2015, multiplied by 12. |