Phoenix, AZ - Chandler Dallas, TX - Carrollton Norwalk, CT Second Quarter 2016 Earnings August 2, 2016 8/2/2016

Safe Harbor This presentation contains forward-looking statements regarding future events and our future results that are subject to the “safe harbor” provisions of the Private Securities Litigation Reform Act of 1995. All statements, other than statements of historical facts, are statements that could be deemed forward-looking statements. These statements are based on current expectations, estimates, forecasts, and projections about the industries in which we operate and the beliefs and assumptions of our management. Words such as “expects,” “anticipates,” “predicts,” “projects,” “intends,” “plans,” “believes,” “seeks,” “estimates,” “continues,” “endeavors,” “strives,” “may,” variations of such words and similar expressions are intended to identify such forward-looking statements. In addition, any statements that refer to projections of our future financial performance, our anticipated growth and trends in our businesses, and other characterizations of future events or circumstances are forward-looking statements. Readers are cautioned these forward-looking statements are based on current expectations and assumptions that are subject to risks and uncertainties, which could cause our actual results to differ materially and adversely from those reflected in the forward-looking statements. Factors that could cause or contribute to such differences include, but are not limited to, those discussed in this release and those discussed in other documents we file with the Securities and Exchange Commission (SEC). More information on potential risks and uncertainties is available in our recent filings with the SEC, including CyrusOne’s Form 10-K report, Form 10-Q reports, and Form 8- K reports. Actual results may differ materially and adversely from those expressed in any forward-looking statements. We undertake no obligation to revise or update any forward-looking statements for any reason. For additional information, including reconciliation of any non-GAAP financial measures, please reference the supplemental report furnished by the Company on a Current Report on Form 8-K filed August 2, 2016. Unless otherwise noted, all data herein is as of June 30, 2016. CyrusOne Second Quarter 2016 Earnings Presentation Built for Tomorrow. Ready Today. | 2

Second Quarter 2016 Overview

CyrusOne Second Quarter 2016 Earnings Presentation Built for Tomorrow. Ready Today. | 4 Highlights Second quarter Adjusted EBITDA of $69.7 million increased 48% over second quarter 2015 Second quarter Normalized FFO per share of $0.67 increased 34% over second quarter 2015 Second quarter revenue of $130.1 million increased $41.0 million, including $5.0 million from lease termination fees, or 46% over second quarter 2015 Leased a record 282,000 colocation square feet(1) and 40 megawatts (MW) in the second quarter totaling $58 million in annualized GAAP revenue(2), including pre-leasing of 2 MW and over 75% of colocation square feet(1) under construction at recently acquired Chicago - Aurora I data center Backlog of $82 million in annualized GAAP revenue(2) as of the end of the second quarter, representing approximately $730 million in total contract value Subsequent to the end of the quarter, leased 12 MW and purchased shell for development of a fully pre- leased data center in Northern Virginia, in addition to previously announced 40 acre land purchase in this market Leases total $14 million in annualized GAAP revenue(2), increasing backlog to $96 million Notes: 1. Colocation square feet (CSF) represents NRSF currently leased or available for lease as colocation space, where customers locate their servers and other IT equipment. Net rentable square feet (NRSF) represents the total square feet of a building currently leased or available for lease, based on engineers’ drawings and estimates but does not include space held for development or space used by CyrusOne. 2. Annualized GAAP revenue is equal to monthly recurring rent, defined as average monthly contractual rent during the term of the lease plus the monthly impact of installation charges, multiplied by 12. Record leasing quarter and nearly $100 million revenue backlog
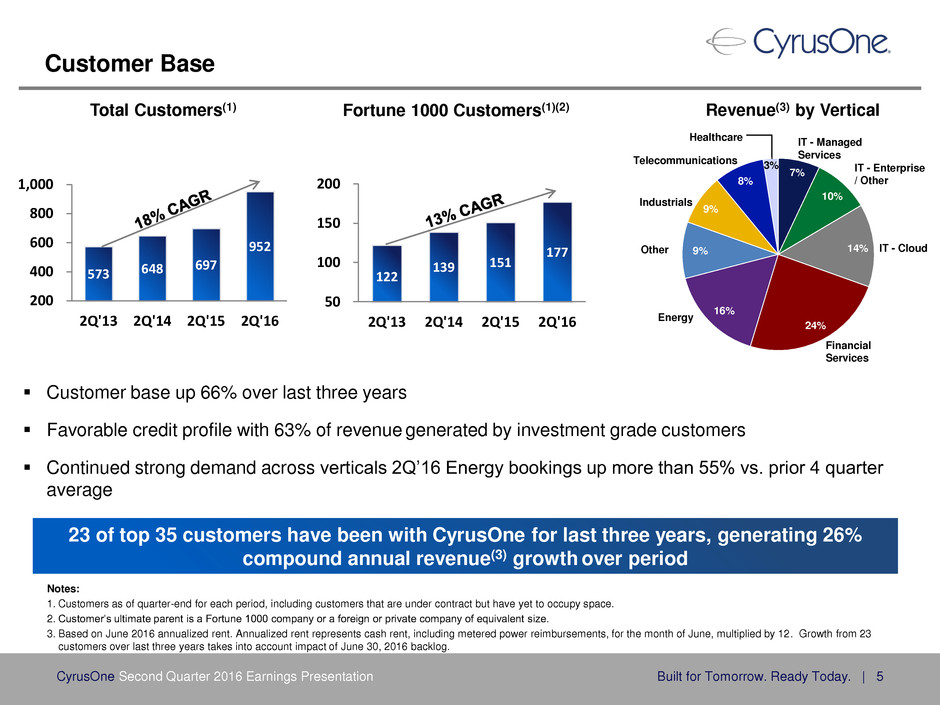
Customer Base Notes: 1. Customers as of quarter-end for each period, including customers that are under contract but have yet to occupy space. 2. Customer’s ultimate parent is a Fortune 1000 company or a foreign or private company of equivalent size. 3. Based on June 2016 annualized rent. Annualized rent represents cash rent, including metered power reimbursements, for the month of June, multiplied by 12. Growth from 23 customers over last three years takes into account impact of June 30, 2016 backlog. CyrusOne Second Quarter 2016 Earnings Presentation Built for Tomorrow. Ready Today. | 5 Customer base up 66% over last three years Favorable credit profile with 63% of revenue generated by investment grade customers Continued strong demand across verticals 2Q’16 Energy bookings up more than 55% vs. prior 4 quarter average 23 of top 35 customers have been with CyrusOne for last three years, generating 26% compound annual revenue(3) growth over period 573 648 697 952 2Q'13 2Q'14 2Q'15 2Q'16 200 400 600 800 1,000 Total Customers(1) 122 139 151 177 2Q'13 2Q'14 2Q'15 2Q'16 50 100 150 200 Fortune 1000 Customers(1)(2) 7% 10% 14% 24% 16% 9% 9% 8% 3% IT - Managed Services IT - Enterprise / Other IT - Cloud Financial Services Energy Other Industrials Telecommunications Healthcare Revenue(3) by Vertical
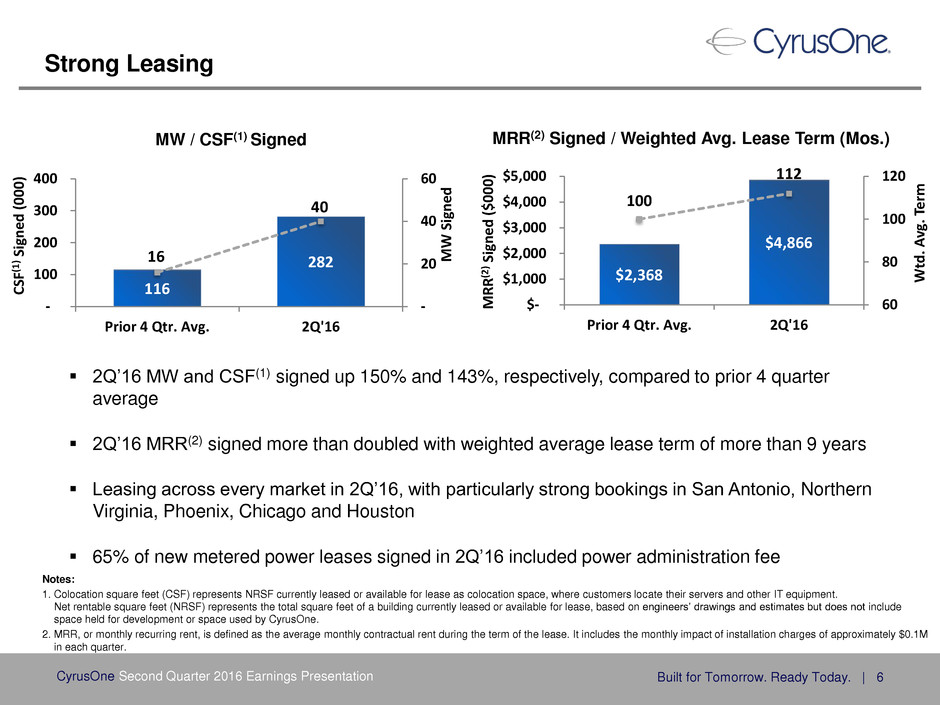
Strong Leasing CyrusOne Second Quarter 2016 Earnings Presentation Built for Tomorrow. Ready Today. | 6 116 282 16 40 - 20 40 60 Prior 4 Qtr. Avg. 2Q'16 - 100 200 300 400 M W Sign ed CS F( 1 ) Sign ed (0 0 0 ) MW / CSF(1) Signed Notes: 1. Colocation square feet (CSF) represents NRSF currently leased or available for lease as colocation space, where customers locate their servers and other IT equipment. Net rentable square feet (NRSF) represents the total square feet of a building currently leased or available for lease, based on engineers’ drawings and estimates but does not include space held for development or space used by CyrusOne. 2. MRR, or monthly recurring rent, is defined as the average monthly contractual rent during the term of the lease. It includes the monthly impact of installation charges of approximately $0.1M in each quarter. $2,368 $4,866 100 112 60 80 100 120 Prior 4 Qtr. Avg. 2Q'16 $- $1,000 $2,000 $3,000 $4,000 $5,000 W td . A vg . T er m M R R (2 ) S ig ned ($0 0 0 ) MRR(2) Signed / Weighted Avg. Lease Term (Mos.) 2Q’16 MW and CSF(1) signed up 150% and 143%, respectively, compared to prior 4 quarter average 2Q’16 MRR(2) signed more than doubled with weighted average lease term of more than 9 years Leasing across every market in 2Q’16, with particularly strong bookings in San Antonio, Northern Virginia, Phoenix, Chicago and Houston 65% of new metered power leases signed in 2Q’16 included power administration fee

CyrusOne Second Quarter 2016 Earnings Presentation Built for Tomorrow. Ready Today. | 7 Speed to Market Driving Higher Leasing Volumes Note: 1. Colocation square feet (CSF) represents NRSF currently leased or available for lease as colocation space, where customers locate their servers and other IT equipment. Net rentable square feet (NRSF) represents the total square feet of a building currently leased or available for lease, based on engineers’ drawings and estimates but does not include space held for development or space used by CyrusOne. 6 month build time 159K colocation square feet(1) 30 MW of power capacity 100% leased Strong customer demand creating significant challenges for hyper-scale companies to forecast data center requirements Ability to deliver capacity quickly and at a low cost solves capacity problems for these companies while allowing CyrusOne to achieve targeted returns San Antonio II Northern Virginia - Sterling II Massively Modular® Design Principles and Advanced Supply Chain Techniques Result in Low Costs and Fast Build Times 6 month build time 64K colocation square feet(1) 12 MW of power capacity 100% leased Recently acquired shell for development of fully pre-leased data center Northern Virginia - Shaw Road

CyrusOne Second Quarter 2016 Earnings Presentation Built for Tomorrow. Ready Today. | 8 Development Yield $207 $220 $216 $225 $278 $289 $310 $341 3Q'14 4Q'14 1Q'15 2Q'15 3Q'15 4Q'15 1Q'16 2Q'16 $- $100 $200 $300 $400 Annualized NOI(1) ($MM) Development Yield(2) Inv. in Real Estate, less CIP $1,251 $1,297 $1,341 $1,546 Development yield of 17% includes development properties that are not yet stabilized The yield for development properties should improve over time as high fixed costs are allocated across incremental leasing $1,199 $1,199 $2,036 3Q'14 2Q'16 $- $500 $1,000 $1,500 $2,000 $2,500 Able to maintain upper-teen yields even with 70% increase in investment since 3Q’14 Inv. in Real Estate ($MM) $1,597 $1,756 $2,036 18% 17% 17% 18% 18% 18% 17% 17% Notes: 1. 1Q’15, 3Q’15, and 4Q’15 annualized NOI adjusted to exclude Austin 1 facility lease exit costs of $0.7M, $0.4M, and $0.3M, respectively. 2. Development Yield is calculated by dividing annualized Net Operating Income (NOI) by total investment in real estate, less construction in progress.

Second Quarter 2016 Financial Review

Revenue, Adj. EBITDA, Normalized FFO and Churn CyrusOne Second Quarter 2016 Earnings Presentation Built for Tomorrow. Ready Today. | 10 Notes: 1. Recurring rent quarterly churn is defined as any reduction in recurring rent due to customer terminations, service reductions or net pricing decreases as a percentage of rent at the beginning of the quarter, excluding any impact from metered power reimbursements or other usage-based or variable billing. 2. Colocation square feet (CSF) represents NRSF leased or available for lease as colocation space, where customers locate their servers and other IT equipment. Net rentable square feet (NRSF) represent the total square feet of a building leased or available for lease based on engineers’ drawings and estimates but does not include space held for development or space used by CyrusOne. 3. Annualized rent represents cash rent, including metered power reimbursements, for the month of June 2016 multiplied by 12. 3.1% 0.6% 0.7% 0.4% 1.3% 2.7% 1Q'15 2Q'15 3Q'15 4Q'15 1Q'16 2Q'16 Revenue ($ Millions) Churn Recurring Rent Quarterly Churn (1) Revenue growth driven by: Expansion of customer base to 952 Increases in leased CSF(2) and annualized rent (3) of 44% and 39%, respectively, compared to 2Q’15 Strong Adjusted EBITDA and Normalized FFO growth Driven primarily by strong growth in revenue Churn 2Q’16 churn elevated as anticipated Included company-initiated churn of 1.2%, with ~70% of space re-leased to two Fortune 500 customers Full year churn net of company-initiated churn expected to be ~8% Normalized FFO ($ Millions) $33.4 $53.1 2Q'15 2Q'16 $0.50 $0.67 Norm. FFO per Share $89.1 $130.1 2Q'15 2Q'16 Adjusted EBITDA ($ Millions) 47.1 69.7 2Q'15 2Q'16 1.2% 1.5%

Year over Year P&L Analysis Notes: 1. Legal claim costs of $0.3 million in 2Q’16 and 2Q’15 are omitted from this presentation as they are excluded from Adjusted EBITDA. 2.Weighted average diluted common share or common share equivalents for 2Q’16 and 2Q‘15 were 79.0 million and 66.0 million, respectively. Revenue growth of 46% NOI up 52% over 2Q’15 driven by revenue growth; NOI margin up 3 percentage points Adjusted EBITDA up 48% over 2Q’15 driven primarily by higher NOI, partially offset by higher SG&A costs Increase in Normalized FFO of 59% due to growth in Adjusted EBITDA, partially offset by higher interest expense CyrusOne Second Quarter 2016 Earnings Presentation Built for Tomorrow. Ready Today. | 11 ($ Millions) 2Q 2016 2Q 2015 $ % Revenue 130.1$ 89.1$ 41.0$ 46% Property operating expenses 44.8 32.8 (12.0) -37% Net Operating Income (NOI) 85.3 56.3 29.0 52% NOI Margin 66% 63% Selling, general & administrative (1) 18.8 12.4 (6.4) -52% Less: Stock-based compensation (3.2) (3.2) - - Adjusted EBITDA 69.7$ 47.1$ 22.6$ 48% Adjusted EBITDA Mar in 54% 53% Normalized FFO 53.1$ 33.4$ 19.7$ 59% Normalized FFO per share (2) 0.67$ 0.50$ 0.17$ 34% Three Months Ended Fav/(Unfav)

Balance Sheet CyrusOne Second Quarter 2016 Earnings Presentation Built for Tomorrow. Ready Today. | 12 ($ Millions) 6/30/16 Land, Buildings and Improvements, Equipment $2,035.9 Construction in Progress 178.9 Gross Investment in Real Estate 2,214.8 Accumulated Depreciation (503.2) Net Investment in Real Estate $1,711.6 Other Assets 799.7 Total Assets $2,511.3 Short-Term Liabilities $235.4 Revolver 85.0 Term Loans 550.0 Senior Unsecured Notes / Other 472.1 Long-Term Debt and Capital Leases 1,107.1 Lease Financing Arrangements 144.3 Total Liabilities $1,486.8 Total Shareholders’ Equity 1,024.5 Total Liabilities and Shareholders’ Equity $2,511.3 > $3 Billion in Gross Assets

Market Diversification / Portfolio Overview Notes: 1. Based on June 2016 annualized rent adjusted to include impact of June 30, 2016 backlog. Annualized rent represents cash rent, including metered power reimbursements, for the month of June, multiplied by 12. 2. Colocation square feet (CSF) represents NRSF currently leased or available for lease as colocation space, where customers locate their servers and other IT equipment. Net rentable square feet (NRSF) represent the total square feet of a building currently leased or available for lease based on engineers’ drawings and estimates but does not include space held for development or space used by CyrusOne. 3. Utilization is calculated by dividing CSF under signed leases (whether or not the lease has commenced billing) by total CSF. 4. Stabilized properties include data halls that have been in service for at least 24 months or are at least 85% utilized. CyrusOne Second Quarter 2016 Earnings Presentation Built for Tomorrow. Ready Today. | 13 Increasingly diversified portfolio with largest market accounting for 17% of revenue(1) 17% 16% 16% 13% 11% 10% 6% 5% 5% 1% Dallas Cincinnati NY Metro Phoenix San Antonio Austin Northern Virginia International Houston Chicago Revenue(1) by Market 48% increase in CSF(2) capacity compared to June 30, 2015, with Utilization (3) on Stabilized Properties(4) at 92% Recent capacity additions in Dallas, Houston, and Austin account for decline in Utilization (3) compared to June 30 ,2015 Portfolio Overview

Lease Term / Expirations Note: 1. Based on June 2016 annualized rent adjusted to include impact of June 30, 2016 backlog. Annualized rent represents cash rent, including metered power reimbursements, for the month of June, multiplied by 12. CyrusOne Second Quarter 2016 Earnings Presentation Built for Tomorrow. Ready Today. | 14 Inclusive of backlog, remaining average lease term has nearly doubled since IPO to nearly 4.5 years 20% of portfolio has remaining average lease term of 10+ years 28 53 4Q'12 2Q'16 Wtd. Avg. Remaining Lease Term (Mos.)(1) 2% 8% 17% 20% 10% 9% 7% 1% 1% 2% 3% 11% 9% M TM 2 0 1 6 2 0 1 7 2 0 1 8 2 0 1 9 2 0 2 0 2 0 2 1 2 0 2 2 2 0 2 3 2 0 2 4 2 0 2 5 2 0 2 6 2 0 2 7 + Lease Expirations(1)

Development CyrusOne Second Quarter 2016 Earnings Presentation Built for Tomorrow. Ready Today. | 15 Market CSF Under Development(1,2) Critical Load Capacity(3) Under Development Northern Virginia 79K 15 MW San Antonio 132K 24 MW Phoenix 32K 6 MW Chicago 16K 5 MW Total 259K 50 MW Notes: 1. Colocation square feet (CSF) represents NRSF currently leased or available for lease as colocation space, where customers locate their servers and other IT equipment. Net rentable square feet (NRSF) represent the total square feet of a building currently leased or available for lease based on engineers’ drawings and estimates but does not include space held for development or space used by CyrusOne. 2. Represents square footage at a facility for which activities have commenced or are expected to commence in the next 2 quarters to prepare the space for its intended use. Estimates and timing are subject to change. 3. Represents aggregate power available for lease to and exclusive use by customers expressed in terms of megawatts. The capacity presented is for non-redundant megawatts, as we can develop flexible solutions to our customers at multiple resiliency levels. Development Projects Development projects across diverse set of markets expected to deliver 259K CSF(1) and 50 MW of power For projects currently under development, over 95% of CSF(1) is contractually committed to customers Estimated $228-$252 million cost to complete Expected to be incurred during 2016 and early 2017 Acquired 40 acres of land in Northern Virginia to accommodate growth in market Subsequent to end of quarter, acquired 129K square foot shell for development of a fully pre- leased data center in Northern Virginia As of 6/30/16

Capital Structure and Debt Maturity Schedule CyrusOne Second Quarter 2016 Earnings Presentation Built for Tomorrow. Ready Today. | 16 Favorable capital structure with low leverage (Net to Adjusted EBITDA(2) of 4.0x) Substantial available liquidity of $571 million No significant near-term maturities w/ 5 year weighted average remaining term Recent positive revisions to ratings outlooks by rating agencies Moody’s: revised outlook to positive from stable, citing “meaningful improvement in key leverage and coverage metrics, rapid yet well planned portfolio growth, and favorable trends in diversification” S&P: placed on CreditWatch Positive Notes: 1. Based on 6/30/16 closing price of $55.66. 2. 2Q’16 Adjusted EBITDA annualized. (1) ($ Millions)

Lease Commencements CyrusOne Second Quarter 2016 Earnings Presentation Built for Tomorrow. Ready Today. | 17 Total Backlog - Estimated Annualized GAAP Revenue(1) Commenced by End of Period ($ Millions) (excl. estimates of pass-through power) Note: 1. Annualized GAAP revenue is equal to monthly recurring rent, defined as average monthly contractual rent during the term of the lease plus the monthly impact of installation charges, multiplied by 12. 2. Colocation square feet (CSF) represents NRSF leased or available for lease as colocation space, where customers locate their servers and other IT equipment. Net rentable square feet (NRSF) represent the total square feet of a building leased or available for lease based on engineers’ drawings and estimates but does not include space held for development or space used by CyrusOne. $2.7 $58.4 $13.2 $5.0 $37.5 2Q'16 3Q'16 4Q'16 FY'17 Total $- $20 $40 $60 2Q’16 Leases - Estimated Annualized GAAP Revenue(1) Commenced by End of Period ($ Millions) (excl. estimates of pass-through power) In 2Q’16, leased 40 MW and 282,000 CSF(2); weighted average lease term of 112 months Estimates on lease commencements for future quarters are based on current estimated installation timelines Excluding estimates for pass-through power charges, leases signed during 2Q’16 represent approximately $58.4M of annualized GAAP revenue(1) Total annualized GAAP revenue(1) backlog of approximately $82.4M as of the end of 2Q’16 $39.9 $82.4 $5.0 $37.5 3Q'16 4Q'16 FY'17 Total $- $20 $40 $60 $80 $100

2016 Guidance CyrusOne Second Quarter 2016 Earnings Presentation Built for Tomorrow. Ready Today. | 18 Category ($ Millions except for Normalized FFO) Previous 2016 Guidance Revised 2016 Guidance Total Revenue $520 - 530 $520 - 530 Base Revenue $470 - 475 $470 - 475 Metered Power Reimbursements $50 - 55 $50 - 55 Adjusted EBITDA $270 - 280 $270 - 280 Normalized FFO per diluted common share or common share equivalent $2.48 - 2.58 $2.50 - 2.58 Capital Expenditures $380 - 405 $635 - 655 Development $375 - 396 $630 - 646 Recurring $5 - 9 $5 - 9
Appendix (Non-GAAP Reconciliations)
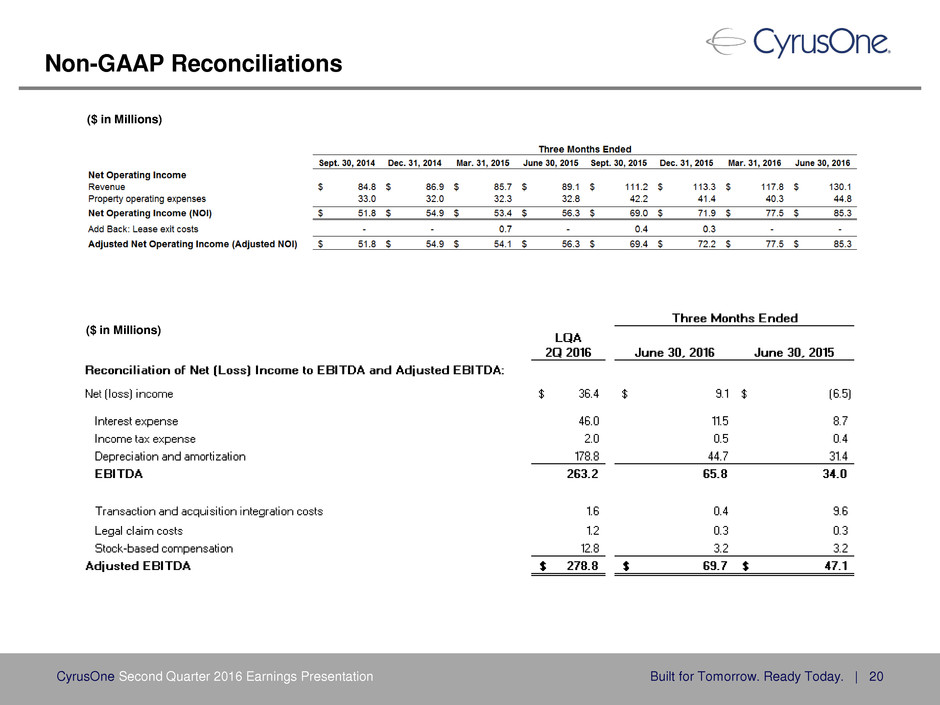
Non-GAAP Reconciliations CyrusOne Second Quarter 2016 Earnings Presentation Built for Tomorrow. Ready Today. | 20 ($ in Millions) ($ in Millions)
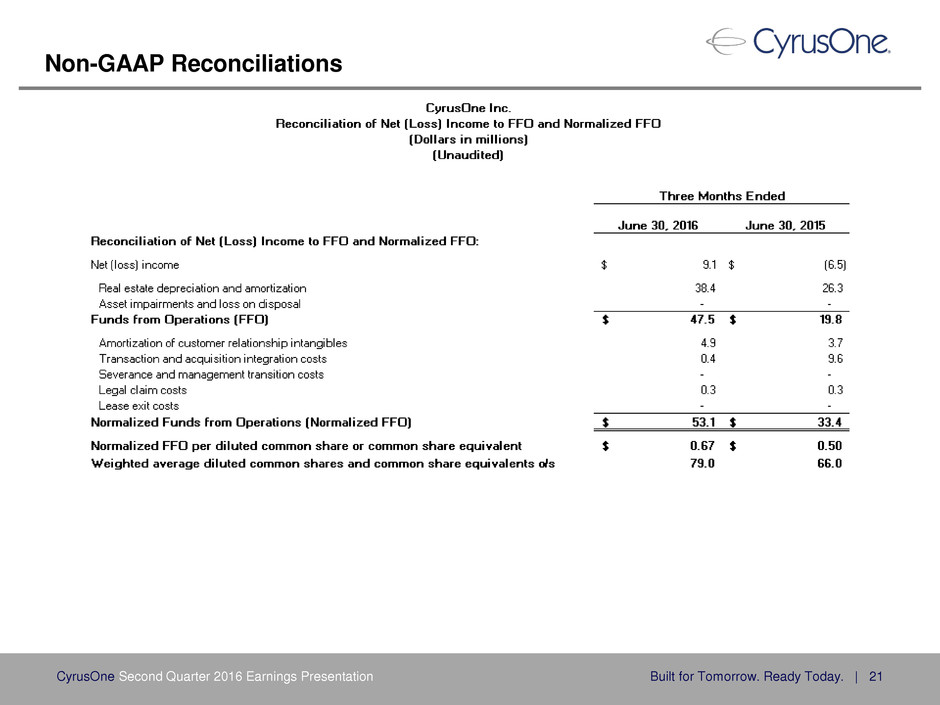
Non-GAAP Reconciliations CyrusOne Second Quarter 2016 Earnings Presentation Built for Tomorrow. Ready Today. | 21


