Exhibit 99.1
CyrusOne Reports Fourth Quarter and Full Year 2017 Earnings
4Q’17 Year-over-Year Revenue Growth of 31% and Adjusted EBITDA Growth of 43%
Announcing a 10% Increase in 1Q’18 Dividend per Share to $0.46
DALLAS (February 21, 2018) - CyrusOne Inc. (NASDAQ: CONE), a premier global data center REIT, today announced fourth quarter and full year 2017 earnings.
Highlights
|
| | | | |
| Category | 4Q’17 | % Change vs. 4Q’16 | FY’17 | % Change vs. FY’16 |
| Revenue | $180.5 million | 31% | $672.0 million | 27% |
| Net income | $2.8 million | n/m | $(83.5) million | n/m |
| Adjusted EBITDA | $104.2 million | 43% | $371.6 million | 33% |
| Normalized FFO | $78.4 million | 39% | $278.9 million | 33% |
| Net income per share | $0.03 | n/m | $(0.95) | n/m |
| Normalized FFO per share | $0.84 | 24% | $3.12 | 17% |
| |
| • | Leased 9 megawatts (“MW”) and 86,000 colocation square feet (“CSF”) in the fourth quarter, totaling $18 million in annualized GAAP revenue |
| |
| – | For full year 2017, signed more than 1,700 leases totaling 58 MW and 521,000 CSF, representing $105 million in annualized GAAP revenue |
| |
| • | Announcing a 10% increase in the quarterly dividend for the first quarter of 2018 to $0.46 per share, up from $0.42 per share in 2017 |
| |
| • | Announced agreement to acquire Zenium Data Centers (“Zenium”), extending our global footprint into Europe’s two largest markets, London and Frankfurt, and establishing a platform for further expansion in Europe |
| |
| • | Signed commercial agreement with, and made $100 million investment in, GDS Holdings Limited (“GDS”) (NASDAQ: GDS), a leading data center provider in China, creating cross-selling opportunities and expanding our global presence |
| |
| – | Value of investment has increased more than 75% as of 12/31/17 |
| |
| • | Acquired 44 acres of land in the Atlanta suburb of Douglasville, Georgia, expanding the Company’s presence in the Southeast |
| |
| • | Enhanced liquidity and strengthened balance sheet through $400 million offering of senior notes and sale of 4.8 million shares of common stock ($296 million in net proceeds) under at-the-market equity program |
“The revenue and Adjusted EBITDA growth rates for the quarter were among our highest since going public,” said Gary Wojtaszek, president and chief executive officer of CyrusOne. “We had another very strong year signing $105 million in annualized revenue, increasing the size of our footprint by more than 50%, extending our presence to the Southeastern U.S. and Europe, developing a solution for our customers in China, and raising nearly $2.5 billion in the capital markets. We are very excited about this next phase of growth for the company as we expand internationally to help our customers with their increasingly global requirements.”
Fourth Quarter 2017 Financial Results
Revenue was $180.5 million for the fourth quarter, compared to $137.4 million for the same period in 2016, an increase of 31%. The increase in revenue was driven primarily by a 49% increase in leased CSF and additional interconnection services.
Net income was $2.8 million for the fourth quarter, compared to net income of $0.8 million in the same period in 2016. Net income per basic and diluted common share1 was $0.03 in the fourth quarter of 2017, compared to net income of $0.01 per basic and diluted common share in the same period in 2016.
Net operating income (NOI)2 was $120.3 million for the fourth quarter, compared to $89.6 million in the same period in 2016, an increase of 34%. Adjusted EBITDA3 was $104.2 million for the fourth quarter, compared to $73.0 million in the same period in 2016, an increase of 43%.
Normalized Funds From Operations (Normalized FFO)4 was $78.4 million for the fourth quarter, compared to $56.4 million in the same period in 2016, an increase of 39%. Normalized FFO per basic and diluted common share was $0.84 in the fourth quarter of 2017, an increase of 24% over fourth quarter 2016.
Leasing Activity
CyrusOne leased approximately 9 MW of power and 86,000 CSF in the fourth quarter, representing $1.5 million in monthly recurring rent, inclusive of the monthly impact of installation charges, or approximately $17.6 million in annualized GAAP revenue5, excluding estimates for pass-through power. The weighted average lease term of the new leases, based on square footage, is 61 months (5.1 years), and the weighted average remaining lease term of CyrusOne’s portfolio is 53 months (taking into account the impact of the backlog). Recurring rent churn6 for the fourth quarter was 1.1%, compared to 2.2% for the same period in 2016.
Portfolio Utilization and Development
In the fourth quarter, the Company completed construction on 164,000 CSF and 20 MW of power capacity across three projects in Northern Virginia, Phoenix and Raleigh-Durham, increasing total CSF across 45 data centers to approximately 3.3 million CSF. CSF utilization7 as of the end of the fourth quarter was 93% for stabilized properties8 and 83% overall. In addition, the Company has development projects underway in Dallas, Northern Virginia, Phoenix, Austin and the New York Metro area that are expected to add approximately 163,000 CSF and 39 MW of power capacity.
Balance Sheet and Liquidity
As of December 31, 2017, the Company had gross assets9 totaling approximately $5.1 billion, an increase of approximately 48% over gross assets as of December 31, 2016. CyrusOne had $2.10 billion of long-term debt10, cash and cash equivalents of $151.9 million, and $1.1 billion available under its unsecured revolving credit facility as of December 31, 2017. Net debt10 was $1.96 billion as of December 31, 2017, representing approximately 25% of the Company's total enterprise value of $7.7 billion, or 4.7x Adjusted EBITDA for the last quarter annualized. Available liquidity11 was $1.24 billion as of December 31, 2017.
As previously announced, CyrusOne completed a $400 million offering of senior notes in early November, using the proceeds to repay borrowings outstanding under its revolving credit facility. Also in the fourth quarter, CyrusOne sold approximately 4.8 million shares of its common stock through its at-the-market equity program at an average price of $62.09, raising approximately $296 million in net equity proceeds. As of December 31, 2017, there was $200 million in remaining capacity under the current ATM program.
Dividend
On October 30, 2017, the Company announced a dividend of $0.42 per share of common stock for the fourth quarter of 2017. The dividend was paid on January 12, 2018, to stockholders of record at the close of business on December 29, 2017.
Additionally, today the Company is announcing a dividend of $0.46 per share of common stock for the first quarter of 2018, a 10% increase in the quarterly dividend compared to 2017. The dividend will be paid on April 13, 2018, to stockholders of record at the close of business on March 29, 2018.
Guidance
CyrusOne is issuing guidance for full year 2018. The annual guidance provided below represents forward-looking statements, which are based on current economic conditions, internal assumptions about the Company's existing customer base, and the supply and demand dynamics of the markets in which CyrusOne operates.
CyrusOne does not provide reconciliations for the non-GAAP financial measures included in the annual guidance provided below due to the inherent difficulty in forecasting and quantifying certain amounts that are necessary for such reconciliations, including net income (loss) and adjustments that could be made for transaction and acquisition integration costs, legal claim costs, lease exit costs, asset impairments and loss on disposals and other charges in its reconciliation of historic numbers, the amount of which, based on historical experience, could be significant.
|
| | |
| Category | 2017 Results | 2018 Guidance(1) |
| Total Revenue | $672 million | $810 - 825 million |
| Base Revenue | $602 million | $735 - 745 million |
| Metered Power Reimbursements | $70 million | $75 - 80 million |
| Adjusted EBITDA | $372 million | $460 - 470 million |
| Normalized FFO per diluted common share | $3.12 | $3.18 - 3.28 |
| Capital Expenditures | $915 million | $850 - 900 million |
| Development | $911 million | $845 - 890 million |
| Recurring | $4 million | $5 - 10 million |
| | | |
(1)Full year 2018 guidance assumes the Zenium acquisition closes on April 30, 2018. Development capital expenditures include the acquisition of land for future development.
Zenium Acquisition
During the fourth quarter, CyrusOne announced the execution of a definitive agreement with Quantum Strategic Partners Ltd. (“Quantum”), a private investment fund managed by Soros Fund Management LLC and certain other sellers named therein, to purchase Zenium, a leading hyperscale data center provider in Europe with four properties in London and Frankfurt, the continent’s two largest data center markets.
The transaction is expected to provide several key benefits to CyrusOne, including the following:
| |
| • | Critical First Step in International Expansion Strategy: The acquisition of Zenium is the first step in executing CyrusOne’s previously announced European expansion strategy, adding four properties in London and Frankfurt, the continent’s two largest data center markets. The European data center market is growing rapidly, with reported take-up over the last eighteen months well over double the prior eighteen-month period. Additionally, there has been strong demand for larger deployments, a market segment for which CyrusOne has unique expertise and capabilities. Establishing a significant European presence is a critical step in CyrusOne’s strategic objective of becoming a global provider. |
| |
| • | Accelerated Entry into Important Markets with Significant Development / Lease-Up Opportunity: With 22.5 MW of critical load available for development and lease-up, the acquisition meaningfully accelerates CyrusOne’s ability to address the increasingly global needs of its existing customers. At the same time, the Company’s expanding footprint will allow CyrusOne to more effectively compete for opportunities from potential customers looking for a single provider with a geographically diverse presence. Given the significant investment to date, CyrusOne expects to deliver this incremental capacity at an estimated build cost of approximately $115 million, or $5.1 million per MW, while the total construction cost per MW across the assets once fully built out is expected to average $6.5-7.0 million per MW, largely in line with CyrusOne’s current all-in build costs. |
| |
| • | Experienced Management Team with Similar Operating Philosophy and Customer Focus: The Zenium management team has a proven track record as data center developers and operators with more than 70 years of combined experience. CyrusOne will benefit from this local expertise in site selection and acquisition, data center development, and sales. Similar to CyrusOne, Zenium has a high-quality customer base with a particular emphasis on hyperscale cloud companies. The Zenium portfolio consists of more than 10 customers, with hyperscale companies representing nearly 75% of contracted revenue. More than half of the customers will be new to CyrusOne, including two Fortune 1000 companies. Over 75% of the contracted revenue is generated from investment grade customers, and the weighted average remaining lease term is approximately six years. |
| |
| • | Significant Operating Leverage: CyrusOne should benefit from significant operating leverage as the combined company expands within London and Frankfurt as well as into new markets, with a new site in Frankfurt already under contract and advanced discussions under way for additional organic site developments in London, Frankfurt, and Dublin. Similarly, as CyrusOne continues to evaluate acquisition opportunities in other markets, the Company expects to be able to leverage the design & construction, sales & marketing, and back-office capabilities of Zenium to generate cost synergies. |
This transaction is expected to be dilutive to Normalized FFO per diluted common share in the first twelve months following the closing, modestly accretive in the second twelve months, and meaningfully accretive thereafter.
CyrusOne intends to assume approximately $50 million of debt currently outstanding under an existing EUR credit facility, with total committed capacity of approximately $120 million based on the 12/31/17 spot exchange rate. The balance of the purchase price is expected to be financed through capacity under its $1.1 billion revolving credit facility.
Appointment of Chief Accounting Officer
On February 16, 2018, the Company’s Board of Directors appointed Howard Garfield as Senior Vice President and Chief Accounting Officer effective February 26, 2018. Mr. Garfield replaces Amitabh Rai who advised the Company of his intention to retire. Mr. Rai will remain as an employee of the company through May 1, 2018 to allow for an orderly transition.
“We are very grateful to Amit for all his contributions as Chief Accounting Officer to CyrusOne since joining the company in 2015,” said Diane M. Morefield, EVP and Chief Financial Officer. “We wish him the best in his retirement.”
"We are also very pleased to have Howard join the CyrusOne leadership team," commented Morefield. “He has a long and impressive track record in the REIT and broader real estate industry. I am confident that Howard will play a very valuable role in helping CyrusOne achieve its business objectives and continue to scale for growth."
Mr. Garfield has over 30 years of accounting, tax, treasury and financial experience, serving in senior and executive management positions with national and international real estate companies. Mr. Garfield was most recently with Monogram Residential Trust (NYSE: MORE), serving as Chief Accounting Officer and Treasurer from 2009 to September 2017, and Chief Financial Officer from 2009 to 2015. In 2008 and 2009, Mr. Garfield was Senior Vice President with Lehman Brothers in their private equity real estate funds group. Mr. Garfield was previously CFO with Hillwood Development, a real estate private equity firm controlled by Ross Perot, Jr., and MEPC plc, an international real estate company publicly traded in the U.K. and the U.S., with responsibilities over accounting, tax and treasury. Mr. Garfield started his career with Touche Ross, is a certified public accountant and holds a BBA in Business Honors, with an emphasis in accounting, from the University of Texas at Austin.
Upcoming Conferences and Events
| |
| • | MUFG Property REIT Corporate Access Day on February 27 in New York City |
| |
| • | Wells Fargo Real Estate Securities Conference on February 28-March 1 in New York City |
| |
| • | Raymond James Institutional Investor Conference on March 4-7 in Orlando, Florida |
| |
| • | Deutsche Bank Media, Telecom & Business Services Conference on March 5-7 in Palm Beach, Florida |
Conference Call Details
CyrusOne will host a conference call on February 22, 2018, at 11:00 AM Eastern Time (10:00 AM Central Time) to discuss its results for the fourth quarter of 2017. A live webcast of the conference call and the presentation to be made during the call will be available under the “Company” tab in the “Investors / Events and Presentations” section of the Company's website at http://investor.cyrusone.com/events.cfm. The U.S. conference call dial-in number is 1-844-492-3731, and the international dial-in number is 1-412-542-4121. A replay will be available one hour after the conclusion of the earnings call on February 22, 2018, through March 8, 2018. The U.S. toll-free replay dial-in number is 1-877-344-7529 and the international replay dial-in number is 1-412-317-0088. The replay access code is 10115841.
Safe Harbor
This release and the documents incorporated by reference herein contain forward-looking statements regarding future events and our future results that are subject to the "safe harbor" provisions of the Private Securities Litigation Reform Act of 1995. All statements, other than statements of historical facts, are statements that could be deemed forward-looking statements. These statements are based on current expectations, estimates, forecasts, and projections about the industries in which we operate and the beliefs and assumptions of our management. Words such as "expects," "anticipates," "predicts," "projects," "intends," "plans," "believes," "seeks," "estimates," "continues," "endeavors," "strives," "may," variations of such words and similar expressions are intended to identify such forward-looking statements. In addition, any statements that refer to projections of our future financial performance, our anticipated growth and trends in our businesses, and other characterizations of future events or circumstances are forward-looking statements. Readers are cautioned these forward-looking statements are based on current expectations and assumptions that are subject to risks and uncertainties, which could cause our actual results to differ materially and adversely from those reflected in the forward-looking statements. Factors that could cause or contribute to such differences include, but are not limited to, those discussed in this release and those discussed in other documents we file with the Securities and Exchange Commission (SEC). More information on potential risks and uncertainties is available in our recent filings with the SEC, including CyrusOne's Form 10-K
report, Form 10-Q reports, and Form 8-K reports. Actual results may differ materially and adversely from those expressed in any forward-looking statements. We undertake no obligation to revise or update any forward-looking statements for any reason.
Use of Non-GAAP Financial Measures
This press release contains certain non-GAAP financial measures that management believes are helpful in understanding the Company's business, as further discussed within this press release. These financial measures, which include Funds From Operations, Normalized Funds From Operations, Adjusted EBITDA, Net Operating Income, Adjusted Net Operating Income, and Net Debt should not be construed as being more important than comparable GAAP measures. Detailed reconciliations of these non-GAAP financial measures to comparable GAAP financial measures have been included in the tables that accompany this release and are available in the Investor Relations section of www.cyrusone.com.
Management uses FFO, Normalized FFO, Adjusted EBITDA, NOI, and Adjusted NOI as supplemental performance measures because they provide performance measures that, when compared year over year, capture trends in occupancy rates, rental rates and operating costs. The Company also believes that, as widely recognized measures of the performance of real estate investment trusts (REITs) and other companies, these measures will be used by investors as a basis to compare its operating performance with that of other companies. Other companies may not calculate these measures in the same manner, and, as presented, they may not be comparable to others. Therefore, FFO, Normalized FFO, NOI, Adjusted NOI, and Adjusted EBITDA should be considered only as supplements to net income as measures of our performance. FFO, Normalized FFO, NOI, Adjusted NOI, and Adjusted EBITDA should not be used as measures of liquidity or as indicative of funds available to fund the Company's cash needs, including the ability to pay dividends. These measures also should not be used as substitutes for cash flow from operating activities computed in accordance with U.S. GAAP.
1Net income / (loss) per common share is defined as net income / (loss) divided by the weighted average common shares outstanding for the period, which were 93.5 million for the fourth quarter of 2017.
2Net Operating Income (NOI) is defined as revenue less property operating expenses. Amortization of deferred leasing costs is presented in depreciation and amortization, which is excluded from NOI. CyrusOne has not historically incurred any tenant improvement costs. Our sales and marketing costs consist of salaries and benefits for our internal sales staff, travel and entertainment, office supplies, marketing and advertising costs. General and administrative costs include salaries and benefits of our senior management and support functions, legal and consulting costs, and other administrative costs. Marketing and advertising costs are not property-specific, rather these costs support our entire portfolio. As a result, we have excluded these marketing and advertising costs from our NOI calculation, consistent with the treatment of general and administrative costs, which also support our entire portfolio. From time to time, there may be non-recurring costs in property operating expenses, and as a result the Company may present Adjusted Net Operating Income (Adjusted NOI) to exclude the impacts of those costs.
3Adjusted EBITDA is defined as net income (loss) as defined by U.S. GAAP plus interest expense, income tax (benefit) expense, depreciation and amortization, stock-based compensation, transaction and integration costs, severance and management transition costs, new accounting standards and systems implementation costs, asset impairments and (gain) loss on disposals, lease exit costs, legal claim costs and other special items. Other companies may not calculate Adjusted EBITDA in the same manner. Accordingly, the Company's Adjusted EBITDA as presented may not be comparable to others.
4Normalized Funds From Operations (Normalized FFO) is defined as Funds From Operations (FFO) plus amortization of customer relationship intangibles, transaction and acquisition integration costs, legal claim costs and lease exit costs, and other special items including loss on extinguishment of debt, severance and management transition costs, and new accounting standards and systems implementation costs, as appropriate. FFO is net (loss) income computed in accordance with U.S. GAAP before real estate depreciation and amortization and Asset impairments and loss on disposal. While it is consistent with the definition of FFO promulgated by the National Association of Real Estate Investment Trusts, our computation of FFO may differ from the methodology for calculating FFO used by other REITs. Accordingly, our FFO may not be comparable to others. Because the value of the customer relationship intangibles is inextricably connected to the real estate acquired, CyrusOne believes the amortization of such intangibles and impairments of such intangibles is analogous to real estate depreciation and impairments; therefore, the Company adds the customer relationship intangible amortization and impairments back for similar treatment with real estate depreciation and impairments. The Company believes its Normalized FFO calculation provides a comparable measure to that used by others in the industry. However, other REITs may not calculate Normalized FFO in the same manner. Accordingly, the Company’s Normalized FFO may not be comparable to others. In addition, because FFO and Normalized FFO exclude real estate depreciation and amortization and real estate impairments, and capture neither the changes in the value of our properties that result from use or from market conditions, nor the level of capital expenditures and leasing commissions necessary to maintain the operating performance of our properties, all of which have real economic effect and could materially impact our results from operations, the utility of FFO and Normalized FFO as measures of our performance is limited. Therefore, FFO and Normalized FFO should be considered only as supplements to net income (loss) as measures of our performance.
5Annualized GAAP revenue is equal to monthly recurring rent, defined as average monthly contractual rent during the term of the lease plus the monthly impact of installation charges, multiplied by 12. It can be shown both inclusive and exclusive of the Company’s estimate of customer reimbursements for metered power.
6Recurring rent churn is calculated as any reduction in recurring rent due to customer terminations, service reductions or net pricing decreases as a percentage of rent at the beginning of the period, excluding any impact from metered power reimbursements or other usage-based billing.
7CSF utilization is calculated by dividing CSF under signed leases for available space (whether or not the contract has commenced billing) by total CSF. CSF Utilized differs from CSF Leased presented in the Data Center Portfolio table because the utilization rate includes CSF for signed leases that have not commenced billing.
8Stabilized properties include data halls that have been in service for at least 24 months or are at least 85% utilized.
9Gross asset value is defined as total assets plus accumulated depreciation.
10Long-term debt and net debt exclude adjustments for deferred financing costs. Net debt provides a useful measure of liquidity and financial health. The Company defines net debt as long-term debt and capital lease obligations, offset by cash and cash equivalents.
11Liquidity is calculated as cash, cash equivalents, and temporary cash investments on hand, plus the undrawn capacity on CyrusOne's revolving credit facility.
About CyrusOne
CyrusOne (NASDAQ: CONE) is a high-growth real estate investment trust (REIT) specializing in highly reliable enterprise-class, carrier-neutral data center properties. The Company provides mission-critical data center facilities that protect and ensure the continued operation of IT infrastructure for nearly 1,000 customers, including 197 Fortune 1000 companies.
With a track record of meeting and surpassing the aggressive speed-to-market demands of hyperscale cloud providers, as well as the expanding IT infrastructure requirements of the enterprise, CyrusOne provides the flexibility, reliability, security, and connectivity that foster business growth. CyrusOne offers a tailored, customer service-focused platform and is committed to full transparency in communication, management, and service delivery throughout its 45 data centers worldwide. Additional information about CyrusOne can be found at www.CyrusOne.com.
# # #
Investor Relations:
Michael Schafer
Vice President, Capital Markets & Investor Relations
972-350-0060
investorrelations@cyrusone.com
Company Profile
CyrusOne (NASDAQ: CONE) specializes in highly reliable enterprise-class, carrier-neutral data center properties. The Company provides mission-critical data center facilities that protect and ensure the continued operation of IT infrastructure for nearly 1,000 customers, including 197 Fortune 1000 companies. CyrusOne's data center offerings provide the flexibility, reliability, and security that enterprise customers require and are delivered through a tailored, customer service-focused platform designed to foster long-term relationships. CyrusOne is committed to full transparency in communication, management, and service delivery throughout its 45 data centers worldwide.
| |
| • | Best-in-Class Sales Force |
| |
| • | Flexible Solutions that Scale as Customers Grow |
| |
| • | Massively Modular® Engineering with Data Hall Builds in 10-14 Weeks |
| |
| • | Focus on Operational Excellence and Superior Customer Service |
| |
| • | Proven Leading-Edge Technology Delivering Power Densities up to 900 Watts per Square Foot |
| |
| • | National IX Replicates Enterprise Data Center Architecture |
|
| | |
| Corporate Headquarters | Senior Management |
| 2101 Cedar Springs Road, Ste. 900 | Gary Wojtaszek, President and CEO | Robert Jackson, EVP General Counsel & Secretary |
| Dallas, Texas 75201 | Diane Morefield, EVP & Chief Financial Officer | John Hatem, EVP Design, Construction & Operations |
| Phone: (972) 350-0060 | Kevin Timmons, EVP & Chief Technology Officer | Blake Hankins, Chief Information Officer |
| Website: www.cyrusone.com | Tesh Durvasula, EVP & Chief Commercial Officer | John Gould, EVP Global Sales |
| | Jonathan Schildkraut, EVP & Chief Strategy Officer | Brent Behrman, EVP Strategic Sales |
| | Kellie Teal-Guess, EVP & Chief People Officer | Amitabh Rai, SVP & Chief Accounting Officer |
Analyst Coverage
|
| | |
| Firm | Analyst | Phone Number |
| Bank of America Merrill Lynch | Michael J. Funk | (646) 855-5664 |
| Barclays | Amir Rozwadowski | (212) 526-4043 |
| Citi | Mike Rollins | (212) 816-1116 |
| Cowen and Company | Colby Synesael | (646) 562-1355 |
| Credit Suisse | Sami Badri | (212) 538-1727 |
| Deutsche Bank | Vin Chao | (212) 250-6799 |
| Gabelli & Company | Sergey Dluzhevskiy | (914) 921-8355 |
| Guggenheim Securities, LLC | Robert Gutman | (212) 518-9148 |
| Jefferies | Jonathan Petersen | (212) 284-1705 |
| J.P. Morgan | Richard Choe | (212) 622-6708 |
| KeyBanc Capital Markets | Jordan Sadler | (917) 368-2280 |
| Morgan Stanley | Simon Flannery | (212) 761-6432 |
| MUFG Securities | Stephen Bersey | (212) 405-7032 |
| RBC Capital Markets | Jonathan Atkin | (415) 633-8589 |
| Raymond James | Frank G. Louthan IV | (404) 442-5867 |
| SunTrust Robinson Humphrey | Greg Miller | (212) 303-4169 |
| UBS | John C. Hodulik, CFA | (212) 713-4226 |
| Wells Fargo | Eric Luebchow | (312) 630-2386 |
| William Blair | Jim Breen, CFA | (617) 235-7513 |
CyrusOne Inc.
Summary of Financial Data
(Dollars in millions, except per share amounts)
|
| | | | | | | | | | | | | | | | | | | |
| | Three Months | | Twelve Months | |
| | December 31, | September 30, | December 31, | Growth % | December 31, | Growth % |
| | 2017 | 2017 | 2016 | Yr/Yr | 2017 | 2016 | Yr/Yr |
| Revenue | $ | 180.5 |
| $ | 175.3 |
| $ | 137.4 |
| 31 | % | $ | 672.0 |
| $ | 529.1 |
| 27 | % |
| Net operating income | 120.3 |
| 112.3 |
| 89.6 |
| 34 | % | 436.9 |
| 341.6 |
| 28 | % |
| Net income (loss) | 2.8 |
| (55.1 | ) | 0.8 |
| n/m |
| (83.5 | ) | 19.9 |
| n/m |
|
| Funds from operations (FFO) | 65.6 |
| 60.7 |
| 48.1 |
| 36 | % | 202.9 |
| 182.8 |
| 11 | % |
| Normalized Funds from Operations (NFFO) | 78.4 |
| 71.4 |
| 56.4 |
| 39 | % | 278.9 |
| 210.2 |
| 33 | % |
| Weighted Average diluted common shares outstanding | 93.5 |
| 90.9 |
| 82.9 |
| 13 | % | 89.4 |
| 79.0 |
| 13 | % |
| Income (loss) per share - basic and diluted | $ | 0.03 |
| $ | (0.61 | ) | $ | 0.01 |
| n/m |
| $ | (0.95 | ) | $ | 0.24 |
| n/m |
|
| Normalized FFO per diluted common share | $ | 0.84 |
| $ | 0.79 |
| $ | 0.68 |
| 24 | % | $ | 3.12 |
| $ | 2.66 |
| 17 | % |
| Adjusted EBITDA | 104.2 |
| 95.9 |
| 73.0 |
| 43 | % | 371.6 |
| 278.5 |
| 33 | % |
| Adjusted EBITDA as a % of Revenue | 57.7 | % | 54.7 | % | 53.1 | % | 4.6 pts |
| 55.3 | % | 52.6 | % | 2.7 pts |
|
|
| | | | | | | | | | | |
| | As of | |
| | December 31, | September 30, | December 31, | Growth % |
| | 2017 | 2017 | 2016 | Yr/Yr |
| Balance Sheet Data | | | | |
| Gross investment in real estate | $ | 3,840.8 |
| $ | 3,656.1 |
| $ | 2,601.6 |
| 48 | % |
| Accumulated depreciation | (782.4 | ) | (722.1 | ) | (578.5 | ) | 35 | % |
| Net investment in real estate | 3,058.4 |
| 2,934.0 |
| 2,023.1 |
| 51 | % |
| Cash and cash equivalents | 151.9 |
| 24.6 |
| 14.6 |
| n/m |
|
| Market value of common equity | 5,723.1 |
| 5,379.7 |
| 3,736.6 |
| 53 | % |
| Net debt | 1,958.2 |
| 2,024.0 |
| 1,258.5 |
| 56 | % |
| Total enterprise value | 7,681.3 |
| 7,403.7 |
| 4,995.1 |
| 54 | % |
| Net debt to LQA Adjusted EBITDA | 4.7x | 5.3x | 4.3x | 0.4x |
| | | | | |
| Dividend Activity | | | | |
| Dividends per share | $ | 0.42 |
| $ | 0.42 |
| $ | 0.38 |
| 11 | % |
| | | | | |
| Portfolio Statistics | | | | |
| Data centers | 45 |
| 44 |
| 35 |
| 29 | % |
| Stabilized CSF | 2,653,300 |
| 2,493,617 |
| 1,895,867 |
| 40 | % |
| Stabilized CSF % utilized | 93 | % | 93 | % | 92 | % | 1 pt |
|
| Total CSF | 3,266,647 |
| 3,130,404 |
| 2,079,502 |
| 57 | % |
| Total CSF % utilized | 83 | % | 82 | % | 85 | % | (2) pts |
|
| Total NRSF | 5,716,701 |
| 5,565,419 |
| 3,903,969 |
| 46 | % |
| | | | |
|
|
| | | | | |
| | | | | |
CyrusOne Inc.
Condensed Consolidated Statements of Operations
(Dollars in millions, except per share amounts)
(Unaudited)
|
| | | | | | | | | | | | | | | | | | | | | | |
| | Three Months | | | Twelve Months | | |
| | Ended December 31, | Change | Ended December 31, | Change |
| | 2017 | 2016 | $ | % | 2017 | 2016 | $ | % |
| Revenue: | | | | | | | | |
| Base revenue and other | $ | 161.6 |
| $ | 123.2 |
| $ | 38.4 |
| 31 | % | $ | 602.4 |
| $ | 476.7 |
| $ | 125.7 |
| 26 | % |
| Metered power reimbursements | 18.9 |
| 14.2 |
| 4.7 |
| 33 | % | 69.6 |
| 52.4 |
| 17.2 |
| 33 | % |
| Revenue | 180.5 |
| 137.4 |
| 43.1 |
| 31 | % | 672.0 |
| 529.1 |
| 142.9 |
| 27 | % |
| Costs and expenses: | | | | | | | | |
| Property operating expenses | 60.2 |
| 47.8 |
| 12.4 |
| 26 | % | 235.1 |
| 187.5 |
| 47.6 |
| 25 | % |
| Sales and marketing | 3.9 |
| 4.0 |
| (0.1 | ) | (3 | )% | 17.0 |
| 16.9 |
| 0.1 |
| 1 | % |
| General and administrative | 16.4 |
| 17.9 |
| (1.5 | ) | (8 | )% | 67.0 |
| 60.7 |
| 6.3 |
| 10 | % |
| Depreciation and amortization | 70.8 |
| 49.3 |
| 21.5 |
| 44 | % | 258.9 |
| 183.9 |
| 75.0 |
| 41 | % |
| Transaction and acquisition integration costs | 5.1 |
| 0.4 |
| 4.7 |
| n/m |
| 10.4 |
| 4.3 |
| 6.1 |
| n/m |
|
| Asset impairments and loss on disposal | 0.2 |
| 5.3 |
| (5.1 | ) | n/m |
| 59.5 |
| 5.3 |
| 54.2 |
| n/m |
|
| Total costs and expenses | 156.6 |
| 124.7 |
| 31.9 |
| 26 | % | 647.9 |
| 458.6 |
| 189.3 |
| 41 | % |
| Operating income | 23.9 |
| 12.7 |
| 11.2 |
| 88 | % | 24.1 |
| 70.5 |
| (46.4 | ) | (66 | )% |
| Interest expense | 20.1 |
| 11.4 |
| 8.7 |
| 76 | % | 68.1 |
| 48.8 |
| 19.3 |
| 40 | % |
| Loss on extinguishment of debt | — |
| — |
| — |
| n/m |
| 36.5 |
| — |
| 36.5 |
| n/m |
|
| Net (loss) income before income taxes | 3.8 |
| 1.3 |
| 2.5 |
| n/m |
| (80.5 | ) | 21.7 |
| (102.2 | ) | n/m |
|
| Income tax expense | (1.0 | ) | (0.5 | ) | (0.5 | ) | 100 | % | (3.0 | ) | (1.8 | ) | (1.2 | ) | 67 | % |
| Net (loss) income | $ | 2.8 |
| $ | 0.8 |
| $ | 2.0 |
| n/m |
| $ | (83.5 | ) | $ | 19.9 |
| $ | (103.4 | ) | n/m |
|
| (Loss) income per share - basic and diluted | $ | 0.03 |
| $ | 0.01 |
| $ | 0.02 |
| n/m |
| $ | (0.95 | ) | $ | 0.24 |
| $ | (1.19 | ) | n/m |
|
CyrusOne Inc.
Condensed Consolidated Balance Sheets
(Dollars in millions)
(Unaudited)
|
| | | | | | | | | | | |
| | December 31, | December 31, | Change |
| | 2017 | 2016 | $ | % |
| Assets | | | | |
| Investment in real estate: | | | | |
| Land | $ | 177.1 |
| $ | 142.7 |
| $ | 34.4 |
| 24 | % |
| Buildings and improvements | 1,371.4 |
| 1,008.9 |
| 362.5 |
| 36 | % |
| Equipment | 1,813.9 |
| 1,042.9 |
| 771.0 |
| 74 | % |
| Construction in progress | 478.4 |
| 407.1 |
| 71.3 |
| 18 | % |
| Subtotal | 3,840.8 |
| 2,601.6 |
| 1,239.2 |
| 48 | % |
| Accumulated depreciation | (782.4 | ) | (578.5 | ) | (203.9 | ) | 35 | % |
| Net investment in real estate | 3,058.4 |
| 2,023.1 |
| 1,035.3 |
| 51 | % |
| Cash and cash equivalents | 151.9 |
| 14.6 |
| 137.3 |
| n/m |
|
| Rent and other receivables, net | 90.5 |
| 83.3 |
| 7.2 |
| 9 | % |
| Goodwill | 455.1 |
| 455.1 |
| — |
| — | % |
| Intangible assets, net | 203.0 |
| 150.2 |
| 52.8 |
| 35 | % |
| Other assets | 353.2 |
| 126.1 |
| 227.1 |
| n/m |
|
| Total assets | $ | 4,312.1 |
| $ | 2,852.4 |
| $ | 1,459.7 |
| 51 | % |
| Liabilities and Equity | | |
|
|
| Accounts payable and accrued expenses | $ | 255.2 |
| $ | 227.1 |
| $ | 28.1 |
| 12 | % |
| Deferred revenue | 111.6 |
| 76.7 |
| 34.9 |
| 46 | % |
| Capital lease obligations | 10.1 |
| 10.8 |
| (0.7 | ) | (6 | )% |
| Long-term debt, net | 2,089.4 |
| 1,240.1 |
| 849.3 |
| 68 | % |
| Lease financing arrangements | 131.9 |
| 135.7 |
| (3.8 | ) | (3 | )% |
| Total liabilities | 2,598.2 |
| 1,690.4 |
| 907.8 |
| 54 | % |
| Equity: |
| |
|
|
| Preferred stock, $.01 par value, 100,000,000 authorized; no shares issued or outstanding | — |
| — |
| — |
| — | % |
| Common stock, $.01 par value, 500,000,000 shares authorized and 96,137,874 and 83,536,250 shares issued and outstanding at December 31, 2017 and December 31, 2016, respectively | 1.0 |
| 0.8 |
| 0.2 |
| 25 | % |
| Additional paid in capital | 2,125.6 |
| 1,412.3 |
| 713.3 |
| 51 | % |
| Accumulated deficit | (486.9 | ) | (249.8 | ) | (237.1 | ) | 95 | % |
| Accumulated other comprehensive loss | 74.2 |
| (1.3 | ) | 75.5 |
| — | % |
| Total stockholders’ equity | 1,713.9 |
| 1,162.0 |
| 551.9 |
| 47 | % |
| Total liabilities and equity | $ | 4,312.1 |
| $ | 2,852.4 |
| $ | 1,459.7 |
| 51 | % |
CyrusOne Inc.
Condensed Consolidated Statements of Operations
(Dollars in millions, except per share amounts)
(Unaudited)
|
| | | | | | | | | | | | | | | |
| For the three months ended: | December 31, | September 30, | June 30, | March 31, | December 31, |
| | 2017 | 2017 | 2017 | 2017 | 2016 |
| Revenue: | | | | | |
| Base revenue and other | $ | 161.6 |
| $ | 155.5 |
| $ | 151.1 |
| $ | 134.2 |
| $ | 123.2 |
|
| Metered power reimbursements | 18.9 |
| 19.8 |
| 15.8 |
| 15.1 |
| 14.2 |
|
| Revenue | 180.5 |
| 175.3 |
| 166.9 |
| 149.3 |
| 137.4 |
|
| Costs and expenses: | | | | | |
| Property operating expenses | 60.2 |
| 63.0 |
| 59.6 |
| 52.3 |
| 47.8 |
|
| Sales and marketing | 3.9 |
| 3.9 |
| 4.3 |
| 4.9 |
| 4.0 |
|
| General and administrative | 16.4 |
| 17.5 |
| 17.3 |
| 15.8 |
| 17.9 |
|
| Depreciation and amortization | 70.8 |
| 68.7 |
| 63.7 |
| 55.7 |
| 49.3 |
|
| Transaction and acquisition integration costs | 5.1 |
| 3.0 |
| 1.7 |
| 0.6 |
| 0.4 |
|
| Asset impairments and loss on disposal | 0.2 |
| 55.5 |
| 3.6 |
| 0.2 |
| 5.3 |
|
| Total costs and expenses | 156.6 |
| 211.6 |
| 150.2 |
| 129.5 |
| 124.7 |
|
| Operating income | 23.9 |
| (36.3 | ) | 16.7 |
| 19.8 |
| 12.7 |
|
| Interest expense | 20.1 |
| 17.9 |
| 16.5 |
| 13.6 |
| 11.4 |
|
| Loss on extinguishment of debt | — |
| — |
| 0.3 |
| 36.2 |
| — |
|
| Net (loss) income before income taxes | 3.8 |
| (54.2 | ) | (0.1 | ) | (30.0 | ) | 1.3 |
|
| Income tax expense | (1.0 | ) | (0.9 | ) | (0.7 | ) | (0.4 | ) | (0.5 | ) |
| Net (loss) income | $ | 2.8 |
| $ | (55.1 | ) | $ | (0.8 | ) | $ | (30.4 | ) | $ | 0.8 |
|
| (Loss) income per share - basic and diluted | $ | 0.03 |
| $ | (0.61 | ) | $ | (0.01 | ) | $ | (0.36 | ) | $ | 0.01 |
|
CyrusOne Inc.
Condensed Consolidated Balance Sheets
(Dollars in millions)
(Unaudited)
|
| | | | | | | | | | | | | | | |
| | December 31, | September 30, | June 30, | March 31, | December 31, |
| | 2017 | 2017 | 2017 | 2017 | 2016 |
| Assets | | | | | |
| Investment in real estate: | | | | | |
| Land | $ | 177.1 |
| $ | 172.0 |
| $ | 160.0 |
| $ | 156.9 |
| $ | 142.7 |
|
| Buildings and improvements | 1,371.4 |
| 1,344.0 |
| 1,291.7 |
| 1,270.9 |
| 1,008.9 |
|
| Equipment | 1,813.9 |
| 1,721.2 |
| 1,525.3 |
| 1,438.0 |
| 1,042.9 |
|
| Construction in progress | 478.4 |
| 418.9 |
| 555.8 |
| 371.7 |
| 407.1 |
|
| Subtotal | 3,840.8 |
| 3,656.1 |
| 3,532.8 |
| 3,237.5 |
| 2,601.6 |
|
| Accumulated depreciation | (782.4 | ) | (722.1 | ) | (679.6 | ) | (625.9 | ) | (578.5 | ) |
| Net investment in real estate | 3,058.4 |
| 2,934.0 |
| 2,853.2 |
| 2,611.6 |
| 2,023.1 |
|
| Cash and cash equivalents | 151.9 |
| 24.6 |
| 40.0 |
| 20.4 |
| 14.6 |
|
| Rent and other receivables, net | 90.5 |
| 93.0 |
| 93.4 |
| 89.4 |
| 83.3 |
|
| Restricted cash | — |
| 0.1 |
| 0.8 |
| 0.6 |
| — |
|
| Goodwill | 455.1 |
| 455.1 |
| 455.1 |
| 455.1 |
| 455.1 |
|
| Intangible assets, net | 203.0 |
| 209.7 |
| 216.3 |
| 223.1 |
| 150.2 |
|
| Other assets | 353.2 |
| 167.3 |
| 157.8 |
| 143.6 |
| 126.1 |
|
| Total assets | $ | 4,312.1 |
| $ | 3,883.8 |
| $ | 3,816.6 |
| $ | 3,543.8 |
| $ | 2,852.4 |
|
| Liabilities and Equity | | | | | |
| Accounts payable and accrued expenses | $ | 255.2 |
| $ | 244.7 |
| $ | 276.0 |
| $ | 268.2 |
| $ | 227.1 |
|
| Deferred revenue | 111.6 |
| 104.8 |
| 96.5 |
| 93.3 |
| 76.7 |
|
| Capital lease obligations | 10.1 |
| 10.9 |
| 11.7 |
| 12.4 |
| 10.8 |
|
| Long-term debt, net | 2,089.4 |
| 2,013.7 |
| 1,832.5 |
| 1,731.8 |
| 1,240.1 |
|
| Lease financing arrangements | 131.9 |
| 133.3 |
| 134.0 |
| 134.5 |
| 135.7 |
|
| Total liabilities | 2,598.2 |
| 2,507.4 |
| 2,350.7 |
| 2,240.2 |
| 1,690.4 |
|
| Equity: | | | | | |
| Preferred stock, $.01 par value, 100,000,000 authorized; no shares issued or outstanding | — |
| — |
| — |
| — |
| — |
|
| Common stock, $.01 par value, 500,000,000 shares authorized and 96,137,874 and 83,536,250 shares issued and outstanding at December 31, 2017 and December 31, 2016, respectively | 1.0 |
| 0.9 |
| 0.9 |
| 0.9 |
| 0.8 |
|
| Additional paid in capital | 2,125.6 |
| 1,826.0 |
| 1,821.9 |
| 1,620.5 |
| 1,412.3 |
|
| Accumulated deficit | (486.9 | ) | (449.2 | ) | (355.7 | ) | (316.5 | ) | (249.8 | ) |
| Accumulated other comprehensive loss | 74.2 |
| (1.3 | ) | (1.2 | ) | (1.3 | ) | (1.3 | ) |
| Total stockholders' equity | 1,713.9 |
| 1,376.4 |
| 1,465.9 |
| 1,303.6 |
| 1,162.0 |
|
| Total liabilities and equity | $ | 4,312.1 |
| $ | 3,883.8 |
| $ | 3,816.6 |
| $ | 3,543.8 |
| $ | 2,852.4 |
|
CyrusOne Inc.
Condensed Consolidated Statements of Cash Flow
(Dollars in millions)
(Unaudited)
|
| | | | | | | | | | | | |
| | Twelve Months Ended December 31, 2017 | Twelve Months Ended December 31, 2016 | Three Months Ended December 31, 2017 | Three Months Ended December 31, 2016 |
| Cash flows from operating activities: | | | | |
| Net (loss) income | $ | (83.5 | ) | $ | 19.9 |
| $ | 2.8 |
| $ | 0.8 |
|
| Adjustments to reconcile net (loss) income to net cash provided by operating activities: | | | | |
| Depreciation and amortization | 258.9 |
| 183.9 |
| 70.8 |
| 49.3 |
|
| Non-cash interest expense and change in interest accrual | 16.5 |
| 4.8 |
| 14.4 |
| (6.3 | ) |
| Stock-based compensation expense | 14.7 |
| 12.3 |
| 3.1 |
| 3.8 |
|
| Provision for bad debt | 0.2 |
| 1.6 |
| (0.3 | ) | 0.7 |
|
| Loss on extinguishment of debt | 36.5 |
| — |
| — |
| — |
|
| Asset impairments and loss on disposal | 59.5 |
| 5.3 |
| 0.2 |
| 5.3 |
|
| Change in operating assets and liabilities: | | | | |
| Rent receivables and other assets | (64.3 | ) | (51.7 | ) | (10.6 | ) | (22.7 | ) |
| Accounts payable and accrued expenses | 17.0 |
| 7.0 |
| 12.2 |
| 4.4 |
|
| Deferred revenues | 34.0 |
| (2.5 | ) | 6.8 |
| 3.7 |
|
| Net cash provided by operating activities | 289.5 |
| 180.6 |
| 99.4 |
| 39.0 |
|
| Cash flows from investing activities: | | | | |
| Capital expenditures – asset acquisitions, net of cash acquired | (492.3 | ) | (131.1 | ) | — |
| — |
|
| Capital expenditures – other development | (914.5 | ) | (600.0 | ) | (205.4 | ) | (174.6 | ) |
| Equity investment | (100.0 | ) | — |
| (100.0 | ) | — |
|
| Net cash used in investing activities | (1,506.8 | ) | (731.1 | ) | (305.4 | ) | (174.6 | ) |
| Cash flows from financing activities: | | |
| |
| Issuance of common stock | 706.0 |
| 448.7 |
| 297.2 |
| 0.1 |
|
| Stock issuance costs | (0.3 | ) | (1.6 | ) | (0.3 | ) | — |
|
| Dividends paid | (145.7 | ) | (114.3 | ) | (38.3 | ) | (31.5 | ) |
| Borrowings from credit facility | 1,390.0 |
| 710.0 |
| 200.0 |
| 180.0 |
|
| Payments on credit facility | (1,275.0 | ) | (460.0 | ) | (537.7 | ) | — |
|
| Payments on senior notes | (474.8 | ) | — |
| — |
| — |
|
| Proceeds from issuance of debt | 1,217.8 |
| — |
| 417.8 |
| — |
|
| Payments on capital leases and lease financing arrangements | (9.8 | ) | (9.1 | ) | (2.5 | ) | (2.3 | ) |
| Interest paid by lenders on issuance of the senior notes | 2.7 |
| — |
| 2.7 |
| — |
|
| Payment of note payable | — |
| (1.5 | ) | — |
| — |
|
| Debt issuance costs | (19.0 | ) | (8.7 | ) | (5.4 | ) | (6.6 | ) |
| Payment of debt extinguishment costs | (30.4 | ) | — |
| — |
| — |
|
| Tax payment upon exercise of equity awards | (6.9 | ) | (14.2 | ) | (0.3 | ) | (0.5 | ) |
| Net cash provided by financing activities | 1,354.6 |
| 549.3 |
| 333.2 |
| 139.2 |
|
| Net increase (decrease) in cash, cash equivalents and restricted cash | 137.3 |
| (1.2 | ) | 127.2 |
| 3.6 |
|
| Cash, cash equivalents and restricted cash at beginning of period | 14.6 |
| 15.8 |
| 24.7 |
| 11.0 |
|
| Cash, cash equivalents and restricted cash at end of period | $ | 151.9 |
| $ | 14.6 |
| $ | 151.9 |
| $ | 14.6 |
|
| | | | | |
| | | | | |
| | | | | |
| | | | | |
| | | |
| |
|
| | | | | | | | | | | | |
| | Twelve Months Ended December 31, 2017 | Twelve Months Ended December 31, 2016 | Three Months Ended December 31, 2017 | Three Months Ended December 31, 2016 |
| Supplemental disclosures | | |
| |
| Cash paid for interest | $ | 68.8 |
| $ | 55.0 |
| $ | 10.6 |
| $ | 21.6 |
|
| Cash paid for income taxes | 2.2 |
| 1.2 |
| 0.3 |
| — |
|
| Capitalized interest | 17.0 |
| 10.6 |
| 4.6 |
| 3.8 |
|
| Non-cash investing and financing activities | | | | |
| Acquisition and development of properties in accounts payable and other liabilities | 115.5 |
| 132.7 |
| 115.5 |
| 132.7 |
|
| Dividends payable | 41.8 |
| 33.9 |
| 41.8 |
| 33.9 |
|
CyrusOne Inc.
Net Operating Income and Reconciliation of Net (Loss) Income to Adjusted EBITDA
(Dollars in millions)
(Unaudited)
|
| | | | | | | | | | | | | | | | | | | | | | | | | |
| | Twelve Months Ended | | | Three Months Ended |
| | December 31, | Change | December 31, | September 30, | June 30, | March 31, | December 31, |
| | 2017 | 2016 | $ | % | 2017 | 2017 | 2017 | 2017 | 2016 |
| Net Operating Income | | | | | | | | | |
| Revenue | $ | 672.0 |
| $ | 529.1 |
| $ | 142.9 |
| 27% | $ | 180.5 |
| $ | 175.3 |
| $ | 166.9 |
| $ | 149.3 |
| $ | 137.4 |
|
| Property operating expenses | 235.1 |
| 187.5 |
| 47.6 |
| 25% | 60.2 |
| 63.0 |
| 59.6 |
| 52.3 |
| 47.8 |
|
| Net Operating Income (NOI) | $ | 436.9 |
| $ | 341.6 |
| $ | 95.3 |
| 28% | $ | 120.3 |
| $ | 112.3 |
| $ | 107.3 |
| $ | 97.0 |
| $ | 89.6 |
|
| NOI as a % of Revenue | 65.0 | % | 64.6 | % | | | 66.6 | % | 64.1 | % | 64.3 | % | 65.0 | % | 65.2 | % |
| Reconciliation of Net (Loss) Income to Adjusted EBITDA: | | | | | | | | | |
| Net (loss) income | $ | (83.5 | ) | $ | 19.9 |
| $ | (103.4 | ) | n/m | $ | 2.8 |
| $ | (55.1 | ) | $ | (0.8 | ) | $ | (30.4 | ) | $ | 0.8 |
|
| Interest expense | 68.1 |
| 48.8 |
| 19.3 |
| 40% | 20.1 |
| 17.9 |
| 16.5 |
| 13.6 |
| 11.4 |
|
| Income tax expense | 3.0 |
| 1.8 |
| 1.2 |
| 67% | 1.0 |
| 0.9 |
| 0.7 |
| 0.4 |
| 0.5 |
|
| Depreciation and amortization | 258.9 |
| 183.9 |
| 75.0 |
| 41% | 70.8 |
| 68.7 |
| 63.7 |
| 55.7 |
| 49.3 |
|
| Transaction and acquisition integration costs | 10.4 |
| 4.3 |
| 6.1 |
| 142% | 5.1 |
| 3.0 |
| 1.7 |
| 0.6 |
| 0.4 |
|
| Legal claim costs | 1.1 |
| 1.1 |
| — |
| n/m | — |
| 0.3 |
| 0.6 |
| 0.2 |
| 0.4 |
|
| Stock-based compensation | 14.7 |
| 11.5 |
| 3.2 |
| 28% | 3.1 |
| 3.9 |
| 4.0 |
| 3.7 |
| 3.0 |
|
| Severance and management transition costs | 0.5 |
| 1.9 |
| (1.4 | ) | n/m | — |
| — |
| — |
| 0.5 |
| 1.9 |
|
| Loss on extinguishment of debt | 36.5 |
| — |
| 36.5 |
| n/m | — |
| — |
| 0.3 |
| 36.2 |
| — |
|
| New accounting standards and system implementation costs | 2.4 |
| — |
| 2.4 |
| n/m | 1.1 |
| 0.8 |
| 0.5 |
| — |
| — |
|
| Asset impairments and loss on disposals | 59.5 |
| 5.3 |
| 54.2 |
| n/m | 0.2 |
| 55.5 |
| 3.6 |
| 0.2 |
| 5.3 |
|
| Adjusted EBITDA | $ | 371.6 |
| $ | 278.5 |
| $ | 93.1 |
| 33% | $ | 104.2 |
| $ | 95.9 |
| $ | 90.8 |
| $ | 80.7 |
| $ | 73.0 |
|
| Adjusted EBITDA as a % of Revenue | 55.3 | % | 52.6 | % | | | 57.7 | % | 54.7 | % | 54.4 | % | 54.1 | % | 53.1 | % |
CyrusOne Inc.
Reconciliation of Revenue to Net Operating Income to Net (Loss) Income
(Dollars in millions)
(Unaudited)
|
| | | | | | | | | | | | | | | | | | | | | | |
| | Three Months Ended | | | Twelve Months Ended | | |
| | December 31, | Change | December 31, | Change |
| 2017 | 2016 | $ | % | 2017 | 2016 | $ | % |
| Revenue | $ | 180.5 |
| $ | 137.4 |
| $ | 43.1 |
| 31 | % | $ | 672.0 |
| $ | 529.1 |
| $ | 142.9 |
| 27 | % |
| Property operating expenses | 60.2 |
| 47.8 |
| 12.4 |
| 26 | % | 235.1 |
| 187.5 |
| 47.6 |
| 25 | % |
| Net Operating Income | $ | 120.3 |
| $ | 89.6 |
| $ | 30.7 |
| 34 | % | $ | 436.9 |
| $ | 341.6 |
| $ | 95.3 |
| 28 | % |
| Sales and marketing | 3.9 |
| 4.0 |
| (0.1 | ) | (3 | )% | 17.0 |
| 16.9 |
| 0.1 |
| 1 | % |
| General and administrative | 16.4 |
| 17.9 |
| (1.5 | ) | (8 | )% | 67.0 |
| 60.7 |
| 6.3 |
| 10 | % |
| Depreciation and amortization | 70.8 |
| 49.3 |
| 21.5 |
| 44 | % | 258.9 |
| 183.9 |
| 75.0 |
| 41 | % |
| Transaction and acquisition integration costs | 5.1 |
| 0.4 |
| 4.7 |
| n/m |
| 10.4 |
| 4.3 |
| 6.1 |
| 142 | % |
| Asset impairments and loss on disposal | 0.2 |
| 5.3 |
| (5.1 | ) | n/m |
| 59.5 |
| 5.3 |
| 54.2 |
| n/m |
|
| Interest expense | 20.1 |
| 11.4 |
| 8.7 |
| 76 | % | 68.1 |
| 48.8 |
| 19.3 |
| 40 | % |
| Loss on extinguishment of debt | — |
| — |
| — |
| n/m |
| 36.5 |
| — |
| 36.5 |
| n/m |
|
| Income tax expense | 1.0 |
| 0.5 |
| 0.5 |
| 100 | % | 3.0 |
| 1.8 |
| 1.2 |
| 67 | % |
| Net (loss) income | $ | 2.8 |
| $ | 0.8 |
| $ | 2.0 |
| n/m |
| $ | (83.5 | ) | $ | 19.9 |
| $ | (103.4 | ) | n/m |
|
CyrusOne Inc.
Reconciliation of Net (Loss) Income to FFO and Normalized FFO
(Dollars in millions)
(Unaudited)
|
| | | | | | | | | | | | | | | | | | | | | | | | | | |
| | Twelve Months Ended | | | Three Months Ended |
| | December 31, | Change | December 31, | September 30, | June 30, | March 31, | December 31, |
| 2017 | 2016 | $ | % | 2017 | 2017 | 2017 | 2017 | 2016 |
| Reconciliation of Net (Loss) Income to FFO and Normalized FFO: | | | | | | | | | |
| Net (loss) income | $ | (83.5 | ) | $ | 19.9 |
| $ | (103.4 | ) | n/m |
| $ | 2.8 |
| $ | (55.1 | ) | $ | (0.8 | ) | $ | (30.4 | ) | $ | 0.8 |
|
| Real estate depreciation and amortization | 226.9 |
| 157.6 |
| 69.3 |
| 44 | % | 62.6 |
| 60.3 |
| 55.3 |
| 48.7 |
| 42.0 |
|
| Asset impairments and loss on disposal | 59.5 |
| 5.3 |
| 54.2 |
| n/m |
| 0.2 |
| 55.5 |
| 3.6 |
| 0.2 |
| 5.3 |
|
| Funds from Operations (FFO) | $ | 202.9 |
| $ | 182.8 |
| $ | 20.1 |
| 11 | % | $ | 65.6 |
| $ | 60.7 |
| $ | 58.1 |
| $ | 18.5 |
| $ | 48.1 |
|
| | | | | | | | | | |
| Loss on extinguishment of debt | 36.5 |
| — |
| 36.5 |
| n/m |
| — |
| — |
| 0.3 |
| 36.2 |
| — |
|
| New accounting standards and system implementation costs | 2.4 |
| — |
| 2.4 |
| n/m |
| 1.1 |
| 0.8 |
| 0.5 |
| — |
| — |
|
| Amortization of customer relationship intangibles | 25.1 |
| 20.1 |
| 5.0 |
| 25 | % | 6.6 |
| 6.6 |
| 6.7 |
| 5.2 |
| 5.6 |
|
| Transaction and acquisition integration costs | 10.4 |
| 4.3 |
| 6.1 |
| 142 | % | 5.1 |
| 3.0 |
| 1.7 |
| 0.6 |
| 0.4 |
|
| Severance and management transition costs | 0.5 |
| 1.9 |
| (1.4 | ) | (74 | )% | — |
| — |
| — |
| 0.5 |
| 1.9 |
|
| Legal claim costs | 1.1 |
| 1.1 |
| — |
| n/m |
| — |
| 0.3 |
| 0.6 |
| 0.2 |
| 0.4 |
|
| Normalized Funds from Operations (Normalized FFO) | $ | 278.9 |
| $ | 210.2 |
| $ | 68.7 |
| 33 | % | $ | 78.4 |
| $ | 71.4 |
| $ | 67.9 |
| $ | 61.2 |
| $ | 56.4 |
|
| Normalized FFO per diluted common share | $ | 3.12 |
| $ | 2.66 |
| $ | 0.46 |
| 17 | % | $ | 0.84 |
| $ | 0.79 |
| $ | 0.77 |
| $ | 0.72 |
| $ | 0.68 |
|
| Weighted Average diluted common shares outstanding | 89.4 |
| 79.0 |
| 10.4 |
| 13 | % | 93.5 |
| 90.9 |
| 88.5 |
| 84.5 |
| 82.9 |
|
| | | | | | | | | | |
| Additional Information: | | | | | | | | | |
| Amortization of deferred financing costs and bond premium | 4.3 |
| 4.1 |
| 0.2 |
| 5 | % | 0.9 |
| 1.2 |
| 1.2 |
| 1.0 |
| 1.1 |
|
| Stock-based compensation | 14.7 |
| 11.5 |
| 3.2 |
| 28 | % | 3.1 |
| 3.9 |
| 4.0 |
| 3.7 |
| 3.0 |
|
| Non-real estate depreciation and amortization | 6.9 |
| 6.2 |
| 0.7 |
| 11 | % | 1.6 |
| 1.8 |
| 1.7 |
| 1.8 |
| 1.7 |
|
| Deferred revenue and straight line rent adjustments | (9.2 | ) | (20.2 | ) | 11.0 |
| (54 | )% | (3.6 | ) | 6.5 |
| (2.7 | ) | (9.4 | ) | (2.5 | ) |
| Leasing commissions | (17.3 | ) | (12.1 | ) | (5.2 | ) | 43 | % | (3.5 | ) | (6.1 | ) | (3.8 | ) | (3.9 | ) | (3.8 | ) |
| Recurring capital expenditures | (4.4 | ) | (5.4 | ) | 1.0 |
| (19 | )% | (1.6 | ) | (0.6 | ) | (0.7 | ) | (1.5 | ) | (1.9 | ) |
CyrusOne Inc.
Market Capitalization Summary, Reconciliation of Net Debt, and Debt Schedule
(Unaudited)
Market Capitalization
|
| | | | | | | | |
| (dollars in millions) | Shares or Equivalents Outstanding | Market Price as of December 31, 2017 | Market Value Equivalents (in millions) |
| Common shares | 96,137,874 |
| $ | 59.53 |
| $ | 5,723.1 |
|
| Net Debt | | | 1,958.2 |
|
| Total Enterprise Value (TEV) | | | $ | 7,681.3 |
|
Reconciliation of Net Debt
|
| | | | | | |
| (dollars in millions) | December 31, | September 30, |
| | 2017 | 2017 |
Long-term debt(a) | $ | 2,100.0 |
| $ | 2,037.7 |
|
| Capital lease obligations | 10.1 |
| 10.9 |
|
| Less: | | |
| Cash and cash equivalents | (151.9 | ) | (24.6 | ) |
| Net Debt | $ | 1,958.2 |
| $ | 2,024.0 |
|
(a)Excludes adjustment for deferred financing costs.
Debt Schedule (as of December 31, 2017)
|
| | | | | | |
| (dollars in millions) | | | |
| Long-term debt: | Amount | Interest Rate | Maturity Date |
| Revolving credit facility | $ | — |
| L + 155bps |
| November 2021(a) |
| Term loan | 250.0 |
| 2.99 | % | September 2021 |
| Term loan | 650.0 |
| 2.99 | % | January 2022 |
| 5.000% senior notes due 2024, excluding bond premium | 700.0 |
| 5.000 | % | March 2024 |
| 5.375% senior notes due 2027, excluding bond premium | 500.0 |
| 5.375 | % | March 2027 |
Total long-term debt(b) | $ | 2,100.0 |
| 4.23 | % | |
| | | | |
| Weighted average term of debt: | 5.9 |
| years | |
| |
| (a) | Assuming exercise of one-year extension option. |
| |
| (b) | Excludes adjustment for deferred financing costs. |
|
| | | | | | | | | | | | | | | | | | | |
| Interest Summary | Three Months | | Twelve Months | |
| | December 31, | September 30, | December 31, | Growth % | December 31, | Growth % |
| | 2017 | 2017 | 2016 | Yr/Yr | 2017 | 2016 | Yr/Yr |
| Interest expense and fees | $ | 23.8 |
| $ | 21.0 |
| $ | 14.1 |
| 69 | % | $ | 80.8 |
| $ | 55.3 |
| 46 | % |
| Amortization of deferred financing costs and bond premium | 0.9 |
| 1.2 |
| 1.1 |
| (18 | )% | 4.3 |
| 4.1 |
| 5 | % |
| Capitalized interest | (4.6 | ) | (4.3 | ) | (3.8 | ) | 21 | % | (17.0 | ) | (10.6 | ) | 60 | % |
| Total interest expense | $ | 20.1 |
| $ | 17.9 |
| $ | 11.4 |
| 76 | % | $ | 68.1 |
| $ | 48.8 |
| 40 | % |
CyrusOne Inc.
Colocation Square Footage (CSF) and Utilization
(Unaudited)
|
| | | | | | | | |
| | As of December 31, 2017 | As of December 31, 2016 |
| Market | Colocation
Space (CSF)(a) | CSF
Utilized(b) | Colocation
Space (CSF)(a) | CSF
Utilized(b) |
| Northern Virginia | 640,102 |
| 79 | % | 277,629 |
| 100 | % |
| Phoenix | 509,442 |
| 91 | % | 215,892 |
| 94 | % |
| Dallas | 506,176 |
| 85 | % | 431,287 |
| 83 | % |
| Cincinnati | 404,255 |
| 91 | % | 386,508 |
| 92 | % |
| Houston | 308,074 |
| 74 | % | 308,074 |
| 73 | % |
| San Antonio | 272,681 |
| 88 | % | 108,112 |
| 99 | % |
| New York Metro | 218,448 |
| 82 | % | 121,530 |
| 79 | % |
| Chicago | 212,995 |
| 64 | % | 111,660 |
| 82 | % |
| Austin | 105,610 |
| 67 | % | 105,610 |
| 50 | % |
| Raleigh-Durham | 75,664 |
| 88 | % | — |
| n/a |
|
| International | 13,200 |
| 76 | % | 13,200 |
| 70 | % |
| Total | 3,266,647 |
| 83 | % | 2,079,502 |
| 85 | % |
Stabilized Properties(c) | 2,653,300 |
| 93 | % | 1,895,867 |
| 92 | % |
| |
| (a) | CSF represents the NRSF at an operating facility that is currently leased or readily available for lease as colocation space, where customers locate their servers and other IT equipment. |
| |
| (b) | Utilization is calculated by dividing CSF under signed leases for colocation space (whether or not the lease has commenced billing) by total CSF. |
| |
| (c) | Stabilized properties include data halls that have been in service for at least 24 months or are at least 85% utilized. |
CyrusOne Inc.
2018 Guidance
|
| | |
| Category | 2017 Results | 2018 Guidance(1) |
| Total Revenue | $672 million | $810 - 825 million |
| Base Revenue | $602 million | $735 - 745 million |
| Metered Power Reimbursements | $70 million | $75 - 80 million |
| Adjusted EBITDA | $372 million | $460 - 470 million |
| Normalized FFO per diluted common share | $3.12 | $3.18 - 3.28 |
| Capital Expenditures | $915 million | $850 - 900 million |
| Development | $911 million | $845 - 890 million |
| Recurring | $4 million | $5 - 10 million |
| | | |
(1)Full year 2018 guidance assumes the Zenium acquisition closes on April 30, 2018. Development capital expenditures include the acquisition of land for future development.
The annual guidance provided above represents forward-looking statements, which are based on current economic conditions, internal assumptions about the Company's existing customer base and the supply and demand dynamics of the markets in which CyrusOne operates.
CyrusOne does not provide reconciliations for the non-GAAP financial measures included in the annual guidance provided above due to the inherent difficulty in forecasting and quantifying certain amounts that are necessary for such reconciliations, including net income (loss) and adjustments that could be made for transaction and acquisition integration costs, legal claim costs, lease exit costs, asset impairments and loss on disposals and other charges in its reconciliation of historic numbers, the amount of which, based on historical experience, could be significant.
CyrusOne Inc.
Data Center Portfolio
As of December 31, 2017
(Unaudited) |
| | | | | | | | | | | | | | | | | | | | | | |
| | | | Operating Net Rentable Square Feet (NRSF)(a) | Powered
Shell
Available
for Future
Development
(NRSF)(k) | Available Critical Load Capacity
(MW)(l) |
Stabilized Properties(b) | Metro
Area | Annualized Rent(c) | Colocation Space (CSF)(d) | CSF Leased(e) | CSF
Utilized(f) | Office & Other(g) | Office & Other Leased (h) | Supporting
Infrastructure(i) | Total(j) |
| Dallas - Carrollton | Dallas | $ | 67,585,708 |
| 304,622 |
| 89 | % | 89 | % | 64,973 |
| 62 | % | 111,406 |
| 481,001 |
| 16,000 |
| 38 |
|
| Houston - Houston West I | Houston | 42,497,450 |
| 112,133 |
| 96 | % | 97 | % | 11,343 |
| 99 | % | 37,244 |
| 160,720 |
| 3,000 |
| 28 |
|
| Cincinnati - 7th Street*** | Cincinnati | 36,405,768 |
| 196,696 |
| 92 | % | 92 | % | 5,744 |
| 100 | % | 175,148 |
| 377,588 |
| 46,000 |
| 16 |
|
| Dallas - Lewisville* | Dallas | 36,257,388 |
| 114,054 |
| 94 | % | 94 | % | 11,374 |
| 95 | % | 54,122 |
| 179,550 |
| — |
| 21 |
|
| Northern Virginia - Sterling II | Northern Virginia | 30,309,953 |
| 158,998 |
| 100 | % | 100 | % | 8,651 |
| 100 | % | 55,306 |
| 222,955 |
| — |
| 30 |
|
| Somerset I | New York Metro | 28,531,926 |
| 96,918 |
| 88 | % | 88 | % | 26,613 |
| 85 | % | 88,991 |
| 212,522 |
| 2,000 |
| 11 |
|
| Chicago - Aurora I | Chicago | 27,652,512 |
| 113,032 |
| 96 | % | 96 | % | 34,008 |
| 100 | % | 223,478 |
| 370,518 |
| 27,000 |
| 71 |
|
| Totowa - Madison** | New York Metro | 25,970,252 |
| 51,290 |
| 89 | % | 89 | % | 22,477 |
| 100 | % | 58,964 |
| 132,731 |
| — |
| 6 |
|
| Cincinnati - North Cincinnati | Cincinnati | 25,398,959 |
| 65,303 |
| 97 | % | 97 | % | 44,886 |
| 75 | % | 52,950 |
| 163,139 |
| 65,000 |
| 14 |
|
| San Antonio III | San Antonio | 24,337,608 |
| 131,767 |
| 100 | % | 100 | % | 9,309 |
| 100 | % | 43,126 |
| 184,202 |
| — |
| 24 |
|
| Houston - Houston West II | Houston | 23,301,914 |
| 79,540 |
| 87 | % | 87 | % | 4,355 |
| 88 | % | 55,042 |
| 138,937 |
| 11,000 |
| 12 |
|
| Wappingers Falls I** | New York Metro | 22,968,754 |
| 37,000 |
| 86 | % | 86 | % | 20,167 |
| 97 | % | 15,077 |
| 72,244 |
| — |
| 3 |
|
| San Antonio I | San Antonio | 21,042,190 |
| 43,891 |
| 100 | % | 100 | % | 5,989 |
| 83 | % | 45,650 |
| 95,530 |
| 11,000 |
| 12 |
|
| Phoenix - Chandler II | Phoenix | 19,884,192 |
| 74,082 |
| 100 | % | 100 | % | 5,639 |
| 38 | % | 25,519 |
| 105,240 |
| — |
| 12 |
|
| Northern Virginia - Sterling I | Northern Virginia | 17,291,618 |
| 77,961 |
| 100 | % | 100 | % | 5,618 |
| 77 | % | 48,598 |
| 132,177 |
| — |
| 12 |
|
| Raleigh-Durham I | Raleigh-Durham | 17,078,401 |
| 75,664 |
| 88 | % | 88 | % | 9,507 |
| 100 | % | 82,119 |
| 167,290 |
| 246,000 |
| 12 |
|
| Houston - Galleria | Houston | 16,864,199 |
| 63,469 |
| 61 | % | 61 | % | 23,259 |
| 51 | % | 24,927 |
| 111,655 |
| — |
| 14 |
|
| Phoenix - Chandler I | Phoenix | 16,783,940 |
| 74,041 |
| 100 | % | 100 | % | 34,582 |
| 12 | % | 38,452 |
| 147,075 |
| 31,000 |
| 16 |
|
| Phoenix - Chandler III | Phoenix | 16,596,885 |
| 67,937 |
| 100 | % | 100 | % | 2,440 |
| — | % | 30,415 |
| 100,792 |
| — |
| 14 |
|
| Northern Virginia - Sterling III | Northern Virginia | 15,218,979 |
| 79,122 |
| 100 | % | 100 | % | 7,264 |
| 100 | % | 33,603 |
| 119,989 |
| — |
| 15 |
|
| Austin II | Austin | 13,666,086 |
| 43,772 |
| 95 | % | 95 | % | 1,821 |
| 100 | % | 22,433 |
| 68,026 |
| — |
| 5 |
|
| San Antonio II | San Antonio | 13,569,018 |
| 64,221 |
| 100 | % | 100 | % | 11,255 |
| 100 | % | 41,127 |
| 116,603 |
| — |
| 12 |
|
| Florence | Cincinnati | 13,361,160 |
| 52,698 |
| 99 | % | 99 | % | 46,848 |
| 87 | % | 40,374 |
| 139,920 |
| — |
| 9 |
|
| Phoenix - Chandler IV | Phoenix | 11,264,335 |
| 73,433 |
| 100 | % | 100 | % | 3,039 |
| 100 | % | 26,533 |
| 103,005 |
| — |
| 12 |
|
| Cincinnati - Hamilton* | Cincinnati | 9,073,368 |
| 46,565 |
| 76 | % | 76 | % | 1,077 |
| 100 | % | 35,336 |
| 82,978 |
| — |
| 10 |
|
| London - Great Bridgewater** | International | 5,680,892 |
| 10,000 |
| 94 | % | 94 | % | — |
| — | % | 514 |
| 10,514 |
| — |
| 1 |
|
| Northern Virginia - Sterling IV | Northern Virginia | 5,439,076 |
| 81,291 |
| 100 | % | 100 | % | 5,523 |
| 100 | % | 34,322 |
| 121,136 |
| — |
| 15 |
|
| Cincinnati - Mason | Cincinnati | 5,394,151 |
| 34,072 |
| 100 | % | 100 | % | 26,458 |
| 98 | % | 17,193 |
| 77,723 |
| — |
| 4 |
|
| Dallas - Midway** | Dallas | 5,356,920 |
| 8,390 |
| 100 | % | 100 | % | — |
| — | % | — |
| 8,390 |
| — |
| 1 |
|
| Phoenix - Chandler VI | Phoenix | 5,274,000 |
| 148,434 |
| 58 | % | 94 | % | 1,000 |
| 100 | % | 32,037 |
| 181,471 |
| 10,000 |
| 12 |
|
| Stamford - Riverbend** | New York Metro | 5,150,002 |
| 20,000 |
| 23 | % | 23 | % | — |
| — | % | 8,484 |
| 28,484 |
| — |
| 2 |
|
| Norwalk I** | New York Metro | 3,766,807 |
| 13,240 |
| 88 | % | 92 | % | 4,085 |
| 72 | % | 40,610 |
| 57,935 |
| 87,000 |
| 2 |
|
| Dallas - Marsh** | Dallas | 2,600,005 |
| 4,245 |
| 100 | % | 100 | % | — |
| — | % | — |
| 4,245 |
| — |
| 1 |
|
| Chicago - Lombard | Chicago | 2,274,283 |
| 13,516 |
| 61 | % | 61 | % | 4,115 |
| 100 | % | 12,230 |
| 29,861 |
| 29,000 |
| 3 |
|
| Stamford - Omega** | New York Metro | 1,233,557 |
| — |
| — | % | — | % | 18,552 |
| 84 | % | 3,796 |
| 22,348 |
| — |
| — |
|
| Totowa - Commerce** | New York Metro | 691,429 |
| — |
| — | % | — | % | 20,460 |
| 43 | % | 5,540 |
| 26,000 |
| — |
| — |
|
| Cincinnati - Blue Ash* | Cincinnati | 616,664 |
| 6,193 |
| 36 | % | 36 | % | 6,821 |
| 100 | % | 2,165 |
| 15,179 |
| — |
| 1 |
|
| South Bend - Crescent* | Chicago | 576,976 |
| 3,432 |
| 43 | % | 43 | % | — |
| — | % | 5,125 |
| 8,557 |
| 11,000 |
| 1 |
|
| Houston - Houston West III | Houston | 493,602 |
| — |
| — | % | — | % | 10,272 |
| 100 | % | 10,654 |
| 20,926 |
| 209,000 |
| — |
|
| Singapore - Inter Business Park** | International | 365,132 |
| 3,200 |
| 22 | % | 22 | % | — |
| — | % | — |
| 3,200 |
| — |
| 1 |
|
| South Bend - Monroe | Chicago | 119,741 |
| 6,350 |
| 23 | % | 23 | % | — |
| — | % | 6,478 |
| 12,828 |
| 4,000 |
| 1 |
|
| Cincinnati - Goldcoast | Cincinnati | 96,090 |
| 2,728 |
| — | % | — | % | 5,280 |
| — | % | 16,481 |
| 24,489 |
| 14,000 |
| 1 |
|
| Stabilized Properties - Total | | $ | 638,041,890 |
| 2,653,300 |
| 91 | % | 93 | % | 524,804 |
| 77 | % | 1,661,569 |
| 4,839,673 |
| 822,000 |
| 470 |
|
| | | | | | | | | | | | |
| | | | | | | | | | | | |
| | | | | | | | | | | | |
|
| | | | | | | | | | | | | | | | | | | | | | |
| CyrusOne Inc. |
| Data Center Portfolio |
| As of December 31, 2017 |
(Unaudited)
|
| | | | | | | | | | | | |
| | | | Operating Net Rentable Square Feet (NRSF)(a) | Powered
Shell
Available
for Future
Development
(NRSF)(k) | Available Critical Load Capacity
(MW)(l) |
| | Metro
Area | Annualized Rent(c) | Colocation Space (CSF)(d) | CSF Leased(e) | CSF
Utilized(f) | Office & Other(g) | Office & Other Leased (h) | Supporting
Infrastructure(i) | Total(j) |
| Stabilized Properties - Total | | $ | 638,041,890 |
| 2,653,300 |
| 91 | % | 93 | % | 524,804 |
| 77 | % | 1,661,569 |
| 4,839,673 |
| 822,000 |
| 470 |
|
| | | | | | | | | | | | |
Pre-Stabilized Properties(b) | | | | | | | | | | | |
| Austin III | Austin | 9,488,450 |
| 61,838 |
| 47 | % | 47 | % | 15,055 |
| 83 | % | 20,629 |
| 97,522 |
| 67,000 |
| 3 |
|
| Northern Virginia - Sterling V | Northern Virginia | 8,874,654 |
| 242,730 |
| 41 | % | 44 | % | 900 |
| — | % | 112,662 |
| 356,292 |
| 244,000 |
| 30 |
|
| Houston - Houston West III (DH #1) | Houston | 2,756,377 |
| 52,932 |
| 22 | % | 24 | % | — |
| — | % | 21,128 |
| 74,060 |
| — |
| 6 |
|
| Dallas - Carrollton (DH #6) | Dallas | 1,579,500 |
| 74,865 |
| 33 | % | 51 | % | — |
| — | % | 21,224 |
| 96,089 |
| — |
| 3 |
|
| Phoenix - Chandler V | Phoenix | 1,505,032 |
| 71,515 |
| 50 | % | 50 | % | 996 |
| 50 | % | 16,399 |
| 88,910 |
| 94,000 |
| 6 |
|
| Chicago - Aurora II (DH #1) | Chicago | 175,668 |
| 76,665 |
| 21 | % | 21 | % | 10,045 |
| — | % | 13,875 |
| 100,585 |
| 272,000 |
| 16 |
|
| San Antonio IV | San Antonio | — |
| 32,802 |
| — | % | — | % | 3,577 |
| — | % | 27,191 |
| 63,570 |
| 35,000 |
| 6 |
|
| All Properties - Total | | $ | 662,421,571 |
| 3,266,647 |
| 80 | % | 83 | % | 555,377 |
| 75 | % | 1,894,677 |
| 5,716,701 |
| 1,534,000 |
| 540 |
|
| |
| * | Indicates properties in which we hold a leasehold interest in the building shell and land. All data center infrastructure has been constructed by us and owned by us. |
| |
| ** | Indicates properties in which we hold a leasehold interest in the building shell, land, and all data center infrastructure. |
*** The information provided for the Cincinnati - 7th Street property includes data for two facilities, one of which we lease and one of which we own.
| |
| (a) | Represents the total square feet of a building under lease or available for lease based on engineers' drawings and estimates but does not include space held for development or space used by CyrusOne. |
| |
| (b) | Stabilized properties include data halls that have been in service for at least 24 months or are at least 85% utilized. Pre-stabilized properties include data halls that have been in service for less than 24 months and are less than 85% utilized. |
| |
| (c) | Represents monthly contractual rent (defined as cash rent including customer reimbursements for metered power) under existing customer leases as of December 31, 2017, multiplied by 12. For the month of December 2017, customer reimbursements were $67.8 million annualized and consisted of reimbursements by customers across all facilities with separately metered power. Customer reimbursements under leases with separately metered power vary from month-to-month based on factors such as our customers' utilization of power and the suppliers' pricing of power. From January 1, 2016 through December 31, 2017, customer reimbursements under leases with separately metered power constituted between 10.2% and 12.6% of annualized rent. After giving effect to abatements, free rent and other straight-line adjustments, our annualized effective rent as of December 31, 2017 was $675.7 million. Our annualized effective rent was greater than our annualized rent as of December 31, 2017 because our positive straight-line and other adjustments and amortization of deferred revenue exceeded our negative straight-line adjustments due to factors such as the timing of contractual rent escalations and customer prepayments for services. |
| |
| (d) | CSF represents the NRSF at an operating facility that is currently leased or readily available for lease as colocation space, where customers locate their servers and other IT equipment. |
| |
| (e) | Percent leased is determined based on CSF being billed to customers under signed leases as of December 31, 2017 divided by total CSF. Leases signed but not commenced as of December 31, 2017 are not included. |
| |
| (f) | Utilization is calculated by dividing CSF under signed leases for colocation space (whether or not the lease has commenced billing) by total CSF. |
| |
| (g) | Represents the NRSF at an operating facility that is currently leased or readily available for lease as space other than CSF, which is typically office and other space. |
| |
| (h) | Percent leased is determined based on Office & Other space being billed to customers under signed leases as of December 31, 2017 divided by total Office & Other space. Leases signed but not commenced as of December 31, 2017 are not included. |
| |
| (i) | Represents infrastructure support space, including mechanical, telecommunications and utility rooms, as well as building common areas. |
| |
| (j) | Represents the NRSF at an operating facility that is currently leased or readily available for lease. This excludes existing vacant space held for development. |
| |
| (k) | Represents space that is under roof that could be developed in the future for operating NRSF, rounded to the nearest 1,000. |
| |
| (l) | Critical load capacity represents the aggregate power available for lease and exclusive use by customers expressed in terms of megawatts. The capacity reported is for non-redundant megawatts, as we can develop flexible solutions to our customers at multiple resiliency levels. Does not sum to total due to rounding. 6 of 18 megawatts of power capacity for Phoenix - Chandler VI reported as placed into service in 3Q'17 are under development and are expected to be placed into service in 1Q'18. 6 of 12 megawatts of power capacity for San Antonio IV reported as placed into service in 3Q'17 are expected to be placed into service in late 2018. |
CyrusOne Inc.
NRSF Under Development
As of December 31, 2017
(Dollars in millions)
(Unaudited)
|
| | | | | | | | | | | | | | | | | | | |
| | | | NRSF Under Development(a) | | Under Development Costs(b) |
| Facilities | Metropolitan Area | Estimated Completion Date | Colocation Space (CSF) | Office & Other | Supporting Infrastructure | Powered Shell(b) | Total | Critical Load MW Capacity(c) | Actual to Date(d) | Estimated Costs to Completion(e) | Total |
| Austin III | Austin | 1Q'18 | — |
| — |
| — |
| — |
| — |
| 3.0 |
| $ | 5 |
| $6-8 | $11-13 |
| Somerset II | New York Metro | 1Q'18 | — |
| — |
| — |
| 210,000 |
| 210,000 |
| — |
| 15 |
| 9-10 | 24-25 |
| Northern Virginia - Sterling V | Northern Virginia | 1Q'18 | 33,000 |
| — |
| 8,000 |
| — |
| 41,000 |
| 3.0 |
| 5 |
| 17-19 | 22-24 |
| Phoenix - Chandler VI | Phoenix | 1Q'18 | — |
| — |
| — |
| — |
| — |
| 12.0 |
| 17 |
| 10-16 | 27-33 |
| Dallas - Carrollton | Dallas | 2Q'18 | 51,000 |
| — |
| 2,000 |
| — |
| 53,000 |
| 15.0 |
| 4 |
| 49-55 | 53-59 |
| Dallas - Allen | Dallas | 2Q'18 | 79,000 |
| 27,000 |
| 60,000 |
| 175,000 |
| 341,000 |
| 6.0 |
| 5 |
| 53-59 | 58-64 |
| Total | | | 163,000 |
| 27,000 |
| 70,000 |
| 385,000 |
| 645,000 |
| 39.0 |
| $ | 51 |
| $144-167 | $195-218 |
| |
| (a) | Represents NRSF at a facility for which activities have commenced or are expected to commence in the next 2 quarters to prepare the space for its intended use. Estimates and timing are subject to change. |
| |
| (b) | Represents NRSF under construction that, upon completion, will be powered shell available for future development into operating NRSF. |
| |
| (c) | Critical load capacity represents the aggregate power available for lease and exclusive use by customers expressed in terms of megawatts. The capacity reported is for non-redundant megawatts, as we can develop flexible solutions to our customers at multiple resiliency levels. |
| |
| (d) | Actual to date is the cash investment as of December 31, 2017. There may be accruals above this amount for work completed, for which cash has not yet been paid. |
| |
| (e) | Represents management’s estimate of the total costs required to complete the current NRSF under development. There may be an increase in costs if customers require greater power density. |
CyrusOne Inc.
Land Available for Future Development (Acres)
As of December 31, 2017
(Unaudited)
|
| | |
| | As of |
| Market | December 31, 2017 |
| Atlanta | 44 |
|
| Austin | 22 |
|
| Chicago | 23 |
|
| Cincinnati | 98 |
|
| Dallas | 33 |
|
| Houston | 20 |
|
| International | — |
|
| New York Metro | — |
|
| Northern Virginia | 16 |
|
| Phoenix | 39 |
|
| Quincy, Washington | 48 |
|
| Raleigh-Durham | — |
|
| San Antonio | — |
|
| Total Available | 343 |
|
CyrusOne Inc.
Leasing Statistics - Lease Signings
As of December 31, 2017
(Dollars in thousands)
(Unaudited)
|
| | | | | |
| Period | Number of Leases(a) | Total CSF Signed(b) | Total kW Signed(c) | Total MRR Signed ($000)(d) | Weighted Average Lease Term(e) |
| 4Q'17 | 395 | 86,000 | 8,600 | $1,463 | 61 |
| Prior 4Q Avg. | 425 | 127,250 | 14,700 | $2,229 | 80 |
| 3Q'17 | 411 | 151,000 | 14,830 | $2,228 | 68 |
| 2Q'17 | 451 | 136,000 | 16,673 | $2,467 | 86 |
| 1Q'17 | 480 | 148,000 | 18,259 | $2,632 | 103 |
| 4Q'16 | 358 | 74,000 | 9,038 | $1,590 | 63 |
| |
| (a) | Number of leases represents each agreement with a customer. A lease agreement could include multiple spaces, and a customer could have multiple leases. |
| |
| (b) | CSF represents the NRSF at an operating facility that is leased as colocation space, where customers locate their servers and other IT equipment. |
| |
| (c) | Represents maximum contracted kW that customers may draw during lease period. Additionally, we can develop flexible solutions for our customers at multiple resiliency levels, and the kW signed is unadjusted for this factor. |
| |
| (d) | Monthly recurring rent is defined as the average monthly contractual rent during the term of the lease. It includes the monthly impact of installation charges of approximately $0.2 million in 2Q'17-4Q'17 and $0.1 million in each of the other quarters. |
| |
| (e) | Calculated on a CSF-weighted basis. |
CyrusOne Inc.
New MRR Signed - Existing vs. New Customers
As of December 31, 2017
(Dollars in thousands)
(Unaudited)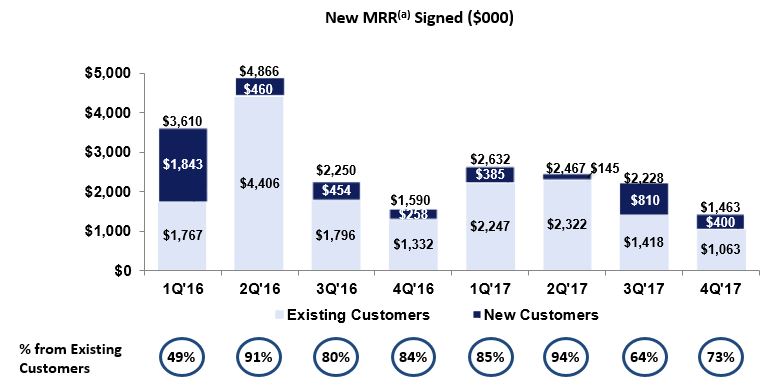
(a) Monthly recurring rent is defined as the average monthly contractual rent during the term of the lease. It includes the monthly impact of installation charges of approximately $0.2 million in 2Q'17-4Q'17 and $0.1 million in each of the other quarters.
CyrusOne Inc.
Customer Sector Diversification(a)
As of December 31, 2017
(Unaudited)
|
| | | | | | | | | |
| | Principal Customer Industry | Number of
Locations | Annualized
Rent(b) | Percentage of
Portfolio
Annualized
Rent(c) | Weighted
Average
Remaining
Lease Term in
Months(d) |
| 1 | Information Technology | 9 | $ | 118,237,061 |
| 17.8 | % | 93.0 |
|
| 2 | Information Technology | 9 | 26,994,022 |
| 4.1 | % | 46.9 |
|
| 3 | Information Technology | 4 | 25,234,226 |
| 3.8 | % | 86.7 |
|
| 4 | Financial Services | 1 | 19,754,228 |
| 3.0 | % | 159.0 |
|
| 5 | Telecommunication Services | 2 | 15,742,896 |
| 2.4 | % | 9.4 |
|
| 6 | Research and Consulting Services | 3 | 15,124,425 |
| 2.3 | % | 36.4 |
|
| 7 | Healthcare | 2 | 14,612,770 |
| 2.2 | % | 120.0 |
|
| 8 | Energy | 5 | 13,574,772 |
| 2.0 | % | 8.2 |
|
| 9 | Energy | 1 | 12,611,653 |
| 1.9 | % | 26.5 |
|
| 10 | Industrials | 4 | 11,224,802 |
| 1.7 | % | 20.4 |
|
| 11 | Telecommunication Services | 7 | 10,177,171 |
| 1.5 | % | 35.9 |
|
| 12 | Financial Services | 2 | 9,038,727 |
| 1.4 | % | 68.2 |
|
| 13 | Information Technology | 4 | 8,762,775 |
| 1.3 | % | 55.7 |
|
| 14 | Information Technology | 2 | 7,383,843 |
| 1.1 | % | 75.1 |
|
| 15 | Information Technology | 3 | 6,806,882 |
| 1.0 | % | 120.4 |
|
| 16 | Energy | 2 | 6,624,678 |
| 1.0 | % | 7.9 |
|
| 17 | Financial Services | 1 | 6,600,225 |
| 1.0 | % | 29.0 |
|
| 18 | Consumer Staples | 4 | 6,309,460 |
| 1.0 | % | 38.5 |
|
| 19 | Telecommunication Services | 5 | 5,885,604 |
| 0.9 | % | 16.1 |
|
| 20 | Consumer Staples | 2 | 5,216,417 |
| 0.8 | % | 51.5 |
|
| | | | $ | 345,916,637 |
| 52.2 | % | 70.6 |
|
| |
| (a) | Customers and their affiliates are consolidated. |
| |
| (b) | Represents monthly contractual rent (defined as cash rent including customer reimbursements for metered power) under existing customer leases as of December 31, 2017, multiplied by 12. For the month of December 2017, customer reimbursements were $67.8 million annualized and consisted of reimbursements by customers across all facilities with separately metered power. Customer reimbursements under leases with separately metered power vary from month-to-month based on factors such as our customers' utilization of power and the suppliers' pricing of power. From January 1, 2016 through December 31, 2017, customer reimbursements under leases with separately metered power constituted between 10.2% and 12.6% of annualized rent. After giving effect to abatements, free rent and other straight-line adjustments, our annualized effective rent as of December 31, 2017 was $675.7 million. Our annualized effective rent was greater than our annualized rent as of December 31, 2017 because our positive straight-line and other adjustments and amortization of deferred revenue exceeded our negative straight-line adjustments due to factors such as the timing of contractual rent escalations and customer prepayments for services. |
| |
| (c) | Represents the customer’s total annualized rent divided by the total annualized rent in the portfolio as of December 31, 2017, which was approximately $662.4 million. |
| |
| (d) | Weighted average based on customer’s percentage of total annualized rent expiring and is as of December 31, 2017, assuming that customers exercise no renewal options and exercise all early termination rights that require payment of less than 50% of the remaining rents. Early termination rights that require payment of 50% or more of the remaining lease payments are not assumed to be exercised because such payments approximate the profitability margin of leasing that space to the customer, such that we do not consider early termination to be economically detrimental to us. |
CyrusOne Inc.
Lease Distribution
As of December 31, 2017
(Unaudited)
|
| | | | | | | | | | | | | |
NRSF Under Lease(a) | Number of Customers(b) | Percentage of All Customers | Total Leased NRSF(c) | Percentage of Portfolio Leased NRSF | Annualized Rent(d) | Percentage of Annualized Rent |
| 0-999 | 685 |
| 70 | % | 148,208 |
| 3 | % | $ | 70,402,796 |
| 11 | % |
| 1,000-2,499 | 118 |
| 12 | % | 185,717 |
| 4 | % | 37,259,253 |
| 5 | % |
| 2,500-4,999 | 67 |
| 7 | % | 234,626 |
| 5 | % | 45,074,048 |
| 7 | % |
| 5,000-9,999 | 44 |
| 4 | % | 306,553 |
| 7 | % | 60,282,199 |
| 9 | % |
| 10,000+ | 74 |
| 7 | % | 3,744,050 |
| 81 | % | 449,403,275 |
| 68 | % |
| Total | 988 |
| 100 | % | 4,619,154 |
| 100 | % | $ | 662,421,571 |
| 100 | % |
| |
| (a) | Represents all leases in our portfolio, including colocation, office and other leases. |
| |
| (b) | Represents the number of customers occupying data center, office and other space as of December 31, 2017. This may vary from total customer count as some customers may be under contract, but have yet to occupy space. |
| |
| (c) | Represents the total square feet at a facility under lease and that has commenced billing, excluding space held for development or space used by CyrusOne. A customer’s leased NRSF is estimated based on such customer’s direct CSF or office and light-industrial space plus management’s estimate of infrastructure support space, including mechanical, telecommunications and utility rooms, as well as building common areas. |
| |
| (d) | Represents monthly contractual rent (defined as cash rent including customer reimbursements for metered power) under existing customer leases as of December 31, 2017, multiplied by 12. For the month of December 2017, customer reimbursements were $67.8 million annualized and consisted of reimbursements by customers across all facilities with separately metered power. Customer reimbursements under leases with separately metered power vary from month-to-month based on factors such as our customers' utilization of power and the suppliers' pricing of power. From January 1, 2016 through December 31, 2017, customer reimbursements under leases with separately metered power constituted between 10.2% and 12.6% of annualized rent. After giving effect to abatements, free rent and other straight-line adjustments, our annualized effective rent as of December 31, 2017 was $675.7 million. Our annualized effective rent was greater than our annualized rent as of December 31, 2017 because our positive straight-line and other adjustments and amortization of deferred revenue exceeded our negative straight-line adjustments due to factors such as the timing of contractual rent escalations and customer prepayments for services. |
CyrusOne Inc.
Lease Expirations
As of December 31, 2017
(Unaudited)
|
| | | | | | | | | | | | | | | | |
Year(a) | Number of
Leases
Expiring(b) | Total Operating
NRSF Expiring | Percentage of
Total NRSF | Annualized
Rent(c) | Percentage of
Annualized Rent | Annualized Rent
at Expiration(d) | Percentage of
Annualized Rent
at Expiration |
| Available | | 1,097,547 |
| 18 | % | | | | |
| Month-to-Month | 555 |
| 56,214 |
| 1 | % | $ | 17,836,114 |
| 3 | % | $ | 18,047,234 |
| 2 | % |
| 2018 | 2,249 |
| 554,759 |
| 10 | % | 133,521,351 |
| 20 | % | 136,908,269 |
| 18 | % |
| 2019 | 1,352 |
| 485,080 |
| 9 | % | 83,799,237 |
| 12 | % | 86,330,774 |
| 12 | % |
| 2020 | 1,314 |
| 483,807 |
| 9 | % | 64,655,451 |
| 10 | % | 67,967,365 |
| 9 | % |
| 2021 | 607 |
| 499,613 |
| 9 | % | 78,682,720 |
| 12 | % | 89,013,555 |
| 12 | % |
| 2022 | 222 |
| 538,570 |
| 9 | % | 45,783,999 |
| 7 | % | 62,049,815 |
| 8 | % |
| 2023 | 78 |
| 162,285 |
| 3 | % | 19,934,650 |
| 3 | % | 27,242,178 |
| 4 | % |
| 2024 | 39 |
| 223,937 |
| 4 | % | 30,482,675 |
| 5 | % | 39,275,747 |
| 5 | % |
| 2025 | 39 |
| 178,710 |
| 3 | % | 26,985,449 |
| 4 | % | 31,523,317 |
| 4 | % |
| 2026 | 26 |
| 577,649 |
| 10 | % | 74,754,446 |
| 11 | % | 81,745,331 |
| 11 | % |
| 2027 | 16 |
| 396,494 |
| 7 | % | 45,812,150 |
| 7 | % | 59,126,790 |
| 8 | % |
| 2028 - Thereafter | 14 |
| 462,036 |
| 8 | % | 40,173,329 |
| 6 | % | 49,029,966 |
| 7 | % |
| Total | 6,511 |
| 5,716,701 |
| 100 | % | $ | 662,421,571 |
| 100 | % | $ | 748,260,341 |
| 100 | % |
| |
| (a) | Leases that were auto-renewed prior to December 31, 2017 are shown in the calendar year in which their current auto-renewed term expires. Unless otherwise stated in the footnotes, the information set forth in the table assumes that customers exercise no renewal options and exercise all early termination rights that require payment of less than 50% of the remaining rents. Early termination rights that require payment of 50% or more of the remaining lease payments are not assumed to be exercised. |
| |
| (b) | Number of leases represents each agreement with a customer. A lease agreement could include multiple spaces and a customer could have multiple leases. |
| |
| (c) | Represents monthly contractual rent (defined as cash rent including customer reimbursements for metered power) under existing customer leases as of December 31, 2017, multiplied by 12. For the month of December 2017, customer reimbursements were $67.8 million annualized and consisted of reimbursements by customers across all facilities with separately metered power. Customer reimbursements under leases with separately metered power vary from month-to-month based on factors such as our customers' utilization of power and the suppliers' pricing of power. From January 1, 2016 through December 31, 2017, customer reimbursements under leases with separately metered power constituted between 10.2% and 12.6% of annualized rent. After giving effect to abatements, free rent and other straight-line adjustments, our annualized effective rent as of December 31, 2017 was $675.7 million. Our annualized effective rent was greater than our annualized rent as of December 31, 2017 because our positive straight-line and other adjustments and amortization of deferred revenue exceeded our negative straight-line adjustments due to factors such as the timing of contractual rent escalations and customer prepayments for services. |
| |
| (d) | Represents the final monthly contractual rent under existing customer leases that had commenced as of December 31, 2017, multiplied by 12. |