Exhibit 99.1
CyrusOne Reports Second Quarter 2020 Earnings
Signed $37 Million in Annualized GAAP Revenue and 22 Megawatts
Record Quarter-End Backlog of $97 Million in Annualized GAAP Revenue
DALLAS (July 29, 2020) - CyrusOne Inc. (NASDAQ: CONE), a premier global data center REIT, today announced second quarter 2020 earnings.
Highlights
| | | | | | | | |
| Category | 2Q’20 | vs. 2Q’19 |
| Revenue | $256.4 million | 2% |
| Net income / (loss) | $45.0 million | n/m |
| Adjusted EBITDA | $136.8 million | 7% |
| Normalized FFO | $118.9 million | 16% |
| Net income / (loss) per diluted share | $0.39 | n/m |
| Normalized FFO per diluted share | $1.03 | 14% |
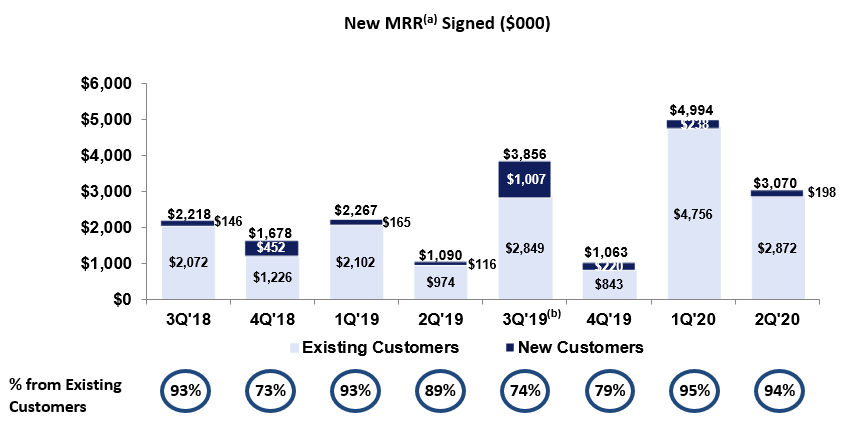
•Leased 22 megawatts (“MW”) and 150,000 colocation square feet (“CSF”) in the second quarter, totaling $37 million in annualized GAAP revenue
–Balanced geographical mix with 51% of annualized GAAP revenue totaling $19 million signed across European markets
–Includes exercise of previously disclosed (in 3Q'19) paid reservation for 4.5 MW totaling approximately $5.5 million in annualized GAAP revenue
•Backlog of $97 million in annualized GAAP revenue as of the end of the second quarter, the highest quarter-end backlog in the company’s history, representing approximately $710 million in total contract value
•Announcing a 2% increase in the quarterly dividend for the third quarter of 2020 to $0.51 per share, up from $0.50 per share in the second quarter of 2020
•Entered into forward sale agreements through the at-the-market (“ATM”) equity program with respect to approximately 4.2 million shares of common stock, which will result in estimated net proceeds of approximately $292 million upon settlement by May 2021
–Combined with the forward sale agreement entered into in the first quarter of 2020, which will result in estimated net proceeds of approximately $121 million upon settlement by March 2021, the Company has approximately $413 million in available forward equity
–Settled the forward sale agreement entered into in the fourth quarter of 2019, resulting in net proceeds of approximately $97 million, which were used to pay down a portion of amounts outstanding on the Company’s unsecured revolving credit facility
“We had another very strong leasing quarter with broad demand across our markets in the U.S. and Europe, and the nearly $100 million revenue backlog positions us well for growth in 2021 and beyond,” said Bruce Duncan, president and chief executive officer of CyrusOne. “We also continue to strengthen our balance sheet, and our $1.5 billion in available liquidity, including more than $400 million in forward equity, gives us significant capacity to fund our development pipeline while managing our leverage.”
Second Quarter 2020 Financial Results
Revenue was $256.4 million for the second quarter, compared to $251.5 million for the same period in 2019, an increase of 2%. The increase in revenue was driven primarily by a 7% increase in occupied CSF, lease termination fees totaling $3.0 million, and additional interconnection services, partially offset by the impact of equipment sales and rent churn. Revenue in the second quarter of 2020 included $6.9 million of equipment sales, compared to $17.1 million of equipment sales for the same period in 2019.
Net income was $45.0 million for the second quarter, compared to net loss of $(8.5) million in the same period in 2019. Net income for the second quarter included a $50.4 million gain on the Company’s equity investment in GDS Holdings Limited (“GDS”), a leading data center provider in China, compared to an $(8.5) million loss in the second quarter of 2019. Also in the second quarter, the Company recognized a $(13.9) million loss associated with a change in fair value on the undesignated portion of its net investment hedge. Net income per diluted common share1 was $0.39 in the second quarter of 2020, compared to net loss per diluted common share of $(0.08) in the same period in 2019.
Net operating income (“NOI”)2 was $157.4 million for the second quarter, compared to $148.2 million in the same period in 2019, an increase of 6%. Adjusted EBITDA3 was $136.8 million for the second quarter, compared to $127.3 million in the same period in 2019, an increase of 7%.
Normalized Funds From Operations (“Normalized FFO”)4 was $118.9 million for the second quarter, compared to $102.1 million in the same period in 2019, an increase of 16%. Normalized FFO per diluted common share was $1.03 in the second quarter of 2020, compared to $0.90 in the same period in 2019, an increase of 14%.
Leasing Activity
CyrusOne leased approximately 22 MW of power and 150,000 CSF in the second quarter, representing approximately $3.1 million in monthly recurring rent, inclusive of the monthly impact of installation charges. The leasing for the quarter represents approximately $36.8 million in annualized GAAP revenue5, excluding estimates for pass-through power. The weighted average lease term of the new leases, based on square footage, is 84 months (7.0 years), and the weighted average remaining lease term of CyrusOne’s portfolio is 52 months (taking into consideration the impact of the backlog). Recurring rent churn percentage6 for the second quarter was 1.1%, compared to 0.6% for the same period in 2019.
Portfolio Development and Percentage CSF Leased
In the second quarter, the Company completed construction on 212,000 CSF and 27 MW of power capacity in San Antonio, Phoenix, Northern Virginia, and London. Percentage CSF leased7 as of the end of the second quarter was 88% for stabilized properties8 and 83% overall. In addition, the Company has development projects underway in Frankfurt, Dublin, London, Northern Virginia, San Antonio, the New York Metro area, and Council Bluffs (IA) that are expected to add approximately 336,000 CSF and 82 MW of power capacity plus 337,000 square feet of powered shell.
Balance Sheet and Liquidity
As of June 30, 2020, the Company had gross asset value9 totaling approximately $8.0 billion, an increase of approximately 13% over gross asset value as of June 30, 2019. CyrusOne had $3.19 billion of long-term debt10, $71 million of cash and cash equivalents, and $1.06 billion available under its unsecured revolving credit facility as of June 30, 2020. Net debt10 was $3.15 billion as of June 30, 2020, representing approximately 27% of the Company's total enterprise value as of June 30, 2020 of $11.7 billion, or 5.0x Adjusted EBITDA for the last quarter annualized (after further adjusting net debt to reflect the pro forma impact of settlement of the forward sale agreements). After further adjusting Adjusted EBITDA to exclude the impact of the adoption of ASC 842 as of January 1, 2019, in order to present the leverage metric on a basis comparable to that of periods prior to 2019, net debt to Adjusted EBITDA for the last quarter annualized was 4.9x11. Available liquidity12 was $1.54 billion as of June 30, 2020.
During the second quarter of 2020, the Company entered into forward sale agreements through the ATM equity program with respect to approximately 4.2 million shares of common stock, which will result in estimated net proceeds of approximately $292 million upon settlement by May 2021. Combined with the forward sale agreement entered into in the first quarter of 2020, which will result in estimated net proceeds of approximately $121 million upon settlement by March 2021, the Company has $413 million in available forward equity (no portion of the forward sale agreements entered into during the first and second quarters of 2020 has been settled as of July 29, 2020). During the second quarter of 2020, the Company settled the forward sale agreement entered into in the fourth quarter of 2019, resulting in net proceeds of approximately $97 million, which were used to pay down a portion of amounts outstanding on the Company’s unsecured revolving credit facility.
Also during the second quarter of 2020, the Company entered into sales agreements pursuant to which the Company may issue and sell from time to time shares of its common stock having an aggregate sales price of up to $750 million through its ATM equity program. This new ATM equity program replaced the prior ATM equity program. As of June 30, 2020, there was approximately $450 million in remaining availability under the new ATM equity program.
Additionally, the Company raised approximately $20 million through the sale of approximately 0.2 million American depository shares (“ADSs”) of GDS. The settlement of a portion of the ADSs and receipt of the associated proceeds occurred in July 2020. After taking into account the impact of the sale of ADSs, CyrusOne owned approximately 2.1 million ADSs with a total value of approximately $164 million based on GDS’s share price as of June 30, 2020.
Dividend
On April 29, 2020, the Company announced a dividend of $0.50 per share of common stock for the second quarter of 2020. The dividend was paid on July 10, 2020, to stockholders of record at the close of business on June 26, 2020.
Additionally, today the Company is announcing a dividend of $0.51 per share of common stock for the third quarter of 2020, a 2% increase in the quarterly dividend compared to the second quarter of 2020. The dividend will be paid on October 9, 2020, to stockholders of record at the close of business on September 25, 2020.
Guidance
CyrusOne is updating guidance for full year 2020, increasing the upper and lower ends of the guidance range for Capital Expenditures and Capital Expenditures - Development and reaffirming its other guidance ranges. The annual guidance provided below represents forward-looking statements, which are based on current economic conditions, internal assumptions about the Company's existing customer base, and the supply and demand dynamics of the markets in which CyrusOne operates. The COVID-19 pandemic continues to evolve rapidly and the potential impact on our business remains uncertain and unpredictable.
CyrusOne does not provide forward-looking guidance for GAAP financial measures (other than Total Revenue and Capital Expenditures) or reconciliations for the non-GAAP financial measures included in the annual guidance provided below due to the inherent difficulty in forecasting and quantifying certain amounts that are necessary for such reconciliations, including Net income (loss) and adjustments that could be made for Transaction, acquisition, integration and other related expenses, Legal claim costs, Impairment losses and loss on disposal of assets and other charges in its reconciliation of historic numbers, the amount of which, based on historical experience, could be significant.
| | | | | | | | |
| Category | Previous 2020 Guidance | Current 2020 Guidance |
| Total Revenue | $1,010 - 1,045 million | $1,010 - 1,045 million |
| Lease and Other Revenues from Customers | $865 - 890 million | $865 - 890 million |
| Metered Power Reimbursements | $145 - 155 million | $145 - 155 million |
| Adjusted EBITDA | $525 - 550 million | $525 - 550 million |
| Normalized FFO per diluted common share | $3.75 - 3.90 | $3.75 - 3.90 |
| Capital Expenditures | $750 - 850 million | $850 - 950 million |
Development(1) | $735 - 830 million | $835 - 930 million |
| Recurring | $15 - 20 million | $15 - 20 million |
| | |
(1)Development capital expenditures include the acquisition of land for future development.
Announcing Retirement of Diane Morefield, Executive Vice President & Chief Financial Officer
CyrusOne is also announcing today that following a successful 40 year career, including the last four years with the company, Diane Morefield plans to retire in early 2021. Ms. Morefield will continue in her role as Executive Vice President & Chief Financial Officer until her successor is appointed, which is targeted to be by December 31, 2020. She will remain with the company during a transition period until her retirement date on March 1, 2021. CyrusOne is conducting a search for its next CFO, which will include consideration of internal and external candidates.
“On behalf of the entire Board and the management team, we thank Diane for her many contributions to CyrusOne since she joined the company in 2016,” said Duncan. “She has been instrumental in the company’s growth, and her leadership will be missed. We are grateful that she has agreed to remain with the company to facilitate a smooth transition. We wish Diane nothing but the best in her retirement.”
“It has been a privilege to be part of the success story at CyrusOne,” said Morefield. “I’m proud of the team we have built and the financial foundation we have set to continue to support the future growth of the company. I look forward to ensuring a smooth transition.”
Upcoming Conferences and Events
•Cowen Virtual Communications Infrastructure Summit on August 11-12
•BMO Capital Markets Virtual Real Assets Conference on September 2-3
•Deutsche Bank Technology Conference on September 14-15 in San Francisco, CA*
•Bank of America Merrill Lynch 2020 Global Real Estate Conference on September 15-16 in New York City*
•Raymond James Park City Summit on September 21-22 in Park City, UT
*Tentative as conference may be virtual
Conference Call Details
CyrusOne will host a conference call on July 30, 2020, at 11:00 AM Eastern Time (10:00 AM Central Time) to discuss its results for the second quarter 2020. A live webcast of the conference call will be available in the “Investors / Events & Presentations” section of the Company's website at http://investor.cyrusone.com/events.cfm. The presentation to be made during the call is now available in this location. The U.S. conference call dial-in number is 1-844-492-3731, and the international dial-in number is 1-412-542-4121. A replay will be available one hour after the conclusion of the earnings call on July 30, 2020, through August 13, 2020. The U.S. toll-free replay dial-in number is 1-877-344-7529 and the international replay dial-in number is 1-412-317-0088. The replay access code is 10145802.
Safe Harbor
This release and the documents incorporated by reference herein contain certain forward-looking statements within the meaning of Section 27A of the Securities Act of 1933, as amended, and Section 21E of the Securities Exchange Act of 1934, as amended. We intend such forward- looking statements to be covered by the safe harbor provisions for forward-looking statements contained in the Private Securities Litigation Reform Act of 1995 and include this statement for purposes of complying with these safe harbor provisions. All statements, other than statements of historical facts, are statements that could be deemed forward-looking statements. These statements are based on current expectations, estimates, forecasts, and projections about the industries in which we operate and the beliefs and assumptions of our management. Words such as "expects," "anticipates," "predicts," "projects," "intends," "plans," "believes," "seeks," "estimates," "continues," "endeavors," "strives," "may," variations of such words and similar expressions are intended to identify such forward-looking statements. In addition, any statements that refer to projections of our future financial performance, our anticipated growth and trends in our and our customers’ respective businesses and industries, and other characterizations of future events or circumstances are forward-looking statements. Readers are cautioned these forward-looking statements are based on current expectations and assumptions that are subject to risks and uncertainties, which could cause our actual results to differ materially and adversely from those reflected in the forward-looking statements. Factors that could cause or contribute to such differences include, but are not limited to, (i) the potential widespread and highly uncertain impact of public health outbreaks, epidemics and pandemics, such as the COVID-19 pandemic; (ii) loss of key customers; (iii) economic downturn, natural disaster or oversupply of data centers in the limited geographic areas that we serve; (iv) risks related to the development of our properties including, without limitation, obtaining applicable permits, power and connectivity and our ability to successfully lease those properties; (v) weakening in the fundamentals for data center real estate, including but not limited to, decreases in or slowed growth of global data, e-commerce and demand for outsourcing of data storage and cloud-based applications; (vi) loss of access to key third-party service providers and suppliers; (vii) risks of loss of power or cooling which may interrupt our services to our customers; (viii) inability to identify and complete acquisitions and operate acquired properties, including those acquired in the acquisition of Zenium Topco Ltd. and certain other affiliated entities (“Zenium”); (ix) our failure to obtain necessary outside financing on favorable terms, or at all; (x) restrictions in the instruments governing our indebtedness; (xi) risks related to environmental matters; (xii) unknown or contingent liabilities related to our acquisitions; (xiii) significant competition in our industry; (xiv) loss of key personnel; (xv) risks associated with real estate assets and the industry; (xvi) failure to maintain our status as a REIT (as defined below) or to comply with the highly technical and complex REIT provisions of the Internal Revenue Code of 1986, as amended; (xvii) REIT distribution requirements could adversely affect our ability to execute our business plan; (xviii) insufficient cash available for distribution to stockholders; (xix) future offerings of debt may adversely affect the market price of our common stock; (xx) increases in market interest rates will increase our borrowings costs and may drive potential investors to seek higher dividend yields and reduce demand for our common stock; (xxi) market price and volume of stock could be volatile; (xxii) risks related to regulatory changes impacting our customers and demand for colocation space in particular geographies; (xxiii) our international activities, including those now conducted as a result of the Zenium acquisition and land acquisitions, are subject to special risks different from those faced by us in the United States; (xxiv) the significant uncertainty that remains about the future relationship between the United Kingdom and the European Union as a result of the United Kingdom’s withdrawal from the European Union; (xxv) expanded and widened price increases in certain selective materials for data center development capital expenditures due to international trade negotiations; (xxvi) a failure to comply with anti-corruption laws and regulations; (xxvii) legislative or other actions relating to taxes; and (xxviii) other factors affecting the real estate and technology
industries generally. More information on potential risks and uncertainties is available in our recent filings with the Securities and Exchange Commission (SEC), including CyrusOne’s Form 10-K report, Form 10-Q reports, and Form 8-K reports. We disclaim any obligation other than as required by law to publicly update or revise any forward-looking statement to reflect changes in underlying assumptions or factors or for new information, data or methods, future events or other changes.
Adoption of New Accounting Standard and Use of Non-GAAP Financial Measures and Other Metrics
In February 2016, the Financial Accounting Standards Board issued ASU 2016-02 (codified in ASC 842, Leases (“ASC 842”)) to increase transparency and comparability among organizations by recognizing lease assets and lease liabilities on the balance sheet and disclosing key information about leasing transactions. The ASU requires that a liability be recorded on the balance sheet for all leases where the reporting entity is a lessee, based on the present value of future lease obligations. A corresponding right-of-use asset will also be recorded. Amortization of the lease obligation and the right-of-use asset for leases classified as operating leases are on a straight-line basis. Leases classified as financing leases are required to be accounted for as financing arrangements similar to the accounting treatment for capital leases under ASC 840, Leases (the former accounting standard for all leases).
We adopted ASU 2016-02 on January 1, 2019, applied the package of practical expedients included therein and utilized the modified retrospective transition method with the cumulative effect of transition recognized on the effective date. By applying the modified retrospective transition method, the presentation of financial information for periods prior to January 1, 2019 was not restated.
This press release contains certain non-GAAP financial measures that management believes are helpful in understanding the Company’s business, as further discussed within this press release. These financial measures, which include Funds From Operations, Normalized Funds From Operations, Normalized Funds From Operations per Diluted Common Share, Adjusted EBITDA, Net Operating Income, and Net Debt should not be construed as being more important than, or a substitute for, comparable GAAP measures. Detailed reconciliations of these non-GAAP financial measures to comparable GAAP financial measures have been included in the tables that accompany this release and are available in the Investor Relations section of www.cyrusone.com.
Management uses FFO, Normalized FFO, Normalized FFO per Diluted Common Share, Adjusted EBITDA, and NOI, which are non-GAAP financial measures commonly used in the REIT industry, as supplemental performance measures. Management uses these measures as supplemental performance measures because, when compared period over period, they capture trends in occupancy rates, rental rates and operating costs. The Company also believes that, as widely recognized measures of the performance of real estate investment trusts (REITs), these measures are used by investors as a basis to evaluate REITs. Other REITs may not calculate these measures in the same manner, and, as presented, they may not be comparable to others. Therefore, FFO, Normalized FFO, NOI, and Adjusted EBITDA should be considered only as supplements to net income presented in accordance with GAAP as measures of our performance. FFO, Normalized FFO, NOI, and Adjusted EBITDA should not be used as measures of liquidity or as indicative of funds available to fund our cash needs, including our ability to make distributions. These measures also should not be used as supplements to or substitutes for cash flow from operating activities computed in accordance with GAAP. The Company believes that Net Debt provides a useful measure of liquidity and financial health.
1Net income (loss) per diluted common share is defined as Net income (loss) divided by the weighted average diluted common shares outstanding for the period, which were 115.7 million for the second quarter of 2020 and 113.1 million for the second quarter of 2019.
2We use Net Operating Income ("NOI"), which is a non-GAAP financial measure commonly used in the REIT industry, as a supplemental performance measure. We use NOI as a supplemental performance measure because, when compared period over period, it captures trends in occupancy rates, rental rates and operating expenses. We also believe that, as a widely recognized measure of the performance of REITs, NOI is used by investors as a basis to evaluate REITs.
We calculate NOI as Net income (loss), adjusted for Sales and marketing expenses, General and administrative expenses, Depreciation and amortization expenses, Transaction, acquisition, integration and other related expenses, Interest expense, net, (Gain) loss on marketable equity investment, Loss on early extinguishment of debt, Impairment losses, Foreign currency and derivative losses, net, Other (income) expense, Income tax benefit and other items as appropriate. Amortization of deferred leasing costs is presented in Depreciation and amortization expenses, which is excluded from NOI. Sales and marketing expenses are not property-specific, rather these expenses support our entire portfolio. As a result, we have excluded these Sales and marketing expenses from our NOI calculation, consistent with the treatment of General and administrative expenses, which also support our entire portfolio. Because the calculation of NOI excludes various expenses, the utility of NOI as a measure of our performance is limited. Other REITs may not calculate NOI in the same manner. Accordingly, our NOI may not be comparable to others. Therefore, NOI should be considered only as a supplement to Net income presented in accordance with GAAP as a measure of our performance. NOI should not be used as a measure of our liquidity or as indicative of funds available to fund our cash needs,
including our ability to make distributions. NOI also should not be used as a supplement to or substitute for cash flow from operating activities computed in accordance with GAAP.
3Adjusted EBITDA, which is a non-GAAP financial measure, is defined as Net income (loss) as defined by GAAP adjusted for Interest expense, net; Income tax benefit ; Depreciation and amortization expenses; Impairment losses; Transaction, acquisition, integration and other related expenses; Legal claim costs; Stock-based compensation expense; Cash severance and management transition costs; Severance-related stock compensation costs; Loss on early extinguishment of debt; New accounting standards and regulatory compliance and the related system implementation costs; (Gain) loss on marketable equity investment; Foreign currency and derivative losses (gains), net; Other expense (income) and other items as appropriate. Other companies may not calculate Adjusted EBITDA in the same manner. Accordingly, the Company’s Adjusted EBITDA as presented may not be comparable to others.
4We use funds from operations ("FFO") and normalized funds from operations ("Normalized FFO"), which are non-GAAP financial measures commonly used in the REIT industry, as supplemental performance measures. We use FFO and Normalized FFO as supplemental performance measures because, when compared period over period, they capture trends in occupancy rates, rental rates and operating costs. We also believe that, as widely recognized measures of the performance of REITs, FFO and Normalized FFO are used by investors as a basis to evaluate REITs.
We calculate FFO as Net income (loss) computed in accordance with GAAP before Real estate depreciation and amortization and Impairment losses and gain on disposal of assets. While it is consistent with the definition of FFO promulgated by the National Association of Real Estate Investment Trusts ("NAREIT"), our computation of FFO may differ from the methodology for calculating FFO used by other REITs. Accordingly, our FFO may not be comparable to others.
We calculate Normalized FFO as FFO adjusted for Loss on early extinguishment of debt; (Gain) loss on marketable equity investment; Foreign currency and derivative losses (gains), net; New accounting standards and regulatory compliance and the related system implementation costs; Amortization of tradenames; Transaction, acquisition, integration and other related expenses; Cash severance and management transition costs; Severance-related stock compensation costs; Legal claim costs and other items as appropriate. We believe our Normalized FFO calculation provides a comparable measure between different periods. Other REITs may not calculate Normalized FFO in the same manner. Accordingly, our Normalized FFO may not be comparable to others.
In addition, because FFO and Normalized FFO exclude Real estate depreciation and amortization, and capture neither the changes in the value of our properties that result from use or from market conditions, nor the level of capital expenditures and leasing commissions necessary to maintain the operating performance of our properties, all of which have real economic effect and could materially impact our results from operations, the utility of FFO and Normalized FFO as measures of our performance is limited. Therefore, FFO and Normalized FFO should be considered only as supplements to Net income presented in accordance with GAAP as measures of our performance. FFO and Normalized FFO should not be used as measures of our liquidity or as indicative of funds available to fund our cash needs, including our ability to make distributions. FFO and Normalized FFO also should not be used as supplements to or substitutes for cash flow from operating activities computed in accordance with GAAP.
5Annualized GAAP revenue is equal to monthly recurring rent, defined as average monthly contractual rent during the term of the lease plus the monthly impact of installation charges, multiplied by 12. It can be shown both inclusive and exclusive of the Company’s estimate of customer reimbursements for metered power.
6Recurring rent churn percentage is calculated as any reduction in recurring rent due to customer terminations, service reductions or net pricing decreases as a percentage of rent at the beginning of the period, excluding any impact from metered power reimbursements or other usage-based billing.
7Percentage CSF leased is calculated by dividing CSF under signed leases for colocation space (whether or not the lease has commenced billing) by total CSF. Percentage CSF leased differs from CSF occupied presented in the Data Center Portfolio table because the leased rate includes CSF for signed leases that have not commenced billing.
8Stabilized properties include data halls that have been in service for at least 24 months or are at least 85% leased.
9Gross asset value is defined as total assets plus accumulated depreciation.
10Long-term debt and net debt exclude adjustments for deferred financing costs and bond discounts / premiums. Net debt, which is a non-GAAP financial measure, provides a useful measure of liquidity and financial health. The Company defines net debt as long-term debt and finance lease liabilities, offset by cash and cash equivalents.
11The estimated impact of the adoption of ASC 842 on Adjusted EBITDA for the last quarter annualized is $15.8 million.
12Liquidity is calculated as cash, cash equivalents, and temporary cash investments on hand, plus the undrawn capacity on CyrusOne’s revolving credit facility, plus the pro forma impact of settlement of the forward sale agreements.
About CyrusOne
CyrusOne (NASDAQ: CONE) is a real estate investment trust (REIT) specializing in highly reliable enterprise-class, carrier-neutral data center properties. The Company provides mission-critical data center facilities that protect and ensure the continued operation of IT infrastructure for approximately 1,000 customers, including approximately 200 Fortune 1000 companies.
With a track record of meeting and surpassing the aggressive speed-to-market demands of hyperscale cloud providers, as well as the expanding IT infrastructure requirements of the enterprise, CyrusOne provides the flexibility, reliability, security, and connectivity that foster business growth. CyrusOne offers a tailored, customer service-focused platform and is committed to full transparency in communication, management, and service delivery throughout its more than 50 data centers worldwide. Additional information about CyrusOne can be found at www.CyrusOne.com.
# # #
Investor Relations
Michael Schafer
Vice President, Capital Markets & Investor Relations
972-350-0060
investorrelations@cyrusone.com
Company Profile
CyrusOne (NASDAQ: CONE) specializes in highly reliable enterprise-class, carrier-neutral data center properties. The Company provides mission-critical data center facilities that protect and ensure the continued operation of IT infrastructure for approximately 1,000 customers, including approximately 200 Fortune 1000 companies. CyrusOne's data center offerings provide the flexibility, reliability, and security that enterprise customers require and are delivered through a tailored, customer service-focused platform designed to foster long-term relationships. CyrusOne is committed to full transparency in communication, management, and service delivery throughout its more than 50 data centers worldwide.
•Best-in-Class Sales Force
•Flexible Solutions that Scale as Customers Grow
•Massively Modular® Engineering with Data Hall Builds in 10-14 Weeks
•Focus on Operational Excellence and Superior Customer Service
•Proven Leading-Edge Technology Delivering Power Densities up to 900 Watts per Square Foot
•National IX Replicates Enterprise Data Center Architecture
| | | | | | | | |
| Corporate Headquarters | Senior Management | |
| 2850 N. Harwood Street, Ste. 2200 | Bruce Duncan, President and CEO | John Gould, EVP & Chief Commercial Officer |
| Dallas, Texas 75201 | Diane Morefield, EVP & Chief Financial Officer | Kellie Teal-Guess, EVP & Chief People Officer |
| Phone: (972) 350-0060 | Kevin Timmons, EVP & Chief Technology Officer | Robert Jackson, EVP General Counsel & Secretary |
| Website: www.cyrusone.com | Jonathan Schildkraut, EVP & Chief Strategy Officer | Matt Pullen, EVP & Managing Director, Europe |
Analyst Coverage
| | | | | | | | |
| Firm | Analyst | Phone Number |
| Bank of America Merrill Lynch | Michael J. Funk | (646) 855-5664 |
| Barclays | Tim Long | (212) 526-4043 |
| Berenberg Capital Markets | Nate Crossett | (646) 949-9030 |
| BMO Capital Markets | Ari Klein | (212) 885-4103 |
| Citi | Mike Rollins | (212) 816-1116 |
| Cowen and Company | Colby Synesael | (646) 562-1355 |
| Credit Suisse | Sami Badri | (212) 538-1727 |
| Deutsche Bank | Matthew Niknam | (212) 250-4711 |
| Green Street Advisors | David Guarino | (949) 640-8780 |
| Jefferies | Jonathan Petersen | (212) 284-1705 |
| J.P. Morgan | Richard Choe | (212) 622-6708 |
| KeyBanc Capital Markets | Jordan Sadler | (917) 368-2280 |
| MoffettNathanson | Nick Del Deo, CFA | (212) 519-0025 |
| Morgan Stanley | Simon Flannery | (212) 761-6432 |
| RBC Capital Markets | Jonathan Atkin | (415) 633-8589 |
| Raymond James | Frank G. Louthan IV | (404) 442-5867 |
| Stifel | Erik Rasmussen | (212) 271-3461 |
| SunTrust Robinson Humphrey | Greg Miller | (212) 303-4169 |
| UBS | John C. Hodulik, CFA | (212) 713-4226 |
| Wells Fargo | Eric Luebchow | (312) 630-2386 |
| William Blair | Jim Breen, CFA | (617) 235-7513 |
CyrusOne Inc.
Summary of Financial Data
(Dollars in millions, except per share amounts)
| | | | | | | | | | | | | | | | | |
| | Three Months | | | | | | |
| | June 30, | March 31, | June 30, | Growth % | | | |
| | 2020 | 2020 | 2019 | Yr/Yr | | | |
| Revenue | $ | 256.4 | | $ | 245.9 | | $ | 251.5 | | 2 | % | | | |
| Net operating income | 157.4 | | 153.3 | | 148.2 | | 6 | % | | | |
| Net income (loss) | 45.0 | | 14.7 | | (8.5) | | n/m | | | |
| Funds from Operations ("FFO") - Nareit defined | 154.9 | | 120.4 | | 91.7 | | 69 | % | | | |
| Normalized Funds from Operations ("Normalized FFO") | 118.9 | | 111.8 | | 102.1 | | 16 | % | | | |
| Weighted average number of common shares outstanding - diluted for Normalized FFO | 115.7 | | 115.1 | | 113.1 | | 2 | % | | | |
| Income (loss) per share - basic | $ | 0.39 | | $ | 0.13 | | $ | (0.08) | | n/m | | | |
| Income (loss) per share - diluted | $ | 0.39 | | $ | 0.13 | | $ | (0.08) | | n/m | | | |
| Normalized FFO per diluted common share | $ | 1.03 | | $ | 0.97 | | $ | 0.90 | | 14 | % | | | |
| Adjusted EBITDA | $ | 136.8 | | $ | 132.2 | | $ | 127.3 | | 7 | % | | | |
| Adjusted EBITDA as a % of Revenue | 53.4 | % | 53.8 | % | 50.6 | % | 2.8 pts | | | |
| | | | | | | | | | | | | | |
| | As of | | | |
| | June 30, | March 31, | June 30, | Growth % |
| | 2020 | 2020 | 2019 | Yr/Yr |
| Balance Sheet Data | | | | |
| Gross investment in real estate | $ | 6,504.9 | | $ | 6,260.9 | | $ | 5,707.0 | | 14 | % |
| Accumulated depreciation | (1,562.7) | | (1,469.5) | | (1,207.4) | | 29 | % |
| Total investment in real estate, net | 4,942.2 | | 4,791.4 | | 4,499.6 | | 10 | % |
| Cash and cash equivalents | 70.7 | | 57.3 | | 144.1 | | (51) | % |
| Market value of common equity | 8,501.0 | | 7,102.1 | | 6,532.5 | | 30 | % |
| Long-term debt | 3,191.3 | | 3,084.0 | | 2,729.9 | | 17 | % |
| Net debt | 3,149.4 | | 3,056.1 | | 2,617.4 | | 20 | % |
| Total enterprise value | 11,650.4 | | 10,158.2 | | 9,149.9 | | 27 | % |
Net debt to LQA Adjusted EBITDA(a) | 5.0x | 5.4x | 5.1x | (0.1)x |
| | | | |
| Dividend Activity | | | | |
| Dividends per share | $ | 0.50 | | $ | 0.50 | | $ | 0.46 | | 9 | % |
| | | | |
| Portfolio Statistics | | | | |
| Data centers | 51 | | 48 | | 47 | | 9 | % |
| Stabilized CSF (000) | 4,055 | | 4,035 | | 3,744 | | 8 | % |
| Stabilized CSF % leased | 88 | % | 88 | % | 89 | % | (1) pts |
| Total CSF (000) | 4,427 | | 4,215 | | 4,116 | | 8 | % |
| Total CSF % leased | 83 | % | 86 | % | 84 | % | (1) pts |
| Total GSF (000) | 7,605 | | 7,243 | | 7,085 | | 7 | % |
(a) June 30, 2020 and March 31, 2020 periods adjusted to reflect the pro forma impact of settlement of the forward sale agreements.
CyrusOne Inc.
Condensed Consolidated Statements of Operations
(Dollars in millions, except per share amounts)
(Unaudited)
| | | | | | | | | | | | | | | | | | | | | | | | | | |
| | Three Months | | | | Six Months | | | |
| | Ended June 30, | | Change | | Ended June 30, | | Change | |
| | 2020 | 2019 | $ | % | 2020 | 2019 | $ | % |
Revenue(a) | $ | 256.4 | | $ | 251.5 | | $ | 4.9 | | 2 | % | $ | 502.3 | | $ | 476.5 | | $ | 25.8 | | 5 | % |
| Operating expenses: | | | | | | | | |
| Property operating expenses | 99.0 | | 103.3 | | (4.3) | | (4) | % | 191.6 | | 186.6 | | 5.0 | | 3 | % |
| Sales and marketing | 3.8 | | 5.3 | | (1.5) | | (28) | % | 8.5 | | 10.6 | | (2.1) | | (20) | % |
| General and administrative | 20.3 | | 19.7 | | 0.6 | | 3 | % | 47.2 | | 41.9 | | 5.3 | | 13 | % |
| Depreciation and amortization | 109.7 | | 102.1 | | 7.6 | | 7 | % | 217.8 | | 204.2 | | 13.6 | | 7 | % |
| Transaction, acquisition, integration and other related expenses | 0.1 | | 1.4 | | (1.3) | | (93) | % | 0.5 | | 1.7 | | (1.2) | | (71) | % |
| Impairment losses | 2.4 | | — | | 2.4 | | n/m | 2.4 | | — | | 2.4 | | n/m |
| Total operating expenses | 235.3 | | 231.8 | | 3.5 | | 2 | % | 468.0 | | 445.0 | | 23.0 | | 5 | % |
| Operating income | 21.1 | | 19.7 | | 1.4 | | 7 | % | 34.3 | | 31.5 | | 2.8 | | 9 | % |
| Interest expense, net | (13.9) | | (21.1) | | 7.2 | | (34) | % | (29.9) | | (44.8) | | 14.9 | | (33) | % |
| Gain (loss) on marketable equity investment | 50.4 | | (8.5) | | 58.9 | | n/m | 65.1 | | 92.7 | | (27.6) | | (30) | % |
| Loss on early extinguishment of debt | — | | — | | — | | n/m | (3.4) | | — | | (3.4) | | n/m |
| Foreign currency and derivative losses, net | (13.9) | | — | | (13.9) | | n/m | (8.8) | | — | | (8.8) | | n/m |
| Other income (expense) | 0.1 | | — | | 0.1 | | n/m | — | | (0.1) | | 0.1 | | (100) | % |
| Net income (loss) before income taxes | 43.8 | | (9.9) | | 53.7 | | n/m | 57.3 | | 79.3 | | (22.0) | | (28) | % |
| Income tax benefit | 1.2 | | 1.4 | | (0.2) | | (14) | % | 2.4 | | 1.6 | | 0.8 | | 50 | % |
| Net income (loss) | $ | 45.0 | | $ | (8.5) | | $ | 53.5 | | n/m | $ | 59.7 | | $ | 80.9 | | $ | (21.2) | | (26) | % |
| Income (loss) per share - basic | $ | 0.39 | | $ | (0.08) | | $ | 0.47 | | n/m | $ | 0.52 | | $ | 0.73 | | $ | (0.21) | | (29) | % |
| Income (loss) per share - diluted | $ | 0.39 | | $ | (0.08) | | $ | 0.47 | | n/m | $ | 0.52 | | $ | 0.73 | | $ | (0.21) | | (29) | % |
(a) Revenue includes metered power reimbursements of $37.1 million and $31.7 million for the three months ended June 30, 2020 and 2019, respectively, and includes metered power reimbursements of $71.9 million and $60.3 million for the six months ended June 30, 2020 and 2019, respectively.
CyrusOne Inc.
Condensed Consolidated Balance Sheets
(Dollars in millions)
(Unaudited)
| | | | | | | | | | | | | | |
| | June 30, | December 31, | Change | |
| | 2020 | 2019 | $ | % |
| Assets | | | | |
| Investment in real estate: | | | | |
| Land | $ | 175.5 | | $ | 147.6 | | $ | 27.9 | | 19 | % |
| Buildings and improvements | 1,857.9 | | 1,761.4 | | 96.5 | | 5 | % |
| Equipment | 3,229.5 | | 3,028.2 | | 201.3 | | 7 | % |
| Gross operating real estate | 5,262.9 | | 4,937.2 | | 325.7 | | 7 | % |
| Less accumulated depreciation | (1,562.7) | | (1,379.2) | | (183.5) | | 13 | % |
| Net operating real estate | 3,700.2 | | 3,558.0 | | 142.2 | | 4 | % |
| Construction in progress, including land under development | 1,024.8 | | 946.3 | | 78.5 | | 8 | % |
| Land held for future development | 217.2 | | 206.0 | | 11.2 | | 5 | % |
| Total investment in real estate, net | 4,942.2 | | 4,710.3 | | 231.9 | | 5 | % |
| Cash and cash equivalents | 70.7 | | 76.4 | | (5.7) | | (7) | % |
| Rent and other receivables, net | 307.0 | | 291.9 | | 15.1 | | 5 | % |
| Restricted cash | 1.3 | | 1.3 | | — | | n/m |
| Operating lease right-of-use assets, net | 204.7 | | 161.9 | | 42.8 | | 26 | % |
| Equity investments | 184.9 | | 135.1 | | 49.8 | | 37 | % |
| Goodwill | 455.1 | | 455.1 | | — | | n/m |
| Intangible assets, net | 174.9 | | 196.1 | | (21.2) | | (11) | % |
| Other assets | 127.3 | | 113.9 | | 13.4 | | 12 | % |
| Total assets | $ | 6,468.1 | | $ | 6,142.0 | | $ | 326.1 | | 5 | % |
| Liabilities and equity | | | | |
| Debt | $ | 3,156.9 | | $ | 2,886.6 | | $ | 270.3 | | 9 | % |
| Finance lease liabilities | 28.8 | | 31.8 | | (3.0) | | (9) | % |
| Operating lease liabilities | 240.5 | | 195.8 | | 44.7 | | 23 | % |
| Construction costs payable | 155.7 | | 176.3 | | (20.6) | | (12) | % |
| Accounts payable and accrued expenses | 127.0 | | 122.7 | | 4.3 | | 4 | % |
| Dividends payable | 59.7 | | 58.6 | | 1.1 | | 2 | % |
| Deferred revenue and prepaid rents | 166.2 | | 163.7 | | 2.5 | | 2 | % |
| Deferred tax liability | 55.8 | | 60.5 | | (4.7) | | (8) | % |
| Other liabilities | 16.8 | | 11.4 | | 5.4 | | 47 | % |
| Total liabilities | 4,007.4 | | 3,707.4 | | 300.0 | | 8 | % |
| Stockholders' equity | | | | |
| Preferred stock, $.01 par value, 100,000,000 authorized; no shares issued or outstanding | — | | — | | — | | n/m |
| Common stock, $0.01 par value, 500,000,000 shares authorized and 116,852,894 and 114,808,898 shares issued and outstanding at June 30, 2020 and December 31, 2019, respectively | 1.2 | | 1.1 | | 0.1 | | 9.1 | % |
| Additional paid in capital | 3,305.9 | | 3,202.0 | | 103.9 | | 3 | % |
| Accumulated deficit | (824.7) | | (767.3) | | (57.4) | | 7 | % |
| Accumulated other comprehensive loss | (21.7) | | (1.2) | | (20.5) | | n/m |
| Total stockholders’ equity | 2,460.7 | | 2,434.6 | | 26.1 | | 1 | % |
| | | | |
| | | | |
| Total liabilities and equity | $ | 6,468.1 | | $ | 6,142.0 | | $ | 326.1 | | 5 | % |
CyrusOne Inc.
Condensed Consolidated Statements of Operations
(Dollars in millions, except per share amounts)
(Unaudited)
| | | | | | | | | | | | | | | | | |
| For the three months ended: | June 30, | March 31, | December 31, | September 30, | June 30, |
| | 2020 | 2020 | 2019 | 2019 | 2019 |
| | | | | |
| | | | | |
| | | | | |
Revenue(a) | $ | 256.4 | | $ | 245.9 | | $ | 253.9 | | $ | 250.9 | | $ | 251.5 | |
| Operating expenses: | | | | | |
| Property operating expenses | 99.0 | | 92.6 | | 93.8 | | 103.0 | | 103.3 | |
| Sales and marketing | 3.8 | | 4.7 | | 4.5 | | 5.1 | | 5.3 | |
| General and administrative | 20.3 | | 26.9 | | 21.8 | | 19.8 | | 19.7 | |
| Depreciation and amortization | 109.7 | | 108.1 | | 108.1 | | 105.4 | | 102.1 | |
| Transaction, acquisition, integration and other related expenses | 0.1 | | 0.4 | | 2.7 | | 4.4 | | 1.4 | |
| Impairment losses | 2.4 | | — | | 0.7 | | — | | — | |
| Total operating expenses | 235.3 | | 232.7 | | 231.6 | | 237.7 | | 231.8 | |
| Operating income | 21.1 | | 13.2 | | 22.3 | | 13.2 | | 19.7 | |
| Interest expense, net | (13.9) | | (16.0) | | (17.6) | | (19.6) | | (21.1) | |
| Gain (loss) on marketable equity investment | 50.4 | | 14.7 | | 27.2 | | 12.4 | | (8.5) | |
| Loss on early extinguishment of debt | — | | (3.4) | | (71.8) | | — | | — | |
| Foreign currency and derivative (losses) gains, net | (13.9) | | 5.1 | | (13.0) | | 5.5 | | — | |
| Other income (expense) | 0.1 | | (0.1) | | 0.7 | | (0.9) | | — | |
| Net income (loss) before income taxes | 43.8 | | 13.5 | | (52.2) | | 10.6 | | (9.9) | |
| Income tax benefit | 1.2 | | 1.2 | | 0.1 | | 2.0 | | 1.4 | |
| Net income (loss) | $ | 45.0 | | $ | 14.7 | | $ | (52.1) | | $ | 12.6 | | $ | (8.5) | |
| Income (loss) per share - basic | $ | 0.39 | | $ | 0.13 | | $ | (0.46) | | $ | 0.11 | | $ | (0.08) | |
| Income (loss) per share - diluted | $ | 0.39 | | $ | 0.13 | | $ | (0.46) | | $ | 0.11 | | $ | (0.08) | |
(a) Revenue includes metered power reimbursements of $37.1 million, $34.8 million, $37.5 million, $41.1 million and $31.7 million for the three months ended June 30, 2020, March 31, 2020, December 31, 2019, September 30, 2019 and June 30, 2019, respectively.
CyrusOne Inc.
Condensed Consolidated Balance Sheets
(Dollars in millions)
(Unaudited)
| | | | | | | | | | | | | | | | | |
| June 30, | March 31, | December 31, | September 30, | June 30, |
| 2020 | 2020 | 2019 | 2019 | 2019 |
| Assets | | | | | |
| Investment in real estate: | | | | | |
| Land | $ | 175.5 | | $ | 172.2 | | $ | 147.6 | | $ | 147.3 | | $ | 148.0 | |
| Buildings and improvements | 1,857.9 | | 1,786.3 | | 1,761.4 | | 1,732.0 | | 1,689.7 | |
| Equipment | 3,229.5 | | 3,106.4 | | 3,028.2 | | 2,950.3 | | 2,869.7 | |
| Gross operating real estate | 5,262.9 | | 5,064.9 | | 4,937.2 | | 4,829.6 | | 4,707.4 | |
| Less accumulated depreciation | (1,562.7) | | (1,469.5) | | (1,379.2) | | (1,292.7) | | (1,207.4) | |
| Net operating real estate | 3,700.2 | | 3,595.4 | | 3,558.0 | | 3,536.9 | | 3,500.0 | |
| Construction in progress, including land under development | 1,024.8 | | 990.6 | | 946.3 | | 836.9 | | 799.2 | |
| Land held for future development | 217.2 | | 205.4 | | 206.0 | | 204.3 | | 200.4 | |
| Total investment in real estate, net | 4,942.2 | | 4,791.4 | | 4,710.3 | | 4,578.1 | | 4,499.6 | |
| Cash and cash equivalents | 70.7 | | 57.3 | | 76.4 | | 51.7 | | 144.1 | |
| Rent and other receivables, net | 307.0 | | 305.3 | | 291.9 | | 279.3 | | 268.4 | |
| Restricted cash | 1.3 | | 1.3 | | 1.3 | | 1.3 | | 1.3 | |
| Operating lease right-of-use assets, net | 204.7 | | 208.6 | | 161.9 | | 90.7 | | 78.5 | |
| Equity investments | 184.9 | | 153.1 | | 135.1 | | 104.3 | | 91.9 | |
| Goodwill | 455.1 | | 455.1 | | 455.1 | | 455.1 | | 455.1 | |
| Intangible assets, net | 174.9 | | 184.5 | | 196.1 | | 203.7 | | 215.3 | |
| Other assets | 127.3 | | 121.9 | | 113.9 | | 128.7 | | 115.5 | |
| Total assets | $ | 6,468.1 | | $ | 6,278.5 | | $ | 6,142.0 | | $ | 5,892.9 | | $ | 5,869.7 | |
| Liabilities and equity | | | | | |
| Debt | $ | 3,156.9 | | $ | 3,047.0 | | $ | 2,886.6 | | $ | 2,776.1 | | $ | 2,713.8 | |
| Finance lease liabilities | 28.8 | | 29.4 | | 31.8 | | 30.7 | | 31.6 | |
| Operating lease liabilities | 240.5 | | 243.0 | | 195.8 | | 124.3 | | 114.1 | |
| Construction costs payable | 155.7 | | 183.4 | | 176.3 | | 131.2 | | 149.5 | |
| Accounts payable and accrued expenses | 127.0 | | 121.0 | | 122.7 | | 132.4 | | 112.8 | |
| Dividends payable | 59.7 | | 58.7 | | 58.6 | | 57.7 | | 53.0 | |
| Deferred revenue and prepaid rents | 166.2 | | 167.3 | | 163.7 | | 164.0 | | 166.8 | |
| Deferred tax liability | 55.8 | | 57.0 | | 60.5 | | 59.6 | | 65.5 | |
| Other liabilities | 16.8 | | 7.9 | | 11.4 | | — | | — | |
| Total liabilities | 4,007.4 | | 3,914.7 | | 3,707.4 | | 3,476.0 | | 3,407.1 | |
| Stockholders' equity | | | | | |
| Preferred stock, $.01 par value, 100,000,000 authorized; no shares issued or outstanding | — | | — | | — | | — | | — | |
| Common stock, $0.01 par value, 500,000,000 shares authorized and 116,852,894 and 114,808,898 shares issued and outstanding at June 30, 2020 and December 31, 2019, respectively | 1.2 | | 1.2 | | 1.1 | | 1.1 | | 1.1 | |
| Additional paid in capital | 3,305.9 | | 3,199.9 | | 3,202.0 | | 3,094.2 | | 3,089.5 | |
| Accumulated deficit | (824.7) | | (811.0) | | (767.3) | | (657.4) | | (613.0) | |
| Accumulated other comprehensive loss | (21.7) | | (26.3) | | (1.2) | | (21.0) | | (15.0) | |
| Total stockholders' equity | 2,460.7 | | 2,363.8 | | 2,434.6 | | 2,416.9 | | 2,462.6 | |
| Total liabilities and equity | $ | 6,468.1 | | $ | 6,278.5 | | $ | 6,142.0 | | $ | 5,892.9 | | $ | 5,869.7 | |
CyrusOne Inc.
Condensed Consolidated Statements of Cash Flow
(Dollars in millions)
(Unaudited)
| | | | | | | | | | | | | | |
| | Six Months Ended June 30, 2020 | Six Months Ended June 30, 2019 | Three Months Ended June 30, 2020 | Three Months Ended June 30, 2019 |
| Cash flows from operating activities: | | | | |
| Net income (loss) | $ | 59.7 | | $ | 80.9 | | $ | 45.0 | | $ | (8.5) | |
| Adjustments to reconcile net income (loss) to net cash provided by operating activities: | | | | |
| Depreciation and amortization | 217.8 | | 204.2 | | 109.7 | | 102.1 | |
| Provision for bad debt expense | — | | (0.3) | | 0.1 | | (0.3) | |
| (Gain) loss on marketable equity investment | (65.1) | | (92.7) | | (50.4) | | 8.5 | |
| Foreign currency and derivative losses, net | 8.8 | | — | | 13.9 | | — | |
| Proceeds from swap terminations | 2.9 | | — | | — | | — | |
| Impairment on land held for future development | 2.2 | | — | | 2.2 | | — | |
| Loss on early extinguishment of debt | 3.4 | | — | | — | | — | |
| Interest expense amortization, net | 3.6 | | 2.3 | | 1.6 | | 1.1 | |
| Stock-based compensation expense | 7.0 | | 8.2 | | 3.3 | | 3.7 | |
| Deferred income tax benefit | (4.2) | | (3.4) | | (2.2) | | (2.6) | |
| Operating lease cost | 13.0 | | 9.6 | | 6.8 | | 4.6 | |
| Other income (expense) | 0.5 | | (0.2) | | 0.3 | | 0.3 | |
| | | | |
| Change in operating assets and liabilities: | | | | |
| Rent and other receivables, net and other assets | (31.0) | | (41.1) | | (1.6) | | (23.1) | |
| Accounts payable and accrued expenses | 4.7 | | (8.2) | | 5.9 | | 31.6 | |
| Deferred revenue and prepaid rents | 2.0 | | 18.0 | | (1.2) | | 10.9 | |
| Operating lease liabilities | (11.1) | | (9.8) | | (5.5) | | (4.7) | |
| Net cash provided by operating activities | 214.2 | | 167.5 | | 127.9 | | 123.6 | |
| Cash flows from investing activities: | | | | |
| Investments in real estate | (458.0) | | (514.8) | | (261.5) | | (212.9) | |
| | | | |
| Proceeds from sale of equity investments | 8.2 | | 199.8 | | 8.2 | | 199.8 | |
| Equity investments | (4.7) | | (0.3) | | (1.4) | | (0.3) | |
| Proceeds from the sale of real estate assets | 0.3 | | — | | 0.3 | | — | |
| Net cash used in investing activities | (454.2) | | (315.3) | | (254.4) | | (13.4) | |
| Cash flows from financing activities: | | | | |
| Issuance of common stock, net | 103.3 | | 252.6 | | 102.7 | | 147.6 | |
| Dividends paid | (116.1) | | (101.3) | | (57.7) | | (50.9) | |
| Payment of deferred financing costs | (12.5) | | — | | 1.1 | | — | |
| Proceeds from revolving credit facility | 438.8 | | 287.8 | | 194.4 | | 12.1 | |
| Repayments of revolving credit facility | (723.1) | | — | | (100.0) | | — | |
| Proceeds from Euro bond | 550.2 | | — | | (0.4) | | — | |
| Proceeds from unsecured term loan | 1,100.0 | | — | | — | | — | |
| Repayments of unsecured term loan | (1,100.0) | | (200.0) | | — | | (200.0) | |
| Payments on finance lease liabilities | (1.3) | | (1.2) | | (0.6) | | (0.6) | |
| Tax payment upon exercise of equity awards | (6.4) | | (8.8) | | (0.1) | | (0.1) | |
| Net cash provided by (used in) financing activities | 232.9 | | 229.1 | | 139.4 | | (91.9) | |
| Effect of exchange rate changes on cash, cash equivalents and restricted cash | 1.4 | | (0.3) | | 0.5 | | (0.2) | |
| Net (decrease) increase in cash, cash equivalents and restricted cash | (5.7) | | 81.0 | | 13.4 | | 18.1 | |
| Cash, cash equivalents and restricted cash at beginning of period | 77.7 | | 64.4 | | 58.6 | | 127.3 | |
| Cash, cash equivalents and restricted cash at end of period | $ | 72.0 | | $ | 145.4 | | $ | 72.0 | | $ | 145.4 | |
| | | | |
| Supplemental disclosure of cash flow information: | | | | |
| Cash paid for interest, including amounts capitalized of $11.4 million and $18.1 million in 2020 and 2019, respectively | $ | 30.0 | | $ | 62.7 | | $ | 21.7 | | $ | 16.0 | |
| Cash paid for income taxes | 0.1 | | 2.8 | | 0.1 | | 2.8 | |
| Non-cash investing and financing activities: | | | | |
| Construction costs payable | 155.7 | | 149.5 | | 155.7 | | 149.5 | |
| Dividends payable | 59.7 | | 53.0 | | 59.7 | | 53.0 | |
CyrusOne Inc.
Reconciliation of Net Income (Loss) to Net Operating Income
(Dollars in millions)
(Unaudited)
| | | | | | | | | | | | | | | | | | | | | | | | | | |
| | Three Months Ended | | | | Six Months Ended | | | |
| | June 30, | | Change | | June 30, | | Change | |
| 2020 | 2019 | $ | % | 2020 | 2019 | $ | % |
| Net income (loss) | $ | 45.0 | | $ | (8.5) | | $ | 53.5 | | n/m | $ | 59.7 | | $ | 80.9 | | $ | (21.2) | | (26) | % |
| Sales and marketing expenses | 3.8 | | 5.3 | | (1.5) | | (28) | % | 8.5 | | 10.6 | | (2.1) | | (20) | % |
| General and administrative expenses | 20.3 | | 19.7 | | 0.6 | | 3 | % | 47.2 | | 41.9 | | 5.3 | | 13 | % |
| Depreciation and amortization expenses | 109.7 | | 102.1 | | 7.6 | | 7 | % | 217.8 | | 204.2 | | 13.6 | | 7 | % |
| Transaction, acquisition, integration and other related expenses | 0.1 | | 1.4 | | (1.3) | | (93) | % | 0.5 | | 1.7 | | (1.2) | | (71) | % |
| Interest expense, net | 13.9 | | 21.1 | | (7.2) | | (34) | % | 29.9 | | 44.8 | | (14.9) | | (33) | % |
| (Gain) loss on marketable equity investment | (50.4) | | 8.5 | | (58.9) | | n/m | (65.1) | | (92.7) | | 27.6 | | (30) | % |
| Loss on early extinguishment of debt | — | | — | | — | | n/m | 3.4 | | — | | 3.4 | | n/m |
| Impairment losses | 2.4 | | — | | 2.4 | | n/m | 2.4 | | — | | 2.4 | | n/m |
| Foreign currency and derivative losses, net | 13.9 | | — | | 13.9 | | n/m | 8.8 | | — | | 8.8 | | n/m |
| Other (income) expense | (0.1) | | — | | (0.1) | | n/m | — | | 0.1 | | (0.1) | | n/m |
| Income tax benefit | (1.2) | | (1.4) | | 0.2 | | (14) | % | (2.4) | | (1.6) | | (0.8) | | 50 | % |
| Net Operating Income | $ | 157.4 | | $ | 148.2 | | $ | 9.2 | | 6 | % | $ | 310.7 | | $ | 289.9 | | $ | 20.8 | | 7 | % |
CyrusOne Inc.
Net Operating Income and Reconciliation of Net Income (Loss) to Adjusted EBITDA
(Dollars in millions)
(Unaudited)
| | | | | | | | | | | | | | | | | | | | | | | | | | | | | | |
| | Six Months Ended | | | | Three Months Ended | | | | | |
| | June 30, | | Change | | June 30, | March 31, | December 31, | September 30, | June 30, | |
| | 2020 | 2019 | $ | % | 2020 | 2020 | 2019 | 2019 | 2019 | |
| Net Operating Income | | | | | | | | | | |
| Revenue | $ | 502.3 | | $ | 476.5 | | $ | 25.8 | | 5% | $ | 256.4 | | $ | 245.9 | | $ | 253.9 | | $ | 250.9 | | $ | 251.5 | | |
| Property operating expenses | 191.6 | | 186.6 | | 5.0 | | 3% | 99.0 | | 92.6 | | 93.8 | | 103.0 | | 103.3 | | |
| Net Operating Income (NOI) | $ | 310.7 | | $ | 289.9 | | $ | 20.8 | | 7% | $ | 157.4 | | $ | 153.3 | | $ | 160.1 | | $ | 147.9 | | $ | 148.2 | | |
| | | | | | | | | | |
| | | | | | | | | | |
| NOI as a % of Revenue | 61.9 | % | 60.8 | % | | | 61.4 | % | 62.3 | % | 63.1 | % | 58.9 | % | 58.9 | % | |
| Reconciliation of Net Income (Loss) to Adjusted EBITDA: | | | | | | | | | | |
| Net income (loss) | $ | 59.7 | | $ | 80.9 | | $ | (21.2) | | (26)% | $ | 45.0 | | $ | 14.7 | | $ | (52.1) | | $ | 12.6 | | $ | (8.5) | | |
| Interest expense, net | 29.9 | | 44.8 | | (14.9) | | (33)% | 13.9 | | 16.0 | | 17.6 | | 19.6 | | 21.1 | | |
| Income tax benefit | (2.4) | | (1.6) | | (0.8) | | 50 | (1.2) | | (1.2) | | (0.1) | | (2.0) | | (1.4) | | |
| Depreciation and amortization expenses | 217.8 | | 204.2 | | 13.6 | | 7% | 109.7 | | 108.1 | | 108.1 | | 105.4 | | 102.1 | | |
| Impairment losses | 2.4 | | — | | 2.4 | | n/m | 2.4 | | — | | 0.7 | | — | | — | | |
EBITDA (Nareit definition)(a) | $ | 307.4 | | $ | 328.3 | | $ | (20.9) | | (6)% | $ | 169.8 | | $ | 137.6 | | $ | 74.2 | | $ | 135.6 | | $ | 113.3 | | |
| | | | | | | | | | |
| Transaction, acquisition, integration and other related expenses | 0.5 | | 1.7 | | (1.2) | | (71)% | 0.1 | | 0.4 | | 2.7 | | 4.4 | | 1.4 | | |
| Legal claim costs | 0.2 | | 0.2 | | — | | n/m | 0.1 | | 0.1 | | 0.5 | | 0.4 | | 0.1 | | |
| Stock-based compensation expense | 6.9 | | 8.2 | | (1.3) | | (16)% | 3.4 | | 3.5 | | 4.3 | | 4.2 | | 3.7 | | |
| Cash severance and management transition costs | 6.8 | | 0.1 | | 6.7 | | n/m | — | | 6.8 | | (0.7) | | — | | — | | |
| Severance-related stock compensation costs | 0.1 | | — | | 0.1 | | n/m | — | | 0.1 | | — | | — | | — | | |
| Loss on early extinguishment of debt | 3.4 | | — | | 3.4 | | n/m | — | | 3.4 | | 71.8 | | — | | — | | |
| New accounting standards and regulatory compliance and the related system implementation costs | — | | 0.6 | | (0.6) | | n/m | — | | — | | — | | 0.2 | | 0.3 | | |
| (Gain) loss on marketable equity investment | (65.1) | | (92.7) | | 27.6 | | (30)% | (50.4) | | (14.7) | | (27.2) | | (12.4) | | 8.5 | | |
| Foreign currency and derivative losses (gains), net | 8.8 | | — | | 8.8 | | n/m | 13.9 | | (5.1) | | 13.0 | | (5.5) | | — | | |
| Other expense (income) | — | | 0.1 | | (0.1) | | n/m | (0.1) | | 0.1 | | (0.7) | | 0.9 | | — | | |
| Adjusted EBITDA | $ | 269.0 | | $ | 246.5 | | $ | 22.5 | | 9% | $ | 136.8 | | $ | 132.2 | | $ | 137.9 | | $ | 127.8 | | $ | 127.3 | | |
| Adjusted EBITDA as a % of Revenue | 53.6 | % | 51.7 | % | | | 53.4 | % | 53.8 | % | 54.3 | % | 50.9 | % | 50.6 | % | |
(a)We calculate Earnings Before Interest, Taxes, Depreciation and Amortization for Real Estate (EBITDAre) as GAAP Net income (loss) plus Interest expense, net, Income tax benefit, Depreciation and amortization expenses and Impairment losses. While it is consistent with the definition of EBITDAre promulgated by the National Association of Real Estate Investment Trusts ("Nareit"), our computation of EBITDAre may differ from the methodology for calculating EBITDAre used by other REITs. Accordingly, our EBITDAre may not be comparable to others.
CyrusOne Inc.
Reconciliation of Net Income (Loss) to FFO and Normalized FFO
(Dollars in millions)
(Unaudited)
| | | | | | | | | | | | | | | | | | | | | | | | | | | | | |
| | Six Months Ended | | | | Three Months Ended | | | | |
| | June 30, | | Change | | June 30, | March 31, | December 31, | September 30, | June 30, |
| 2020 | 2019 | $ | % | 2020 | 2020 | 2019 | 2019 | 2019 |
| Reconciliation of Net Income (Loss) to FFO and Normalized FFO: | | | | | | | | | |
| Net income (loss) | $ | 59.7 | | $ | 80.9 | | $ | (21.2) | | (26) | % | $ | 45.0 | | $ | 14.7 | | $ | (52.1) | | $ | 12.6 | | $ | (8.5) | |
| Real estate depreciation and amortization | 213.3 | | 200.3 | | 13.0 | | 6 | % | 107.5 | | 105.8 | | 105.6 | | 102.6 | | 100.2 | |
| Impairment losses and gain on disposal of assets | 2.3 | | — | | 2.3 | | n/m | 2.4 | | (0.1) | | 0.1 | | 1.0 | | — | |
| Funds from Operations ("FFO") - Nareit defined | $ | 275.3 | | $ | 281.2 | | $ | (5.9) | | (2) | % | $ | 154.9 | | $ | 120.4 | | $ | 53.6 | | $ | 116.2 | | $ | 91.7 | |
| | | | | | | | | |
| Loss on early extinguishment of debt | 3.4 | | — | | 3.4 | | n/m | — | | 3.4 | | 71.8 | | — | | — | |
| (Gain) loss on marketable equity investment | (65.1) | | (92.7) | | 27.6 | | (30) | % | (50.4) | | (14.7) | | (27.2) | | (12.4) | | 8.5 | |
| Foreign currency and derivative losses (gains), net | 8.8 | | — | | 8.8 | | n/m | 13.9 | | (5.1) | | 13.0 | | (5.5) | | — | |
| New accounting standards and regulatory compliance and the related system implementation costs | — | | 0.6 | | (0.6) | | n/m | — | | — | | — | | 0.2 | | 0.3 | |
| Amortization of tradenames | 0.6 | | 0.3 | | 0.3 | | n/m | 0.3 | | 0.3 | | 0.4 | | 0.6 | | 0.1 | |
| Transaction, acquisition, integration and other related expenses | 0.6 | | 1.7 | | (1.1) | | (65) | % | 0.1 | | 0.5 | | 2.3 | | 4.4 | | 1.4 | |
| Cash severance and management transition costs | 6.8 | | 0.1 | | 6.7 | | n/m | — | | 6.8 | | (0.7) | | — | | — | |
| Severance-related stock compensation costs | 0.1 | | — | | 0.1 | | n/m | — | | 0.1 | | — | | — | | — | |
| Legal claim costs | 0.2 | | 0.2 | | — | | n/m | 0.1 | | 0.1 | | 0.5 | | 0.4 | | 0.1 | |
| Normalized Funds from Operations (Normalized FFO) | $ | 230.7 | | $ | 191.4 | | $ | 39.3 | | 21 | % | $ | 118.9 | | $ | 111.8 | | $ | 113.7 | | $ | 103.9 | | $ | 102.1 | |
| Normalized FFO per diluted common share | $ | 2.00 | | $ | 1.72 | | $ | 0.28 | | 16 | % | $ | 1.03 | | $ | 0.97 | | $ | 0.99 | | $ | 0.91 | | $ | 0.90 | |
| Weighted average diluted common shares outstanding | 115.4 | | 111.1 | | 4.3 | | 4 | % | 115.7 | | 115.1 | | 114.4 | | 113.5 | | 113.1 | |
| | | | | | | | | |
| Additional Information: | | | | | | | | | |
| | | | | | | | | |
| Amortization of deferred financing costs and bond premium / discount | 3.6 | | 2.4 | | 1.2 | | 50 | % | 1.6 | | 2.0 | | 1.4 | | 1.2 | | 1.2 | |
| Stock-based compensation expense | 6.9 | | 8.2 | | (1.3) | | (16) | % | 3.4 | | 3.5 | | 4.3 | | 4.2 | | 3.7 | |
| Non-real estate depreciation and amortization | 4.0 | | 3.8 | | 0.2 | | 5 | % | 2.0 | | 2.0 | | 2.1 | | 2.0 | | 1.9 | |
Straight line rent adjustments(a) | (0.4) | | (16.9) | | 16.5 | | (98) | % | (2.1) | | 1.7 | | (3.8) | | (5.9) | | (6.8) | |
Deferred revenue, primarily installation revenue(b) | 0.1 | | 10.6 | | (10.5) | | n/m | 2.3 | | (2.2) | | (2.3) | | (1.7) | | 4.7 | |
| Leasing commissions | (5.6) | | (6.8) | | 1.2 | | (18) | % | (3.2) | | (2.4) | | (4.8) | | (2.8) | | (3.1) | |
| Recurring capital expenditures | (9.9) | | (4.3) | | (5.6) | | n/m | (6.4) | | (3.5) | | (1.1) | | (4.5) | | (1.6) | |
| | | | | | | | | |
| | | | | | | | | |
| | | | | | | | | |
(a)Straight line rent adjustments:
Represents the difference between revenue recognized on a straight line basis under GAAP over the term of the lease compared to the contractual rental payments. Lease agreements typically include payments that escalate over the term of the contract or, to a lesser extent, a ramp period.
(b)Deferred revenue, primarily installation revenue:
Represents payments received from customers in excess of revenue recognized under GAAP. This primarily relates to specific customer-requested buildouts that CyrusOne does not include in its basic data center design. The company charges customers up front for these buildouts rather than incorporating into rent and billing them over time. The cash payments for these buildouts are non-recurring, and may vary significantly from quarter to quarter, but revenue is amortized over the life of the lease.
CyrusOne Inc.
Market Capitalization Summary, Reconciliation of Net Debt and Interest Summary
(Unaudited)
Market Capitalization (as of June 30, 2020)
| | | | | | | | | | | |
| (dollars in millions) | Shares or
Equivalents
Outstanding | Market Price
as of
June 30, 2020 | Market Value
Equivalents
(in millions) |
| Common shares | 116,852,894 | | $ | 72.75 | | $ | 8,501.0 | |
| Net Debt | | | 3,149.4 | |
| Total Enterprise Value (TEV) | | | $ | 11,650.4 | |
Reconciliation of Net Debt
| | | | | | | | | | | |
| June 30, | March 31, | June 30, |
| (dollars in millions) | 2020 | 2020 | 2019 |
Long-term debt(a) | $ | 3,191.3 | | $ | 3,084.0 | | $ | 2,729.9 | |
| Finance lease liabilities | 28.8 | | 29.4 | | 31.6 | |
| Less: | | | |
| Cash and cash equivalents | (70.7) | | (57.3) | | (144.1) | |
| Net Debt | $ | 3,149.4 | | $ | 3,056.1 | | $ | 2,617.4 | |
(a) Excludes adjustment for deferred financing costs and unamortized bond discounts.
Interest Summary
| | | | | | | | | | | | | | | | | |
| Three Months Ended | | | | | | |
| June 30, | March 31, | June 30, | % Change | | | |
| (dollars in millions) | 2020 | 2020 | 2019 | Yr/Yr | | | |
| Interest expense and fees, net | $ | 17.7 | | $ | 20.0 | | $ | 28.8 | | (39) | % | | | |
| Amortization of deferred financing costs and bond premium / discount | 1.6 | | 2.0 | | 1.2 | | 33 | % | | | |
| Capitalized interest | (5.4) | | (6.0) | | (8.9) | | (39) | % | | | |
| Total interest expense, net | $ | 13.9 | | $ | 16.0 | | $ | 21.1 | | (34) | % | | | |
CyrusOne Inc.
Debt Schedule and Debt Covenants
(Unaudited)
Debt Schedule (as of June 30, 2020)
| | | | | | | | | | | |
| (dollars in millions) | | | |
| Long-term debt: | Amount | Interest Rate | Maturity Date |
Revolving credit facility - EUR(a)(b) | 89.8 | | EURIBOR + 100 bps(c) | March 2025(d) |
Revolving credit facility - GBP(a)(e) | 37.0 | | GBP LIBOR + 100 bps(f) | March 2025(d) |
Revolving credit facility - USD(a) | 203.0 | | USD LIBOR + 100 bps(g) | March 2025(d) |
Term loan(h) | 1,100.0 | | USD LIBOR + 120 bps(i) | March 2025(j) |
| 2.900% USD senior notes due 2024 | 600.0 | | 2.900% | November 2024 |
1.450% EUR senior notes due 2027(k) | 561.5 | | 1.450% | January 2027 |
| 3.450% USD senior notes due 2029 | 600.0 | | 3.450% | November 2029 |
Total long-term debt(l) | $ | 3,191.3 | | 2.05%(m) | |
| | | |
| Weighted average term of debt: | 5.9 | | years | |
(a)Revolving credit facility includes 0.20% facility fee on entire revolving credit facility commitment of $1.4 billion.
(b)Amount outstanding is USD equivalent of €80 million.
(c)Interest rate as of June 30, 2020: 1.00%.
(d)Assuming exercise of 12-month extension option.
(e)Amount outstanding is USD equivalent of £30 million.
(f)Interest rate as of June 30, 2020: 1.10%.
(g)Interest rate as of June 30, 2020: 1.18%.
(h)$500 million of $1,100 million synthetically converted into €451 million pursuant to a USD-EUR cross currency swap; $300 million swapped pursuant to USD floating to fixed interest rate swap.
(i)Interest rate as of June 30, 2020: 1.38%; weighted average interest rate pursuant to swaps: 1.40%.
(j)Assumes exercise of two 12-month extension options on $400 million tranche.
(k)Amount outstanding is USD equivalent of €500 million.
(l)Excludes adjustment for deferred financing costs and unamortized bond discounts.
(m)Weighted average interest rate calculated using lower interest rate on swapped amount.
Debt Covenants - Senior Notes (as of June 30, 2020)
| | | | | | | | |
| Ratios | Requirement | June 30, 2020 |
| Total Outstanding Indebtedness to Total Assets | ≤ 60% | 39% |
| Secured Indebtedness to Total Assets | ≤ 40% | 0% |
| Consolidated EBITDA to Interest Expense | ≥ 1.50x | 7.09x |
| Total Unencumbered Assets to Unsecured Indebtedness | ≥ 150% | 253% |
CyrusOne Inc.
Colocation Square Footage (CSF) and CSF Leased
(Unaudited)
| | | | | | | | | | | | | | | | | | | | |
| As of June 30, 2020 | | As of March 31, 2020 | | As of June 30, 2019 | |
| Market | Colocation Space (CSF)(a) (000) | CSF Leased(b) | Colocation Space (CSF)(a) (000) | CSF Leased(b) | Colocation Space (CSF)(a) (000) | CSF Leased(b) |
| Northern Virginia | 1,166 | | 92 | % | 1,113 | | 96 | % | 1,113 | | 91 | % |
| Dallas | 621 | | 71 | % | 621 | | 71 | % | 621 | | 70 | % |
| Phoenix | 581 | | 92 | % | 509 | | 100 | % | 509 | | 100 | % |
| Cincinnati | 402 | | 73 | % | 402 | | 75 | % | 402 | | 79 | % |
| San Antonio | 367 | | 96 | % | 300 | | 100 | % | 300 | | 100 | % |
| Houston | 308 | | 62 | % | 308 | | 63 | % | 308 | | 68 | % |
| New York Metro | 245 | | 76 | % | 245 | | 73 | % | 228 | | 77 | % |
| Chicago | 203 | | 78 | % | 203 | | 78 | % | 203 | | 72 | % |
| Austin | 106 | | 76 | % | 106 | | 78 | % | 106 | | 81 | % |
| Raleigh-Durham | 94 | | 96 | % | 94 | | 96 | % | 83 | | 100 | % |
| Total - Domestic | 4,093 | | 83 | % | 3,901 | | 85 | % | 3,872 | | 84 | % |
| London | 148 | | 70 | % | 128 | | 81 | % | 116 | | 72 | % |
| Frankfurt | 144 | | 99 | % | 144 | | 99 | % | 125 | | 99 | % |
| Amsterdam | 39 | | 100 | % | 39 | | 100 | % | — | | — | % |
| Singapore | 3 | | 20 | % | 3 | | 20 | % | 3 | | 22 | % |
| Total - International | 334 | | 85 | % | 314 | | 91 | % | 244 | | 85 | % |
| Total - Portfolio | 4,427 | | 83 | % | 4,215 | | 86 | % | 4,116 | | 84 | % |
Stabilized Properties(c) | 4,055 | | 88 | % | 4,035 | | 88 | % | 3,744 | | 89 | % |
(a)CSF represents the GSF at an operating facility that is currently leased or readily available for lease as colocation space, where customers
locate their servers and other IT equipment. May not sum to total due to rounding.
(b)CSF Leased is calculated by dividing CSF under signed leases for colocation space (whether or not the lease has commenced billing) by total CSF.
(c)Stabilized properties include data halls that have been in service for at least 24 months or are at least 85% leased.
CyrusOne Inc.
2020 Guidance
| | | | | | | | |
| Category | Previous 2020 Guidance | Current 2020 Guidance |
| Total Revenue | $1,010 - 1,045 million | $1,010 - 1,045 million |
| Lease and Other Revenues from Customers | $865 - 890 million | $865 - 890 million |
| Metered Power Reimbursements | $145 - 155 million | $145 - 155 million |
| Adjusted EBITDA | $525 - 550 million | $525 - 550 million |
| Normalized FFO per diluted common share | $3.75 - 3.90 | $3.75 - 3.90 |
| Capital Expenditures | $750 - 850 million | $850 - 950 million |
Development(1) | $735 - 830 million | $835 - 930 million |
| Recurring | $15 - 20 million | $15 - 20 million |
| | |
(1)Development capital expenditures include the acquisition of land for future development.
CyrusOne is updating guidance for full year 2020, increasing the upper and lower ends of the guidance range for Capital Expenditures and Capital Expenditures - Development and reaffirming its other guidance ranges. The annual guidance provided above represents forward-looking statements, which are based on current economic conditions, internal assumptions about the Company's existing customer base, and the supply and demand dynamics of the markets in which CyrusOne operates. The COVID-19 pandemic continues to evolve rapidly and the potential impact on our business remains uncertain and unpredictable.
CyrusOne does not provide forward-looking guidance for GAAP financial measures (other than Total Revenue and Capital Expenditures) or reconciliations for the non-GAAP financial measures included in the annual guidance provided above due to the inherent difficulty in forecasting and quantifying certain amounts that are necessary for such reconciliations, including Net income (loss) and adjustments that could be made for Transaction, acquisition, integration and other related expenses, Legal claim costs, Impairment losses and loss on disposal of assets and other charges in its reconciliation of historic numbers, the amount of which, based on historical experience, could be significant.
CyrusOne Inc.
Data Center Portfolio
As of June 30, 2020
(Unaudited)
| | | | | | | | | | | | | | | | | | | | | | | | | | | | | | | | | | | |
| | | Gross Square Feet (GSF)(a) | | | | | | | Powered Shell Available for Future Development (GSF)(k) (000) | Available Critical Load Capacity (MW)(l) |
Stabilized Properties(b) | Metro
Area | Annualized Rent(c) ($000) | Colocation Space (CSF)(d) (000) | CSF Occupied(e) | CSF Leased(f) | Office & Other(g) (000) | Office & Other Occupied(h) | Supporting Infrastructure(i) (000) | Total(j) (000) | | |
| Dallas - Carrollton | Dallas | $ | 90,153 | | 428 | | 79 | % | 79 | % | 83 | | 46 | % | 133 | | 644 | | — | | 62 | |
| Northern Virginia - Sterling V | Northern Virginia | 66,202 | | 383 | | 99 | % | 99 | % | 11 | | 100 | % | 145 | | 539 | | 64 | | 66 | |
| Northern Virginia - Sterling VI | Northern Virginia | 50,843 | | 272 | | 100 | % | 100 | % | 35 | | — | % | — | | 307 | | — | | 57 | |
| Somerset I | New York Metro | 34,156 | | 108 | | 81 | % | 81 | % | 27 | | 99 | % | 89 | | 224 | | 138 | | 16 | |
| Northern Virginia - Sterling II | Northern Virginia | 33,944 | | 159 | | 100 | % | 100 | % | 9 | | 100 | % | 55 | | 223 | | — | | 30 | |
| Chicago - Aurora I | Chicago | 32,412 | | 113 | | 98 | % | 98 | % | 34 | | 100 | % | 223 | | 371 | | 27 | | 71 | |
| San Antonio III | San Antonio | 32,330 | | 132 | | 100 | % | 100 | % | 9 | | 100 | % | 43 | | 184 | | — | | 24 | |
| Houston - Houston West I | Houston | 27,731 | | 112 | | 75 | % | 75 | % | 11 | | 100 | % | 37 | | 161 | | 3 | | 28 | |
| Cincinnati - 7th Street*** | Cincinnati | 27,710 | | 197 | | 54 | % | 54 | % | 6 | | 61 | % | 175 | | 378 | | 46 | | 16 | |
| Phoenix - Chandler VI | Phoenix | 27,236 | | 148 | | 100 | % | 100 | % | 6 | | 100 | % | 32 | | 187 | | 279 | | 24 | |
| Totowa - Madison** | New York Metro | 26,515 | | 51 | | 87 | % | 87 | % | 22 | | 89 | % | 59 | | 133 | | — | | 6 | |
| Dallas - Lewisville* | Dallas | 26,475 | | 114 | | 82 | % | 82 | % | 11 | | 63 | % | 54 | | 180 | | — | | 21 | |
| Cincinnati - North Cincinnati | Cincinnati | 25,723 | | 65 | | 99 | % | 99 | % | 45 | | 79 | % | 53 | | 163 | | 65 | | 14 | |
| Frankfurt I | Frankfurt | 24,038 | | 53 | | 97 | % | 97 | % | 8 | | 91 | % | 57 | | 118 | | — | | 18 | |
| Frankfurt II | Frankfurt | 23,895 | | 90 | | 100 | % | 100 | % | 9 | | 100 | % | 72 | | 171 | | 10 | | 35 | |
| Phoenix - Chandler I | Phoenix | 21,892 | | 74 | | 100 | % | 100 | % | 35 | | 12 | % | 39 | | 147 | | 31 | | 16 | |
| Phoenix - Chandler II | Phoenix | 21,877 | | 74 | | 100 | % | 100 | % | 6 | | 53 | % | 26 | | 105 | | — | | 12 | |
| Houston - Houston West II | Houston | 21,444 | | 80 | | 73 | % | 73 | % | 4 | | 97 | % | 55 | | 139 | | 11 | | 12 | |
| Austin III | Austin | 20,779 | | 62 | | 69 | % | 69 | % | 15 | | 81 | % | 21 | | 98 | | 67 | | 9 | |
| Phoenix - Chandler III | Phoenix | 20,669 | | 68 | | 100 | % | 100 | % | 2 | | — | % | 30 | | 101 | | — | | 14 | |
| Raleigh-Durham I | Raleigh-Durham | 19,737 | | 94 | | 89 | % | 96 | % | 16 | | 95 | % | 82 | | 192 | | 235 | | 17 | |
| Northern Virginia - Sterling III | Northern Virginia | 19,222 | | 79 | | 100 | % | 100 | % | 7 | | 100 | % | 34 | | 120 | | — | | 15 | |
| San Antonio I | San Antonio | 19,140 | | 44 | | 99 | % | 99 | % | 6 | | 83 | % | 46 | | 96 | | 11 | | 12 | |
| Wappingers Falls I** | New York Metro | 18,329 | | 37 | | 63 | % | 63 | % | 20 | | 87 | % | 15 | | 72 | | — | | 3 | |
| Northern Virginia - Sterling I | Northern Virginia | 17,712 | | 78 | | 100 | % | 100 | % | 6 | | 69 | % | 49 | | 132 | | — | | 12 | |
| Northern Virginia - Sterling IV | Northern Virginia | 17,012 | | 81 | | 100 | % | 100 | % | 7 | | 100 | % | 34 | | 122 | | — | | 15 | |
| San Antonio II | San Antonio | 15,485 | | 64 | | 100 | % | 100 | % | 11 | | 100 | % | 41 | | 117 | | — | | 12 | |
| Phoenix - Chandler V | Phoenix | 15,381 | | 72 | | 100 | % | 100 | % | 1 | | 95 | % | 16 | | 89 | | 13 | | 12 | |
| Austin II | Austin | 14,867 | | 44 | | 86 | % | 86 | % | 2 | | 100 | % | 22 | | 68 | | — | | 5 | |
| London I* | London | 12,698 | | 30 | | 100 | % | 100 | % | 12 | | 56 | % | 58 | | 100 | | 9 | | 12 | |
| Phoenix - Chandler IV | Phoenix | 12,551 | | 73 | | 100 | % | 100 | % | 3 | | 100 | % | 27 | | 103 | | — | | 12 | |
| San Antonio IV | San Antonio | 11,584 | | 60 | | 100 | % | 100 | % | 12 | | 100 | % | 27 | | 99 | | — | | 12 | |
| Cincinnati - Hamilton* | Cincinnati | 11,218 | | 47 | | 73 | % | 73 | % | 1 | | 100 | % | 35 | | 83 | | — | | 10 | |
| Houston - Galleria | Houston | 11,019 | | 63 | | 39 | % | 39 | % | 23 | | 24 | % | 25 | | 112 | | — | | 14 | |
| London II* | London | 10,862 | | 64 | | 100 | % | 100 | % | 10 | | 100 | % | 93 | | 166 | | 4 | | 21 | |
| Florence | Cincinnati | 9,638 | | 53 | | 99 | % | 99 | % | 47 | | 87 | % | 40 | | 140 | | — | | 9 | |
| Houston - Houston West III | Houston | 7,030 | | 53 | | 42 | % | 44 | % | 10 | | 15 | % | 32 | | 95 | | 209 | | 6 | |
| London - Great Bridgewater** | London | 6,428 | | 10 | | 96 | % | 96 | % | — | | — | % | 1 | | 11 | | — | | 1 | |
| Stamford - Riverbend** | New York Metro | 5,812 | | 20 | | 23 | % | 23 | % | — | | — | % | 8 | | 28 | | — | | 2 | |
| Chicago - Aurora II (DH #1) | Chicago | 5,686 | | 77 | | 51 | % | 51 | % | 45 | | 1 | % | 14 | | 136 | | 272 | | 16 | |
| Norwalk I** | New York Metro | 5,284 | | 13 | | 100 | % | 100 | % | 4 | | 65 | % | 41 | | 58 | | 87 | | 2 | |
| Cincinnati - Mason | Cincinnati | 4,184 | | 34 | | 100 | % | 100 | % | 26 | | 98 | % | 17 | | 78 | | — | | 4 | |
| Chicago - Lombard | Chicago | 2,479 | | 14 | | 64 | % | 64 | % | 4 | | 45 | % | 12 | | 30 | | 29 | | 3 | |
| Stamford - Omega** | New York Metro | 1,354 | | — | | — | % | — | % | 19 | | 72 | % | 4 | | 22 | | — | | — | |
| Totowa - Commerce** | New York Metro | 658 | | — | | — | % | — | % | 20 | | 44 | % | 6 | | 26 | | — | | — | |
| Cincinnati - Blue Ash* | Cincinnati | 632 | | 6 | | 36 | % | 36 | % | 7 | | 100 | % | 2 | | 15 | | — | | 1 | |
| Singapore - Inter Business Park** | Singapore | 359 | | 3 | | 20 | % | 20 | % | — | | — | % | — | | 3 | | — | | 1 | |
| London III* | London | — | | 20 | | — | % | 100 | % | 2 | | — | % | 45 | | 67 | | 1 | | 6 | |
| Amsterdam I | Amsterdam | — | | 39 | | 100 | % | 100 | % | 15 | | 100 | % | 40 | | 94 | | 207 | | 4 | |
| Stabilized Properties - Total | | $ | 932,387 | | 4,055 | | 88 | % | 88 | % | 725 | | 64 | % | 2,263 | | 7,043 | | 1,818 | | 785 | |
| | | | | | | | | | | |
| | | | | | | | | | | | | | | | | | | | | | | | | | | | | | | | | | | |
| CyrusOne Inc. | | | | | | | | | | | |
| Data Center Portfolio | | | | | | | | | | | |
| As of June 30, 2020 | | | | | | | | | | | |
| (Unaudited) | | | | | | | | | | | |
| | | | | | | | | | | |
| | | | Gross Square Feet (GSF)(a) | | | | | | | Powered Shell Available for Future Development (GSF)(k) (000) | Available Critical Load Capacity (MW)(l) |
| Metro
Area | Annualized Rent(c) ($000) | Colocation Space (CSF)(d) (000) | CSF Occupied(e) | CSF Leased(f) | Office & Other(g) (000) | Office & Other Occupied(h) | Supporting Infrastructure(i) (000) | Total(j) (000) | | |
| Stabilized Properties - Total | | $ | 932,387 | | 4,055 | | 88 | % | 88 | % | 725 | | 64 | % | 2,263 | | 7,043 | | 1,818 | | 785 | |
| | | | | | | | | | | |
Pre-Stabilized Properties(b) | | | | | | | | | | | |
| Northern Virginia - Sterling VIII | Northern Virginia | 8,642 | | 61 | | 37 | % | 37 | % | 4 | | — | % | 25 | | 90 | | — | | 6 | |
| Dallas - Allen (DH #1) | Dallas | 1,756 | | 79 | | 12 | % | 12 | % | — | | — | % | 58 | | 137 | | 204 | | 6 | |
| Northern Virginia - Sterling IX | Northern Virginia | 305 | | 53 | | 10 | % | 10 | % | 1 | | — | % | 66 | | 120 | | 187 | | 6 | |
| Somerset I (DH #14) | New York Metro | 296 | | 16 | | 71 | % | 79 | % | — | | — | % | — | | 16 | | — | | 2 | |
| London I*(DH #1) | London | — | | 8 | | — | % | — | % | — | | — | % | — | | 8 | | — | | 3 | |
| London II*(DH #3) | London | — | | 17 | | — | % | — | % | — | | — | % | — | | 17 | | — | | 7 | |
| San Antonio V | San Antonio | — | | 67 | | 79 | % | 79 | % | 7 | | 100 | % | 21 | | 94 | | 9 | | 9 | |
| Phoenix - Chandler V (DH#2) | Phoenix | — | | 71 | | 35 | % | 35 | % | 1 | | 100 | % | 8 | | 81 | | — | | 6 | |
| All Properties - Total | | $ | 943,386 | | 4,427 | | 83 | % | 83 | % | 738 | | 64 | % | 2,441 | | 7,605 | | 2,218 | | 830 | |
* Indicates properties in which we hold a leasehold interest in the building shell and land. All data center infrastructure has been constructed by us and is owned by us.
** Indicates properties in which we hold a leasehold interest in the building shell, land, and all data center infrastructure.
*** The information provided for the Cincinnati - 7th Street property includes data for two facilities, one of which we lease and one of which we own.
(a)Represents the total square feet of a building under lease or available for lease based on engineers' drawings and estimates but does not include space held for development or space used by CyrusOne.
(b)Stabilized properties include data halls that have been in service for at least 24 months or are at least 85% leased. Pre-stabilized properties include data halls that have been in service for less than 24 months and are less than 85% leased.
(c)Represents monthly contractual rent (defined as cash rent including customer reimbursements for metered power) under existing customer leases as of June 30, 2020 multiplied by 12. For the month of June 2020, customer reimbursements were $154.4 million annualized and consisted of reimbursements by customers across all facilities with separately metered power. Customer reimbursements under leases with separately metered power vary from month-to-month based on factors such as our customers' utilization of power and the suppliers' pricing of power. From July 1, 2018 through June 30, 2020, customer reimbursements under leases with separately metered power constituted between 13.5% and 19.4% of annualized rent. After giving effect to abatements, free rent and other straight-line adjustments, our annualized effective rent as of June 30, 2020 was $938.9 million. Our annualized effective rent was lower than our annualized rent as of June 30, 2020 because our negative straight-line and other adjustments and amortization of deferred revenue exceeded our positive straight-line adjustments due to factors such as the timing of contractual rent escalations and customer payments for services.
(d)CSF represents the GSF at an operating facility that is currently leased or readily available for lease as colocation space, where customers locate their servers and other IT equipment.
(e)Percent occupied is determined based on CSF billed to customers under signed leases as of June 30, 2020 divided by total CSF. Leases signed but that have not commenced billing as of June 30, 2020 are not included.
(f)Percent leased is calculated by dividing CSF under signed leases for colocation space (whether or not the lease has commenced billing) by total CSF.
(g)Represents the GSF at an operating facility that is currently leased or readily available for lease as space other than CSF, which is typically office and other space.
(h)Percent occupied is determined based on Office & Other space being billed to customers under signed leases as of June 30, 2020 divided by total Office & Other space. Leases signed but not commenced as of June 30, 2020 are not included.
(i)Represents infrastructure support space, including mechanical, telecommunications and utility rooms, as well as building common areas.
(j)Represents the GSF at an operating facility that is currently leased or readily available for lease. This excludes existing vacant space held for development.
(k)Represents space that is under roof that could be developed in the future for operating GSF, rounded to the nearest 1,000.
(l)Critical load capacity represents the aggregate power available for lease and exclusive use by customers expressed in terms of megawatts. The capacity reported is for non-redundant megawatts, as we can develop flexible solutions to our customers at multiple resiliency levels. Does not sum to total due to rounding.
CyrusOne Inc.
GSF Under Development
As of June 30, 2020
(Dollars in millions)
(Unaudited)
| | | | | | | | | | | | | | | | | | | | | | | | | | | | | | | | | | | |
| | | | GSF Under Development(a) | | | | | | Under Development Costs(b) | | |
| Facilities | Metropolitan
Area | Estimated Completion Date | Colocation Space
(CSF) (000) | Office & Other (000) | Supporting
Infrastructure (000) | Powered Shell(c) (000) | Total (000) | Critical Load MW Capacity(d) | Actual to Date(e) | Estimated Costs to Completion(f) | Total |
| Somerset I | New York | 3Q'20 | 45 | | — | | 2 | | — | | 47 | | 6.0 | | $ | 4 | | $19-27 | $23-31 |
| Frankfurt III (DH #1) | Frankfurt | 3Q'20 | 101 | | 9 | | 109 | | 16 | | 235 | | 35.0 | | 123 | | 56-75 | 179-198 |
| Northern Virginia - Sterling VII | Northern Virginia | 4Q'20 | — | | — | | — | | 167 | | 167 | | — | | 41 | | 50-59 | 91-100 |
| Northern Virginia - Sterling VIII | Northern Virginia | 4Q'20 | — | | — | | — | | — | | — | | 9.0 | | 4 | | 35-40 | 39-44 |
| Council Bluffs I | Iowa | 4Q'20 | 42 | | 14 | | 18 | | 42 | | 115 | | 5.0 | | 12 | | 48-54 | 60-66 |
| Dublin I | Dublin | 4Q'20 | 39 | | 10 | | 33 | | 113 | | 195 | | 6.0 | | 39 | | 28-35 | 67-74 |
| Frankfurt III (DH #2 and DH #3) | Frankfurt | 4Q'20 | 23 | | — | | — | | — | | 23 | | 9.0 | | — | | 22-26 | 22-26 |
| San Antonio V | San Antonio | 4Q'20 | 67 | | — | | 18 | | — | | 85 | | 6.0 | | — | | 35-39 | 35-39 |
| London III | London | 1Q'21 | 19 | | — | | — | | — | | 19 | | 6.0 | | — | | 28-33 | 28-33 |
| Total | | | 336 | | 33 | | 180 | | 337 | | 886 | | 82.0 | | $ | 223 | | $321-388 | $544-611 |
(a)Represents GSF at a facility for which activities have commenced or are expected to commence in the next 2 quarters to prepare the space for its intended use. Estimates and timing are subject to change. May not sum to total due to rounding.
(b)London development costs are GBP-denominated and shown as USD-equivalent using exchange rate of 1.23. Dublin and Frankfurt development costs are EUR-denominated and shown as USD-equivalent using exchange rate of 1.12 as of June 30, 2020.
(c)Represents GSF under construction that, upon completion, will be powered shell available for future development into operating GSF.
(d)Critical load capacity represents the aggregate power available for lease and exclusive use by customers expressed in terms of megawatts. The capacity reported is for non-redundant megawatts, as we can develop flexible solutions to our customers at multiple resiliency levels.
(e)Actual to date is the cash investment as of June 30, 2020. There may be accruals above this amount for work completed, for which cash has not yet been paid.
(f)Represents management’s estimate of the total costs required to complete the current GSF under development. There may be an increase in costs if customers require greater power density.
| | | | | | | | |
Capital Expenditures - Investment in Real Estate(a) | Three Months Ended | Six Months Ended |
| (dollars in millions) | June 30, 2020 | June 30, 2020 |
| Capital expenditures - investment in real estate | $255.1 | $448.1 |
(a) Excludes recurring capital expenditures.
CyrusOne Inc.
Land Available for Future Development (Acres)
As of June 30, 2020
(Unaudited)
| | | | | |
| As of |
| Market | June 30, 2020 |
| Amsterdam | 8 | |
| Atlanta | 44 | |
| Austin | 22 | |
| Chicago | 23 | |
| Cincinnati | 98 | |
| Council Bluffs, Iowa | 10 | |
| Dallas | 57 | |
| Dublin | 15 | |
| Frankfurt | 2 | |
| Houston | 20 | |
| Northern Virginia | 24 | |
| Phoenix | 96 | |
| Quincy, Washington | 48 | |
| San Antonio | 12 | |
| Santa Clara | 23 | |
Total Available(a) | 501 | |
| Book Value of Total Available | $ | 217.2 | million |
(a)Does not sum to total due to rounding.
CyrusOne Inc.
Leasing Statistics - Lease Signings
As of June 30, 2020
(Unaudited)
| | | | | | | | | | | | | | | | | |
| Period | Number of Leases(a) | Total CSF Signed(b) | Total kW Signed(c) | Total MRR Signed (000)(d) | Weighted Average Lease Term(e) |
| 2Q'20 | 396 | 150,000 | 21,956 | $3,070 | 84 |
| Prior 4Q Avg. | 465 | 149,750 | 21,251 | $2,751 | 81 |
| 1Q'20 | 460 | 289,000 | 43,586 | $4,994 | 98 |
| 4Q'19 | 450 | 28,000 | 4,703 | $1,063 | 55 |
3Q'19(f) | 451 | 236,000 | 30,769 | $3,856 | 104 |
| 2Q'19 | 500 | 46,000 | 5,946 | $1,090 | 67 |
(a) Number of leases represents each agreement with a customer. A lease agreement could include multiple spaces, and a customer could have multiple leases.
(b) CSF represents the GSF at an operating facility that is leased as colocation space, where customers locate their servers and other IT equipment.
(c) Represents maximum contracted kW that customers may draw during lease period, and subject to full build out of projects subject to additional conditions. Additionally, we can develop flexible solutions for our customers at multiple resiliency levels, and the kW signed is unadjusted for this factor.
(d) Monthly recurring rent is defined as the average monthly contractual rent during the term of the lease. It includes the monthly impact of installation charges of approximately $0.3 million in 1Q'20, $0.2 million in 4Q'19 and 2Q'20, and $0.1 million in 2Q'19 and 3Q'19.
(e) Calculated on a CSF-weighted basis.
(f) Leasing statistics updated from prior period reporting to remove the prior inclusion of the paid reservation that was exercised in 2Q'20 and included in the 2Q'20 leasing results (30,000 CSF, 4.5 MW, and approximately $0.5 million in monthly recurring rent).
CyrusOne Inc.
New MRR Signed - Existing vs. New Customers
As of June 30, 2020
(Dollars in thousands)
(Unaudited)
(a) Monthly recurring rent is defined as the average monthly contractual rent during the term of the lease. It includes the monthly impact of installation charges of approximately $0.3 million in 3Q'18 and 1Q'20, $0.2 million in 1Q'19, 4Q'19 and 2Q'20, and $0.1 million in 4Q'18, 2Q'19 and 3Q'19.
(b) Leasing statistics updated from prior period reporting to remove the prior inclusion of the paid reservation that was exercised in 2Q'20 and included in the 2Q'20 leasing results (30,000 CSF, 4.5 MW, and approximately $0.5 million in monthly recurring rent).
CyrusOne Inc.
Customer Sector Diversification(a)
As of June 30, 2020
(Unaudited)
| | | | | | | | | | | | | | | | | |
| Principal Customer Industry | Number of
Locations | Annualized Rent(b) (000) | Percentage of Portfolio Annualized Rent(c) | Weighted Average Remaining Lease Term in Months(d) |
| 1 | Information Technology | 11 | $ | 190,542 | | 20.2 | % | 94.9 | |
| 2 | Information Technology | 11 | 65,382 | | 6.9 | % | 25.5 | |
| 3 | Information Technology | 5 | 57,177 | | 6.1 | % | 50.3 | |
| 4 | Information Technology | 7 | 37,157 | | 3.9 | % | 46.4 | |
| 5 | Information Technology | 7 | 31,446 | | 3.3 | % | 36.7 | |
| 6 | Information Technology | 5 | 28,804 | | 3.1 | % | 32.2 | |
| 7 | Financial Services | 1 | 19,574 | | 2.1 | % | 129.0 | |
| 8 | Information Technology | 5 | 16,896 | | 1.8 | % | 38.9 | |
| 9 | Healthcare | 2 | 15,827 | | 1.7 | % | 90.0 | |
| 10 | Research and Consulting Services | 3 | 15,338 | | 1.6 | % | 17.9 | |
| 11 | Industrials | 5 | 11,063 | | 1.2 | % | 10.2 | |
| 12 | Financial Services | 4 | 10,574 | | 1.1 | % | 93.0 | |
| 13 | Telecommunication Services | 2 | 9,923 | | 1.1 | % | 15.6 | |
| 14 | Telecommunication Services | 2 | 9,879 | | 1.0 | % | 45.3 | |
| 15 | Information Technology | 1 | 9,619 | | 1.0 | % | 44.6 | |
| 16 | Telecommunication Services | 8 | 9,559 | | 1.0 | % | 9.3 | |
| 17 | Consumer Staples | 3 | 9,212 | | 1.0 | % | 8.0 | |
| 18 | Telecommunication Services | 1 | 7,766 | | 0.8 | % | 88.3 | |
| 19 | Information Technology | 3 | 7,165 | | 0.8 | % | 47.0 | |
| 20 | Information Technology | 1 | 6,756 | | 0.7 | % | 11.0 | |
| | | $ | 569,658 | | 60.4 | % | 60.9 | |
(a)Customers and their affiliates are consolidated.
(b)Represents monthly contractual rent (defined as cash rent including customer reimbursements for metered power) under existing customer leases as of June 30, 2020, multiplied by 12. For the month of June 2020, customer reimbursements were $154.4 million annualized and consisted of reimbursements by customers across all facilities with separately metered power. Customer reimbursements under leases with separately metered power vary from month-to-month based on factors such as our customers' utilization of power and the suppliers' pricing of power. From July 1, 2018 through June 30, 2020, customer reimbursements under leases with separately metered power constituted between 13.5% and 19.4% of annualized rent. After giving effect to abatements, free rent and other straight-line adjustments, our annualized effective rent as of June 30, 2020 was $938.9 million. Our annualized effective rent was lower than our annualized rent as of June 30, 2020 because our negative straight-line and other adjustments and amortization of deferred revenue exceeded our positive straight-line adjustments due to factors such as the timing of contractual rent escalations and customer payments for services.
(c)Represents the customer’s total annualized rent divided by the total annualized rent in the portfolio as of June 30, 2020, which was approximately $943.4 million.
(d)Weighted average based on customer’s percentage of total annualized rent expiring and is as of June 30, 2020, assuming that customers exercise no renewal options and exercise all early termination rights that require payment of less than 50% of the remaining rents. Early termination rights that require payment of 50% or more of the remaining lease payments are not assumed to be exercised because such payments approximate the profitability margin of leasing that space to the customer, such that we do not consider early termination to be economically detrimental to us.
CyrusOne Inc.
Lease Distribution
As of June 30, 2020
(Unaudited)
| | | | | | | | | | | | | | | | | | | | |
GSF Under Lease(a) | Number of Customers(b) | Percentage of
All Customers | Total Leased GSF(c) (000) | Percentage of
Portfolio
Leased GSF | Annualized Rent(d) (000) | Percentage of
Annualized Rent |
| 0-999 | 626 | | 66 | % | 131 | | 2 | % | $ | 78,716 | | 8 | % |
| 1000-2499 | 116 | | 12 | % | 181 | | 3 | % | 44,378 | | 5 | % |
| 2500-4999 | 73 | | 8 | % | 258 | | 5 | % | 50,069 | | 5 | % |
| 5000-9999 | 48 | | 5 | % | 337 | | 6 | % | 54,323 | | 6 | % |
| 10000+ | 81 | | 9 | % | 4,825 | | 84 | % | 715,899 | | 76 | % |
| Total | 944 | | 100 | % | 5,732 | | 100 | % | $ | 943,386 | | 100 | % |
(a)Represents all leases in our portfolio, including colocation, office and other leases.
(b)Represents the number of customers occupying data center, office and other space as of June 30, 2020. This may vary from total customer count as some customers may be under contract but have yet to occupy space.
(c)Represents the total square feet at a facility under lease and that has commenced billing, excluding space held for development or space used by CyrusOne. A customer’s leased GSF is estimated based on such customer’s direct CSF or office and light-industrial space plus management’s estimate of infrastructure support space, including mechanical, telecommunications and utility rooms, as well as building common areas.
(d)Represents monthly contractual rent (defined as cash rent including customer reimbursements for metered power) under existing customer leases as of June 30, 2020, multiplied by 12. For the month of June 2020, customer reimbursements were $154.4 million annualized and consisted of reimbursements by customers across all facilities with separately metered power. Customer reimbursements under leases with separately metered power vary from month-to-month based on factors such as our customers' utilization of power and the suppliers' pricing of power. From July 1, 2018 through June 30, 2020, customer reimbursements under leases with separately metered power constituted between 13.5% and 19.4% of annualized rent. After giving effect to abatements, free rent and other straight-line adjustments, our annualized effective rent as of June 30, 2020 was $938.9 million. Our annualized effective rent was lower than our annualized rent as of June 30, 2020 because our negative straight-line and other adjustments and amortization of deferred revenue exceeded our positive straight-line adjustments due to factors such as the timing of contractual rent escalations and customer payments for services.
CyrusOne Inc.
Lease Expirations
As of June 30, 2020
(Unaudited)
| | | | | | | | | | | | | | | | | | | | | | | |
Year(a) | Number of Leases Expiring(b) | Total Operating
GSF Expiring (000) | Percentage of
Total GSF | Annualized Rent(c) (000) | Percentage of
Annualized Rent | Annualized Rent at Expiration(d) (000) | Percentage of
Annualized Rent
at Expiration |
| Available | | 1,873 | | 25 | % | | | | |
| Month-to-Month | 1,203 | | 118 | | 1 | % | $ | 28,755 | | 3 | % | $ | 29,784 | | 3 | % |
| 2020 | 1,271 | | 324 | | 4 | % | 66,959 | | 7 | % | 66,984 | | 7 | % |
| 2021 | 3,078 | | 800 | | 10 | % | 168,801 | | 18 | % | 171,977 | | 17 | % |
| 2022 | 1,602 | | 698 | | 9 | % | 119,970 | | 13 | % | 125,813 | | 12 | % |
| 2023 | 986 | | 919 | | 12 | % | 137,327 | | 14 | % | 146,605 | | 14 | % |
| 2024 | 248 | | 521 | | 7 | % | 97,736 | | 10 | % | 106,077 | | 10 | % |
| 2025 | 110 | | 276 | | 4 | % | 37,420 | | 4 | % | 46,233 | | 5 | % |
| 2026 | 47 | | 623 | | 8 | % | 93,980 | | 10 | % | 100,568 | | 10 | % |
| 2027 | 34 | | 504 | | 7 | % | 85,383 | | 9 | % | 95,813 | | 9 | % |
| 2028 | 17 | | 278 | | 4 | % | 35,129 | | 4 | % | 39,797 | | 4 | % |
| 2029 | 7 | | 82 | | 1 | % | 6,601 | | 1 | % | 8,753 | | 1 | % |
| 2030 - Thereafter | 23 | | 589 | | 8 | % | 65,324 | | 7 | % | 84,276 | | 8 | % |
| Total | 8,626 | | 7,605 | | 100 | % | $ | 943,386 | | 100 | % | $ | 1,022,680 | | 100 | % |
(a)Leases that were auto-renewed prior to June 30, 2020 are shown in the calendar year in which their current auto-renewed term expires. Unless otherwise stated in the footnotes, the information set forth in the table assumes that customers exercise no renewal options and exercise all early termination rights that require payment of less than 50% of the remaining rents. Early termination rights that require payment of 50% or more of the remaining lease payments are not assumed to be exercised.
(b)Number of leases represents each agreement with a customer. A lease agreement could include multiple spaces and a customer could have multiple leases.
(c)Represents monthly contractual rent (defined as cash rent including customer reimbursements for metered power) under existing customer leases as of June 30, 2020, multiplied by 12. For the month of June 2020, customer reimbursements were $154.4 million annualized and consisted of reimbursements by customers across all facilities with separately metered power. Customer reimbursements under leases with separately metered power vary from month-to-month based on factors such as our customers' utilization of power and the suppliers' pricing of power. From July 1, 2018 through June 30, 2020, customer reimbursements under leases with separately metered power constituted between 13.5% and 19.4% of annualized rent. After giving effect to abatements, free rent and other straight-line adjustments, our annualized effective rent as of June 30, 2020 was $938.9 million. Our annualized effective rent was lower than our annualized rent as of June 30, 2020 because our negative straight-line and other adjustments and amortization of deferred revenue exceeded our positive straight-line adjustments due to factors such as the timing of contractual rent escalations and customer payments for services.
(d)Represents the final monthly contractual rent under existing customer leases that had commenced as of June 30, 2020, multiplied by 12.