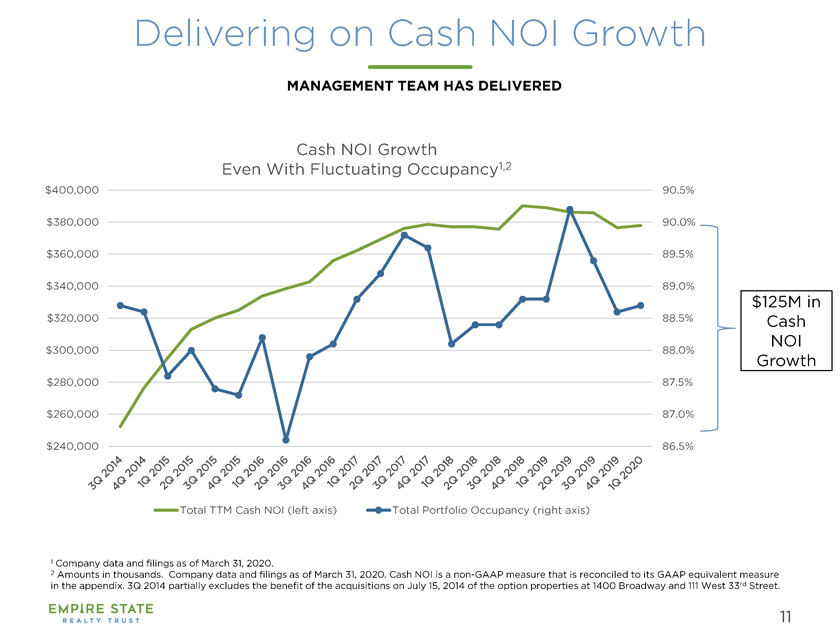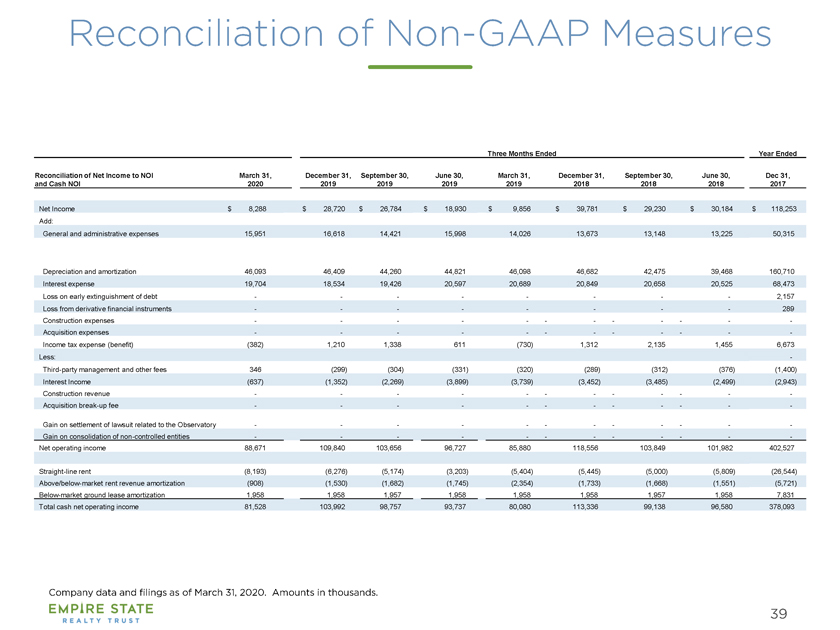
Three Months Ended Year Ended Reconciliation of Net Income to NOI and Cash NOI March 31, 2020 December 31, 2019 September 30, 2019 June 30, 2019 March 31, 2019 December 31, 2018 September 30, 2018 June 30, 2018 Dec 31, 2017 Net Income $ 8,288 $ 28,720 $ 26,784 $ 18,930 $ 9,856 $ 39,781 $ 29,230 $ 30,184 $ 118,253 Add: General and administrative expenses 15,951 16,618 14,421 15,998 14,026 13,673 13,148 13,225 50,315 Depreciation and amortization 46,093 46,409 44,260 44,821 46,098 46,682 42,475 39,468 160,710 Interest expense 19,704 18,534 19,426 20,597 20,689 20,849 20,658 20,525 68,473 Loss on early extinguishment of debt 2,157 Loss from derivative financial instruments 289 Construction expenses Acquisition expenses Income tax expense (benefit) (382) 1,210 1,338 611 (730) 1,312 2,135 1,455 6,673 Less: Third party management and other fees 346 (299) (304) (331) (320) (289) (312) (376) (1,400) Interest Income (637) (1,352) (2,269) (3,899) (3,739) (3,452) (3,485) (2,499) (2,943) Construction revenue Acquisition break up fee Gain on settlement of lawsuit related to the Observatory Gain on consolidation of non controlled entities Net operating income 88,671 109,840 103,656 96,727 85,880 118,556 103,849 101,982 402,527 Straight line rent (8,193) (6,276) (5,174) (3,203) (5,404) (5,445) (5,000) (5,809) (26,544) Above/below market rent revenue amortization (908) (1,530) (1,682) (1,745) (2,354) (1,733) (1,668) (1,551) (5,721) Below market ground lease amortization 1,958 1,958 1,957 1,958 1,958 1,958 1,957 1,958 7,831 Total cash net operating income 81,528 103,992 98,757 93,737 80,080 113,336 99,138 96,580 378,093