Irvine, California 92618
Irvine, California 92618

| Share class | Costs of a $10,000 investment | Costs paid as a percentage of a $10,000 investment |
| Class 529-A | $ 75 | 0.74 % |
| 1 year | 5 years | Since inception 1 | |
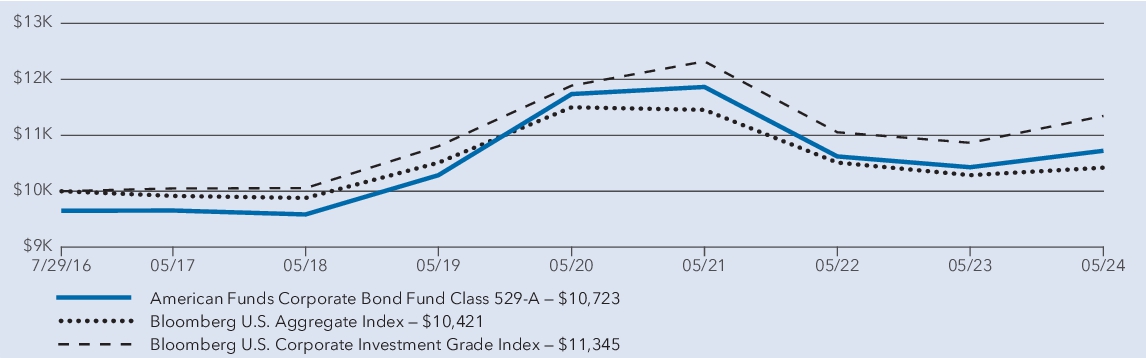
| American Funds Corporate Bond Fund — Class 529-A (with sales charge) 2 | -0.78 % | 0.12 % | 0.90 % |
| American Funds Corporate Bond Fund — Class 529-A (without sales charge) 2 | 2.82 | 0.83 | 1.35 |
| Bloomberg U.S. Aggregate Index 3 | 1.31 | -0.17 | 0.53 |
| Bloomberg U.S. Corporate Investment Grade Index 3 | 4.40 | 0.98 | 1.62 |
| Fund net assets (in millions) | $ 1,836 |
| Total number of portfolio holdings | 737 |
| Total advisory fees paid (in millions) | $ 5 |
| Portfolio turnover rate | 191 % |

| Share class | Costs of a $10,000 investment | Costs paid as a percentage of a $10,000 investment |
| Class 529-C | $ 151 | 1.49 % |
| 1 year | 5 years | Since inception 1 | |
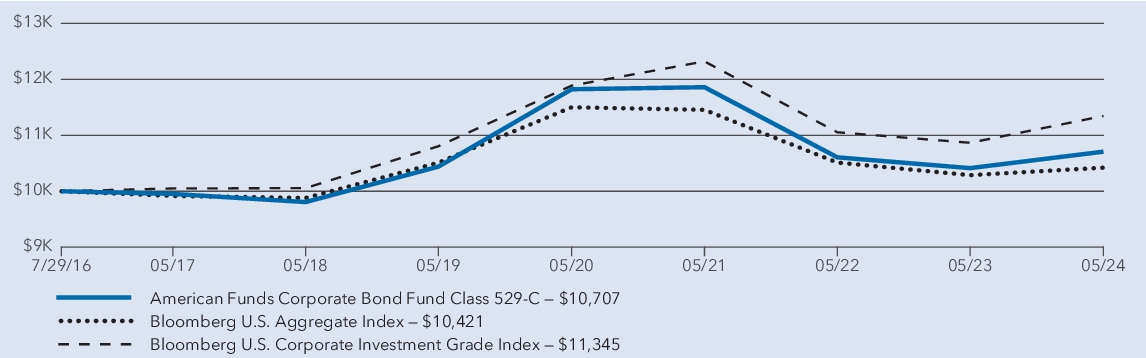
| American Funds Corporate Bond Fund — Class 529-C (with sales charge) 2 | 1.06 % | 0.07 % | 0.87 % |
| American Funds Corporate Bond Fund — Class 529-C (without sales charge) 2 | 2.05 | 0.07 | 0.87 |
| Bloomberg U.S. Aggregate Index 3 | 1.31 | -0.17 | 0.53 |
| Bloomberg U.S. Corporate Investment Grade Index 3 | 4.40 | 0.98 | 1.62 |
| Fund net assets (in millions) | $ 1,836 |
| Total number of portfolio holdings | 737 |
| Total advisory fees paid (in millions) | $ 5 |
| Portfolio turnover rate | 191 % |


| Share class | Costs of a $10,000 investment | Costs paid as a percentage of a $10,000 investment |
| Class 529-E | $ 93 | 0.92 % |
| 1 year | 5 years | Since inception 1 | |
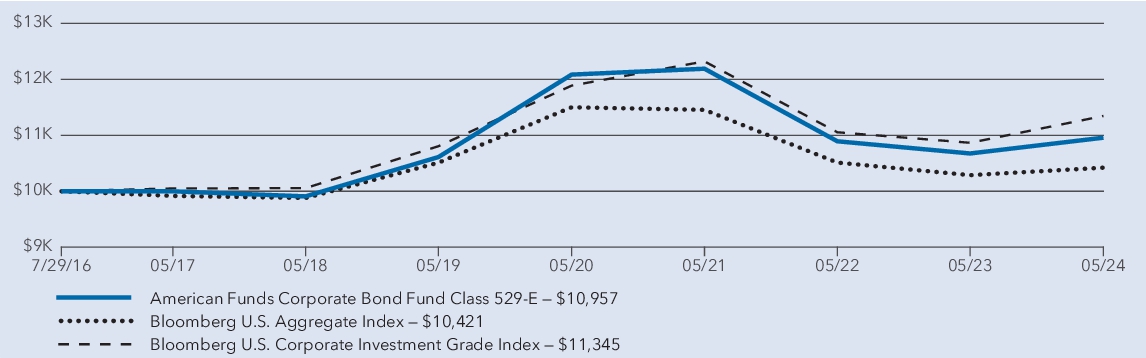
| American Funds Corporate Bond Fund — Class 529-E 2 | 2.64 % | 0.64 % | 1.17 % |
| Bloomberg U.S. Aggregate Index 3 | 1.31 | -0.17 | 0.53 |
| Bloomberg U.S. Corporate Investment Grade Index 3 | 4.40 | 0.98 | 1.62 |
| Fund net assets (in millions) | $ 1,836 |
| Total number of portfolio holdings | 737 |
| Total advisory fees paid (in millions) | $ 5 |
| Portfolio turnover rate | 191 % |


| Share class | Costs of a $10,000 investment | Costs paid as a percentage of a $10,000 investment |
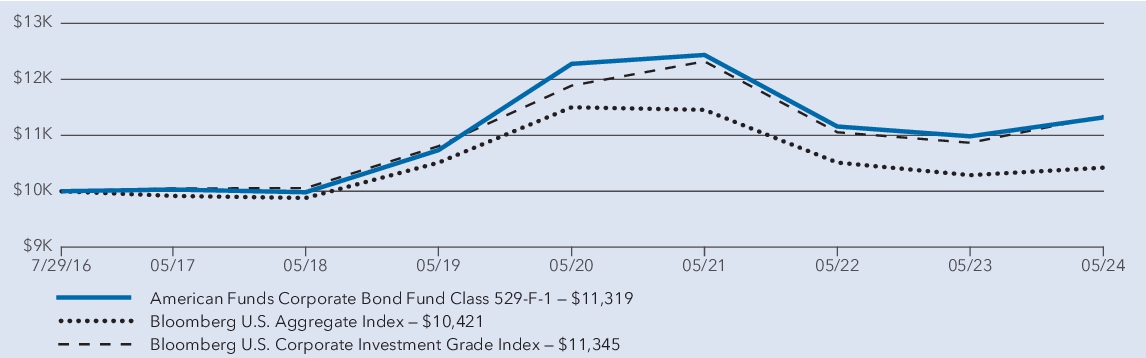
| Class 529-F-1 | $ 50 | 0.49 % |
| 1 year | 5 years | Since inception 1 | |
| American Funds Corporate Bond Fund — Class 529-F-1 2 | 3.07 % | 1.07 % | 1.59 % |
| Bloomberg U.S. Aggregate Index 3 | 1.31 | -0.17 | 0.53 |
| Bloomberg U.S. Corporate Investment Grade Index 3 | 4.40 | 0.98 | 1.62 |
| Fund net assets (in millions) | $ 1,836 |
| Total number of portfolio holdings | 737 |
| Total advisory fees paid (in millions) | $ 5 |
| Portfolio turnover rate | 191 % |


| Share class | Costs of a $10,000 investment | Costs paid as a percentage of a $10,000 investment |
| Class 529-F-2 | $ 44 | 0.43 % |

| 1 year | Since inception 1 | |
| American Funds Corporate Bond Fund — Class 529-F-2 2 | 3.14 % | -2.76 % |
| Bloomberg U.S. Aggregate Index 3 | 1.31 | -2.93 |
| Bloomberg U.S. Corporate Investment Grade Index 3 | 4.40 | -2.20 |
| Fund net assets (in millions) | $ 1,836 |
| Total number of portfolio holdings | 737 |
| Total advisory fees paid (in millions) | $ 5 |
| Portfolio turnover rate | 191 % |


| Share class | Costs of a $10,000 investment | Costs paid as a percentage of a $10,000 investment |
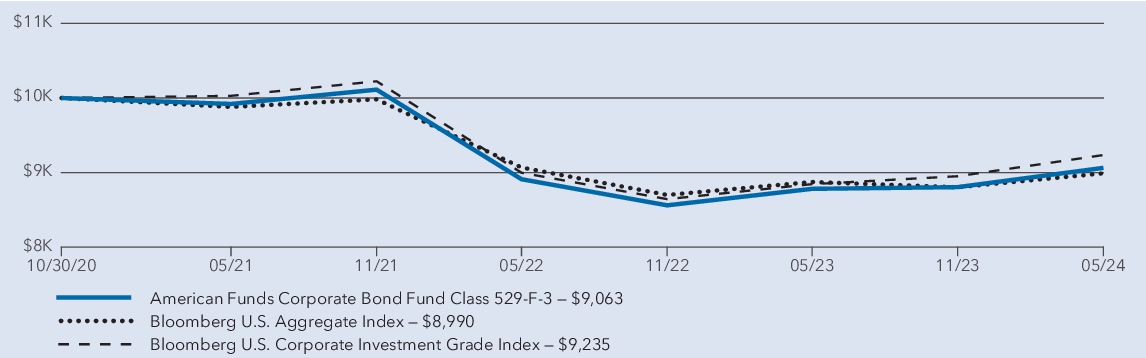
| Class 529-F-3 | $ 37 | 0.36 % |
| 1 year | Since inception 1 | |
| American Funds Corporate Bond Fund — Class 529-F-3 2 | 3.20 % | -2.71 % |
| Bloomberg U.S. Aggregate Index 3 | 1.31 | -2.93 |
| Bloomberg U.S. Corporate Investment Grade Index 3 | 4.40 | -2.20 |
| Fund net assets (in millions) | $ 1,836 |
| Total number of portfolio holdings | 737 |
| Total advisory fees paid (in millions) | $ 5 |
| Portfolio turnover rate | 191 % |


| Share class | Costs of a $10,000 investment | Costs paid as a percentage of a $10,000 investment |
| Class 529-T | $ 52 | 0.51 % |

| 1 year | 5 years | Since inception 1 | |
| American Funds Corporate Bond Fund — Class 529-T (with sales charge) 2 | 0.48 % | 0.56 % | 1.63 % |
| American Funds Corporate Bond Fund — Class 529-T (without sales charge) 2 | 3.05 | 1.07 | 1.99 |
| Bloomberg U.S. Aggregate Index 3 | 1.31 | -0.17 | 0.89 |
| Bloomberg U.S. Corporate Investment Grade Index 3 | 4.40 | 0.98 | 1.99 |
| Fund net assets (in millions) | $ 1,836 |
| Total number of portfolio holdings | 737 |
| Total advisory fees paid (in millions) | $ 5 |
| Portfolio turnover rate | 191 % |


| Share class | Costs of a $10,000 investment | Costs paid as a percentage of a $10,000 investment |
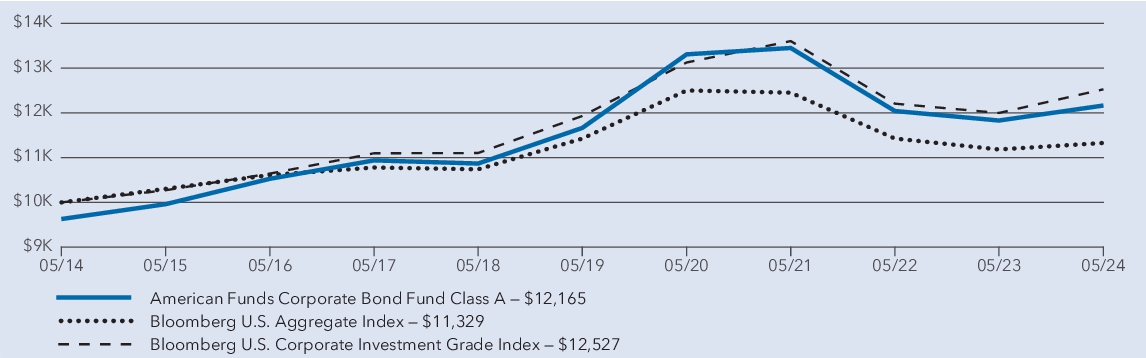
| Class A | $ 73 | 0.72 % |
| 1 year | 5 years | 10 years | |
| American Funds Corporate Bond Fund — Class A (with sales charge) * | -1.07 % | 0.07 % | 1.98 % |
| American Funds Corporate Bond Fund — Class A (without sales charge) * | 2.83 | 0.84 | 2.37 |
| Bloomberg U.S. Aggregate Index † | 1.31 | -0.17 | 1.26 |
| Bloomberg U.S. Corporate Investment Grade Index † | 4.40 | 0.98 | 2.28 |
| Fund net assets (in millions) | $ 1,836 |
| Total number of portfolio holdings | 737 |
| Total advisory fees paid (in millions) | $ 5 |
| Portfolio turnover rate | 191 % |


| Share class | Costs of a $10,000 investment | Costs paid as a percentage of a $10,000 investment |
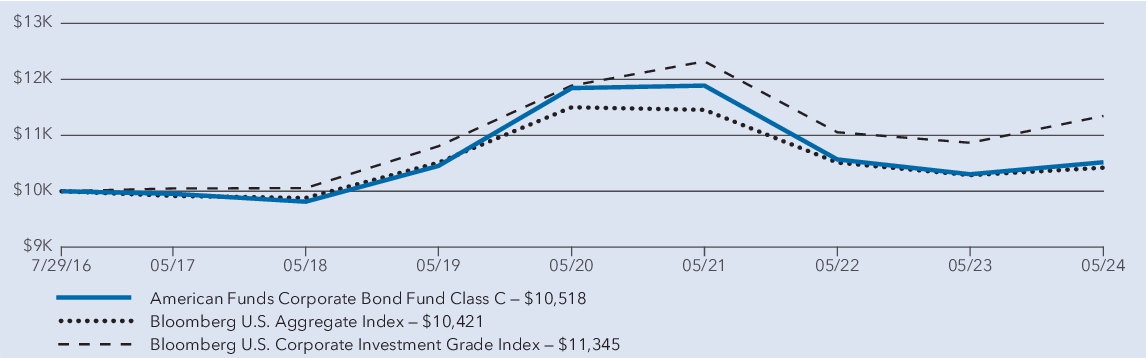
| Class C | $ 147 | 1.45 % |
| 1 year | 5 years | Since inception 1 | |
| American Funds Corporate Bond Fund — Class C (with sales charge) 2 | 1.10 % | 0.12 % | 0.65 % |
| American Funds Corporate Bond Fund — Class C (without sales charge) 2 | 2.09 | 0.12 | 0.65 |
| Bloomberg U.S. Aggregate Index 3 | 1.31 | -0.17 | 0.53 |
| Bloomberg U.S. Corporate Investment Grade Index 3 | 4.40 | 0.98 | 1.62 |
| Fund net assets (in millions) | $ 1,836 |
| Total number of portfolio holdings | 737 |
| Total advisory fees paid (in millions) | $ 5 |
| Portfolio turnover rate | 191 % |


| Share class | Costs of a $10,000 investment | Costs paid as a percentage of a $10,000 investment |
| Class F-1 | $ 71 | 0.70 % |
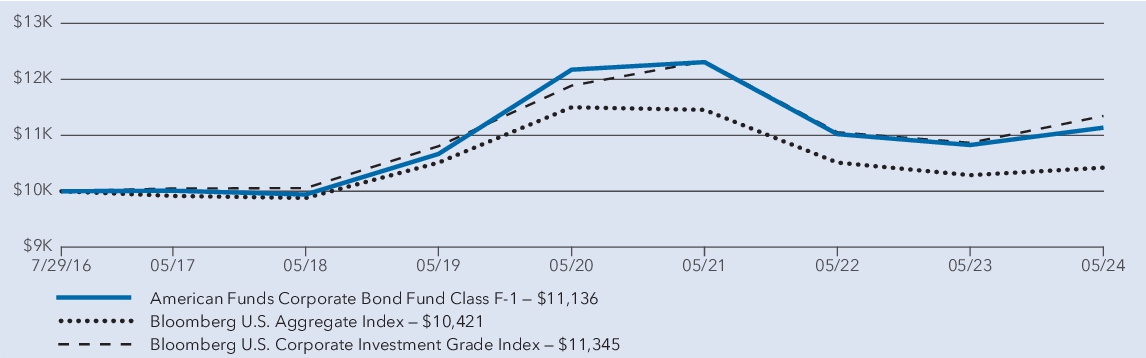
| 1 year | 5 years | Since inception 1 | |
| American Funds Corporate Bond Fund — Class F-1 2 | 2.86 % | 0.87 % | 1.38 % |
| Bloomberg U.S. Aggregate Index 3 | 1.31 | -0.17 | 0.53 |
| Bloomberg U.S. Corporate Investment Grade Index 3 | 4.40 | 0.98 | 1.62 |
| Fund net assets (in millions) | $ 1,836 |
| Total number of portfolio holdings | 737 |
| Total advisory fees paid (in millions) | $ 5 |
| Portfolio turnover rate | 191 % |


| Share class | Costs of a $10,000 investment | Costs paid as a percentage of a $10,000 investment |
| Class F-2 | $ 44 | 0.43 % |

| 1 year | 5 years | Since inception 1 | |
| American Funds Corporate Bond Fund — Class F-2 2 | 3.13 % | 1.13 % | 1.66 % |
| Bloomberg U.S. Aggregate Index 3 | 1.31 | -0.17 | 0.53 |
| Bloomberg U.S. Corporate Investment Grade Index 3 | 4.40 | 0.98 | 1.62 |
| Fund net assets (in millions) | $ 1,836 |
| Total number of portfolio holdings | 737 |
| Total advisory fees paid (in millions) | $ 5 |
| Portfolio turnover rate | 191 % |


| Share class | Costs of a $10,000 investment | Costs paid as a percentage of a $10,000 investment |
| Class F-3 | $ 33 | 0.32 % |
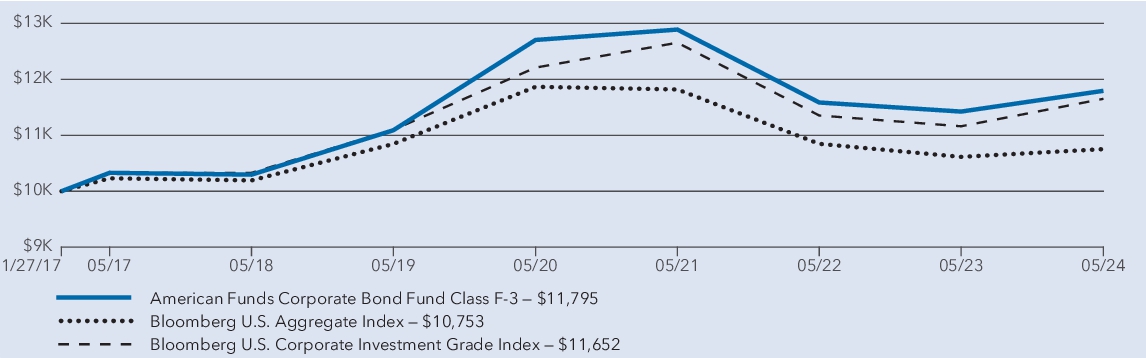
| 1 year | 5 years | Since inception 1 | |
American Funds Corporate Bond Fund — Class F-3 2 | 3.25 % | 1.24 % | 2.28 % |
Bloomberg U.S. Aggregate Index 3 | 1.31 | -0.17 | 0.99 |
Bloomberg U.S. Corporate Investment Grade Index 3 | 4.40 | 0.98 | 2.10 |
| Fund net assets (in millions) | $ 1,836 |
| Total number of portfolio holdings | 737 |
| Total advisory fees paid (in millions) | $ 5 |
| Portfolio turnover rate | 191 % |


| Share class | Costs of a $10,000 investment | Costs paid as a percentage of a $10,000 investment |
| Class R-1 | $ 143 | 1.41 % |
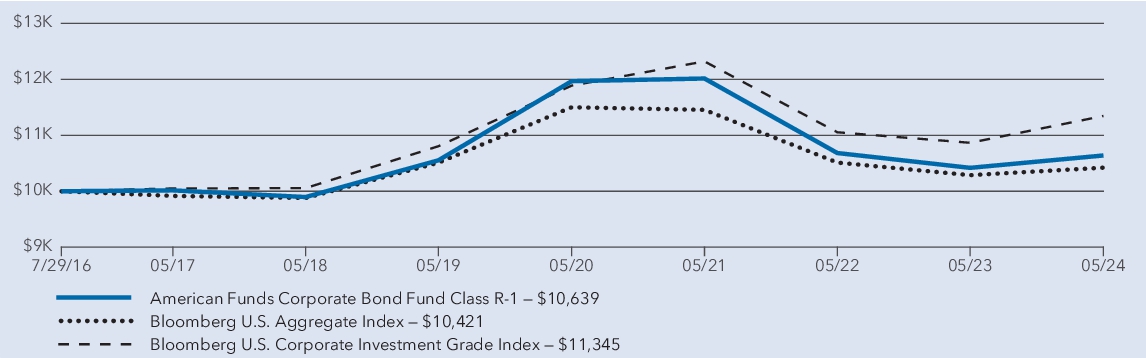
| 1 year | 5 years | Since inception 1 | |
American Funds Corporate Bond Fund — Class R-1 2 | 2.13 % | 0.16 % | 0.79 % |
Bloomberg U.S. Aggregate Index 3 | 1.31 | -0.17 | 0.53 |
Bloomberg U.S. Corporate Investment Grade Index 3 | 4.40 | 0.98 | 1.62 |
| Fund net assets (in millions) | $ 1,836 |
| Total number of portfolio holdings | 737 |
| Total advisory fees paid (in millions) | $ 5 |
| Portfolio turnover rate | 191 % |


| Share class | Costs of a $10,000 investment | Costs paid as a percentage of a $10,000 investment |
| Class R-2 | $ 142 | 1.40 % |

| 1 year | 5 years | Since inception 1 | |
| American Funds Corporate Bond Fund — Class R-2 2 | 2.15 % | 0.16 % | 0.73 % |
| Bloomberg U.S. Aggregate Index 3 | 1.31 | -0.17 | 0.53 |
| Bloomberg U.S. Corporate Investment Grade Index 3 | 4.40 | 0.98 | 1.62 |
| Fund net assets (in millions) | $ 1,836 |
| Total number of portfolio holdings | 737 |
| Total advisory fees paid (in millions) | $ 5 |
| Portfolio turnover rate | 191 % |


| Share class | Costs of a $10,000 investment | Costs paid as a percentage of a $10,000 investment |
| Class R-2E | $ 113 | 1.12 % |
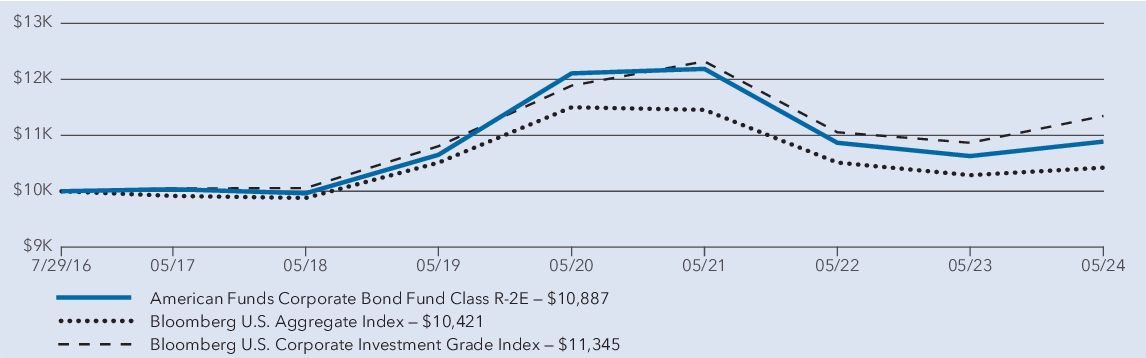
| 1 year | 5 years | Since inception 1 | |
| American Funds Corporate Bond Fund — Class R-2E 2 | 2.44 % | 0.44 % | 1.09 % |
| Bloomberg U.S. Aggregate Index 3 | 1.31 | -0.17 | 0.53 |
| Bloomberg U.S. Corporate Investment Grade Index 3 | 4.40 | 0.98 | 1.62 |
| Fund net assets (in millions ) | $ 1,836 |
| Total number of portfolio holdings | 737 |
| Total advisory fees paid (in millions) | $ 5 |
| Portfolio turnover rate | 191 % |


| Share class | Costs of a $10,000 investment | Costs paid as a percentage of a $10,000 investment |
| Class R-3 | $ 96 | 0.95 % |
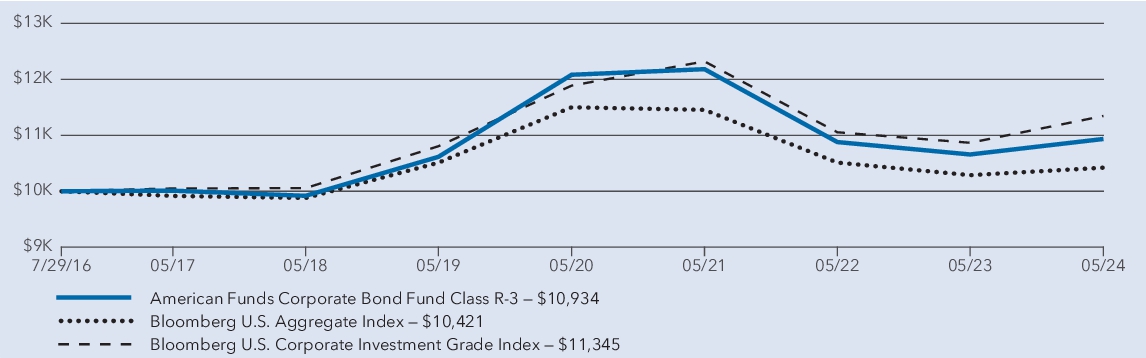
| 1 year | 5 years | Since inception 1 | |
| American Funds Corporate Bond Fund — Class R-3 2 | 2.60 % | 0.59 % | 1.15 % |
| Bloomberg U.S. Aggregate Index 3 | 1.31 | -0.17 | 0.53 |
| Bloomberg U.S. Corporate Investment Grade Index 3 | 4.40 | 0.98 | 1.62 |
| Fund net assets (in millions) | $ 1,836 |
| Total number of portfolio holdings | 737 |
| Total advisory fees paid (in millions) | $ 5 |
| Portfolio turnover rate | 191 % |


| Share class | Costs of a $10,000 investment | Costs paid as a percentage of a $10,000 investment |
| Class R-4 | $ 67 | 0.66 % |

| 1 year | 5 years | Since inception 1 | |
| American Funds Corporate Bond Fund — Class R-4 2 | 2.90 % | 0.89 % | 1.43 % |
| Bloomberg U.S. Aggregate Index 3 | 1.31 | -0.17 | 0.53 |
| Bloomberg U.S. Corporate Investment Grade Index 3 | 4.40 | 0.98 | 1.62 |
| Fund net assets (in millions) | $ 1,836 |
| Total number of portfolio holdings | 737 |
| Total advisory fees paid (in millions) | $ 5 |
| Portfolio turnover rate | 191 % |


| Share class | Costs of a $10,000 investment | Costs paid as a percentage of a $10,000 investment |
| Class R-5 | $ 38 | 0.37 % |

| 1 year | 5 years | Since inception 1 | |
| American Funds Corporate Bond Fund — Class R-5 2 | 3.20 % | 1.19 % | 1.71 % |
| Bloomberg U.S. Aggregate Index 3 | 1.31 | -0.17 | 0.53 |
| Bloomberg U.S. Corporate Investment Grade Index 3 | 4.40 | 0.98 | 1.62 |
| Fund net assets (in millions) | $ 1,836 |
| Total number of portfolio holdings | 737 |
| Total advisory fees paid (in millions) | $ 5 |
| Portfolio turnover rate | 191 % |


| Share class | Costs of a $10,000 investment | Costs paid as a percentage of a $10,000 investment |
| Class R-5E | $ 48 | 0.47 % |

| 1 year | 5 years | Since inception 1 | |
| American Funds Corporate Bond Fund — Class R-5E 2 | 3.10 % | 1.09 % | 1.64 % |
| Bloomberg U.S. Aggregate Index 3 | 1.31 | -0.17 | 0.53 |
| Bloomberg U.S. Corporate Investment Grade Index 3 | 4.40 | 0.98 | 1.62 |
| Fund net assets (in millions) | $ 1,836 |
| Total number of portfolio holdings | 737 |
| Total advisory fees paid (in millions) | $ 5 |
| Portfolio turnover rate | 191 % |


| Share class | Costs of a $10,000 investment | Costs paid as a percentage of a $10,000 investment |
| Class R-6 | $ 33 | 0.32 % |
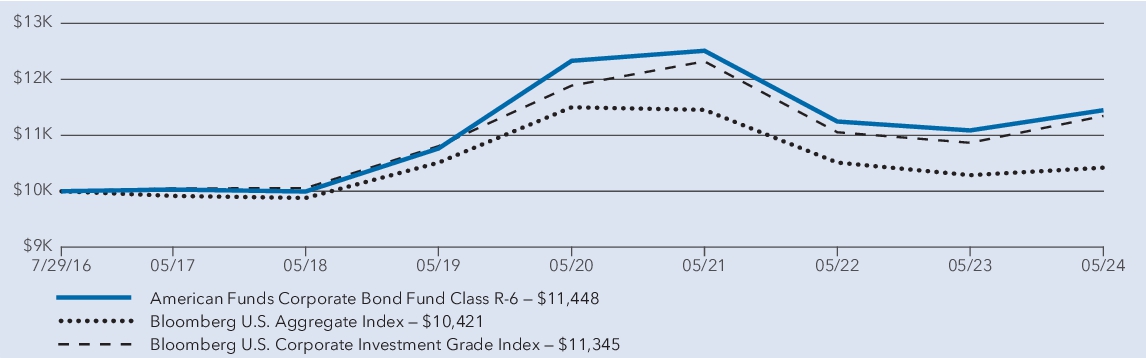
| 1 year | 5 years | Since inception 1 | |
| American Funds Corporate Bond Fund — Class R-6 2 | 3.25 % | 1.24 % | 1.74 % |
| Bloomberg U.S. Aggregate Index 3 | 1.31 | -0.17 | 0.53 |
| Bloomberg U.S. Corporate Investment Grade Index 3 | 4.40 | 0.98 | 1.62 |
| Fund net assets (in millions) | $ 1,836 |
| Total number of portfolio holdings | 737 |
| Total advisory fees paid (in millions ) | $ 5 |
| Portfolio turnover rate | 191 % |


| Share class | Costs of a $10,000 investment | Costs paid as a percentage of a $10,000 investment |
| Class T | $ 45 | 0.44 % |
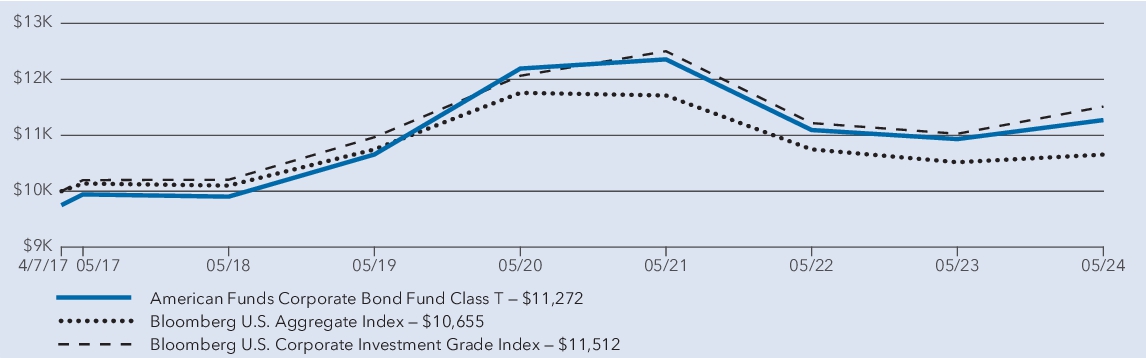
| 1 year | 5 years | Since inception 1 | |
| American Funds Corporate Bond Fund — Class T (with sales charge) 2 | 0.54 % | 0.62 % | 1.69 % |
| American Funds Corporate Bond Fund — Class T (without sales charge) 2 | 3.12 | 1.13 | 2.05 |
| Bloomberg U.S. Aggregate Index 3 | 1.31 | -0.17 | 0.89 |
| Bloomberg U.S. Corporate Investment Grade Index 3 | 4.40 | 0.98 | 1.99 |
| Fund net assets (in millions) | $ 1,836 |
| Total number of portfolio holdings | 737 |
| Total advisory fees paid (in millions) | $ 5 |
| Portfolio turnover rate | 191 % |

ITEM 2 - Code of Ethics
The Registrant has adopted a Code of Ethics, as of the end of the period covered by this report, applicable to the registrant's principal executive officer, principal financial officer and principal accounting officer, or persons performing similar functions. A copy of the code of ethics is available without charge at capitalgroup.com.
ITEM 3 - Audit Committee Financial Expert
The Registrant's board has determined that Paul S. Williams, a member of the Registrant's audit committee, is an "audit committee financial expert" and "independent," as such terms are defined in this Item. This designation will not increase the designee's duties, obligations or liability as compared to his or her duties, obligations and liability as a member of the audit committee and of the board, nor will it reduce the responsibility of the other audit committee members. There may be other individuals who, through education or experience, would qualify as "audit committee financial experts" if the board had designated them as such. Most importantly, the board believes each member of the audit committee contributes significantly to the effective oversight of the Registrant's financial statements and condition.
ITEM 4 - Principal Accountant Fees and Services
Registrant1 | (a) Audit Fees | (b) Audit-Related Fees | (c) Tax Fees | (d) All Other Fees |
May 31, 2024 | 102,000 | None | 10,000 | None |
May 31, 2023 | 86,000 | None | 9,000 | None |
Advisor and Affiliates2 |
|
|
|
|
May 31, 2024 | Not Applicable | None | None | None |
May 31, 2023 | Not Applicable | None | None | None |
Registrant, Advisor and Affiliates3 | (g) Aggregate |
non-audit fees | |
May 31, 2024 | 10,000 |
May 31, 2023 | 9,000 |
1The audit fees represents fees billed for professional services rendered for the audit and review of the Registrant's annual financial statements. The audit-related fees represents fees billed for assurance and related services that are reasonably related to the performance of the audit or review of the Registrant's financial statements, but not reported under "audit fees". The tax fees consist of professional services relating to the preparation of the Registrant’s tax returns. The other fees represents fees, if any, billed for other products and services rendered by the principal accountant to the Registrant other than those reported under the "audit fees", "audit-related fees", and "tax fees".
2This includes only fees for non-audit services billed to the adviser and affiliates for engagements that relate directly to the operations and financial reporting of the Registrant and were subject to the pre-approval policies described below. The audit-related fees consist of assurance and related services relating to the examination of the Registrant’s transfer agent, principal underwriter and investment adviser conducted in accordance with Statement on Standards for Attestation Engagements Number 18 issued by the American Institute of Certified Public Accountants. The tax fees consist of consulting services relating to the Registrant’s investments. The other fees consist of subscription services related to an accounting research tool.
3Aggregate non-audit fees paid to the Registrant’s auditors, including fees for all services billed to the Registrant, adviser and affiliates that provide ongoing services to the Registrant. The non-audit services represented by these amounts were brought to the attention of the committee and considered to be compatible with maintaining the auditors’ independence.
(e1)(e2)(h) All audit and permissible non-audit services that the Registrant’s audit committee considers compatible with maintaining the independent registered public accounting firm’s independence are required to be pre-approved by the committee. The pre-approval requirement will extend to all non-audit services provided to the Registrant, the investment adviser, and any entity controlling, controlled by, or under common control with the investment adviser that provides ongoing services to the Registrant, if the engagement relates directly to the operations and financial reporting of the Registrant. The committee will not delegate its responsibility to pre-approve these services to the investment adviser. The committee may delegate to one or more committee members the authority to review and pre-approve audit and permissible non-audit services. Actions taken under any such delegation will be reported to the full committee at its next meeting. The pre-approval requirement is waived with respect to non-audit services if certain conditions are met. The pre- approval requirement was not waived for any of the non-audit services listed above provided to the Registrant, adviser and affiliates.
(f)Not applicable.
(i)Not applicable.
(j)Not applicable.
ITEM 5 - Audit Committee of Listed Registrants
Not applicable to this Registrant, insofar as the Registrant is not a listed issuer as defined in Rule 10A-3 under the Securities Exchange Act of 1934.
ITEM 6 - Investments
The schedule of investments is included as part of the material filed under Item 7 of this Form.
ITEM 7 - Financial Statements and Financial Highlights for Open-End Management Investment Companies

N-CSR Items 7-11
Bonds, notes & other debt instruments 93.49% | Principal amount (000) | Value (000) | ||
Corporate bonds, notes & loans 83.97% | ||||
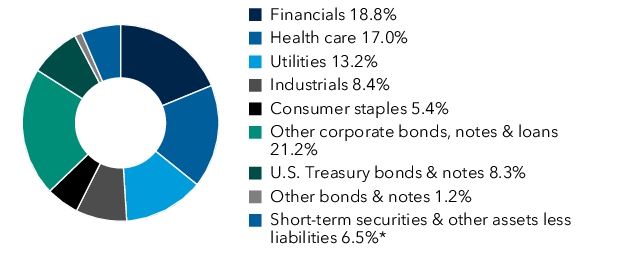
Financials 18.83% | ||||
AIB Group PLC 5.871% 3/28/2035 (USD-SOFR + 1.91% on 3/28/2034)1,2 | USD2,963 | $2,944 | ||
American Express Co. 5.532% 4/25/2030 (USD-SOFR + 1.09% on 4/25/2029)2 | 6,095 | 6,153 | ||
American Express Co. 6.489% 10/30/2031 (USD-SOFR + 1.94% on 10/30/2030)2 | 464 | 494 | ||
American Express Co. 5.043% 5/1/2034 (USD-SOFR + 1.835% on 5/1/2033)2 | 2,900 | 2,836 | ||
American International Group, Inc. 5.125% 3/27/2033 | 5,010 | 4,920 | ||
American International Group, Inc. 4.80% 7/10/2045 | 100 | 91 | ||
American International Group, Inc. 4.375% 6/30/2050 | 1,000 | 835 | ||
Aon Corp. 2.60% 12/2/2031 | 1,000 | 832 | ||
Aon Corp. 5.00% 9/12/2032 | 500 | 486 | ||
Aon Corp. 5.35% 2/28/2033 | 1,497 | 1,475 | ||
Aon Corp. 3.90% 2/28/2052 | 1,000 | 740 | ||
Aon North America, Inc. 5.15% 3/1/2029 | 250 | 249 | ||
Aon North America, Inc. 5.30% 3/1/2031 | 250 | 249 | ||
Aon North America, Inc. 5.45% 3/1/2034 | 8,840 | 8,762 | ||
Aon North America, Inc. 5.75% 3/1/2054 | 3,309 | 3,257 | ||
Bank of America Corp. 2.299% 7/21/2032 (USD-SOFR + 1.22% on 7/21/2031)2 | 2,500 | 2,035 | ||
Bank of America Corp. 5.872% 9/15/2034 (USD-SOFR + 1.84% on 9/15/2033)2 | 5,569 | 5,697 | ||
Bank of America Corp. 5.468% 1/23/2035 (3-month USD CME Term SOFR + 1.65% on 1/23/2034)2 | 11,913 | 11,839 | ||
Bank of America Corp. 2.972% 7/21/2052 (USD-SOFR + 1.56% on 7/21/2051)2 | 1,290 | 843 | ||
Bank of Ireland Group PLC 6.253% 9/16/2026 (1-year UST Yield Curve Rate T Note Constant Maturity + 2.65% on 9/16/2025)1,2 | 500 | 502 | ||
Bank of Ireland Group PLC 2.029% 9/30/2027 (1-year UST Yield Curve Rate T Note Constant Maturity + 1.10% on 9/30/2026)1,2 | 800 | 736 | ||
Bank of New York Mellon Corp. 5.188% 3/14/2035 (USD-SOFR + 1.418% on 3/14/2034)2 | 2,778 | 2,730 | ||
Bank of Nova Scotia (The) 8.00% 1/27/2084 (5-year UST Yield Curve Rate T Note Constant Maturity + 4.017% on 1/27/2029)2 | 2,439 | 2,492 | ||
Berkshire Hathaway Finance Corp. 4.20% 8/15/2048 | 228 | 192 | ||
Berkshire Hathaway Finance Corp. 3.85% 3/15/2052 | 301 | 232 | ||
Berkshire Hathaway, Inc. 4.50% 2/11/2043 | 125 | 117 | ||
BlackRock Funding, Inc. 5.25% 3/14/2054 | 3,008 | 2,902 | ||
Blackstone Holdings Finance Co., LLC 5.90% 11/3/20271 | 430 | 439 | ||
Blackstone Holdings Finance Co., LLC 6.20% 4/22/20331 | 390 | 407 | ||
BNP Paribas SA 2.159% 9/15/2029 (USD-SOFR + 1.218% on 9/15/2028)1,2 | 1,193 | 1,039 | ||
BNP Paribas SA 2.871% 4/19/2032 (USD-SOFR + 1.387% on 4/19/2031)1,2 | 625 | 526 | ||
BPCE SA 2.045% 10/19/2027 (USD-SOFR + 1.087% on 10/19/2026)1,2 | 1,500 | 1,377 | ||
BPCE SA 6.714% 10/19/2029 (USD-SOFR + 2.27% on 10/19/2028)1,2 | 600 | 624 | ||
BPCE SA 2.277% 1/20/2032 (USD-SOFR + 1.312% on 1/20/2031)1,2 | 2,216 | 1,793 | ||
BPCE SA 5.748% 7/19/2033 (USD-SOFR + 2.865% on 7/19/2032)1,2 | 2,310 | 2,297 | ||
BPCE SA 5.936% 5/30/2035 (USD-SOFR + 1.85% on 5/30/2034)1,2 | 3,795 | 3,796 | ||
CaixaBank, SA 6.208% 1/18/2029 (USD-SOFR + 2.70% on 1/18/2028)1,2 | 450 | 457 | ||
CaixaBank, SA 5.673% 3/15/2030 (USD-SOFR + 1.78% on 3/15/2029)1,2 | 3,825 | 3,812 | ||
CaixaBank, SA 6.84% 9/13/2034 (USD-SOFR + 2.77% on 9/13/2033)1,2 | 2,577 | 2,735 | ||
CaixaBank, SA 6.037% 6/15/2035 (USD-SOFR + 2.26% on 9/15/2034)1,2 | 5,175 | 5,194 | ||
Canadian Imperial Bank of Commerce 6.092% 10/3/2033 | 1,450 | 1,498 | ||
Capital One Financial Corp. 5.70% 2/1/2030 (USD-SOFR + 1.905% on 2/1/2029)2 | 2,108 | 2,108 | ||
Capital One Financial Corp. 6.377% 6/8/2034 (USD-SOFR + 2.86% on 6/8/2033)2 | 3,428 | 3,513 | ||
Capital One Financial Corp. 6.051% 2/1/2035 (USD-SOFR + 2.26% on 2/1/2034)2 | 7,591 | 7,625 | ||
Charles Schwab Corp. (The) 6.196% 11/17/2029 (USD-SOFR + 1.878% on 11/17/2028)2 | 1,200 | 1,241 | ||
Chubb INA Holdings, LLC 3.35% 5/3/2026 | 675 | 652 | ||
Chubb INA Holdings, LLC 5.00% 3/15/2034 | 5,205 | 5,136 | ||
Citigroup, Inc. 2.014% 1/25/2026 (USD-SOFR + 0.694% on 1/25/2025)2 | 3,338 | 3,258 | ||
Citigroup, Inc. 5.174% 2/13/2030 (USD-SOFR + 1.364% on 2/13/2029)2 | 9,350 | 9,262 | ||
Citigroup, Inc. 2.52% 11/3/2032 (USD-SOFR + 1.177% on 11/3/2031)2 | 515 | 422 | ||
Citigroup, Inc. 5.827% 2/13/2035 (USD-SOFR + 2.056% on 2/13/2034)2 | 1,962 | 1,943 | ||
Citizens Financial Group, Inc. 6.645% 4/25/2035 (USD-SOFR + 2.325% on 4/25/2034)2 | 911 | 935 | ||
CME Group, Inc. 4.15% 6/15/2048 | 4,000 | 3,368 | ||
Corebridge Financial, Inc. 3.90% 4/5/2032 | 2,220 | 1,984 | ||
Corebridge Financial, Inc. 4.40% 4/5/2052 | 217 | 172 | ||
Deutsche Bank AG 2.129% 11/24/2026 (USD-SOFR + 1.87% on 11/24/2025)2 | 835 | 791 | ||
Deutsche Bank AG 7.146% 7/13/2027 (USD-SOFR + 2.52% on 7/13/2026)2 | 268 | 275 | ||
1 | American Funds Corporate Bond Fund |
Bonds, notes & other debt instruments (continued) | Principal amount (000) | Value (000) | ||
Corporate bonds, notes & loans (continued) | ||||
Financials (continued) | ||||
Deutsche Bank AG 6.72% 1/18/2029 (USD-SOFR + 3.18% on 1/18/2028)2 | USD1,338 | $1,382 | ||
Fifth Third Bancorp 6.339% 7/27/2029 (USD-SOFR + 2.34% on 7/27/2028)2 | 1,320 | 1,354 | ||
Fifth Third Bancorp 5.631% 1/29/2032 (USD-SOFR + 1.84% on 1/29/2031)2 | 1,787 | 1,772 | ||
Five Corners Funding Trust II 2.85% 5/15/20301 | 1,000 | 873 | ||
Five Corners Funding Trust III 5.791% 2/15/20331 | 2,790 | 2,830 | ||
Five Corners Funding Trust IV 5.997% 2/15/20531 | 500 | 504 | ||
Goldman Sachs Group, Inc. (3-month USD CME Term SOFR + 1.432%) 6.754% 5/15/20263 | 500 | 504 | ||
Goldman Sachs Group, Inc. 5.727% 4/25/2030 (USD-SOFR + 1.265% on 4/25/2029)2 | 7,868 | 7,975 | ||
Goldman Sachs Group, Inc. 6.561% 10/24/2034 (USD-SOFR + 1.95% on 10/24/2033)2 | 413 | 443 | ||
Goldman Sachs Group, Inc. 5.851% 4/25/2035 (USD-SOFR + 1.552% on 4/25/2034)2 | 9,370 | 9,573 | ||
Goldman Sachs Group, Inc. 2.908% 7/21/2042 (USD-SOFR + 1.40% on 7/21/2041)2 | 3,928 | 2,779 | ||
HSBC Holdings PLC 2.206% 8/17/2029 (USD-SOFR + 1.285% on 8/17/2028)2 | 2,544 | 2,228 | ||
HSBC Holdings PLC 2.871% 11/22/2032 (USD-SOFR + 1.41% on 11/22/2031)2 | 3,244 | 2,703 | ||
HSBC Holdings PLC 6.332% 3/9/2044 (USD-SOFR + 2.65% on 3/9/2043)2 | 400 | 423 | ||
Huntington Bancshares, Inc. 6.208% 8/21/2029 (USD-SOFR + 2.02% on 8/21/2028)2 | 1,245 | 1,270 | ||
Intercontinental Exchange, Inc. 5.25% 6/15/2031 | 3,847 | 3,866 | ||
Intesa Sanpaolo SpA 8.248% 11/21/2033 (1-year UST Yield Curve Rate T Note Constant Maturity + 4.40% on 11/21/2032)1,2 | 375 | 417 | ||
Intesa Sanpaolo SpA 7.778% 6/20/2054 (1-year UST Yield Curve Rate T Note Constant Maturity + 3.90% on 6/20/2053)1,2 | 1,000 | 1,072 | ||
JPMorgan Chase & Co. 2.005% 3/13/2026 (USD-SOFR + 1.585% on 3/13/2025)2 | 5,825 | 5,661 | ||
JPMorgan Chase & Co. 2.083% 4/22/2026 (USD-SOFR + 1.85% on 4/22/2025)2 | 5,000 | 4,844 | ||
JPMorgan Chase & Co. 5.581% 4/22/2030 (USD-SOFR + 1.16% on 4/22/2029)2 | 16,330 | 16,514 | ||
JPMorgan Chase & Co. 1.953% 2/4/2032 (USD-SOFR + 1.065% on 2/4/2031)2 | 3,054 | 2,473 | ||
JPMorgan Chase & Co. 5.766% 4/22/2035 (USD-SOFR + 1.49% on 4/22/2034)2 | 9,343 | 9,548 | ||
JPMorgan Chase & Co. 3.328% 4/22/2052 (USD-SOFR + 1.58% on 4/22/2051)2 | 1,850 | 1,308 | ||
Lloyds Banking Group PLC 3.75% 1/11/2027 | 213 | 205 | ||
Lloyds Banking Group PLC 5.462% 1/5/2028 (1-year UST Yield Curve Rate T Note Constant Maturity + 1.375% on 1/5/2027)2 | 325 | 324 | ||
Lloyds Banking Group PLC 4.375% 3/22/2028 | 590 | 570 | ||
Lloyds Banking Group PLC 5.679% 1/5/2035 (1-year UST Yield Curve Rate T Note Constant Maturity + 1.75% on 1/5/2034)2 | 800 | 798 | ||
M&T Bank Corp. 7.413% 10/30/2029 (USD-SOFR + 2.80% on 10/30/2028)2 | 1,310 | 1,378 | ||
M&T Bank Corp. 6.082% 3/13/2032 (USD-SOFR + 2.26% on 3/13/2031)2 | 1,170 | 1,161 | ||
M&T Bank Corp. 5.053% 1/27/2034 (USD-SOFR + 1.85% on 1/27/2033)2 | 3,799 | 3,497 | ||
Marsh & McLennan Companies, Inc. 5.40% 9/15/2033 | 250 | 253 | ||
Mastercard, Inc. 4.875% 5/9/2034 | 6,218 | 6,132 | ||
MetLife, Inc. 5.375% 7/15/2033 | 2,754 | 2,775 | ||
MetLife, Inc. 4.60% 5/13/2046 | 100 | 87 | ||
MetLife, Inc. 5.00% 7/15/2052 | 230 | 211 | ||
Metropolitan Life Global Funding I 0.95% 7/2/20251 | 1,203 | 1,147 | ||
Metropolitan Life Global Funding I 3.45% 12/18/20261 | 150 | 144 | ||
Metropolitan Life Global Funding I 4.40% 6/30/20271 | 1,000 | 981 | ||
Metropolitan Life Global Funding I 5.05% 1/6/20281 | 350 | 349 | ||
Metropolitan Life Global Funding I 4.85% 1/8/20291 | 250 | 247 | ||
Metropolitan Life Global Funding I 3.05% 6/17/20291 | 250 | 226 | ||
Metropolitan Life Global Funding I 2.95% 4/9/20301 | 476 | 421 | ||
Metropolitan Life Global Funding I 2.40% 1/11/20321 | 250 | 205 | ||
Metropolitan Life Global Funding I 5.15% 3/28/20331 | 200 | 197 | ||
Metropolitan Life Global Funding I 5.05% 1/8/20341 | 500 | 489 | ||
Morgan Stanley 5.173% 1/16/2030 (USD-SOFR + 1.45% on 1/16/2029)2 | 292 | 290 | ||
Morgan Stanley 5.656% 4/18/2030 (USD-SOFR + 1.26% on 4/18/2029)2 | 4,688 | 4,751 | ||
Morgan Stanley 1.794% 2/13/2032 (USD-SOFR + 1.034% on 2/13/2031)2 | 1,424 | 1,134 | ||
Morgan Stanley 6.627% 11/1/2034 (USD-SOFR + 2.05% on 11/1/2033)2 | 5,208 | 5,603 | ||
Morgan Stanley 5.831% 4/19/2035 (USD-SOFR + 1.58% on 4/19/2034)2 | 13,126 | 13,393 | ||
Morgan Stanley 3.217% 4/22/2042 (USD-SOFR + 1.485% on 4/22/2041)2 | 667 | 498 | ||
NatWest Group PLC 3.073% 5/22/2028 (1-year UST Yield Curve Rate T Note Constant Maturity + 2.55% on 5/22/2027)2 | 340 | 318 | ||
NatWest Group PLC 4.445% 5/8/2030 (3-month USD-LIBOR + 1.871% on 5/5/2029)2,4 | 370 | 352 | ||
NatWest Group PLC 6.016% 3/2/2034 (1-year UST Yield Curve Rate T Note Constant Maturity + 2.10% on 3/2/2033)2 | 500 | 511 | ||
New York Life Global Funding 3.00% 1/10/20281 | 100 | 93 | ||
New York Life Global Funding 1.20% 8/7/20301 | 1,500 | 1,188 | ||
New York Life Global Funding 1.85% 8/1/20311 | 250 | 201 | ||
New York Life Global Funding 4.55% 1/28/20331 | 2,155 | 2,043 | ||
New York Life Global Funding 5.00% 1/9/20341 | 2,550 | 2,494 | ||
American Funds Corporate Bond Fund | 2 |
Bonds, notes & other debt instruments (continued) | Principal amount (000) | Value (000) | ||
Corporate bonds, notes & loans (continued) | ||||
Financials (continued) | ||||
Northwestern Mutual Life Insurance Co. (The) 4.90% 6/12/20281 | USD1,010 | $1,000 | ||
PNC Financial Services Group, Inc. 5.354% 12/2/2028 (USD-SOFR + 1.62% on 12/2/2027)2 | 2,500 | 2,497 | ||
PNC Financial Services Group, Inc. 6.875% 10/20/2034 (USD-SOFR + 2.284% on 10/20/2033)2 | 2,570 | 2,786 | ||
PNC Financial Services Group, Inc. 5.676% 1/22/2035 (USD-SOFR + 1.902% on 1/22/2034)2 | 2,321 | 2,322 | ||
Prudential Financial, Inc. 3.70% 3/13/2051 | 725 | 529 | ||
Royal Bank of Canada 5.00% 2/1/2033 | 3,000 | 2,944 | ||
State Street Corp. 5.159% 5/18/2034 (USD-SOFR + 1.89% on 5/18/2033)2 | 3,086 | 3,038 | ||
Sumitomo Mitsui Financial Group, Inc. 5.88% 7/13/2026 | 4,311 | 4,354 | ||
Synchrony Financial 2.875% 10/28/2031 | 1,800 | 1,448 | ||
Toronto-Dominion Bank (The) 5.523% 7/17/2028 | 2,665 | 2,690 | ||
Travelers Companies, Inc. 4.00% 5/30/2047 | 105 | 85 | ||
Travelers Companies, Inc. 4.05% 3/7/2048 | 100 | 81 | ||
Travelers Companies, Inc. 2.55% 4/27/2050 | 452 | 275 | ||
Travelers Companies, Inc. 5.45% 5/25/2053 | 420 | 421 | ||
Truist Financial Corp. 7.161% 10/30/2029 (USD-SOFR + 2.446% on 10/30/2028)2 | 579 | 613 | ||
Truist Financial Corp. 5.867% 6/8/2034 (USD-SOFR + 2.361% on 6/8/2033)2 | 1,877 | 1,884 | ||
Truist Financial Corp. 5.711% 1/24/2035 (USD-SOFR + 1.922% on 1/24/2034)2 | 5,110 | 5,080 | ||
U.S. Bancorp 4.839% 2/1/2034 (USD-SOFR + 1.60% on 2/1/2033)2 | 54 | 51 | ||
U.S. Bancorp 5.678% 1/23/2035 (USD-SOFR + 1.86% on 1/23/2034)2 | 7,000 | 6,992 | ||
UBS Group AG 1.364% 1/30/2027 (5-year UST Yield Curve Rate T Note Constant Maturity + 1.08% on 1/30/2026)1,2 | 2,600 | 2,419 | ||
UBS Group AG 5.428% 2/8/2030 (1-year UST Yield Curve Rate T Note Constant Maturity + 1.52% on 2/8/2029)1,2 | 250 | 249 | ||
UBS Group AG 4.194% 4/1/2031 (USD-SOFR + 3.73% on 4/1/2030)1,2 | 5,202 | 4,837 | ||
UBS Group AG 3.091% 5/14/2032 (USD-SOFR + 1.73% on 5/14/2031)1,2 | 500 | 426 | ||
UBS Group AG 2.746% 2/11/2033 (1-year UST Yield Curve Rate T Note Constant Maturity + 1.10% on 2/11/2032)1,2 | 5,330 | 4,358 | ||
UBS Group AG 5.699% 2/8/2035 (1-year UST Yield Curve Rate T Note Constant Maturity + 1.77% on 2/8/2034)1,2 | 500 | 499 | ||
Wells Fargo & Co. 5.707% 4/22/2028 (USD-SOFR + 1.07% on 4/22/2027)2 | 1,610 | 1,621 | ||
Wells Fargo & Co. 2.879% 10/30/2030 (3-month USD CME Term SOFR + 1.432% on 10/30/2029)2 | 913 | 805 | ||
Wells Fargo & Co. 3.35% 3/2/2033 (USD-SOFR + 1.50% on 3/2/2032)2 | 3,293 | 2,841 | ||
Wells Fargo & Co. 5.389% 4/24/2034 (USD-SOFR + 2.02% on 4/24/2033)2 | 7,101 | 6,991 | ||
Wells Fargo & Co. 6.491% 10/23/2034 (USD-SOFR + 2.06% on 10/23/2033)2 | 1,169 | 1,244 | ||
Wells Fargo & Co. 5.499% 1/23/2035 (USD-SOFR + 1.78% on 1/23/2034)2 | 3,364 | 3,336 | ||
Wells Fargo & Co. 4.611% 4/25/2053 (USD-SOFR + 2.13% on 4/25/2052)2 | 7,388 | 6,311 | ||
Willis North America, Inc. 5.90% 3/5/2054 | 500 | 488 | ||
345,816 | ||||
Health care 16.97% | ||||
AbbVie, Inc. 4.80% 3/15/2029 | 7,690 | 7,619 | ||
AbbVie, Inc. 5.05% 3/15/2034 | 26,701 | 26,427 | ||
AbbVie, Inc. 5.35% 3/15/2044 | 300 | 296 | ||
AbbVie, Inc. 5.40% 3/15/2054 | 11,480 | 11,325 | ||
AbbVie, Inc. 5.50% 3/15/2064 | 925 | 910 | ||
Amgen, Inc. 5.15% 3/2/2028 | 4,976 | 4,964 | ||
Amgen, Inc. 3.00% 2/22/2029 | 3,165 | 2,901 | ||
Amgen, Inc. 2.45% 2/21/2030 | 1,250 | 1,084 | ||
Amgen, Inc. 5.25% 3/2/2030 | 2,706 | 2,714 | ||
Amgen, Inc. 2.30% 2/25/2031 | 1,250 | 1,046 | ||
Amgen, Inc. 4.20% 3/1/2033 | 3,500 | 3,228 | ||
Amgen, Inc. 5.25% 3/2/2033 | 10,053 | 9,981 | ||
Amgen, Inc. 5.60% 3/2/2043 | 2,850 | 2,824 | ||
Amgen, Inc. 3.375% 2/21/2050 | 125 | 88 | ||
Amgen, Inc. 3.00% 1/15/2052 | 50 | 33 | ||
Amgen, Inc. 4.875% 3/1/2053 | 2,438 | 2,152 | ||
Amgen, Inc. 5.65% 3/2/2053 | 5,007 | 4,945 | ||
Amgen, Inc. 4.40% 2/22/2062 | 174 | 138 | ||
Amgen, Inc. 5.75% 3/2/2063 | 3,610 | 3,557 | ||
AstraZeneca Finance, LLC 4.85% 2/26/2029 | 3,500 | 3,475 | ||
AstraZeneca Finance, LLC 4.90% 2/26/2031 | 3,295 | 3,273 | ||
AstraZeneca Finance, LLC 2.25% 5/28/2031 | 1,061 | 892 | ||
AstraZeneca Finance, LLC 5.00% 2/26/2034 | 4,789 | 4,731 | ||
3 | American Funds Corporate Bond Fund |
Bonds, notes & other debt instruments (continued) | Principal amount (000) | Value (000) | ||
Corporate bonds, notes & loans (continued) | ||||
Health care (continued) | ||||
AstraZeneca PLC 3.375% 11/16/2025 | USD177 | $173 | ||
AstraZeneca PLC 0.70% 4/8/2026 | 2,658 | 2,452 | ||
AstraZeneca PLC 1.375% 8/6/2030 | 2,347 | 1,904 | ||
Baxter International, Inc. 2.272% 12/1/2028 | 500 | 438 | ||
Baxter International, Inc. 2.539% 2/1/2032 | 6,429 | 5,225 | ||
Baxter International, Inc. 3.132% 12/1/2051 | 456 | 286 | ||
Becton, Dickinson and Co. 4.874% 2/8/2029 | 2,000 | 1,974 | ||
Becton, Dickinson and Co. 5.11% 2/8/2034 | 1,050 | 1,025 | ||
Boston Scientific Corp. 2.65% 6/1/2030 | 2,000 | 1,744 | ||
Boston Scientific Corp. 4.70% 3/1/2049 | 36 | 32 | ||
Bristol-Myers Squibb Co. 4.90% 2/22/2029 | 1,855 | 1,844 | ||
Bristol-Myers Squibb Co. 5.20% 2/22/2034 | 16,029 | 15,931 | ||
Bristol-Myers Squibb Co. 5.50% 2/22/2044 | 975 | 966 | ||
Bristol-Myers Squibb Co. 2.55% 11/13/2050 | 537 | 315 | ||
Bristol-Myers Squibb Co. 3.70% 3/15/2052 | 558 | 408 | ||
Bristol-Myers Squibb Co. 6.25% 11/15/2053 | 3,411 | 3,677 | ||
Bristol-Myers Squibb Co. 5.55% 2/22/2054 | 6,925 | 6,823 | ||
Bristol-Myers Squibb Co. 6.40% 11/15/2063 | 1,230 | 1,343 | ||
Bristol-Myers Squibb Co. 5.65% 2/22/2064 | 1,925 | 1,882 | ||
Cencora, Inc. 2.70% 3/15/2031 | 1,622 | 1,377 | ||
Centene Corp. 2.45% 7/15/2028 | 6,355 | 5,609 | ||
Centene Corp. 4.625% 12/15/2029 | 2,470 | 2,327 | ||
Centene Corp. 3.375% 2/15/2030 | 1,963 | 1,730 | ||
Centene Corp. 3.00% 10/15/2030 | 4,185 | 3,561 | ||
Centene Corp. 2.50% 3/1/2031 | 6,040 | 4,927 | ||
Centene Corp. 2.625% 8/1/2031 | 1,530 | 1,246 | ||
Cigna Group (The) 5.125% 5/15/2031 | 1,100 | 1,089 | ||
Cigna Group (The) 5.25% 2/15/2034 | 7,475 | 7,331 | ||
CVS Health Corp. 3.25% 8/15/2029 | 414 | 374 | ||
CVS Health Corp. 5.125% 2/21/2030 | 1,700 | 1,672 | ||
CVS Health Corp. 1.75% 8/21/2030 | 1,415 | 1,142 | ||
CVS Health Corp. 1.875% 2/28/2031 | 3,295 | 2,623 | ||
CVS Health Corp. 5.25% 2/21/2033 | 5,024 | 4,886 | ||
CVS Health Corp. 5.70% 6/1/2034 | 3,724 | 3,707 | ||
CVS Health Corp. 5.05% 3/25/2048 | 65 | 56 | ||
CVS Health Corp. 5.625% 2/21/2053 | 1,400 | 1,299 | ||
CVS Health Corp. 5.875% 6/1/2053 | 2,980 | 2,859 | ||
CVS Health Corp. 6.00% 6/1/2063 | 503 | 484 | ||
Elevance Health, Inc. 4.10% 5/15/2032 | 1,287 | 1,186 | ||
Elevance Health, Inc. 4.75% 2/15/2033 | 863 | 828 | ||
Elevance Health, Inc. 4.55% 5/15/2052 | 1,157 | 970 | ||
Elevance Health, Inc. 5.125% 2/15/2053 | 390 | 358 | ||
GE HealthCare Technologies, Inc. 5.65% 11/15/2027 | 700 | 709 | ||
GE HealthCare Technologies, Inc. 5.857% 3/15/2030 | 1,180 | 1,210 | ||
GE HealthCare Technologies, Inc. 6.377% 11/22/2052 | 225 | 244 | ||
Gilead Sciences, Inc. 5.25% 10/15/2033 | 10,979 | 10,994 | ||
Gilead Sciences, Inc. 2.60% 10/1/2040 | 622 | 427 | ||
Gilead Sciences, Inc. 5.55% 10/15/2053 | 4,121 | 4,092 | ||
HCA, Inc. 5.20% 6/1/2028 | 5,000 | 4,962 | ||
HCA, Inc. 4.125% 6/15/2029 | 1,000 | 942 | ||
HCA, Inc. 2.375% 7/15/2031 | 2,455 | 2,004 | ||
Humana, Inc. 5.375% 4/15/2031 | 2,633 | 2,608 | ||
Humana, Inc. 5.75% 4/15/2054 | 2,485 | 2,394 | ||
Johnson & Johnson 4.90% 6/1/2031 | 5,163 | 5,172 | ||
Johnson & Johnson 4.95% 6/1/2034 | 12,905 | 12,926 | ||
Johnson & Johnson 5.25% 6/1/2054 | 4,932 | 4,913 | ||
Medtronic Global Holdings S.C.A. 4.50% 3/30/2033 | 1,300 | 1,244 | ||
Pfizer Investment Enterprises Pte., Ltd. 4.75% 5/19/2033 | 24,631 | 23,826 | ||
Pfizer Investment Enterprises Pte., Ltd. 5.30% 5/19/2053 | 7,875 | 7,534 | ||
Roche Holdings, Inc. 2.076% 12/13/20311 | 7,280 | 5,922 | ||
Roche Holdings, Inc. 5.593% 11/13/20331 | 200 | 207 | ||
Roche Holdings, Inc. 5.218% 3/8/20541 | 2,100 | 2,048 | ||
Solventum Corp. 5.60% 3/23/20341 | 8,275 | 8,133 | ||
UnitedHealth Group, Inc. 2.875% 8/15/2029 | 348 | 314 | ||
UnitedHealth Group, Inc. 4.20% 5/15/2032 | 2,484 | 2,327 | ||
UnitedHealth Group, Inc. 3.05% 5/15/2041 | 2,000 | 1,478 | ||
UnitedHealth Group, Inc. 4.25% 6/15/2048 | 468 | 387 | ||
American Funds Corporate Bond Fund | 4 |
Bonds, notes & other debt instruments (continued) | Principal amount (000) | Value (000) | ||
Corporate bonds, notes & loans (continued) | ||||
Health care (continued) | ||||
UnitedHealth Group, Inc. 4.45% 12/15/2048 | USD285 | $243 | ||
UnitedHealth Group, Inc. 3.25% 5/15/2051 | 1,938 | 1,329 | ||
UnitedHealth Group, Inc. 4.75% 5/15/2052 | 2,486 | 2,202 | ||
UnitedHealth Group, Inc. 5.375% 4/15/2054 | 1,400 | 1,359 | ||
UnitedHealth Group, Inc. 4.95% 5/15/2062 | 530 | 472 | ||
UnitedHealth Group, Inc. 6.05% 2/15/2063 | 414 | 435 | ||
311,743 | ||||
Utilities 13.24% | ||||
AEP Transmission Co., LLC 5.15% 4/1/2034 | 7,306 | 7,152 | ||
AEP Transmission Co., LLC 2.75% 8/15/2051 | 979 | 590 | ||
American Electric Power Co., Inc. 1.00% 11/1/2025 | 650 | 609 | ||
American Transmission Systems, Inc. 2.65% 1/15/20321 | 685 | 566 | ||
Berkshire Hathaway Energy Co. 4.60% 5/1/2053 | 415 | 344 | ||
CenterPoint Energy, Inc. 2.65% 6/1/2031 | 5,389 | 4,536 | ||
Cleveland Electric Illuminating Co. (The) 3.50% 4/1/20281 | 1,000 | 931 | ||
Cleveland Electric Illuminating Co. (The) 4.55% 11/15/20301 | 2,500 | 2,357 | ||
Commonwealth Edison Co. 3.125% 3/15/2051 | 25 | 16 | ||
Consumers Energy Co. 4.90% 2/15/2029 | 2,000 | 1,987 | ||
Consumers Energy Co. 4.60% 5/30/2029 | 1,625 | 1,592 | ||
Consumers Energy Co. 3.60% 8/15/2032 | 974 | 868 | ||
Consumers Energy Co. 4.625% 5/15/2033 | 2,405 | 2,297 | ||
Duke Energy Carolinas, LLC 5.35% 1/15/2053 | 1,780 | 1,697 | ||
Duke Energy Florida, LLC 5.95% 11/15/2052 | 850 | 872 | ||
Duke Energy Progress, LLC 2.50% 8/15/2050 | 1,044 | 602 | ||
Edison International 4.125% 3/15/2028 | 4,260 | 4,059 | ||
Electricite de France SA 5.65% 4/22/20291 | 1,100 | 1,107 | ||
Electricité de France SA 9.125% junior subordinated perpetual bonds (5-year UST Yield Curve Rate T Note Constant Maturity + 5.411% on 6/15/2033)1,2 | 4,725 | 5,202 | ||
Entergy Corp. 2.40% 6/15/2031 | 2,100 | 1,727 | ||
Entergy Louisiana, LLC 1.60% 12/15/2030 | 475 | 379 | ||
Entergy Louisiana, LLC 5.35% 3/15/2034 | 1,440 | 1,422 | ||
Entergy Louisiana, LLC 5.70% 3/15/2054 | 790 | 779 | ||
Eversource Energy 2.55% 3/15/2031 | 1,467 | 1,213 | ||
Eversource Energy 5.50% 1/1/2034 | 5,378 | 5,268 | ||
FirstEnergy Corp. 1.60% 1/15/2026 | 4,125 | 3,875 | ||
FirstEnergy Corp. 2.65% 3/1/2030 | 8,442 | 7,262 | ||
FirstEnergy Corp. 2.25% 9/1/2030 | 8,830 | 7,296 | ||
FirstEnergy Corp., Series B, 4.15% 7/15/2027 | 5,666 | 5,400 | ||
FirstEnergy Pennsylvania Electric Co. 4.30% 1/15/20291 | 200 | 191 | ||
FirstEnergy Transmission, LLC 2.866% 9/15/20281 | 5,525 | 5,009 | ||
Florida Power & Light Co. 2.45% 2/3/2032 | 24 | 20 | ||
Florida Power & Light Co. 4.80% 5/15/2033 | 2,374 | 2,306 | ||
Florida Power & Light Co. 5.30% 6/15/2034 | 7,765 | 7,795 | ||
Florida Power & Light Co. 5.60% 6/15/2054 | 2,212 | 2,228 | ||
Georgia Power Co. 4.95% 5/17/2033 | 1,475 | 1,436 | ||
Georgia Power Co. 5.25% 3/15/2034 | 8,671 | 8,616 | ||
Jersey Central Power & Light Co. 4.30% 1/15/20261 | 1,085 | 1,063 | ||
Jersey Central Power & Light Co. 2.75% 3/1/20321 | 250 | 206 | ||
MidAmerican Energy Co. 3.15% 4/15/2050 | 1,833 | 1,223 | ||
Mid-Atlantic Interstate Transmission, LLC 4.10% 5/15/20281 | 3,000 | 2,872 | ||
NiSource, Inc. 5.40% 6/30/2033 | 1,000 | 987 | ||
Northern States Power Co. 2.25% 4/1/2031 | 845 | 706 | ||
Northern States Power Co. 2.90% 3/1/2050 | 25 | 16 | ||
Northern States Power Co. 2.60% 6/1/2051 | 359 | 214 | ||
Northern States Power Co. 4.50% 6/1/2052 | 1,610 | 1,362 | ||
Northern States Power Co. 5.10% 5/15/2053 | 738 | 684 | ||
Northern States Power Co. 5.40% 3/15/2054 | 624 | 605 | ||
Pacific Gas and Electric Co. 3.15% 1/1/2026 | 2,217 | 2,131 | ||
Pacific Gas and Electric Co. 2.95% 3/1/2026 | 353 | 337 | ||
Pacific Gas and Electric Co. 2.10% 8/1/2027 | 1,252 | 1,129 | ||
Pacific Gas and Electric Co. 3.00% 6/15/2028 | 11,167 | 10,187 | ||
Pacific Gas and Electric Co. 3.75% 7/1/2028 | 4,007 | 3,734 | ||
Pacific Gas and Electric Co. 4.65% 8/1/2028 | 1,442 | 1,388 | ||
Pacific Gas and Electric Co. 4.55% 7/1/2030 | 1,526 | 1,441 | ||
Pacific Gas and Electric Co. 2.50% 2/1/2031 | 4,209 | 3,470 | ||
Pacific Gas and Electric Co. 4.40% 3/1/2032 | 3,581 | 3,272 | ||
5 | American Funds Corporate Bond Fund |
Bonds, notes & other debt instruments (continued) | Principal amount (000) | Value (000) | ||
Corporate bonds, notes & loans (continued) | ||||
Utilities (continued) | ||||
Pacific Gas and Electric Co. 5.90% 6/15/2032 | USD791 | $797 | ||
Pacific Gas and Electric Co. 6.15% 1/15/2033 | 1,101 | 1,124 | ||
Pacific Gas and Electric Co. 6.40% 6/15/2033 | 4,134 | 4,294 | ||
Pacific Gas and Electric Co. 5.80% 5/15/2034 | 2,921 | 2,916 | ||
Pacific Gas and Electric Co. 4.95% 7/1/2050 | 3,899 | 3,257 | ||
Pacific Gas and Electric Co. 3.50% 8/1/2050 | 1,158 | 765 | ||
PacifiCorp 2.70% 9/15/2030 | 4,000 | 3,431 | ||
PacifiCorp 5.30% 2/15/2031 | 4,640 | 4,590 | ||
PacifiCorp 5.45% 2/15/2034 | 5,205 | 5,091 | ||
PacifiCorp 3.30% 3/15/2051 | 175 | 112 | ||
PacifiCorp 2.90% 6/15/2052 | 4,565 | 2,658 | ||
PacifiCorp 5.35% 12/1/2053 | 1,635 | 1,466 | ||
PacifiCorp 5.50% 5/15/2054 | 2,923 | 2,678 | ||
PacifiCorp 5.80% 1/15/2055 | 5,952 | 5,672 | ||
Progress Energy, Inc. 7.00% 10/30/2031 | 988 | 1,083 | ||
Public Service Company of Colorado 1.90% 1/15/2031 | 605 | 490 | ||
Public Service Company of Colorado 5.35% 5/15/2034 | 5,702 | 5,655 | ||
Public Service Company of Colorado 4.10% 6/15/2048 | 806 | 615 | ||
Public Service Company of Colorado 3.20% 3/1/2050 | 1,236 | 818 | ||
Public Service Company of Colorado 2.70% 1/15/2051 | 2,875 | 1,680 | ||
Public Service Company of Colorado 5.25% 4/1/2053 | 1,010 | 928 | ||
Public Service Company of Colorado 5.75% 5/15/2054 | 1,825 | 1,816 | ||
Public Service Electric and Gas Co. 3.10% 3/15/2032 | 26 | 22 | ||
Public Service Electric and Gas Co. 5.20% 3/1/2034 | 245 | 244 | ||
Southern California Edison Co. 3.65% 3/1/2028 | 1,521 | 1,437 | ||
Southern California Edison Co. 5.30% 3/1/2028 | 190 | 190 | ||
Southern California Edison Co. 5.65% 10/1/2028 | 3,360 | 3,416 | ||
Southern California Edison Co. 2.25% 6/1/2030 | 1,000 | 842 | ||
Southern California Edison Co. 2.50% 6/1/2031 | 5,000 | 4,174 | ||
Southern California Edison Co. 5.45% 6/1/2031 | 3,900 | 3,915 | ||
Southern California Edison Co. 5.20% 6/1/2034 | 14,980 | 14,592 | ||
Southern California Edison Co. 3.60% 2/1/2045 | 1,180 | 868 | ||
Southern California Edison Co. 3.65% 2/1/2050 | 684 | 489 | ||
Southern California Edison Co. 2.95% 2/1/2051 | 5,911 | 3,690 | ||
Southern California Edison Co. 3.45% 2/1/2052 | 1,447 | 987 | ||
Southwestern Electric Power Co. 3.25% 11/1/2051 | 2,025 | 1,293 | ||
WEC Energy Group, Inc. 5.15% 10/1/2027 | 25 | 25 | ||
Wisconsin Power and Light Co. 1.95% 9/16/2031 | 775 | 618 | ||
Xcel Energy, Inc. 4.00% 6/15/2028 | 1,000 | 952 | ||
Xcel Energy, Inc. 3.40% 6/1/2030 | 1,000 | 896 | ||
Xcel Energy, Inc. 2.35% 11/15/2031 | 4,929 | 3,958 | ||
Xcel Energy, Inc. 4.60% 6/1/2032 | 10 | 9 | ||
Xcel Energy, Inc. 5.45% 8/15/2033 | 3,525 | 3,463 | ||
Xcel Energy, Inc. 5.50% 3/15/2034 | 7,308 | 7,194 | ||
Xcel Energy, Inc. 3.50% 12/1/2049 | 1,783 | 1,218 | ||
243,061 | ||||
Industrials 8.45% | ||||
BAE Systems PLC 5.00% 3/26/20271 | 1,000 | 991 | ||
BAE Systems PLC 5.125% 3/26/20291 | 611 | 606 | ||
BAE Systems PLC 5.25% 3/26/20311 | 352 | 349 | ||
BAE Systems PLC 5.30% 3/26/20341 | 663 | 653 | ||
Boeing Co. 4.875% 5/1/2025 | 783 | 775 | ||
Boeing Co. 2.75% 2/1/2026 | 16,088 | 15,232 | ||
Boeing Co. 2.196% 2/4/2026 | 2,250 | 2,113 | ||
Boeing Co. 2.70% 2/1/2027 | 505 | 464 | ||
Boeing Co. 5.04% 5/1/2027 | 336 | 328 | ||
Boeing Co. 3.25% 2/1/2028 | 11,627 | 10,599 | ||
Boeing Co. 6.298% 5/1/20291 | 208 | 210 | ||
Boeing Co. 5.15% 5/1/2030 | 4,346 | 4,149 | ||
Boeing Co. 3.625% 2/1/2031 | 129 | 112 | ||
Boeing Co. 6.388% 5/1/20311 | 2,022 | 2,046 | ||
Boeing Co. 6.528% 5/1/20341 | 2,576 | 2,613 | ||
Boeing Co. 5.705% 5/1/2040 | 1,551 | 1,426 | ||
Boeing Co. 5.805% 5/1/2050 | 2,958 | 2,651 | ||
Boeing Co. 6.858% 5/1/20541 | 2,212 | 2,245 | ||
Boeing Co. 5.93% 5/1/2060 | 2,430 | 2,145 | ||
American Funds Corporate Bond Fund | 6 |
Bonds, notes & other debt instruments (continued) | Principal amount (000) | Value (000) | ||
Corporate bonds, notes & loans (continued) | ||||
Industrials (continued) | ||||
Boeing Co. 7.008% 5/1/20641 | USD268 | $270 | ||
Burlington Northern Santa Fe, LLC 3.05% 2/15/2051 | 2,000 | 1,318 | ||
Burlington Northern Santa Fe, LLC 3.30% 9/15/2051 | 227 | 157 | ||
Canadian National Railway Co. 5.85% 11/1/2033 | 400 | 422 | ||
Canadian National Railway Co. 6.125% 11/1/2053 | 871 | 964 | ||
Canadian Pacific Railway Co. 1.75% 12/2/2026 | 2,456 | 2,256 | ||
Canadian Pacific Railway Co. 3.10% 12/2/2051 | 5,351 | 3,550 | ||
Carrier Global Corp. 2.242% 2/15/2025 | 191 | 186 | ||
Carrier Global Corp. 5.80% 11/30/2025 | 250 | 251 | ||
Carrier Global Corp. 2.493% 2/15/2027 | 50 | 47 | ||
Carrier Global Corp. 2.722% 2/15/2030 | 1,048 | 920 | ||
Carrier Global Corp. 2.70% 2/15/2031 | 60 | 51 | ||
Carrier Global Corp. 5.90% 3/15/2034 | 1,768 | 1,838 | ||
Carrier Global Corp. 3.377% 4/5/2040 | 119 | 92 | ||
Carrier Global Corp. 3.577% 4/5/2050 | 148 | 108 | ||
Carrier Global Corp. 6.20% 3/15/2054 | 800 | 859 | ||
CSX Corp. 3.80% 3/1/2028 | 1,559 | 1,499 | ||
CSX Corp. 4.25% 3/15/2029 | 1,000 | 969 | ||
CSX Corp. 4.10% 11/15/2032 | 389 | 362 | ||
CSX Corp. 5.20% 11/15/2033 | 275 | 275 | ||
CSX Corp. 3.35% 9/15/2049 | 1,015 | 713 | ||
CSX Corp. 2.50% 5/15/2051 | 2,079 | 1,226 | ||
CSX Corp. 4.50% 11/15/2052 | 350 | 299 | ||
General Dynamics Corp. 1.15% 6/1/2026 | 1,140 | 1,054 | ||
General Dynamics Corp. 3.75% 5/15/2028 | 703 | 675 | ||
General Dynamics Corp. 3.625% 4/1/2030 | 969 | 902 | ||
General Dynamics Corp. 2.25% 6/1/2031 | 203 | 170 | ||
Honeywell International, Inc. 2.30% 8/15/2024 | 80 | 79 | ||
Honeywell International, Inc. 1.35% 6/1/2025 | 124 | 119 | ||
Honeywell International, Inc. 4.875% 9/1/2029 | 250 | 250 | ||
Honeywell International, Inc. 1.95% 6/1/2030 | 1,935 | 1,639 | ||
Honeywell International, Inc. 4.95% 9/1/2031 | 250 | 249 | ||
Honeywell International, Inc. 5.00% 3/1/2035 | 4,560 | 4,501 | ||
Honeywell International, Inc. 5.25% 3/1/2054 | 1,270 | 1,232 | ||
Honeywell International, Inc. 5.35% 3/1/2064 | 250 | 243 | ||
Ingersoll-Rand, Inc. 5.197% 6/15/2027 | 250 | 250 | ||
Ingersoll-Rand, Inc. 5.40% 8/14/2028 | 946 | 954 | ||
Ingersoll-Rand, Inc. 5.176% 6/15/2029 | 550 | 549 | ||
Ingersoll-Rand, Inc. 5.314% 6/15/2031 | 199 | 199 | ||
Ingersoll-Rand, Inc. 5.70% 8/14/2033 | 479 | 488 | ||
Ingersoll-Rand, Inc. 5.45% 6/15/2034 | 1,563 | 1,567 | ||
Ingersoll-Rand, Inc. 5.70% 6/15/2054 | 500 | 506 | ||
L3Harris Technologies, Inc. 5.40% 7/31/2033 | 2,124 | 2,108 | ||
Lockheed Martin Corp. 5.10% 11/15/2027 | 856 | 861 | ||
Lockheed Martin Corp. 4.50% 2/15/2029 | 6,646 | 6,523 | ||
Lockheed Martin Corp. 1.85% 6/15/2030 | 176 | 147 | ||
Lockheed Martin Corp. 5.25% 1/15/2033 | 3,509 | 3,557 | ||
Lockheed Martin Corp. 4.75% 2/15/2034 | 304 | 295 | ||
Lockheed Martin Corp. 4.80% 8/15/2034 | 6,756 | 6,575 | ||
Lockheed Martin Corp. 5.70% 11/15/2054 | 501 | 515 | ||
Lockheed Martin Corp. 5.90% 11/15/2063 | 236 | 249 | ||
Lockheed Martin Corp. 5.20% 2/15/2064 | 2,190 | 2,065 | ||
Norfolk Southern Corp. 5.05% 8/1/2030 | 4,576 | 4,554 | ||
Norfolk Southern Corp. 4.45% 3/1/2033 | 245 | 231 | ||
Norfolk Southern Corp. 5.35% 8/1/2054 | 3,366 | 3,204 | ||
Northrop Grumman Corp. 4.70% 3/15/2033 | 8,330 | 8,016 | ||
Northrop Grumman Corp. 4.95% 3/15/2053 | 3,195 | 2,892 | ||
RTX Corp. 5.00% 2/27/2026 | 165 | 164 | ||
RTX Corp. 5.75% 11/8/2026 | 1,000 | 1,010 | ||
RTX Corp. 4.125% 11/16/2028 | 475 | 455 | ||
RTX Corp. 5.75% 1/15/2029 | 500 | 513 | ||
RTX Corp. 6.00% 3/15/2031 | 531 | 552 | ||
RTX Corp. 1.90% 9/1/2031 | 219 | 174 | ||
RTX Corp. 5.15% 2/27/2033 | 573 | 564 | ||
RTX Corp. 6.10% 3/15/2034 | 2,753 | 2,883 | ||
RTX Corp. 2.82% 9/1/2051 | 750 | 458 | ||
RTX Corp. 3.03% 3/15/2052 | 3,000 | 1,910 | ||
7 | American Funds Corporate Bond Fund |
Bonds, notes & other debt instruments (continued) | Principal amount (000) | Value (000) | ||
Corporate bonds, notes & loans (continued) | ||||
Industrials (continued) | ||||
RTX Corp. 5.375% 2/27/2053 | USD129 | $123 | ||
RTX Corp. 6.40% 3/15/2054 | 1,730 | 1,888 | ||
Union Pacific Corp. 4.75% 2/21/2026 | 5,000 | 4,969 | ||
Union Pacific Corp. 2.80% 2/14/2032 | 1,512 | 1,295 | ||
Union Pacific Corp. 3.375% 2/14/2042 | 530 | 409 | ||
Union Pacific Corp. 4.30% 3/1/2049 | 510 | 425 | ||
Union Pacific Corp. 3.25% 2/5/2050 | 1,851 | 1,288 | ||
Union Pacific Corp. 2.95% 3/10/2052 | 2,503 | 1,616 | ||
Union Pacific Corp. 3.50% 2/14/2053 | 1,910 | 1,372 | ||
Union Pacific Corp. 3.95% 8/15/2059 | 175 | 132 | ||
Veralto Corp. 5.35% 9/18/20281 | 750 | 751 | ||
Veralto Corp. 5.45% 9/18/20331 | 2,000 | 1,982 | ||
Waste Management, Inc. 4.625% 2/15/2030 | 4,000 | 3,920 | ||
Waste Management, Inc. 1.50% 3/15/2031 | 616 | 492 | ||
155,102 | ||||
Consumer staples 5.41% | ||||
7-Eleven, Inc. 0.95% 2/10/20261 | 2,244 | 2,082 | ||
7-Eleven, Inc. 1.30% 2/10/20281 | 1,260 | 1,094 | ||
7-Eleven, Inc. 1.80% 2/10/20311 | 2,661 | 2,124 | ||
7-Eleven, Inc. 2.80% 2/10/20511 | 762 | 456 | ||
Altria Group, Inc. 3.70% 2/4/2051 | 1,320 | 891 | ||
Anheuser-Busch Companies, LLC 4.70% 2/1/2036 | 2,100 | 1,984 | ||
Anheuser-Busch Companies, LLC 4.90% 2/1/2046 | 2,493 | 2,291 | ||
Anheuser-Busch InBev Worldwide, Inc. 4.75% 1/23/2029 | 2,000 | 1,987 | ||
Anheuser-Busch InBev Worldwide, Inc. 3.50% 6/1/2030 | 2,166 | 2,001 | ||
Anheuser-Busch InBev Worldwide, Inc. 4.439% 10/6/2048 | 280 | 239 | ||
Anheuser-Busch InBev Worldwide, Inc. 5.55% 1/23/2049 | 589 | 590 | ||
BAT Capital Corp. 2.789% 9/6/2024 | 600 | 595 | ||
BAT Capital Corp. 3.215% 9/6/2026 | 470 | 448 | ||
BAT Capital Corp. 2.259% 3/25/2028 | 499 | 445 | ||
BAT Capital Corp. 6.421% 8/2/2033 | 3,878 | 4,052 | ||
BAT Capital Corp. 7.079% 8/2/2043 | 1,306 | 1,397 | ||
BAT Capital Corp. 5.65% 3/16/2052 | 680 | 612 | ||
BAT Capital Corp. 7.081% 8/2/2053 | 5,056 | 5,445 | ||
BAT International Finance PLC 4.448% 3/16/2028 | 475 | 459 | ||
Campbell Soup Co. 5.20% 3/21/2029 | 851 | 847 | ||
Campbell Soup Co. 5.40% 3/21/2034 | 560 | 554 | ||
Coca-Cola Co. 5.00% 5/13/2034 | 7,036 | 7,016 | ||
Coca-Cola Co. 5.30% 5/13/2054 | 333 | 328 | ||
Coca-Cola Consolidated, Inc. 5.45% 6/1/2034 | 3,216 | 3,236 | ||
Conagra Brands, Inc. 4.60% 11/1/2025 | 720 | 711 | ||
Conagra Brands, Inc. 1.375% 11/1/2027 | 1,510 | 1,322 | ||
Conagra Brands, Inc. 5.30% 11/1/2038 | 371 | 348 | ||
Conagra Brands, Inc. 5.40% 11/1/2048 | 226 | 208 | ||
Constellation Brands, Inc. 4.35% 5/9/2027 | 1,000 | 976 | ||
Constellation Brands, Inc. 3.60% 2/15/2028 | 200 | 189 | ||
Constellation Brands, Inc. 4.80% 1/15/2029 | 2,680 | 2,634 | ||
Constellation Brands, Inc. 2.875% 5/1/2030 | 2,262 | 1,979 | ||
Constellation Brands, Inc. 2.25% 8/1/2031 | 3,083 | 2,518 | ||
Constellation Brands, Inc. 4.75% 5/9/2032 | 1,780 | 1,705 | ||
Constellation Brands, Inc. 4.90% 5/1/2033 | 3,846 | 3,699 | ||
Constellation Brands, Inc. 4.10% 2/15/2048 | 200 | 158 | ||
J. M. Smucker Co. (The) 6.20% 11/15/2033 | 556 | 581 | ||
J. M. Smucker Co. (The) 6.50% 11/15/2043 | 289 | 305 | ||
J. M. Smucker Co. (The) 6.50% 11/15/2053 | 786 | 843 | ||
PepsiCo, Inc. 1.95% 10/21/2031 | 2,563 | 2,096 | ||
PepsiCo, Inc. 3.625% 3/19/2050 | 140 | 106 | ||
PepsiCo, Inc. 2.75% 10/21/2051 | 310 | 196 | ||
Philip Morris International, Inc. 4.875% 2/13/2026 | 5,000 | 4,969 | ||
Philip Morris International, Inc. 5.25% 9/7/2028 | 3,000 | 3,014 | ||
Philip Morris International, Inc. 5.625% 11/17/2029 | 1,028 | 1,048 | ||
Philip Morris International, Inc. 2.10% 5/1/2030 | 1,167 | 983 | ||
Philip Morris International, Inc. 5.50% 9/7/2030 | 3,000 | 3,031 | ||
Philip Morris International, Inc. 1.75% 11/1/2030 | 908 | 735 | ||
Philip Morris International, Inc. 5.75% 11/17/2032 | 5,214 | 5,324 | ||
Philip Morris International, Inc. 5.375% 2/15/2033 | 4,300 | 4,267 | ||
American Funds Corporate Bond Fund | 8 |
Bonds, notes & other debt instruments (continued) | Principal amount (000) | Value (000) | ||
Corporate bonds, notes & loans (continued) | ||||
Consumer staples (continued) | ||||
Philip Morris International, Inc. 5.625% 9/7/2033 | USD2,600 | $2,623 | ||
Philip Morris International, Inc. 5.25% 2/13/2034 | 1,343 | 1,316 | ||
Procter & Gamble Co. 0.55% 10/29/2025 | 932 | 876 | ||
Procter & Gamble Co. 1.00% 4/23/2026 | 342 | 318 | ||
Procter & Gamble Co. 3.95% 1/26/2028 | 1,881 | 1,839 | ||
Procter & Gamble Co. 3.00% 3/25/2030 | 152 | 139 | ||
Procter & Gamble Co. 1.20% 10/29/2030 | 1,000 | 806 | ||
Reynolds American, Inc. 4.45% 6/12/2025 | 225 | 222 | ||
Walmart, Inc. 4.10% 4/15/2033 | 2,394 | 2,270 | ||
Walmart, Inc. 4.50% 4/15/2053 | 4,326 | 3,815 | ||
99,342 | ||||
Communication services 5.27% | ||||
AT&T, Inc. 1.65% 2/1/2028 | 1,092 | 965 | ||
AT&T, Inc. 4.35% 3/1/2029 | 2,500 | 2,413 | ||
AT&T, Inc. 2.25% 2/1/2032 | 8,711 | 7,027 | ||
AT&T, Inc. 2.55% 12/1/2033 | 3,437 | 2,712 | ||
AT&T, Inc. 5.40% 2/15/2034 | 1,020 | 1,013 | ||
AT&T, Inc. 3.50% 9/15/2053 | 4,945 | 3,342 | ||
AT&T, Inc. 3.55% 9/15/2055 | 780 | 524 | ||
Charter Communications Operating, LLC 2.80% 4/1/2031 | 3,700 | 3,021 | ||
Charter Communications Operating, LLC 2.30% 2/1/2032 | 1,800 | 1,381 | ||
Charter Communications Operating, LLC 4.40% 4/1/2033 | 2,805 | 2,466 | ||
Charter Communications Operating, LLC 5.125% 7/1/2049 | 315 | 242 | ||
Charter Communications Operating, LLC 3.70% 4/1/2051 | 4,890 | 2,996 | ||
Charter Communications Operating, LLC 3.90% 6/1/2052 | 980 | 616 | ||
Charter Communications Operating, LLC 5.25% 4/1/2053 | 4,100 | 3,235 | ||
Comcast Corp. 1.95% 1/15/2031 | 2,044 | 1,677 | ||
Comcast Corp. 4.80% 5/15/2033 | 2,533 | 2,450 | ||
Comcast Corp. 5.30% 6/1/2034 | 11,360 | 11,355 | ||
Comcast Corp. 2.887% 11/1/2051 | 2,786 | 1,734 | ||
Comcast Corp. 5.35% 5/15/2053 | 310 | 295 | ||
Comcast Corp. 5.65% 6/1/2054 | 3,586 | 3,560 | ||
Netflix, Inc. 5.875% 11/15/2028 | 3,163 | 3,255 | ||
Netflix, Inc. 5.375% 11/15/20291 | 4,878 | 4,912 | ||
Netflix, Inc. 4.875% 6/15/20301 | 191 | 187 | ||
T-Mobile USA, Inc. 1.50% 2/15/2026 | 1,200 | 1,123 | ||
T-Mobile USA, Inc. 2.625% 4/15/2026 | 125 | 119 | ||
T-Mobile USA, Inc. 3.75% 4/15/2027 | 1,200 | 1,151 | ||
T-Mobile USA, Inc. 2.55% 2/15/2031 | 3,779 | 3,188 | ||
T-Mobile USA, Inc. 2.25% 11/15/2031 | 3,956 | 3,210 | ||
T-Mobile USA, Inc. 5.05% 7/15/2033 | 5,612 | 5,466 | ||
T-Mobile USA, Inc. 5.15% 4/15/2034 | 4,920 | 4,821 | ||
T-Mobile USA, Inc. 3.00% 2/15/2041 | 823 | 591 | ||
T-Mobile USA, Inc. 3.40% 10/15/2052 | 5,864 | 3,991 | ||
T-Mobile USA, Inc. 5.50% 1/15/2055 | 572 | 549 | ||
Verizon Communications, Inc. 1.68% 10/30/2030 | 250 | 202 | ||
Verizon Communications, Inc. 1.75% 1/20/2031 | 550 | 442 | ||
Verizon Communications, Inc. 2.55% 3/21/2031 | 621 | 524 | ||
Verizon Communications, Inc. 2.355% 3/15/2032 | 232 | 188 | ||
Verizon Communications, Inc. 2.65% 11/20/2040 | 5,823 | 4,014 | ||
Verizon Communications, Inc. 3.40% 3/22/2041 | 700 | 536 | ||
Verizon Communications, Inc. 2.85% 9/3/2041 | 18 | 13 | ||
Verizon Communications, Inc. 3.85% 11/1/2042 | 206 | 164 | ||
Verizon Communications, Inc. 2.875% 11/20/2050 | 336 | 212 | ||
Verizon Communications, Inc. 3.55% 3/22/2051 | 900 | 644 | ||
Verizon Communications, Inc. 5.50% 2/23/2054 | 136 | 133 | ||
Verizon Communications, Inc. 2.987% 10/30/2056 | 4,447 | 2,714 | ||
Vodafone Group PLC 4.25% 9/17/2050 | 1,000 | 784 | ||
WarnerMedia Holdings, Inc. 5.141% 3/15/2052 | 900 | 711 | ||
96,868 | ||||
Energy 4.57% | ||||
BP Capital Markets America, Inc. 2.721% 1/12/2032 | 2,250 | 1,909 | ||
BP Capital Markets America, Inc. 4.893% 9/11/2033 | 13,489 | 13,102 | ||
BP Capital Markets America, Inc. 3.001% 3/17/2052 | 2,000 | 1,293 | ||
Canadian Natural Resources, Ltd. 2.05% 7/15/2025 | 397 | 381 | ||
9 | American Funds Corporate Bond Fund |
Bonds, notes & other debt instruments (continued) | Principal amount (000) | Value (000) | ||
Corporate bonds, notes & loans (continued) | ||||
Energy (continued) | ||||
Chevron Corp. 2.236% 5/11/2030 | USD4,250 | $3,663 | ||
Chevron Corp. 3.078% 5/11/2050 | 2,300 | 1,563 | ||
Chevron USA, Inc. 1.018% 8/12/2027 | 5,000 | 4,426 | ||
ConocoPhillips Co. 3.80% 3/15/2052 | 2,130 | 1,592 | ||
ConocoPhillips Co. 5.30% 5/15/2053 | 2,747 | 2,608 | ||
ConocoPhillips Co. 5.55% 3/15/2054 | 2,290 | 2,257 | ||
Diamondback Energy, Inc. 5.15% 1/30/2030 | 266 | 264 | ||
Diamondback Energy, Inc. 5.40% 4/18/2034 | 2,889 | 2,849 | ||
Diamondback Energy, Inc. 5.75% 4/18/2054 | 1,614 | 1,557 | ||
Enbridge, Inc. 6.70% 11/15/2053 | 1,110 | 1,217 | ||
Eni SpA 5.50% 5/15/20341 | 2,421 | 2,406 | ||
Eni SpA 5.95% 5/15/20541 | 1,904 | 1,884 | ||
Exxon Mobil Corp. 2.61% 10/15/2030 | 500 | 437 | ||
Exxon Mobil Corp. 3.452% 4/15/2051 | 5,165 | 3,730 | ||
Kinder Morgan, Inc. 5.40% 2/1/2034 | 5,265 | 5,154 | ||
ONEOK, Inc. 6.05% 9/1/2033 | 1,728 | 1,770 | ||
Petroleos Mexicanos 6.84% 1/23/2030 | 2,601 | 2,307 | ||
Petroleos Mexicanos 6.875% 10/16/2025 | 1,468 | 1,455 | ||
Petroleos Mexicanos 4.50% 1/23/2026 | 2,901 | 2,743 | ||
Petroleos Mexicanos 6.875% 8/4/2026 | 1,539 | 1,500 | ||
Petroleos Mexicanos 6.50% 3/13/2027 | 5,120 | 4,847 | ||
Schlumberger Investment SA 5.00% 6/1/2034 | 2,000 | 1,962 | ||
Shell International Finance BV 2.75% 4/6/2030 | 5,000 | 4,441 | ||
Shell International Finance BV 3.00% 11/26/2051 | 2,970 | 1,937 | ||
TotalEnergies Capital SA 5.15% 4/5/2034 | 937 | 935 | ||
TotalEnergies Capital SA 5.488% 4/5/2054 | 1,500 | 1,484 | ||
Williams Companies, Inc. 5.15% 3/15/2034 | 6,438 | 6,252 | ||
83,925 | ||||
Information technology 4.17% | ||||
Analog Devices, Inc. 2.10% 10/1/2031 | 309 | 254 | ||
Analog Devices, Inc. 5.05% 4/1/2034 | 2,436 | 2,422 | ||
Analog Devices, Inc. 2.95% 10/1/2051 | 596 | 389 | ||
Analog Devices, Inc. 5.30% 4/1/2054 | 1,751 | 1,706 | ||
Broadcom Corp. 3.875% 1/15/2027 | 1,090 | 1,053 | ||
Broadcom, Inc. 4.00% 4/15/20291 | 585 | 554 | ||
Broadcom, Inc. 4.75% 4/15/2029 | 1,400 | 1,374 | ||
Broadcom, Inc. 4.15% 11/15/2030 | 715 | 670 | ||
Broadcom, Inc. 3.419% 4/15/20331 | 812 | 694 | ||
Broadcom, Inc. 3.469% 4/15/20341 | 6,255 | 5,275 | ||
Broadcom, Inc. 3.137% 11/15/20351 | 380 | 302 | ||
Cisco Systems, Inc. 4.85% 2/26/2029 | 4,840 | 4,827 | ||
Cisco Systems, Inc. 4.95% 2/26/2031 | 8,101 | 8,058 | ||
Cisco Systems, Inc. 5.05% 2/26/2034 | 14,836 | 14,750 | ||
Cisco Systems, Inc. 5.30% 2/26/2054 | 1,516 | 1,488 | ||
Microchip Technology, Inc. 5.05% 3/15/2029 | 11,825 | 11,725 | ||
ServiceNow, Inc. 1.40% 9/1/2030 | 18,798 | 15,136 | ||
Texas Instruments, Inc. 4.60% 2/8/2029 | 1,146 | 1,135 | ||
Texas Instruments, Inc. 4.85% 2/8/2034 | 4,845 | 4,773 | ||
76,585 | ||||
Consumer discretionary 2.87% | ||||
Amazon.com, Inc. 2.875% 5/12/2041 | 434 | 321 | ||
American Honda Finance Corp. 1.20% 7/8/2025 | 3,818 | 3,648 | ||
BMW US Capital, LLC 2.55% 4/1/20311 | 534 | 456 | ||
Daimler Trucks Finance North America, LLC 3.65% 4/7/20271 | 825 | 790 | ||
Daimler Trucks Finance North America, LLC 5.125% 1/19/20281 | 256 | 254 | ||
Daimler Trucks Finance North America, LLC 2.375% 12/14/20281 | 1,000 | 885 | ||
Daimler Trucks Finance North America, LLC 5.375% 1/18/20341 | 466 | 462 | ||
Ford Motor Co. 3.25% 2/12/2032 | 1,260 | 1,036 | ||
Ford Motor Co. 6.10% 8/19/2032 | 740 | 738 | ||
Ford Motor Credit Co., LLC 3.375% 11/13/2025 | 200 | 193 | ||
Ford Motor Credit Co., LLC 6.95% 3/6/2026 | 400 | 407 | ||
Ford Motor Credit Co., LLC 6.95% 6/10/2026 | 200 | 204 | ||
Ford Motor Credit Co., LLC 4.95% 5/28/2027 | 725 | 707 | ||
Ford Motor Credit Co., LLC 7.35% 11/4/2027 | 200 | 208 | ||
Ford Motor Credit Co., LLC 6.80% 5/12/2028 | 400 | 412 | ||
American Funds Corporate Bond Fund | 10 |
Bonds, notes & other debt instruments (continued) | Principal amount (000) | Value (000) | ||
Corporate bonds, notes & loans (continued) | ||||
Consumer discretionary (continued) | ||||
Ford Motor Credit Co., LLC 6.798% 11/7/2028 | USD1,967 | $2,032 | ||
Ford Motor Credit Co., LLC 2.90% 2/10/2029 | 200 | 175 | ||
Ford Motor Credit Co., LLC 5.80% 3/8/2029 | 4,695 | 4,670 | ||
Ford Motor Credit Co., LLC 5.113% 5/3/2029 | 4,025 | 3,879 | ||
Ford Motor Credit Co., LLC 7.35% 3/6/2030 | 200 | 211 | ||
Ford Motor Credit Co., LLC 7.20% 6/10/2030 | 530 | 555 | ||
Ford Motor Credit Co., LLC 4.00% 11/13/2030 | 530 | 470 | ||
Ford Motor Credit Co., LLC 6.05% 3/5/2031 | 2,300 | 2,291 | ||
Ford Motor Credit Co., LLC 7.122% 11/7/2033 | 1,214 | 1,281 | ||
Ford Motor Credit Co., LLC 6.125% 3/8/2034 | 2,600 | 2,569 | ||
Home Depot, Inc. 1.375% 3/15/2031 | 517 | 409 | ||
Home Depot, Inc. 3.125% 12/15/2049 | 593 | 401 | ||
Hyundai Capital America 1.80% 10/15/20251 | 774 | 735 | ||
Hyundai Capital America 1.50% 6/15/20261 | 1,866 | 1,718 | ||
Hyundai Capital America 5.60% 3/30/20281 | 800 | 802 | ||
Hyundai Capital America 2.00% 6/15/20281 | 409 | 358 | ||
Hyundai Capital America 5.30% 1/8/20291 | 509 | 505 | ||
Hyundai Capital America 6.50% 1/16/20291 | 384 | 399 | ||
Hyundai Capital America 5.35% 3/19/20291 | 700 | 695 | ||
Hyundai Capital America 5.40% 1/8/20311 | 117 | 116 | ||
McDonald’s Corp. 5.00% 5/17/2029 | 3,025 | 3,019 | ||
McDonald’s Corp. 3.60% 7/1/2030 | 752 | 693 | ||
McDonald’s Corp. 4.95% 8/14/2033 | 343 | 337 | ||
McDonald’s Corp. 5.20% 5/17/2034 | 2,864 | 2,844 | ||
McDonald’s Corp. 5.15% 9/9/2052 | 2,010 | 1,866 | ||
Morongo Band of Mission Indians (The) 7.00% 10/1/20391 | 1,100 | 1,153 | ||
Stellantis Finance US, Inc. 5.625% 1/12/20281 | 3,358 | 3,397 | ||
Stellantis Finance US, Inc. 2.691% 9/15/20311 | 3,600 | 2,996 | ||
Toyota Motor Credit Corp. 4.55% 5/17/2030 | 1,400 | 1,364 | ||
52,661 | ||||
Real estate 2.85% | ||||
Boston Properties, LP 2.55% 4/1/2032 | 60 | 47 | ||
Boston Properties, LP 2.45% 10/1/2033 | 716 | 530 | ||
Boston Properties, LP 6.50% 1/15/2034 | 2,648 | 2,692 | ||
COPT Defense Properties, LP 2.00% 1/15/2029 | 362 | 307 | ||
COPT Defense Properties, LP 2.75% 4/15/2031 | 620 | 511 | ||
COPT Defense Properties, LP 2.90% 12/1/2033 | 619 | 484 | ||
Crown Castle, Inc. 5.00% 1/11/2028 | 4,351 | 4,283 | ||
Crown Castle, Inc. 5.80% 3/1/2034 | 1,168 | 1,176 | ||
Equinix Europe 2 Financing Corp., LLC 5.50% 6/15/2034 | 2,100 | 2,076 | ||
Equinix, Inc. 2.90% 11/18/2026 | 583 | 548 | ||
Equinix, Inc. 1.80% 7/15/2027 | 470 | 423 | ||
Equinix, Inc. 3.20% 11/18/2029 | 3,314 | 2,970 | ||
Equinix, Inc. 2.15% 7/15/2030 | 2,680 | 2,223 | ||
Invitation Homes Operating Partnership, LP 2.70% 1/15/2034 | 606 | 476 | ||
Kilroy Realty, LP 6.25% 1/15/2036 | 2,930 | 2,814 | ||
Prologis, LP 4.875% 6/15/2028 | 803 | 797 | ||
Prologis, LP 4.75% 6/15/2033 | 4,281 | 4,111 | ||
Prologis, LP 5.125% 1/15/2034 | 459 | 452 | ||
Prologis, LP 5.00% 3/15/2034 | 2,465 | 2,405 | ||
Prologis, LP 5.25% 6/15/2053 | 156 | 147 | ||
Prologis, LP 5.25% 3/15/2054 | 340 | 319 | ||
Public Storage Operating Co. 5.125% 1/15/2029 | 417 | 419 | ||
Public Storage Operating Co. 2.30% 5/1/2031 | 2,632 | 2,196 | ||
Public Storage Operating Co. 5.10% 8/1/2033 | 166 | 164 | ||
Scentre Group Trust 1 3.50% 2/12/20251 | 48 | 47 | ||
VICI Properties, LP 4.375% 5/15/2025 | 770 | 760 | ||
VICI Properties, LP 4.625% 6/15/20251 | 383 | 378 | ||
VICI Properties, LP 4.50% 1/15/20281 | 850 | 814 | ||
VICI Properties, LP 4.75% 2/15/2028 | 6,733 | 6,536 | ||
VICI Properties, LP 4.95% 2/15/2030 | 3,061 | 2,934 | ||
VICI Properties, LP 5.125% 5/15/2032 | 8,813 | 8,334 | ||
52,373 | ||||
11 | American Funds Corporate Bond Fund |
Bonds, notes & other debt instruments (continued) | Principal amount (000) | Value (000) | ||
Corporate bonds, notes & loans (continued) | ||||
Materials 1.34% | ||||
Air Products and Chemicals, Inc. 4.85% 2/8/2034 | USD1,000 | $975 | ||
BHP Billiton Finance (USA), Ltd. 5.10% 9/8/2028 | 375 | 376 | ||
BHP Billiton Finance (USA), Ltd. 5.25% 9/8/2030 | 565 | 569 | ||
BHP Billiton Finance (USA), Ltd. 5.25% 9/8/2033 | 1,921 | 1,911 | ||
BHP Billiton Finance (USA), Ltd. 5.50% 9/8/2053 | 1,390 | 1,374 | ||
Celanese US Holdings, LLC 6.165% 7/15/2027 | 250 | 254 | ||
Celanese US Holdings, LLC 6.35% 11/15/2028 | 673 | 691 | ||
Celanese US Holdings, LLC 6.33% 7/15/2029 | 556 | 571 | ||
Celanese US Holdings, LLC 6.55% 11/15/2030 | 366 | 382 | ||
Celanese US Holdings, LLC 6.379% 7/15/2032 | 1,214 | 1,248 | ||
Celanese US Holdings, LLC 6.70% 11/15/2033 | 564 | 594 | ||
Dow Chemical Co. (The) 4.55% 11/30/2025 | 14 | 14 | ||
Dow Chemical Co. (The) 5.15% 2/15/2034 | 250 | 246 | ||
Dow Chemical Co. (The) 4.625% 10/1/2044 | 600 | 518 | ||
Dow Chemical Co. (The) 4.80% 5/15/2049 | 2,131 | 1,827 | ||
Dow Chemical Co. (The) 3.60% 11/15/2050 | 170 | 120 | ||
Dow Chemical Co. (The) 5.60% 2/15/2054 | 2,228 | 2,153 | ||
Eastman Chemical Co. 5.625% 2/20/2034 | 3,919 | 3,899 | ||
International Flavors & Fragrances, Inc. 3.268% 11/15/20401 | 1,048 | 743 | ||
International Flavors & Fragrances, Inc. 3.468% 12/1/20501 | 776 | 509 | ||
Linde, Inc. 1.10% 8/10/2030 | 1,512 | 1,211 | ||
Linde, Inc. 2.00% 8/10/2050 | 703 | 382 | ||
OCI NV 6.70% 3/16/20331 | 2,576 | 2,549 | ||
Sherwin-Williams Co. 3.125% 6/1/2024 | 700 | 700 | ||
Sherwin-Williams Co. 3.30% 5/15/2050 | 1,050 | 723 | ||
24,539 | ||||
Total corporate bonds, notes & loans | 1,542,015 | |||
U.S. Treasury bonds & notes 8.27% | ||||
U.S. Treasury 8.27% | ||||
U.S. Treasury 4.625% 2/28/2026 | 45 | 45 | ||
U.S. Treasury 4.875% 5/31/2026 | 2,176 | 2,176 | ||
U.S. Treasury 4.50% 5/15/2027 | 5,774 | 5,747 | ||
U.S. Treasury 4.25% 2/28/2029 | 20 | 20 | ||
U.S. Treasury 4.50% 5/31/2029 | 56,792 | 56,794 | ||
U.S. Treasury 4.125% 3/31/2031 | 10 | 10 | ||
U.S. Treasury 4.625% 5/31/2031 | 70 | 70 | ||
U.S. Treasury 4.00% 2/15/2034 | 50 | 48 | ||
U.S. Treasury 4.375% 5/15/2034 | 21,867 | 21,664 | ||
U.S. Treasury 4.25% 5/15/2039 | 32 | 31 | ||
U.S. Treasury 1.75% 8/15/20415 | 115 | 75 | ||
U.S. Treasury 4.625% 5/15/20445 | 41,574 | 41,100 | ||
U.S. Treasury 4.00% 11/15/2052 | 2 | 2 | ||
U.S. Treasury 4.75% 11/15/2053 | 78 | 79 | ||
U.S. Treasury 4.25% 2/15/2054 | 25,673 | 24,067 | ||
151,928 | ||||
Asset-backed obligations 0.93% | ||||
Castlelake Aircraft Securitization Trust, Series 2021-1, Class A, 2.868% 5/11/20371,6 | 1,826 | 1,605 | ||
CF Hippolyta, LLC, Series 2020-1, Class A1, 1.69% 7/15/20601,6 | 4,236 | 3,999 | ||
CF Hippolyta, LLC, Series 2020-1, Class A2, 1.99% 7/15/20601,6 | 288 | 249 | ||
CF Hippolyta, LLC, Series 2021-1, Class A1, 1.53% 3/15/20611,6 | 394 | 359 | ||
Global SC Finance V SRL, Series 2019-1A, Class B, 4.81% 9/17/20391,6 | 591 | 557 | ||
New Economy Assets Phase 1 Issuer, LLC, Series 2021-1, Class A1, 1.91% 10/20/20611,6 | 11,523 | 10,214 | ||
16,983 | ||||
Municipals 0.21% | ||||
Ohio 0.21% | ||||
Cleveland-Cuyahoga Port Auth., Federal Lease Rev. Bonds (VA Cleveland Health Care Center Project), Series 2021, 4.425% 5/1/2031 | 4,535 | 3,937 | ||
American Funds Corporate Bond Fund | 12 |
Bonds, notes & other debt instruments (continued) | Principal amount (000) | Value (000) | ||
Bonds & notes of governments & government agencies outside the U.S. 0.11% | ||||
Panama (Republic of) 6.875% 1/31/2036 | USD1,515 | $1,465 | ||
Panama (Republic of) 8.00% 3/1/2038 | 575 | 603 | ||
2,068 | ||||
Total bonds, notes & other debt instruments (cost: $1,781,197,000) | 1,716,931 | |||
Short-term securities 5.84% | Shares | |||
Money market investments 5.84% | ||||
Capital Group Central Cash Fund 5.36%7,8 | 1,071,162 | 107,138 | ||
Total short-term securities (cost: $107,118,000) | 107,138 | |||
Total investment securities 99.33% (cost: $1,888,315,000) | 1,824,069 | |||
Other assets less liabilities 0.67% | 12,377 | |||
Net assets 100.00% | $1,836,446 | |||
Contracts | Type | Number of contracts | Expiration date | Notional amount (000) | Value and unrealized appreciation (depreciation) at 5/31/2024 (000) |
2 Year U.S. Treasury Note Futures | Long | 842 | 10/3/2024 | USD171,518 | $(32 ) |
5 Year U.S. Treasury Note Futures | Long | 1,090 | 10/3/2024 | 115,319 | (147 ) |
10 Year U.S. Treasury Note Futures | Short | 419 | 9/30/2024 | (45,586 ) | (35 ) |
10 Year Ultra U.S. Treasury Note Futures | Short | 3,044 | 9/30/2024 | (341,023 ) | 2,153 |
20 Year U.S. Treasury Bond Futures | Long | 1,475 | 9/30/2024 | 171,192 | (1,294 ) |
30 Year Ultra U.S. Treasury Bond Futures | Long | 188 | 9/30/2024 | 23,018 | (338 ) |
$307 |
Reference index | Financing rate paid | Payment frequency | Expiration date | Notional amount (000) | Value at 5/31/2024 (000) | Upfront premium paid (received) (000) | Unrealized appreciation (depreciation) at 5/31/2024 (000) |
CDX.NA.IG.42 | 1.00% | Quarterly | 6/20/2029 | USD113,980 | $(2,550 ) | $(2,520 ) | $(30 ) |
Value at 6/1/2023 (000) | Additions (000) | Reductions (000) | Net realized gain (loss) (000) | Net unrealized appreciation (depreciation) (000) | Value at 5/31/2024 (000) | Dividend or interest income (000) | |
Short-term securities 5.84% | |||||||
Money market investments 5.84% | |||||||
Capital Group Central Cash Fund 5.36% 7 | $142,398 | $882,847 | $918,139 | $4 | $28 | $107,138 | $5,952 |
13 | American Funds Corporate Bond Fund |
1 | Acquired in a transaction exempt from registration under Rule 144A or, for commercial paper, Section 4(a)(2) of the Securities Act of 1933. May be resold in the U.S. in transactions exempt from registration, normally to qualified institutional buyers. The total value of all such securities was $166,831,000, which represented 9.08% of the net assets of the fund. |
2 | Step bond; coupon rate may change at a later date. |
3 | Coupon rate may change periodically. Reference rate and spread are as of the most recent information available. Some coupon rates are determined by the issuer or agent based on current market conditions; therefore, the reference rate and spread are not available. |
4 | Securities referencing LIBOR are expected to transition to an alternative reference rate by the security’s next scheduled coupon reset date. |
5 | All or a portion of this security was pledged as collateral. The total value of pledged collateral was $5,515,000, which represented .30% of the net assets of the fund. |
6 | Principal payments may be made periodically. Therefore, the effective maturity date may be earlier than the stated maturity date. |
7 | Rate represents the seven-day yield at 5/31/2024. |
8 | Part of the same “group of investment companies“ as the fund as defined under the Investment Company Act of 1940, as amended. |
Key to abbreviation(s) |
Auth. = Authority |
CME = CME Group |
LIBOR = London Interbank Offered Rate |
Rev. = Revenue |
SOFR = Secured Overnight Financing Rate |
USD = U.S. dollars |
American Funds Corporate Bond Fund | 14 |
Assets: | ||
Investment securities, at value: | ||
Unaffiliated issuers (cost: $1,781,197) | $1,716,931 | |
Affiliated issuers (cost: $107,118) | 107,138 | $1,824,069 |
Cash | 53 | |
Receivables for: | ||
Sales of investments | 109,245 | |
Sales of fund’s shares | 1,573 | |
Dividends and interest | 18,108 | |
Variation margin on futures contracts | 1,202 | 130,128 |
1,954,250 | ||
Liabilities: | ||
Payables for: | ||
Purchases of investments | 113,702 | |
Repurchases of fund’s shares | 2,193 | |
Dividends on fund’s shares | 32 | |
Investment advisory services | 391 | |
Services provided by related parties | 316 | |
Trustees’ deferred compensation | 17 | |
Variation margin on futures contracts | 1,107 | |
Variation margin on centrally cleared swap contracts | 39 | |
Other | 7 | 117,804 |
Net assets at May 31, 2024 | $1,836,446 | |
Net assets consist of: | ||
Capital paid in on shares of beneficial interest | $2,193,147 | |
Total distributable earnings (accumulated loss) | (356,701 ) | |
Net assets at May 31, 2024 | $1,836,446 |
(dollars and shares in thousands, except per-share amounts)
unlimited shares authorized (197,798 total shares outstanding)
Net assets | Shares outstanding | Net asset value per share | |
Class A | $827,446 | 89,121 | $9.28 |
Class C | 24,646 | 2,655 | 9.28 |
Class T | 9 | 1 | 9.28 |
Class F-1 | 24,454 | 2,634 | 9.28 |
Class F-2 | 517,217 | 55,708 | 9.28 |
Class F-3 | 237,509 | 25,581 | 9.28 |
Class 529-A | 55,570 | 5,985 | 9.28 |
Class 529-C | 2,536 | 273 | 9.28 |
Class 529-E | 1,515 | 163 | 9.28 |
Class 529-T | 11 | 1 | 9.28 |
Class 529-F-1 | 9 | 1 | 9.28 |
Class 529-F-2 | 9,911 | 1,068 | 9.28 |
Class 529-F-3 | 9 | 1 | 9.28 |
Class R-1 | 1,066 | 115 | 9.28 |
Class R-2 | 5,821 | 627 | 9.28 |
Class R-2E | 1,860 | 200 | 9.28 |
Class R-3 | 13,049 | 1,406 | 9.28 |
Class R-4 | 4,348 | 468 | 9.28 |
Class R-5E | 4,600 | 495 | 9.28 |
Class R-5 | 933 | 101 | 9.28 |
Class R-6 | 103,927 | 11,194 | 9.28 |
15 | American Funds Corporate Bond Fund |
Investment income: | ||
Income: | ||
Interest from unaffiliated issuers | $78,857 | |
Dividends from affiliated issuers | 5,952 | $84,809 |
Fees and expenses*: | ||
Investment advisory services | 4,556 | |
Distribution services | 2,768 | |
Transfer agent services | 2,001 | |
Administrative services | 540 | |
529 plan services | 38 | |
Reports to shareholders | 172 | |
Registration statement and prospectus | 286 | |
Trustees’ compensation | 9 | |
Auditing and legal | 126 | |
Custodian | 33 | |
Other | 13 | |
Total fees and expenses before reimbursement | 10,542 | |
Less reimbursement of fees and expenses: | ||
Miscellaneous fee reimbursement | 98 | |
Total fees and expenses after reimbursement | 10,444 | |
Net investment income | 74,365 | |
Net realized gain (loss) and unrealized appreciation (depreciation): | ||
Net realized gain (loss) on: | ||
Investments: | ||
Unaffiliated issuers | (73,191 ) | |
Affiliated issuers | 4 | |
Futures contracts | (5,815 ) | |
Swap contracts | (3,501 ) | (82,503 ) |
Net unrealized appreciation (depreciation) on: | ||
Investments: | ||
Unaffiliated issuers | 62,233 | |
Affiliated issuers | 28 | |
Futures contracts | (1,412 ) | |
Swap contracts | 560 | 61,409 |
Net realized gain (loss) and unrealized appreciation (depreciation) | (21,094 ) | |
Net increase (decrease) in net assets resulting from operations | $53,271 |
American Funds Corporate Bond Fund | 16 |
Year ended May 31, | ||
2024 | 2023 | |
Operations: | ||
Net investment income | $74,365 | $53,940 |
Net realized gain (loss) | (82,503 ) | (151,973 ) |
Net unrealized appreciation (depreciation) | 61,409 | 60,832 |
Net increase (decrease) in net assets resulting from operations | 53,271 | (37,201 ) |
Distributions paid or accrued to shareholders | (70,487 ) | (52,558 ) |
Net capital share transactions | 64,489 | 110,530 |
Total increase (decrease) in net assets | 47,273 | 20,771 |
Net assets: | ||
Beginning of year | 1,789,173 | 1,768,402 |
End of year | $1,836,446 | $1,789,173 |
17 | American Funds Corporate Bond Fund |
Share class | Initial sales charge | Contingent deferred sales charge upon redemption | Conversion feature |
Class A | Up to 3.75% | None (except 0.75% for certain redemptions within 18 months of purchase without an initial sales charge) | None |
Class 529-A | Up to 3.50% | None (except 1.00% for certain redemptions within 18 months of purchase without an initial sales charge) | None |
Classes C and 529-C | None | 1.00% for redemptions within one year of purchase | Class C converts to Class A after eight years and Class 529-C converts to Class 529-A after five years |
Class 529-E | None | None | None |
Classes T and 529-T* | Up to 2.50% | None | None |
Classes F-1, F-2, F-3, 529-F-1, 529-F-2 and 529-F-3 | None | None | None |
Classes R-1, R-2, R-2E, R-3, R-4, R-5E, R-5 and R-6 | None | None | None |
American Funds Corporate Bond Fund | 18 |
Fixed-income class | Examples of standard inputs |
All | Benchmark yields, transactions, bids, offers, quotations from dealers and trading systems, new issues, spreads and other relationships observed in the markets among comparable securities; and proprietary pricing models such as yield measures calculated using factors such as cash flows, financial or collateral performance and other reference data (collectively referred to as “standard inputs”) |
Corporate bonds, notes & loans; convertible securities | Standard inputs and underlying equity of the issuer |
Bonds & notes of governments & government agencies | Standard inputs and interest rate volatilities |
Mortgage-backed; asset-backed obligations | Standard inputs and cash flows, prepayment information, default rates, delinquency and loss assumptions, collateral characteristics, credit enhancements and specific deal information |
Municipal securities | Standard inputs and, for certain distressed securities, cash flows or liquidation values using a net present value calculation based on inputs that include, but are not limited to, financial statements and debt contracts |
19 | American Funds Corporate Bond Fund |
Investment securities | ||||
Level 1 | Level 2 | Level 3 | Total | |
Assets: | ||||
Bonds, notes & other debt instruments: | ||||
Corporate bonds, notes & loans | $— | $1,542,015 | $— | $1,542,015 |
U.S. Treasury bonds & notes | — | 151,928 | — | 151,928 |
Asset-backed obligations | — | 16,983 | — | 16,983 |
Municipals | — | 3,937 | — | 3,937 |
Bonds & notes of governments & government agencies outside the U.S. | — | 2,068 | — | 2,068 |
Short-term securities | 107,138 | — | — | 107,138 |
Total | $107,138 | $1,716,931 | $— | $1,824,069 |
Other investments* | ||||
Level 1 | Level 2 | Level 3 | Total | |
Assets: | ||||
Unrealized appreciation on futures contracts | $2,153 | $— | $— | $2,153 |
Liabilities: | ||||
Unrealized depreciation on futures contracts | (1,846 ) | — | — | (1,846 ) |
Unrealized depreciation on centrally cleared credit default swaps | — | (30 ) | — | (30 ) |
Total | $307 | $(30 ) | $— | $277 |
American Funds Corporate Bond Fund | 20 |
21 | American Funds Corporate Bond Fund |
American Funds Corporate Bond Fund | 22 |
23 | American Funds Corporate Bond Fund |
Assets | Liabilities | ||||
Contracts | Risk type | Location on statement of assets and liabilities | Value | Location on statement of assets and liabilities | Value |
Futures | Interest | Unrealized appreciation* | $2,153 | Unrealized depreciation* | $1,846 |
Swap (centrally cleared) | Credit | Unrealized appreciation* | — | Unrealized depreciation* | 30 |
$2,153 | $1,876 | ||||
Net realized gain (loss) | Net unrealized appreciation (depreciation) | ||||
Contracts | Risk type | Location on statement of operations | Value | Location on statement of operations | Value |
Futures | Interest | Net realized gain (loss) on futures contracts | $(5,815 ) | Net unrealized appreciation (depreciation) on futures contracts | $(1,412 ) |
Swap | Interest | Net realized gain (loss) on swap contracts | 17 | Net unrealized appreciation (depreciation) on swap contracts | (21 ) |
Swap | Credit | Net realized gain (loss) on swap contracts | (3,518 ) | Net unrealized appreciation (depreciation) on swap contracts | 581 |
$(9,316 ) | $(852 ) | ||||
American Funds Corporate Bond Fund | 24 |
Undistributed ordinary income | $325 |
Capital loss carryforward* | (291,179 ) |
Gross unrealized appreciation on investments | 10,655 |
Gross unrealized depreciation on investments | (76,540 ) |
Net unrealized appreciation (depreciation) on investments | (65,885 ) |
Cost of investments | 1,892,751 |
Year ended May 31, | ||
Share class | 2024 | 2023 |
Class A | $29,770 | $23,639 |
Class C | 783 | 668 |
Class T | — † | — † |
Class F-1 | 1,137 | 1,292 |
Class F-2 | 23,674 | 18,203 |
Class F-3 | 8,431 | 4,733 |
Class 529-A | 1,983 | 1,519 |
Class 529-C | 82 | 70 |
Class 529-E | 53 | 47 |
Class 529-T | — † | — † |
Class 529-F-1 | — † | — † |
Class 529-F-2 | 375 | 270 |
Class 529-F-3 | — † | — † |
Class R-1 | 31 | 23 |
Class R-2 | 179 | 136 |
Class R-2E | 58 | 37 |
Class R-3 | 426 | 297 |
Class R-4 | 155 | 135 |
Class R-5E | 149 | 90 |
Class R-5 | 45 | 35 |
Class R-6 | 3,156 | 1,364 |
Total | $70,487 | $52,558 |
25 | American Funds Corporate Bond Fund |
Share class | Currently approved limits | Plan limits |
Class A | 0.30 % | 0.30 % |
Class 529-A | 0.30 | 0.50 |
Classes C, 529-C and R-1 | 1.00 | 1.00 |
Class R-2 | 0.75 | 1.00 |
Class R-2E | 0.60 | 0.85 |
Classes 529-E and R-3 | 0.50 | 0.75 |
Classes T, F-1, 529-T, 529-F-1 and R-4 | 0.25 | 0.50 |
American Funds Corporate Bond Fund | 26 |
Share class | Distribution services | Transfer agent services | Administrative services | 529 plan services |
Class A | $2,142 | $1,079 | $237 | Not applicable |
Class C | 258 | 36 | 8 | Not applicable |
Class T | — | — * | — * | Not applicable |
Class F-1 | 75 | 43 | 9 | Not applicable |
Class F-2 | Not applicable | 707 | 175 | Not applicable |
Class F-3 | Not applicable | 6 | 60 | Not applicable |
Class 529-A | 125 | 68 | 16 | $30 |
Class 529-C | 27 | 4 | 1 | 2 |
Class 529-E | 7 | 1 | — * | 1 |
Class 529-T | — | — * | — * | — * |
Class 529-F-1 | — | — * | — * | — * |
Class 529-F-2 | Not applicable | 5 | 3 | 5 |
Class 529-F-3 | Not applicable | — * | — * | — * |
Class R-1 | 10 | 1 | — * | Not applicable |
Class R-2 | 44 | 19 | 2 | Not applicable |
Class R-2E | 10 | 3 | 1 | Not applicable |
Class R-3 | 60 | 17 | 4 | Not applicable |
Class R-4 | 10 | 4 | 1 | Not applicable |
Class R-5E | Not applicable | 6 | 1 | Not applicable |
Class R-5 | Not applicable | — * | — * | Not applicable |
Class R-6 | Not applicable | 2 | 22 | Not applicable |
Total class-specific expenses | $2,768 | $2,001 | $540 | $38 |
27 | American Funds Corporate Bond Fund |
Sales* | Reinvestments of distributions | Repurchases* | Net increase (decrease) | |||||
Share class | Amount | Shares | Amount | Shares | Amount | Shares | Amount | Shares |
Year ended May 31, 2024 | ||||||||
Class A | $180,784 | 19,485 | $29,532 | 3,190 | $(156,088 ) | (16,909 ) | $54,228 | 5,766 |
Class C | 5,435 | 586 | 779 | 84 | (8,842 ) | (959 ) | (2,628 ) | (289 ) |
Class T | — | — | — | — | — | — | — | — |
Class F-1 | 4,652 | 502 | 1,135 | 123 | (21,308 ) | (2,325 ) | (15,521 ) | (1,700 ) |
Class F-2 | 201,900 | 21,813 | 23,660 | 2,558 | (320,456 ) | (34,527 ) | (94,896 ) | (10,156 ) |
Class F-3 | 118,322 | 12,831 | 8,421 | 910 | (58,466 ) | (6,352 ) | 68,277 | 7,389 |
Class 529-A | 16,393 | 1,764 | 1,971 | 213 | (14,489 ) | (1,560 ) | 3,875 | 417 |
Class 529-C | 1,043 | 113 | 82 | 9 | (1,563 ) | (170 ) | (438 ) | (48 ) |
Class 529-E | 298 | 32 | 53 | 5 | (509 ) | (55 ) | (158 ) | (18 ) |
Class 529-T | — | — | — † | — † | — | — | — † | — † |
Class 529-F-1 | — | — | — † | — † | — | — | — † | — † |
Class 529-F-2 | 3,441 | 371 | 374 | 40 | (2,098 ) | (226 ) | 1,717 | 185 |
Class 529-F-3 | — | — | — † | — † | — | — | — † | — † |
Class R-1 | 350 | 37 | 31 | 3 | (186 ) | (20 ) | 195 | 20 |
Class R-2 | 1,761 | 190 | 178 | 19 | (1,886 ) | (204 ) | 53 | 5 |
Class R-2E | 919 | 101 | 58 | 6 | (597 ) | (65 ) | 380 | 42 |
Class R-3 | 5,078 | 547 | 422 | 46 | (3,636 ) | (392 ) | 1,864 | 201 |
Class R-4 | 1,305 | 140 | 154 | 17 | (1,339 ) | (143 ) | 120 | 14 |
Class R-5E | 2,394 | 256 | 147 | 16 | (1,186 ) | (128 ) | 1,355 | 144 |
Class R-5 | 516 | 57 | 44 | 5 | (753 ) | (82 ) | (193 ) | (20 ) |
Class R-6 | 58,444 | 6,293 | 3,155 | 341 | (15,340 ) | (1,671 ) | 46,259 | 4,963 |
Total net increase (decrease) | $603,035 | 65,118 | $70,196 | 7,585 | $(608,742 ) | (65,788 ) | $64,489 | 6,915 |
American Funds Corporate Bond Fund | 28 |
Sales* | Reinvestments of distributions | Repurchases* | Net increase (decrease) | |||||
Share class | Amount | Shares | Amount | Shares | Amount | Shares | Amount | Shares |
Year ended May 31, 2023 | ||||||||
Class A | $111,509 | 11,869 | $23,457 | 2,503 | $(174,795 ) | (18,643 ) | $(39,829 ) | (4,271 ) |
Class C | 4,148 | 439 | 665 | 71 | (12,066 ) | (1,281 ) | (7,253 ) | (771 ) |
Class T | — | — | — | — | — | — | — | — |
Class F-1 | 27,378 | 2,873 | 1,289 | 138 | (24,786 ) | (2,637 ) | 3,881 | 374 |
Class F-2 | 374,612 | 39,847 | 18,191 | 1,940 | (326,273 ) | (35,318 ) | 66,530 | 6,469 |
Class F-3 | 89,591 | 9,475 | 4,728 | 504 | (38,459 ) | (4,099 ) | 55,860 | 5,880 |
Class 529-A | 9,532 | 1,013 | 1,514 | 162 | (12,161 ) | (1,286 ) | (1,115 ) | (111 ) |
Class 529-C | 991 | 106 | 70 | 7 | (1,813 ) | (191 ) | (752 ) | (78 ) |
Class 529-E | 308 | 33 | 47 | 5 | (518 ) | (55 ) | (163 ) | (17 ) |
Class 529-T | — | — | — † | — † | — | — | — † | — † |
Class 529-F-1 | — | — | — † | — † | — | — | — † | — † |
Class 529-F-2 | 2,062 | 219 | 268 | 29 | (3,130 ) | (333 ) | (800 ) | (85 ) |
Class 529-F-3 | — | — | — † | — † | — | — | — † | — † |
Class R-1 | 111 | 12 | 23 | 3 | (444 ) | (47 ) | (310 ) | (32 ) |
Class R-2 | 1,680 | 179 | 134 | 14 | (1,762 ) | (188 ) | 52 | 5 |
Class R-2E | 592 | 62 | 36 | 4 | (397 ) | (42 ) | 231 | 24 |
Class R-3 | 3,545 | 377 | 295 | 32 | (3,134 ) | (333 ) | 706 | 76 |
Class R-4 | 1,282 | 141 | 135 | 14 | (1,430 ) | (151 ) | (13 ) | 4 |
Class R-5E | 1,479 | 157 | 89 | 9 | (712 ) | (75 ) | 856 | 91 |
Class R-5 | 357 | 38 | 35 | 4 | (222 ) | (24 ) | 170 | 18 |
Class R-6 | 41,944 | 4,477 | 1,362 | 145 | (10,827 ) | (1,143 ) | 32,479 | 3,479 |
Total net increase (decrease) | $671,121 | 71,317 | $52,338 | 5,584 | $(612,929 ) | (65,846 ) | $110,530 | 11,055 |
if any, of $1,706,901,000 and $1,698,989,000, respectively, during the year ended May 31, 2024.
29 | American Funds Corporate Bond Fund |
Income (loss) from investment operations1 | Dividends and distributions | ||||||||||||
Year ended | Net asset value, beginning of year | Net investment income (loss) | Net gains (losses) on securities (both realized and unrealized) | Total from investment operations | Dividends (from net investment income) | Distributions (from capital gains) | Total dividends and distributions | Net asset value, end of year | Total return2,3 | Net assets, end of year (in millions) | Ratio of expenses to average net assets before waivers/ reimburse- ments4 | Ratio of expenses to average net assets after waivers/ reimburse- ments3,4 | Ratio of net income (loss) to average net assets3 |
Class A: | |||||||||||||
5/31/2024 | $9.37 | $.37 | $(.11 ) | $.26 | $(.35 ) | $— | $(.35 ) | $9.28 | 2.83 % | $827 | .73 % | .72 % | 3.99 % |
5/31/2023 | 9.83 | .29 | (.47 ) | (.18 ) | (.28 ) | — | (.28 ) | 9.37 | (1.77 ) | 781 | .70 | .69 | 3.07 |
5/31/2022 | 11.17 | .19 | (1.34 ) | (1.15 ) | (.19 ) | — | (.19 ) | 9.83 | (10.47 ) | 862 | .82 | .81 | 1.72 |
5/31/2021 | 11.52 | .17 | (.03 ) | .14 | (.17 ) | (.32 ) | (.49 ) | 11.17 | 1.07 | 1,063 | .84 | .83 | 1.48 |
5/31/2020 | 10.44 | .24 | 1.20 | 1.44 | (.24 ) | (.12 ) | (.36 ) | 11.52 | 14.10 | 807 | .88 | .84 | 2.20 |
Class C: | |||||||||||||
5/31/2024 | 9.37 | .30 | (.11 ) | .19 | (.28 ) | — | (.28 ) | 9.28 | 2.09 | 25 | 1.46 | 1.45 | 3.25 |
5/31/2023 | 9.83 | .22 | (.47 ) | (.25 ) | (.21 ) | — | (.21 ) | 9.37 | (2.51 ) | 28 | 1.45 | 1.44 | 2.30 |
5/31/2022 | 11.17 | .11 | (1.34 ) | (1.23 ) | (.11 ) | — | (.11 ) | 9.83 | (11.10 ) | 37 | 1.53 | 1.52 | 1.00 |
5/31/2021 | 11.52 | .09 | (.03 ) | .06 | (.09 ) | (.32 ) | (.41 ) | 11.17 | .37 | 55 | 1.54 | 1.52 | .78 |
5/31/2020 | 10.44 | .17 | 1.20 | 1.37 | (.17 ) | (.12 ) | (.29 ) | 11.52 | 13.30 | 36 | 1.58 | 1.54 | 1.50 |
Class T: | |||||||||||||
5/31/2024 | 9.37 | .39 | (.11 ) | .28 | (.37 ) | — | (.37 ) | 9.28 | 3.12 5 | — 6 | .44 5 | .44 5 | 4.27 5 |
5/31/2023 | 9.83 | .32 | (.47 ) | (.15 ) | (.31 ) | — | (.31 ) | 9.37 | (1.46 )5 | — 6 | .38 5 | .37 5 | 3.39 5 |
5/31/2022 | 11.17 | .22 | (1.34 ) | (1.12 ) | (.22 ) | — | (.22 ) | 9.83 | (10.22 )5 | — 6 | .54 5 | .53 5 | 2.00 5 |
5/31/2021 | 11.52 | .20 | (.03 ) | .17 | (.20 ) | (.32 ) | (.52 ) | 11.17 | 1.34 5 | — 6 | .57 5 | .56 5 | 1.76 5 |
5/31/2020 | 10.44 | .27 | 1.20 | 1.47 | (.27 ) | (.12 ) | (.39 ) | 11.52 | 14.43 5 | — 6 | .59 5 | .55 5 | 2.51 5 |
Class F-1: | |||||||||||||
5/31/2024 | 9.37 | .37 | (.11 ) | .26 | (.35 ) | — | (.35 ) | 9.28 | 2.86 | 24 | .71 | .70 | 3.98 |
5/31/2023 | 9.83 | .29 | (.47 ) | (.18 ) | (.28 ) | — | (.28 ) | 9.37 | (1.77 ) | 41 | .69 | .68 | 3.11 |
5/31/2022 | 11.17 | .19 | (1.34 ) | (1.15 ) | (.19 ) | — | (.19 ) | 9.83 | (10.45 ) | 39 | .80 | .80 | 1.72 |
5/31/2021 | 11.52 | .18 | (.03 ) | .15 | (.18 ) | (.32 ) | (.50 ) | 11.17 | 1.10 | 68 | .81 | .79 | 1.49 |
5/31/2020 | 10.44 | .25 | 1.20 | 1.45 | (.25 ) | (.12 ) | (.37 ) | 11.52 | 14.13 | 32 | .84 | .80 | 2.18 |
Class F-2: | |||||||||||||
5/31/2024 | 9.37 | .40 | (.11 ) | .29 | (.38 ) | — | (.38 ) | 9.28 | 3.13 | 517 | .44 | .43 | 4.26 |
5/31/2023 | 9.83 | .32 | (.47 ) | (.15 ) | (.31 ) | — | (.31 ) | 9.37 | (1.53 ) | 617 | .44 | .44 | 3.34 |
5/31/2022 | 11.17 | .22 | (1.34 ) | (1.12 ) | (.22 ) | — | (.22 ) | 9.83 | (10.22 ) | 584 | .54 | .53 | 2.01 |
5/31/2021 | 11.52 | .21 | (.03 ) | .18 | (.21 ) | (.32 ) | (.53 ) | 11.17 | 1.37 | 641 | .54 | .52 | 1.72 |
5/31/2020 | 10.44 | .27 | 1.20 | 1.47 | (.27 ) | (.12 ) | (.39 ) | 11.52 | 14.44 | 158 | .57 | .53 | 2.47 |
Class F-3: | |||||||||||||
5/31/2024 | 9.37 | .41 | (.11 ) | .30 | (.39 ) | — | (.39 ) | 9.28 | 3.25 | 237 | .32 | .32 | 4.41 |
5/31/2023 | 9.83 | .33 | (.47 ) | (.14 ) | (.32 ) | — | (.32 ) | 9.37 | (1.41 ) | 171 | .32 | .32 | 3.49 |
5/31/2022 | 11.17 | .23 | (1.34 ) | (1.11 ) | (.23 ) | — | (.23 ) | 9.83 | (10.11 ) | 121 | .42 | .42 | 2.11 |
5/31/2021 | 11.52 | .22 | (.03 ) | .19 | (.22 ) | (.32 ) | (.54 ) | 11.17 | 1.47 | 139 | .45 | .43 | 1.85 |
5/31/2020 | 10.44 | .29 | 1.20 | 1.49 | (.29 ) | (.12 ) | (.41 ) | 11.52 | 14.55 | 41 | .48 | .44 | 2.56 |
Class 529-A: | |||||||||||||
5/31/2024 | 9.37 | .37 | (.11 ) | .26 | (.35 ) | — | (.35 ) | 9.28 | 2.82 | 56 | .74 | .74 | 3.98 |
5/31/2023 | 9.83 | .29 | (.47 ) | (.18 ) | (.28 ) | — | (.28 ) | 9.37 | (1.81 ) | 52 | .74 | .73 | 3.03 |
5/31/2022 | 11.17 | .19 | (1.34 ) | (1.15 ) | (.19 ) | — | (.19 ) | 9.83 | (10.47 ) | 56 | .82 | .81 | 1.72 |
5/31/2021 | 11.52 | .17 | (.03 ) | .14 | (.17 ) | (.32 ) | (.49 ) | 11.17 | 1.08 | 66 | .83 | .81 | 1.50 |
5/31/2020 | 10.44 | .24 | 1.20 | 1.44 | (.24 ) | (.12 ) | (.36 ) | 11.52 | 14.09 | 53 | .88 | .84 | 2.20 |
American Funds Corporate Bond Fund | 30 |
Income (loss) from investment operations1 | Dividends and distributions | ||||||||||||
Year ended | Net asset value, beginning of year | Net investment income (loss) | Net gains (losses) on securities (both realized and unrealized) | Total from investment operations | Dividends (from net investment income) | Distributions (from capital gains) | Total dividends and distributions | Net asset value, end of year | Total return2,3 | Net assets, end of year (in millions) | Ratio of expenses to average net assets before waivers/ reimburse- ments4 | Ratio of expenses to average net assets after waivers/ reimburse- ments3,4 | Ratio of net income (loss) to average net assets3 |
Class 529-C: | |||||||||||||
5/31/2024 | $9.37 | $.30 | $(.11 ) | $.19 | $(.28 ) | $— | $(.28 ) | $9.28 | 2.05 % | $3 | 1.50 % | 1.49 % | 3.21 % |
5/31/2023 | 9.83 | .22 | (.47 ) | (.25 ) | (.21 ) | — | (.21 ) | 9.37 | (2.56 ) | 3 | 1.50 | 1.49 | 2.25 |
5/31/2022 | 11.17 | .10 | (1.34 ) | (1.24 ) | (.10 ) | — | (.10 ) | 9.83 | (11.15 ) | 4 | 1.58 | 1.57 | .94 |
5/31/2021 | 11.52 | .08 | (.03 ) | .05 | (.08 ) | (.32 ) | (.40 ) | 11.17 | .32 | 6 | 1.59 | 1.58 | .77 |
5/31/2020 | 10.44 | .16 | 1.20 | 1.36 | (.16 ) | (.12 ) | (.28 ) | 11.52 | 13.24 | 8 | 1.64 | 1.60 | 1.45 |
Class 529-E: | |||||||||||||
5/31/2024 | 9.37 | .35 | (.11 ) | .24 | (.33 ) | — | (.33 ) | 9.28 | 2.64 | 1 | .92 | .92 | 3.79 |
5/31/2023 | 9.83 | .27 | (.47 ) | (.20 ) | (.26 ) | — | (.26 ) | 9.37 | (2.00 ) | 2 | .93 | .92 | 2.83 |
5/31/2022 | 11.17 | .17 | (1.34 ) | (1.17 ) | (.17 ) | — | (.17 ) | 9.83 | (10.64 ) | 2 | 1.02 | 1.01 | 1.51 |
5/31/2021 | 11.52 | .15 | (.03 ) | .12 | (.15 ) | (.32 ) | (.47 ) | 11.17 | .87 | 3 | 1.04 | 1.02 | 1.30 |
5/31/2020 | 10.44 | .22 | 1.20 | 1.42 | (.22 ) | (.12 ) | (.34 ) | 11.52 | 13.89 | 2 | 1.06 | 1.02 | 2.00 |
Class 529-T: | |||||||||||||
5/31/2024 | 9.37 | .39 | (.11 ) | .28 | (.37 ) | — | (.37 ) | 9.28 | 3.05 5 | — 6 | .51 5 | .51 5 | 4.20 5 |
5/31/2023 | 9.83 | .31 | (.47 ) | (.16 ) | (.30 ) | — | (.30 ) | 9.37 | (1.56 )5 | — 6 | .47 5 | .46 5 | 3.30 5 |
5/31/2022 | 11.17 | .21 | (1.34 ) | (1.13 ) | (.21 ) | — | (.21 ) | 9.83 | (10.26 )5 | — 6 | .58 5 | .58 5 | 1.96 5 |
5/31/2021 | 11.52 | .20 | (.03 ) | .17 | (.20 ) | (.32 ) | (.52 ) | 11.17 | 1.29 5 | — 6 | .62 5 | .60 5 | 1.73 5 |
5/31/2020 | 10.44 | .27 | 1.20 | 1.47 | (.27 ) | (.12 ) | (.39 ) | 11.52 | 14.38 5 | — 6 | .64 5 | .61 5 | 2.46 5 |
Class 529-F-1: | |||||||||||||
5/31/2024 | 9.37 | .39 | (.11 ) | .28 | (.37 ) | — | (.37 ) | 9.28 | 3.07 5 | — 6 | .49 5 | .49 5 | 4.22 5 |
5/31/2023 | 9.83 | .31 | (.47 ) | (.16 ) | (.30 ) | — | (.30 ) | 9.37 | (1.57 )5 | — 6 | .49 5 | .48 5 | 3.28 5 |
5/31/2022 | 11.17 | .21 | (1.34 ) | (1.13 ) | (.21 ) | — | (.21 ) | 9.83 | (10.28 )5 | — 6 | .61 5 | .60 5 | 1.93 5 |
5/31/2021 | 11.52 | .20 | (.03 ) | .17 | (.20 ) | (.32 ) | (.52 ) | 11.17 | 1.30 5 | — 6 | .64 5 | .61 5 | 1.90 5 |
5/31/2020 | 10.44 | .27 | 1.20 | 1.47 | (.27 ) | (.12 ) | (.39 ) | 11.52 | 14.37 | 6 | .64 | .60 | 2.44 |
Class 529-F-2: | |||||||||||||
5/31/2024 | 9.37 | .40 | (.11 ) | .29 | (.38 ) | — | (.38 ) | 9.28 | 3.14 | 10 | .43 | .43 | 4.29 |
5/31/2023 | 9.83 | .32 | (.47 ) | (.15 ) | (.31 ) | — | (.31 ) | 9.37 | (1.50 ) | 8 | .42 | .41 | 3.33 |
5/31/2022 | 11.17 | .22 | (1.34 ) | (1.12 ) | (.22 ) | — | (.22 ) | 9.83 | (10.21 ) | 9 | .53 | .52 | 2.02 |
5/31/20217,8 | 11.68 | .11 | (.19 ) | (.08 ) | (.11 ) | (.32 ) | (.43 ) | 11.17 | (.82 )9 | 9 | .54 10 | .53 10 | 1.66 10 |
Class 529-F-3: | |||||||||||||
5/31/2024 | 9.37 | .40 | (.11 ) | .29 | (.38 ) | — | (.38 ) | 9.28 | 3.20 | — 6 | .36 | .36 | 4.35 |
5/31/2023 | 9.83 | .32 | (.47 ) | (.15 ) | (.31 ) | — | (.31 ) | 9.37 | (1.45 ) | — 6 | .37 | .36 | 3.41 |
5/31/2022 | 11.17 | .22 | (1.34 ) | (1.12 ) | (.22 ) | — | (.22 ) | 9.83 | (10.17 ) | — 6 | .48 | .48 | 2.05 |
5/31/20217,8 | 11.68 | .11 | (.19 ) | (.08 ) | (.11 ) | (.32 ) | (.43 ) | 11.17 | (.79 )9 | — 6 | .59 10 | .49 10 | 1.69 10 |
Class R-1: | |||||||||||||
5/31/2024 | 9.37 | .30 | (.11 ) | .19 | (.28 ) | — | (.28 ) | 9.28 | 2.13 | 1 | 1.42 | 1.41 | 3.31 |
5/31/2023 | 9.83 | .22 | (.47 ) | (.25 ) | (.21 ) | — | (.21 ) | 9.37 | (2.49 ) | 1 | 1.43 | 1.42 | 2.33 |
5/31/2022 | 11.17 | .11 | (1.34 ) | (1.23 ) | (.11 ) | — | (.11 ) | 9.83 | (11.08 ) | 1 | 1.50 | 1.50 | 1.03 |
5/31/2021 | 11.52 | .09 | (.03 ) | .06 | (.09 ) | (.32 ) | (.41 ) | 11.17 | .40 | 1 | 1.51 | 1.50 | .82 |
5/31/2020 | 10.44 | .18 | 1.20 | 1.38 | (.18 ) | (.12 ) | (.30 ) | 11.52 | 13.41 | 1 | 1.49 | 1.45 | 1.58 |
31 | American Funds Corporate Bond Fund |
Income (loss) from investment operations1 | Dividends and distributions | ||||||||||||
Year ended | Net asset value, beginning of year | Net investment income (loss) | Net gains (losses) on securities (both realized and unrealized) | Total from investment operations | Dividends (from net investment income) | Distributions (from capital gains) | Total dividends and distributions | Net asset value, end of year | Total return2,3 | Net assets, end of year (in millions) | Ratio of expenses to average net assets before waivers/ reimburse- ments4 | Ratio of expenses to average net assets after waivers/ reimburse- ments3,4 | Ratio of net income (loss) to average net assets3 |
Class R-2: | |||||||||||||
5/31/2024 | $9.37 | $.31 | $(.11 ) | $.20 | $(.29 ) | $— | $(.29 ) | $9.28 | 2.15 % | $6 | 1.40 % | 1.40 % | 3.31 % |
5/31/2023 | 9.83 | .23 | (.47 ) | (.24 ) | (.22 ) | — | (.22 ) | 9.37 | (2.46 ) | 6 | 1.40 | 1.39 | 2.38 |
5/31/2022 | 11.17 | .11 | (1.34 ) | (1.23 ) | (.11 ) | — | (.11 ) | 9.83 | (11.08 ) | 6 | 1.50 | 1.49 | 1.04 |
5/31/2021 | 11.52 | .09 | (.03 ) | .06 | (.09 ) | (.32 ) | (.41 ) | 11.17 | .39 | 7 | 1.52 | 1.50 | .83 |
5/31/2020 | 10.44 | .17 | 1.20 | 1.37 | (.17 ) | (.12 ) | (.29 ) | 11.52 | 13.34 | 8 | 1.55 | 1.51 | 1.53 |
Class R-2E: | |||||||||||||
5/31/2024 | 9.37 | .33 | (.11 ) | .22 | (.31 ) | — | (.31 ) | 9.28 | 2.44 | 2 | 1.12 | 1.12 | 3.62 |
5/31/2023 | 9.83 | .25 | (.47 ) | (.22 ) | (.24 ) | — | (.24 ) | 9.37 | (2.19 ) | 2 | 1.13 | 1.12 | 2.66 |
5/31/2022 | 11.17 | .14 | (1.34 ) | (1.20 ) | (.14 ) | — | (.14 ) | 9.83 | (10.84 ) | 1 | 1.23 | 1.23 | 1.30 |
5/31/2021 | 11.52 | .13 | (.03 ) | .10 | (.13 ) | (.32 ) | (.45 ) | 11.17 | .67 | 2 | 1.25 | 1.23 | 1.08 |
5/31/2020 | 10.44 | .20 | 1.20 | 1.40 | (.20 ) | (.12 ) | (.32 ) | 11.52 | 13.67 | 1 | 1.26 | 1.22 | 1.81 |
Class R-3: | |||||||||||||
5/31/2024 | 9.37 | .35 | (.11 ) | .24 | (.33 ) | — | (.33 ) | 9.28 | 2.60 | 13 | .96 | .95 | 3.77 |
5/31/2023 | 9.83 | .27 | (.47 ) | (.20 ) | (.26 ) | — | (.26 ) | 9.37 | (2.04 ) | 11 | .97 | .96 | 2.82 |
5/31/2022 | 11.17 | .16 | (1.34 ) | (1.18 ) | (.16 ) | — | (.16 ) | 9.83 | (10.69 ) | 11 | 1.07 | 1.06 | 1.47 |
5/31/2021 | 11.52 | .14 | (.03 ) | .11 | (.14 ) | (.32 ) | (.46 ) | 11.17 | .82 | 13 | 1.09 | 1.07 | 1.24 |
5/31/2020 | 10.44 | .22 | 1.20 | 1.42 | (.22 ) | (.12 ) | (.34 ) | 11.52 | 13.82 | 10 | 1.13 | 1.09 | 1.96 |
Class R-4: | |||||||||||||
5/31/2024 | 9.37 | .37 | (.11 ) | .26 | (.35 ) | — | (.35 ) | 9.28 | 2.90 | 4 | .66 | .66 | 4.05 |
5/31/2023 | 9.83 | .29 | (.47 ) | (.18 ) | (.28 ) | — | (.28 ) | 9.37 | (1.74 ) | 4 | .67 | .66 | 3.11 |
5/31/2022 | 11.17 | .19 | (1.34 ) | (1.15 ) | (.19 ) | — | (.19 ) | 9.83 | (10.43 ) | 4 | .77 | .77 | 1.75 |
5/31/2021 | 11.52 | .18 | (.03 ) | .15 | (.18 ) | (.32 ) | (.50 ) | 11.17 | 1.12 | 6 | .79 | .77 | 1.52 |
5/31/2020 | 10.44 | .25 | 1.20 | 1.45 | (.25 ) | (.12 ) | (.37 ) | 11.52 | 14.16 | 4 | .83 | .79 | 2.27 |
Class R-5E: | |||||||||||||
5/31/2024 | 9.37 | .39 | (.11 ) | .28 | (.37 ) | — | (.37 ) | 9.28 | 3.10 | 5 | .47 | .47 | 4.27 |
5/31/2023 | 9.83 | .31 | (.47 ) | (.16 ) | (.30 ) | — | (.30 ) | 9.37 | (1.55 ) | 3 | .47 | .46 | 3.34 |
5/31/2022 | 11.17 | .21 | (1.34 ) | (1.13 ) | (.21 ) | — | (.21 ) | 9.83 | (10.25 ) | 3 | .57 | .56 | 2.01 |
5/31/2021 | 11.52 | .20 | (.03 ) | .17 | (.20 ) | (.32 ) | (.52 ) | 11.17 | 1.30 | 1 | .62 | .60 | 1.73 |
5/31/2020 | 10.44 | .27 | 1.20 | 1.47 | (.27 ) | (.12 ) | (.39 ) | 11.52 | 14.37 | 1 | .64 | .59 | 2.43 |
Class R-5: | |||||||||||||
5/31/2024 | 9.37 | .40 | (.11 ) | .29 | (.38 ) | — | (.38 ) | 9.28 | 3.20 | 1 | .37 | .37 | 4.34 |
5/31/2023 | 9.83 | .32 | (.47 ) | (.15 ) | (.31 ) | — | (.31 ) | 9.37 | (1.45 ) | 1 | .37 | .36 | 3.43 |
5/31/2022 | 11.17 | .22 | (1.34 ) | (1.12 ) | (.22 ) | — | (.22 ) | 9.83 | (10.17 ) | 1 | .49 | .48 | 2.02 |
5/31/2021 | 11.52 | .21 | (.03 ) | .18 | (.21 ) | (.32 ) | (.53 ) | 11.17 | 1.41 | 2 | .51 | .49 | 1.83 |
5/31/2020 | 10.44 | .28 | 1.20 | 1.48 | (.28 ) | (.12 ) | (.40 ) | 11.52 | 14.49 | 1 | .53 | .49 | 2.55 |
Class R-6: | |||||||||||||
5/31/2024 | 9.37 | .41 | (.11 ) | .30 | (.39 ) | — | (.39 ) | 9.28 | 3.25 | 104 | .32 | .32 | 4.44 |
5/31/2023 | 9.83 | .33 | (.47 ) | (.14 ) | (.32 ) | — | (.32 ) | 9.37 | (1.41 ) | 58 | .32 | .32 | 3.56 |
5/31/2022 | 11.17 | .23 | (1.34 ) | (1.11 ) | (.23 ) | — | (.23 ) | 9.83 | (10.12 ) | 27 | .42 | .42 | 2.13 |
5/31/2021 | 11.52 | .22 | (.03 ) | .19 | (.22 ) | (.32 ) | (.54 ) | 11.17 | 1.47 | 20 | .45 | .43 | 1.89 |
5/31/2020 | 10.44 | .29 | 1.20 | 1.49 | (.29 ) | (.12 ) | (.41 ) | 11.52 | 14.55 | 12 | .48 | .45 | 2.62 |
American Funds Corporate Bond Fund | 32 |
Year ended May 31, | |||||
2024 | 2023 | 2022 | 2021 | 2020 | |
Portfolio turnover rate for all share classes11 | 191 % | 181 % | 118 % | 146 % | 232 % |
1 | Based on average shares outstanding. |
2 | Total returns exclude any applicable sales charges, including contingent deferred sales charges. |
3 | This column reflects the impact, if any, of certain waivers/reimbursements from CRMC and/or AFS. During one of the years shown, CRMC waived a portion of investment advisory services fees. In addition, during one of the years shown, AFS waived a portion of transfer agent services fees for Class F-3 shares. In addition, during one of the years shown, CRMC reimbursed a portion of transfer agent services fees for certain share classes. In addition, during some of the years shown, CRMC reimbursed a portion of miscellaneous fees and expenses. |
4 | Ratios do not include expenses of any Central Funds. The fund indirectly bears its proportionate share of the expenses of any Central Funds. |
5 | All or a significant portion of assets in this class consisted of seed capital invested by CRMC and/or its affiliates. Fees for distribution services are not charged or accrued on these seed capital assets. If such fees were paid by the fund on seed capital assets, fund expenses would have been higher and net income and total return would have been lower. |
6 | Amount less than $1 million. |
7 | Based on operations for a period that is less than a full year. |
8 | Class 529-F-2 and 529-F-3 shares began investment operations on October 30, 2020. |
9 | Not annualized. |
10 | Annualized. |
11 | Rates do not include the fund’s portfolio activity with respect to any Central Funds. |
33 | American Funds Corporate Bond Fund |
American Funds Corporate Bond Fund | 34 |
Qualified dividend income | $256,000 |
Section 163(j) interest dividends | $77,520,000 |
Corporate dividends received deduction | $19,000 |
U.S. government income that may be exempt from state taxation | $7,187,000 |
35 | American Funds Corporate Bond Fund |
American Funds Corporate Bond Fund | 36 |
37 | American Funds Corporate Bond Fund |
American Funds Corporate Bond Fund | 38 |
ITEM 8 - Changes in and Disagreements with Accountants for Open-End Management Investment Companies
Not applicable, insofar as the Registrant did not have any changes in or disagreements with accountants.
ITEM 9 - Proxy Disclosures for Open-End Management Investment Companies
Not applicable, insofar as the Registrant did not have any proxy disclosures.
ITEM 10 - Remuneration Paid to Directors, Officers, and Others of Open-End Management Investment Companies
The information is included as part of the material filed under Item 7 of this Form.
ITEM 11 - Statement Regarding Basis for Approval of Investment Advisory Contract
The information is included as part of the material filed under Item 7 of this Form.
ITEM 12 - Disclosure of Proxy Voting Policies and Procedures for Closed-End Management Investment Companies
Not applicable to this Registrant, insofar as the Registrant is not a closed-end management investment company.
ITEM 13 - Portfolio Managers of Closed-End Management Investment Companies
Not applicable to this Registrant, insofar as the Registrant is not a closed-end management investment company.
ITEM 14 - Purchases of Equity Securities by Closed-End Management Investment Company and Affiliated Purchasers
Not applicable to this Registrant, insofar as the Registrant is not a closed-end management investment company.
ITEM 15 - Submission of Matters to a Vote of Security Holders
There have been no material changes to the procedures by which shareholders may recommend nominees to the Registrant’s board of trustees since the Registrant last submitted a proxy statement to its shareholders. The procedures are as follows. The Registrant has a nominating and governance committee comprised solely of persons who are not considered ‘‘interested persons’’ of the Registrant within the meaning of the Investment Company Act of 1940, as amended. The committee periodically reviews such issues as the board’s composition, responsibilities, committees, compensation and other relevant issues, and recommends any appropriate changes to the full board of trustees. While the committee normally is able to identify from its own resources an ample number of qualified candidates, it will consider shareholder suggestions of persons to be considered as nominees to fill future vacancies on the board. Such suggestions must be sent in writing to the nominating and governance committee of the Registrant, c/o the Registrant’s Secretary, and must be accompanied by complete biographical and occupational data on the prospective nominee, along with a written consent of the prospective nominee for consideration of his or her name by the nominating and governance committee.
ITEM 16 - Controls and Procedures
(a) The Registrant’s Principal Executive Officer and Principal Financial Officer have concluded, based on their evaluation of the Registrant’s disclosure controls and procedures (as such term is defined in Rule 30a-3 under the Investment Company Act of 1940), that such controls and procedures are adequate and reasonably designed to achieve the purposes described in paragraph (c) of such rule.
(b) There were no changes in the Registrant’s internal controls over financial reporting (as defined in Rule 30a-3(d) under the Investment Company Act of 1940) that occurred during the Registrant’s semi-annual period covered by this report that has materially affected, or is reasonably likely to materially affect, the Registrant’s internal control over financial reporting.
ITEM 17 - Disclosure of Securities Lending Activities for Closed-End Management Investment Companies
Not applicable to this Registrant, insofar as the Registrant is not a closed-end management investment company.
ITEM 18 - Recovery of Erroneously Awarded Compensation
Not applicable.
SIGNATURES
Pursuant to the requirements of the Securities Exchange Act of 1934 and the Investment Company Act of 1940, the Registrant has duly caused this report to be signed on its behalf by the undersigned, thereunto duly authorized.
American Funds Corporate Bond Fund
By /s/ Kristine M. Nishiyama
Kristine M. Nishiyama,
Principal Executive Officer
Date: July 31, 2024
Pursuant to the requirements of the Securities Exchange Act of 1934 and the Investment Company Act of 1940, this report has been signed below by the following persons on behalf of the Registrant and in the capacities and on the dates indicated.
By /s/ Kristine M. Nishiyama
Kristine M. Nishiyama,
Principal Executive Officer
Date: July 31, 2024
By /s/ Becky L. Park
Becky L. Park, Treasurer and
Principal Financial Officer
Date: July 31, 2024