UNITED STATES
SECURITIES AND EXCHANGE COMMISSION
Washington, D.C. 20549
FORM N-CSR
Certified Shareholder Report of
Registered Management Investment Companies
Investment Company Act File Number: 811-22745
American Funds Global High-Income Opportunities Fund
(Exact Name of Registrant as Specified in Charter)
6455 Irvine Center Drive
Irvine, California 92618
(Address of Principal Executive Offices)
Registrant's telephone number, including area code: (949) 975-5000
Date of fiscal year end: February 28 or 29
Date of reporting period: February 28, 2014
Courtney R. Taylor
American Funds Global High-Income Opportunities Fund
6455 Irvine Center Drive
Irvine, California 92618
(Name and Address of Agent for Service)
Copies to:
Michael Glazer
Bingham McCutchen LLP
355 South Grand Avenue, Suite 4400
Los Angeles, California 90071
(Counsel for the Registrant)
ITEM 1 – Reports to Stockholders
American Funds
Annual report |

American Funds Global High-Income Opportunities Fund seeks to provide, over the long term, a high level of total return largely comprising current income by investing significantly in higher yielding and generally lower quality debt securities of global issuers.
This fund is one of more than 40 offered by one of the nation’s largest mutual fund families, American Funds, from Capital Group. For more than 80 years, Capital has invested with a long-term focus based on thorough research and attention to risk.
Fund results shown in this report, unless otherwise indicated, are for Class A shares at net asset value. If a sales charge (maximum 3.75%) had been deducted, the results would have been lower. Results are for past periods and are not predictive of results for future periods. Current and future results may be lower or higher than those shown. Share prices and returns will vary, so investors may lose money. Investing for short periods makes losses more likely. Investments are not FDIC-insured, nor are they deposits of or guaranteed by a bank or any other entity, so they may lose value.
Here are the average annual total returns on a $1,000 investment with all distributions reinvested for periods ended March 31, 2014 (the most recent calendar quarter-end):
| Class A shares | 1 year | Lifetime (since 12/14/12) | ||||||
| Reflecting 3.75% maximum sales charge | -0.86 | % | 0.92 | % | ||||
The fund’s estimated gross expense ratio for Class A shares is 1.12% as of the prospectus dated May 1, 2014 (unaudited).
Investment results assume all distributions are reinvested and reflect applicable fees and expenses. The investment adviser is currently reimbursing a portion of other expenses for Class A shares. This reimbursement will be in effect through at least April 30, 2015, unless modified or terminated by the fund’s board. The adviser may elect at its discretion to extend, modify or terminate the reimbursement at that time. Investment results shown reflect the reimbursement, without which the results would have been lower. Refer to the fund’s most recent prospectus for details. Visit americanfunds.com for more information.
Although the fund has plans of distribution for Class A shares, fees for distribution services are not paid by the fund on amounts invested in the fund by the fund’s investment adviser. Expenses shown assume fees for distribution services were charged on these assets. However, because fees for distribution services were not charged on these assets, actual fund expenses were lower and total return was higher. See the “Plans of distribution” section of the prospectus for information on the distribution service fees permitted to be charged by the fund.
The fund’s 30-day yield for Class A shares as of March 31, 2014, reflecting the 3.75% maximum sales charge and calculated in accordance with the U.S. Securities and Exchange Commission (SEC) formula, was 5.05%.
The return of principal for bond funds and for funds with significant underlying bond holdings is not guaranteed. Fund shares are subject to the same interest rate, inflation and credit risks associated with the underlying bond holdings. High-yield bonds are subject to greater fluctuations in value and risk of loss of income and principal than investment-grade bonds. Investing in bonds issued outside the U.S. may be subject to additional risks. They include currency fluctuations, political and social instability, differing securities regulations and accounting standards, higher transaction costs, possible changes in taxation, illiquidity and price volatility. These risks may be heightened in connection with investments in developing countries. Refer to the fund prospectus and the Risk Factors section of this report for more information on these and other risks associated with investing in the fund.
| Contents | ||
| 1 | Letter to investors | |
| 3 | Investment portfolio | |
| 9 | Financial statements | |
| 23 | Board of trustees and other officers | |
We welcome the opportunity to present you with the annual report for American Funds Global High-Income Opportunities Fund. This report covers the period from March 1, 2013, through February 28, 2014.
The fund’s total return for the year was 1.47%, with all distributions reinvested. By way of comparison, the unmanaged Barclays Global High Yield Index, which has no expenses, advanced 8.69%. The table below also shows results for a custom market index and a custom peer group index that may offer a better reflection of the universe in which the fund invests and the peers with which it should be compared.
The fund produced dividends totaling more than 52 cents a share for the period. This resulted in an income return of 5.27% for those reinvesting their dividends and 5.16% for investors taking them in cash. The fund’s net asset value declined from $10.20 to $9.79.
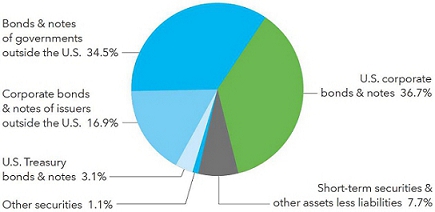
At period-end, 53.6% of the fund was invested in corporate bonds, notes and loans, with another 34.5% invested in non–U.S. sovereign debt. The remainder of the portfolio is invested in other securities, forward contracts, short-term obligations and cash.
Cordially,

Robert H. Neithart
President
April 16, 2014
For current information about the fund, visit americanfunds.com.
Results at a glance
For periods ended February 28, 2014, with all distributions reinvested
| Cumulative total returns | Average annual total returns | |||||||||||
| Lifetime | ||||||||||||
| 6 months | 1 year | (since 12/14/12) | ||||||||||
| Global High-Income Opportunities Fund (Class A shares) | 6.26 | % | 1.47 | % | 3.05 | % | ||||||
| Barclays Global High Yield Index1 | 8.19 | 8.69 | 8.51 | |||||||||
| Custom Global High Yield Index1,2 | 5.88 | 1.44 | 2.13 | |||||||||
| Custom Lipper Blended Index3,4 | 5.41 | 0.71 | 1.76 | |||||||||
| 1 | The market indexes are unmanaged and, therefore, have no expenses. Investors cannot invest directly in an index. |
| 2 | The Custom Global High Yield Index blends the Barclays U.S. Corporate High Yield 2% Issuer Capped Index, J.P. Morgan EMBI Global Index, J.P. Morgan GBI-EM Global Diversified Index and the J.P. Morgan CEMBI Broad Diversified Index by weighting their total returns at 50%, 20%, 20% and 10%, respectively. The portfolio is rebalanced monthly. |
| 3 | Lipper indexes track the largest mutual funds (no more than 30), represented by one share class per fund, in the corresponding Lipper category. |
| 4 | The Custom Lipper Blended Index blends the Lipper High Yield Funds Index, Lipper Emerging Markets Hard Currency Debt Funds Index and the Lipper Emerging Markets Local Currency Debt Funds Index by weighting their total returns at 50%, 30% and 20%, respectively. The portfolio is rebalanced monthly. |
| American Funds Global High-Income Opportunities Fund | 1 |
The value of a $10,000 investment
How a $10,000 investment has fared (for the period December 14, 2012, through February 28, 2014, with dividends reinvested)
Fund results shown reflect deduction of the maximum sales charge of 3.75% on the $10,000 investment.1 Thus, the net amount invested was $9,625.
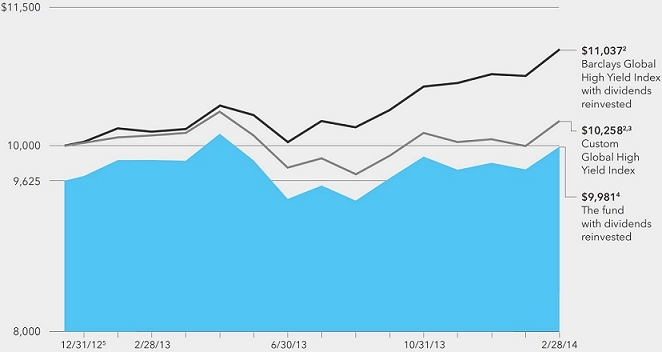
| 1 | As outlined in the prospectus, the sales charge is reduced for accounts (and aggregated investments) of $100,000 or more and is eliminated for purchases of $1 million or more. There is no sales charge on dividends or capital gain distributions that are reinvested in additional shares. |
| 2 | The market indexes are unmanaged and, therefore, have no expenses. Investors cannot invest directly in an index. |
| 3 | The Custom Global High Yield Index blends the Barclays U.S. Corporate High Yield 2% Issuer Capped Index, J.P. Morgan EMBI Global Index, J.P. Morgan GBI-EM Global Diversified Index and the J.P. Morgan CEMBI Broad Diversified Index by weighting their total returns at 50%, 20%, 20% and 10%, respectively. The portfolio is rebalanced monthly. |
| 4 | Includes reinvested dividends of $537 and reinvested capital gains of $13. |
| 5 | For the period December 14, 2012 (commencement of operations), through December 31, 2012. |
Past results are not predictive of results for future periods. The results shown are before taxes on fund distributions and sale of fund shares.
Average annual total returns based on a $1,000 investment (for the periods ended February 28, 2014)*
| 1 year | Lifetime (since 12/14/12) | |||||||
| Class A shares | -2.36 | % | -0.16 | % | ||||
| * | Assumes reinvestment of all distributions and payment of the maximum 3.75% sales charge. |
Investment results assume all distributions are reinvested and reflect applicable fees and expenses. The investment adviser is currently reimbursing a portion of other expenses for Class A shares. This reimbursement will be in effect through at least April 30, 2015, unless modified or terminated by the fund’s board. The adviser may elect at its discretion to extend, modify or terminate the reimbursement at that time. Investment results shown reflect the reimbursement, without which the results would have been lower. Refer to the fund’s most recent prospectus for details. Visit americanfunds.com for more information.
Although the fund has plans of distribution for Class A shares, fees for distribution services are not paid by the fund on amounts invested in the fund by the fund’s investment adviser. Because fees for distribution services were not charged on these assets, total returns were higher. See the “Plans of distribution” section of the prospectus for information on the distribution service fees permitted to be charged by the fund.
| 2 | American Funds Global High-Income Opportunities Fund |
Investment portfolio February 28, 2014
| Portfolio by type of security | Percent of net assets |
| Portfolio quality summary* | Percent of net assets | |||
| U.S. Treasury and agency† | 3.1 | % | ||
| A/A | 4.2 | |||
| Baa/BBB | 18.6 | |||
| Below investment grade | 63.1 | |||
| Unrated | 2.2 | |||
| Other | 1.1 | |||
| Short-term securities & other assets less liabilities | 7.7 | |||
| * | Bond ratings, which typically range from Aaa/AAA (highest) to D (lowest), are assigned by credit rating agencies such as Moody’s, Standard & Poor’s and/or Fitch as an indication of an issuer’s creditworthiness. If agency ratings differ, the security will be considered to have received the highest of those ratings, consistent with the fund’s investment policies. Securities in the “unrated” category (above) have not been rated by a rating agency; however, the investment adviser performs its own credit analysis and assigns comparable ratings that are used for compliance with the fund’s investment policies. The ratings are not covered by the Report of Independent Registered Public Accounting Firm. |
| † | These securities are guaranteed by the full faith and credit of the United States government. |
| Bonds, notes & other debt instruments 91.21% | Principal amount (000) | Value (000) | Percent of net assets | |||||||||
| Corporate bonds, notes & loans 53.60% | ||||||||||||
| Telecommunication services 8.86% | ||||||||||||
| Wind Acquisition SA 11.75% 20171 | $ | 150 | $ | 159 | ||||||||
| Wind Acquisition SA 7.25% 20181 | 400 | 423 | 1.62 | % | ||||||||
| Wind Acquisition SA 7.25% 20181 | 200 | 212 | ||||||||||
| Millicom International Cellular SA 4.75% 20201 | 500 | 483 | ||||||||||
| Millicom International Cellular SA 6.625% 20211 | 200 | 210 | 1.42 | |||||||||
| Sprint Nextel Corp. 7.00% 2020 | 575 | 631 | 1.29 | |||||||||
| NII Capital Corp. 10.00% 2016 | 450 | 200 | ||||||||||
| NII Capital Corp. 7.875% 20191 | 300 | 211 | 1.22 | |||||||||
| NII Capital Corp. 11.375% 20191 | 250 | 186 | ||||||||||
| Digicel Group Ltd. 8.25% 2020 | 250 | 266 | ||||||||||
| Digicel Group Ltd. 6.00% 20211 | 200 | 201 | .95 | |||||||||
| Cricket Communications, Inc. 7.75% 2020 | 350 | 398 | .81 | |||||||||
| Trilogy International Partners, LLC 10.25% 20161 | 375 | 383 | .78 | |||||||||
| Metro PCS Wireless, Inc. 6.25% 2021 | 125 | 134 | ||||||||||
| T-Mobile US, Inc. 6.731% 2022 | 100 | 108 | .77 | |||||||||
| Metro PCS Wireless, Inc. 6.625% 2023 | 125 | 135 | ||||||||||
| 4,340 | 8.86 | |||||||||||
| Industrials 7.75% | ||||||||||||
| Navios Maritime Holdings Inc. and Navios Maritime Finance II (US) Inc. 8.125% 2019 | 300 | 310 | ||||||||||
| Navios Maritime Acquisition Corp. and Navios Acquisition Finance (US) Inc. 8.125% 20211 | 200 | 210 | 1.49 | |||||||||
| Navios Maritime Holdings Inc. 7.375% 20221 | 200 | 208 | ||||||||||
| Nortek Inc. 8.50% 2021 | 525 | 591 | 1.21 | |||||||||
| R.R. Donnelley & Sons Co. 7.25% 2018 | 250 | 291 | ||||||||||
| R.R. Donnelley & Sons Co. 7.875% 2021 | 50 | 57 | .99 | |||||||||
| R.R. Donnelley & Sons Co. 7.00% 2022 | 125 | 139 | ||||||||||
| RZD Capital Ltd. 8.30% 2019 | RUB | 15,000 | 407 | .83 |
| American Funds Global High-Income Opportunities Fund | 3 |
| Bonds, notes & other debt instruments (continued) | Principal amount (000) | Value (000) | Percent of net assets | |||||||||
| Corporate bonds, notes & loans (continued) | ||||||||||||
| Industrials (continued) | ||||||||||||
| Far East Capital Limited SA 8.75% 20201 | $ | 350 | $ | 318 | .65 | % | ||||||
| CEVA Group PLC 11.625% 20161 | 250 | 263 | ||||||||||
| CEVA Group PLC 8.375% 20171 | 33 | 34 | .61 | |||||||||
| ADS Waste Escrow 8.25% 2020 | 250 | 273 | .56 | |||||||||
| Brunswick Rail Finance Ltd. 6.50% 2017 | 250 | 255 | .52 | |||||||||
| Avianca Holdings SA, 8.375% 20201 | 225 | 237 | .48 | |||||||||
| Ply Gem Industries, Inc. 6.50% 20221 | 175 | 178 | .36 | |||||||||
| DAE Aviation Holdings, Inc. and Standard Aero Ltd., Term Loan, 7.75% 20192,3,4 | 25 | 25 | .05 | |||||||||
| 3,796 | 7.75 | |||||||||||
| Health care 7.36% | ||||||||||||
| inVentiv Health Inc. 9.00% 20181 | 400 | 428 | ||||||||||
| inVentiv Health Inc. 11.00% 20181 | 425 | 395 | 1.68 | |||||||||
| DJO Finance LLC 7.75% 2018 | 85 | 90 | ||||||||||
| DJO Finance LLC 8.75% 2018 | 225 | 247 | 1.60 | |||||||||
| DJO Finance LLC 9.875% 2018 | 405 | 445 | ||||||||||
| INC Research LLC 11.50% 20191 | 600 | 677 | 1.38 | |||||||||
| VWR Funding, Inc. 7.25% 2017 | 250 | 269 | .55 | |||||||||
| Forest Laboratories, Inc. 5.00% 20211 | 250 | 268 | .55 | |||||||||
| Select Medical Holdings Corp. 6.375% 2021 | 175 | 179 | .37 | |||||||||
| PRA Holdings, Inc. 9.50% 20231 | 150 | 163 | .33 | |||||||||
| Kinetic Concepts, Inc. 12.50% 2019 | 125 | 145 | .29 | |||||||||
| Centene Corp. 5.75% 2017 | 100 | 109 | .22 | |||||||||
| Symbion Inc. 8.00% 2016 | 100 | 106 | .22 | |||||||||
| Endo Pharmaceuticals Holdings Inc. 5.75% 20221 | 80 | 83 | .17 | |||||||||
| 3,604 | 7.36 | |||||||||||
| Materials 7.04% | ||||||||||||
| CEMEX Finance LLC 9.375% 2022 | 500 | 575 | 1.17 | |||||||||
| JMC Steel Group Inc. 8.25% 20181 | 550 | 574 | 1.17 | |||||||||
| First Quantum Minerals Ltd. 6.75% 20201 | 254 | 263 | ||||||||||
| First Quantum Minerals Ltd. 7.00% 20211 | 254 | 264 | 1.08 | |||||||||
| Walter Energy, Inc. 9.875% 2020 | 275 | 214 | ||||||||||
| Walter Energy, Inc. 8.50% 2021 | 125 | 92 | .62 | |||||||||
| ArcelorMittal 7.25% 20412 | 300 | 306 | .62 | |||||||||
| Ryerson Inc. 11.25% 2018 | 250 | 282 | .59 | |||||||||
| FMG Resources 6.00% 20171 | 250 | 265 | .54 | |||||||||
| Reynolds Group Inc. 9.875% 2019 | 225 | 255 | .52 | |||||||||
| Sibur Securities Ltd. 3.914% 20181 | 200 | 195 | .40 | |||||||||
| LSB Industries, Inc. 7.75% 20191 | 150 | 162 | .33 | |||||||||
| 3,447 | 7.04 | |||||||||||
| Energy 6.63% | ||||||||||||
| Odebrecht Offshore Drilling Finance Ltd., First Lien, 6.625% 20221,3 | 200 | 207 | ||||||||||
| Odebrecht Offshore Drilling Finance Ltd. 6.75% 20221,3 | 197 | 203 | .84 | |||||||||
| Arch Coal, Inc. 7.25% 2021 | 500 | 405 | .83 | |||||||||
| Teekay Corp. 8.50% 2020 | 350 | 394 | .80 | |||||||||
| PDC Energy Inc. 7.75% 2022 | 350 | 384 | .78 | |||||||||
| Sabine Pass Liquefaction, LLC 5.625% 20211 | 275 | 283 | .58 | |||||||||
| Peabody Energy Corp. 6.00% 2018 | 250 | 272 | .56 | |||||||||
| Petróleos Mexicanos 6.50% 2041 | 250 | 271 | .55 | |||||||||
| Alpha Natural Resources, Inc. 6.00% 2019 | 300 | 259 | .53 | |||||||||
| 4 | American Funds Global High-Income Opportunities Fund |
| Bonds, notes & other debt instruments (continued) | Principal amount (000) | Value (000) | Percent of net assets | |||||||||
| Corporate bonds, notes & loans (continued) | ||||||||||||
| Energy (continued) | ||||||||||||
| CONSOL Energy Inc. 8.25% 2020 | $ | 225 | $ | 246 | .50 | % | ||||||
| Samson Investment Co. 10.50% 20201 | 200 | 223 | .45 | |||||||||
| NGPL PipeCo LLC 7.119% 20171 | 75 | 74 | ||||||||||
| NGPL PipeCo LLC 9.625% 20191 | 25 | 27 | .21 | |||||||||
| 3,248 | 6.63 | |||||||||||
| Consumer discretionary 6.19% | ||||||||||||
| Boyd Gaming Corp. 9.00% 2020 | 750 | 819 | 1.67 | |||||||||
| Caesars Entertainment Operating Co. 11.25% 2017 | 300 | 307 | ||||||||||
| Caesars Entertainment Operating Co. 9.00% 2020 | 300 | 293 | 1.23 | |||||||||
| Toys “R” Us-Delaware, Inc. 7.375% 20161 | 250 | 232 | .47 | |||||||||
| VTR Finance BV 6.875% 20241 | 225 | 231 | .47 | |||||||||
| Neiman Marcus Group LTD Inc. 8.00% 20211 | 125 | 135 | ||||||||||
| Neiman Marcus Group LTD Inc. 8.75% 20211,2,5 | 75 | 81 | .44 | |||||||||
| Laureate Education, Inc. 9.25% 20191 | 200 | 215 | .44 | |||||||||
| DISH DBS Corp. 4.625% 2017 | 200 | 213 | .43 | |||||||||
| Sotheby’s Holdings, Inc. 5.25% 20221 | 200 | 194 | .40 | |||||||||
| Automotores Gildemeister SA 8.25% 2021 | 150 | 114 | .39 | |||||||||
| Automotores Gildemeister SA 8.25% 20211 | 100 | 76 | ||||||||||
| Grupo Televisa, SAB 7.25% 2043 | MXN | 2,000 | 123 | .25 | ||||||||
| 3,033 | 6.19 | |||||||||||
| Information technology 3.91% | ||||||||||||
| First Data Holdings, Inc. 14.50% 20191,5 | $ | 250 | 241 | |||||||||
| First Data Corp. 11.75% 20211 | 200 | 215 | 1.21 | |||||||||
| First Data Corp. 8.75% 20221,2,5 | 125 | 137 | ||||||||||
| NXP BV and NXP Funding LLC 3.75% 20181 | 475 | 483 | .99 | |||||||||
| Alcatel-Lucent USA Inc. 4.625% 20171 | 300 | 311 | .63 | |||||||||
| Global A&T Electronics Ltd. 10.00% 20191 | 275 | 230 | .47 | |||||||||
| SRA International, Inc. 11.00% 2019 | 150 | 157 | .32 | |||||||||
| Lawson Software, Inc. 9.375% 2019 | 125 | 142 | .29 | |||||||||
| 1,916 | 3.91 | |||||||||||
| Financials 3.73% | ||||||||||||
| Crescent Resources 10.25% 20171 | 400 | 449 | .92 | |||||||||
| Realogy Corp. 9.00% 20201 | 350 | 404 | .83 | |||||||||
| iStar Financial Inc., Series B, 9.00% 2017 | 125 | 149 | ||||||||||
| iStar Financial Inc., 4.875% 2018 | 200 | 203 | .72 | |||||||||
| CIT Group Inc. 5.00% 2017 | 225 | 242 | .49 | |||||||||
| BBVA Bancomer SA 6.50% 2021 | 200 | 218 | .45 | |||||||||
| Icahn Enterprises Finance Corp. 6.00% 20201 | 150 | 159 | .32 | |||||||||
| 1,824 | 3.73 | |||||||||||
| �� | ||||||||||||
| Utilities 1.23% | ||||||||||||
| AES Corp. 8.00% 2017 | 200 | 237 | .49 | |||||||||
| NRG Energy, Inc. 6.625% 2023 | 200 | 212 | .43 | |||||||||
| Emgesa SA ESP 8.75% 2021 | COP | 300,000 | 153 | .31 | ||||||||
| 602 | 1.23 | |||||||||||
| Consumer staples 0.90% | ||||||||||||
| Marfrig Holdings (Europe) BV 9.875% 20171 | $ | 225 | 231 | .47 | ||||||||
| C&S Group Enterprises LLC 8.375% 20171 | 200 | 211 | .43 | |||||||||
| 442 | .90 | |||||||||||
| Total corporate bonds, notes & loans | 26,252 | 53.60 | ||||||||||
| American Funds Global High-Income Opportunities Fund | 5 |
| Bonds, notes & other debt instruments (continued) | Principal amount (000) | Value (000) | Percent of net assets | |||||||||
| Bonds & notes of governments outside the U.S. 34.47% | ||||||||||||
| Greek Government 2.00%/3.00% 20236 | € | 125 | $ | 132 | ||||||||
| Greek Government 2.00%/3.00% 20246 | 125 | 129 | ||||||||||
| Greek Government 2.00%/3.00% 20256 | 125 | 126 | ||||||||||
| Greek Government 2.00%/3.00% 20266 | 125 | 123 | ||||||||||
| Greek Government 2.00%/3.00% 20276 | 125 | 120 | ||||||||||
| Greek Government 2.00%/3.00% 20286 | 125 | 118 | ||||||||||
| Greek Government 2.00%/3.00% 20296 | 125 | 116 | ||||||||||
| Greek Government 2.00%/3.00% 20306 | 125 | 115 | ||||||||||
| Greek Government 2.00%/3.00% 20316 | 125 | 113 | ||||||||||
| Greek Government 2.00%/3.00% 20326 | 125 | 112 | ||||||||||
| Greek Government 2.00%/3.00% 20336 | 125 | 111 | 4.66 | % | ||||||||
| Greek Government 2.00%/3.00% 20346 | 125 | 110 | ||||||||||
| Greek Government 2.00%/3.00% 20356 | 125 | 109 | ||||||||||
| Greek Government 2.00%/3.00% 20366 | 125 | 108 | ||||||||||
| Greek Government 2.00%/3.00% 20376 | 125 | 108 | ||||||||||
| Greek Government 2.00%/3.00% 20386 | 125 | 107 | ||||||||||
| Greek Government 2.00%/3.00% 20396 | 125 | 107 | ||||||||||
| Greek Government 2.00%/3.00% 20406 | 125 | 106 | ||||||||||
| Greek Government 2.00%/3.00% 20416 | 125 | 106 | ||||||||||
| Greek Government 2.00%/3.00% 20426 | 125 | 106 | ||||||||||
| Brazil (Federal Republic of) 10.00% 2017 | BRL | 2,000 | 810 | 3.57 | ||||||||
| Brazil (Federal Republic of) 6.00% 20457 | 2,420 | 936 | ||||||||||
| Russian Federation 7.50% 2018 | RUB | 37,300 | 1,035 | |||||||||
| Russian Federation 5.00% 2020 | $ | 400 | 430 | 2.99 | ||||||||
| United Mexican States Government 3.50% 20177 | MXN | 7,697 | 623 | |||||||||
| United Mexican States Government, Series M20, 10.00% 2024 | 8,500 | 823 | 2.94 | |||||||||
| Portuguese Government 4.95% 2023 | € | 320 | 452 | |||||||||
| Portuguese Government 5.65% 2024 | 120 | 177 | 2.74 | |||||||||
| Portuguese Government 4.10% 2037 | 600 | 714 | ||||||||||
| Turkey (Republic of) 9.50% 2022 | TRY | 1,500 | 663 | |||||||||
| Turkey (Republic of) 6.875% 2036 | $ | 425 | 451 | 2.28 | ||||||||
| Slovenia (Republic of) 5.50% 2022 | 500 | 524 | 2.17 | |||||||||
| Slovenia (Republic of) 5.85% 20231 | 500 | 540 | ||||||||||
| Colombia (Republic of) Global 9.85% 2027 | COP | 1,230,000 | 728 | 1.49 | ||||||||
| Venezuela (Republic of) 9.25% 2027 | $ | 900 | 657 | 1.34 | ||||||||
| Polish Government, Series 0922, 5.75% 2022 | PLN | 1,750 | 638 | 1.30 | ||||||||
| Iraq (Republic of) 5.80% 20283 | $ | 700 | 609 | 1.24 | ||||||||
| Uruguay (Republic of) 4.25% 20273,7 | UYU | 13,607 | 595 | 1.22 | ||||||||
| Philippines (Republic of) 6.375% 2022 | PHP | 16,325 | 416 | |||||||||
| Philippines (Republic of) 7.75% 2031 | $ | 125 | 171 | 1.20 | ||||||||
| Republic of Belarus 8.95% 2018 | 500 | 510 | 1.04 | |||||||||
| South Africa (Republic of), Series R-2023, 7.75% 2023 | ZAR | 4,025 | 358 | .73 | ||||||||
| Dominican Republic 8.625% 20273 | $ | 300 | 333 | .68 | ||||||||
| Bahrain Government 5.50% 2020 | 250 | 273 | .56 | |||||||||
| Sri Lanka (Republic of) 6.25% 2021 | 250 | 262 | .54 | |||||||||
| Lithuania (Republic of) 6.625% 2022 | 200 | 238 | .49 | |||||||||
| Thai Government 3.625% 2023 | THB | 7,450 | 228 | .47 | ||||||||
| Chilean Government 6.00% 2021 | CLP | 110,000 | 210 | .43 | ||||||||
| Peru (Republic of) 7.35% 2025 | $ | 150 | 192 | .39 | ||||||||
| 16,878 | 34.47 | |||||||||||
| 6 | American Funds Global High-Income Opportunities Fund |
| Bonds, notes & other debt instruments (continued) | Principal amount (000) | Value (000) | Percent of net assets | |||||||||
| U.S. Treasury bonds & notes 3.14% | ||||||||||||
| U.S. Treasury 0.25% 2015 | $ | 1,535 | $ | 1,537 | 3.14 | % | ||||||
| Total bonds, notes & other debt instruments (cost: $45,806,000) | 44,667 | 91.21 | ||||||||||
| Convertible securities 0.87% | Shares | |||||||||||
| Industrials 0.87% | ||||||||||||
| CEVA Group PLC, Series A-1, 3.239% convertible preferred8 | 145 | 188 | ||||||||||
| CEVA Group PLC, Series A-2, 2.239% convertible preferred8,9 | 231 | 240 | .87 | |||||||||
| Total convertible securities (cost: $427,000) | 428 | .87 | ||||||||||
| Common stocks 0.23% | ||||||||||||
| Industrials 0.23% | ||||||||||||
| CEVA Group PLC1,8,10 | 107 | 111 | .23 | |||||||||
| Total common stocks (cost: $124,000) | 111 | .23 | ||||||||||
| Short-term securities 5.11% | Principal amount (000) | |||||||||||
| BNP Paribas Finance Inc. 0.05% due 3/3/2014 | $ | 1,100 | 1,100 | 2.25 | ||||||||
| Sumitomo Mitsui Banking Corp. 0.12% due 3/4/20141 | 900 | 900 | 1.84 | |||||||||
| Gotham Funding Corp. 0.14% due 3/14/20141 | 500 | 500 | 1.02 | |||||||||
| Total short-term securities (cost: $2,500,000) | 2,500 | 5.11 | ||||||||||
| Total investment securities (cost: $48,857,000) | 47,706 | 97.42 | ||||||||||
| Other assets less liabilities | 1,259 | 2.58 | ||||||||||
| Net assets | $ | 48,965 | 100.00 | % | ||||||||
Forward currency contracts
The fund has entered into forward currency contracts to sell currencies as shown in the following table. The average notional amount of open forward currency contracts was $3,284,000 over the prior 10-month period.
| Unrealized | ||||||||||||||||
| appreciation | ||||||||||||||||
| Contract amount | (depreciation) | |||||||||||||||
| Receive | Deliver | at 2/28/2014 | ||||||||||||||
| Settlement date | Counterparty | (000) | (000) | (000) | ||||||||||||
| Sales: | ||||||||||||||||
| Brazilian reais | 4/3/2014 | Citibank | $786 | BRL1,850 | $5 | |||||||||||
| Colombian pesos | 3/11/2014 | Citibank | $346 | COP710,225 | (1 | ) | ||||||||||
| Euros | 3/12/2014 | Citibank | $1,842 | €1,350 | (22 | ) | ||||||||||
| Mexican pesos | 3/10/2014 | Bank of New York Mellon | $721 | MXN9,550 | 1 | |||||||||||
| Turkish lira | 3/24/2014 | Bank of New York Mellon | $405 | TRY900 | 1 | |||||||||||
| $(16 | ) | |||||||||||||||
| American Funds Global High-Income Opportunities Fund | 7 |
| 1 | Acquired in a transaction exempt from registration under Rule 144A or section 4(2) of the Securities Act of 1933. May be resold in the U.S. in transactions exempt from registration, normally to qualified institutional buyers. The total value of all such securities was $14,956,000, which represented 30.54% of the net assets of the fund. |
| 2 | Coupon rate may change periodically. |
| 3 | Principal payments may be made periodically. Therefore, the effective maturity date may be earlier than the stated maturity date. |
| 4 | Loan participations and assignments; may be subject to legal or contractual restrictions on resale. The total value of all such loans was $25,000, which represented .05% of the net assets of the fund. |
| 5 | Payment in kind; the issuer has the option of paying additional securities in lieu of cash. |
| 6 | Step bond; coupon rate will increase at a later date. |
| 7 | Index-linked bond whose principal amount moves with a government price index. |
| 8 | Valued under fair value procedures adopted by authority of the board of trustees. The total value of all such securities was $539,000, which represented 1.10% of the net assets of the fund. |
| 9 | Acquired through a private placement transaction exempt from registration under the Securities Act of 1933. This security (acquired on 12/14/2012 at a cost of $280,000) may be subject to legal or contractual restrictions on resale. |
| 10 | Security did not produce income during the last 12 months. |
Key to abbreviations and symbol
BRL = Brazilian reais
CLP = Chilean pesos
COP = Colombian pesos
€ = Euros
MXN = Mexican pesos
PHP = Philippine pesos
PLN = Polish zloty
RUB = Russian rubles
THB = Thai baht
TRY = Turkish lira
UYU = Uruguayan pesos
ZAR = South African rand
See Notes to Financial Statements
| 8 | American Funds Global High-Income Opportunities Fund |
| Statement of assets and liabilities | ||||||||
| at February 28, 2014 | (dollars in thousands) | |||||||
| Assets: | ||||||||
| Investment securities, at value (cost: $48,857) | $ | 47,706 | ||||||
| Cash | 89 | |||||||
| Unrealized appreciation on open forward currency contracts | 7 | |||||||
| Receivables for: | ||||||||
| Sales of investments | $ | 424 | ||||||
| Interest | 818 | 1,242 | ||||||
| 49,044 | ||||||||
| Liabilities: | ||||||||
| Unrealized depreciation on open forward currency contracts | 23 | |||||||
| Payables for: | ||||||||
| Closed forward currency contracts | 31 | |||||||
| Investment advisory services | 21 | |||||||
| Services provided by related parties | — | * | ||||||
| Other | 4 | 56 | ||||||
| Net assets at February 28, 2014 | $ | 48,965 | ||||||
| Net assets consist of: | ||||||||
| Capital paid in on shares of beneficial interest | $ | 50,000 | ||||||
| Undistributed net investment income | 537 | |||||||
| Accumulated net realized loss | (399 | ) | ||||||
| Net unrealized depreciation | (1,173 | ) | ||||||
| Net assets at February 28, 2014 | $ | 48,965 | ||||||
(dollars and shares in thousands, except per-share amounts)
Shares of beneficial interest issued and outstanding (no stated par value) —
unlimited shares authorized (5,000 total shares outstanding)
| Net assets | Shares outstanding | Net asset value per share | ||||||||||
| Class A | $ | 48,965 | 5,000 | $ | 9.79 | |||||||
| * | Amount less than one thousand. |
See Notes to Financial Statements
| American Funds Global High-Income Opportunities Fund | 9 |
| Statement of operations for the year ended February 28, 2014 | (dollars in thousands) | |||||||
| Investment income: | ||||||||
| Income: | ||||||||
| Interest | $ | 3,121 | ||||||
| Fees and expenses*: | ||||||||
| Investment advisory services | $ | 281 | ||||||
| Administrative services | 5 | |||||||
| Reports to shareholders | 9 | |||||||
| Registration statement and prospectus | 16 | |||||||
| Trustees’ compensation | — | † | ||||||
| Auditing and legal | 11 | |||||||
| Custodian | 8 | |||||||
| Other | 12 | |||||||
| Total fees and expenses before reimbursement | 342 | |||||||
| Less reimbursement of fees and expenses | 27 | |||||||
| Total fees and expenses after reimbursement | 315 | |||||||
| Net investment income | 2,806 | |||||||
| Net realized loss and unrealized depreciation on investments, forward currency contracts and currency: | ||||||||
| Net realized (loss) gain on: | ||||||||
| Investments | (477 | ) | ||||||
| Forward currency contracts | 126 | |||||||
| Currency transactions | (29 | ) | (380 | ) | ||||
| Net unrealized depreciation on: | ||||||||
| Investments | (1,742 | ) | ||||||
| Forward currency contracts | (16 | ) | ||||||
| Currency translations | (4 | ) | (1,762 | ) | ||||
| Net realized loss and unrealized depreciation on investments, forward currency contracts and currency | (2,142 | ) | ||||||
| Net increase in net assets resulting from operations | $ | 664 | ||||||
| * | Additional information related to class-specific fees and expenses is included in the Notes to Financial Statements. |
| † | Amount less than one thousand. |
See Notes to Financial Statements
| 10 | American Funds Global High-Income Opportunities Fund |
Statements of changes in net assets
(dollars in thousands)
| For the period | ||||||||
| Year ended | December 14, 2012* | |||||||
| February 28, 2014 | to February 28, 2013 | |||||||
| Operations: | ||||||||
| Net investment income | $ | 2,806 | $ | 529 | ||||
| Net realized loss on investments, forward currency contracts and currency transactions | (380 | ) | (25 | ) | ||||
| Net unrealized (depreciation) appreciation on investments, forward currency contracts and currency translations | (1,762 | ) | 589 | |||||
| Net increase in net assets resulting from operations | 664 | 1,093 | ||||||
| Dividends and distributions paid to shareholders: | ||||||||
| Dividends from net investment income | (2,630 | ) | (97 | ) | ||||
| Distributions from net realized gain on investments | (65 | ) | — | |||||
| Total dividends and distributions paid to shareholders | (2,695 | ) | (97 | ) | ||||
| Net capital share transactions | — | 50,000 | ||||||
| Total (decrease) increase in net assets | (2,031 | ) | 50,996 | |||||
| Net assets: | ||||||||
| Beginning of year | 50,996 | — | ||||||
| End of year (including undistributed net investment income: $537 and $341, respectively) | $ | 48,965 | $ | 50,996 | ||||
| * | Commencement of operations. |
See Notes to Financial Statements
| American Funds Global High-Income Opportunities Fund | 11 |
Notes to financial statements
1. Organization
American Funds Global High-Income Opportunities Fund (the “fund”) is registered under the Investment Company Act of 1940 as an open-end, nondiversified management investment company. The fund seeks to provide, over the long term, a high level of total return largely comprising current income by investing significantly in higher yielding and generally lower quality debt securities of global issuers.
The fund has 16 share classes consisting of five retail share classes (Classes A, B and C, as well as two F share classes, F-1 and F-2), five 529 college savings plan share classes (Classes 529-A, 529-B, 529-C, 529-E and 529-F-1) and six retirement plan share classes (Classes R-1, R-2, R-3, R-4, R-5 and R-6). The 529 college savings plan share classes can be used to save for college education. The retirement plan share classes are generally offered only through eligible employer-sponsored retirement plans. The fund’s share classes are described further in the following table:
| Share class | Initial sales charge | Contingent deferred sales charge upon redemption | Conversion feature | ||||
| Classes A and 529-A | Up to 3.75% | None (except 1% for certain redemptions within one year of purchase without an initial sales charge) | None | ||||
| Classes B and 529-B* | None | Declines from 5% to 0% for redemptions within six years of purchase | Classes B and 529-B convert to Classes A and 529-A, respectively, after eight years | ||||
| Class C | None | 1% for redemptions within one year of purchase | Class C converts to Class F-1 after 10 years | ||||
| Class 529-C | None | 1% for redemptions within one year of purchase | None | ||||
| Class 529-E | None | None | None | ||||
| Classes F-1, F-2 and 529-F-1 | None | None | None | ||||
| Classes R-1, R-2, R-3, R-4, R-5 and R-6 | None | None | None |
| * | Class B and 529-B shares of the fund are not available for purchase. |
Holders of all share classes have equal pro rata rights to assets, dividends and liquidation proceeds. Each share class has identical voting rights, except for the exclusive right to vote on matters affecting only its class. Share classes have different fees and expenses (“class-specific fees and expenses”), primarily due to different arrangements for distribution, administrative and shareholder services. Differences in class-specific fees and expenses will result in differences in net investment income and, therefore, the payment of different per-share dividends by each share class.
2. Significant accounting policies
The financial statements have been prepared to comply with accounting principles generally accepted in the United States of America. These principles require management to make estimates and assumptions that affect reported amounts and disclosures. Actual results could differ from those estimates. The fund follows the significant accounting policies described in this section, as well as the valuation policies described in the next section on valuation.
Security transactions and related investment income — Security transactions are recorded by the fund as of the date the trades are executed with brokers. Realized gains and losses from security transactions are determined based on the specific identified cost of the securities. In the event a security is purchased with a delayed payment date, the fund will segregate liquid assets sufficient to meet its payment obligations. Interest income is recognized on an accrual basis. Market discounts, premiums and original issue discounts on fixed-income securities are amortized daily over the expected life of the security.
Class allocations — Income, fees and expenses (other than class-specific fees and expenses) and realized and unrealized gains and losses are allocated daily among the various share classes based on their relative net assets. Class-specific fees and expenses, such as distribution, administrative and shareholder services, are charged directly to the respective share class.
Dividends and distributions to shareholders — Dividends and distributions to shareholders are recorded on the ex-dividend date.
| 12 | American Funds Global High-Income Opportunities Fund |
Currency translation — Assets and liabilities, including investment securities, denominated in currencies other than U.S. dollars are translated into U.S. dollars at the exchange rates supplied by one or more pricing vendors on the valuation date. Purchases and sales of investment securities and income and expenses are translated into U.S. dollars at the exchange rates on the dates of such transactions. The effects of changes in exchange rates on investment securities are included with the net realized gain or loss and net unrealized appreciation or depreciation on investments in the fund’s statement of operations. The realized gain or loss and unrealized appreciation or depreciation resulting from all other transactions denominated in currencies other than U.S. dollars are disclosed separately.
3. Valuation
Capital Research and Management Company (“CRMC”), the fund’s investment adviser, values the fund’s investments at fair value as defined by accounting principles generally accepted in the United States of America. The net asset value of each share class of the fund is generally determined as of approximately 4:00 p.m. New York time each day the New York Stock Exchange is open.
Methods and inputs — The fund’s investment adviser uses the following methods and inputs to establish the fair value of the fund’s assets and liabilities. Use of particular methods and inputs may vary over time based on availability and relevance as market and economic conditions evolve.
Equity securities are generally valued at the official closing price of, or the last reported sale price on, the exchange or market on which such securities are traded, as of the close of business on the day the securities are being valued or, lacking any sales, at the last available bid price. Prices for each security are taken from the principal exchange or market on which the security trades.
Fixed-income securities, including short-term securities purchased with more than 60 days left to maturity, are generally valued at prices obtained from one or more pricing vendors. Vendors value such securities based on one or more of the inputs described in the following table. The table provides examples of inputs that are commonly relevant for valuing particular classes of fixed-income securities in which the fund is authorized to invest. However, these classifications are not exclusive, and any of the inputs may be used to value any other class of fixed-income security.
| Fixed-income class | Examples of standard inputs | |
| All | Benchmark yields, transactions, bids, offers, quotations from dealers and trading systems, new issues, spreads and other relationships observed in the markets among comparable securities; and proprietary pricing models such as yield measures calculated using factors such as cash flows, financial or collateral performance and other reference data (collectively referred to as “standard inputs”) | |
| Corporate bonds, notes & loans; convertible securities | Standard inputs and underlying equity of the issuer | |
| Bonds & notes of governments & government agencies | Standard inputs and interest rate volatilities | |
| Mortgage-backed; asset-backed obligations | Standard inputs and cash flows, prepayment information, default rates, delinquency and loss assumptions, collateral characteristics, credit enhancements and specific deal information | |
| Municipal securities | Standard inputs and, for certain distressed securities, cash flows or liquidation values using a net present value calculation based on inputs that include, but are not limited to, financial statements and debt contracts |
When the fund’s investment adviser deems it appropriate to do so (such as when vendor prices are unavailable or not deemed to be representative), fixed-income securities will be valued in good faith at the mean quoted bid and ask prices that are reasonably and timely available (or bid prices, if ask prices are not available) or at prices for securities of comparable maturity, quality and type.
Securities with both fixed-income and equity characteristics, or equity securities traded principally among fixed-income dealers, are generally valued in the manner described for either equity or fixed-income securities, depending on which method is deemed most appropriate by the fund’s investment adviser. Short-term securities purchased within 60 days to maturity are valued at amortized cost, which approximates fair value. The value of short-term securities originally purchased with maturities greater than 60 days is determined based on an amortized value to par when they reach 60 days. Forward currency contracts are valued at the mean of representative quoted bid and ask prices, generally based on prices supplied by one or more pricing vendors.
| American Funds Global High-Income Opportunities Fund | 13 |
Securities and other assets for which representative market quotations are not readily available or are considered unreliable by the fund’s investment adviser are fair valued as determined in good faith under fair valuation guidelines adopted by authority of the fund’s board of trustees as further described. The investment adviser follows fair valuation guidelines, consistent with U.S. Securities and Exchange Commission rules and guidance, to consider relevant principles and factors when making fair value determinations. The investment adviser considers relevant indications of value that are reasonably and timely available to it in determining the fair value to be assigned to a particular security, such as the type and cost of the security; contractual or legal restrictions on resale of the security; relevant financial or business developments of the issuer; actively traded similar or related securities; conversion or exchange rights on the security; related corporate actions; significant events occurring after the close of trading in the security; and changes in overall market conditions. Fair valuations and valuations of investments that are not actively trading involve judgment and may differ materially from valuations that would have been used had greater market activity occurred.
Processes and structure — The fund’s board of trustees has delegated authority to the fund’s investment adviser to make fair value determinations, subject to board oversight. The investment adviser has established a Joint Fair Valuation Committee (the “Fair Valuation Committee”) to administer, implement and oversee the fair valuation process, and to make fair value decisions. The Fair Valuation Committee regularly reviews its own fair value decisions, as well as decisions made under its standing instructions to the investment adviser’s valuation teams. The Fair Valuation Committee reviews changes in fair value measurements from period to period and may, as deemed appropriate, update the fair valuation guidelines to better reflect the results of back testing and address new or evolving issues. The Fair Valuation Committee reports any changes to the fair valuation guidelines to the board of trustees with supplemental information to support the changes. The fund’s board and audit committee also regularly review reports that describe fair value determinations and methods.
The fund’s investment adviser has also established a Fixed-Income Pricing Review Group to administer and oversee the fixed-income valuation process, including the use of fixed-income pricing vendors. This group regularly reviews pricing vendor information and market data. Pricing decisions, processes and controls over security valuation are also subject to additional internal reviews, including an annual control self-evaluation program facilitated by the investment adviser’s compliance group.
Classifications — The fund’s investment adviser classifies the fund’s assets and liabilities into three levels based on the inputs used to value the assets or liabilities. Level 1 values are based on quoted prices in active markets for identical securities. Level 2 values are based on significant observable market inputs, such as quoted prices for similar securities and quoted prices in inactive markets. Level 3 values are based on significant unobservable inputs that reflect the investment adviser’s determination of assumptions that market participants might reasonably use in valuing the securities. The valuation levels are not necessarily an indication of the risk or liquidity associated with the underlying investment. For example, U.S. government securities are reflected as Level 2 because the inputs used to determine fair value may not always be quoted prices in an active market. At February 28, 2014, all of the fund’s investments were classified as Level 2.
4. Risk factors
Investing in the fund may involve certain risks including, but not limited to, those described below.
Market conditions — The prices of, and the income generated by, the securities held by the fund may decline – sometimes rapidly or unpredictably – due to various factors, including events or conditions affecting the general economy or particular industries; overall market changes; local, regional or global political, social or economic instability; governmental or governmental agency responses to economic conditions; and currency, interest rate and commodity price fluctuations.
Issuer risks — The values of, and the income generated by, securities held by the fund may also decline in response to various factors directly related to the issuers of such securities, including reduced demand for an issuer’s goods or services, poor management performance and strategic initiatives such as mergers, acquisitions or dispositions and the market response to any such initiative.
Investing in debt instruments — The prices of, and the income generated by, bonds and other debt securities held by the fund may be affected by changing interest rates and by changes in the effective maturities and credit ratings of these securities.
Rising interest rates will generally cause the prices of bonds and other debt securities to fall. Falling interest rates may cause an issuer to redeem, call or refinance a debt security before its stated maturity, which may result in the fund having to reinvest the proceeds in lower yielding securities. Longer maturity debt securities generally have higher rates of interest and may be subject to greater price fluctuations than shorter maturity debt securities.
| 14 | American Funds Global High-Income Opportunities Fund |
Bonds and other debt securities are also subject to credit risk, which is the possibility that the credit strength of an issuer will weaken and/or an issuer of a debt security will fail to make timely payments of principal or interest and the security will go into default. Lower quality debt securities generally have higher rates of interest and may be subject to greater price fluctuations than higher quality debt securities. Credit risk is gauged, in part, by the credit ratings of the debt securities in which the fund invests. However, ratings are only the opinions of the rating agencies issuing them and are not guarantees as to credit quality or an evaluation of market risk. The fund’s investment adviser relies on its own credit analysts to research issuers and issues in seeking to mitigate various credit and default risks.
Investing in lower rated bonds — Lower rated bonds and other lower rated debt securities generally have higher rates of interest and involve greater risk of default or price declines due to changes in the issuer’s creditworthiness than those of higher quality debt securities. The market prices of these securities may fluctuate more than the prices of higher quality debt securities and may decline significantly in periods of general economic difficulty. These risks may be increased with respect to investments in “junk bonds.”
Investing outside the U.S. — Securities of issuers domiciled outside the U.S., or with significant operations outside the U.S., may lose value because of adverse political, social, economic or market developments in the countries or regions in which the issuers operate. These securities may also lose value due to changes in foreign currency exchange rates against the U.S. dollar and/or currencies of other countries. Securities markets in certain countries may be more volatile and/or less liquid than those in the U.S. Investments outside the U.S. may also be subject to different accounting practices and different regulatory, legal and reporting standards, and may be more difficult to value, than those in the U.S. In addition, the value of investments outside the U.S. may be reduced by foreign taxes, including foreign withholding taxes on interest and dividends. Further, there may be increased risks of delayed settlement of securities purchased or sold by the fund. The risks of investing outside the U.S. may be heightened in connection with investments in emerging markets.
Thinly traded securities — There may be little trading in the secondary market for particular bonds or other debt securities, which may make them more difficult to value, acquire or sell.
Nondiversification risk — As a nondiversified fund, the fund has the ability to invest a larger percentage of its assets in the securities of a smaller number of issuers than a diversified fund. Although the fund does not intend to limit its investments to the securities of a small number of issuers, if it were to do so, poor performance by a single large holding could adversely impact the fund’s investment results more than if the fund were invested in a larger number of issuers.
Management — The investment adviser to the fund actively manages the fund’s investments. Consequently, the fund is subject to the risk that the methods and analyses employed by the investment adviser in this process may not produce the desired results. This could cause the fund to lose value or its investment results to lag relevant benchmarks or other funds with similar objectives.
5. Certain investment techniques
Loan transactions — The fund has entered into loan transactions in which the fund acquires a loan either through an agent, by assignment from another holder, or as a participation interest in another holder’s portion of a loan. The loan is often administered by a financial institution that acts as agent for the holders of the loan, and the fund may be required to receive approval from the agent and/or borrower prior to the sale of the investment. The loan’s interest rate and maturity date may change based on the terms of the loan, including potential early payments of principal.
Forward currency contracts — The fund has entered into forward currency contracts, which represent agreements to exchange currencies on specific future dates at predetermined rates. The fund’s investment adviser uses forward currency contracts to manage the fund’s exposure to changes in exchange rates. Upon entering into these contracts, risks may arise from the potential inability of counterparties to meet the terms of their contracts and from possible movements in exchange rates.
On a daily basis, the fund’s investment adviser values forward currency contracts and records unrealized appreciation or depreciation for open forward currency contracts in the fund’s statement of assets and liabilities. Realized gains or losses are recorded at the time the forward currency contract is closed or offset by another contract with the same broker for the same settlement date and currency.
Closed forward currency contracts that have not reached their settlement date are included in the respective receivables or payables for closed forward currency contracts in the fund’s statement of assets and liabilities. Net realized gains or losses from closed forward currency contracts and net unrealized appreciation or depreciation from open forward currency contracts are recorded in the fund’s statement of operations.
| American Funds Global High-Income Opportunities Fund | 15 |
The following tables present the financial statement impacts resulting from the fund’s use of forward currency contracts as of February 28, 2014 (dollars in thousands):
| Asset | Liability | |||||||||||
| Contract | Location on statement of assets and liabilities | Value | Location on statement of assets and liabilities | Value | ||||||||
| Forward currency | Unrealized appreciation on open forward currency contracts | $ | 7 | Unrealized depreciation on open forward currency contracts | $ | 23 | ||||||
| Forward currency | Receivables for closed forward currency contracts | — | Payables for closed forward currency contracts | 31 | ||||||||
| $ | 7 | $ | 54 | |||||||||
| Net realized gain | Net unrealized depreciation | |||||||||||
| Contract | Location on statement of operations | Value | Location on statement of operations | Value | ||||||||
| Forward currency | Net realized gain on forward currency contracts | $ | 126 | Net unrealized depreciation on forward currency contracts | $ | (16 | ) | |||||
| $ | 126 | $ | (16 | ) | ||||||||
6. Taxation and distributions
Federal income taxation — The fund complies with the requirements under Subchapter M of the Internal Revenue Code applicable to mutual funds and intends to distribute substantially all of its net taxable income and net capital gains each year. The fund is not subject to income taxes to the extent such distributions are made. Therefore, no federal income tax provision is required.
As of and during the period ended February 28, 2014, the fund did not have a liability for any unrecognized tax benefits. The fund recognizes interest and penalties, if any, related to unrecognized tax benefits as income tax expense in the statement of operations. During the period, the fund did not incur any interest or penalties.
The fund is not subject to examination by U.S. federal and state tax authorities for tax years before 2012, the year the fund commenced operations.
Non-U.S. taxation — Interest income is recorded net of non-U.S. taxes paid. Gains realized by the fund on the sale of securities in certain countries are subject to non-U.S. taxes. The fund records a liability based on unrealized gains to provide for potential non-U.S. taxes payable upon the sale of these securities.
Distributions — Distributions paid to shareholders are based on net investment income and net realized gains determined on a tax basis, which may differ from net investment income and net realized gains for financial reporting purposes. These differences are due primarily to different treatment for items such as currency gains and losses; short-term capital gains and losses; capital losses related to sales of certain securities within 30 days of purchase; cost of investments sold; and net capital losses. The fiscal year in which amounts are distributed may differ from the year in which the net investment income and net realized gains are recorded by the fund for financial reporting purposes.
During the year ended February 28, 2014, the fund reclassified $20,000 from accumulated net realized loss to undistributed net investment income to align financial reporting with tax reporting.
As of February 28, 2014, the tax basis components of distributable earnings, unrealized appreciation (depreciation) and cost of investment securities were as follows (dollars in thousands):
| Undistributed ordinary income | $ | 522 | ||
| Capital loss carryforward* | 341 | |||
| Gross unrealized appreciation on investment securities | 2,111 | |||
| Gross unrealized depreciation on investment securities | (3,319 | ) | ||
| Net unrealized depreciation on investment securities | (1,208 | ) | ||
| Cost of investment securities | 48,914 |
| * | The capital loss carryforward will be used to offset any capital gains realized by the fund in the current year or in subsequent years. The fund will not make distributions from capital gains while a capital loss carryforward remains. |
| 16 | American Funds Global High-Income Opportunities Fund |
Tax basis distributions paid to shareholders from ordinary income were as follows (dollars in thousands):
| Share class | Year ended February 28, 2014 | For the period December 14, 2012* to February 28, 2013 | ||||||
| Class A | $ 2,695 | $ 97 | ||||||
| Total | $ 2,695 | $ 97 | ||||||
| * | Commencement of operations. |
7. Fees and transactions with related parties
CRMC, the fund’s investment adviser, is the parent company of American Funds Distributors,® Inc. (“AFD”), the principal underwriter of the fund’s shares, and American Funds Service Company® (“AFS”), the fund’s transfer agent. CRMC, AFD and AFS are considered related parties to the fund.
Investment advisory services — The fund has an investment advisory and service agreement with CRMC that provides for monthly fees accrued daily. These fees are based on an annual rate of 0.570% of average daily net assets. For the year ended February 28, 2014, the investment advisory services fee was $281,000, which was equivalent to an annualized rate of 0.570% of average daily net assets.
CRMC has agreed to reimburse a portion of the fees and expenses of the fund during its startup period. This reimbursement may be adjusted or discontinued by CRMC, subject to any restrictions in the fund’s prospectus. For the year ended February 28, 2014, total fees and expenses reimbursed by CRMC were $27,000. Fees and expenses in the statement of operations are presented gross of any reimbursements from CRMC.
Class-specific fees and expenses — Expenses that are specific to individual share classes are accrued directly to the respective share class. The principal class-specific fees and expenses are described below:
Distribution services — The fund has plans of distribution for all share classes, except Class F-2, R-5 and R-6 shares. Under the plans, the board of trustees approves certain categories of expenses that are used to finance activities primarily intended to sell fund shares and service existing accounts. The plans provide for payments, based on an annualized percentage of average daily net assets, ranging from 0.30% to 1.00% as noted in this section. In some cases, the board of trustees has limited the amounts that may be paid to less than the maximum allowed by the plans. All share classes with a plan may use up to 0.25% of average daily net assets to pay service fees, or to compensate AFD for paying service fees, to firms that have entered into agreements with AFD to provide certain shareholder services. The remaining amounts available to be paid under each plan are paid to dealers to compensate them for their sales activities.
For Class A and 529-A shares, distribution-related expenses include the reimbursement of dealer and wholesaler commissions paid by AFD for certain shares sold without a sales charge. These share classes reimburse AFD for amounts billed within the prior 15 months but only to the extent that the overall annual expense limit of 0.30% is not exceeded. As of February 28, 2014, there were no unreimbursed expenses subject to reimbursement for Class A or 529-A shares.
| Share class | Currently approved limits | Plan limits | ||||||
| Class A | 0.30 | % | 0.30 | % | ||||
| Class 529-A | 0.30 | 0.50 | ||||||
| Classes B and 529-B | 1.00 | 1.00 | ||||||
| Classes C, 529-C and R-1 | 1.00 | 1.00 | ||||||
| Class R-2 | 0.75 | 1.00 | ||||||
| Classes 529-E and R-3 | 0.50 | 0.75 | ||||||
| Classes F-1, 529-F-1 and R-4 | 0.25 | 0.50 | ||||||
Transfer agent services — The fund has a shareholder services agreement with AFS under which the fund compensates AFS for providing transfer agent services to each of the fund’s share classes. These services include recordkeeping, shareholder communications and transaction processing. In addition, the fund reimburses AFS for amounts paid to third parties for performing transfer agent services on behalf of fund shareholders.
| American Funds Global High-Income Opportunities Fund | 17 |
Administrative services — The fund has an administrative services agreement with CRMC under which the fund compensates CRMC for providing administrative services to Class A, C, F, 529 and R shares. These services include, but are not limited to, coordinating, monitoring, assisting and overseeing third parties that provide services to fund shareholders. Under the agreement, Class A shares pay an annual fee of 0.01% and Class C, F, 529 and R shares pay an annual fee of 0.05% of their respective average daily net assets.
529 plan services — Each 529 share class is subject to service fees to compensate the Commonwealth of Virginia for the maintenance of the 529 college savings plan. The quarterly fee is based on a series of decreasing annual rates beginning with 0.10% on the first $30 billion of the net assets invested in Class 529 shares of the American Funds and decreasing to 0.06% on such assets between $120 billion and $150 billion. The fee for any given calendar quarter is accrued and calculated on the basis of the average net assets of Class 529 shares of the American Funds for the last month of the prior calendar quarter. The fee is included in other expenses in the fund’s statement of operations. The Commonwealth of Virginia is not considered a related party.
For the year ended February 28, 2014, class-specific expenses under the agreements were as follows (dollars in thousands):
| Share class | Distribution services | Transfer agent services | Administrative services | 529 plan services | ||||
| Class A | $— | $— | $5 | Not applicable | ||||
| Total class-specific expenses | $— | $— | $5 | Not applicable |
Trustees’ deferred compensation — Trustees who are unaffiliated with CRMC may elect to defer the cash payment of part or all of their compensation. These deferred amounts, which remain as liabilities of the fund, are treated as if invested in shares of the fund or other American Funds. These amounts represent general, unsecured liabilities of the fund and vary according to the total returns of the selected funds. Trustees’ compensation in the fund’s statement of operations includes the current fees (either paid in cash or deferred) and the net increase or decrease in the value of the deferred amounts.
Affiliated officers and trustees — Officers and certain trustees of the fund are or may be considered to be affiliated with CRMC, AFD and AFS. No affiliated officers or trustees received any compensation directly from the fund.
8. Capital share transactions
Capital share transactions in the fund were as follows (dollars and shares in thousands):
| Sales | Reinvestments of dividends and distributions | Repurchases | Net increase | ||||||||||||||||||||||||||||
| Share class | Amount | Shares | Amount | Shares | Amount | Shares | Amount | Shares | |||||||||||||||||||||||
| Year ended February 28, 2014 | |||||||||||||||||||||||||||||||
| Class A | $ | — | — | $ | — | — | $ | — | — | $ | — | — | |||||||||||||||||||
| Total net increase | $ | — | — | $ | — | — | $ | — | — | $ | — | — | |||||||||||||||||||
| For the period December 14, 2012* to February 28, 2013 | |||||||||||||||||||||||||||||||
| Class A | $ | 50,000 | 5,000 | $ | — | — | $ | — | — | $ | 50,000 | 5,000 | |||||||||||||||||||
| Total net increase | $ | 50,000 | 5,000 | $ | — | — | $ | — | — | $ | 50,000 | 5,000 | |||||||||||||||||||
| * | Commencement of operations. |
9. Investment transactions
The fund made purchases and sales of investment securities, excluding short-term securities and U.S. government obligations, if any, of $18,870,000 and $21,461,000, respectively, during the year ended February 28, 2014.
10. Ownership concentration
At February 28, 2014, CRMC held 100% of the fund’s outstanding shares. The ownership represents the seed money invested in the fund when it began operations on December 14, 2012.
| 18 | American Funds Global High-Income Opportunities Fund |
Financial highlights
| Income from investment operations1 | Dividends and distributions | ||||||||||||||||||||||||||||||||||||||||||||||
| Net asset value, beginning of period | Net investment income | Net (losses) gains on securities (both realized and unrealized) | Total from investment operations | Dividends (from net investment income) | Distributions (from capital gains) | Total dividends and distributions | Net asset value, end of period | Total return2,3 | Net assets, end of period (in thousands) | Ratio of expenses to average net assets before reimbursements4 | Ratio of expenses to average net assets after reimbursements3,4 | Ratio of net income to average net assets3 | |||||||||||||||||||||||||||||||||||
| Class A: | |||||||||||||||||||||||||||||||||||||||||||||||
| Year ended 2/28/2014 | $ | 10.20 | $ | .56 | $ | (.43 | ) | $ | .13 | $ | (.53 | ) | $ | (.01 | ) | $ | (.54 | ) | $ | 9.79 | 1.47 | % | $ | 48,965 | .69 | % | .64 | % | 5.69 | % | |||||||||||||||||
| Period from 12/14/2012 to 2/28/20135,6 | 10.00 | .11 | .11 | .22 | (.02 | ) | — | — | 10.20 | 2.20 | 50,996 | .19 | .13 | 1.04 | |||||||||||||||||||||||||||||||||
| Year ended February 28, 2014 | For the period 12/14/2012 to 2/28/20135,6 | |||||||
| Portfolio turnover rate for all share classes | 44% | 8% | ||||||
| 1 | Based on average shares outstanding. |
| 2 | Total returns exclude any applicable sales charges, including contingent deferred sales charges. |
| 3 | This column reflects the impact, if any, of certain reimbursements from CRMC. During the periods shown, CRMC reimbursed other fees and expenses. |
| 4 | Although the fund has plans of distribution for Class A shares, fees for distribution services are not paid by the fund on amounts invested in the fund by CRMC and/or its affiliates. If fees for distribution services were charged on these assets, fund expenses would have been higher and net income and total return would have been lower. |
| 5 | For the period December 14, 2012, commencement of operations, through February 28, 2013. |
| 6 | Based on operations for the period shown and, accordingly, is not representative of a full year. |
See Notes to Financial Statements
| American Funds Global High-Income Opportunities Fund | 19 |
Report of Independent Registered Public Accounting Firm
To the Shareholders and Board of Trustees of American Funds Global High-Income Opportunities Fund:
We have audited the accompanying statement of assets and liabilities of American Funds Global High-Income Opportunities Fund (the “Fund”), including the investment portfolio, as of February 28, 2014, and the related statement of operations for the year then ended, the statements of changes in net assets and financial highlights for each of the periods presented. These financial statements and financial highlights are the responsibility of the Fund’s management. Our responsibility is to express an opinion on these financial statements and financial highlights based on our audits.
We conducted our audits in accordance with the standards of the Public Company Accounting Oversight Board (United States). Those standards require that we plan and perform the audit to obtain reasonable assurance about whether the financial statements and financial highlights are free of material misstatement. The Fund is not required to have, nor were we engaged to perform, an audit of its internal control over financial reporting. Our audits included consideration of internal control over financial reporting as a basis for designing audit procedures that are appropriate in the circumstances, but not for the purpose of expressing an opinion on the effectiveness of the Fund’s internal control over financial reporting. Accordingly, we express no such opinion. An audit also includes examining, on a test basis, evidence supporting the amounts and disclosures in the financial statements, assessing the accounting principles used and significant estimates made by management, as well as evaluating the overall financial statement presentation. Our procedures included confirmation of securities owned as of February 28, 2014, by correspondence with the custodian and brokers; where replies were not received from brokers, we performed other auditing procedures. We believe that our audits provide a reasonable basis for our opinion.
In our opinion, such financial statements and financial highlights referred to above present fairly, in all material respects, the financial position of American Funds Global High-Income Opportunities Fund as of February 28, 2014, the results of its operations for the year then ended, the changes in its net assets and financial highlights for each of the periods presented, in conformity with accounting principles generally accepted in the United States of America.
Deloitte & Touche LLP
Costa Mesa, California
April 16, 2014
| 20 | American Funds Global High-Income Opportunities Fund |
| Expense example | unaudited |
As a fund shareholder, you incur two types of costs: (1) transaction costs, such as initial sales charges on purchase payments and contingent deferred sales charges on redemptions (loads), and (2) ongoing costs, including management fees, distribution and service (12b-1) fees, and other expenses. This example is intended to help you understand your ongoing costs (in dollars) of investing in the fund so you can compare these costs with the ongoing costs of investing in other mutual funds. The example is based on an investment of $1,000 invested at the beginning of the period and held for the entire six-month period (September 1, 2013, through February 28, 2014).
Actual expenses:
The first line of the share class in the table below provides information about actual account values and actual expenses. You may use the information in this line, together with the amount you invested, to estimate the expenses that you paid over the period. Simply divide your account value by $1,000 (for example, an $8,600 account value divided by $1,000 = 8.6), then multiply the result by the number in the first line under the heading entitled “Expenses paid during period” to estimate the expenses you paid on your account during this period.
Hypothetical example for comparison purposes:
The second line of the share class in the table below provides information about hypothetical account values and hypothetical expenses based on the actual expense ratio for the share class and an assumed rate of return of 5.00% per year before expenses, which is not the actual return of the share class. The hypothetical account values and expenses may not be used to estimate the actual ending account balance or expenses you paid for the period. You may use this information to compare the ongoing costs of investing in the fund and other funds. To do so, compare this 5.00% hypothetical example with the 5.00% hypothetical examples that appear in the shareholder reports of the other funds.
Notes:
There are some account fees that are charged to certain types of accounts, such as individual retirement accounts and 529 college savings plan accounts (generally, a $10 fee is charged to set up the account and an additional $10 fee is charged to the account annually), that would increase the amount of expenses paid on your account. In addition, retirement plan participants may be subject to certain fees charged by the plan sponsor, and Class F-1, F-2 and 529-F-1 shareholders may be subject to fees charged by financial intermediaries, typically ranging from 0.75% to 1.50% of assets annually depending on services offered. You can estimate the impact of these fees by adding the amount of the fees to the total estimated expenses you paid on your account during the period as calculated above. In addition, your ending account value would be lower by the amount of these fees.
Note that the expenses shown in the table are meant to highlight your ongoing costs only and do not reflect any transactional costs, such as sales charges (loads). Therefore, the second line of the share class in the table is useful in comparing ongoing costs only and will not help you determine the relative total costs of owning different funds. In addition, if these transactional costs were included, your costs would have been higher.
| Beginning account value 9/1/2013 | Ending account value 2/28/2014 | Expenses paid during period* | Annualized expense ratio | |||||||||||||
| Class A — actual return | $ | 1,000.00 | $ | 1,062.64 | $ | 3.27 | .64 | % | ||||||||
| Class A — assumed 5% return | 1,000.00 | 1,021.62 | 3.21 | .64 | ||||||||||||
| * | The “expenses paid during period” are equal to the “annualized expense ratio,” multiplied by the average account value over the period, multiplied by the number of days in the period, and divided by 365 (to reflect the one-half year period). |
| American Funds Global High-Income Opportunities Fund | 21 |
| Tax information | unaudited |
We are required to advise you of the federal tax status of certain distributions received by shareholders during the fiscal year. The fund hereby designates the following amounts for the fund’s fiscal year ended February 28, 2014:
| Foreign taxes | $ | 0.001 per share | |
| Foreign source income | $ | 0.33 per share | |
| U.S. government income that may be exempt from state taxation | $ | 4,000 |
Individual shareholders should refer to their Form 1099 or other tax information, which will be mailed in January 2015, to determine the calendar year amounts to be included on their 2014 tax returns. Shareholders should consult their tax advisors.
| 22 | American Funds Global High-Income Opportunities Fund |
Board of trustees and other officers
“Independent” trustees1
| Name and age | Year first elected a trustee of the fund2 | Principal occupation(s) during past five years | Number of portfolios in fund complex overseen by trustee | Other directorships3 held by trustee | ||||
| William H. Baribault, 68 | 2012 | Chairman of the Board and CEO, Oakwood Enterprises (private investment and consulting) | 70 | None | ||||
| James G. Ellis, 67 | 2012 | Dean and Professor of Marketing, Marshall School of Business, University of Southern California | 70 | Quiksilver, Inc. | ||||
| Leonard R. Fuller, 67 | 2012 | President and CEO, Fuller Consulting (financial management consulting firm) | 70 | None | ||||
| R. Clark Hooper, 67 Chairman of the Board (Independent and Non-Executive) | 2012 | Private investor | 72 | The Swiss Helvetia Fund, Inc. | ||||
| Merit E. Janow, 55 | 2012 | Dean and Professor, Columbia University, School of International and Public Affairs | 69 | The NASDAQ Stock Market LLC; Trimble Navigation Limited | ||||
| Laurel B. Mitchell, Ph.D., 58 | 2012 | Clinical Professor and Director, Accounting Program, University of Redlands | 66 | None | ||||
| Frank M. Sanchez, 70 | 2012 | Principal, The Sanchez Family Corporation dba McDonald’s Restaurants (McDonald’s licensee) | 66 | None | ||||
| Margaret Spellings, 56 | 2012 | President, George W. Bush Foundation; former President and CEO, Margaret Spellings & Company (public policy and strategic consulting); former President, U.S. Chamber Foundation and Senior Advisor to the President and CEO, U.S. Chamber of Commerce; former U.S. Secretary of Education, U.S. Department of Education | 70 | None | ||||
| Steadman Upham, Ph.D., 65 | 2012 | President and University Professor, The University of Tulsa | 69 | None |
We are saddened by the loss of W. Scott Hedrick who passed away on November 3, 2013. Mr. Hedrick served as an independent board member on the boards of various American Funds since 2007. His wise counsel and friendship will be missed.
“Interested” trustee4,5
| Name, age and position with fund | Year first elected a trustee or officer of the fund2 | Principal occupation(s) during past five years and positions held with affiliated entities or the principal underwriter of the fund | Number of portfolios in fund complex overseen by trustee | Other directorships3 held by trustee | ||||
| John H. Smet, 57 Vice Chairman of the Board | 2012 | Director, Capital Research and Management Company; Senior Vice President — Capital Fixed Income Investors, Capital Research and Management Company | 20 | None |
The fund’s statement of additional information includes further details about fund trustees and is available without charge upon request by calling American Funds Service Company at (800) 421-4225 or by visiting the American Funds website at americanfunds.com. The address for all trustees and officers of the fund is 333 South Hope Street, Los Angeles, CA 90071, Attention: Secretary.
| American Funds Global High-Income Opportunities Fund | 23 |
Other officers5
| Name, age and position with fund | Year first elected an officer of the fund2 | Principal occupation(s) during past five years and positions held with affiliated entities or the principal underwriter of the fund | ||
| Robert H. Neithart, 48 President | 2012 | Senior Vice President — Capital Fixed Income Investors, Capital Research and Management Company; Senior Vice President — Capital Fixed Income Investors, Capital International Research, Inc.;6 Senior Vice President — Capital Fixed Income Investors, Capital Guardian Trust Company;6 Director, The Capital Group Companies, Inc.;6 Chairman of the Board, Capital Strategy Research, Inc.6 | ||
| Kristine M. Nishiyama, 43 Senior Vice President | 2012 | Senior Vice President and Senior Counsel — Fund Business Management Group, Capital Research and Management Company; Senior Vice President and General Counsel, Capital Bank and Trust Company6 | ||
| Courtney R. Taylor, 39 Secretary | 2012 | Assistant Vice President — Fund Business Management Group, Capital Research and Management Company | ||
| Karl C. Grauman, 46 Treasurer | 2012 | Vice President — Fund Business Management Group, Capital Research and Management Company | ||
| Steven I. Koszalka, 50 Assistant Secretary | 2012 | Vice President — Fund Business Management Group, Capital Research and Management Company | ||
| Brian C. Janssen, 42 Assistant Treasurer | 2012 | Vice President — Fund Business Management Group, Capital Research and Management Company | ||
| Dori Laskin, 62 Assistant Treasurer | 2012 | Vice President — Fund Business Management Group, Capital Research and Management Company |
| 1 | The term “independent” trustee refers to a trustee who is not an “interested person” of the fund within the meaning of the Investment Company Act of 1940. |
| 2 | Trustees and officers of the fund serve until their resignation, removal or retirement. |
| 3 | This includes all directorships (other than those in the American Funds or other funds managed by Capital Research and Management Company or its affiliates) that are held by each trustee as a trustee or director of a public company or a registered investment company. |
| 4 | “Interested persons” within the meaning of the Investment Company Act of 1940, on the basis of their affiliation with the fund’s investment adviser, Capital Research and Management Company, or affiliated entities (including the fund’s principal underwriter). |
| 5 | All of the officers listed are officers and/or directors/trustees of one or more of the other funds for which Capital Research and Management Company serves as investment adviser. |
| 6 | Company affiliated with Capital Research and Management Company. |
| 24 | American Funds Global High-Income Opportunities Fund |
Office of the fund
Capital Research and Management Company
333 South Hope Street
Los Angeles, CA 90071-1406
Investment adviser
6455 Irvine Center Drive
Irvine, CA 92618-4518
Transfer agent for shareholder accounts
American Funds Service Company
(Write to the address near you.)
P.O. Box 6007
Indianapolis, IN 46206-6007
P.O. Box 2280
Norfolk, VA 23501-2280
Custodian of assets
State Street Bank and Trust Company
One Lincoln Street
Boston, MA 02111
Counsel
Bingham McCutchen LLP
355 South Grand Avenue, Suite 4400
Los Angeles, CA 90071-3106
Independent registered public accounting firm
Deloitte & Touche LLP
695 Town Center Drive
Suite 1200
Costa Mesa, CA 92626-7188
Principal underwriter
American Funds Distributors, Inc.
333 South Hope Street
Los Angeles, CA 90071-1406
Investors should carefully consider investment objectives, risks, charges and expenses. This and other important information is contained in the fund prospectus and summary prospectus, which can be obtained from your financial professional and should be read carefully before investing. You may also call American Funds Service Company (AFS) at (800) 421-4225 or visit the American Funds website at americanfunds.com.
“American Funds Proxy Voting Procedures and Principles” — which describes how we vote proxies relating to portfolio securities — is available on the American Funds website or upon request by calling AFS. The fund files its proxy voting record with the U.S. Securities and Exchange Commission (SEC) for the 12 months ended June 30 by August 31. The proxy voting record is available free of charge on the SEC website at sec.gov and on the American Funds website.
American Funds Global High-Income Opportunities Fund files a complete list of its portfolio holdings with the SEC for the first and third quarters of each fiscal year on Form N-Q. This filing is available free of charge on the SEC website. You may also review or, for a fee, copy this filing at the SEC’s Public Reference Room in Washington, D.C. Additional information regarding the operation of the Public Reference Room may be obtained by calling the SEC’s Office of Investor Education and Advocacy at (800) SEC-0330. Additionally, the list of portfolio holdings is available by calling AFS.
This report is for the information of shareholders of American Funds Global High-Income Opportunities Fund, but it also may be used as sales literature when preceded or accompanied by the current prospectus or summary prospectus, which gives details about charges, expenses, investment objectives and operating policies of the fund. If used as sales material after June 30, 2014, this report must be accompanied by an American Funds statistical update for the most recently completed calendar quarter.
| American Funds Global High-Income Opportunities Fund | 25 |
The American Funds Advantage
Since 1931, American Funds, part of Capital Group, has helped investors pursue long-term investment success. Our consistent approach — in combination with The Capital SystemSM — has resulted in a superior long-term track record.
Aligned with investor success
We base our decisions on a long-term perspective, which we believe aligns our goals with the interests of our clients. Our portfolio managers average 25 years of investment experience, including 21 years at our company, reflecting a career commitment to our long-term approach.1
The Capital SystemSM
Our investment process, The Capital System, combines individual accountability with teamwork. Each fund is divided into portions that are managed independently by investment professionals with diverse backgrounds, ages and investment approaches. An extensive global research effort is the backbone of our system.
Superior long-term track record
Our equity funds have beaten their Lipper peer indexes in 90% of 10-year periods and 96% of 20-year periods. Our fixed-income funds have beaten their Lipper indexes in 56% of 10-year periods and 57% of 20-year periods.2 Our fund management fees have been among the lowest in the industry.3
| 1 | Portfolio manager experience as of December 31, 2013. |
| 2 | Based on Class A share results for rolling periods through December 31, 2013. Periods covered are the shorter of the fund’s lifetime or since the comparable Lipper index inception date (except SMALLCAP World Fund, for which the Lipper average was used). |
| 3 | Based on management fees for the 20-year period ended December 31, 2013, versus comparable Lipper categories, excluding funds of funds. |
Lit. No. MFGEARX-038-0414 10262-S36346
ITEM 2 – Code of Ethics
The Registrant has adopted a Code of Ethics that applies to its Principal Executive Officer and Principal Financial Officer. The Registrant undertakes to provide to any person without charge, upon request, a copy of the Code of Ethics. Such request can be made to American Funds Service Company at 800/421-9225 or to the Secretary of the Registrant, 6455 Irvine Center Drive, Irvine, California 92618.
ITEM 3 – Audit Committee Financial Expert
The Registrant’s board has determined that Laurel B. Mitchell, a member of the Registrant’s audit committee, is an “audit committee financial expert” and "independent," as such terms are defined in this Item. This designation will not increase the designee’s duties, obligations or liability as compared to his or her duties, obligations and liability as a member of the audit committee and of the board, nor will it reduce the responsibility of the other audit committee members. There may be other individuals who, through education or experience, would qualify as "audit committee financial experts" if the board had designated them as such. Most importantly, the board believes each member of the audit committee contributes significantly to the effective oversight of the Registrant’s financial statements and condition.
ITEM 4 – Principal Accountant Fees and Services
| Registrant: | ||||
| a) Audit Fees: | ||||
| 2013 | $20,000 | |||
| 2014 | $3,000 | |||
| b) Audit-Related Fees: | ||||
| 2013 | None | |||
| 2014 | None | |||
| The audit-related fees consist of assurance and related services relating to the examination of the Registrant’s investment adviser conducted in accordance with Statement on Standards for Attestation Engagements Number 16 issued by the American Institute of Certified Public Accountants. | ||||
| c) Tax Fees: | ||||
| 2013 | $2,000 | |||
| 2014 | $3,000 | |||
| The tax fees consist of professional services relating to the preparation of the Registrant’s tax returns including returns relating to the Registrant’s investments in non-U.S. jurisdictions. | ||||
| d) All Other Fees: | ||||
| 2013 | None | |||
| 2014 | None | |||
| Adviser and affiliates (includes only fees for non-audit services billed to the adviser and affiliates for engagements that relate directly to the operations and financial reporting of the Registrant and were subject to the pre-approval policies described below): | ||||
| a) Audit Fees: | ||||
| Not Applicable | ||||
| b) Audit-Related Fees: | ||||
| 2013 | $1,240,000 | |||
| 2014 | $937,000 | |||
| The audit-related fees consist of assurance and related services relating to the examination of the Registrant’s transfer agent, principal underwriter and investment adviser conducted in accordance with Statement on Standards for Attestation Engagements Number 16 issued by the American Institute of Certified Public Accountants. | ||||
| c) Tax Fees: | ||||
| 2013 | $29,000 | |||
| 2014 | $43,000 | |||
| The tax fees consist of consulting services relating to the Registrant’s investments. | ||||
| d) All Other Fees: | ||||
| 2013 | $2,000 | |||
| 2014 | $3,000 | |||
| The other fees consist of subscription services related to an accounting research tool. | ||||
All audit and permissible non-audit services that the Registrant’s audit committee considers compatible with maintaining the independent registered public accounting firm’s independence are required to be pre-approved by the committee. The pre-approval requirement will extend to all non-audit services provided to the Registrant, the investment adviser, and any entity controlling, controlled by, or under common control with the investment adviser that provides ongoing services to the Registrant, if the engagement relates directly to the operations and financial reporting of the Registrant. The committee will not delegate its responsibility to pre-approve these services to the investment adviser. The committee may delegate to one or more committee members the authority to review and pre-approve audit and permissible non-audit services. Actions taken under any such delegation will be reported to the full committee at its next meeting. The pre-approval requirement is waived with respect to non-audit services if certain conditions are met. The pre-approval requirement was not waived for any of the non-audit services listed above provided to the Registrant, adviser and affiliates.
Aggregate non-audit fees paid to the Registrant’s auditors, including fees for all services billed to the Registrant, adviser and affiliates that provide ongoing services to the Registrant, were $1,870,000 for fiscal year 2013 and $1,390,000 for fiscal year 2014. The non-audit services represented by these amounts were brought to the attention of the committee and considered to be compatible with maintaining the auditors’ independence.
ITEM 5 – Audit Committee of Listed Registrants
Not applicable to this Registrant, insofar as the Registrant is not a listed issuer as defined in Rule 10A-3 under the Securities Exchange Act of 1934.
ITEM 6 – Schedule of Investments
Not applicable, insofar as the schedule is included as part of the report to shareholders filed under Item 1 of this Form.
ITEM 7 – Disclosure of Proxy Voting Policies and Procedures for Closed-End Management Investment Companies
Not applicable to this Registrant, insofar as the Registrant is not a closed-end management investment company.
ITEM 8 – Portfolio Managers of Closed-End Management Investment Companies
Not applicable to this Registrant, insofar as the Registrant is not a closed-end management investment company.
ITEM 9 – Purchases of Equity Securities by Closed-End Management Investment Company and Affiliated Purchasers
Not applicable to this Registrant, insofar as the Registrant is not a closed-end management investment company.
ITEM 10 – Submission of Matters to a Vote of Security Holders
There have been no material changes to the procedures by which shareholders may recommend nominees to the Registrant’s board of trustees since the Registrant last submitted a proxy statement to its shareholders. The procedures are as follows. The Registrant has a nominating and governance committee comprised solely of persons who are not considered ‘‘interested persons’’ of the Registrant within the meaning of the Investment Company Act of 1940, as amended. The committee periodically reviews such issues as the board’s composition, responsibilities, committees, compensation and other relevant issues, and recommends any appropriate changes to the full board of trustees. While the committee normally is able to identify from its own resources an ample number of qualified candidates, it will consider shareholder suggestions of persons to be considered as nominees to fill future vacancies on the board. Such suggestions must be sent in writing to the nominating and governance committee of the Registrant, c/o the Registrant’s Secretary, and must be accompanied by complete biographical and occupational data on the prospective nominee, along with a written consent of the prospective nominee for consideration of his or her name by the nominating and governance committee.
ITEM 11 – Controls and Procedures
| (a) | The Registrant’s Principal Executive Officer and Principal Financial Officer have concluded, based on their evaluation of the Registrant’s disclosure controls and procedures (as such term is defined in Rule 30a-3 under the Investment Company Act of 1940), that such controls and procedures are adequate and reasonably designed to achieve the purposes described in paragraph (c) of such rule. |
| (b) | There were no changes in the Registrant’s internal controls over financial reporting (as defined in Rule 30a-3(d) under the Investment Company Act of 1940) that occurred during the Registrant’s second fiscal quarter of the period covered by this report that has materially affected, or is reasonably likely to materially affect, the Registrant’s internal control over financial reporting. |
ITEM 12 – Exhibits
| (a)(1) | The Code of Ethics that is the subject of the disclosure required by Item 2 is attached as an exhibit hereto. |
| (a)(2) | The certifications required by Rule 30a-2 of the Investment Company Act of 1940 and Sections 302 and 906 of the Sarbanes-Oxley Act of 2002 are attached as exhibits hereto. |
SIGNATURES
Pursuant to the requirements of the Securities Exchange Act of 1934 and the Investment Company Act of 1940, the Registrant has duly caused this report to be signed on its behalf by the undersigned, thereunto duly authorized.
| AMERICAN FUNDS GLOBAL HIGH-INCOME OPPORTUNITIES FUND | |
| By /s/ Robert H. Neithart | |
Robert H. Neithart, President and Principal Executive Officer | |
| Date: April 30, 2014 |
Pursuant to the requirements of the Securities Exchange Act of 1934 and the Investment Company Act of 1940, this report has been signed below by the following persons on behalf of the Registrant and in the capacities and on the dates indicated.
| By /s/ Robert H. Neithart |
Robert H. Neithart, President and Principal Executive Officer |
| Date: April 30, 2014 |
| By Karl C. Grauman |
Karl C. Grauman, Treasurer and Principal Financial Officer |
| Date: April 30, 2014 |