UNITED STATES
SECURITIES AND EXCHANGE COMMISSION
Washington, D.C. 20549
FORM N-CSR
Certified Shareholder Report of
Registered Management Investment Companies
Investment Company Act File Number: 811-22746
American Funds Inflation Linked Bond Fund
(Exact Name of Registrant as Specified in Charter)
6455 Irvine Center Drive
Irvine, California 92618
(Address of Principal Executive Offices)
Registrant's telephone number, including area code: (949) 975-5000
Date of fiscal year end: November 30
Date of reporting period: November 30, 2019
Brian C. Janssen
American Funds Inflation Linked Bond Fund
6455 Irvine Center Drive
Irvine, California 92618
(Name and Address of Agent for Service)
ITEM 1 – Reports to Stockholders
American Funds Inflation
Linked Bond Fund® Annual report
for the year ended
November 30, 2019 |  |

Invest with the
goal of preserving
purchasing power
Beginning January 1, 2021, as permitted by regulations adopted by the U.S. Securities and Exchange Commission, we intend to no longer mail paper copies of the fund’s shareholder reports, unless specifically requested from American Funds or your financial intermediary, such as a broker-dealer or bank. Instead, the reports will be made available on the Capital Group website (capitalgroup.com); you will be notified by mail and provided with a website link to access the report each time a report is posted. If you have already elected to receive shareholder reports electronically, you will not be affected by this change and do not need to take any action. If you prefer to receive shareholder reports and other communications electronically, you may update your mailing preferences with your financial intermediary, or enroll in e-delivery at capitalgroup.com (for accounts held directly with the fund).
You may elect to receive paper copies of all future reports free of charge. If you invest through a financial intermediary, you may contact your financial intermediary to request that you continue to receive paper copies of your shareholder reports. If you invest directly with the fund, you may inform American Funds that you wish to continue receiving paper copies of your shareholder reports by contacting us at (800) 421-4225. Your election to receive paper reports will apply to all funds held with American Funds or through your financial intermediary.
American Funds Inflation Linked Bond Fund seeks to provide inflation protection and income consistent with investment in inflation linked securities.
This fund is one of more than 40 offered by Capital Group, home of American Funds, one of the nation’s largest mutual fund families. For more than 85 years, Capital Group has invested with a long-term focus based on thorough research and attention to risk.
Fund results shown in this report, unless otherwise indicated, are for Class A shares at net asset value. If a sales charge (maximum 2.50%) had been deducted, the results would have been lower. Results are for past periods and are not predictive of results for future periods. Current and future results may be lower or higher than those shown. Share prices and returns will vary, so investors may lose money. Investing for short periods makes losses more likely. For current information and month-end results, visit capitalgroup.com.
Here are the total returns on a $1,000 investment with all distributions reinvested for the period ended December 31, 2019 (the most recent calendar quarter-end):
| Class A shares | | 1 year | | 5 years | | Lifetime
(since 12/14/12) |
| | | | | | | |
| Reflecting 2.50% maximum sales charge | | 3.90% | | 1.72% | | 0.66% |
The total annual fund operating expense ratio is 0.73% for Class A shares as of the prospectus dated February 1, 2020 (unaudited). The expense ratio is restated to reflect current fees.
Investment results assume all distributions are reinvested and reflect applicable fees and expenses. When applicable, investment results reflect fee waivers and expense reimbursements, without which results would have been lower.
The fund’s 30-day yield for Class A shares as of December 31, 2019, reflecting the 2.50% maximum sales charge and calculated in accordance with the U.S. Securities and Exchange Commission formula, was 2.09%.
The return of principal for bond funds and for funds with significant underlying bond holdings is not guaranteed. Fund shares are subject to the same interest rate, inflation and credit risks associated with the underlying bond holdings. The values of inflation-linked bonds generally fluctuate in response to changes in real interest rates. Inflation-linked bonds may experience greater losses than other debt securities with similar durations. There can be no assurance that the value of inflation-linked securities will be directly correlated to changes in interest rates. Refer to the fund prospectus and the Risk Factors section of this report for more information on these and other risks associated with investing in the fund.
Investments are not FDIC-insured, nor are they deposits of or guaranteed by a bank or any other entity, so they may lose value.
Contents
Fellow investors
Inflation expectations initially climbed before trending lower during the 12-month period ended November 30, 2019. At the same time, bond yields (which move inversely to prices) declined dramatically, helping the inflation-linked bond market to notch gains.
Over the same period, American Funds Inflation Linked Bond Fund generated a 6.43% return. The unmanaged Bloomberg Barclays U.S. Treasury Inflation-Protected Securities (TIPS) Index — a measure of the market in which the fund primarily invests — gained 8.61%.
The values of TIPS (issued by the United States Treasury Department) are directly linked to the U.S. Consumer Price Index (CPI) for All Urban Consumers. The Lipper Inflation Protected Bond Funds Average, a peer group measure, rose 6.87%.
Fund investors who reinvested dividends of just over 20 cents a share (paid in December 2018) earned an income return of 2.20%, the same as those who took dividends in cash. A capital gain of over 3 cents a share was also paid in December 2018.
The portfolio’s overall positioning in regard to interest rates detracted from results relative to the benchmark. The fund’s curve positioning (emphasizing bonds of particular maturities) and interest rate swap spread positioning were among the larger negative factors.
Market overview
Shortly after the start of fund’s fiscal year, significant equity volatility and relatively modest inflation prompted the Federal Reserve to recalibrate its policy stance.
In January 2019, the Fed hit the pause button on hikes — holding the federal funds target rate range steady at 2.25%–2.50%. This was followed by quarter percentage point rate cuts in July, September and October. In December 2019 the Fed left rates unchanged, at a range of 1.50%–1.75%.
Annualized core CPI — the inflation measure that strips out volatile food and energy prices — bottomed out in May 2019; it has climbed above 2.3% in recent months.
Earlier in the period, inflation prospects appeared decent thanks to solid economic data. By the third quarter of 2019, however, growth had moderated to 2.1% on an annualized basis. Unemployment stood at 3.5% in November — matching the 50-year low recorded in September.
The price of oil — another important source of inflation — peaked at $66 a barrel in
Results at a glance
For periods ended November 30, 2019, with all distributions reinvested
| | | Cumulative
total returns | | Average annual total returns |
| | | 6 months | | | 1 year | | | 3 years | | | 5 years | | | Lifetime
(since 12/14/12) |
| | | | | | | | | | | |
| American Funds Inflation Linked Bond Fund (Class A shares) | | | 0.82 | % | | | 6.43 | % | | | 2.36 | % | | | 1.94 | % | | | 0.95 | % |
| Bloomberg Barclays U.S. Treasury Inflation-Protected Securities (TIPS) Index* | | | 2.63 | | | | 8.61 | | | | 3.15 | | | | 2.31 | | | | 0.95 | |
| Lipper Inflation Protected Bond Funds Average† | | | 1.94 | | | | 6.87 | | | | 2.49 | | | | 1.64 | | | | 0.42 | |
| * | The market index is unmanaged and, therefore, has no expenses. Investors cannot invest directly in an index. Bloomberg Barclays source: Bloomberg Index Services Ltd. |
| † | Lipper averages reflect the current composition of all eligible mutual funds (all share classes) within a given category. Source: Thomson Reuters Lipper. Lipper categories are dynamic and averages may have few funds, especially over longer periods. To see the number of funds included in the Lipper category for each fund’s lifetime, please see the Quarterly Statistical Update, available on our website. |
| American Funds Inflation Linked Bond Fund | 1 |
April 2019; it has mostly traded in a range of between $50 and $60 in the interim. Inflation expectations fared similarly, falling sharply at the end of 2018, climbing through April 2019, and remaining subdued since May.
Inside the portfolio
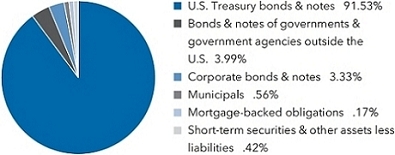
As of November 30, 2019, 91.2% of the fund’s net assets were invested in inflation-linked government bonds, mostly U.S. TIPS. The portfolio’s modest investment in nominal Treasuries increased. Holdings of government bonds from the Eurozone and Japan were among the portfolio’s relatively small non-U.S. exposure.
Investments in corporate bonds accounted for 3.3% of the fund’s assets as of November 30, 2019. Informed by insights from our macroeconomic and fundamental credit analysts, managers recently added to holdings of bonds from energy-related industries; we also found opportunities to invest in firms from the utilities sector.
Consistent with the fund’s investment guidelines, we have made careful use of derivatives. For example, when used in conjunction with bonds, interest rate swaps can help the fund to gain more precisely targeted exposures to inflation and interest rates. A complete list of fund holdings can be found beginning on page 4.
Looking forward
While the past year was a period in which results relative to the benchmark were disappointing, we are pleased to have delivered solid returns (that far outpaced inflation) for fund investors on an absolute basis.
Furthermore, we remain confident that we are appropriately-positioned for an economic cycle that is in its latter stages — especially when you consider recent valuations. With the Fed seemingly likely to be on pause in 2020, we think monetary policy will offer a supportive backdrop for the fund’s portfolio.
And, if market confidence cracks (due to lackluster growth, or an escalation in the U.S.-China trade dispute, for example), then we believe that the fund could be a source of relative resilience for investors. Markets could also be unsettled by political developments in the run up to the 2020 presidential election.
The outlook for inflation appears finely balanced. Rising wages and low unemployment suggest there could be upward pressure on the general level of prices for goods and services. On the other hand, structural developments such as weak growth in the number of people working (or seeking work) could weigh on inflation in the longer term. That said, we are positive on the TIPS asset class, given valuations.
Regardless of how inflation evolves from here, it’s worth underscoring the important role that an investment in this fund can play for investors. It can act as a complement to other bond investments that may not hold up well in an inflationary environment — and provide diversification to equity-heavy portfolios.
We look forward to reporting to you again in six months.
Cordially,

Ritchie R. Tuazon
President
January 15, 2020
For current information about the fund, visit capitalgroup.com.
| 2 | American Funds Inflation Linked Bond Fund |
The value of a $10,000 investment
How a $10,000 investment has grown (for the period December 14, 2012, to November 30, 2019, with all distributions reinvested.
Fund results shown, unless otherwise indicated, reflect deduction of the maximum sales charge of 2.50% on the $10,000 investment.1 Thus, the net amount invested was $9,750.
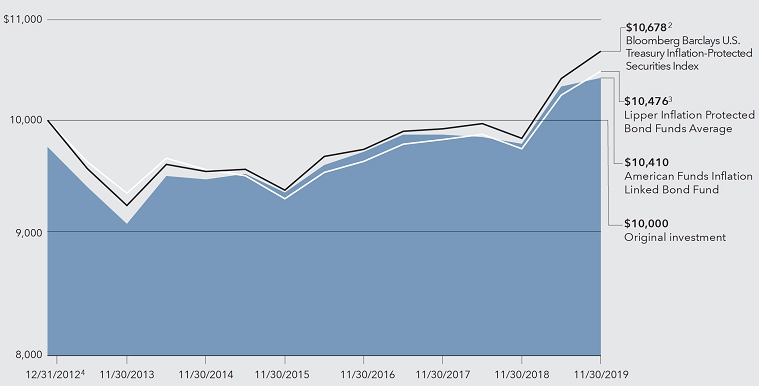
| 1 | As outlined in the prospectus, the sales charge is reduced for accounts (and aggregated investments) of $500,000 or more and is eliminated for purchases of $1 million or more. There is no sales charge on dividends or capital gain distributions that are reinvested in additional shares. |
| 2 | The index is unmanaged and, therefore, has no expenses. Investors cannot invest directly in an index. Bloomberg Barclays source: Bloomberg Index Services Ltd. |
| 3 | Results of the Lipper Inflation Protected Bond Funds Average do not reflect any sales charges. Source: Thomson Reuters Lipper. Lipper averages reflect the current composition of all eligible mutual funds (all share classes) with in a given category. Lipper categories are dynamic and averages may have few funds, especially over longer periods. To see the number of funds included in the Lipper category for each fund’s lifetime, please see the Quarterly Statistical Update, available on our website. |
| 4 | For the period December 14, 2012, commencement of operations, through December 31, 2012. |
Past results are not predictive of results for future periods. The results shown are before taxes on fund distributions and sale of fund shares.
Average annual total returns based on a $1,000 investment(for periods ended November 30, 2019)*
| | | Cumulative total return | | Average annual total return |
| | | 1 year | | 5 Years | | Lifetime (since 12/14/12) |
| | | | | | | |
| Class A shares | | 3.82% | | 1.42% | | 0.58% |
| * | Assumes reinvestment of all distributions and payment of the maximum 2.50% sales charge. |
Investment results assume all distributions are reinvested and reflect applicable fees and expenses. When applicable, investment results reflect fee waivers and expense reimbursements, without which results would have been lower.
| American Funds Inflation Linked Bond Fund | 3 |
Investment portfolio November 30, 2019
| Portfolio by type of security | Percent of net assets |
| Portfolio quality summary* | | Percent of
net assets |
| U.S. Treasury and agency† | | | 91.53 | % |
| AAA/Aaa | | | .67 | |
| AA/Aa | | | 1.43 | |
| A/A | | | 4.09 | |
| BBB/Baa | | | 1.86 | |
| Short-term securities & other assets less liabilities | | | .42 | |
| | |
| * | Bond ratings, which typically range from AAA/Aaa (highest) to D (lowest), are assigned by credit rating agencies such as Standard & Poor’s, Moody’s and/or Fitch as an indication of an issuer’s creditworthiness. In assigning a credit rating to a security, the fund looks specifically to the ratings assigned to the issuer of the security by Standard & Poor’s, Moody’s and/or Fitch. If agency ratings differ, the security will be considered to have received the highest of those ratings, consistent with the fund’s investment policies. The ratings are not covered by the Report of Independent Registered Public Accounting Firm. |
| † | These securities are guaranteed by the full faith and credit of the U.S. government. |
| Bonds, notes & other debt instruments 99.58% | Principal amount
(000) | | | Value
(000) | |
| U.S. Treasury bonds & notes 91.53% | | | | | | |
| U.S. Treasury inflation-protected securities 89.93% | | | | | | | | |
| U.S. Treasury Inflation-Protected Security 1.375% 20201 | | $ | 30,870 | | | $ | 30,905 | |
| U.S. Treasury Inflation-Protected Security 0.125% 20211,2 | | | 31,416 | | | | 31,224 | |
| U.S. Treasury Inflation-Protected Security 0.625% 20211,2 | | | 222,140 | | | | 223,765 | |
| U.S. Treasury Inflation-Protected Security 1.125% 20211 | | | 41,080 | | | | 41,370 | |
| U.S. Treasury Inflation-Protected Security 0.125% 20221 | | | 270,692 | | | | 268,904 | |
| U.S. Treasury Inflation-Protected Security 0.125% 20221 | | | 108,448 | | | | 107,873 | |
| U.S. Treasury Inflation-Protected Security 0.125% 20221 | | | 17,752 | | | | 17,736 | |
| U.S. Treasury Inflation-Protected Security 0.125% 20231 | | | 33,315 | | | | 33,138 | |
| U.S. Treasury Inflation-Protected Security 0.375% 20231 | | | 29,789 | | | | 30,056 | |
| U.S. Treasury Inflation-Protected Security 0.125% 20241 | | | 280,492 | | | | 280,652 | |
| U.S. Treasury Inflation-Protected Security 0.125% 20241 | | | 243,177 | | | | 243,411 | |
| U.S. Treasury Inflation-Protected Security 0.50% 20241 | | | 52,326 | | | | 52,957 | |
| U.S. Treasury Inflation-Protected Security 0.625% 20241 | | | 105,636 | | | | 107,401 | |
| U.S. Treasury Inflation-Protected Security 0.25% 20251 | | | 268,943 | | | | 269,925 | |
| U.S. Treasury Inflation-Protected Security 0.375% 20251,2 | | | 477,791 | | | | 484,595 | |
| U.S. Treasury Inflation-Protected Security 2.375% 20251,2 | | | 31,941 | | | | 35,471 | |
| U.S. Treasury Inflation-Protected Security 0.125% 20261 | | | 134,962 | | | | 134,994 | |
| U.S. Treasury Inflation-Protected Security 0.625% 20261 | | | 177,752 | | | | 182,581 | |
| U.S. Treasury Inflation-Protected Security 2.00% 20261,2 | | | 134,535 | | | | 149,250 | |
| U.S. Treasury Inflation-Protected Security 0.375% 20271 | | | 205,722 | | | | 209,485 | |
| U.S. Treasury Inflation-Protected Security 0.375% 20271 | | | 105,865 | | | | 107,297 | |
| U.S. Treasury Inflation-Protected Security 2.375% 20271,2 | | | 193,776 | | | | 223,539 | |
| U.S. Treasury Inflation-Protected Security 0.50% 20281 | | | 238,780 | | | | 244,875 | |
| U.S. Treasury Inflation-Protected Security 1.75% 20281 | | | 74,760 | | | | 84,042 | |
| U.S. Treasury Inflation-Protected Security 0.25% 20291,2 | | | 689,576 | | | | 695,572 | |
| U.S. Treasury Inflation-Protected Security 0.875% 20291 | | | 69,551 | | | | 73,919 | |
| U.S. Treasury Inflation-Protected Security 2.50% 20291 | | | 2,392 | | | | 2,888 | |
| U.S. Treasury Inflation-Protected Security 2.125% 20401,2 | | | 53,456 | | | | 71,031 | |
| U.S. Treasury Inflation-Protected Security 2.125% 20411,2 | | | 51,001 | | | | 68,434 | |
| U.S. Treasury Inflation-Protected Security 0.75% 20421,2 | | | 56,814 | | | | 60,298 | |
| U.S. Treasury Inflation-Protected Security 0.625% 20431 | | | 11,168 | | | | 11,550 | |
| U.S. Treasury Inflation-Protected Security 1.375% 20441,2 | | | 71,718 | | | | 86,458 | |
| | |
| 4 | American Funds Inflation Linked Bond Fund |
| | Principal amount
(000) | | | Value
(000) | |
| U.S. Treasury Inflation-Protected Security 0.75% 20451,2 | | $ | 122,117 | | | $ | 129,632 | |
| U.S. Treasury Inflation-Protected Security 1.00% 20461,2 | | | 104,941 | | | | 118,070 | |
| U.S. Treasury Inflation-Protected Security 0.875% 20471,2 | | | 174,754 | | | | 191,490 | |
| U.S. Treasury Inflation-Protected Security 1.00% 20481,2 | | | 262,898 | | | | 297,573 | |
| U.S. Treasury Inflation-Protected Security 1.00% 20491,2 | | | 55,200 | | | | 62,857 | |
| | | | | | | | 5,465,218 | |
| | | | | | | | | |
| U.S. Treasury 1.60% | | | | | | | | |
| U.S. Treasury 1.875% 20192 | | | 1,000 | | | | 1,000 | |
| U.S. Treasury 1.25% 2024 | | | 2,000 | | | | 1,966 | |
| U.S. Treasury 1.625% 2026 | | | 85,000 | | | | 84,436 | |
| U.S. Treasury 1.625% 2026 | | | 10,000 | | | | 9,933 | |
| | | | | | | | 97,335 | |
| | | | | | | | | |
| Total U.S. Treasury bonds & notes | | | | | | | 5,562,553 | |
| | | | | | | | | |
| Bonds & notes of governments & government agencies outside the U.S. 3.99% | | | |
| Colombia (Republic of) 5.00% 2045 | | | 600 | | | | 688 | |
| European Stability Mechanism 2.125% 20223 | | | 40,000 | | | | 40,495 | |
| Japan, Series 18, 0.10% 20241 | | ¥ | 2,242,450 | | | | 20,815 | |
| Japan, Series 20, 0.10% 20251 | | | 4,318,000 | | | | 40,278 | |
| South Africa (Republic of), Series R-197, 5.50% 20231 | | ZAR | 755 | | | | 57 | |
| Spain (Kingdom of) 0.25% 2024 | | € | 106,400 | | | | 119,114 | |
| United Kingdom 0.125% 20411 | | £ | 8,354 | | | | 17,020 | |
| Uruguay (Oriental Republic of) 8.50% 2028 | | UYU | 172,200 | | | | 3,930 | |
| | | | | | | | | |
| Total bonds & notes of governments & government agencies outside the U.S. | | | | 242,397 | |
| | | | | | | | | |
| Corporate bonds & notes 3.33% | | | | | | | | |
| Energy 1.26% | | | | | | | | |
| Energy Transfer Partners, LP 6.00% 2048 | | $ | 10,000 | | | | 11,418 | |
| Equinor ASA 3.625% 2028 | | | 13,165 | | | | 14,562 | |
| MPLX LP 4.00% 2028 | | | 2,430 | | | | 2,491 | |
| MPLX LP 4.70% 2048 | | | 10,000 | | | | 9,924 | |
| Occidental Petroleum Corp. 2.60% 2021 | | | 24,802 | | | | 24,928 | |
| Occidental Petroleum Corp. 2.90% 2024 | | | 10,841 | | | | 10,913 | |
| Petróleos Mexicanos 7.47% 2026 | | MXN | 30 | | | | 1 | |
| Sabine Pass Liquefaction, LLC 4.20% 2028 | | $ | 2,225 | | | | 2,344 | |
| | | | | | | | 76,581 | |
| | | | | | | | | |
| Utilities 0.91% | | | | | | | | |
| Consumers Energy Co. 4.05% 2048 | | | 8,570 | | | | 9,987 | |
| FirstEnergy Corp. 3.90% 2027 | | | 4,725 | | | | 5,068 | |
| FirstEnergy Corp. 4.85% 2047 | | | 4,890 | | | | 5,809 | |
| Mississippi Power Co. 4.25% 2042 | | | 1,660 | | | | 1,806 | |
| Public Service Enterprise Group Inc. 3.20% 2049 | | | 8,250 | | | | 8,522 | |
| Tampa Electric Co. 4.45% 2049 | | | 8,070 | | | | 9,757 | |
| Virginia Electric and Power Co. 3.80% 2028 | | | 7,925 | | | | 8,648 | |
| Virginia Electric and Power Co. 2.875% 2029 | | | 2,800 | | | | 2,869 | |
| Wisconsin Electric Power Co. 4.30% 2048 | | | 2,600 | | | | 3,124 | |
| | | | | | | | 55,590 | |
| | | | | | | | | |
| Consumer staples 0.39% | | | | | | | | |
| Conagra Brands, Inc. 4.85% 2028 | | | 6,400 | | | | 7,275 | |
| Keurig Dr Pepper Inc. 4.057% 2023 | | | 10,650 | | | | 11,267 | |
| Keurig Dr Pepper Inc. 5.085% 2048 | | | 4,291 | | | | 5,162 | |
| | | | | | | | 23,704 | |
| | | | | | | | | |
| Health care 0.28% | | | | | | | | |
| Becton, Dickinson and Co. 3.70% 2027 | | | 7,700 | | | | 8,250 | |
| Cigna Corp. 4.90% 2048 | | | 7,175 | | | | 8,529 | |
| | | | | | | | 16,779 | |
| | | | | | | | | |
| Industrials 0.22% | | | | | | | | |
| General Dynamics Corp. 3.75% 2028 | | | 8,650 | | | | 9,624 | |
| United Technologies Corp. 4.125% 2028 | | | 3,265 | | | | 3,679 | |
| | | | | | | | 13,303 | |
| | |
| American Funds Inflation Linked Bond Fund | 5 |
| Bonds, notes & other debt instruments (continued) | Principal amount
(000) | | | Value
(000) | |
| Corporate bonds & notes (continued) | | | | | | |
| Consumer discretionary 0.14% | | | | | | | | |
| Boston University 4.061% 2048 | | $ | 2,075 | | | $ | 2,486 | |
| Home Depot, Inc. 4.50% 2048 | | | 4,639 | | | | 5,818 | |
| | | | | | | | 8,304 | |
| | | | | | | | | |
| Communication services 0.13% | | | | | | | | |
| Verizon Communications Inc. 4.50% 2033 | | | 7,000 | | | | 8,195 | |
| | | | | | | | | |
| Total corporate bonds & notes | | | | | | | 202,456 | |
| | | | | | | | | |
| Municipals 0.56% | | | | | | | | |
| California 0.56% | | | | | | | | |
| South Pasadena Unified School Dist., G.O. Bonds, 2016 Election, Series 2019-B, 3.404% 2049 | | | 29,960 | | | | 29,981 | |
| South Pasadena Unified School Dist., G.O. Bonds, 2016 Election, Series 2019-B, 5.00% 2039 | | | 3,545 | | | | 4,140 | |
| | | | | | | | | |
| Total municipals | | | | | | | 34,121 | |
| | | | | | | | | |
| Mortgage-backed obligations 0.17% | | | | | | | | |
| Collateralized mortgage-backed obligations 0.17% | | | | | | | | |
| Legacy Mortgage Asset Trust, Series 2019-GS5, Class A1, 3.20% 20593,4,5 | | | 10,221 | | | | 10,252 | |
| | | | | | | | | |
| Total mortgage-backed obligations | | | | | | | 10,252 | |
| | | | | | | | | |
| Total bonds, notes & other debt instruments(cost: $5,857,409,000) | | | | | | | 6,051,779 | |
| | | | | | | | | |
| Short-term securities 1.90% | | Shares | | | | | |
| Money market investments 1.90% | | | | | | | | |
| Capital Group Central Cash Fund 1.78%6 | | | 1,155,031 | | | | 115,503 | |
| | | | | | | | | |
| Total short-term securities(cost: $115,503,000) | | | | | | | 115,503 | |
| Total investment securities 101.48%(cost: $5,972,912,000) | | | | | | | 6,167,282 | |
| Other assets less liabilities (1.48)% | | | | | | | (90,071 | ) |
| | | | | | | | | |
| Net assets 100.00% | | | | | | $ | 6,077,211 | |
Futures contracts
| Contracts | | Type | | Number of
contracts | | | Expiration | | Notional
amount
(000) | 7
| | Value at
11/30/2019
(000) | 8
| Unrealized
(depreciation)
appreciation
at 11/30/2019
(000) | |
| 30 Day Federal Funds Futures | | Long | | | 3,045 | | | January 2020 | | $ | 1,268,852 | | | $ | 1,249,057 | | | $ | (893 | ) |
| 90 Day Euro Dollar Futures | | Long | | | 5,022 | | | March 2020 | | | 1,255,500 | | | | 1,233,905 | | | | 4,117 | |
| 90 Day Euro Dollar Futures | | Short | | | 547 | | | March 2021 | | | (136,750 | ) | | | (134,753 | ) | | | 271 | |
| 2 Year U.S. Treasury Note Futures | | Short | | | 3,825 | | | April 2020 | | | (765,000 | ) | | | (824,616 | ) | | | 182 | |
| 5 Year Euro-Bobl Futures | | Long | | | 638 | | | December 2019 | | € | 63,800 | | | | 94,411 | | | | (1,603 | ) |
| 5 Year U.S. Treasury Note Futures | | Long | | | 14,035 | | | April 2020 | | $ | 1,403,500 | | | | 1,669,726 | | | | (740 | ) |
| 10 Year Euro-Bund Futures | | Long | | | 305 | | | December 2019 | | € | 30,500 | | | | 57,483 | | | | (958 | ) |
| 10 Year U.S. Treasury Note Futures | | Long | | | 695 | | | March 2020 | | $ | 69,500 | | | | 89,905 | | | | (33 | ) |
| 10 Year Ultra U.S. Treasury Note Futures | | Short | | | 3,569 | | | March 2020 | | | (356,900 | ) | | | (507,579 | ) | | | 629 | |
| 20 Year U.S. Treasury Bond Futures | | Short | | | 187 | | | March 2020 | | | (18,700 | ) | | | (29,727 | ) | | | 139 | |
| 30 Year Euro-Buxl Futures | | Long | | | 270 | | | December 2019 | | € | 27,000 | | | | 61,955 | | | | (3,308 | ) |
| 30 Year Ultra U.S. Treasury Bond Futures | | Short | | | 2,254 | | | March 2020 | | $ | (225,400 | ) | | | (423,118 | ) | | | (954 | ) |
| | | | | | | | | | | | | | | | | | | $ | (3,151 | ) |
| | |
| 6 | American Funds Inflation Linked Bond Fund |
Forward currency contracts
| Contract amount | | | | | Unrealized
appreciation
(depreciation) | |
Purchases
(000) | | Sales
(000) | | Counterparty | | Settlement
date | at 11/30/2019
(000) | |
| USD9,830 | | MXN189,916 | | HSBC Bank | | 12/11/2019 | | $ | 134 | |
| USD4,397 | | CAD5,785 | | Bank of New York Mellon | | 12/11/2019 | | | 42 | |
| USD4,106 | | EUR3,700 | | Bank of New York Mellon | | 12/11/2019 | | | 26 | |
| JPY2,061,479 | | USD18,925 | | JPMorgan Chase | | 12/11/2019 | | | (75 | ) |
| USD10,365 | | SEK100,000 | | Citibank | | 12/11/2019 | | | (83 | ) |
| NZD23,540 | | USD14,994 | | Standard Chartered Bank | | 12/12/2019 | | | 117 | |
| USD11,409 | | MXN220,400 | | Citibank | | 12/13/2019 | | | 160 | |
| USD190 | | CAD250 | | JPMorgan Chase | | 12/13/2019 | | | 2 | |
| JPY1,466,000 | | USD13,474 | | Goldman Sachs | | 12/13/2019 | | | (65 | ) |
| JPY3,431,000 | | USD31,478 | | UBS AG | | 12/16/2019 | | | (87 | ) |
| USD13,508 | | GBP10,510 | | Bank of America, N.A. | | 12/16/2019 | | | (95 | ) |
| EUR21,658 | | MXN460,000 | | Citibank | | 12/17/2019 | | | 428 | |
| AUD14,700 | | USD10,089 | | UBS AG | | 12/17/2019 | | | (140 | ) |
| EUR59,300 | | USD65,794 | | Citibank | | 12/19/2019 | | | (359 | ) |
| USD120,006 | | EUR108,100 | | Citibank | | 12/20/2019 | | | 711 | |
| USD5,853 | | EUR5,300 | | Barclays Bank PLC | | 12/20/2019 | | | 4 | |
| EUR11,600 | | USD12,863 | | Morgan Stanley | | 12/20/2019 | | | (62 | ) |
| AUD23,900 | | USD16,278 | | JPMorgan Chase | | 12/20/2019 | | | (102 | ) |
| USD23,857 | | MXN466,000 | | Goldman Sachs | | 1/6/2020 | | | 153 | |
| CAD6,035 | | USD4,541 | | HSBC Bank | | 1/7/2020 | | | 4 | |
| MXN309,932 | | USD15,874 | | Barclays Bank PLC | | 1/7/2020 | | | (111 | ) |
| USD27,799 | | KRW32,489,550 | | Citibank | | 1/9/2020 | | | 261 | |
| COP38,740,000 | | USD11,214 | | Citibank | | 1/9/2020 | | | (226 | ) |
| | | | | | | | | $ | 637 | |
Swap contracts
Interest rate swaps
| Receive | | Pay | | Expiration
date | | Notional
(000) | | Value at
11/30/2019
(000) | | Upfront
payments/
receipts
(000) | | Unrealized
(depreciation)
appreciation
at 11/30/2019
(000) | |
| 1.555% | | U.S. EFFR | | 1/29/2020 | | $8,297,600 | | $ | (119 | ) | | $ | — | | | $ | (119 | ) |
| 1.5365% | | U.S. EFFR | | 1/29/2020 | | 5,475,600 | | | (216 | ) | | | — | | | | (216 | ) |
| 1.535% | | U.S. EFFR | | 1/29/2020 | | 5,744,700 | | | (239 | ) | | | — | | | | (239 | ) |
| 1.538% | | U.S. EFFR | | 1/29/2020 | | 8,123,000 | | | (304 | ) | | | — | | | | (304 | ) |
| 1.531% | | U.S. EFFR | | 3/18/2020 | | 3,613,900 | | | (20 | ) | | | — | | | | (20 | ) |
| 1.5305% | | U.S. EFFR | | 3/18/2020 | | 9,147,000 | | | (57 | ) | | | — | | | | (57 | ) |
| 1.515% | | U.S. EFFR | | 3/18/2020 | | 3,272,000 | | | (89 | ) | | | — | | | | (89 | ) |
| 1.5155% | | U.S. EFFR | | 3/18/2020 | | 6,918,200 | | | (184 | ) | | | — | | | | (184 | ) |
| 1.5135% | | U.S. EFFR | | 3/18/2020 | | 6,916,900 | | | (203 | ) | | | — | | | | (203 | ) |
| 7.14% | | 28-day MXN-TIIE | | 4/29/2020 | | MXN1,633,150 | | | (117 | ) | | | — | | | | (117 | ) |
| 7.87% | | 28-day MXN-TIIE | | 5/8/2020 | | 1,452,815 | | | 135 | | | | — | | | | 135 | |
| 7.84% | | 28-day MXN-TIIE | | 5/8/2020 | | 792,185 | | | 69 | | | | — | | | | 69 | |
| 6.78% | | 28-day MXN-TIIE | | 7/6/2020 | | 777,690 | | | (131 | ) | | | — | | | | (131 | ) |
| 2.37325% | | U.S. EFFR | | 3/6/2021 | | $ 566,100 | | | 6,111 | | | | — | | | | 6,111 | |
| 2.1125% | | U.S. EFFR | | 3/28/2021 | | 460,300 | | | 3,617 | | | | — | | | | 3,617 | |
| 2.103% | | U.S. EFFR | | 3/28/2021 | | 110,000 | | | 851 | | | | — | | | | 851 | |
| 3-month USD-LIBOR | | 2.367% | | 3/28/2021 | | 68,800 | | | (598 | ) | | | — | | | | (598 | ) |
| 2.19875% | | U.S. EFFR | | 5/7/2021 | | 483,100 | | | 4,829 | | | | — | | | | 4,829 | |
| 1.665% | | U.S. EFFR | | 6/20/2021 | | 737,000 | | | 2,271 | | | | — | | | | 2,271 | |
| 1.7775% | | 3-month USD-LIBOR | | 6/21/2021 | | 1,345,400 | | | 2,168 | | | | — | | | | 2,168 | |
| 1.355% | | U.S. EFFR | | 10/24/2021 | | 115,400 | | | (19 | ) | | | — | | | | (19 | ) |
| 1.3475% | | U.S. EFFR | | 10/24/2021 | | 312,500 | | | (95 | ) | | | — | | | | (95 | ) |
| 1.339% | | U.S. EFFR | | 10/24/2021 | | 209,800 | | | (97 | ) | | | — | | | | (97 | ) |
| 1.3065% | | U.S. EFFR | | 10/25/2021 | | 283,300 | | | (304 | ) | | | — | | | | (304 | ) |
| 1.305% | | U.S. EFFR | | 10/25/2021 | | 308,600 | | | (339 | ) | | | — | | | | (339 | ) |
| 1.39% | | U.S. EFFR | | 10/31/2021 | | 517,300 | | | 292 | | | | — | | | | 292 | |
| 1.3615% | | U.S. EFFR | | 11/1/2021 | | 258,600 | | | 9 | | | | — | | | | 9 | |
| | |
| American Funds Inflation Linked Bond Fund | 7 |
Swap contracts(continued)
Interest rate swaps (continued)
| Receive | | Pay | | Expiration
date | | Notional
(000) | | Value at
11/30/2019
(000) | | Upfront
payments/
receipts
(000) | | Unrealized
(depreciation)
appreciation
at 11/30/2019
(000) | |
| 1.332% | | U.S. EFFR | | 11/4/2021 | | $ 56,000 | | $ | (29 | ) | | $ | — | | | $ | (29 | ) |
| 1.281% | | U.S. EFFR | | 11/4/2021 | | 258,900 | | | (388 | ) | | | — | | | | (388 | ) |
| 1.411% | | U.S. EFFR | | 11/7/2021 | | 345,875 | | | 350 | | | | — | | | | 350 | |
| 1.3925% | | U.S. EFFR | | 11/7/2021 | | 345,875 | | | 226 | | | | — | | | | 226 | |
| 8.54% | | 28-day MXN-TIIE | | 1/6/2022 | | MXN813,614 | | | 1,451 | | | | — | | | | 1,451 | |
| 8.44% | | 28-day MXN-TIIE | | 1/7/2022 | | 916,386 | | | 1,544 | | | | — | | | | 1,544 | |
| 2.197% | | U.S. EFFR | | 4/18/2022 | | $ 489,000 | | | 9,161 | | | | — | | | | 9,161 | |
| 6.99% | | 28-day MXN-TIIE | | 6/17/2022 | | MXN480,000 | | | 151 | | | | — | | | | 151 | |
| 1.8475% | | 3-month USD-LIBOR | | 7/11/2022 | | $ 193,600 | | | 1,247 | | | | — | | | | 1,247 | |
| 2.80% | | 3-month USD-LIBOR | | 9/2/2022 | | 280,000 | | | 7,035 | | | | — | | | | 7,035 | |
| 2.75% | | 3-month USD-LIBOR | | 9/2/2022 | | 280,000 | | | 6,763 | | | | — | | | | 6,763 | |
| 1.5675% | | 3-month USD-LIBOR | | 8/17/2023 | | 270,000 | | | 250 | | | | — | | | | 250 | |
| 3-month USD-LIBOR | | 2.18075% | | 3/29/2024 | | 29,400 | | | (732 | ) | | | — | | | | (732 | ) |
| 3-month USD-LIBOR | | 2.194% | | 3/29/2024 | | 29,600 | | | (753 | ) | | | — | | | | (753 | ) |
| 3-month USD-LIBOR | | 2.21875% | | 3/29/2024 | | 31,000 | | | (821 | ) | | | — | | | | (821 | ) |
| 3-month USD-LIBOR | | 2.221% | | 4/1/2024 | | 23,000 | | | (611 | ) | | | — | | | | (611 | ) |
| 3-month USD-LIBOR | | 2.365% | | 5/2/2024 | | 428,700 | | | (14,316 | ) | | | — | | | | (14,316 | ) |
| 3-month USD-LIBOR | | 1.7935% | | 7/12/2024 | | 46,000 | | | (418 | ) | | | — | | | | (418 | ) |
| 2.319% | | 3-month USD-LIBOR | | 6/15/2025 | | 340,000 | | | 12,252 | | | | — | | | | 12,252 | |
| 3-month USD-LIBOR | | 1.867% | | 7/11/2025 | | 274,100 | | | (2,083 | ) | | | — | | | | (2,083 | ) |
| 2.344% | | 3-month USD-LIBOR | | 9/25/2025 | | 449,000 | | | 16,649 | | | | — | | | | 16,649 | |
| 6-month JPY-LIBOR | | 0.228% | | 2/8/2026 | | ¥4,250,000 | | | (619 | ) | | | — | | | | (619 | ) |
| 28-day MXN-TIIE | | 8.11% | | 1/11/2027 | | MXN800,000 | | | (3,122 | ) | | | — | | | | (3,122 | ) |
| 28-day MXN-TIIE | | 8.135% | | 1/14/2027 | | 453,000 | | | (1,803 | ) | | | — | | | | (1,803 | ) |
| 28-day MXN-TIIE | | 7.625% | | 5/20/2027 | | 385,000 | | | (966 | ) | | | — | | | | (966 | ) |
| U.S. EFFR | | 2.045% | | 11/2/2027 | | $ 290,000 | | | (14,160 | ) | | | — | | | | (14,160 | ) |
| 2.91% | | 3-month USD-LIBOR | | 2/1/2028 | | 70,300 | | | 3,937 | | | | — | | | | 3,937 | |
| 2.908% | | 3-month USD-LIBOR | | 2/1/2028 | | 70,300 | | | 3,931 | | | | — | | | | 3,931 | |
| 2.925% | | 3-month USD-LIBOR | | 2/1/2028 | | 56,200 | | | 3,186 | | | | — | | | | 3,186 | |
| 2.92% | | 3-month USD-LIBOR | | 2/2/2028 | | 53,200 | | | 3,003 | | | | — | | | | 3,003 | |
| 6-month GBP-LIBOR | | 1.6567% | | 9/28/2028 | | £ 44,000 | | | (3,745 | ) | | | — | | | | (3,745 | ) |
| 28-day MXN-TIIE | | 8.855% | | 12/28/2028 | | MXN511,419 | | | (3,617 | ) | | | — | | | | (3,617 | ) |
| 3-month USD-LIBOR | | 2.724% | | 2/5/2029 | | $ 219,770 | | | (19,710 | ) | | | — | | | | (19,710 | ) |
| 3-month USD-LIBOR | | 2.3665% | | 3/27/2029 | | 24,000 | | | (1,426 | ) | | | — | | | | (1,426 | ) |
| 3-month USD-LIBOR | | 1.9675% | | 6/21/2029 | | 288,900 | | | (7,070 | ) | | | — | | | | (7,070 | ) |
| 3-month USD-LIBOR | | 1.995% | | 7/19/2029 | | 76,400 | | | (2,063 | ) | | | — | | | | (2,063 | ) |
| 3-month USD-LIBOR | | 2.494% | | 6/15/2030 | | 180,000 | | | (13,022 | ) | | | — | | | | (13,022 | ) |
| 3-month USD-LIBOR | | 2.97125% | | 9/2/2030 | | 57,050 | | | (6,585 | ) | | | — | | | | (6,585 | ) |
| 3-month USD-LIBOR | | 3.005% | | 9/2/2030 | | 57,050 | | | (6,762 | ) | | | — | | | | (6,762 | ) |
| 3-month USD-LIBOR | | 2.507% | | 9/25/2030 | | 239,000 | | | (17,316 | ) | | | — | | | | (17,316 | ) |
| 3-month USD-LIBOR | | 1.83% | | 8/17/2031 | | 58,000 | | | (387 | ) | | | — | | | | (387 | ) |
| 3-month USD-LIBOR | | 2.986% | | 2/1/2038 | | 33,900 | | | (2,658 | ) | | | — | | | | (2,658 | ) |
| 3-month USD-LIBOR | | 2.9625% | | 2/1/2038 | | 42,100 | | | (3,221 | ) | | | — | | | | (3,221 | ) |
| 3-month USD-LIBOR | | 2.963% | | 2/1/2038 | | 42,200 | | | (3,230 | ) | | | — | | | | (3,230 | ) |
| 3-month USD-LIBOR | | 2.967% | | 2/2/2038 | | 32,800 | | | (2,521 | ) | | | — | | | | (2,521 | ) |
| 6-month GBP-LIBOR | | 1.5872% | | 2/5/2039 | | £ 3,600 | | | (483 | ) | | | — | | | | (483 | ) |
| 6-month GBP-LIBOR | | 1.5877% | | 2/5/2039 | | 6,100 | | | (819 | ) | | | — | | | | (819 | ) |
| 3-month USD-LIBOR | | 3.253% | | 10/29/2048 | | $ 4 | | | (1 | ) | | | — | | | | (1 | ) |
| 3-month USD-LIBOR | | 2.195% | | 6/24/2049 | | 127,200 | | | (9,613 | ) | | | — | | | | (9,613 | ) |
| | | | | | | | | | | | | $ | — | | | $ | (56,713 | ) |
Credit default swaps
Centrally cleared credit default swaps on credit indices — buy protection
| Receive | | Pay/
Payment frequency | | Expiration
date | | Notional
(000) | | Value at
11/30/2019
(000) | | Upfront
payments
(000) | | Unrealized
depreciation
at 11/30/2019
(000) | |
| CDX.NA.IG.33 | | 1.00%/Quarterly | | 12/20/2024 | | $1,145,000 | | $ | (27,582 | ) | | $ | (23,526 | ) | | $ | (4,056 | ) |
| | |
| 8 | American Funds Inflation Linked Bond Fund |
| 1 | Index-linked bond whose principal amount moves with a government price index. |
| 2 | All or a portion of this security was pledged as collateral. The total value of pledged collateral was $94,739,000, which represented 1.56% of the net assets of the fund. |
| 3 | Acquired in a transaction exempt from registration under Rule 144A of the Securities Act of 1933. May be resold in the U.S. in transactions exempt from registration, normally to qualified institutional buyers. The total value of all such securities was $50,747,000, which represented .84% of the net assets of the fund. |
| 4 | Principal payments may be made periodically. Therefore, the effective maturity date may be earlier than the stated maturity date. |
| 5 | Coupon rate may change periodically. |
| 6 | Rate represents the seven-day yield at 11/30/2019. |
| 7 | Notional amount is calculated based on the number of contracts and notional contract size. |
| 8 | Value is calculated based on the notional amount and current market price. |
Key to abbreviations and symbols
AUD = Australian dollars
CAD = Canadian dollars
COP = Colombian pesos
Dist. = District
EFFR = Effective Federal Funds Rate
EUR/€ = Euros
G.O. = General Obligation
GBP/£ = British pounds
JPY/¥ = Japanese yen
KRW = South Korean won
LIBOR = London Interbank Offered Rate
MXN = Mexican pesos
NZD = New Zealand dollars
SEK = Swedish kronor
TIIE = Equilibrium Interbank Interest Rate
USD/$ = U.S. dollars
UYU = Uruguayan pesos
ZAR = South African rand
See notes to financial statements.
| American Funds Inflation Linked Bond Fund | 9 |
Financial statements
| Statement of assets and liabilities | | | | | | |
| at November 30, 2019 | | (dollars in thousands) | |
| | | | | | | | | |
| Assets: | | | | | | | | |
| Investment securities in unaffiliated issuers, at value (cost: $5,972,912) | | | | | | $ | 6,167,282 | |
| Cash | | | | | | | 1,022 | |
| Cash denominated in currencies other than U.S. dollars (cost: $1,792) | | | | | | | 1,792 | |
| Unrealized appreciation on open forward currency contracts | | | | | | | 2,042 | |
| Receivables for: | | | | | | | | |
| Sales of fund’s shares | | $ | 12,299 | | | | | |
| Dividends and interest | | | 13,830 | | | | | |
| Variation margin on futures contracts | | | 1,938 | | | | | |
| Variation margin on swap contracts | | | 8,269 | | | | 36,336 | |
| | | | | | | | 6,208,474 | |
| Liabilities: | | | | | | | | |
| Unrealized depreciation on open forward currency contracts | | | | | | | 1,405 | |
| Payables for: | | | | | | | | |
| Purchases of investments | | | 118,848 | | | | | |
| Repurchases of fund’s shares | | | 675 | | | | | |
| Investment advisory services | | | 1,371 | | | | | |
| Services provided by related parties | | | 386 | | | | | |
| Trustees’ deferred compensation | | | 29 | | | | | |
| Variation margin on futures contracts | | | 768 | | | | | |
| Variation margin on swap contracts | | | 7,770 | | | | | |
| Other | | | 11 | | | | 129,858 | |
| Net assets at November 30, 2019 | | | | | | $ | 6,077,211 | |
| | | | | | | | | |
| Net assets consist of: | | | | | | | | |
| Capital paid in on shares of beneficial interest | | | | | | $ | 5,915,584 | |
| Total distributable earnings | | | | | | | 161,627 | |
| Net assets at November 30, 2019 | | | | | | $ | 6,077,211 | |
(dollars and shares in thousands, except per-share amounts)
Shares of beneficial interest issued and outstanding (no stated par value) —
unlimited shares authorized (611,030 total shares outstanding)
| | | Net assets | | | Shares
outstanding | | | Net asset
value per share | |
| Class A | | $ | 655,498 | | | | 66,289 | | | $ | 9.89 | |
| Class C | | | 11,192 | | | | 1,145 | | | | 9.78 | |
| Class T | | | 10 | | | | 1 | | | | 9.90 | |
| Class F-1 | | | 32,900 | | | | 3,325 | | | | 9.89 | |
| Class F-2 | | | 426,365 | | | | 42,891 | | | | 9.94 | |
| Class F-3 | | | 204,447 | | | | 20,598 | | | | 9.93 | |
| Class 529-A | | | 25,982 | | | | 2,627 | | | | 9.89 | |
| Class 529-C | | | 2,469 | | | | 252 | | | | 9.79 | |
| Class 529-E | | | 1,106 | | | | 112 | | | | 9.84 | |
| Class 529-T | | | 11 | | | | 1 | | | | 9.90 | |
| Class 529-F-1 | | | 4,902 | | | | 494 | | | | 9.92 | |
| Class R-1 | | | 351 | | | | 36 | | | | 9.80 | |
| Class R-2 | | | 5,372 | | | | 553 | | | | 9.72 | |
| Class R-2E | | | 1,626 | | | | 165 | | | | 9.85 | |
| Class R-3 | | | 9,806 | | | | 999 | | | | 9.81 | |
| Class R-4 | | | 8,335 | | | | 843 | | | | 9.89 | |
| Class R-5E | | | 3,920 | | | | 395 | | | | 9.91 | |
| Class R-5 | | | 3,419 | | | | 344 | | | | 9.95 | |
| Class R-6 | | | 4,679,500 | | | | 469,960 | | | | 9.96 | |
See notes to financial statements.
| 10 | American Funds Inflation Linked Bond Fund |
| Statement of operations | | | | | | |
| for the year ended November 30, 2019 | | (dollars in thousands) | |
| | | | | | | |
| Investment income: | | | | | | | | |
| Income: | | | | | | | | |
| Interest | | $ | 122,945 | | | | | |
| Dividends | | | 4,375 | | | $ | 127,320 | |
| Fees and expenses*: | | | | | | | | |
| Investment advisory services | | | 15,128 | | | | | |
| Distribution services | | | 2,334 | | | | | |
| Transfer agent services | | | 1,334 | | | | | |
| Administrative services | | | 2,062 | | | | | |
| Reports to shareholders | | | 104 | | | | | |
| Registration statement and prospectus | | | 460 | | | | | |
| Trustees’ compensation | | | 32 | | | | | |
| Auditing and legal | | | 56 | | | | | |
| Custodian | | | 49 | | | | | |
| Other | | | 56 | | | | | |
| Total fees and expenses before waiver | | | 21,615 | | | | | |
| Less transfer agent services waiver | | | 26 | | | | | |
| Total fees and expenses after waiver | | | | | | | 21,589 | |
| Net investment income | | | | | | | 105,731 | |
| | | | | | | | | |
| Net realized loss and unrealized appreciation: | | | | | | | | |
| Net realized gain (loss) on: | | | | | | | | |
| Investments in unaffiliated issuers | | | 56,205 | | | | | |
| Futures contracts | | | (36,797 | ) | | | | |
| Forward currency contracts | | | 397 | | | | | |
| Swap contracts | | | (70,482 | ) | | | | |
| Currency transactions | | | (188 | ) | | | (50,865 | ) |
| Net unrealized appreciation (depreciation) on: | | | | | | | | |
| Investments in unaffiliated issuers | | | 356,393 | | | | | |
| Futures contracts | | | (4,605 | ) | | | | |
| Forward currency contracts | | | 404 | | | | | |
| Swap contracts | | | (63,467 | ) | | | 288,725 | |
| Net realized loss and unrealized appreciation | | | | | | | 237,860 | |
| | | | | | | | | |
| Net increase in net assets resulting from operations | | | | | | $ | 343,591 | |
| * | Additional information related to class-specific fees and expenses is included in the notes to financial statements. |
See notes to financial statements.
| American Funds Inflation Linked Bond Fund | 11 |
Statements of changes in net assets
| | | (dollars in thousands) | |
| | | | |
| | | Year ended November 30, | |
| | | 2019 | | | 2018 | |
| Operations: | | | | | | | | |
| Net investment income | | $ | 105,731 | | | $ | 111,837 | |
| Net realized (loss) gain | | | (50,865 | ) | | | 13,521 | |
| Net unrealized appreciation (depreciation) | | | 288,725 | | | | (151,293 | ) |
| Net increase (decrease) in net assets resulting from operations | | | 343,591 | | | | (25,935 | ) |
| | | | | | | | | |
| Distributions paid to shareholders | | | (139,150 | ) | | | (66,747 | ) |
| | | | | | | | | |
| Net capital share transactions | | | 1,075,116 | | | | 1,138,825 | |
| | | | | | | | | |
| Total increase in net assets | | | 1,279,557 | | | | 1,046,143 | |
| | | | | | | | | |
| Net assets: | | | | | | | | |
| Beginning of year | | | 4,797,654 | | | | 3,751,511 | |
| End of year | | $ | 6,077,211 | | | $ | 4,797,654 | |
See notes to financial statements.
| 12 | American Funds Inflation Linked Bond Fund |
Notes to financial statements
1. Organization
American Funds Inflation Linked Bond Fund (the “fund”) is registered under the Investment Company Act of 1940 as an open-end, diversified management investment company. The fund seeks to provide inflation protection and income consistent with investment in inflation linked securities.
The fund has 19 share classes consisting of six retail share classes (Classes A, C, T, F-1, F-2 and F-3), five 529 college savings plan share classes (Classes 529-A, 529-C, 529-E, 529-T and 529-F-1) and eight retirement plan share classes (Classes R-1, R-2, R-2E, R-3, R-4, R-5E, R-5 and R-6). The 529 college savings plan share classes can be used to save for college education. The retirement plan share classes are generally offered only through eligible employer-sponsored retirement plans. The fund’s share classes are described further in the following table:
| Share class | | Initial sales
charge | | Contingent deferred sales
charge upon redemption | | Conversion feature |
| Classes A and 529-A | | Up to 2.50% | | None (except 1% for certain redemptions within 18 months of purchase without an initial sales charge) | | None |
| Class C* | | None | | 1% for redemptions within one year of purchase | | Class C converts to Class F-1 after 10 years |
| Class 529-C* | | None | | 1% for redemptions within one year of purchase | | Class 529-C converts to Class 529-A after 10 years |
| Class 529-E | | None | | None | | None |
| Classes T and 529-T* | | Up to 2.50% | | None | | None |
| Classes F-1, F-2, F-3 and 529-F-1 | | None | | None | | None |
| Classes R-1, R-2, R-2E, R-3, R-4, R-5E, R-5 and R-6 | | None | | None | | None |
| * | Class C, T, 529-C and 529-T shares are not available for purchase. |
Holders of all share classes have equal pro rata rights to the assets, dividends and liquidation proceeds of the fund. Each share class has identical voting rights, except for the exclusive right to vote on matters affecting only its class. Share classes have different fees and expenses (“class-specific fees and expenses”), primarily due to different arrangements for distribution, transfer agent and administrative services. Differences in class-specific fees and expenses will result in differences in net investment income and, therefore, the payment of different per-share dividends by each share class.
2. Significant accounting policies
The fund is an investment company that applies the accounting and reporting guidance issued in Topic 946 by the U.S. Financial Accounting Standards Board. The fund’s financial statements have been prepared to comply with U.S. generally accepted accounting principles (“U.S. GAAP”). These principles require the fund’s investment adviser to make estimates and assumptions that affect reported amounts and disclosures. Actual results could differ from those estimates. Subsequent events, if any, have been evaluated through the date of issuance in the preparation of the financial statements. The fund follows the significant accounting policies described in this section, as well as the valuation policies described in the next section on valuation.
Security transactions and related investment income — Security transactions are recorded by the fund as of the date the trades are executed with brokers. Realized gains and losses from security transactions are determined based on the specific identified cost of the securities. In the event a security is purchased with a delayed payment date, the fund will segregate liquid assets sufficient to meet its payment obligations. Dividend income is recognized on the ex-dividend date and interest income is recognized on an accrual basis. Market discounts, premiums and original issue discounts on fixed-income securities are amortized daily over the expected life of the security.
Class allocations — Income, fees and expenses (other than class-specific fees and expenses) and realized and unrealized gains and losses are allocated daily among the various share classes based on their relative net assets. Class-specific fees and expenses, such as distribution, transfer agent and administrative services, are charged directly to the respective share class.
Distributions paid to shareholders — Income dividends and capital gain distributions are recorded on the ex-dividend date.
| American Funds Inflation Linked Bond Fund | 13 |
Currency translation — Assets and liabilities, including investment securities, denominated in currencies other than U.S. dollars are translated into U.S. dollars at the exchange rates supplied by one or more pricing vendors on the valuation date. Purchases and sales of investment securities and income and expenses are translated into U.S. dollars at the exchange rates on the dates of such transactions. The effects of changes in exchange rates on investment securities are included with the net realized gain or loss and net unrealized appreciation or depreciation on investments in the fund’s statement of operations. The realized gain or loss and unrealized appreciation or depreciation resulting from all other transactions denominated in currencies other than U.S. dollars are disclosed separately.
3. Valuation
Capital Research and Management Company (“CRMC”), the fund’s investment adviser, values the fund’s investments at fair value as defined by U.S. GAAP. The net asset value of each share class of the fund is generally determined as of approximately 4:00 p.m. New York time each day the New York Stock Exchange is open.
Methods and inputs — The fund’s investment adviser uses the following methods and inputs to establish the fair value of the fund’s assets and liabilities. Use of particular methods and inputs may vary over time based on availability and relevance as market and economic conditions evolve.
Fixed-income securities, including short-term securities, are generally valued at prices obtained from one or more pricing vendors. Vendors value such securities based on one or more of the inputs described in the following table. The table provides examples of inputs that are commonly relevant for valuing particular classes of fixed-income securities in which the fund is authorized to invest. However, these classifications are not exclusive, and any of the inputs may be used to value any other class of fixed-income security.
| Fixed-income class | | Examples of standard inputs |
| All | | Benchmark yields, transactions, bids, offers, quotations from dealers and trading systems, new issues, spreads and other relationships observed in the markets among comparable securities; and proprietary pricing models such as yield measures calculated using factors such as cash flows, financial or collateral performance and other reference data (collectively referred to as “standard inputs”) |
| Corporate bonds & notes; convertible securities | | Standard inputs and underlying equity of the issuer |
| Bonds & notes of governments & government agencies | | Standard inputs and interest rate volatilities |
| Mortgage-backed; asset-backed obligations | | Standard inputs and cash flows, prepayment information, default rates, delinquency and loss assumptions, collateral characteristics, credit enhancements and specific deal information |
When the fund’s investment adviser deems it appropriate to do so (such as when vendor prices are unavailable or deemed to be not representative), fixed-income securities will be valued in good faith at the mean quoted bid and ask prices that are reasonably and timely available (or bid prices, if ask prices are not available) or at prices for securities of comparable maturity, quality and type. The Capital Group Central Cash Fund (“CCF”), a fund within the Capital Group Central Fund Series (“Central Funds”), is valued based upon a floating net asset value, which fluctuates with changes in the value of CCF’s portfolio securities. The underlying securities are valued based on the policies and procedures in CCF’s statement of additional information.
Exchange-traded futures are generally valued at the official settlement price of the exchange or market on which such instruments are traded, as of the close of business on the day the futures are being valued. Forward currency contracts are valued at the mean of representative quoted bid and ask prices, generally based on prices supplied by one or more pricing vendors. Interest rate swaps and credit default swaps are generally valued by pricing vendors based on market inputs that include the index and term of index, reset frequency, payer/receiver, currency and pay frequency.
Securities and other assets for which representative market quotations are not readily available or are considered unreliable by the fund’s investment adviser are fair valued as determined in good faith under fair valuation guidelines adopted by authority of the fund’s board of trustees as further described. The investment adviser follows fair valuation guidelines, consistent with U.S. Securities and Exchange Commission rules and guidance, to consider relevant principles and factors when making fair value determinations. The investment adviser considers relevant indications of value that are reasonably and timely available to it in determining the fair value to be assigned to a particular security, such as the type and cost of the security; contractual or legal restrictions on resale of the security; relevant financial or business developments of the issuer; actively traded similar or related securities; conversion or exchange rights on the security; related corporate actions; significant events occurring after the close of trading in the security; and changes in overall market conditions. In addition, the closing prices of equity securities that trade in markets outside U.S. time zones may be adjusted to reflect significant events
| 14 | American Funds Inflation Linked Bond Fund |
that occur after the close of local trading but before the net asset value of each share class of the fund is determined. Fair valuations and valuations of investments that are not actively trading involve judgment and may differ materially from valuations that would have been used had greater market activity occurred.
Processes and structure — The fund’s board of trustees has delegated authority to the fund’s investment adviser to make fair value determinations, subject to board oversight. The investment adviser has established a Joint Fair Valuation Committee (the “Fair Valuation Committee”) to administer, implement and oversee the fair valuation process, and to make fair value decisions. The Fair Valuation Committee regularly reviews its own fair value decisions, as well as decisions made under its standing instructions to the investment adviser’s valuation teams. The Fair Valuation Committee reviews changes in fair value measurements from period to period and may, as deemed appropriate, update the fair valuation guidelines to better reflect the results of back testing and address new or evolving issues. The Fair Valuation Committee reports any changes to the fair valuation guidelines to the board of trustees. The fund’s board and audit committee also regularly review reports that describe fair value determinations and methods.
The fund’s investment adviser has also established a Fixed-Income Pricing Review Group to administer and oversee the fixed-income valuation process, including the use of fixed-income pricing vendors. This group regularly reviews pricing vendor information and market data. Pricing decisions, processes and controls over security valuation are also subject to additional internal reviews, including an annual control self-evaluation program facilitated by the investment adviser’s compliance group.
Classifications — The fund’s investment adviser classifies the fund’s assets and liabilities into three levels based on the inputs used to value the assets or liabilities. Level 1 values are based on quoted prices in active markets for identical securities. Level 2 values are based on significant observable market inputs, such as quoted prices for similar securities and quoted prices in inactive markets. Certain securities trading outside the U.S. may transfer between Level 1 and Level 2 due to valuation adjustments resulting from significant market movements following the close of local trading. Level 3 values are based on significant unobservable inputs that reflect the investment adviser’s determination of assumptions that market participants might reasonably use in valuing the securities. The valuation levels are not necessarily an indication of the risk or liquidity associated with the underlying investment. For example, U.S. government securities are reflected as Level 2 because the inputs used to determine fair value may not always be quoted prices in an active market. The following tables present the fund’s valuation levels as of November 30, 2019 (dollars in thousands):
| | | Investment securities | |
| | | Level 1 | | | Level 2 | | | Level 3 | | | Total | |
| Assets: | | | | | | | | | | | | | | | | |
| Bonds, notes & other debt instruments: | | | | | | | | | | | | | | | | |
| U.S. Treasury bonds & notes | | $ | — | | | $ | 5,562,553 | | | $ | — | | | $ | 5,562,553 | |
| Bonds & notes of governments & government agencies outside the U.S. | | | — | | | | 242,397 | | | | — | | | | 242,397 | |
| Corporate bonds & notes | | | — | | | | 202,456 | | | | — | | | | 202,456 | |
| Municipals | | | — | | | | 34,121 | | | | — | | | | 34,121 | |
| Mortgage-backed obligations | | | — | | | | 10,252 | | | | — | | | | 10,252 | |
| Short-term securities | | | 115,503 | | | | — | | | | — | | | | 115,503 | |
| Total | | $ | 115,503 | | | $ | 6,051,779 | | | $ | — | | | $ | 6,167,282 | |
| | | | | | | | | | | | | | | | | |
| | | Other investments* | |
| | | Level 1 | | | Level 2 | | | Level 3 | | | Total | |
| Assets: | | | | | | | | | | | | | | | | |
| Unrealized appreciation on futures contracts | | $ | 5,338 | | | $ | — | | | $ | — | | | $ | 5,338 | |
| Unrealized appreciation on open forward currency contracts | | | — | | | | 2,042 | | | | — | | | | 2,042 | |
| Unrealized appreciation on interest rate swaps | | | — | | | | 91,488 | | | | — | | | | 91,488 | |
| Liabilities: | | | | | | | | | | | | | | | | |
| Unrealized depreciation on futures contracts | | | (8,489 | ) | | | — | | | | — | | | | (8,489 | ) |
| Unrealized depreciation on open forward currency contracts | | | — | | | | (1,405 | ) | | | — | | | | (1,405 | ) |
| Unrealized depreciation on interest rate swaps | | | — | | | | (148,201 | ) | | | — | | | | (148,201 | ) |
| Unrealized depreciation on credit default swaps | | | — | | | | (4,056 | ) | | | — | | | | (4,056 | ) |
| Total | | $ | (3,151 | ) | | $ | (60,132 | ) | | $ | — | | | $ | (63,283 | ) |
| * | Futures contracts, forward currency contracts, interest rate swaps and credit default swaps are not included in the investment portfolio. |
| American Funds Inflation Linked Bond Fund | 15 |
4. Risk factors
Investing in the fund may involve certain risks including, but not limited to, those described below.
Market conditions — The prices of, and the income generated by, the securities held by the fund may decline — sometimes rapidly or unpredictably — due to various factors, including events or conditions affecting the general economy or particular industries; overall market changes; local, regional or global political, social or economic instability; governmental, governmental agency or central bank responses to economic conditions; and currency exchange rate, interest rate and commodity price fluctuations.
Issuer risks — The prices of, and the income generated by, securities held by the fund may decline in response to various factors directly related to the issuers of such securities, including reduced demand for an issuer’s goods or services, poor management performance, major litigation related to the issuer, changes in government regulations affecting the issuer or its competitive environment and strategic initiatives such as mergers, acquisitions or dispositions and the market response to any such initiatives.
Investing in debt instruments — The prices of, and the income generated by, bonds and other debt securities held by the fund may be affected by changing interest rates and by changes in the effective maturities and credit ratings of these securities.
Rising interest rates will generally cause the prices of bonds and other debt securities to fall. A general rise in interest rates may cause investors to sell debt securities on a large scale, which could also adversely affect the price and liquidity of debt securities and could also result in increased redemptions from the fund. Falling interest rates may cause an issuer to redeem, call or refinance a debt security before its stated maturity, which may result in the fund failing to recoup the full amount of its initial investment and having to reinvest the proceeds in lower yielding securities. Longer maturity debt securities generally have greater sensitivity to changes in interest rates and may be subject to greater price fluctuations than shorter maturity debt securities.
Bonds and other debt securities are also subject to credit risk, which is the possibility that the credit strength of an issuer or guarantor will weaken or be perceived to be weaker, and/or an issuer of a debt security will fail to make timely payments of principal or interest and the security will go into default. A downgrade or default affecting any of the fund’s securities could cause the value of the fund’s shares to decrease. Lower quality debt securities generally have higher rates of interest and may be subject to greater price fluctuations than higher quality debt securities. Credit risk is gauged, in part, by the credit ratings of the debt securities in which the fund invests. However, ratings are only the opinions of the rating agencies issuing them and are not guarantees as to credit quality or an evaluation of market risk. The fund’s investment adviser relies on its own credit analysts to research issuers and issues in seeking to assess credit and default risks.
Investing in inflation-linked bonds — The values of inflation-linked bonds generally fluctuate in response to changes in real interest rates — i.e., rates of interest after factoring in inflation. A rise in real interest rates may cause the prices of inflation-linked securities to fall, while a decline in real interest rates may cause the prices to increase. Inflation-linked bonds may experience greater losses than other debt securities with similar durations when real interest rates rise faster than nominal interest rates. There can be no assurance that the value of an inflation-linked security will be directly correlated to changes in interest rates; for example, if interest rates rise for reasons other than inflation, the increase may not be reflected in the security’s inflation measure.
Investing in inflation-linked bonds may also reduce the fund’s distributable income during periods of deflation. If prices for goods and services decline throughout the economy, the principal and income on inflation-linked securities may decline and result in losses to the fund.
Investing in securities backed by the U.S. government — Securities backed by the U.S. Treasury or the full faith and credit of the U.S. government are guaranteed only as to the timely payment of interest and principal when held to maturity. Accordingly, the current market values for these securities will fluctuate with changes in interest rates and the credit rating of the U.S. government. Securities issued by government-sponsored entities and federal agencies and instrumentalities that are not backed by the full faith and credit of the U.S. government are neither issued nor guaranteed by the U.S. government.
Liquidity risk — Certain fund holdings may be or may become difficult or impossible to sell, particularly during times of market turmoil. Liquidity may be impacted by the lack of an active market for a holding, legal or contractual restrictions on resale, or the reduced number and capacity of market participants to make a market in such holding. Market prices for less liquid or illiquid holdings may be volatile, and reduced liquidity may have an adverse impact on the market price of such holdings. Additionally, the sale of less liquid or illiquid holdings may involve substantial delays (including delays in settlement) and additional costs and the fund may be unable to sell such holdings when necessary to meet its liquidity needs or may be forced to sell at a loss.
| 16 | American Funds Inflation Linked Bond Fund |
Investing in derivatives — The use of derivatives involves a variety of risks, which may be different from, or greater than, the risks associated with investing in traditional securities, such as stocks and bonds. Changes in the value of a derivative may not correlate perfectly with, and may be more sensitive to market events than, the underlying asset, rate or index, and a derivative instrument may expose the fund to losses in excess of its initial investment. Derivatives may be difficult to value, difficult for the fund to buy or sell at an opportune time or price and difficult, or even impossible, to terminate or otherwise offset. The fund’s use of derivatives may result in losses to the fund, and investing in derivatives may reduce the fund’s returns and increase the fund’s price volatility. The fund’s counterparty to a derivative transaction (including, if applicable, the fund’s clearing broker, the derivatives exchange or the clearinghouse) may be unable or unwilling to honor its financial obligations in respect of the transaction. In certain cases, the fund may be hindered or delayed in exercising remedies against or closing out derivative instruments with a counterparty, which may result in additional losses.
Investing outside the U.S. — Securities of issuers domiciled outside the U.S., or with significant operations or revenues outside the U.S., may lose value because of adverse political, social, economic or market developments (including social instability, regional conflicts, terrorism and war) in the countries or regions in which the issuers operate or generate revenue. These securities may also lose value due to changes in foreign currency exchange rates against the U.S. dollar and/or currencies of other countries. Issuers of these securities may be more susceptible to actions of foreign governments, such as nationalization, currency blockage or the imposition of price controls or punitive taxes, each of which could adversely impact the value of these securities. Securities markets in certain countries may be more volatile and/or less liquid than those in the U.S. Investments outside the U.S. may also be subject to different accounting practices and different regulatory, legal and reporting standards and practices, and may be more difficult to value, than those in the U.S. In addition, the value of investments outside the U.S. may be reduced by foreign taxes, including foreign withholding taxes on interest and dividends. Further, there may be increased risks of delayed settlement of securities purchased or sold by the fund. The risks of investing outside the U.S. may be heightened in connection with investments in emerging markets.
Management — The investment adviser to the fund actively manages the fund’s investments. Consequently, the fund is subject to the risk that the methods and analyses, including models, tools and data, employed by the investment adviser in this process may be flawed or incorrect and may not produce the desired results. This could cause the fund to lose value or its investment results to lag relevant benchmarks or other funds with similar objectives. Your investment in the fund is not a bank deposit and is not insured or guaranteed by the Federal Deposit Insurance Corporation or any other governmental agency, entity or person. You should consider how this fund fits into your overall investment program.
5. Certain investment techniques
Index-linked bonds — The fund has invested in index-linked bonds, which are fixed-income securities whose principal value is periodically adjusted to a government price index. Over the life of an index-linked bond, interest is paid on the adjusted principal value. Increases or decreases in the principal value of index-linked bonds are recorded as interest income in the fund’s statement of operations.
Futures contracts — The fund has entered into futures contracts, which provide for the future sale by one party and purchase by another party of a specified amount of a specific financial instrument for a specified price, date, time and place designated at the time the contract is made. Futures contracts are used to strategically manage the fund’s interest rate sensitivity by increasing or decreasing the duration of the fund or a portion of the fund’s portfolio.
Upon entering into futures contracts, and to maintain the fund’s open positions in futures contracts, the fund is required to deposit with a futures broker, known as a futures commission merchant (“FCM”), in a segregated account in the name of the FCM an amount of cash, U.S. government securities or other liquid securities, known as initial margin. The margin required for a particular futures contract is set by the exchange on which the contract is traded to serve as collateral, and may be significantly modified from time to time by the exchange during the term of the contract. Securities deposited as initial margin, if any, are disclosed in the investment portfolio and cash deposited as initial margin, if any, is reflected as cash pledged for futures contracts in the fund’s statement of assets and liabilities.
On a daily basis, the fund pays or receives variation margin based on the increase or decrease in the value of the futures contracts and records variation margin on futures contracts in the statement of assets and liabilities. In addition, the fund segregates liquid assets equivalent to the fund’s outstanding obligations under the contract in excess of the initial margin and variation margin, if any. Futures contracts may involve a risk of loss in excess of the variation margin shown on the fund’s statement of assets and liabilities. The fund records realized gains or losses at the time the futures contract is closed or expires. Net realized gains or losses and net unrealized appreciation or depreciation from futures contracts are recorded in the fund’s statement of operations. The average month-end notional amount of futures contracts while held was $6,715,450,000.
| American Funds Inflation Linked Bond Fund | 17 |
Forward currency contracts — The fund has entered into forward currency contracts, which represent agreements to exchange currencies on specific future dates at predetermined rates. The fund’s investment adviser uses forward currency contracts to manage the fund’s exposure to changes in exchange rates. Upon entering into these contracts, risks may arise from the potential inability of counterparties to meet the terms of their contracts and from possible movements in exchange rates.
On a daily basis, the fund’s investment adviser values forward currency contracts and records unrealized appreciation or depreciation for open forward currency contracts in the fund’s statement of assets and liabilities. Realized gains or losses are recorded at the time the forward currency contract is closed or offset by another contract with the same broker for the same settlement date and currency.
Closed forward currency contracts that have not reached their settlement date are included in the respective receivables or payables for closed forward currency contracts in the fund’s statement of assets and liabilities. Net realized gains or losses from closed forward currency contracts and net unrealized appreciation or depreciation from open forward currency contracts are recorded in the fund’s statement of operations. The average month-end notional amount of open forward currency contracts while held was $486,728,000.
Interest rate swaps — The fund has entered into interest rate swap contracts, which are agreements to exchange one stream of future interest payments for another based on a specified notional amount. Typically, interest rate swaps exchange a fixed interest rate for a payment that floats relative to a benchmark or vice versa. The fund’s investment adviser uses interest rate swaps to seek to manage the interest rate sensitivity of the fund by increasing or decreasing the duration of the fund or a portion of the fund’s portfolio. Risks may arise as a result of the fund’s investment adviser incorrectly anticipating changes in interest rates, increased volatility, reduced liquidity and the potential inability of counterparties to meet the terms of their agreements.
Upon entering into an interest rate swap contract, the fund is required to deposit cash, U.S. government securities or other liquid securities, which is known as initial margin. Generally, the initial margin required for a particular interest rate swap is set and held as collateral by the clearinghouse on which the contract is cleared. The amount of initial margin required may be significantly modified from time to time by the clearinghouse during the term of the contract.
On a daily basis, the fund’s investment adviser records daily interest accruals related to the exchange of future payments as a receivable and payable in the fund’s statement of assets and liabilities. The fund also pays or receives a variation margin based on the increase or decrease in the value of the interest rate swaps, including accrued interest, and records variation margin on interest rate swaps in the statement of assets and liabilities. The fund records realized gains and losses on both the net accrued interest and any gain or loss recognized at the time the interest rate swap is closed or expires. Net realized gains or losses, as well as any net unrealized appreciation or depreciation, from interest rate swaps are recorded in the fund’s statement of operations. The average month-end notional amount of interest rate swaps while held was $56,047,466,000.
Credit default swap indices — The fund has entered into centrally cleared credit default swap agreements on credit indices (“CDSI”) that involve one party (the protection buyer) making a stream of payments to another party (the protection seller) in exchange for the right to receive a specified return upon the occurrence of a credit event, such as a default or restructuring, with respect to any of the underlying issuers (reference obligations) in the referenced index. The fund’s investment adviser uses credit default swaps to assume exposure to a diversified portfolio of credits or to hedge against existing credit risks.
CDSI are portfolios of credit instruments or exposures designed to be representative of some part of the credit market, such as the high-yield or investment-grade credit market. CDSI are generally traded using standardized terms, including a fixed spread and standard maturity dates, and reference all the names in the index. If there is a credit event, it is settled based on that name’s weight in the index. The composition of the underlying issuers or obligations within a particular index may change periodically, usually every six months. A specified credit event may affect all or individual underlying reference obligations included in the index, and will be settled based upon the relative weighting of the affected obligation(s) within the index. The value of each CDSI can be used as a measure of the current payment/performance risk of the CDSI and represents the likelihood of an expected liability or profit should the notional amount of the CDSI be closed or sold as of the period end. An increasing value, as compared to the notional amount of the CDSI, represents a deterioration of the referenced indices’ credit soundness and a greater likelihood of risk of default or other credit event occurring as defined under the terms of the agreement. When the fund provides sell protection, its maximum exposure is the notional amount of the credit default swap agreement.
Upon entering into a centrally cleared CDSI contract, the fund is required to deposit with a derivatives clearing member (“DCM”) in a segregated account in the name of the DCM an amount of cash, U.S. government securities or other liquid securities, which is known as initial margin. Generally, the initial margin required for a particular credit default swap is set and held as collateral by the clearinghouse on which the contract is cleared. The amount of initial margin required may be significantly modified from time to time by the clearinghouse during the term of the contract. Securities deposited as initial margin are designated on the investment portfolio.
| 18 | American Funds Inflation Linked Bond Fund |
On a daily basis, interest accruals related to the exchange of future payments are recorded as a receivable and payable in the fund’s statement of assets and liabilities. The fund also pays or receives a variation margin based on the increase or decrease in the value of the CDSI, and records variation margin in the statement of assets and liabilities. The fund records realized gains and losses on both the net accrued interest and any gain or loss recognized at the time the swap is closed or expires. Net realized gains or losses, as well as any net unrealized appreciation or depreciation, from credit default swaps are recorded in the fund’s statement of operations. The average month-end notional amount of credit default swaps while held was $1,145,000,000.
The following tables identify the location and fair value amounts on the fund’s statement of assets and liabilities and the effect on the fund’s statement of operations resulting from the fund’s use of futures contracts, forward currency contracts, interest rate swaps and credit default swaps as of, or for the year ended, November 30, 2019 (dollars in thousands):
| | | | | Assets | | | Liabilities | |
| Contracts | | Risk type | | Location on statement of
assets and liabilities | | Value | | | Location on statement of
assets and liabilities | | Value | |
| Futures | | Interest | | Unrealized appreciation* | | $ | 5,338 | | | Unrealized depreciation* | | $ | 8,489 | |
| Forward currency | | Currency | | Unrealized appreciation on open forward currency contracts | | | 2,042 | | | Unrealized depreciation on open forward currency contracts | | | 1,405 | |
| Swap | | Interest | | Unrealized appreciation* | | | 91,488 | | | Unrealized depreciation* | | | 148,201 | |
| Swap | | Credit | | Unrealized appreciation* | | | — | | | Unrealized depreciation* | | | 4,056 | |
| | | | | | | $ | 98,868 | | | | | $ | 162,151 | |
| | | | | | | | | | | | | | | |
| | | | | Net realized (loss) gain | | | Net unrealized (depreciation) appreciation | |
| Contracts | | Risk type | | Location on statement of
operations | | Value | | | Location on statement of
operations | | Value | |
| Futures | | Interest | | Net realized loss on futures contracts | | $ | (36,797 | ) | | Net unrealized depreciation on futures contracts | | $ | (4,605 | ) |
| Forward currency | | Currency | | Net realized gain on forward currency contracts | | | 397 | | | Net unrealized appreciation on forward currency contracts | | | 404 | |
| Swap | | Interest | | Net realized loss on swap contracts | | | (53,273 | ) | | Net unrealized depreciation on swap contracts | | | (50,983 | ) |
| Swap | | Credit | | Net realized loss on swap contracts | | | (17,209 | ) | | Net unrealized depreciation on swap contracts | | | (12,484 | ) |
| | | | | | | $ | (106,882 | ) | | | | $ | (67,668 | ) |
| * | Includes cumulative appreciation/depreciation on futures contracts, interest rate swaps and credit default swaps as reported in the applicable tables following the fund’s investment portfolio. Only current day’s variation margin is reported within the statement of assets and liabilities. |
Collateral — The fund participates in a collateral program that calls for the fund to either receive or pledge highly liquid assets, such as cash or U.S. government securities, as collateral due to its use of futures contracts, forward currency contracts, interest rate swaps and credit default swaps. For futures contracts, interest rate swaps and credit default swaps, the program calls for the fund to pledge collateral for initial and variation margin by contract. For forward currency contracts, the program calls for the fund to either receive or pledge collateral based on the net gain or loss on unsettled forward currency contracts by counterparty. The purpose of the collateral is to cover potential losses that could occur in the event that either party cannot meet its contractual obligation. Non-cash collateral pledged by the fund, if any, is disclosed in the fund’s investment portfolio, and cash collateral pledged by the fund, if any, is held in a segregated account with the fund’s custodian, which is reflected as pledged cash in the fund’s statement of assets and liabilities.
Rights of offset — The fund has entered into enforceable master netting agreements with certain counterparties for forward currency contracts, where on any date amounts payable by each party to the other (in the same currency with respect to the same transaction) may be closed or offset by each party’s payment obligation. If an early termination date occurs under these agreements following an event of default or termination event, all obligations of each party to its counterparty are settled net through a single payment in a single currency (“close-out netting”). For financial reporting purposes, the fund does not offset financial assets and financial liabilities that are subject to these master netting arrangements in the statement of assets and liabilities.
| American Funds Inflation Linked Bond Fund | 19 |
The following table presents the fund��s forward currency contracts by counterparty that are subject to master netting agreements but that are not offset in the fund’s statement of assets and liabilities. The net amount column shows the impact of offsetting on the fund’s statement of assets and liabilities as of November 30, 2019, if close-out netting was exercised (dollars in thousands):
| | | Gross amounts
recognized in the | | | Gross amounts not offset in the
statement of assets and liabilities and
subject to a master netting agreement | | | | |
| Counterparty | | statement of assets
and liabilities | | | Available
to offset | | | Non-cash
collateral* | | | Cash
collateral* | | | Net
amount | |
| Assets: | | | | | | | | | | | | | | | | | | | | |
| Bank of New York Mellon | | $ | 68 | | | $ | — | | | $ | — | | | $ | — | | | $ | 68 | |
| Barclays Bank PLC | | | 4 | | | | (4 | ) | | | — | | | | — | | | | — | |
| Citibank | | | 1,560 | | | | (668 | ) | | | — | | | | (892 | ) | | | — | |
| Goldman Sachs | | | 153 | | | | (65 | ) | | | — | | | | — | | | | 88 | |
| HSBC Bank | | | 138 | | | | — | | | | — | | | | — | | | | 138 | |
| JPMorgan Chase | | | 2 | | | | (2 | ) | | | — | | | | — | | | | — | |
| Standard Chartered Bank | | | 117 | | | | — | | | | — | | | | — | | | | 117 | |
| Total | | $ | 2,042 | | | $ | (739 | ) | | $ | — | | | $ | (892 | ) | | $ | 411 | |
| Liabilities: | | | | | | | | | | | | | | | | | | | | |
| Bank of America, N.A. | | $ | 95 | | | $ | — | | | $ | — | | | $ | — | | | $ | 95 | |
| Barclays Bank PLC | | | 111 | | | | (4 | ) | | | — | | | | — | | | | 107 | |
| Citibank | | | 668 | | | | (668 | ) | | | — | | | | — | | | | — | |
| Goldman Sachs | | | 65 | | | | (65 | ) | | | — | | | | — | | | | — | |
| JPMorgan Chase | | | 177 | | | | (2 | ) | | | (114 | ) | | | — | | | | 61 | |
| Morgan Stanley | | | 62 | | | | — | | | | — | | | | — | | | | 62 | |
| UBS AG | | | 227 | | | | — | | | | (227 | ) | | | — | | | | — | |
| Total | | $ | 1,405 | | | $ | (739 | ) | | $ | (341 | ) | | $ | — | | | $ | 325 | |
| * | Collateral is shown on a settlement basis. |
6. Taxation and distributions
Federal income taxation — The fund complies with the requirements under Subchapter M of the Internal Revenue Code applicable to mutual funds and intends to distribute substantially all of its net taxable income and net capital gains each year. The fund is not subject to income taxes to the extent such distributions are made. Therefore, no federal income tax provision is required.
As of and during the period ended November 30, 2019, the fund did not have a liability for any unrecognized tax benefits. The fund recognizes interest and penalties, if any, related to unrecognized tax benefits as income tax expense in the statement of operations. During the period, the fund did not incur any significant interest or penalties.
The fund’s tax returns are not subject to examination by federal, state and, if applicable, non-U.S. tax authorities after the expiration of each jurisdiction’s statute of limitations, which is generally three years after the date of filing but can be extended in certain jurisdictions.
Non-U.S. taxation — Dividend and interest income are recorded net of non-U.S. taxes paid. The fund may file withholding tax reclaims in certain jurisdictions to recover a portion of amounts previously withheld. These reclaims are recorded when the amount is known and there are no significant uncertainties on collectability. Gains realized by the fund on the sale of securities in certain countries, if any, may be subject to non-U.S. taxes. If applicable, the fund records an estimated deferred tax liability based on unrealized gains to provide for potential non-U.S. taxes payable upon the sale of these securities.
Distributions — Distributions paid to shareholders are based on net investment income and net realized gains determined on a tax basis, which may differ from net investment income and net realized gains for financial reporting purposes. These differences are due primarily to different treatment for items such as currency gains and losses; short-term capital gains and losses; capital losses related to sales of certain securities within 30 days of purchase; cost of investments sold; net capital losses and income on certain investments. The fiscal year in which amounts are distributed may differ from the year in which the net investment income and net realized gains are recorded by the fund for financial reporting purposes.
During the year ended November 30, 2019, the fund reclassified $1,000 from total distributable earnings to capital paid in on shares of beneficial interest to align financial reporting with tax reporting.
| 20 | American Funds Inflation Linked Bond Fund |
As of November 30, 2019, the tax basis components of distributable earnings, unrealized appreciation (depreciation) and cost of investments were as follows (dollars in thousands):
| Undistributed ordinary income | | $ | 60,715 | |
| Capital loss carryforward* | | | (30,455 | ) |
| Post-October capital loss deferral† | | | (4,637 | ) |
| Gross unrealized appreciation on investments | | | 318,695 | |
| Gross unrealized depreciation on investments | | | (182,654 | ) |
| Net unrealized appreciation on investments | | | 136,041 | |
| Cost of investments | | | 5,991,484 | |
| * | The capital loss carryforward will be used to offset any capital gains realized by the fund in future years. The fund will not make distributions from capital gains while a capital loss carryforward remains. |
| † | This deferral is considered incurred in the subsequent year. |
Distributions paid were characterized for tax purposes as follows (dollars in thousands):
| | | Year ended November 30, 2019 | | | Year ended November 30, 2018 | |
| Share class | | Ordinary
income | | | Long-term
capital gains | | | Total
distributions
paid | | | Ordinary
income | | | Long-term
capital gains | | | Total
distributions
paid | |
| Class A | | $ | 14,879 | | | $ | 1,633 | | | $ | 16,512 | | | $ | 8,189 | | | $ | — | | | $ | 8,189 | |
| Class C | | | 205 | | | | 36 | | | | 241 | | | | 108 | | | | — | | | | 108 | |
| Class T | | | — | * | | | — | * | | | — | * | | | — | * | | | — | | | | — | * |
| Class F-1 | | | 875 | | | | 100 | | | | 975 | | | | 785 | | | | — | | | | 785 | |
| Class F-2 | | | 13,712 | | | | 1,344 | | | | 15,056 | | | | 6,106 | | | | — | | | | 6,106 | |
| Class F-3 | | | 3,680 | | | | 353 | | | | 4,033 | | | | 1,850 | | | | — | | | | 1,850 | |
| Class 529-A | | | 557 | | | | 60 | | | | 617 | | | | 256 | | | | — | | | | 256 | |
| Class 529-C | | | 42 | | | | 7 | | | | 49 | | | | 7 | | | | — | | | | 7 | |
| Class 529-E | | | 15 | | | | 2 | | | | 17 | | | | 9 | | | | — | | | | 9 | |
| Class 529-T | | | — | * | | | — | * | | | — | * | | | — | * | | | — | | | | — | * |
| Class 529-F-1 | | | 143 | | | | 14 | | | | 157 | | | | 40 | | | | — | | | | 40 | |
| Class R-1 | | | 7 | | | | 1 | | | | 8 | | | | 2 | | | | — | | | | 2 | |
| Class R-2 | | | 70 | | | | 10 | | | | 80 | | | | 18 | | | | — | | | | 18 | |
| Class R-2E | | | 15 | | | | 2 | | | | 17 | | | | 9 | | | | — | | | | 9 | |
| Class R-3 | | | 130 | | | | 16 | | | | 146 | | | | 46 | | | | — | | | | 46 | |
| Class R-4 | | | 121 | | | | 13 | | | | 134 | | | | 53 | | | | — | | | | 53 | |
| Class R-5E | | | 58 | | | | 6 | | | | 64 | | | | 23 | | | | — | | | | 23 | |
| Class R-5 | | | 65 | | | | 6 | | | | 71 | | | | 25 | | | | — | | | | 25 | |
| Class R-6 | | | 92,236 | | | | 8,737 | | | | 100,973 | | | | 49,221 | | | | — | | | | 49,221 | |
| Total | | $ | 126,810 | | | $ | 12,340 | | | $ | 139,150 | | | $ | 66,747 | | | $ | — | | | $ | 66,747 | |
| * | Amount less than one thousand. |
7. Fees and transactions with related parties
CRMC, the fund’s investment adviser, is the parent company of American Funds Distributors®, Inc. (“AFD”), the principal underwriter of the fund’s shares, and American Funds Service Company® (“AFS”), the fund’s transfer agent. CRMC, AFD and AFS are considered related parties to the fund.
Investment advisory services — The fund has an investment advisory and service agreement with CRMC that provides for monthly fees accrued daily. At the beginning of the year, these fees were based on a series of decreasing annual rates beginning with 0.360% on the first $500 million of daily net assets and decreasing to 0.250% on such assets in excess of $4.0 billion. On March 4, 2019, the fund’s board of trustees approved an amended investment advisory and service agreement effective May 1, 2019, decreasing the annual rate to 0.240% on daily net assets in excess of $6.5 billion. For the year ended November 30, 2019, the investment advisory services fee was $15,128,000, which was equivalent to an annualized rate of 0.281% of average daily net assets.
| American Funds Inflation Linked Bond Fund | 21 |
Class-specific fees and expenses — Expenses that are specific to individual share classes are accrued directly to the respective share class. The principal class-specific fees and expenses are further described below:
Distribution services — The fund has plans of distribution for all share classes, except Class F-2, F-3, R-5E, R-5 and R-6 shares. Under the plans, the board of trustees approves certain categories of expenses that are used to finance activities primarily intended to sell fund shares and service existing accounts. The plans provide for payments, based on an annualized percentage of average daily net assets, ranging from 0.30% to 1.00% as noted in this section. In some cases, the board of trustees has limited the amounts that may be paid to less than the maximum allowed by the plans. All share classes with a plan may use up to 0.25% of average daily net assets to pay service fees, or to compensate AFD for paying service fees, to firms that have entered into agreements with AFD to provide certain shareholder services. The remaining amounts available to be paid under each plan are paid to dealers to compensate them for their sales activities.
| Share class | | Currently approved limits | | Plan limits | |
| Class A | | | 0.30 | % | | | 0.30 | % | |
| Class 529-A | | | 0.50 | | | | 0.50 | | |
| Classes C, 529-C and R-1 | | | 1.00 | | | | 1.00 | | |
| Class R-2 | | | 0.75 | | | | 1.00 | | |
| Class R-2E | | | 0.60 | | | | 0.85 | | |
| Classes 529-E and R-3 | | | 0.50 | | | | 0.75 | | |
| Classes T, F-1, 529-T, 529-F-1 and R-4 | | | 0.25 | | | | 0.50 | | |
For Class A and 529-A shares, distribution-related expenses include the reimbursement of dealer and wholesaler commissions paid by AFD for certain shares sold without a sales charge. These share classes reimburse AFD for amounts billed within the prior 15 months but only to the extent that the overall annual expense limits are not exceeded. As of November 30, 2019, unreimbursed expenses subject to reimbursement totaled $3,000 for Class A shares. There were no unreimbursed expenses subject to reimbursement for Class 529-A shares.
Transfer agent services — The fund has a shareholder services agreement with AFS under which the fund compensates AFS for providing transfer agent services to each of the fund’s share classes. These services include recordkeeping, shareholder communications and transaction processing. In addition, the fund reimburses AFS for amounts paid to third parties for performing transfer agent services on behalf of fund shareholders. For the year ended November 30, 2019, AFS voluntarily waived transfer agent services fees of $26,000 for Class F-3 shares.
Administrative services — The fund has an administrative services agreement with CRMC under which the fund compensates CRMC for providing administrative services to all share classes. Administrative services are provided by CRMC and its affiliates to help assist third parties providing non-distribution services to fund shareholders. These services include providing in depth information on the fund and market developments that impact fund investments. Administrative services also include, but are not limited to, coordinating, monitoring and overseeing third parties that provide services to fund shareholders. The agreement provides the fund the ability to charge an administrative services fee at the annual rate of 0.05% of the daily net assets attributable to each share class of the fund. Prior to July 1,2019, Class A shares paid CRMC an administrative services fee at the annual rate of 0.01% of daily net assets and all other share classes paid a fee at the annual rate of 0.05% of their respective daily net assets. The fund’s board of trustees authorized the fund to pay CRMC effective July 1, 2019, an administrative services fee at the annual rate of 0.03% of the average daily net assets attributable to each share class of the fund (which could increase as noted above) for CRMC’s provision of administrative services.
529 plan services — Each 529 share class is subject to service fees to compensate the Virginia College Savings Plan (“Virginia529”) for its oversight and administration of the CollegeAmerica 529 college savings plan. The fee is based on the combined net assets invested in Class 529 and ABLE shares of the American Funds. Class ABLE shares are offered on other American Funds by Virginia529 through ABLEAmerica®, a tax-advantaged savings program for individuals with disabilities. The quarterly fee is based on a series of decreasing annual rates beginning with 0.10% on the first $20 billion of the combined net assets invested in the American Funds and decreasing to 0.03% on such assets in excess of $100 billion. The fee for any given calendar quarter is accrued and calculated on the basis of the average net assets of Class 529 and ABLE shares of the American Funds for the last month of the prior calendar quarter. The fee is included in other expenses in the fund’s statement of operations. Virginia529 is not considered a related party to the fund.
| 22 | American Funds Inflation Linked Bond Fund |
For the year ended November 30, 2019, class-specific expenses under the agreements were as follows (dollars in thousands):
| Share class | | Distribution
services | | | Transfer agent
services | | | Administrative
services | | | 529 plan
services | |
| Class A | | | $1,932 | | | | $676 | | | | $119 | | | Not applicable | |
| Class C | | | 122 | | | | 13 | | | | 5 | | | Not applicable | |
| Class T | | | — | | | | — | * | | | — | * | | Not applicable | |
| Class F-1 | | | 90 | | | | 47 | | | | 15 | | | Not applicable | |
| Class F-2 | | | Not applicable | | | | 472 | | | | 190 | | | Not applicable | |
| Class F-3 | | | Not applicable | | | | 43 | | | | 69 | | | Not applicable | |
| Class 529-A | | | 57 | | | | 23 | | | | 10 | | | $16 | |
| Class 529-C | | | 23 | | | | 2 | | | | 1 | | | 2 | |
| Class 529-E | | | 4 | | | | — | * | | | 1 | | | 1 | |
| Class 529-T | | | — | | | | — | * | | | — | * | | — | * |
| Class 529-F-1 | | | — | | | | 5 | | | | 2 | | | 3 | |
| Class R-1 | | | 4 | | | | 1 | | | | — | * | | Not applicable | |
| Class R-2 | | | 36 | | | | 17 | | | | 2 | | | Not applicable | |
| Class R-2E | | | 8 | | | | 3 | | | | 1 | | | Not applicable | |
| Class R-3 | | | 41 | | | | 13 | | | | 3 | | | Not applicable | |
| Class R-4 | | | 17 | | | | 7 | | | | 3 | | | Not applicable | |
| Class R-5E | | | Not applicable | | | | 4 | | | | 1 | | | Not applicable | |
| Class R-5 | | | Not applicable | | | | 2 | | | | 1 | | | Not applicable | |
| Class R-6 | | | Not applicable | | | | 6 | | | | 1,639 | | | Not applicable | |
| Total class-specific expenses | | | $2,334 | | | | $1,334 | | | | $2,062 | | | $22 | |
| * | Amount less than one thousand. |
Trustees’ deferred compensation — Trustees who are unaffiliated with CRMC may elect to defer the cash payment of part or all of their compensation. These deferred amounts, which remain as liabilities of the fund, are treated as if invested in shares of the fund or other American Funds. These amounts represent general, unsecured liabilities of the fund and vary according to the total returns of the selected funds. Trustees’ compensation of $32,000 in the fund’s statement of operations reflects $29,000 in current fees (either paid in cash or deferred) and a net increase of $3,000 in the value of the deferred amounts.
Affiliated officers and trustees — Officers and certain trustees of the fund are or may be considered to be affiliated with CRMC, AFD and AFS. No affiliated officers or trustees received any compensation directly from the fund.
Investment in CCF — The fund holds shares of CCF, an institutional prime money market fund managed by CRMC. CCF invests in high-quality, short-term money market instruments. CCF is used as the primary investment vehicle for the fund’s short-term investments. CCF shares are only available for purchase by CRMC, its affiliates, and other funds managed by CRMC and are not available to the public. CRMC does not receive an investment advisory services fee from CCF.
Security transactions with related funds — The fund may purchase securities from, or sell securities to, other funds managed by CRMC (or funds managed by certain affiliates of CRMC) under procedures adopted by the fund’s board of trustees. The funds involved in such transactions are considered related by virtue of having a common investment adviser (or affiliated investment advisers), common trustees and/or common officers. When such transactions occur, each transaction is executed at the current market price of the security and no brokerage commissions or fees are paid in accordance with Rule 17a-7 of the 1940 Act.
Interfund lending — Pursuant to an exemptive order issued by the SEC, the fund, along with other CRMC-managed funds (or funds managed by certain affiliates of CRMC), may participate in an interfund lending program. The program provides an alternate credit facility that permits the funds to lend or borrow cash for temporary purposes directly to or from one another, subject to the conditions of the exemptive order. The fund did not lend or borrow cash through the interfund lending program at any time during the year ended November 30, 2019.
| American Funds Inflation Linked Bond Fund | 23 |
8. Capital share transactions
Capital share transactions in the fund were as follows (dollars and shares in thousands):
| | | Sales* | | | Reinvestments of
distributions | | | Repurchases* | | | Net (decrease)
increase | |
| Share class | | Amount | | | Shares | | | Amount | | | Shares | | | Amount | | | Shares | | | Amount | | | Shares | |
| | | | | | | | | | | | | | | | | | | | | | | | | | |
| Year ended November 30, 2019 | | | | | | | | | | | | | | | | | | | | | | | | | |
| | | | | | | | | | | | | | | | | | | | | | | | | | | | | | | | | |
| Class A | | $ | 138,414 | | | | 14,325 | | | $ | 16,421 | | | | 1,760 | | | $ | (157,519 | ) | | | (16,351 | ) | | $ | (2,684 | ) | | | (266 | ) |
| Class C | | | 2,284 | | | | 239 | | | | 239 | | | | 25 | | | | (5,684 | ) | | | (595 | ) | | | (3,161 | ) | | | (331 | ) |
| Class T | | | — | | | | — | | | | — | | | | — | | | | — | | | | — | | | | — | | | | — | |
| Class F-1 | | | 12,407 | | | | 1,290 | | | | 973 | | | | 104 | | | | (20,444 | ) | | | (2,124 | ) | | | (7,064 | ) | | | (730 | ) |
| Class F-2 | | | 188,597 | | | | 19,470 | | | | 14,910 | | | | 1,595 | | | | (310,407 | ) | | | (32,215 | ) | | | (106,900 | ) | | | (11,150 | ) |
| Class F-3 | | | 117,814 | | | | 12,178 | | | | 3,790 | | | | 406 | | | | (57,341 | ) | | | (5,933 | ) | | | 64,263 | | | | 6,651 | |
| Class 529-A | | | 7,527 | | | | 777 | | | | 617 | | | | 66 | | | | (6,703 | ) | | | (692 | ) | | | 1,441 | | | | 151 | |
| Class 529-C | | | 997 | | | | 104 | | | | 49 | | | | 5 | | | | (1,384 | ) | | | (144 | ) | | | (338 | ) | | | (35 | ) |
| Class 529-E | | | 522 | | | | 54 | | | | 18 | | | | 2 | | | | (234 | ) | | | (25 | ) | | | 306 | | | | 31 | |
| Class 529-T | | | — | | | | — | | | | — | † | | | — | † | | | — | | | | — | | | | — | † | | | — | † |
| Class 529-F-1 | | | 1,813 | | | | 189 | | | | 157 | | | | 17 | | | | (2,607 | ) | | | (271 | ) | | | (637 | ) | | | (65 | ) |
| Class R-1 | | | 247 | | | | 26 | | | | 8 | | | | 1 | | | | (306 | ) | | | (32 | ) | | | (51 | ) | | | (5 | ) |
| Class R-2 | | | 2,848 | | | | 299 | | | | 80 | | | | 8 | | | | (1,492 | ) | | | (156 | ) | | | 1,436 | | | | 151 | |
| Class R-2E | | | 1,297 | | | | 134 | | | | 17 | | | | 2 | | | | (559 | ) | | | (58 | ) | | | 755 | | | | 78 | |
| Class R-3 | | | 6,063 | | | | 629 | | | | 144 | | | | 16 | | | | (2,704 | ) | | | (280 | ) | | | 3,503 | | | | 365 | |
| Class R-4 | | | 5,874 | | | | 606 | | | | 133 | | | | 14 | | | | (2,841 | ) | | | (293 | ) | | | 3,166 | | | | 327 | |
| Class R-5E | | | 2,180 | | | | 224 | | | | 64 | | | | 7 | | | | (807 | ) | | | (85 | ) | | | 1,437 | | | | 146 | |
| Class R-5 | | | 1,274 | | | | 130 | | | | 71 | | | | 8 | | | | (854 | ) | | | (89 | ) | | | 491 | | | | 49 | |
| Class R-6 | | | 1,148,622 | | | | 117,907 | | | | 100,974 | | | | 10,788 | | | | (130,443 | ) | | | (13,354 | ) | | | 1,119,153 | | | | 115,341 | |
| Total net increase (decrease) | | $ | 1,638,780 | | | | 168,581 | | | $ | 138,665 | | | | 14,824 | | | $ | (702,329 | ) | | | (72,697 | ) | | $ | 1,075,116 | | | | 110,708 | |
| | | | | | | | | | | | | | | | | | | | | | | | | | | | | | | | | |
| Year ended November 30, 2018 | | | | | | | | | | | | | | | | | | | | | | |
| | | | | | | | | | | | | | | | | | | | | | | | | | | | | | | | | |
| Class A | | $ | 268,881 | | | | 28,060 | | | $ | 8,106 | | | | 843 | | | $ | (161,346 | ) | | | (16,894 | ) | | $ | 115,641 | | | | 12,009 | |
| Class C | | | 8,043 | | | | 849 | | | | 107 | | | | 11 | | | | (8,334 | ) | | | (882 | ) | | | (184 | ) | | | (22 | ) |
| Class T | | | — | | | | — | | | | — | | | | — | | | | — | | | | — | | | | — | | | | — | |
| Class F-1 | | | 17,613 | | | | 1,833 | | | | 785 | | | | 82 | | | | (27,493 | ) | | | (2,876 | ) | | | (9,095 | ) | | | (961 | ) |
| Class F-2 | | | 303,775 | | | | 31,607 | | | | 6,103 | | | | 633 | | | | (122,482 | ) | | | (12,764 | ) | | | 187,396 | | | | 19,476 | |
| Class F-3 | | | 67,659 | | | | 7,049 | | | | 1,750 | | | | 182 | | | | (32,443 | ) | | | (3,387 | ) | | | 36,966 | | | | 3,844 | |
| Class 529-A | | | 13,592 | | | | 1,417 | | | | 256 | | | | 27 | | | | (5,745 | ) | | | (598 | ) | | | 8,103 | | | | 846 | |
| Class 529-C | | | 1,434 | | | | 151 | | | | 7 | | | | 1 | | | | (1,726 | ) | | | (180 | ) | | | (285 | ) | | | (28 | ) |
| Class 529-E | | | 359 | | | | 37 | | | | 9 | | | | 1 | | | | (192 | ) | | | (20 | ) | | | 176 | | | | 18 | |
| Class 529-T | | | — | | | | — | | | | — | † | | | — | † | | | — | | | | — | | | | — | † | | | — | † |
| Class 529-F-1 | | | 3,697 | | | | 385 | | | | 39 | | | | 4 | | | | (668 | ) | | | (69 | ) | | | 3,068 | | | | 320 | |
| Class R-1 | | | 307 | | | | 32 | | | | 1 | | | | — | † | | | (94 | ) | | | (10 | ) | | | 214 | | | | 22 | |
| Class R-2 | | | 2,338 | | | | 247 | | | | 18 | | | | 2 | | | | (888 | ) | | | (93 | ) | | | 1,468 | | | | 156 | |
| Class R-2E | | | 138 | | | | 15 | | | | 9 | | | | 1 | | | | (116 | ) | | | (12 | ) | | | 31 | | | | 4 | |
| Class R-3 | | | 3,711 | | | | 389 | | | | 46 | | | | 5 | | | | (1,379 | ) | | | (145 | ) | | | 2,378 | | | | 249 | |
| Class R-4 | | | 2,687 | | | | 281 | | | | 53 | | | | 5 | | | | (954 | ) | | | (100 | ) | | | 1,786 | | | | 186 | |
| Class R-5E | | | 1,460 | | | | 152 | | | | 23 | | | | 2 | | | | (428 | ) | | | (44 | ) | | | 1,055 | | | | 110 | |
| Class R-5 | | | 2,001 | | | | 208 | | | | 25 | | | | 3 | | | | (574 | ) | | | (60 | ) | | | 1,452 | | | | 151 | |
| Class R-6 | | | 858,557 | | | | 88,875 | | | | 49,220 | | | | 5,106 | | | | (119,122 | ) | | | (12,405 | ) | | | 788,655 | | | | 81,576 | |
| Total net increase (decrease) | | $ | 1,556,252 | | | | 161,587 | | | $ | 66,557 | | | | 6,908 | | | $ | (483,984 | ) | | | (50,539 | ) | | $ | 1,138,825 | | | | 117,956 | |
| * | Includes exchanges between share classes of the fund. |
| † | Amount less than one thousand. |
| 24 | American Funds Inflation Linked Bond Fund |
9. Investment transactions
The fund made purchases and sales of investment securities, excluding short-term securities and U.S. government obligations, if any, of $302,904,000 and $220,159,000, respectively, during the year ended November 30, 2019.
10. Ownership concentration
At November 30, 2019, three shareholders held more than 10% of the fund’s outstanding shares. The three shareholders were American Funds 2020 Target Date Retirement Fund, American Funds 2025 Target Date Retirement Fund and American Funds 2030 Target Date Retirement Fund, with aggregate ownership of the fund’s outstanding shares of 19%, 19% and 17%, respectively. CRMC is the investment adviser to the three target date funds.
| American Funds Inflation Linked Bond Fund | 25 |
Financial highlights
| | | | | | Income (loss) from
investment operations1 | | | Dividends and distributions | | | | | | | | | | | | | | | | | | | |
| Period ended | | Net asset
value,
beginning
of period | | | Net
investment
income
(loss) | | | Net gains
(losses) on
securities
(both
realized and
unrealized) | | | Total from
investment
operations | | | Dividends
(from net
investment
income) | | | Distributions
(from capital
gains) | | | Total
dividends
and
distributions | | | Net asset
value,
end
of period | | | Total
return2,3 | | | Net assets,
end of period
(in millions) | | | Ratio of
expenses to
average net
assets before
waivers/
reimburse-
ments4 | | | Ratio of
expenses to
average net
assets after
waivers/
reimburse-
ments3,4 | | | Ratio of
net income
(loss)
to average
net assets3 | |
| Class A: | | | | | | | | | | | | | | | | | | | | | | | | | | | | | | | | | | | | | | | | | | | | | | | | | | | | |
| 11/30/2019 | | $ | 9.54 | | | $ | .16 | | | $ | .44 | | | $ | .60 | | | $ | (.21 | ) | | $ | (.04 | ) | | $ | (.25 | ) | | $ | 9.89 | | | | 6.43 | % | | $ | 656 | | | | .72 | % | | | .72 | % | | | 1.61 | % |
| 11/30/2018 | | | 9.77 | | | | .22 | | | | (.31 | ) | | | (.09 | ) | | | (.11 | ) | | | (.03 | ) | | | (.14 | ) | | | 9.54 | | | | (.86 | ) | | | 635 | | | | .71 | | | | .71 | | | | 2.25 | |
| 11/30/2017 | | | 9.70 | | | | .19 | | | | (.03 | ) | | | .16 | | | | (.09 | ) | | | — | | | | (.09 | ) | | | 9.77 | | | | 1.64 | | | | 533 | | | | .73 | | | | .73 | | | | 1.96 | |
| 11/30/2016 | | | 9.45 | | | | .13 | | | | .24 | | | | .37 | | | | (.04 | ) | | | (.08 | ) | | | (.12 | ) | | | 9.70 | | | | 3.94 | | | | 267 | | | | .75 | | | | .74 | | | | 1.31 | |
| 11/30/2015 | | | 9.70 | | | | .09 | | | | (.21 | ) | | | (.12 | ) | | | (.08 | ) | | | (.05 | ) | | | (.13 | ) | | | 9.45 | | | | (1.25 | ) | | | 89 | | | | .80 | | | | .79 | | | | .99 | |
| Class C: | | | | | | | | | | | | | | | | | | | | | | | | | | | | | | | | | | | | | | | | | | | | | | | | | | | | |
| 11/30/2019 | | | 9.42 | | | | .08 | | | | .45 | | | | .53 | | | | (.13 | ) | | | (.04 | ) | | | (.17 | ) | | | 9.78 | | | | 5.67 | | | | 11 | | | | 1.44 | | | | 1.44 | | | | .82 | |
| 11/30/2018 | | | 9.64 | | | | .14 | | | | (.29 | ) | | | (.15 | ) | | | (.04 | ) | | | (.03 | ) | | | (.07 | ) | | | 9.42 | | | | (1.55 | ) | | | 14 | | | | 1.45 | | | | 1.45 | | | | 1.49 | |
| 11/30/2017 | | | 9.60 | | | | .11 | | | | (.02 | ) | | | .09 | | | | (.05 | ) | | | — | | | | (.05 | ) | | | 9.64 | | | | .90 | | | | 15 | | | | 1.48 | | | | 1.48 | | | | 1.19 | |
| 11/30/2016 | | | 9.39 | | | | .06 | | | | .24 | | | | .30 | | | | (.01 | ) | | | (.08 | ) | | | (.09 | ) | | | 9.60 | | | | 3.15 | | | | 10 | | | | 1.49 | | | | 1.48 | | | | .60 | |
| 11/30/20155,6 | | | 9.67 | | | | .03 | | | | (.31 | ) | | | (.28 | ) | | | — | | | | — | | | | — | | | | 9.39 | | | | (2.90 | )7 | | | 3 | | | | 1.55 | 8 | | | 1.54 | 8 | | | .34 | 8 |
| Class T: | | | | | | | | | | | | | | | | | | | | | | | | | | | | | | | | | | | | | | | | | | | | | | | | | | | | |
| 11/30/2019 | | | 9.55 | | | | .18 | | | | .44 | | | | .62 | | | | (.23 | ) | | | (.04 | ) | | | (.27 | ) | | | 9.90 | | | | 6.81 | 9 | | | — | 10 | | | .44 | 9 | | | .44 | 9 | | | 1.90 | 9 |
| 11/30/2018 | | | 9.78 | | | | .24 | | | | (.30 | ) | | | (.06 | ) | | | (.14 | ) | | | (.03 | ) | | | (.17 | ) | | | 9.55 | | | | (.63 | )9 | | | — | 10 | | | .47 | 9 | | | .47 | 9 | | | 2.46 | 9 |
| 11/30/20175,11 | | | 9.70 | | | | .15 | | | | (.07 | ) | | | .08 | | | | — | | | | — | | | | — | | | | 9.78 | | | | .82 | 7,9 | | | — | 10 | | | .46 | 8,9 | | | .46 | 8,9 | | | 2.29 | 8,9 |
| Class F-1: | | | | | | | | | | | | | | | | | | | | | | | | | | | | | | | | | | | | | | | | | | | | | | | | | | | | |
| 11/30/2019 | | | 9.53 | | | | .16 | | | | .44 | | | | .60 | | | | (.20 | ) | | | (.04 | ) | | | (.24 | ) | | | 9.89 | | | | 6.54 | | | | 33 | | | | .72 | | | | .72 | | | | 1.60 | |
| 11/30/2018 | | | 9.76 | | | | .21 | | | | (.29 | ) | | | (.08 | ) | | | (.12 | ) | | | (.03 | ) | | | (.15 | ) | | | 9.53 | | | | (.85 | ) | | | 39 | | | | .73 | | | | .73 | | | | 2.17 | |
| 11/30/2017 | | | 9.70 | | | | .19 | | | | (.04 | ) | | | .15 | | | | (.09 | ) | | | — | | | | (.09 | ) | | | 9.76 | | | | 1.57 | | | | 49 | | | | .75 | | | | .75 | | | | 1.95 | |
| 11/30/2016 | | | 9.45 | | | | .18 | | | | .19 | | | | .37 | | | | (.04 | ) | | | (.08 | ) | | | (.12 | ) | | | 9.70 | | | | 3.93 | | | | 29 | | | | .70 | | | | .70 | | | | 1.82 | |
| 11/30/20155,6 | | | 9.67 | | | | .02 | | | | (.24 | ) | | | (.22 | ) | | | — | | | | — | | | | — | | | | 9.45 | | | | (2.27 | )7 | | | 2 | | | | .81 | 8 | | | .81 | 8 | | | .29 | 8 |
| Class F-2: | | | | | | | | | | | | | | | | | | | | | | | | | | | | | | | | | | | | | | | | | | | | | | | | | | | | |
| 11/30/2019 | | | 9.59 | | | | .17 | | | | .46 | | | | .63 | | | | (.24 | ) | | | (.04 | ) | | | (.28 | ) | | | 9.94 | | | | 6.81 | | | | 426 | | | | .44 | | | | .44 | | | | 1.75 | |
| 11/30/2018 | | | 9.81 | | | | .25 | | | | (.30 | ) | | | (.05 | ) | | | (.14 | ) | | | (.03 | ) | | | (.17 | ) | | | 9.59 | | | | (.54 | ) | | | 518 | | | | .46 | | | | .46 | | | | 2.55 | |
| 11/30/2017 | | | 9.73 | | | | .22 | | | | (.04 | ) | | | .18 | | | | (.10 | ) | | | — | | | | (.10 | ) | | | 9.81 | | | | 1.88 | | | | 339 | | | | .49 | | | | .49 | | | | 2.21 | |
| 11/30/2016 | | | 9.47 | | | | .18 | | | | .21 | | | | .39 | | | | (.05 | ) | | | (.08 | ) | | | (.13 | ) | | | 9.73 | | | | 4.16 | | | | 207 | | | | .46 | | | | .46 | | | | 1.86 | |
| 11/30/20155,6 | | | 9.67 | | | | .18 | | | | (.38 | ) | | | (.20 | ) | | | — | | | | — | | | | — | | | | 9.47 | | | | (2.07 | )7 | | | 18 | | | | .55 | 8 | | | .55 | 8 | | | 2.18 | 8 |
| Class F-3: | | | | | | | | | | | | | | | | | | | | | | | | | | | | | | | | | | | | | | | | | | | | | | | | | | | | |
| 11/30/2019 | | | 9.57 | | | | .20 | | | | .44 | | | | .64 | | | | (.24 | ) | | | (.04 | ) | | | (.28 | ) | | | 9.93 | | | | 6.89 | | | | 204 | | | | .36 | | | | .34 | | | | 2.08 | |
| 11/30/2018 | | | 9.80 | | | | .25 | | | | (.31 | ) | | | (.06 | ) | | | (.14 | ) | | | (.03 | ) | | | (.17 | ) | | | 9.57 | | | | (.56 | ) | | | 133 | | | | .39 | | | | .39 | | | | 2.57 | |
| 11/30/20175,12 | | | 9.66 | | | | .20 | | | | (.06 | ) | | | .14 | | | | — | | | | — | | | | — | | | | 9.80 | | | | 1.45 | 7 | | | 99 | | | | .38 | 8 | | | .38 | 8 | | | 2.45 | 8 |
| Class 529-A: | | | | | | | | | | | | | | | | | | | | | | | | | | | | | | | | | | | | | | | | | | | | | | | | | | | | |
| 11/30/2019 | | | 9.54 | | | | .16 | | | | .44 | | | | .60 | | | | (.21 | ) | | | (.04 | ) | | | (.25 | ) | | | 9.89 | | | | 6.57 | | | | 26 | | | | .72 | | | | .72 | | | | 1.65 | |
| 11/30/2018 | | | 9.77 | | | | .22 | | | | (.30 | ) | | | (.08 | ) | | | (.12 | ) | | | (.03 | ) | | | (.15 | ) | | | 9.54 | | | | (.84 | ) | | | 24 | | | | .71 | | | | .71 | | | | 2.30 | |
| 11/30/2017 | | | 9.71 | | | | .19 | | | | (.04 | ) | | | .15 | | | | (.09 | ) | | | — | | | | (.09 | ) | | | 9.77 | | | | 1.58 | | | | 16 | | | | .72 | | | | .72 | | | | 1.97 | |
| 11/30/2016 | | | 9.45 | | | | .14 | | | | .25 | | | | .39 | | | | (.05 | ) | | | (.08 | ) | | | (.13 | ) | | | 9.71 | | | | 4.10 | | | | 8 | | | | .65 | | | | .64 | | | | 1.44 | |
| 11/30/20155,6 | | | 9.67 | | | | .08 | | | | (.30 | ) | | | (.22 | ) | | | — | | | | — | | | | — | | | | 9.45 | | | | (2.27 | )7 | | | 3 | | | | .74 | 8 | | | .73 | 8 | | | .97 | 8 |
| 26 | American Funds Inflation Linked Bond Fund |
| | | | | | Income (loss) from
investment operations1 | | | Dividends and distributions | | | | | | | | | | | | | | | | | | | |
| Period ended | | Net asset
value,
beginning
of period | | | Net
investment
income
(loss) | | | Net gains
(losses) on
securities
(both
realized and
unrealized) | | | Total from
investment
operations | | | Dividends
(from net
investment
income) | | | Distributions
(from capital
gains) | | | Total
dividends
and
distributions | | | Net asset
value,
end
of period | | | Total
return2,3 | | | Net assets,
end of period
(in millions) | | | Ratio of
expenses to
average net
assets before
waivers/
reimburse-
ments4 | | | Ratio of
expenses to
average net
assets after
waivers/
reimburse-
ments3,4 | | | Ratio of
net income
(loss)
to average
net assets3 | |
| Class 529-C: | | | | | | | | | | | | | | | | | | | | | | | | | | | | | | | | | | | | | | | | | | | | | | | | | | | | |
| 11/30/2019 | | $ | 9.43 | | | $ | .09 | | | $ | .45 | | | $ | .54 | | | $ | (.14 | ) | | $ | (.04 | ) | | $ | (.18 | ) | | $ | 9.79 | | | | 5.87 | % | | $ | 3 | | | | 1.39 | % | | | 1.39 | % | | | .93 | % |
| 11/30/2018 | | | 9.62 | | | | .14 | | | | (.30 | ) | | | (.16 | ) | | | — | | | | (.03 | ) | | | (.03 | ) | | | 9.43 | | | | (1.64 | ) | | | 3 | | | | 1.51 | | | | 1.51 | | | | 1.43 | |
| 11/30/2017 | | | 9.60 | | | | .11 | | | | (.04 | ) | | | .07 | | | | (.05 | ) | | | — | | | | (.05 | ) | | | 9.62 | | | | .79 | | | | 3 | | | | 1.54 | | | | 1.54 | | | | 1.13 | |
| 11/30/2016 | | | 9.39 | | | | .05 | | | | .24 | | | | .29 | | | | — | | | | (.08 | ) | | | (.08 | ) | | | 9.60 | | | | 3.09 | | | | 2 | | | | 1.53 | | | | 1.53 | | | | .48 | |
| 11/30/20155,6 | | | 9.67 | | | | .03 | | | | (.31 | ) | | | (.28 | ) | | | — | | | | — | | | | — | | | | 9.39 | | | | (2.90 | )7 | | | 1 | | | | 1.62 | 8 | | | 1.60 | 8 | | | .35 | 8 |
| Class 529-E: | | | | | | | | | | | | | | | | | | | | | | | | | | | | | | | | | | | | | | | | | | | | | | | | | | | | |
| 11/30/2019 | | | 9.49 | | | | .14 | | | | .43 | | | | .57 | | | | (.18 | ) | | | (.04 | ) | | | (.22 | ) | | | 9.84 | | | | 6.29 | | | | 1 | | | | .93 | | | | .93 | | | | 1.44 | |
| 11/30/2018 | | | 9.73 | | | | .19 | | | | (.30 | ) | | | (.11 | ) | | | (.10 | ) | | | (.03 | ) | | | (.13 | ) | | | 9.49 | | | | (1.08 | ) | | | 1 | | | | .96 | | | | .96 | | | | 2.02 | |
| 11/30/2017 | | | 9.68 | | | | .17 | | | | (.04 | ) | | | .13 | | | | (.08 | ) | | | — | | | | (.08 | ) | | | 9.73 | | | | 1.35 | | | | 1 | | | | .99 | | | | .99 | | | | 1.73 | |
| 11/30/2016 | | | 9.43 | | | | .07 | | | | .28 | | | | .35 | | | | (.02 | ) | | | (.08 | ) | | | (.10 | ) | | | 9.68 | | | | 3.75 | | | | — | 10 | | | .97 | | | | .97 | | | | .77 | |
| 11/30/20155,6 | | | 9.67 | | | | .09 | | | | (.33 | ) | | | (.24 | ) | | | — | | | | — | | | | — | | | | 9.43 | | | | (2.48 | )7 | | | — | 10 | | | 1.04 | 8 | | | 1.03 | 8 | | | 1.10 | 8 |
| Class 529-T: | | | | | | | | | | | | | | | | | | | | | | | | | | | | | | | | | | | | | | | | | | | | | | | | | | | | |
| 11/30/2019 | | | 9.55 | | | | .18 | | | | .44 | | | | .62 | | | | (.23 | ) | | | (.04 | ) | | | (.27 | ) | | | 9.90 | | | | 6.64 | 9 | | | — | 10 | | | .50 | 9 | | | .50 | 9 | | | 1.84 | 9 |
| 11/30/2018 | | | 9.78 | | | | .23 | | | | (.30 | ) | | | (.07 | ) | | | (.13 | ) | | | (.03 | ) | | | (.16 | ) | | | 9.55 | | | | (.65 | )9 | | | — | 10 | | | .52 | 9 | | | .52 | 9 | | | 2.42 | 9 |
| 11/30/20175,11 | | | 9.70 | | | | .14 | | | | (.06 | ) | | | .08 | | | | — | | | | — | | | | — | | | | 9.78 | | | | .82 | 7,9 | | | — | 10 | | | .50 | 8,9 | | | .50 | 8,9 | | | 2.25 | 8,9 |
| Class 529-F-1: | | | | | | | | | | | | | | | | | | | | | | | | | | | | | | | | | | | | | | | | | | | | | | | | | | | | |
| 11/30/2019 | | | 9.57 | | | | .17 | | | | .45 | | | | .62 | | | | (.23 | ) | | | (.04 | ) | | | (.27 | ) | | | 9.92 | | | | 6.81 | | | | 5 | | | | .50 | | | | .50 | | | | 1.78 | |
| 11/30/2018 | | | 9.80 | | | | .24 | | | | (.31 | ) | | | (.07 | ) | | | (.13 | ) | | | (.03 | ) | | | (.16 | ) | | | 9.57 | | | | (.68 | ) | | | 5 | | | | .50 | | | | .50 | | | | 2.50 | |
| 11/30/2017 | | | 9.73 | | | | .21 | | | | (.05 | ) | | | .16 | | | | (.09 | ) | | | — | | | | (.09 | ) | | | 9.80 | | | | 1.72 | | | | 2 | | | | .53 | | | | .53 | | | | 2.20 | |
| 11/30/2016 | | | 9.47 | | | | .14 | | | | .24 | | | | .38 | | | | (.04 | ) | | | (.08 | ) | | | (.12 | ) | | | 9.73 | | | | 4.09 | | | | 1 | | | | .55 | | | | .55 | | | | 1.46 | |
| 11/30/20155,6 | | | 9.67 | | | | .10 | | | | (.30 | ) | | | (.20 | ) | | | — | | | | — | | | | — | | | | 9.47 | | | | (2.07 | )7 | | | — | 10 | | | .64 | 8 | | | .63 | 8 | | | 1.27 | 8 |
| Class R-1: | | | | | | | | | | | | | | | | | | | | | | | | | | | | | | | | | | | | | | | | | | | | | | | | | | | | |
| 11/30/2019 | | | 9.46 | | | | .07 | | | | .46 | | | | .53 | | | | (.15 | ) | | | (.04 | ) | | | (.19 | ) | | | 9.80 | | | | 5.73 | | | | — | 10 | | | 1.46 | | | | 1.46 | | | | .77 | |
| 11/30/2018 | | | 9.70 | | | | .14 | | | | (.30 | ) | | | (.16 | ) | | | (.05 | ) | | | (.03 | ) | | | (.08 | ) | | | 9.46 | | | | (1.62 | ) | | | — | 10 | | | 1.47 | | | | 1.47 | | | | 1.49 | |
| 11/30/2017 | | | 9.63 | | | | .10 | | | | (.02 | ) | | | .08 | | | | (.01 | ) | | | — | | | | (.01 | ) | | | 9.70 | | | | .83 | 9 | | | — | 10 | | | 1.55 | 9 | | | 1.54 | 9 | | | 1.07 | 9 |
| 11/30/2016 | | | 9.42 | | | | .04 | | | | .25 | | | | .29 | | | | — | | | | (.08 | ) | | | (.08 | ) | | | 9.63 | | | | 3.08 | 9 | | | — | 10 | | | 1.50 | 9 | | | 1.49 | 9 | | | .39 | 9 |
| 11/30/20155,6 | | | 9.67 | | | | .07 | | | | (.32 | ) | | | (.25 | ) | | | — | | | | — | | | | — | | | | 9.42 | | | | (2.58 | )7,9 | | | — | 10 | | | 1.41 | 8,9 | | | 1.41 | 8,9 | | | .86 | 8,9 |
| Class R-2: | | | | | | | | | | | | | | | | | | | | | | | | | | | | | | | | | | | | | | | | | | | | | | | | | | | | |
| 11/30/2019 | | | 9.39 | | | | .08 | | | | .45 | | | | .53 | | | | (.16 | ) | | | (.04 | ) | | | (.20 | ) | | | 9.72 | | | | 5.73 | | | | 5 | | | | 1.44 | | | | 1.44 | | | | .88 | |
| 11/30/2018 | | | 9.62 | | | | .15 | | | | (.30 | ) | | | (.15 | ) | | | (.05 | ) | | | (.03 | ) | | | (.08 | ) | | | 9.39 | | | | (1.54 | ) | | | 4 | | | | 1.41 | | | | 1.41 | | | | 1.57 | |
| 11/30/2017 | | | 9.59 | | | | .12 | | | | (.03 | ) | | | .09 | | | | (.06 | ) | | | — | | | | (.06 | ) | | | 9.62 | | | | .90 | | | | 2 | | | | 1.41 | | | | 1.41 | | | | 1.28 | |
| 11/30/2016 | | | 9.41 | | | | .06 | | | | .23 | | | | .29 | | | | (.03 | ) | | | (.08 | ) | | | (.11 | ) | | | 9.59 | | | | 3.12 | | | | 1 | | | | 1.49 | | | | 1.49 | | | | .62 | |
| 11/30/20155,6 | | | 9.67 | | | | (.04 | ) | | | (.22 | ) | | | (.26 | ) | | | — | | | | — | | | | — | | | | 9.41 | | | | (2.69 | )7,9 | | | — | 10 | | | 1.59 | 8,9 | | | 1.58 | 8,9 | | | (.51 | )8,9 |
| Class R-2E: | | | | | | | | | | | | | | | | | | | | | | | | | | | | | | | | | | | | | | | | | | | | | | | | | | | | |
| 11/30/2019 | | | 9.50 | | | | .15 | | | | .40 | | | | .55 | | | | (.16 | ) | | | (.04 | ) | | | (.20 | ) | | | 9.85 | | | | 6.03 | | | | 2 | | | | 1.15 | | | | 1.15 | | | | 1.55 | |
| 11/30/2018 | | | 9.73 | | | | .17 | | | | (.29 | ) | | | (.12 | ) | | | (.08 | ) | | | (.03 | ) | | | (.11 | ) | | | 9.50 | | | | (1.27 | ) | | | 1 | | | | 1.18 | | | | 1.18 | | | | 1.74 | |
| 11/30/2017 | | | 9.71 | | | | .14 | | | | (.03 | ) | | | .11 | | | | (.09 | ) | | | — | | | | (.09 | ) | | | 9.73 | | | | 1.16 | | | | 1 | | | | 1.21 | | | | 1.21 | | | | 1.40 | |
| 11/30/2016 | | | 9.46 | | | | .17 | | | | .19 | | | | .36 | | | | (.03 | ) | | | (.08 | ) | | | (.11 | ) | | | 9.71 | | | | 3.88 | | | | 1 | | | | .95 | | | | .94 | | | | 1.79 | |
| 11/30/20155,6 | | | 9.67 | | | | .04 | | | | (.25 | ) | | | (.21 | ) | | | — | | | | — | | | | — | | | | 9.46 | | | | (2.17 | )7,9 | | | — | 10 | | | .74 | 8,9 | | | .72 | 8,9 | | | .51 | 8,9 |
| | | | | | | | | | | | | | | | | | | | | | | | | | | | | | | | | | | | | | | | | | | | | | | | | | | | | |
See end of table for footnotes.
| American Funds Inflation Linked Bond Fund | 27 |
Financial highlights (continued)
| | | | | | Income (loss) from
investment operations1 | | | Dividends and distributions | | | | | | | | | | | | | | | | | | | |
| Period ended | | Net asset
value,
beginning
of period | | | Net
investment
income
(loss) | | | Net gains
(losses) on
securities
(both
realized and
unrealized) | | | Total from
investment
operations | | | Dividends
(from net
investment
income) | | | Distributions
(from capital
gains) | | | Total
dividends
and
distributions | | | Net asset
value,
end
of period | | | Total
return2,3 | | | Net assets,
end of period
(in millions) | | | Ratio of
expenses to
average net
assets before
waivers/
reimburse-
ments4 | | | Ratio of
expenses to
average net
assets after
waivers/
reimburse-
ments3,4 | | | Ratio of
net income
(loss)
to average
net assets3 | |
| Class R-3: | | | | | | | | | | | | | | | | | | | | | | | | | | | | | | | | | | | | | | | | | | | | | | | | | | | | |
| 11/30/2019 | | $ | 9.47 | | | $ | .14 | | | $ | .43 | | | $ | .57 | | | $ | (.19 | ) | | $ | (.04 | ) | | $ | (.23 | ) | | $ | 9.81 | | | | 6.22 | % | | $ | 10 | | | | .99 | % | | | .99 | % | | | 1.50 | % |
| 11/30/2018 | | | 9.70 | | | | .19 | | | | (.30 | ) | | | (.11 | ) | | | (.09 | ) | | | (.03 | ) | | | (.12 | ) | | | 9.47 | | | | (1.12 | ) | | | 6 | | | | 1.01 | | | | 1.01 | | | | 2.03 | |
| 11/30/2017 | | | 9.65 | | | | .16 | | | | (.03 | ) | | | .13 | | | | (.08 | ) | | | — | | | | (.08 | ) | | | 9.70 | | | | 1.40 | | | | 4 | | | | .99 | | | | .99 | | | | 1.68 | |
| 11/30/2016 | | | 9.43 | | | | .09 | | | | .25 | | | | .34 | | | | (.04 | ) | | | (.08 | ) | | | (.12 | ) | | | 9.65 | | | | 3.59 | | | | 2 | | | | 1.01 | | | | 1.01 | | | | .92 | |
| 11/30/20155,6 | | | 9.67 | | | | .02 | | | | (.26 | ) | | | (.24 | ) | | | — | | | | — | | | | — | | | | 9.43 | | | | (2.48 | )7 | | | 1 | | | | 1.17 | 8 | | | 1.16 | 8 | | | .20 | 8 |
| Class R-4: | | | | | | | | | | | | | | | | | | | | | | | | | | | | | | | | | | | | | | | | | | | | | | | | | | | | |
| 11/30/2019 | | | 9.54 | | | | .17 | | | | .43 | | | | .60 | | | | (.21 | ) | | | (.04 | ) | | | (.25 | ) | | | 9.89 | | | | 6.49 | | | | 8 | | | | .69 | | | | .69 | | | | 1.79 | |
| 11/30/2018 | | | 9.77 | | | | .22 | | | | (.30 | ) | | | (.08 | ) | | | (.12 | ) | | | (.03 | ) | | | (.15 | ) | | | 9.54 | | | | (.85 | ) | | | 5 | | | | .71 | | | | .71 | | | | 2.34 | |
| 11/30/2017 | | | 9.70 | | | | .19 | | | | (.03 | ) | | | .16 | | | | (.09 | ) | | | — | | | | (.09 | ) | | | 9.77 | | | | 1.64 | | | | 3 | | | | .72 | | | | .72 | | | | 1.98 | |
| 11/30/2016 | | | 9.45 | | | | .13 | | | | .24 | | | | .37 | | | | (.04 | ) | | | (.08 | ) | | | (.12 | ) | | | 9.70 | | | | 3.99 | | | | 2 | | | | .69 | | | | .69 | | | | 1.37 | |
| 11/30/20155,6 | | | 9.67 | | | | .04 | | | | (.26 | ) | | | (.22 | ) | | | — | | | | — | | | | — | | | | 9.45 | | | | (2.27 | )7 | | | — | 10 | | | .79 | 8 | | | .79 | 8 | | | .46 | 8 |
| Class R-5E: | | | | | | | | | | | | | | | | | | | | | | | | | | | | | | | | | | | | | | | | | | | | | | | | | | | | |
| 11/30/2019 | | | 9.57 | | | | .19 | | | | .43 | | | | .62 | | | | (.24 | ) | | | (.04 | ) | | | (.28 | ) | | | 9.91 | | | | 6.72 | | | | 4 | | | | .47 | | | | .47 | | | | 1.91 | |
| 11/30/2018 | | | 9.79 | | | | .22 | | | | (.28 | ) | | | (.06 | ) | | | (.13 | ) | | | (.03 | ) | | | (.16 | ) | | | 9.57 | | | | (.56 | ) | | | 2 | | | | .51 | | | | .51 | | | | 2.26 | |
| 11/30/2017 | | | 9.70 | | | | .20 | | | | (.03 | ) | | | .17 | | | | (.08 | ) | | | — | | | | (.08 | ) | | | 9.79 | | | | 1.78 | | | | 1 | | | | .50 | | | | .50 | | | | 2.08 | |
| 11/30/2016 | | | 9.45 | | | | .12 | | | | .27 | | | | .39 | | | | (.06 | ) | | | (.08 | ) | | | (.14 | ) | | | 9.70 | | | | 4.16 | | | | — | 10 | | | .60 | | | | .60 | | | | 1.21 | |
| 11/30/20155,13 | | | 9.43 | | | | — | 14 | | | .02 | | | | .02 | | | | — | | | | — | | | | — | | | | 9.45 | | | | .21 | 7 | | | — | 10 | | | .02 | 7 | | | .02 | 7 | | | (.03 | )7 |
| Class R-5: | | | | | | | | | | | | | | | | | | | | | | | | | | | | | | | | | | | | | | | | | | | | | | | | | | | | |
| 11/30/2019 | | | 9.59 | | | | .18 | | | | .46 | | | | .64 | | | | (.24 | ) | | | (.04 | ) | | | (.28 | ) | | | 9.95 | | | | 6.86 | | | | 3 | | | | .39 | | | | .39 | | | | 1.88 | |
| 11/30/2018 | | | 9.82 | | | | .24 | | | | (.30 | ) | | | (.06 | ) | | | (.14 | ) | | | (.03 | ) | | | (.17 | ) | | | 9.59 | | | | (.59 | ) | | | 3 | | | | .41 | | | | .41 | | | | 2.50 | |
| 11/30/2017 | | | 9.73 | | | | .24 | | | | (.05 | ) | | | .19 | | | | (.10 | ) | | | — | | | | (.10 | ) | | | 9.82 | | | | 1.95 | | | | 2 | | | | .44 | | | | .44 | | | | 2.43 | |
| 11/30/2016 | | | 9.47 | | | | .14 | | | | .26 | | | | .40 | | | | (.06 | ) | | | (.08 | ) | | | (.14 | ) | | | 9.73 | | | | 4.21 | | | | — | 10 | | | .46 | | | | .46 | | | | 1.45 | |
| 11/30/20155,6 | | | 9.67 | | | | .10 | | | | (.30 | ) | | | (.20 | ) | | | — | | | | — | | | | — | | | | 9.47 | | | | (2.07 | )7 | | | — | 10 | | | .52 | 8 | | | .52 | 8 | | | 1.22 | 8 |
| Class R-6: | | | | | | | | | | | | | | | | | | | | | | | | | | | | | | | | | | | | | | | | | | | | | | | | | | | | |
| 11/30/2019 | | | 9.60 | | | | .20 | | | | .45 | | | | .65 | | | | (.25 | ) | | | (.04 | ) | | | (.29 | ) | | | 9.96 | | | | 6.90 | | | | 4,680 | | | | .33 | | | | .33 | | | | 2.05 | |
| 11/30/2018 | | | 9.82 | | | | .25 | | | | (.30 | ) | | | (.05 | ) | | | (.14 | ) | | | (.03 | ) | | | (.17 | ) | | | 9.60 | | | | (.46 | ) | | | 3,405 | | | | .36 | | | | .36 | | | | 2.60 | |
| 11/30/2017 | | | 9.74 | | | | .22 | | | | (.04 | ) | | | .18 | | | | (.10 | ) | | | — | | | | (.10 | ) | | | 9.82 | | | | 1.89 | | | | 2,682 | | | | .38 | | | | .38 | | | | 2.29 | |
| 11/30/2016 | | | 9.47 | | | | .15 | | | | .26 | | | | .41 | | | | (.06 | ) | | | (.08 | ) | | | (.14 | ) | | | 9.74 | | | | 4.33 | | | | 1,547 | | | | .39 | | | | .39 | | | | 1.53 | |
| 11/30/2015 | | | 9.69 | | | | .03 | | | | (.12 | ) | | | (.09 | ) | | | (.08 | ) | | | (.05 | ) | | | (.13 | ) | | | 9.47 | | | | (.95 | ) | | | 1,072 | | | | .48 | | | | .46 | | | | .36 | |
| | | Year ended November 30, |
| | | 2019 | | 2018 | | 2017 | | 2016 | | 2015 |
| Portfolio turnover rate for all share classes15 | | 78% | | 57% | | 123% | | 295% | | 801% |
| 1 | Based on average shares outstanding. |
| 2 | Total returns exclude any applicable sales charges, including contingent deferred sales charges. |
| 3 | This column reflects the impact, if any, of certain waivers/reimbursements from CRMC and/or the fund’s transfer agent. During the periods shown, CRMC reduced fees for investment advisory services and/or reimbursed a portion of the fund’s transfer agent services fees for certain share classes. In addition, during one of the years shown, the fund’s transfer agent waived a portion of the fund’s transfer agent services fees for Class F-3 shares. |
| 4 | Ratios do not include expenses of any Central Funds. The fund indirectly bears its proportionate share of the expenses of any Central Funds. |
| 5 | Based on operations for a period that is less than a full year. |
| 6 | This share class began investment operations on January 23, 2015. |
| 7 | Not annualized. |
| 8 | Annualized. |
| 9 | All or a significant portion of assets in this class consisted of seed capital invested by CRMC and/or its affiliates. Fees for distribution services are not charged or accrued on these seed capital assets. If such fees were paid by the fund on seed capital assets, fund expenses would have been higher and net income and total return would have been lower. |
| 10 | Amount less than $1 million. |
| 11 | Class T and 529-T shares began investment operations on April 7, 2017. |
| 12 | Class F-3 shares began investment operations on January 27, 2017. |
| 13 | Class R-5E shares began investment operations on November 20, 2015. |
| 14 | Amount less than $.01. |
| 15 | Rates do not include the fund’s portfolio activity with respect to any Central Funds. |
See notes to financial statements.
| 28 | American Funds Inflation Linked Bond Fund |
Report of Independent Registered Public Accounting Firm
To the Board of Trustees and Shareholders of American Funds Inflation Linked Bond Fund
Opinion on the Financial Statements
We have audited the accompanying statement of assets and liabilities, including the investment portfolio, of American Funds Inflation Linked Bond Fund (the “Fund”)as of November 30, 2019, the related statement of operations for the year ended November 30, 2019, the statement of changes in net assets for each of the two years in the period ended November 30, 2019, including the related notes, and the financial highlights for each of the periods indicated therein (collectively referred to as the "financial statements"). In our opinion, the financial statements present fairly, in all material respects, the financial position of the Fund as of November 30, 2019, the results of its operations for the year then ended, the changes in its net assets for each of the two years in the period ended November 30, 2019 and the financial highlights for each of the periods indicated therein in conformity with accounting principles generally accepted in the United States of America.
Basis for Opinion
These financial statements are the responsibility of the Fund’s management. Our responsibility is to express an opinion on the Fund’s financial statements based on our audits. We are a public accounting firm registered with the Public Company Accounting Oversight Board (United States) (PCAOB) and are required to be independent with respect to the Fund in accordance with the U.S. federal securities laws and the applicable rules and regulations of the Securities and Exchange Commission and the PCAOB.
We conducted our audits of these financial statements in accordance with the standards of the PCAOB. Those standards require that we plan and perform the audit to obtain reasonable assurance about whether the financial statements are free of material misstatement, whether due to error or fraud.
Our audits included performing procedures to assess the risks of material misstatement of the financial statements, whether due to error or fraud, and performing procedures that respond to those risks. Such procedures included examining, on a test basis, evidence regarding the amounts and disclosures in the financial statements. Our audits also included evaluating the accounting principles used and significant estimates made by management, as well as evaluating the overall presentation of the financial statements. Our procedures included confirmation of securities owned as of November 30, 2019 by correspondence with the custodian, transfer agent and brokers; when replies were not received from brokers, we performed other auditing procedures. We believe that our audits provide a reasonable basis for our opinion.
/s/ PricewaterhouseCoopers LLP
Los Angeles, California
January 15, 2020
We have served as the auditor of one or more investment companies in The Capital Group Companies Investment Company Complex since 1934.
| American Funds Inflation Linked Bond Fund | 29 |
As a fund shareholder, you incur two types of costs: (1) transaction costs, such as initial sales charges on purchase payments and contingent deferred sales charges on redemptions (loads), and (2) ongoing costs, including management fees, distribution and service (12b-1) fees, and other expenses. This example is intended to help you understand your ongoing costs (in dollars) of investing in the fund so you can compare these costs with the ongoing costs of investing in other mutual funds. The example is based on an investment of $1,000 invested at the beginning of the period and held for the entire six-month period (June 1, 2019, through November 30, 2019).
Actual expenses:
The first line of each share class in the table on the following page provides information about actual account values and actual expenses. You may use the information in this line, together with the amount you invested, to estimate the expenses that you paid over the period. Simply divide your account value by $1,000 (for example, an $8,600 account value divided by $1,000 =8.6), then multiply the result by the number in the first line under the heading titled “Expenses paid during period” to estimate the expenses you paid on your account during this period.
Hypothetical example for comparison purposes:
The second line of each share class in the table on the following page provides information about hypothetical account values and hypothetical expenses based on the actual expense ratio for the share class and an assumed rate of return of 5.00% per year before expenses, which is not the actual return of the share class. The hypothetical account values and expenses may not be used to estimate the actual ending account balance or expenses you paid for the period. You may use this information to compare the ongoing costs of investing in the fund and other funds. To do so, compare this 5.00% hypothetical example with the 5.00% hypothetical examples that appear in the shareholder reports of the other funds.
Notes:
Retirement plan participants may be subject to certain fees charged by the plan sponsor, and Class F-1, F-2, F-3 and 529-F-1 shareholders may be subject to fees charged by financial intermediaries, typically ranging from 0.75% to 1.50% of assets annually depending on services offered. You can estimate the impact of these fees by adding the amount of the fees to the total estimated expenses you paid on your account during the period as calculated above. In addition, your ending account value would be lower by the amount of these fees.
Note that the expenses shown in the table on the following page are meant to highlight your ongoing costs only and do not reflect any transactional costs, such as sales charges (loads). Therefore, the second line of each share class in the table is useful in comparing ongoing costs only and will not help you determine the relative total costs of owning different funds. In addition, if these transactional costs were included, your costs would have been higher.
| 30 | American Funds Inflation Linked Bond Fund |
| | | Beginning
account value
6/1/2019 | | | Ending
account value
11/30/2019 | | | Expenses paid
during period* | | | Annualized
expense ratio | |
| Class A – actual return | | $ | 1,000.00 | | | $ | 1,008.16 | | | $ | 3.62 | | | | .72 | % |
| Class A – assumed 5% return | | | 1,000.00 | | | | 1,021.46 | | | | 3.65 | | | | .72 | |
| Class C – actual return | | | 1,000.00 | | | | 1,005.14 | | | | 7.14 | | | | 1.42 | |
| Class C – assumed 5% return | | | 1,000.00 | | | | 1,017.95 | | | | 7.18 | | | | 1.42 | |
| Class T – actual return | | | 1,000.00 | | | | 1,010.20 | | | | 2.17 | | | | .43 | |
| Class T – assumed 5% return | | | 1,000.00 | | | | 1,022.91 | | | | 2.18 | | | | .43 | |
| Class F-1 – actual return | | | 1,000.00 | | | | 1,009.18 | | | | 3.53 | | | | .70 | |
| Class F-1 – assumed 5% return | | | 1,000.00 | | | | 1,021.56 | | | | 3.55 | | | | .70 | |
| Class F-2 – actual return | | | 1,000.00 | | | | 1,010.15 | | | | 2.12 | | | | .42 | |
| Class F-2 – assumed 5% return | | | 1,000.00 | | | | 1,022.96 | | | | 2.13 | | | | .42 | |
| Class F-3 – actual return | | | 1,000.00 | | | | 1,010.17 | | | | 1.66 | | | | .33 | |
| Class F-3 – assumed 5% return | | | 1,000.00 | | | | 1,023.41 | | | | 1.67 | | | | .33 | |
| Class 529-A – actual return | | | 1,000.00 | | | | 1,009.18 | | | | 3.53 | | | | .70 | |
| Class 529-A – assumed 5% return | | | 1,000.00 | | | | 1,021.56 | | | | 3.55 | | | | .70 | |
| Class 529-C – actual return | | | 1,000.00 | | | | 1,006.16 | | | | 6.79 | | | | 1.35 | |
| Class 529-C – assumed 5% return | | | 1,000.00 | | | | 1,018.30 | | | | 6.83 | | | | 1.35 | |
| Class 529-E – actual return | | | 1,000.00 | | | | 1,008.19 | | | | 4.63 | | | | .92 | |
| Class 529-E – assumed 5% return | | | 1,000.00 | | | | 1,020.46 | | | | 4.66 | | | | .92 | |
| Class 529-T – actual return | | | 1,000.00 | | | | 1,009.18 | | | | 2.42 | | | | .48 | |
| Class 529-T – assumed 5% return | | | 1,000.00 | | | | 1,022.66 | | | | 2.43 | | | | .48 | |
| Class 529-F-1 – actual return | | | 1,000.00 | | | | 1,010.17 | | | | 2.42 | | | | .48 | |
| Class 529-F-1 – assumed 5% return | | | 1,000.00 | | | | 1,022.66 | | | | 2.43 | | | | .48 | |
| Class R-1 – actual return | | | 1,000.00 | | | | 1,005.13 | | | | 7.29 | | | | 1.45 | |
| Class R-1 – assumed 5% return | | | 1,000.00 | | | | 1,017.80 | | | | 7.33 | | | | 1.45 | |
| Class R-2 – actual return | | | 1,000.00 | | | | 1,005.17 | | | | 7.24 | | | | 1.44 | |
| Class R-2 – assumed 5% return | | | 1,000.00 | | | | 1,017.85 | | | | 7.28 | | | | 1.44 | |
| Class R-2E – actual return | | | 1,000.00 | | | | 1,007.15 | | | | 5.84 | | | | 1.16 | |
| Class R-2E – assumed 5% return | | | 1,000.00 | | | | 1,019.25 | | | | 5.87 | | | | 1.16 | |
| Class R-3 – actual return | | | 1,000.00 | | | | 1,007.18 | | | | 4.98 | | | | .99 | |
| Class R-3 – assumed 5% return | | | 1,000.00 | | | | 1,020.10 | | | | 5.01 | | | | .99 | |
| Class R-4 – actual return | | | 1,000.00 | | | | 1,008.16 | | | | 3.42 | | | | .68 | |
| Class R-4 – assumed 5% return | | | 1,000.00 | | | | 1,021.66 | | | | 3.45 | | | | .68 | |
| Class R-5E – actual return | | | 1,000.00 | | | | 1,010.18 | | | | 2.32 | | | | .46 | |
| Class R-5E – assumed 5% return | | | 1,000.00 | | | | 1,022.76 | | | | 2.33 | | | | .46 | |
| Class R-5 – actual return | | | 1,000.00 | | | | 1,010.15 | | | | 1.86 | | | | .37 | |
| Class R-5 – assumed 5% return | | | 1,000.00 | | | | 1,023.21 | | | | 1.88 | | | | .37 | |
| Class R-6 – actual return | | | 1,000.00 | | | | 1,010.14 | | | | 1.61 | | | | .32 | |
| Class R-6 – assumed 5% return | | | 1,000.00 | | | | 1,023.46 | | | | 1.62 | | | | .32 | |
| * | The “expenses paid during period” are equal to the “annualized expense ratio,” multiplied by the average account value over the period, multiplied by the number of days in the period, and divided by 365 (to reflect the one-half year period). |
| American Funds Inflation Linked Bond Fund | 31 |
We are required to advise you of the federal tax status of certain distributions received by shareholders during the fiscal year. The fund hereby designates the following amounts for the fund’s fiscal year ended November 30, 2019:
| U.S. government income that may be exempt from state taxation | | | $67,536,000 |
Individual shareholders should refer to their Form 1099 or other tax information, which was mailed in January 2020, to determine thecalendar year amounts to be included on their 2019 tax returns. Shareholders should consult their tax advisors.
| 32 | American Funds Inflation Linked Bond Fund |
This page intentionally left blank.
| American Funds Inflation Linked Bond Fund | 33 |
Board of trustees and other officers
Independent trustees1
| Name and year of birth | | Year first
elected a
trustee of
the fund2 | | Principal occupation(s) during past five years | | Number of
portfolios in
fund complex
overseen by
trustee | | Other directorships3
held by trustee |
| William H. Baribault, 1945 | | 2012 | | Chairman of the Board and CEO, Oakwood Advisors (private investment and consulting); former CEO and President, Richard Nixon Foundation | | 89 | | General Finance Corporation |
| James G. Ellis, 1947 | | 2012 | | Professor of Marketing and former Dean, Marshall School of Business, University of Southern California | | 99 | | Mercury General Corporation |
| Nariman Farvardin, 1956 | | 2018 | | President, Stevens Institute of Technology | | 86 | | None |
| Mary Davis Holt, 1950 | | 2015-2016
2017 | | Principal, Mary Davis Holt Enterprises, LLC (leadership development consulting); former Partner, Flynn Heath Holt Leadership, LLC (leadership consulting); former COO, Time Life Inc. (1993–2003) | | 86 | | None |
| R. Clark Hooper, 1946 | | 2012 | | Private investor | | 89 | | None |
| Merit E. Janow, 1958 | | 2012 | | Dean and Professor, Columbia University, School of International and Public Affairs | | 88 | | Mastercard Incorporated; Trimble Inc. |
Margaret Spellings, 1957
Chairman of the Board
(Independent and Non-
Executive) | | 2012 | | CEO, Texas 2036; former President, Margaret Spellings & Company(public policy and strategic consulting); former President, The University of North Carolina; former President, George W. Bush Foundation | | 90 | | None |
| Alexandra Trower, 1964 | | 2018 | | Executive Vice President, Global Communications and Corporate Officer, The Estée Lauder Companies | | 85 | | None |
Interested trustees4,5
Name, year of birth and
position with fund | | Year first
elected a
trustee or
officer of
the fund2 | | Principal occupation(s) during past five years and positions
held with affiliated entities or the principal underwriter of
the fund | | Number of
portfolios in
fund complex
overseen by
trustee | | Other directorships3
held by trustee |
| Michael C. Gitlin, 1970 | | 2015 | | Vice Chairman and Director, Capital Research and Management Company; Partner — Capital Fixed Income Investors, Capital Research and Management Company; Director, The Capital Group Companies, Inc.; served as Head of Fixed Income at a large investment management firm prior to joining Capital Research and Management Company in 2015 | | 85 | | None |
| Karl J. Zeile, 1966 | | 2019 | | Partner — Capital Fixed Income Investors, Capital Research and Management Company | | 20 | | None |
The fund’s statement of additional information includes further details about fund trustees and is available without charge upon request by calling American Funds Service Company at (800) 421-4225 or by visiting the Capital Group website at capitalgroup.com. The address for all trustees and officers of the fund is 333 South Hope Street, Los Angeles, CA 90071, Attention: Secretary.
| 34 | American Funds Inflation Linked Bond Fund |
Other officers5
Name, year of birth
and position with fund | | Year first
elected
an officer
of the
fund2 | | Principal occupation(s) during past five years and positions held with affiliated entities
or the principal underwriter of the fund |
Ritchie Tuazon, 1978
President | | 2015 | | Partner — Capital Fixed Income Investors, Capital Research and Management Company |
Kristine M. Nishiyama, 1970
Executive Vice President | | 2012 | | Senior Vice President and Senior Counsel — Fund Business Management Group, Capital Research and Management Company; Chair, Senior Vice President, General Counsel and Director, Capital Bank and Trust Company6 |
David A. Hoag, 1965
Senior Vice President | | 2012 | | Partner — Capital Fixed Income Investors, Capital Bank and Trust Company; Partner — Capital Fixed Income Investors, Capital Research and Management Company |
Steven I. Koszalka, 1964
Secretary | | 2012 | | Vice President — Fund Business Management Group, Capital Research and Management Company |
Brian C. Janssen, 1972
Treasurer | | 2012 | | Vice President — Investment Operations, Capital Research and Management Company |
Jane Y. Chung, 1974
Assistant Secretary | | 2014 | | Associate — Fund Business Management Group, Capital Research and Management Company |
Sandra Chuon, 1972
Assistant Treasurer | | 2019 | | Assistant Vice President — Investment Operations, Capital Research and Management Company |
Gregory F. Niland, 1971
Assistant Treasurer | | 2015 | | Vice President — Investment Operations, Capital Research and Management Company |
| 1 | The term independent trustee refers to a trustee who is not an “interested person” of the fund within the meaning of the Investment Company Act of 1940. |
| 2 | Trustees and officers of the fund serve until their resignation, removal or retirement. |
| 3 | This includes all directorships/trusteeships (other than those in the American Funds or other funds managed by Capital Research and Management Company or its affiliates) that are held by each trustee as a trustee or director of a public company or a registered investment company. |
| 4 | The term interested trustee refers to a trustee who is an “interested person” within the meaning of the Investment Company Act of 1940, on the basis of their affiliation with the fund’s investment adviser, Capital Research and Management Company, or affiliated entities (including the fund’s principal underwriter). |
| 5 | All of the trustees and/or officers listed are officers and/or directors/trustees of one or more of the other funds for which Capital Research and Management Company serves as investment adviser. |
| 6 | Company affiliated with Capital Research and Management Company. |
| American Funds Inflation Linked Bond Fund | 35 |
Office of the fund
6455 Irvine Center Drive
Irvine, CA 92618-4518
Investment adviser
Capital Research and Management Company
333 South Hope Street
Los Angeles, CA 90071-1406
Transfer agent for shareholder accounts
American Funds Service Company
(Write to the address near you.)
P.O. Box 6007
Indianapolis, IN 46206-6007
P.O. Box 2280
Norfolk, VA 23501-2280
Custodian of assets
Bank of New York Mellon
One Wall Street
New York, NY 10286
Counsel
Morgan, Lewis & Bockius LLP
One Federal Street
Boston, MA 02110-1726
Independent registered public accounting firm
PricewaterhouseCoopers LLP
601 South Figueroa Street
Los Angeles, CA 90017-3874
Principal underwriter
American Funds Distributors, Inc.
333 South Hope Street
Los Angeles, CA 90071-1406
| 36 | American Funds Inflation Linked Bond Fund |
Investors should carefully consider investment objectives, risks, charges and expenses. This and other important information is contained in the fund prospectus and summary prospectus, which can be obtained from your financial professional and should be read carefully before investing. You may also call American Funds Service Company (AFS) at (800) 421-4225 or visit the Capital Group website at capitalgroup.com.
“American Funds Proxy Voting Procedures and Principles” — which describes how we vote proxies relating to portfolio securities — is available on our website or upon request by calling AFS. The fund files its proxy voting record with the U.S. Securities and Exchange Commission (SEC) for the 12 months ended June 30 by August 31. The proxy voting record is available free of charge on the SEC website at sec.gov and our website.
American Funds Inflation Linked Bond Fund files a complete list of its portfolio holdings with the SEC for the first and third quarters of each fiscal year on Form NPORT-P. This filing is available free of charge on the SEC website. Additionally, the list of portfolio holdings is available by calling AFS.
This report is for the information of shareholders of American Funds Inflation Linked Bond Fund, but it also may be used as sales literature when preceded or accompanied by the current prospectus or summary prospectus, which gives details about charges, expenses, investment objectives and operating policies of the fund. If used as sales material after March 31, 2020, this report must be accompanied by an American Funds statistical update for the most recently completed calendar quarter.
Bloomberg® is a trademark of Bloomberg Finance L.P. (collectively with its affiliates, “Bloomberg”). Barclays® is a trademark of Barclays Bank Plc (collectively with its affiliates, “Barclays”), used under license. Neither Bloomberg nor Barclays approves or endorses this material, guarantees the accuracy or completeness of any information herein and, to the maximum extent allowed by law, neither shall have any liability or responsibility for injury or damages arising in connection therewith.
American Funds Distributors, Inc., member FINRA.
The Capital Advantage®
Since 1931, Capital Group, home of American Funds, has helped investors pursue long-term investment success. Our consistent approach — in combination with The Capital SystemSM— has resulted in superior outcomes.
| Aligned with investor success |
| | We base our decisions on a long-term perspective, which we believe aligns our goals with the interests of our clients. Our portfolio managers average 27 years of investment experience, including 20 years at our company, reflecting a career commitment to our long-term approach.1 |
| | |
| | The Capital System |
| | The Capital System combines individual accountability with teamwork. Funds using The Capital System are divided into portions that are managed independently by investment professionals with diverse backgrounds, ages and investment approaches. An extensive global research effort is the backbone of our system. |
| | |
| | American Funds’ superior outcomes |
| | Equity funds have beaten their Lipper peer indexes in 92% of 10-year periods and 99% of 20-year periods.2 Fixed income funds have helped investors achieve diversification through attention to correlation between bonds and equities.3 Fund management fees have been among the lowest in the industry.4 |
| | 1 | Portfolio manager experience as of December 31, 2018. |
| | 2 | Based on Class F-2 share results for rolling periods through December 31, 2018. Periods covered are the shorter of the fund’s lifetime or since the comparable Lipper index inception date (except Capital Income Builder and SMALLCAP World Fund, for which the Lipper average was used). Expenses differ for each share class, so results will vary. |
| | 3 | Based on Class F-2 share results, as of December 31, 2018. Fourteen of our 15 American Funds fixed income funds that have been in existence for the three-year period showed a three-year correlation below 0.2. Standard & Poor’s 500 Composite Index was used as an equity market proxy. Correlation based on monthly total returns. Correlation is a statistical measure of how two securities move in relation to each other. A correlation ranges from –1 to 1. A positive correlation close to 1 implies that as one security moves, either up or down, the other security will move in “lockstep,” in the same direction. A negative correlation close to –1 indicates that the securities have moved in the opposite direction. |
| | 4 | On average, our management fees were in the lowest quintile 70% of the time, based on the 20-year period ended December 31, 2018, versus comparable Lipper categories, excluding funds of funds. |
Class F-2 shares were first offered on August 1, 2008. Class F-2 share results prior to the date of first sale are hypothetical based on the results of the original share class of the fund without a sales charge, adjusted for typical estimated expenses. Results for certain funds with an inception date after August 1, 2008, also include hypothetical returns because those funds’ Class F-2 shares sold after the funds’ date of first offering. Please see capitalgroup.com for more information on specific expense adjustments and the actual dates of first sale.
All Capital Group trademarks mentioned are owned by The Capital Group Companies, Inc., an affiliated company or fund. All other company and product names mentioned are the property of their respective companies.

ITEM 2 – Code of Ethics
The Registrant has adopted a Code of Ethics that applies to its Principal Executive Officer and Principal Financial Officer. The Registrant undertakes to provide to any person without charge, upon request, a copy of the Code of Ethics. Such request can be made by calling 800/421-4225 or to the Secretary of the Registrant, 6455 Irvine Center Drive, Irvine, California 92618.
ITEM 3 – Audit Committee Financial Expert
The Registrant’s board has determined that James G. Ellis, a member of the Registrant’s audit committee, is an “audit committee financial expert” and "independent," as such terms are defined in this Item. This designation will not increase the designee’s duties, obligations or liability as compared to his or her duties, obligations and liability as a member of the audit committee and of the board, nor will it reduce the responsibility of the other audit committee members. There may be other individuals who, through education or experience, would qualify as "audit committee financial experts" if the board had designated them as such. Most importantly, the board believes each member of the audit committee contributes significantly to the effective oversight of the Registrant’s financial statements and condition.
ITEM 4 – Principal Accountant Fees and Services
| a) Audit Fees: | | |
| Audit | 2018 | 44,000 |
| | 2019 | 44,000 |
| | | |
| b) Audit-Related Fees: | | |
| | 2018 | None |
| | 2019 | None |
| | | |
| c) Tax Fees: | | |
| | 2018 | None |
| | 2019 | 6,000 |
| | The tax fees consist of professional services relating to the preparation of the Registrant’s tax returns. | |
| | | |
| d) All Other Fees: | | |
| | 2018 | None |
| | 2019 | None |
| | | |
| | Adviser and affiliates (includes only fees for non-audit services billed to the adviser and affiliates for engagements that relate directly to the operations and financial reporting of the Registrant and were subject to the pre-approval policies described below): | |
| a) Audit Fees: | | |
| | Not Applicable | |
| | | |
| b) Audit-Related Fees: | | |
| | 2018 | None |
| | 2019 | None |
| | The audit-related fees consist of assurance and related services relating to the examination of the Registrant’s transfer agent, principal underwriter and investment adviser conducted in accordance with Statement on Standards for Attestation Engagements Number 18 issued by the American Institute of Certified Public Accountants. | |
| | | |
| c) Tax Fees: | | |
| | 2018 | None |
| | 2019 | None |
| | The tax fees consist of consulting services relating to the Registrant’s investments. | |
| | | |
| | | |
| d) All Other Fees: | | |
| | 2018 | None |
| | 2019 | 9,000 |
| | The other fees consist of subscription services related to an accounting research tool. | |
| | | |
| | | |
| | All audit and permissible non-audit services that the Registrant’s audit committee considers compatible with maintaining the independent registered public accounting firm’s independence are required to be pre-approved by the committee. The pre-approval requirement will extend to all non-audit services provided to the Registrant, the investment adviser, and any entity controlling, controlled by, or under common control with the investment adviser that provides ongoing services to the Registrant, if the engagement relates directly to the operations and financial reporting of the Registrant. The committee will not delegate its responsibility to pre-approve these services to the investment adviser. The committee may delegate to one or more committee members the authority to review and pre-approve audit and permissible non-audit services. Actions taken under any such delegation will be reported to the full committee at its next meeting. The pre-approval requirement is waived with respect to non-audit services if certain conditions are met. The pre-approval requirement was not waived for any of the non-audit services listed above provided to the Registrant, adviser and affiliates. | |
| | | |
| | Aggregate non-audit fees paid to the Registrant’s auditors, including fees for all services billed to the Registrant, adviser and affiliates that provide ongoing services to the Registrant, were $0 for fiscal year 2018 and $14,000 for fiscal year 2019. The non-audit services represented by these amounts were brought to the attention of the committee and considered to be compatible with maintaining the auditors’ independence. | |
ITEM 5 – Audit Committee of Listed Registrants
Not applicable to this Registrant, insofar as the Registrant is not a listed issuer as defined in Rule 10A-3 under the Securities Exchange Act of 1934.
ITEM 6 – Schedule of Investments
Not applicable, insofar as the schedule is included as part of the report to shareholders filed under Item 1 of this form.
ITEM 7 – Disclosure of Proxy Voting Policies and Procedures for Closed-End Management Investment Companies
Not applicable to this Registrant, insofar as the Registrant is not a closed-end management investment company.
ITEM 8 – Portfolio Managers of Closed-End Management Investment Companies
Not applicable to this Registrant, insofar as the Registrant is not a closed-end management investment company.
ITEM 9 – Purchases of Equity Securities by Closed-End Management Investment Company and Affiliated Purchasers
Not applicable to this Registrant, insofar as the Registrant is not a closed-end management investment company.
ITEM 10 – Submission of Matters to a Vote of Security Holders
There have been no material changes to the procedures by which shareholders may recommend nominees to the Registrant’s board of trustees since the Registrant last submitted a proxy statement to its shareholders. The procedures are as follows. The Registrant has a nominating and governance committee comprised solely of persons who are not considered ‘‘interested persons’’ of the Registrant within the meaning of the Investment Company Act of 1940, as amended. The committee periodically reviews such issues as the board’s composition, responsibilities, committees, compensation and other relevant issues, and recommends any appropriate changes to the full board of trustees. While the committee normally is able to identify from its own resources an ample number of qualified candidates, it will consider shareholder suggestions of persons to be considered as nominees to fill future vacancies on the board. Such suggestions must be sent in writing to the nominating and governance committee of the Registrant, c/o the Registrant’s Secretary, and must be accompanied by complete biographical and occupational data on the prospective nominee, along with a written consent of the prospective nominee for consideration of his or her name by the nominating and governance committee.
ITEM 11 – Controls and Procedures
| (a) | The Registrant’s Principal Executive Officer and Principal Financial Officer have concluded, based on their evaluation of the Registrant’s disclosure controls and procedures (as such term is defined in Rule 30a-3 under the Investment Company Act of 1940), that such controls and procedures are adequate and reasonably designed to achieve the purposes described in paragraph (c) of such rule. |
| | |
| (b) | There were no changes in the Registrant’s internal controls over financial reporting (as defined in Rule 30a-3(d) under the Investment Company Act of 1940) that occurred during the Registrant’s semi-annual period covered by this report that has materially affected, or is reasonably likely to materially affect, the Registrant’s internal control over financial reporting. |
ITEM 12 – Exhibits
| (a)(1) | The Code of Ethics that is the subject of the disclosure required by Item 2 is attached as an exhibit hereto. |
| | |
| (a)(2) | The certifications required by Rule 30a-2 of the Investment Company Act of 1940 and Sections 302 and 906 of the Sarbanes-Oxley Act of 2002 are attached as exhibits hereto. |
SIGNATURES
Pursuant to the requirements of the Securities Exchange Act of 1934 and the Investment Company Act of 1940, the Registrant has duly caused this report to be signed on its behalf by the undersigned, thereunto duly authorized.
| | AMERICAN FUNDS INFLATION LINKED BOND FUND |
| | |
| | By __/s/ Kristine M. Nishiyama________________ |
| | Kristine M. Nishiyama, Executive Vice President and Principal Executive Officer |
| | |
| | Date: January 31, 2020 |
Pursuant to the requirements of the Securities Exchange Act of 1934 and the Investment Company Act of 1940, this report has been signed below by the following persons on behalf of the Registrant and in the capacities and on the dates indicated.
| By _/s/ Kristine M. Nishiyama_____________ |
Kristine M. Nishiyama, Executive Vice President and Principal Executive Officer |
| |
| Date: January 31, 2020 |
| By___/s/ Brian C. Janssen__________________ |
Brian C. Janssen, Treasurer and Principal Financial Officer |
| |
| Date: January 31, 2020 |