Citizens Independent Bancorp (CZID) Inactive
Filed: 17 Jan 14, 12:00am
Citizens Independent Bancorp Inc./ The Citizens Bank Investment Overview - 3rd Quarter 2013 Moving Forward… Sensible Solutions Success Non - Shareholders Capital Raise Campaign Presented 2014 CONFIDENTIAL: DO NOT COPY OR DISTRIBUTE Filed pursuant to Rule 424(b)(3) under the Securities Act of 1933 Registration No. 333 - 191004
Financial Disclaimer This Investor Presentation has been produced by Citizens Independent Bancorp, Inc. and Citizens Bank solely for use at this i nve stor presentation held in connection with the public offering of Common Stock of CIB and may not be reproduced or redistributed, i n w hole or in part, to any other person. CIB/ TCBOL has filed a registration statement, including a prospectus with the Securities and Exch ang e Commission (“SEC”) for the rights offering of its Common Stock to which this presentation relates. Before you decide whether to invest, you should read the Prospectus in that registration statement for more complete information about CIB and this offering. You may obt ain these documents for free by visiting our website www.tcbol.com . Alternatively you may contact Citizens Independent Bancorp. located at 188 West Main Street, Logan, Ohio 43138 or by calling 740 - 385 - 8561. Some of our statements contained in this presentation are “forward - looking” statements within the meaning of the Section 27A of the Securities Act of 1933, as amended, and Section 21E of the Securities Exchange Act of 1934, as amended. We intend such forwar d - looking statements to be covered by the safe harbor provisions for forward - looking statements contained in the Private Securities Litig ation Reform Act of 1995 and are including this statement for purposes of invoking these safe harbor provisions. Forward - looking statements a re not guarantees of performance or results. When we use words such as “may,” “plan,” “contemplate,” “anticipate,” “believe,” “inten d,” “continue,” “expect,” “project,” “predict,” “estimate,” “target,” “could,” “is likely,” “should,” “would,” “will,” and similar expression s, you should consider them as identifying forward - looking statements, although we may use other phrasing. All statements other than statements of historical fact included in this presentation regarding our outlook, financial positi on and results of operation, liquidity, capital resources and interest rate sensitivity are forward - looking statements. These forward - looking stat ements also include, but are not limited to, anticipated changes in industry conditions created by state and federal legislation and regu lat ions; anticipated changes in general interest rates and the impact of future interest rate changes on our profitability, capital adequacy and t he fair value of our financials assets and liabilities; retention of our existing customer base and our ability to attract new customers; the dev elopment of new products and services and their success in the marketplace; the adequacy of the allowance for loan losses; and statements reg ard ing our anticipated loan and deposit account growth, expense levels, liquidity and capital resources and projections of earnings. The forward - looking statements contained in this presentation are based on our beliefs and assumptions and on the information av ailable to us at the time that these disclosures were prepared and involve known and unknown risks, uncertainties and other factors whic h m ay cause our actual results to be materially different from any future results expressed or implied by such forward - thinking statements. Although we believe the expectations reflected in such forward - looking statements are reasonable, we can give no assurance such expectations will prove to have been correct. Important factors that could cause actual results to differ materially from those in the forward - looking s tatements included herein include, but are not limited to, competition in the industry and markets in which we operate; levels of non - perf orming assets; change in general interest rates; loan demand; rapid changes in technology affecting the financial services industry; real es tat e values; changes in government regulation; and general economic and business conditions. For other factors, risks and uncertainties that could cause our actual results to differ materially from estimates and projec tio ns contained in these forward - looking statements, please read the “Risk Factors” section of the Prospectus that relates to the rights offering. All written or oral forward - looking statements attributable to us are expressly qualified in their entirety by this cautionary note. The CIB/ T CBOL assumes no obligation to update forward - looking statements.
Compliance Under the BHC Act and CIBC Act Investments by companies, such as private equity firms, require analysis under the BHC Act. For instance, an existing bank holding company would need to file an application with the Reserve Bank if it planned to purchase Citizens’ shares that would cause its aggregate interest to equal or exceed 5%. Other companies would need to file a CIBC Act notice with the Reserve Bank before they acquired Citizens shares that caused their aggregate interest to equal or exceed 10% but less than 25%. They may be required to provide passivity commitments to the Reserve Bank if they plan to acquire 5% or more. Investments by other shareholders would require filing a notice with the Reserve Bank before they acquired Citizens shares that caused their aggregate interest to equal or exceed 10%. The Fed will view any warrants issued by Citizens as already exercised in calculating the percentage of shares owned, controlled or held with the power to vote by the shareholder (or group) under the BHC Act and the CIBC Act. The Fed will apply the presumption that family members act in concert. Agreements between shareholders regarding the acquisition, voting or transfer of shares would result in the Federal Reserve presuming that shareholders are acting in concert, as when there is a history of shareholders making parallel investments. The Fed’s control calculations are not done from a fully diluted basis. Rather, the Fed assumes that warrants and options are only exercised by the shareholder (or group) that is being reviewed. Please refer to the prospectus language limiting investors to 9.9%, as well as the right of Citizens not to issue shares if prior clearance or approval is required from any state or federal bank regulatory authority to acquire, own, or control shares (Page 21).
Regulatory Matters Under applicable laws, the FDIC and the DFI, as the Bank’s primary regulators, and the FRB, as the Company’s primary federal regulator; have the ability to impose substantial sanctions, restrictions and requirements on us if they find, upon examinati on or otherwise, weaknesses with respect to our operations. Please refer to the prospectus language on Page 83. Based on the FDIC’s January 3,2011 examination of Citizens Bank, the FDIC determined on May 3, 2011 that the Bank is in “troubled condition” within the meaning of federal statutes and regulations. As a result, certain limitations and regulatory requirements apply to the Bank, including but not limited to, prior approval of changes to senior executive management and directors and the payment of, or the agreement to pay, certain severance payments to officers, directors, and employees. On June 11, 2011 the Bank entered into a Consent Order with the FDIC that was replaced by a revised Consent Order on October 23, 2012 . Further, the Bank entered into a written agreement with the DFI on July 6, 2011. This agreement was subsequently replaced with the DFI 2012 Agreement dated October 31, 2012. The Consent Order and DFI 2012 Agreement are nearly identical. Please refer to the prospectus language on Page 84. On April 5, 2013 the Bank entered into the FDIC 2013 Memorandum of Understanding (MOU) . Please refer to the prospectus language on Page 85. On July 5, 2011 the Company entered into the FRB 2011 MOU with the FRB. Please refer to the prospectus language on Page 85. The Informal Agreements are informal administrative actions that are not disclosed to the public. The Consent Order is a publ ic document, and a copy is available from the FDIC’s website at www.fdic.gov . The Consent Order will remain in effect until terminated modified or suspended by the FDIC. Please refer to the prospectus language on Page 86. Management and the Board of Directors believe that appropriate actions have been taken to comply with the requirements of the Consent Order that have reached the required completion date (with the exception of Tier 1 and Total Risk Based Capital requirements) and will continue working to resolve all remaining items. Failure to comply with the Consent Order could result in additional regulatory enforcement action, including the imposition of additional restrictions. The Consent Order will remain in effect until terminated, modified, or suspended by the FDIC. Please refer to the prospectus language on Page 86.
Introduction None of us, individuals nor corporations, can control external events. It is more natural for any company to experience peaks and valleys in their daily operations. For 47 out of 52 years we have experienced peaks. We were determined to change our current valley into a peak. Our chosen path out of our valley has been to choose to see things as they really are and to change and do things much differently than they were done in our immediate past. We are committed and returning to implementing only the good, the tried, tested and successful methods that have proven to be successful by thriving institutions as we were up unitl a couple of years ago. Changing our valley back to a peak is a result of implementing a proven, sensible approach that returns us to the success our shareholders have so become accustomed.
We will continue our plan to move forward urgently yet not hastily or unwisely but always thoughtfully and thoroughly, focusing return on equity through organic quality loan growth and improved efficiency. We strongly believe this will return our status to that of a high performance community bank, allowing consistent return to shareholders and offering competitive products and outstanding service to our customers. We are restoring confidence in the bank by stabilizing the bank, the Board, and Management and by raising capital to an acceptable level ASAP. This is being accomplished through hard work, by working together as a team: shareholders, directors, management, and employees. You create a peak when you truly follow a prepared strategy that provides a sensible solution for success. Introduction

I have often stated that any business is like an automobile - It must be driven to get results. To go forward you must be in drive. We are now in drive. Now we need to step on the gas to accelerate to return to our past 50 years of peaks for the next 50 years. The Capital Restoration Plan is the final step to our complete recovery. We will continue to focus on what is right and what is fair. It’s our mission of exceptional quality service and providing shareholders growth and good return on this investment. The will to win is very important. The will to prepare is vital. We have been preparing to win. Now we are even more determined to show that we can and are winning. Introduction
Citizens Independent Bancorp Inc./ The Citizens Bank Investment Overview - 3rd Quarter 2013 Moving Forward… Sensible Solutions Success Non - Shareholders Capital Raise Campaign Presented 2014 CONFIDENTIAL: DO NOT COPY OR DISTRIBUTE
Vision/ Mission Statement Our mission is to return our status of a high performance community bank. This will be accomplished by generating consistent returns to our shareholders and offering competitive products and outstanding service to our customers through our knowledgeable and professional employees.
Primary Business Philosophy TCBOL is to generate interest income, monitor and control operating expenses, and maintain a reasonable equity position giving primary attention to both its yield on interest - earning assets and its cost of funds in order to attain a reasonable net interest spread and net interest margin thereby allowing us to pay dividends to our shareholders that permits the growth and value of our stock.
Agenda I. Offering Considerations II. Historical Overview III. CIB/TCBOL Financial Overview IV. Peer Analysis V. Moving Forward: S ensible S olutions = S uccess
I. Offering Considerations II. Historical Overview III. CIB/TCBOL Financial Overview IV. Peer Analysis V. Moving Forward: S ensible S olutions = S uccess
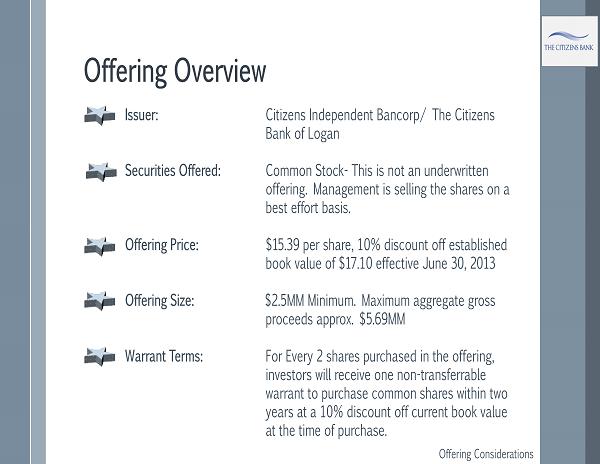
Offering Overview Offering Considerations Issuer: Citizens Independent Bancorp/ The Citizens Bank of Logan Securities Offered: Common Stock - This is not an underwritten offering. Management is selling the shares on a best effort basis. Offering Price: $15.39 per share, 10% discount off established book value of $17.10 effective June 30, 2013 Offering Size: $2.5MM Minimum. Maximum aggregate gross proceeds approx. $5.69MM Warrant Terms: For Every 2 shares purchased in the offering, investors will receive one non - transferrable warrant to purchase common shares within two years at a 10% discount off current book value at the time of purchase.
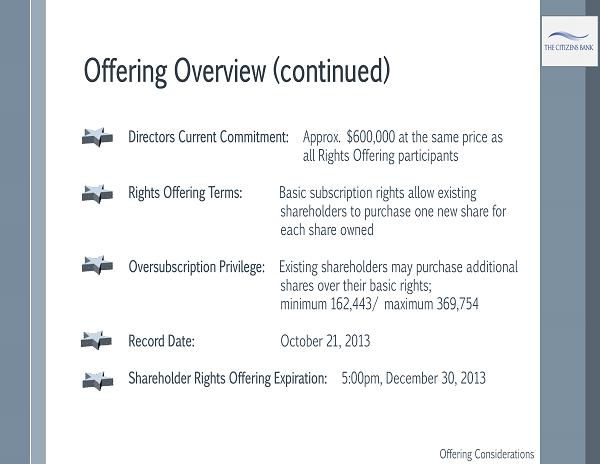
Offering Overview (continued) Offering Considerations Directors Current Commitment: Approx. $600,000 at the same price as all Rights Offering participants Rights Offering Terms: Basic subscription rights allow existing shareholders to purchase one new share for each share owned Oversubscription Privilege: Existing shareholders may purchase additional shares over their basic rights; minimum 162,443/ maximum 369,754 Record Date: October 21, 2013 Shareholder Rights Offering Expiration: 5:00pm, December 30, 2013
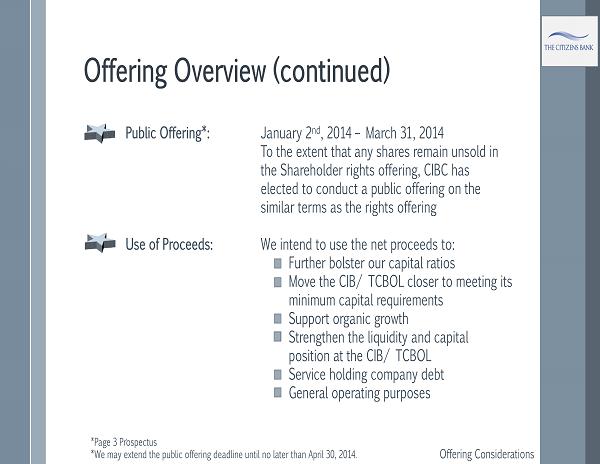
Offering Overview (continued) Offering Considerations Public Offering*: January 2 nd , 2014 – March 31, 2014 To the extent that any shares remain unsold in the Shareholder rights offering, CIBC has elected to conduct a public offering on the similar terms as the rights offering Use of Proceeds: We intend to use the net proceeds to: Further bolster our capital ratios Move the CIB/ TCBOL closer to meeting its minimum capital requirements Support organic growth Strengthen the liquidity and capital position at the CIB/ TCBOL Service holding company debt General operating purposes . *Page 3 Prospectus *We may extend the public offering deadline until no later than April 30, 2014 .
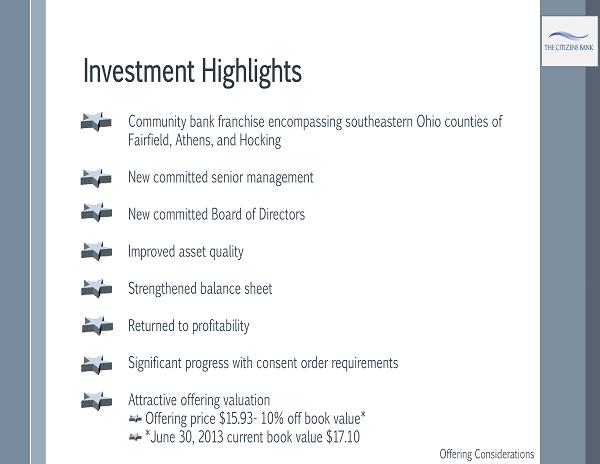
Investment Highlights Offering Considerations Community bank franchise encompassing southeastern Ohio counties of Fairfield, Athens, and Hocking New committed senior management New committed Board of Directors Improved asset quality Strengthened balance sheet Returned to profitability Significant progress with consent order requirements Attractive offering valuation Offering price $15.93 - 10% off book value* *June 30, 2013 current book value $17.10
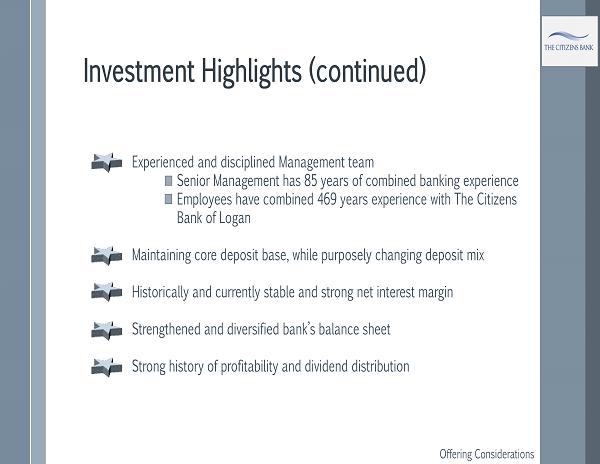
Investment Highlights (continued) Offering Considerations Experienced and disciplined Management team Senior Management has 85 years of combined banking experience Employees have combined 469 years experience with The Citizens Bank of Logan Maintaining core deposit base, while purposely changing deposit mix Historically and currently stable and strong net interest margin Strengthened and diversified bank’s balance sheet Strong history of profitability and dividend distribution
Purchase Priorities Offering Considerations Common shares are being offered for sale to the public in the following order of priority: First, to shareholders of Citizens Independent Bank Corp. who are beneficial owners of common shares as of June 30, 2013 Closes December 30, 2013 at 5:00PM Any shares not sold in the offering to the shareholders listed above may then be sold through an offering to the general public. This offering expires March 31, 5:00PM* and/or if we achieve maximum 369,754 new shares issued * We may extend the public offering until no later than April 30, 2014
Purchase Limitations Offering Considerations The opportunity to purchase common shares is subject to the following purchase limitations: There is no minimum number of shares that may be purchased Maximum number of shares that may be purchased is the number of common shares, whereby the purchaser’s total beneficial ownership of CIB common shares (including any common shares currently owned) would not exceed 9.9% of outstanding common shares after the offering has closed*. * Compliance under the BHC Act and CIBC.
I. Offering Considerations II. Historical Overview III. CIB/TCBOL Financial Overview IV. Peer Analysis V. Moving Forward: S ensible S olutions = S uccess
The History of The Citizens Bank of Logan: The 1930s through the Great Depression Historical Overview In the 1930s there were 3 banks serving the Logan area: The First National Bank The Rempel Bank The Farmers and Merchants Bank Once the Great Depression hit only 2 remained: The First National Bank The Farmers and Merchants Bank
The History of The Citizens Bank of Logan: The 1960s In 1961 It was felt that Logan and Hocking County needed a bank that would better serve the interest of the local people and the local economy. The Founders saw this need yet understood that in order for the Bank to survive the bank must have the backing of the hometown people and the local Economy. Historical Overview
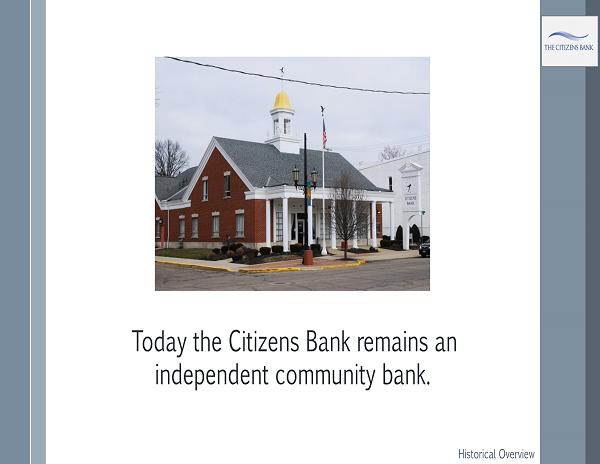
Today the Citizens Bank remains an independent community bank. Historical Overview
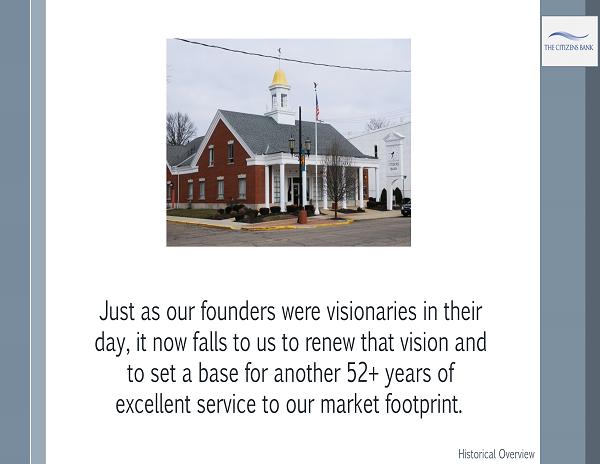
Just as our founders were visionaries in their day, it now falls to us to renew that vision and to set a base for another 52+ years of excellent service to our market footprint. Historical Overview
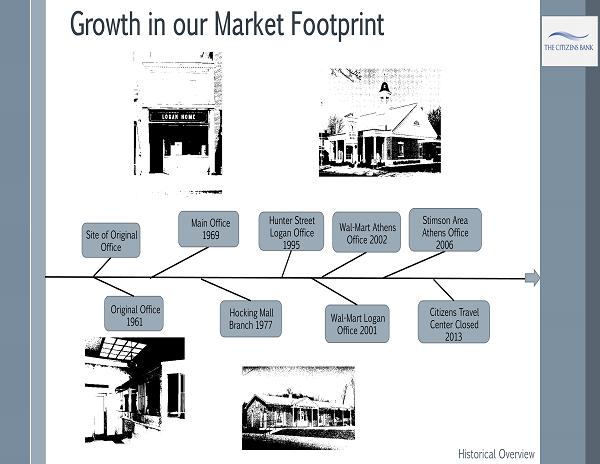
Growth in our Market Footprint Hunter Street Logan Office 1995 Wal - Mart Logan Office 2001 Stimson Area Athens Office 2006 Citizens Travel Center Closed 2013 Wal - Mart Athens Office 2002 Hocking Mall Branch 1977 Original Office 1961 Main Office 1969 Site of Original Office Historical Overview
I. Offering Considerations II. Historical Overview III. CIB/TCBOL Financial Overview IV. Peer Analysis V. Moving Forward: S ensible S olutions = S uccess
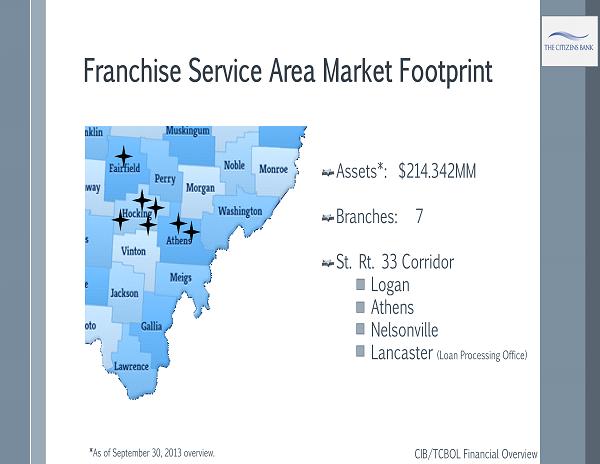
Franchise Service Area Market Footprint CIB/TCBOL Financial Overview Assets*: $214.342MM Branches: 7 St. Rt. 33 Corridor Logan Athens Nelsonville Lancaster (Loan Processing Office) * As of September 30, 2013 overview.
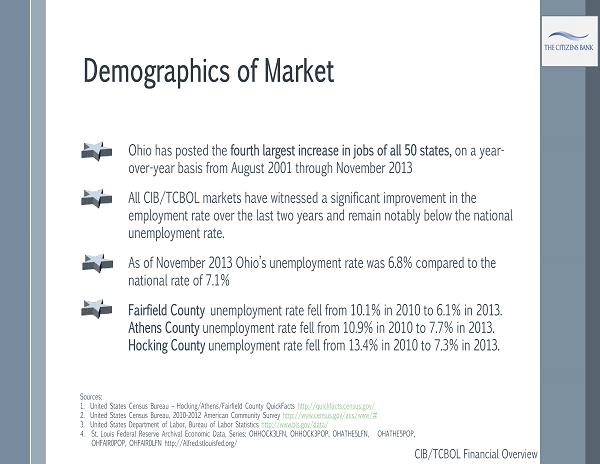
Demographics of Market Ohio has posted the fourth largest increase in jobs of all 50 states, on a year - over - year basis from August 2001 through November 2013 All CIB/TCBOL markets have witnessed a significant improvement in the employment rate over the last two years and remain notably below the national unemployment rate. As of November 2013 Ohio’s unemployment rate was 6.8% compared to the national rate of 7.1% Fairfield County unemployment rate fell from 10.1% in 2010 to 6.1% in 2013. Athens County unemployment rate fell from 10.9% in 2010 to 7.7% in 2013. Hocking County unemployment rate fell from 13.4% in 2010 to 7.3% in 2013. CIB/TCBOL Financial Overview Sources: 1. United States Census Bureau – Hocking/Athens/Fairfield County QuickFacts http://quickfacts.census.gov/ 2. United States Census Bureau, 2010 - 2012 American Community Survey http://www.census.gov/acs/www/# 3. United States Department of Labor, Bureau of Labor Statistics http://www.bls.gov/data/ 4. St. Louis Federal Reserve Archival Economic Data, Series: OHHOCK3LFN, OHHOCK3POP, OHATHE5LFN, OHATHE5POP, OHFAIR0POP, OHFAIR0LFN http://Alfred.stlouisfed.org/
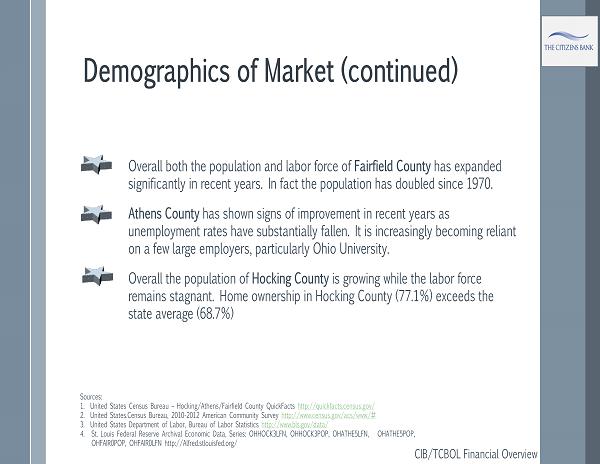
Demographics of Market (continued) Overall both the population and labor force of Fairfield County has expanded significantly in recent years. In fact the population has doubled since 1970. Athens County has shown signs of improvement in recent years as unemployment rates have substantially fallen. It is increasingly becoming reliant on a few large employers, particularly Ohio University. Overall the population of Hocking County is growing while the labor force remains stagnant. Home ownership in Hocking County (77.1%) exceeds the state average (68.7%) CIB/TCBOL Financial Overview Sources: 1. United States Census Bureau – Hocking/Athens/Fairfield County QuickFacts http://quickfacts.census.gov/ 2. United States.Census Bureau, 2010 - 2012 American Community Survey http://www.census.gov/acs/www/# 3. United States Department of Labor, Bureau of Labor Statistics http://www.bls.gov/data/ 4. St. Louis Federal Reserve Archival Economic Data, Series: OHHOCK3LFN, OHHOCK3POP, OHATHE5LFN, OHATHE5POP, OHFAIR0POP, OHFAIR0LFN http://Alfred.stlouisfed.org/
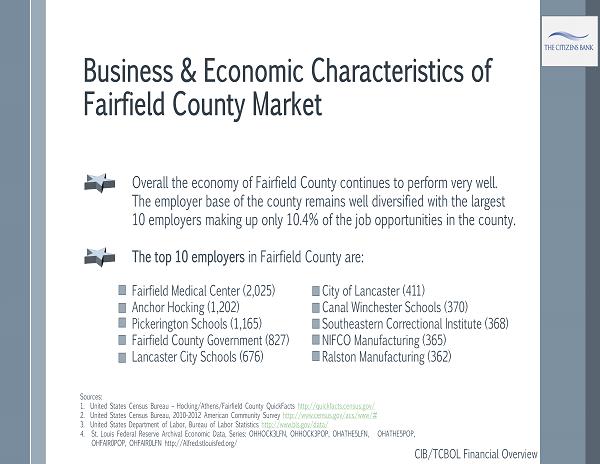
Business & Economic Characteristics of Fairfield County Market Overall the economy of Fairfield County continues to perform very well. The employer base of the county remains well diversified with the largest 10 employers making up only 10.4% of the job opportunities in the county. The top 10 employers in Fairfield County are: Fairfield Medical Center (2,025) City of Lancaster (411) Anchor Hocking (1,202) Canal Winchester Schools (370) Pickerington Schools (1,165) Southeastern Correctional Institute (368) Fairfield County Government (827) NIFCO Manufacturing (365) Lancaster City Schools (676) Ralston Manufacturing (362) CIB/TCBOL Financial Overview Sources: 1. United States Census Bureau – Hocking/Athens/Fairfield County QuickFacts http://quickfacts.census.gov/ 2. United States Census Bureau, 2010 - 2012 American Community Survey http://www.census.gov/acs/www/# 3. United States Department of Labor, Bureau of Labor Statistics http://www.bls.gov/data/ 4. St. Louis Federal Reserve Archival Economic Data, Series: OHHOCK3LFN, OHHOCK3POP, OHATHE5LFN, OHATHE5POP, OHFAIR0POP, OHFAIR0LFN http://Alfred.stlouisfed.org/
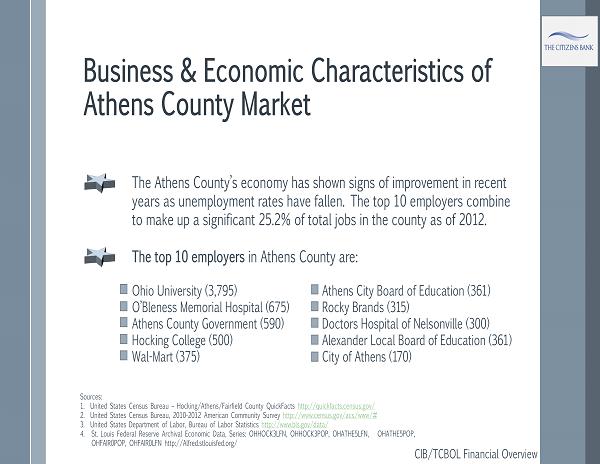
Business & Economic Characteristics of Athens County Market The Athens County’s economy has shown signs of improvement in recent years as unemployment rates have fallen. The top 10 employers combine to make up a significant 25.2% of total jobs in the county as of 2012. The top 10 employers in Athens County are: Ohio University (3,795) Athens City Board of Education (361) O’Bleness Memorial Hospital (675) Rocky Brands (315) Athens County Government (590) Doctors Hospital of Nelsonville (300) Hocking College (500) Alexander Local Board of Education (361) Wal - Mart (375) City of Athens (170) CIB/TCBOL Financial Overview Sources: 1. United States Census Bureau – Hocking/Athens/Fairfield County QuickFacts http://quickfacts.census.gov/ 2. United States Census Bureau, 2010 - 2012 American Community Survey http://www.census.gov/acs/www/# 3. United States Department of Labor, Bureau of Labor Statistics http://www.bls.gov/data/ 4. St. Louis Federal Reserve Archival Economic Data, Series: OHHOCK3LFN, OHHOCK3POP, OHATHE5LFN, OHATHE5POP, OHFAIR0POP, OHFAIR0LFN http://Alfred.stlouisfed.org/

Business & Economic Characteristics of Hocking County Market Overall, Hocking County’s economy still lags Ohio averages but has shown improvement in recent years. The top 10 employers combine to make up 15.7% of total jobs in the county. The top 10 employers of Hocking County are: Logan - Hocking Schools (453) Smead Manufacturing (182) Hocking County Government (323) Logan Health Care (111) Hocking Valley Community Hospital (293) Kilbarger Corporation (110) Wal - Mart Stores (245) General Electric (108) Amanda Bent Bolt (189) Kroger (101) CIB/TCBOL Financial Overview Sources: 1. United States Census Bureau – Hocking/Athens/Fairfield County QuickFacts http://quickfacts.census.gov/ 2. United States Census Bureau, 2010 - 2012 American Community Survey http://www.census.gov/acs/www/# 3. United States Department of Labor, Bureau of Labor Statistics http://www.bls.gov/data/ 4. St. Louis Federal Reserve Archival Economic Data, Series: OHHOCK3LFN, OHHOCK3POP, OHATHE5LFN, OHATHE5POP, OHFAIR0POP, OHFAIR0LFN http://Alfred.stlouisfed.org/
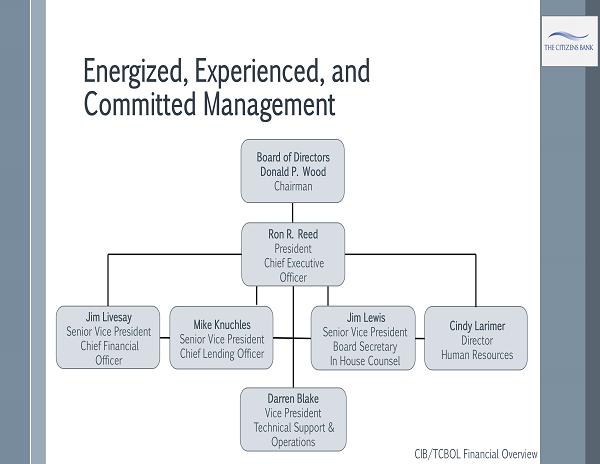
Energized, Experienced, and Committed Management Ron R. Reed President Chief Executive Officer Jim Livesay Senior Vice President Chief Financial Officer Mike Knuchles Senior Vice President Chief Lending Officer Jim Lewis Senior Vice President Board Secretary In House Counsel Cindy Larimer Director Human Resources Darren Blake Vice President Technical Support & Operations Board of Directors Donald P. Wood Chairman CIB/TCBOL Financial Overview
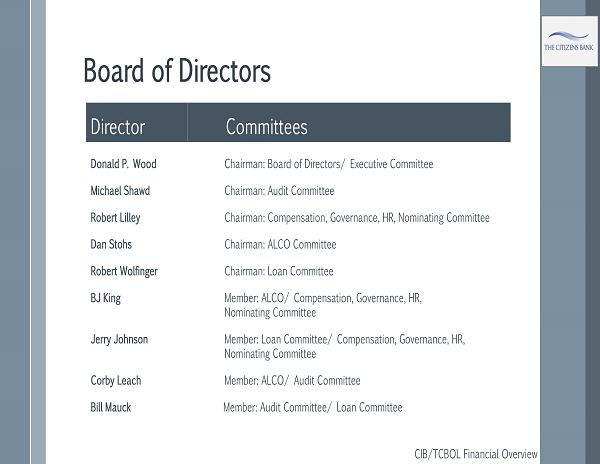
Board of Directors Donald P. Wood Chairman: Board of Directors/ Executive Committee Michael Shawd Chairman: Audit Committee Robert Lilley Chairman: Compensation, Governance, HR, Nominating Committee Dan Stohs Chairman: ALCO Committee Robert Wolfinger Chairman: Loan Committee BJ King Member: ALCO/ Compensation, Governance, HR, Nominating Committee Jerry Johnson Member: Loan Committee/ Compensation, Governance, HR, Nominating Committee Corby Leach Member: ALCO/ Audit Committee Bill Mauck Member: Audit Committee/ Loan Committee Director Committees r CIB/TCBOL Financial Overview
Commitment to Investors/ Keys to Success CIB/TCBOL Financial Overview S ensible S olutions = S uccess Senior Management and the new Board of Directors are committed to NOT take any shortcuts in implementing our S ensible S olutions = S uccess. Wishing leads to know action. Inaction is a decision that can doom any organization to poor performance and even failure. The will to win is very important . The will to prepare to win is vital . We pledge to our investors/ shareholders that we will not act recklessly but courageously .
Commitment to Investors/ Keys to Success (continued) Planning is bringing the future into the present so that we can take forward thinking action today. Our plans are conservative yet will not impair or paralyze management or the Board to take necessary risks to continue to allow the bank to grow and move forward profitability. We have been thoughtful and thorough: The bank’s long term health depends on us to have done so. We must and have established, realistic warning thresholds for key measures that triggers and provides sufficient advanced warnings to adverse scenarios. CIB/TCBOL Financial Overview
Commitment to Investors/ Keys to Success (continued) CIB/TCBOL Financial Overview We have acted urgently yet not hastily or unwisely. The Capital Campaign is a forward - looking process that ameliorates regulatory capital requirements and buttresses required capital based on CIB/ TCBOL’s current and perspective risk profile. We are currently developing a 1 to 3 year and a long - term strategic plan. We have been preparing to win and are winning.
Financial Objectives Return to paying dividends as soon as practical; however the decision to do will be made based upon achieving capital requirements and regulatory approval Provide stable returns and target returns in top quartile of Ohio banks Within 2 years reduce efficiency ratio to < 70% and/or below the peer group median thereafter CIB/TCBOL Financial Overview
Asset Quality Trends Management has been proactive in addressing a challenging credit environment Conservative lending approach has been successful Front end of credit pipeline showing improvement Non Performing Assets (NPAs) reduced OREO properties reduced and reevaluated on a sound and realistic basis CIB/TCBOL Financial Overview
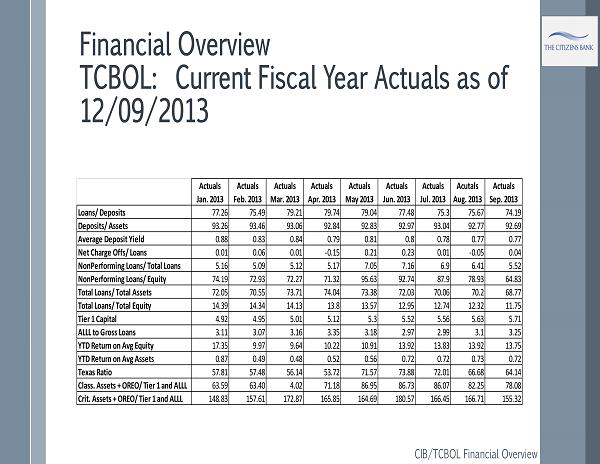
Financial Overview TCBOL: Current Fiscal Year Actuals as of 12/09/2013 CIB/TCBOL Financial Overview Actuals Jan. 2013 Actuals Feb. 2013 Actuals Mar. 2013 Actuals Apr. 2013 Actuals May 2013 Actuals Jun. 2013 Actuals Jul. 2013 Acutals Aug. 2013 Actuals Sep. 2013 Loans/ Deposits 77.26 75.49 79.21 79.74 79.04 77.48 75.3 75.67 74.19 Deposits/ Assets 93.26 93.46 93.06 92.84 92.83 92.97 93.04 92.77 92.69 Average Deposit Yield 0.88 0.83 0.84 0.79 0.81 0.8 0.78 0.77 0.77 Net Charge Offs/ Loans 0.01 0.06 0.01 -0.15 0.21 0.23 0.01 -0.05 0.04 NonPerforming Loans/ Total Loans 5.16 5.09 5.12 5.17 7.05 7.16 6.9 6.41 5.52 NonPerforming Loans/ Equity 74.19 72.93 72.27 71.32 95.63 92.74 87.9 78.93 64.83 Total Loans/ Total Assets 72.05 70.55 73.71 74.04 73.38 72.03 70.06 70.2 68.77 Total Loans/ Total Equity 14.39 14.34 14.13 13.8 13.57 12.95 12.74 12.32 11.75 Tier 1 Capital 4.92 4.95 5.01 5.12 5.3 5.52 5.56 5.63 5.71 ALLL to Gross Loans 3.11 3.07 3.16 3.35 3.18 2.97 2.99 3.1 3.25 YTD Return on Avg Equity 17.35 9.97 9.64 10.22 10.91 13.92 13.83 13.92 13.75 YTD Return on Avg Assets 0.87 0.49 0.48 0.52 0.56 0.72 0.72 0.73 0.72 Texas Ratio 57.81 57.48 56.14 53.72 71.57 73.88 72.01 66.68 64.14 Class. Assets + OREO/ Tier 1 and ALLL 63.59 63.40 4.02 71.18 86.95 86.73 86.07 82.25 78.08 Crit. Assets + OREO/ Tier 1 and ALLL 148.83 157.61 172.87 165.85 164.69 180.57 166.45 166.71 155.32
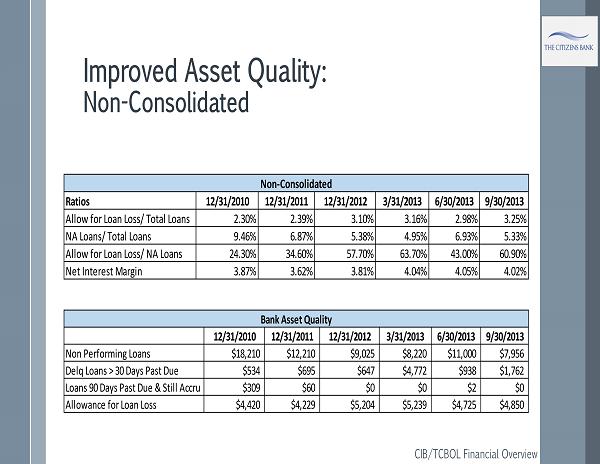
Improved Asset Quality: Non - Consolidated CIB/TCBOL Financial Overview Ratios 12/31/2010 12/31/2011 12/31/2012 3/31/2013 6/30/2013 9/30/2013 Allow for Loan Loss/ Total Loans 2.30% 2.39% 3.10% 3.16% 2.98% 3.25% NA Loans/ Total Loans 9.46% 6.87% 5.38% 4.95% 6.93% 5.33% Allow for Loan Loss/ NA Loans 24.30% 34.60% 57.70% 63.70% 43.00% 60.90% Net Interest Margin 3.87% 3.62% 3.81% 4.04% 4.05% 4.02% Non-Consolidated 12/31/2010 12/31/2011 12/31/2012 3/31/2013 6/30/2013 9/30/2013 Non Performing Loans $18,210 $12,210 $9,025 $8,220 $11,000 $7,956 Delq Loans > 30 Days Past Due $534 $695 $647 $4,772 $938 $1,762 Loans 90 Days Past Due & Still Accru $309 $60 $0 $0 $2 $0 Allowance for Loan Loss $4,420 $4,229 $5,204 $5,239 $4,725 $4,850 Bank Asset Quality
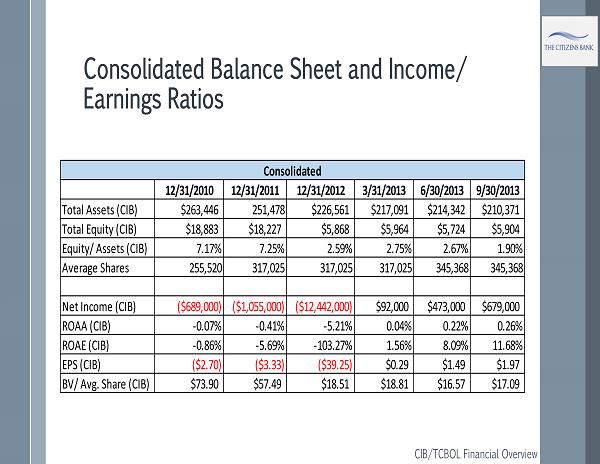
Consolidated Balance Sheet and Income/ Earnings Ratios CIB/TCBOL Financial Overview 12/31/2010 12/31/2011 12/31/2012 3/31/2013 6/30/2013 9/30/2013 Total Assets (CIB) $263,446 251,478 $226,561 $217,091 $214,342 $210,371 Total Equity (CIB) $18,883 $18,227 $5,868 $5,964 $5,724 $5,904 Equity/ Assets (CIB) 7.17% 7.25% 2.59% 2.75% 2.67% 1.90% Average Shares 255,520 317,025 317,025 317,025 345,368 345,368 Net Income (CIB) ($689,000) ($1,055,000) ($12,442,000) $92,000 $473,000 $679,000 ROAA (CIB) -0.07% -0.41% -5.21% 0.04% 0.22% 0.26% ROAE (CIB) -0.86% -5.69% -103.27% 1.56% 8.09% 11.68% EPS (CIB) ($2.70) ($3.33) ($39.25) $0.29 $1.49 $1.97 BV/ Avg. Share (CIB) $73.90 $57.49 $18.51 $18.81 $16.57 $17.09 Consolidated
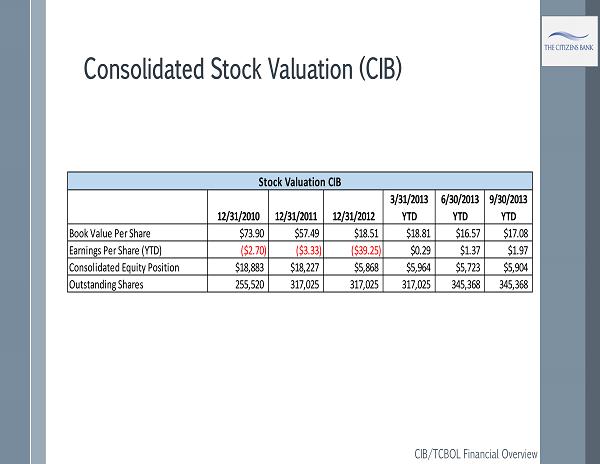
Consolidated Stock Valuation (CIB) CIB/TCBOL Financial Overview 12/31/2010 12/31/2011 12/31/2012 3/31/2013 YTD 6/30/2013 YTD 9/30/2013 YTD Book Value Per Share $73.90 $57.49 $18.51 $18.81 $16.57 $17.08 Earnings Per Share (YTD) ($2.70) ($3.33) ($39.25) $0.29 $1.37 $1.97 Consolidated Equity Position $18,883 $18,227 $5,868 $5,964 $5,723 $5,904 Outstanding Shares 255,520 317,025 317,025 317,025 345,368 345,368 Stock Valuation CIB
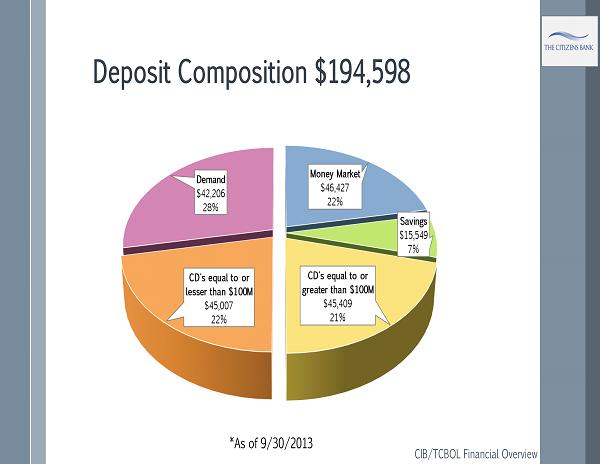
Deposit Composition $194,598 *As of 9/30/2013 CIB/TCBOL Financial Overview
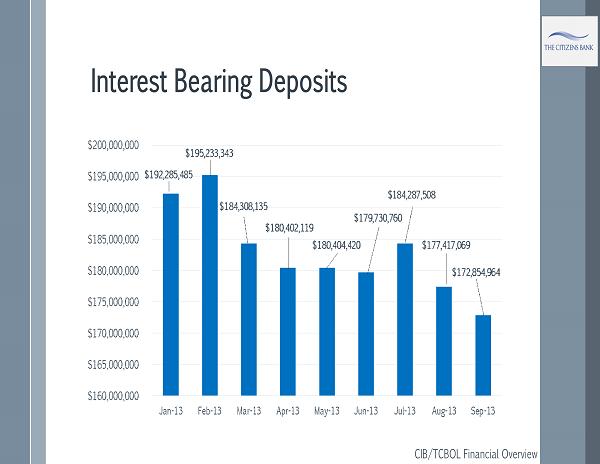
Interest Bearing Deposits CIB/TCBOL Financial Overview
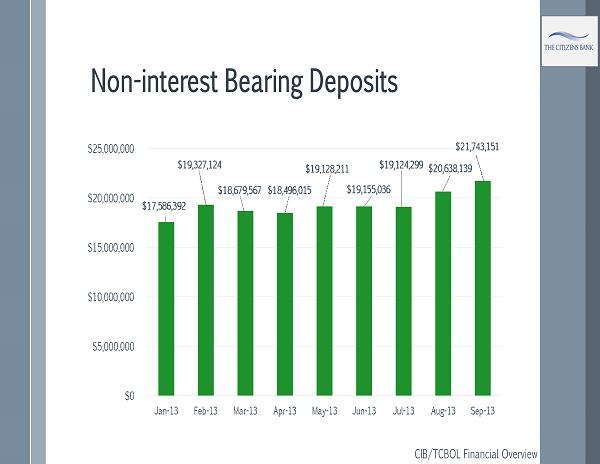
Non - interest Bearing Deposits CIB/TCBOL Financial Overview
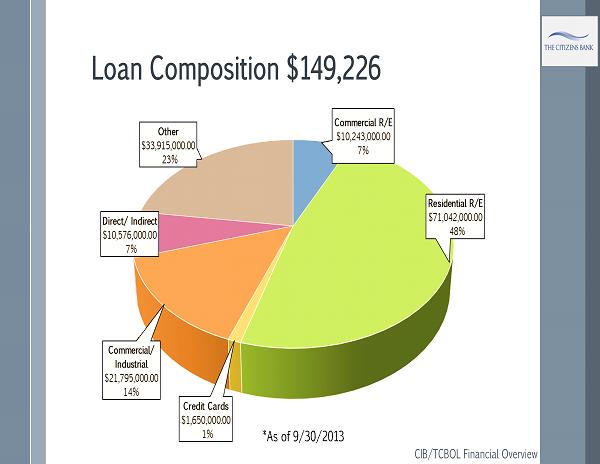
Loan Composition $149,226 CIB/TCBOL Financial Overview
Key Initiatives New Board and Management are committed to focusing on fundamentals that stabilize management and make the bank forward profitability New disciplined management team with a proven combined 85 year track record Improved capital levels Balance sheet strengthened - attractive core deposit base Sensibly re - balancing loan portfolio Well positioned to grow our balance sheet and geographic footprint, enhancing long - term shareholder value. CIB/TCBOL Financial Overview
Key Initiatives (continued) Improved performance ratios by driving the expansion and growth of the Citizens Bank in our targeted market area Maintain quarterly shareholder communication Implement strategy to improve transactional opportunities for shareholders Add lenders in mortgage and commercial lending in Lancaster market Continue to invest in the economic development of our market ,expanding and enhancing business development opportunities in our market area. CIB/TCBOL Financial Overview
Key Items affecting CIB/TCBOL’s results for the first six months of 2013 Net interest income declined by $97,000 year - over - year for the six months ended June 30, 2013. A $536,000 decline in interest income was offset by a $439,000 decrease in interest expense. Non - interest income declined by $559,000 to $706,000 for the six months ended June 30, 2013. The decrease can primarily be attributed to a $412 gain on sale of investment securities that provided a one - time increase to 2012 non - interest income. Non - interest expense declined by $678,000 to $3.8 million for six months ended June 30, 2013. The decline in expense can be attributed to lower holding costs for OREO properties and reduced credit card processing expense. CIB/TCBOL Financial Overview
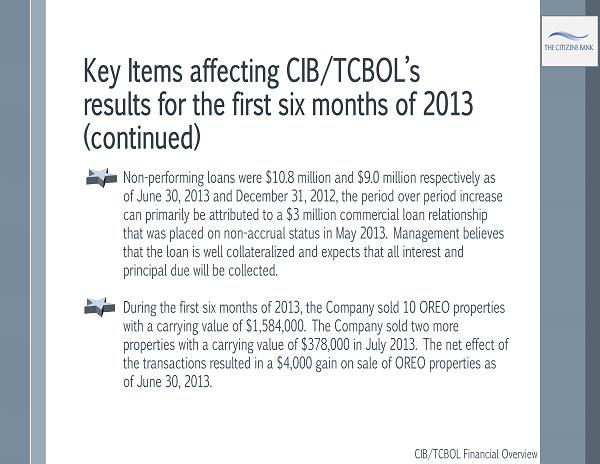
Key Items affecting CIB/TCBOL’s results for the first six months of 2013 (continued) Non - performing loans were $10.8 million and $9.0 million respectively as of June 30, 2013 and December 31, 2012, the period over period increase can primarily be attributed to a $3 million commercial loan relationship that was placed on non - accrual status in May 2013. Management believes that the loan is well collateralized and expects that all interest and principal due will be collected. During the first six months of 2013, the Company sold 10 OREO properties with a carrying value of $1,584,000. The Company sold two more properties with a carrying value of $378,000 in July 2013. The net effect of the transactions resulted in a $4,000 gain on sale of OREO properties as of June 30, 2013. CIB/TCBOL Financial Overview
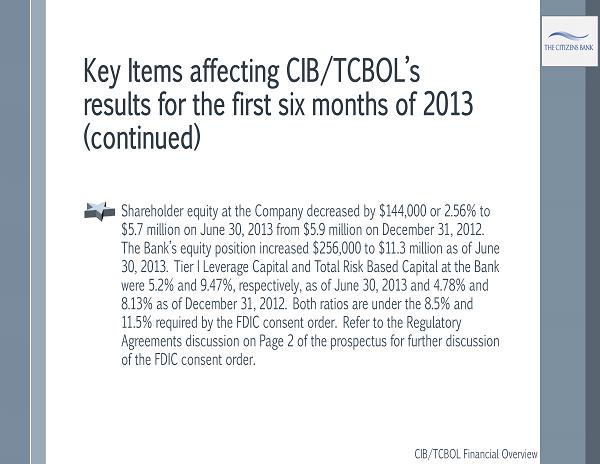
Key Items affecting CIB/TCBOL’s results for the first six months of 2013 (continued) Shareholder equity at the Company decreased by $144,000 or 2.56% to $5.7 million on June 30, 2013 from $5.9 million on December 31, 2012. The Bank’s equity position increased $256,000 to $11.3 million as of June 30, 2013. Tier I Leverage Capital and Total Risk Based Capital at the Bank were 5.2% and 9.47%, respectively, as of June 30, 2013 and 4.78% and 8.13% as of December 31, 2012. Both ratios are under the 8.5% and 11.5% required by the FDIC consent order. Refer to the Regulatory Agreements discussion on Page 2 of the prospectus for further discussion of the FDIC consent order. CIB/TCBOL Financial Overview
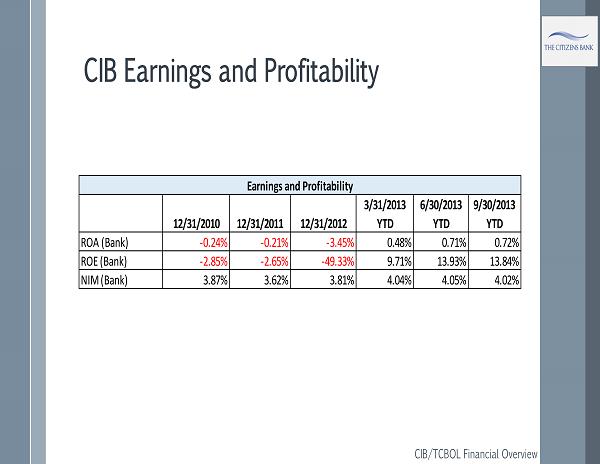
CIB Earnings and Profitability 12/31/2010 12/31/2011 12/31/2012 3/31/2013 YTD 6/30/2013 YTD 9/30/2013 YTD ROA (Bank) -0.24% -0.21% -3.45% 0.48% 0.71% 0.72% ROE (Bank) -2.85% -2.65% -49.33% 9.71% 13.93% 13.84% NIM (Bank) 3.87% 3.62% 3.81% 4.04% 4.05% 4.02% Earnings and Profitability CIB/TCBOL Financial Overview
Credit Quality Management In - market lending No loan production offices outside of footprint Conservative underwriting standards Improved lender expertise Cash flow lender Use of guarantors Maintain up to date current financial/ collateral data Audit Committee assures on - going monitoring Management and Board review risk management reports monthly Make risk grade changes as needed Credit administration infrastructure active throughout the loan process Utilize outside credit analysts with specific industry specialization for financial performance criteria and collateral evaluations for sophisticated large loan requests CIB/TCBOL Financial Overview
I. Offering Considerations II. Historical Overview III. CIB/TCBOL Financial Overview IV. Peer Analysis V. Moving Forward: S ensible S olutions = S uccess
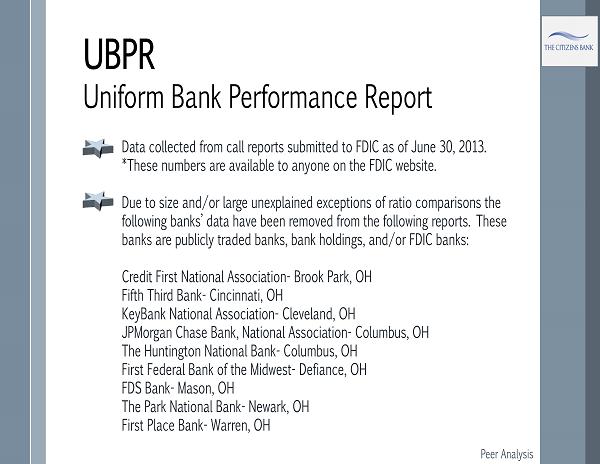
Peer Analysis UBPR Uniform Bank Performance Report Data collected from call reports submitted to FDIC as of June 30, 2013. *These numbers are available to anyone on the FDIC website. Due to size and/or large unexplained exceptions of ratio comparisons the following banks’ data have been removed from the following reports. These banks are publicly traded banks, bank holdings, and/or FDIC banks: Credit First National Association - Brook Park, OH Fifth Third Bank - Cincinnati, OH KeyBank National Association - Cleveland, OH JPMorgan Chase Bank, National Association - Columbus, OH The Huntington National Bank - Columbus, OH First Federal Bank of the Midwest - Defiance, OH FDS Bank - Mason, OH The Park National Bank - Newark, OH First Place Bank - Warren, OH
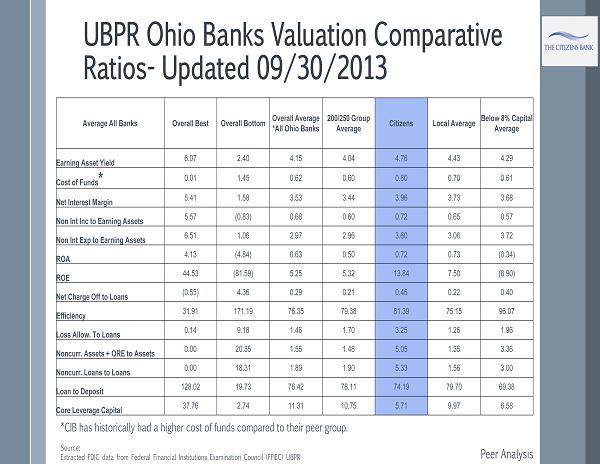
UBPR Ohio Banks Valuation Comparative Ratios - Updated 09/30/2013 Peer Analysis Average All Banks Overall Best Overall Bottom Overall Average *All Ohio Banks 200/250 Group Average Citizens Local Average Below 8% Capital Average Earning Asset Yield 6.07 2.40 4.15 4.04 4.76 4.43 4.29 Cost of Funds * 0.01 1.45 0.62 0.60 0.80 0.70 0.61 Net Interest Margin 5.41 1.58 3.53 3.44 3.96 3.73 3.68 Non Int Inc to Earning Assets 5.57 (0.83) 0.68 0.60 0.72 0.65 0.57 Non Int Exp to Earning Assets 6.51 1.06 2.97 2.96 3.60 3.06 3.72 ROA 4.13 (4.84) 0.63 0.50 0.72 0.73 (0.34) ROE 44.53 (81.59) 5.25 5.32 13.84 7.50 (8.90) Net Charge Off to Loans (0.55) 4.36 0.29 0.21 0.45 0.22 0.40 Efficiency 31.91 171.19 76.35 79.38 81.39 75.15 96.07 Loss Allow. To Loans 0.14 9.18 1.46 1.70 3.25 1.26 1.96 Noncurr. Assets + ORE to Assets 0.00 20.35 1.55 1.48 5.05 1.35 3.36 Noncurr. Loans to Loans 0.00 18.31 1.89 1.90 5.33 1.56 3.00 Loan to Deposit 128.02 19.73 76.42 78.11 74.19 79.70 69.38 Core Leverage Capital 37.76 2.74 11.31 10.75 5.71 9.97 6.58 *CIB has historically had a higher cost of funds compared to their peer group. Source: Extracted FDIC data from Federal Financial Institutions Examination Council (FFIEC) UBPR
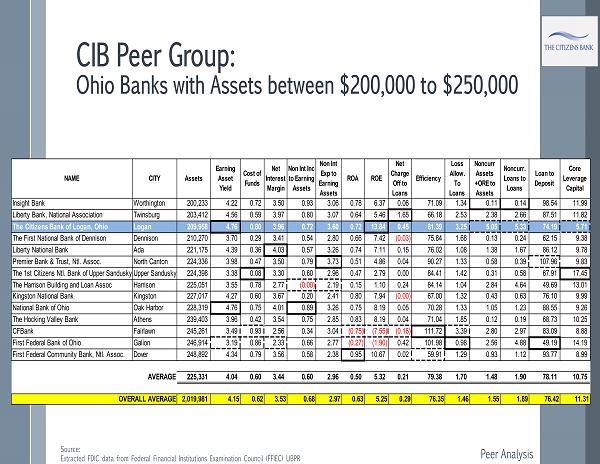
CIB Peer Group: Ohio Banks with Assets between $200,000 to $250,000 Peer Analysis Source: Extracted FDIC data from Federal Financial Institutions Examination Council (FFIEC) UBPR NAME CITY Assets Earning Asset Yield Cost of Funds Net Interest Margin Non Int Inc to Earning Assets Non Int Exp to Earning Assets ROA ROE Net Charge Off to Loans Efficiency Loss Allow. To Loans Noncurr Assets +ORE to Assets Noncurr. Loans to Loans Loan to Deposit Core Leverage Capital Insight Bank Worthington 200,233 4.22 0.72 3.50 0.93 3.06 0.78 6.37 0.06 71.09 1.34 0.11 0.14 98.54 11.99 Liberty Bank, National Association Twinsburg 203,412 4.56 0.59 3.97 0.80 3.07 0.64 5.46 1.65 66.18 2.53 2.38 2.66 87.51 11.82 The Citizens Bank of Logan, Ohio Logan 209,958 4.76 0.80 3.96 0.72 3.60 0.72 13.84 0.45 81.39 3.25 5.05 5.33 74.19 5.71 The First National Bank of Dennison Dennison 210,270 3.70 0.29 3.41 0.54 2.80 0.66 7.42 (0.03) 75.84 1.68 0.13 0.24 62.15 9.38 Liberty National Bank Ada 221,175 4.39 0.36 4.03 0.57 3.26 0.74 7.11 0.15 76.02 1.08 1.38 1.67 86.12 9.78 Premier Bank & Trust, Ntl. Assoc. North Canton 224,336 3.98 0.47 3.50 0.79 3.73 0.51 4.86 0.04 90.27 1.33 0.58 0.39 107.96 9.83 The 1st Citizens Ntl. Bank of Upper SanduskyUpper Sandusky 224,398 3.38 0.08 3.30 0.60 2.96 0.47 2.79 0.00 84.41 1.42 0.31 0.58 67.91 17.45 The Harrison Building and Loan Assoc Harrison 225,051 3.55 0.78 2.77 (0.00) 2.19 0.15 1.10 0.24 84.14 1.04 2.84 4.64 49.69 13.01 Kingston National Bank Kingston 227,017 4.27 0.60 3.67 0.20 2.41 0.80 7.94 (0.00) 67.00 1.32 0.43 0.63 76.10 9.99 National Bank of Ohio Oak Harbor 228,319 4.76 0.75 4.01 0.89 3.26 0.75 8.19 0.05 70.28 1.33 1.05 1.23 88.55 9.26 The Hocking Valley Bank Athens 239,403 3.96 0.42 3.54 0.75 2.85 0.83 8.19 0.04 71.04 1.85 0.12 0.19 68.73 10.25 CFBank Fairlawn 245,261 3.49 0.93 2.56 0.34 3.04 (0.75) (7.55) (0.16) 111.72 3.39 2.80 2.97 83.09 8.88 First Federal Bank of Ohio Galion 246,914 3.19 0.86 2.33 0.66 2.77 (0.27) (1.90) 0.42 101.98 0.98 2.56 4.88 49.19 14.19 First Federal Community Bank, Ntl. Assoc. Dover 248,892 4.34 0.79 3.56 0.58 2.38 0.95 10.67 0.02 59.91 1.29 0.93 1.12 93.77 8.99 225,331 4.04 0.60 3.44 0.60 2.96 0.50 5.32 0.21 79.38 1.70 1.48 1.90 78.11 10.75 2,019,981 4.15 0.62 3.53 0.68 2.97 0.63 5.25 0.29 76.35 1.46 1.55 1.89 76.42 11.31OVERALL AVERAGE AVERAGE
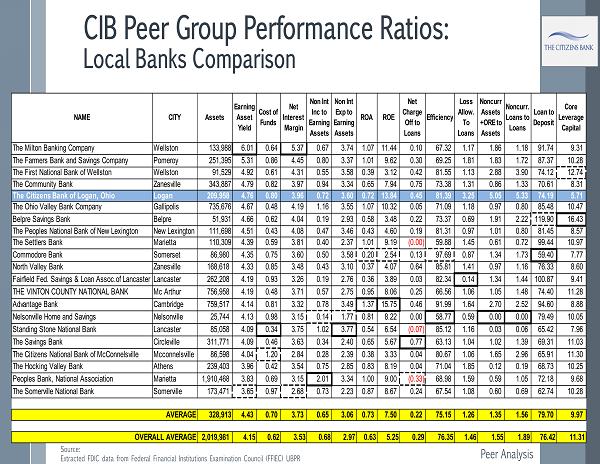
CIB Peer Group Performance Ratios: Local Banks Comparison Peer Analysis NAME CITY Assets Earning Asset Yield Cost of Funds Net Interest Margin Non Int Inc to Earning Assets Non Int Exp to Earning Assets ROA ROE Net Charge Off to Loans Efficiency Loss Allow. To Loans Noncurr Assets +ORE to Assets Noncurr. Loans to Loans Loan to Deposit Core Leverage Capital The Milton Banking Company Wellston 133,988 6.01 0.64 5.37 0.67 3.74 1.07 11.44 0.10 67.32 1.17 1.86 1.18 91.74 9.31 The Farmers Bank and Savings Company Pomeroy 251,395 5.31 0.86 4.45 0.80 3.37 1.01 9.62 0.30 69.25 1.81 1.83 1.72 87.37 10.28 The First National Bank of Wellston Wellston 91,529 4.92 0.61 4.31 0.55 3.58 0.39 3.12 0.42 81.55 1.13 2.88 3.90 74.12 12.74 The Community Bank Zanesville 343,887 4.79 0.82 3.97 0.94 3.34 0.65 7.94 0.75 73.38 1.31 0.86 1.33 70.61 8.31 The Citizens Bank of Logan, Ohio Logan 209,958 4.76 0.80 3.96 0.72 3.60 0.72 13.84 0.45 81.39 3.25 5.05 5.33 74.19 5.71 The Ohio Valley Bank Company Gallipolis 735,676 4.67 0.48 4.19 1.16 3.55 1.07 10.32 0.05 71.09 1.18 0.97 0.80 85.48 10.47 Belpre Savings Bank Belpre 51,931 4.66 0.62 4.04 0.19 2.93 0.58 3.48 0.22 73.37 0.69 1.91 2.22 119.90 16.43 The Peoples National Bank of New Lexington New Lexington 111,698 4.51 0.43 4.08 0.47 3.46 0.43 4.60 0.19 81.31 0.97 1.01 0.80 81.45 8.57 The Settlers Bank Marietta 110,309 4.39 0.59 3.81 0.40 2.37 1.01 9.19 (0.00) 59.88 1.45 0.61 0.72 99.44 10.97 Commodore Bank Somerset 86,980 4.35 0.75 3.60 0.50 3.58 0.20 2.54 0.13 97.69 0.87 1.34 1.73 59.40 7.77 North Valley Bank Zanesville 168,618 4.33 0.85 3.48 0.43 3.10 0.37 4.07 0.64 85.81 1.41 0.97 1.16 76.33 8.60 Fairfield Fed. Savings & Loan Assoc.of Lancaster Lancaster 262,208 4.19 0.93 3.26 0.19 2.76 0.36 3.89 0.03 82.34 0.14 1.34 1.44 100.87 9.41 THE VINTON COUNTY NATIONAL BANK Mc Arthur 756,958 4.19 0.48 3.71 0.57 2.75 0.95 8.06 0.25 66.56 1.06 1.05 1.48 74.40 11.28 Advantage Bank Cambridge 759,517 4.14 0.81 3.32 0.78 3.49 1.37 15.75 0.46 91.99 1.64 2.70 2.52 94.60 8.88 Nelsonville Home and Savings Nelsonville 25,744 4.13 0.98 3.15 0.14 1.77 0.81 8.22 0.00 58.77 0.59 0.00 0.00 79.49 10.05 Standing Stone National Bank Lancaster 85,058 4.09 0.34 3.75 1.02 3.77 0.54 6.54 (0.07) 85.12 1.16 0.03 0.06 65.42 7.96 The Savings Bank Circleville 311,771 4.09 0.46 3.63 0.34 2.40 0.65 5.67 0.77 63.13 1.04 1.02 1.39 69.31 11.03 The Citizens National Bank of McConnelsville Mcconnelsville 86,598 4.04 1.20 2.84 0.28 2.39 0.38 3.33 0.04 80.67 1.06 1.65 2.96 65.91 11.30 The Hocking Valley Bank Athens 239,403 3.96 0.42 3.54 0.75 2.85 0.83 8.19 0.04 71.04 1.85 0.12 0.19 68.73 10.25 Peoples Bank, National Association Marietta 1,910,468 3.83 0.69 3.15 2.01 3.34 1.00 9.00 (0.33) 68.98 1.59 0.59 1.05 72.18 9.68 The Somerville National Bank Somerville 173,471 3.65 0.97 2.68 0.73 2.23 0.87 8.67 0.24 67.54 1.08 0.60 0.69 62.74 10.28 328,913 4.43 0.70 3.73 0.65 3.06 0.73 7.50 0.22 75.15 1.26 1.35 1.56 79.70 9.97 2,019,981 4.15 0.62 3.53 0.68 2.97 0.63 5.25 0.29 76.35 1.46 1.55 1.89 76.42 11.31OVERALL AVERAGE AVERAGE Source: Extracted FDIC data from Federal Financial Institutions Examination Council (FFIEC) UBPR
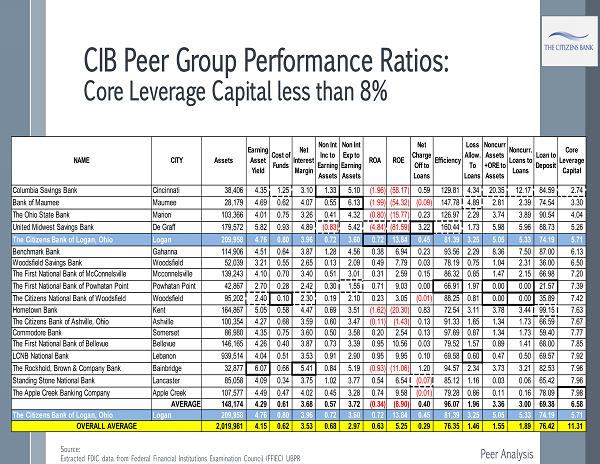
CIB Peer Group Performance Ratios: Core Leverage Capital less than 8% Peer Analysis NAME CITY Assets Earning Asset Yield Cost of Funds Net Interest Margin Non Int Inc to Earning Assets Non Int Exp to Earning Assets ROA ROE Net Charge Off to Loans Efficiency Loss Allow. To Loans Noncurr Assets +ORE to Assets Noncurr. Loans to Loans Loan to Deposit Core Leverage Capital Columbia Savings Bank Cincinnati 38,406 4.35 1.25 3.10 1.33 5.10 (1.96) (58.17) 0.59 129.81 4.34 20.35 12.17 84.59 2.74 Bank of Maumee Maumee 28,179 4.69 0.62 4.07 0.55 6.13 (1.99) (54.32) (0.09) 147.78 4.89 2.81 2.39 74.54 3.30 The Ohio State Bank Marion 103,366 4.01 0.75 3.26 0.41 4.32 (0.80) (15.77) 0.23 126.97 2.29 3.74 3.89 90.54 4.04 United Midwest Savings Bank De Graff 179,572 5.82 0.93 4.89 (0.83) 5.42 (4.84) (81.59) 3.22 160.44 1.73 5.98 5.96 88.73 5.26 The Citizens Bank of Logan, Ohio Logan 209,958 4.76 0.80 3.96 0.72 3.60 0.72 13.84 0.45 81.39 3.25 5.05 5.33 74.19 5.71 Benchmark Bank Gahanna 114,906 4.51 0.64 3.87 1.28 4.56 0.38 6.94 0.23 93.56 2.29 8.36 7.50 87.00 6.13 Woodsfield Savings Bank Woodsfield 52,039 3.21 0.55 2.65 0.13 2.09 0.49 7.79 0.03 78.19 0.75 1.04 2.31 36.00 6.50 The First National Bank of McConnelsville Mcconnelsville 139,243 4.10 0.70 3.40 0.51 3.01 0.31 2.59 0.15 86.32 0.85 1.47 2.15 66.98 7.20 The First National Bank of Powhatan Point Powhatan Point 42,867 2.70 0.28 2.42 0.30 1.55 0.71 9.03 0.00 66.91 1.97 0.00 0.00 21.57 7.39 The Citizens National Bank of Woodsfield Woodsfield 95,202 2.40 0.10 2.30 0.19 2.10 0.23 3.05 (0.01) 88.25 0.81 0.00 0.00 35.89 7.42 Hometown Bank Kent 164,867 5.05 0.58 4.47 0.69 3.51 (1.62) (20.30) 0.83 72.54 3.11 3.78 3.44 99.15 7.63 The Citizens Bank of Ashville, Ohio Ashville 100,354 4.27 0.68 3.59 0.60 3.47 (0.11) (1.43) 0.13 91.33 1.65 1.34 1.73 66.59 7.67 Commodore Bank Somerset 86,980 4.35 0.75 3.60 0.50 3.58 0.20 2.54 0.13 97.69 0.87 1.34 1.73 59.40 7.77 The First National Bank of Bellevue Bellevue 146,165 4.26 0.40 3.87 0.73 3.39 0.95 10.56 0.03 79.52 1.57 0.89 1.41 68.00 7.85 LCNB National Bank Lebanon 939,514 4.04 0.51 3.53 0.91 2.90 0.95 9.95 0.10 69.58 0.60 0.47 0.50 69.57 7.92 The Rockhold, Brown & Company Bank Bainbridge 32,877 6.07 0.66 5.41 0.84 5.19 (0.93) (11.06) 1.20 94.57 2.34 3.73 3.21 82.53 7.96 Standing Stone National Bank Lancaster 85,058 4.09 0.34 3.75 1.02 3.77 0.54 6.54 (0.07) 85.12 1.16 0.03 0.06 65.42 7.96 The Apple Creek Banking Company Apple Creek 107,577 4.49 0.47 4.02 0.45 3.28 0.74 9.58 (0.01) 79.28 0.86 0.11 0.16 78.09 7.98 AVERAGE 148,174 4.29 0.61 3.68 0.57 3.72 (0.34) (8.90) 0.40 96.07 1.96 3.36 3.00 69.38 6.58 The Citizens Bank of Logan, Ohio Logan 209,958 4.76 0.80 3.96 0.72 3.60 0.72 13.84 0.45 81.39 3.25 5.05 5.33 74.19 5.71 2,019,981 4.15 0.62 3.53 0.68 2.97 0.63 5.25 0.29 76.35 1.46 1.55 1.89 76.42 11.31OVERALL AVERAGE Source: Extracted FDIC data from Federal Financial Institutions Examination Council (FFIEC) UBPR
I. Offering Considerations II. Historical Overview III. CIB/TCBOL Financial Overview IV. Peer Analysis V. Moving Forward: S ensible S olutions = S uccess
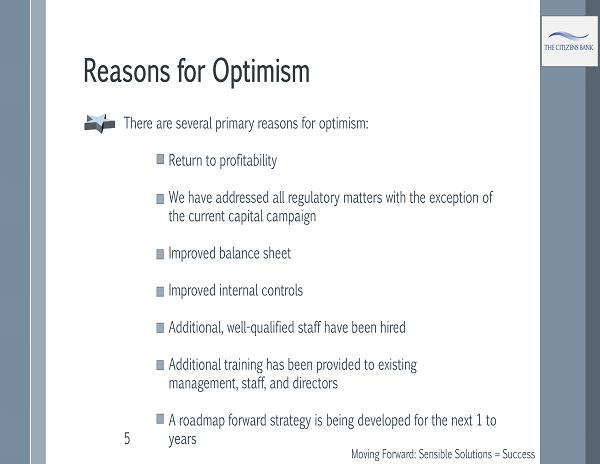
Reasons for Optimism Moving Forward: Sensible Solutions = Success There are several primary reasons for optimism: Return to profitability We have addressed all regulatory matters with the exception of the current capital campaign Improved balance sheet Improved internal controls Additional, well - qualified staff have been hired Additional training has been provided to existing management, staff, and directors A roadmap forward strategy is being developed for the next 1 to 5 years
Other Reasons for Optimism Moving Forward: Sensible Solutions = Success We have a strong customer service focus Good competitive product structure Improved efficiency Board of Directors that both support and monitor management strategies Renewed focus on retail banking and cross selling ALLL models: Improved to include environmental reserve, conservative specific reserves, and more granular general reserve model
Other Reasons for Optimism (continued) There will be no short cuts to our S ensible S olutions = S uccess. Inaction is a decision that we will not tolerate. Our focus will be above peer average ROE, conservative loan growth, and improved efficiency. We have undertaken an honest assessment of our long - term future. Our focus will be to take necessary risks to continue to allow the bank to grow and move forward. Restore capital to regulatory levels sooner rather than later. Moving Forward: Sensible Solutions = Success
Recent Developments: Moving Forward/Keys to Success Operate in thriving communities and staying active in our market footprint. Practice forward S ensible S olutions = S uccess Implemented risk management processes focusing on long - term positive performance objectives that ensures attractive return on investments for shareholders. Emphasis on high reliance of a core deposit base. Conservative underwriting: Underwriting is now centralized and independent. Moving Forward: Sensible Solutions = Success
Recent Developments: Moving Forward/Keys to Success Updated credit policies and refined underwriting to include stronger controls. Emphasis on relationship banking/cross selling initiatives Avoid opportunities of which we do not have expertise Acknowledge and tackle problems swiftly and with transparency Diversified balance sheet and business opportunities that fit the TCBOL’s expertise. Moving Forward: Sensible Solutions = Success
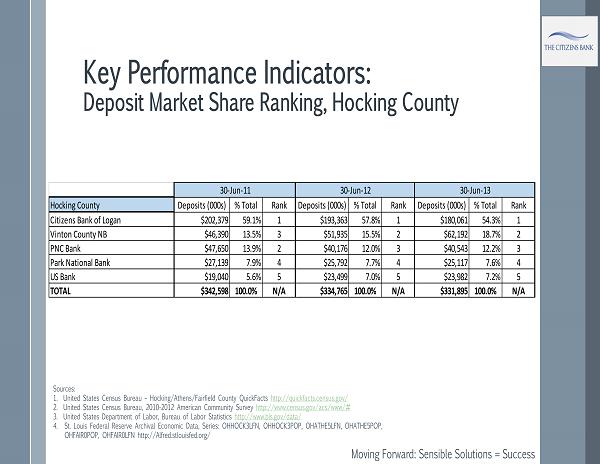
Key Performance Indicators: Deposit Market Share Ranking, Hocking County Hocking County Deposits (000s) % Total Rank Deposits (000s) % Total Rank Deposits (000s) % Total Rank Citizens Bank of Logan $202,379 59.1% 1 $193,363 57.8% 1 $180,061 54.3% 1 Vinton County NB $46,390 13.5% 3 $51,935 15.5% 2 $62,192 18.7% 2 PNC Bank $47,650 13.9% 2 $40,176 12.0% 3 $40,543 12.2% 3 Park National Bank $27,139 7.9% 4 $25,792 7.7% 4 $25,117 7.6% 4 US Bank $19,040 5.6% 5 $23,499 7.0% 5 $23,982 7.2% 5 TOTAL $342,598 100.0% N/A $334,765 100.0% N/A $331,895 100.0% N/A 30-Jun-11 30-Jun-12 30-Jun-13 Moving Forward: Sensible Solutions = Success Sources: 1. United States Census Bureau – Hocking/Athens/Fairfield County QuickFacts http://quickfacts.census.gov/ 2. United States Census Bureau, 2010 - 2012 American Community Survey http://www.census.gov/acs/www/# 3. United States Department of Labor, Bureau of Labor Statistics http://www.bls.gov/data/ 4. St. Louis Federal Reserve Archival Economic Data, Series: OHHOCK3LFN, OHHOCK3POP, OHATHE5LFN, OHATHE5POP, OHFAIR0POP, OHFAIR0LFN http://Alfred.stlouisfed.org/
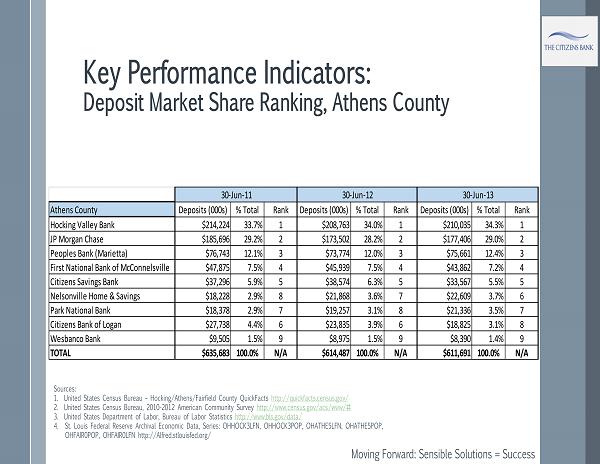
Key Performance Indicators: Deposit Market Share Ranking, Athens County Moving Forward: Sensible Solutions = Success Athens County Deposits (000s) % Total Rank Deposits (000s) % Total Rank Deposits (000s) % Total Rank Hocking Valley Bank $214,224 33.7% 1 $208,763 34.0% 1 $210,035 34.3% 1 JP Morgan Chase $185,696 29.2% 2 $173,502 28.2% 2 $177,406 29.0% 2 Peoples Bank (Marietta) $76,743 12.1% 3 $73,774 12.0% 3 $75,661 12.4% 3 First National Bank of McConnelsville $47,875 7.5% 4 $45,939 7.5% 4 $43,862 7.2% 4 Citizens Savings Bank $37,296 5.9% 5 $38,574 6.3% 5 $33,567 5.5% 5 Nelsonville Home & Savings $18,228 2.9% 8 $21,868 3.6% 7 $22,609 3.7% 6 Park National Bank $18,378 2.9% 7 $19,257 3.1% 8 $21,336 3.5% 7 Citizens Bank of Logan $27,738 4.4% 6 $23,835 3.9% 6 $18,825 3.1% 8 Wesbanco Bank $9,505 1.5% 9 $8,975 1.5% 9 $8,390 1.4% 9 TOTAL $635,683 100.0% N/A $614,487 100.0% N/A $611,691 100.0% N/A 30-Jun-11 30-Jun-12 30-Jun-13 Sources: 1. United States Census Bureau – Hocking/Athens/Fairfield County QuickFacts http://quickfacts.census.gov/ 2. United States Census Bureau, 2010 - 2012 American Community Survey http://www.census.gov/acs/www/# 3. United States Department of Labor, Bureau of Labor Statistics http://www.bls.gov/data/ 4. St. Louis Federal Reserve Archival Economic Data, Series: OHHOCK3LFN, OHHOCK3POP, OHATHE5LFN, OHATHE5POP, OHFAIR0POP, OHFAIR0LFN http://Alfred.stlouisfed.org/
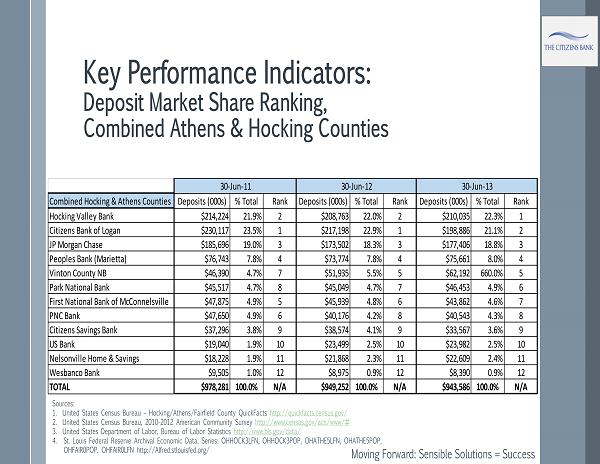
Key Performance Indicators: Deposit Market Share Ranking, Combined Athens & Hocking Counties Moving Forward: Sensible Solutions = Success Combined Hocking & Athens Counties Deposits (000s) % Total Rank Deposits (000s) % Total Rank Deposits (000s) % Total Rank Hocking Valley Bank $214,224 21.9% 2 $208,763 22.0% 2 $210,035 22.3% 1 Citizens Bank of Logan $230,117 23.5% 1 $217,198 22.9% 1 $198,886 21.1% 2 JP Morgan Chase $185,696 19.0% 3 $173,502 18.3% 3 $177,406 18.8% 3 Peoples Bank (Marietta) $76,743 7.8% 4 $73,774 7.8% 4 $75,661 8.0% 4 Vinton County NB $46,390 4.7% 7 $51,935 5.5% 5 $62,192 660.0% 5 Park National Bank $45,517 4.7% 8 $45,049 4.7% 7 $46,453 4.9% 6 First National Bank of McConnelsville $47,875 4.9% 5 $45,939 4.8% 6 $43,862 4.6% 7 PNC Bank $47,650 4.9% 6 $40,176 4.2% 8 $40,543 4.3% 8 Citizens Savings Bank $37,296 3.8% 9 $38,574 4.1% 9 $33,567 3.6% 9 US Bank $19,040 1.9% 10 $23,499 2.5% 10 $23,982 2.5% 10 Nelsonville Home & Savings $18,228 1.9% 11 $21,868 2.3% 11 $22,609 2.4% 11 Wesbanco Bank $9,505 1.0% 12 $8,975 0.9% 12 $8,390 0.9% 12 TOTAL $978,281 100.0% N/A $949,252 100.0% N/A $943,586 100.0% N/A 30-Jun-11 30-Jun-12 30-Jun-13 Sources: 1. United States Census Bureau – Hocking/Athens/Fairfield County QuickFacts http://quickfacts.census.gov/ 2. United States Census Bureau, 2010 - 2012 American Community Survey http://www.census.gov/acs/www/# 3. United States Department of Labor, Bureau of Labor Statistics http://www.bls.gov/data/ 4. St. Louis Federal Reserve Archival Economic Data, Series: OHHOCK3LFN, OHHOCK3POP, OHATHE5LFN, OHATHE5POP, OHFAIR0POP, OHFAIR0LFN http://Alfred.stlouisfed.org/
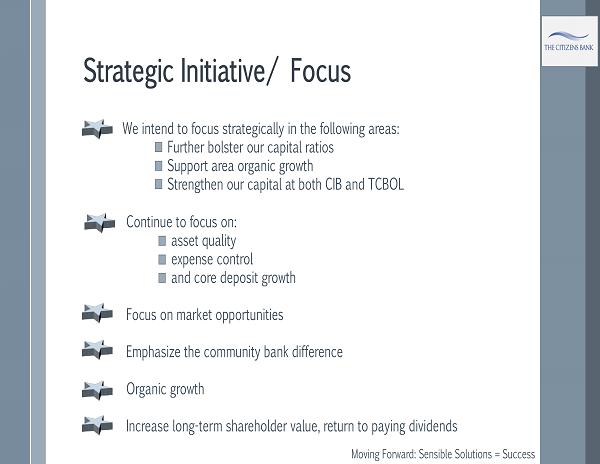
Strategic Initiative/ Focus We intend to focus strategically in the following areas: Further bolster our capital ratios Support area organic growth Strengthen our capital at both CIB and TCBOL Continue to focus on: asset quality expense control and core deposit growth Focus on market opportunities Emphasize the community bank difference Organic growth Increase long - term shareholder value, return to paying dividends Moving Forward: Sensible Solutions = Success
Strategic Opportunities Operate in a growing, recession resistant market Leverage our existing strong community bank reputation. Personal, caring, high - quality customer service with the addition of sophisticated products, services, and delivery system Provide strong alternatives in our market area to the deteriorating reputation of the big banks (impersonal, fee oriented, greed motivation) Deeper penetration into existing market in small business lending, residential/ consumer lending, private client services, personal banking and cross selling opportunities Expand organic loan deposit growth and growth in our contiguous markets: Athens, Meigs, Fairfield, Vinton, and Perry Counties Moving Forward: Sensible Solutions = Success
Why invest in Citizens Bank? A return to profitability Increased momentum in local markets Strong new loan pipeline Newly energized and experienced management team and employees A reduction of classified assets Senior level human infrastructure has been totally rebuilt More attractive and balanced loan and deposit mix Moving Forward: Sensible Solutions = Success
Contact Information Citizens Independent Bancorp Inc./ The Citizens Bank of Logan To request additional information, please contact Donald P. Wood 740 - 589 - 3601 don.wood@tcbol.com
Moving Forward… Sensible Solutions Success
Moving Forward… Sensible Solutions Success
Moving Forward… Sensible Solutions Success
Moving Forward… Sensible Solutions Success
Moving Forward… Sensible Solutions Success
Moving Forward… Sensible Solutions Success
Moving Forward… Sensible Solutions Success
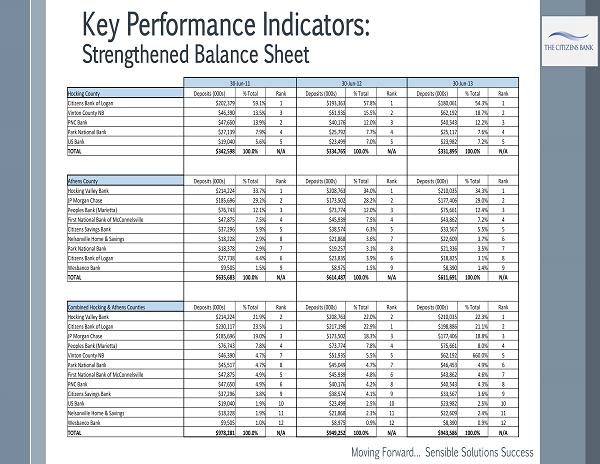
Key Performance Indicators: Strengthened Balance Sheet 30 - Jun - 11 30 - Jun - 12 30 - Jun - 13 Hocking County Deposits (000s) % Total Rank Deposits (000s) % Total Rank Deposits (000s) % Total Rank Citizens Bank of Logan $202,379 59.1% 1 $193,363 57.8% 1 $180,061 54.3% 1 Vinton County NB $46,390 13.5% 3 $51,935 15.5% 2 $62,192 18.7% 2 PNC Bank $47,650 13.9% 2 $40,176 12.0% 3 $40,543 12.2% 3 Park National Bank $27,139 7.9% 4 $25,792 7.7% 4 $25,117 7.6% 4 US Bank $19,040 5.6% 5 $23,499 7.0% 5 $23,982 7.2% 5 TOTAL $342,598 100.0% N/A $334,765 100.0% N/A $331,895 100.0% N/A Athens County Deposits (000s) % Total Rank Deposits (000s) % Total Rank Deposits (000s) % Total Rank Hocking Valley Bank $214,224 33.7% 1 $208,763 34.0% 1 $210,035 34.3% 1 JP Morgan Chase $185,696 29.2% 2 $173,502 28.2% 2 $177,406 29.0% 2 Peoples Bank (Marietta) $76,743 12.1% 3 $73,774 12.0% 3 $75,661 12.4% 3 First National Bank of McConnelsville $47,875 7.5% 4 $45,939 7.5% 4 $43,862 7.2% 4 Citizens Savings Bank $37,296 5.9% 5 $38,574 6.3% 5 $33,567 5.5% 5 Nelsonville Home & Savings $18,228 2.9% 8 $21,868 3.6% 7 $22,609 3.7% 6 Park National Bank $18,378 2.9% 7 $19,257 3.1% 8 $21,336 3.5% 7 Citizens Bank of Logan $27,738 4.4% 6 $23,835 3.9% 6 $18,825 3.1% 8 Wesbanco Bank $9,505 1.5% 9 $8,975 1.5% 9 $8,390 1.4% 9 TOTAL $635,683 100.0% N/A $614,487 100.0% N/A $611,691 100.0% N/A Combined Hocking & Athens Counties Deposits (000s) % Total Rank Deposits (000s) % Total Rank Deposits (000s) % Total Rank Hocking Valley Bank $214,224 21.9% 2 $208,763 22.0% 2 $210,035 22.3% 1 Citizens Bank of Logan $230,117 23.5% 1 $217,198 22.9% 1 $198,886 21.1% 2 JP Morgan Chase $185,696 19.0% 3 $173,502 18.3% 3 $177,406 18.8% 3 Peoples Bank (Marietta) $76,743 7.8% 4 $73,774 7.8% 4 $75,661 8.0% 4 Vinton County NB $46,390 4.7% 7 $51,935 5.5% 5 $62,192 660.0% 5 Park National Bank $45,517 4.7% 8 $45,049 4.7% 7 $46,453 4.9% 6 First National Bank of McConnelsville $47,875 4.9% 5 $45,939 4.8% 6 $43,862 4.6% 7 PNC Bank $47,650 4.9% 6 $40,176 4.2% 8 $40,543 4.3% 8 Citizens Savings Bank $37,296 3.8% 9 $38,574 4.1% 9 $33,567 3.6% 9 US Bank $19,040 1.9% 10 $23,499 2.5% 10 $23,982 2.5% 10 Nelsonville Home & Savings $18,228 1.9% 11 $21,868 2.3% 11 $22,609 2.4% 11 Wesbanco Bank $9,505 1.0% 12 $8,975 0.9% 12 $8,390 0.9% 12 TOTAL $978,281 100.0% N/A $949,252 100.0% N/A $943,586 100.0% N/A Moving Forward… Sensible Solutions Success
Two Content Layout with Table Group A Group B Class 1 82 95 Class 2 76 88 Class 3 84 90 › First bullet point here › Second bullet point here › Third bullet point here
Two Content Layout with Table › First bullet point here › Second bullet point here › Third bullet point here A • Task 1 • Task 2 B • Task 1 • Task 2 C • Task 1
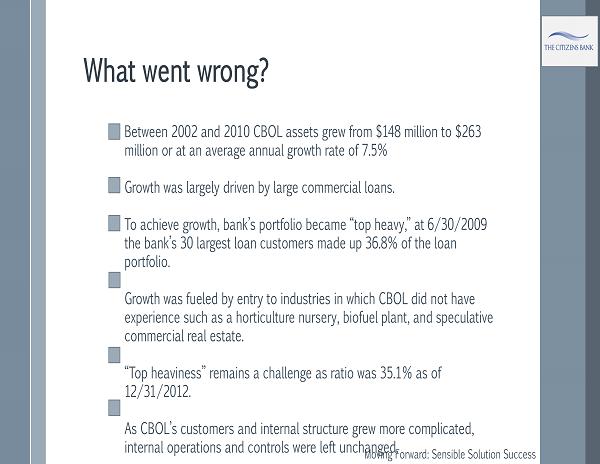
What went wrong? Moving Forward: Sensible Solution Success Between 2002 and 2010 CBOL assets grew from $148 million to $263 million or at an average annual growth rate of 7.5% Growth was largely driven by large commercial loans. To achieve growth, bank’s portfolio became “top heavy,” at 6/30/2009 the bank’s 30 largest loan customers made up 36.8% of the loan portfolio. Growth was fueled by entry to industries in which CBOL did not have experience such as a horticulture nursery, biofuel plant, and speculative commercial real estate. “Top heaviness” remains a challenge as ratio was 35.1% as of 12/31/2012. As CBOL’s customers and internal structure grew more complicated, internal operations and controls were left unchanged.
Strategy 2014+: Committed to Delivery Moving Forward… Sensible Solutions Success Strong underlying historical performance enabled us to embark upon a path of deliberate but tough decisions We are convinced that this path will lead us in the right direction - becoming the community’s leading client - centric bank This is a journey that we will complete in years, not months Together, we are determined and encouraged by initial results and the highly supportive feedback from clients and employees.