UNITED STATES
SECURITIES AND EXCHANGE COMMISSION
Washington, D.C. 20549
FORM N-CSRS
CERTIFIED SHAREHOLDER REPORT OF REGISTERED
MANAGEMENT INVESTMENT COMPANIES
Investment Company Act file number 811-22725
Priority Income Fund, Inc.
(Exact name of registrant as specified in charter)
10 East 40th Street, 42nd Floor
New York, NY 10016
(Address of principal executive offices)
M. Grier Eliasek
Chief Executive Officer
Priority Income Fund, Inc.
10 East 40th Street, 42nd Floor
New York, NY 10016
(Name and address of agent for service)
Registrant’s telephone number, including area code: (212) 448-0702
Date of fiscal year end: June 30
Date of reporting period: December 31, 2014
Item 1. Report to Shareholders.
The semi-annual report to shareholders for the six months ended December 31, 2014 is filed herewith pursuant to Rule 30e-1 under the Investment Company Act of 1940, as amended.
Semi-annual Report
December 31, 2014
priority-incomefund.com
Priority Income Fund, Inc. (the “Company”) is an externally managed, non-diversified, closed-end management investment company registered under the Investment Company Act of 1940, as amended. The Company has elected to be treated for tax purposes as a regulated investment company under Subchapter M of the Internal Revenue Code of 1986, as amended.
INVESTMENT OBJECTIVE
The Company’s investment objective is to generate current income and, as a secondary objective, long-term capital appreciation. We expect to seek to achieve our investment objective by investing, under normal circumstances, in senior secured loans made to companies whose debt is rated below investment grade or, in limited circumstances, unrated, which we collectively refer to as “Senior Secured Loans,” with an emphasis on current income. Our investments may take the form of the purchase of Senior Secured Loans (either in the primary or secondary markets) or through investments in the equity and junior debt tranches of collateralized loan obligation (“CLO”) vehicles that in turn own pools of Senior Secured Loans. The Company intends to invest in both the primary and secondary markets.
TABLE OF CONTENTS
|
| |
| |
| | |
| Investment Manager's Report | |
| |
| | |
| Index to Financial Statements | |
| |
| |
| |
| |
| |
| |
| | |
| |
| |
| |
2015 SEMI-ANNUAL REPORT
PRIORITY INCOME FUND, INC. 4
Letter to Shareholders
Dear Shareholders,
We are pleased to present this semi-annual report of Priority Income Fund, Inc. (“we,” “us,” “our,” the “Company” or “Priority”) for the six-months ended December 31, 2014. Priority has made regular distributions for the past eleven months and declared bonus distributions for the past three quarters. We continue to be optimistic about the Company's performance based on strategic investments that will continue to drive income and distributions.
Dividend Policy
As a regulated investment company, the Company is required to pay out distributions based upon taxable income, rather than accounting income. In general, we expect our annual taxable income to be higher than our reportable accounting income on the basis of actual cash received. Our dividend policy is based upon our estimate of our taxable income, which includes interest income from our underlying collateralized loan obligation ("CLO") equity investments as well as the recognition of certain mark-to-market gains to the extent that the fair market value of our CLO investments is determined to be in excess of its adjusted tax basis. Because of this, distributions may be greater than accounting income, as expressed by net investment income.
Market Commentary
In this semi-annual report, we collectively refer to "senior secured loans" as senior secured loans made to companies whose debt is rated below investment grade or, in limited circumstances, unrated. The senior secured loan and CLO markets continue to represent attractive areas for investment. There are a number of factors to support this view, including:
| |
| • | The most junior tranches of U.S. Cash Flow CLOs have delivered over 21% annual average yields since January 2003.1 |
| |
| • | We believe the continued moderate default environment provides a favorable backdrop to the historically strong cash flow performance of CLO income securities. While low current defaults are a positive indicator of credit performance, we are vigilant regarding market developments in terms of extensions of credit terms and structures. Credit quality has remained acceptable on a relative basis. Leverage is increasing, but generally not to the levels seen in the large leveraged buyouts of 2006-2007. Overall, the health of non-investment grade corporate borrowers continued to improve in 2014. Year-over-year earnings before interest, taxes, depreciation and amortization ("EBITDA") growth among issuers increased to 9.5% in the third quarter of 2014, up from 8.8% in the second quarter2. Cash flow coverage continues to be strong as well: the average ratio of EBITDA less capital expenditures to cash interest reached a record 3.44x in the third quarter from 3.36x in the second quarter and versus the lowest trough levels of 2007 of 1.6x.2 |
| |
| • | Retail demand for loans in the U.S. has declined, and the outflow from retail loan mutual funds has helped stabilize supply and demand. 2014 saw a major change in funds flows for retail loan mutual funds. While inflows continued in the first quarter of 2014, this trend reversed in April and the nine months since saw retail loan assets under management recede by some $31 billion as duration fatigue set in. Managers saw investors lose their appetite for loans as the 10-year Treasury yield fell steadily from a high of 3.04% at year-end 2013 to 2.17% at the end of 2014. The result of this shift to outflows meant CLOs grew their participation market share in the underlying loan market: CLOs represent 53% of the loan market in 2013, growing to 62% in 2014 while retail loan mutual funds market share shrank from 32% in 2013 to 22% in 2014.3 |
| |
| • | For CLO equity investors, the level of loan spreads is crucial to performance. CLO equity performance can decline due to extended periods of downward movement in loan spreads while CLO equity performance benefits from extended periods of loan spread expansion or high spreads relative to long-term historical levels. The year 2014 witnessed just such an expansion, especially in the latter half of the year. Single B new issue spreads finished 2014 at the highest levels in over two years and continued to rise in January 2015. This has begun to appear in CLO loan pools with most 2012-2014 vintage pools experiencing weighted average loan spread improvement in the final months |
2015 SEMI-ANNUAL REPORT
PRIORITY INCOME FUND, INC. 5
of 2014. Credit quality in these same loan pools also improved with median CCC assets seeing a decline in exposure in the final months of 2014 as well as an expansion of the junior most overcollateralization ratios in these same pools. The average yield-to-maturity on Senior Secured Loans increased from the lows in 2013 of 4.90% and 4.75% for primary and secondary loans to 6.00% and 5.91% as of December 31, 2014, respectively.3
| |
| • | Non-investment grade loan issuance for 2014 was $379 billion, a decline from $455 billion in 2013.3 Increased regulatory scrutiny of non-investment grade leveraged loans combined with retail mutual fund outflows significantly contributed to this year over year decline in new loan issuance. Overall the total leveraged loans outstanding balance reached a record level of $832 billion at the end of 2014.3 |
| |
| • | 2014 was a record setting year for new CLO issuance with $124 billion of new CLOs formed, a $41 billion increase over new issuance of $83 billion in 2013, result in an overall CLO market size of $380 billion.4 After factoring in CLO amortization and retirements, net issuance in 2014 was likely around $80 billion, according to analyst estimates compared to $150 billion of growth in the senior secured loan market. Over 100 CLO collateral managers issued new CLOs in 2014. We continue to focus our investments on a small group of less than two dozen collateral managers who meet our quality and track record criteria. As spreads on liabilities widened in 2014, increasing the financing costs for new CLOs, our team focused increasingly on opportunities in the secondary market for CLO equity. 2013 and, to some extent, 2012 vintage CLOs carry lower financing costs than 2014 new issue CLOs and are still benefiting from the increase in average loan spreads occurring in the course of 2014, resulting in a net increase in the “arbitrage” of those pools. Better relative value in the secondary market for CLO equity was also driven by regulatory driven forced selling. |
| |
| • | Default rates for senior secured loans continue to remain below the historical average in the United States. The market default rate ended 2014 at a nine-month low of 3.2% and less than one-third the peak market default rate of 10.7% in October 2009.3 The outlook for defaults in 2015 of approximately 1.6% continues to reflect positive economic performance of the underlying borrowers and a low level of maturities.5 Risks to this outlook include the recent default of a large borrower, Caesars Entertainment, which increased the market default rate to nearly 4%5 in January 2015, combined with recent concerns for oil and gas credits, which represent only 4.7% of all performing loans in the senior secured loan market5 and 4.3% average exposure in 2.0 CLOs,6 as oil prices plunged late in 2014. The portfolio of loans underlying the CLOs held by the Company currently consists of only 0.13% defaulted assets, substantially below the market rate of defaults. |
| |
| • | A primary credit concern is the exposure in the senior secured loan and CLO markets to oil and gas companies, which represented 4.7% of performing loans in the loan index and 17.0% of the overall U.S. speculative-grade debt market7 following the downturn of oil prices late in 2014 . We have performed and continue to perform extensive surveillance regarding our oil and gas sector exposures within our portfolio. We have discussed oil and gas exposures with our CLO managers. Our exposure to the Moody's designated oil and gas sector is approximately 4.32% representing 67 borrowers. Furthermore, oil and gas exposures require further sub-sector analysis. For example, in one of the Company's largest collateral manager exposures, while the manager's overall exposure to oil and gas is 3.06%, the manager's exposure to exploration, drilling and production (the sub-sectors most affected by low oil prices) is only 0.81% with the remaining exposure being the less affected segments of midstream and downstream. |
| |
| • | In October 2014, the U.S. government published the final regulations and implementation of the Dodd Frank Wall Street Reform and Consumer Protection Act for U.S. CLOs regarding risk retention. In general, the new rules will apply to all new CLOs issued after December 24, 2016 and require the CLO managers to own a minimum of 5% of each CLO they manage. We have long required CLO managers to have substantive "skin in the game"; nonetheless, we expect the market to begin to digest the impact of the forthcoming risk retention rules and various methods for compliance will begin to emerge. We believe we are well positioned with the top performing collateral managers who are likely to thrive in a post-risk retention environment. U.S. CLO issuance for 2015 is forecast by various industry analysts to be between $70 billion and $90 billion,8 with net issuance, after redemptions and amortizations, of between $20 billion and $50 billion.9 |
We believe that the senior secured loan market is well supported by the recovering U.S. economy, solid corporate fundamentals, increased demand for yield in an ultra-low interest rate environment and the continued health of the structured credit market.
Senior secured loans, which are primarily floating rate, should also perform well in a rising interest rate environment relative to other fixed income asset classes that are primarily fixed rate loans.
2015 SEMI-ANNUAL REPORT
PRIORITY INCOME FUND, INC. 6
Sincerely,
M. Grier Eliasek
Chief Executive Officer
This letter may contain certain forward-looking statements within the meaning of the Private Securities Litigation Reform Act
of 1995, including statements regarding the future performance of Priority Income Fund, Inc. Words such as “believes,” “expects,” and “future” or similar expressions are intended to identify forward-looking statements. Any such statements, other than statements of historical fact, are highly likely to be affected by unknowable future events and conditions, including elements of the future that are or are not under the control of Priority Income Fund, Inc., and that Priority Income Fund, Inc. may or may not have considered. Accordingly, such statements cannot be guarantees or assurances of any aspect of future performance. Actual developments and results may vary materially from any forward-looking statements. Such statements speak only as of the time when made. Priority Income Fund, Inc. undertakes no obligation to publicly update or revise any forward-looking statements, whether as a result of new information, future events or otherwise.
_____________________________________
1 Citigroup Global Markets Research.
2 S&P LCD - U.S. Loan Index Current Stats (3Q'14).
3 S&P LCD - Leveraged Lending Review 4Q14.
4 Wells Fargo Structured Products Research, The CLO Salmagundi: 2014 - The Year That Was, January 20, 2015.
5 LCD News, Loan default rate hits 6-month high in January in Caesars Ch. 11, February 2, 2015.
6 LCD News, CLO roundup: Supply continues amid concerns over oil, Vivarte, December 15, 2014.
7 LCD News, S&P: Low exposure to oil and gas bodes well for U.S. CLO ratings, December 17, 2014.
8 LCD News, Leveraged loans lose 1.25% in December; 2014 return is 1.60%, January 5, 2015.
9 LCD News, 2015 CLO Outlook: In the shadow of risk retention, December 19, 2014.
2015 SEMI-ANNUAL REPORT
PRIORITY INCOME FUND, INC. 7
|
| | | | | | | | | | |
| Portfolio Composition - At a Glance | | | |
| Top Ten Holdings | | | | | | | | |
| As of December 31, 2014 | | | | | | | | |
| | | | | | | | | |
| | | | | | | | | |
| Portfolio Company | | Investment | | Maturity | | Fair Value | | % of Net Assets |
| LCM XVI | | Income notes | | 7/15/2026 | | 3,723,835 |
| | 14.2 | % |
| Madison Park Funding 2014-15A | | Subordinated notes | | 1/27/2026 | | 2,783,812 |
| | 10.6 | % |
| COV 2014-2A | | Subordinated notes | | 10/17/2026 | | 1,983,504 |
| | 7.6 | % |
| OCT22 2014-1A | | Subordinated notes | | 11/22/2025 | | 1,834,279 |
| | 7.0 | % |
| Symphony 2013-11A | | Subordinated notes | | 1/17/2025 | | 1,770,000 |
| | 6.7 | % |
| OCTLF 2014-1A | | Subordinated notes | | 11/18/2026 | | 1,701,950 |
| | 6.5 | % |
| BABSN 2014-IIA | | Subordinated notes | | 10/17/2016 | | 952,919 |
| | 3.6 | % |
| VOYA CLO 2014-4A | | Subordinated notes | | 10/14/2026 | | 930,856 |
| | 3.5 | % |
| MVW 2014-1A | | Income notes | | 10/15/2026 | | 920,134 |
| | 3.5 | % |
| CIFC Funding 2014-4A | | Income notes | | 10/17/2026 | | 912,557 |
| | 3.5 | % |
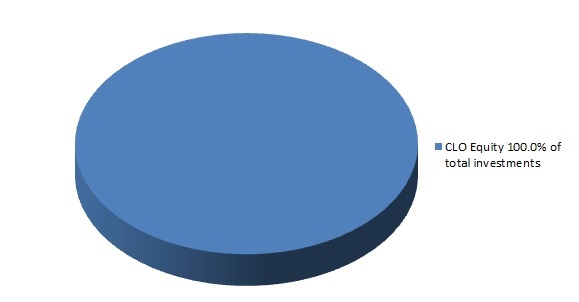
Portfolio Composition
|
| | |
| Number of Loans Underlying the Company's CLO Investments | 3,215 |
|
| Dollar Amount of Loans Underlying the Company's CLO Investments | $20.8 billion |
|
| Percentage of Collateral Underlying the Company's CLO Investments that is in Default | 0.13% |
|
| LTM Default Rate of Collateral Underlying the Company's CLO Investments | 0.49% |
|
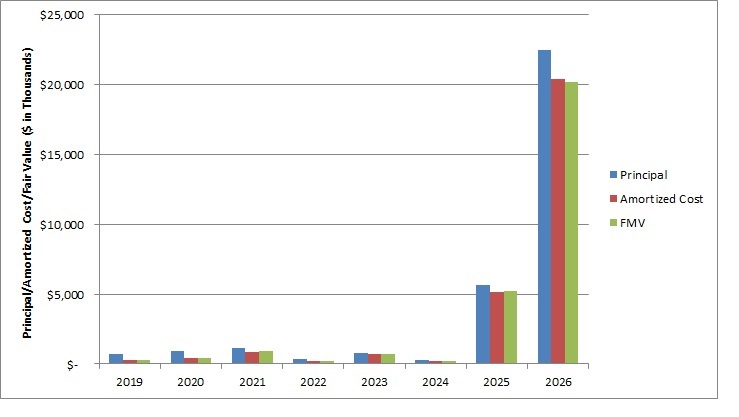
Maturity of Portfolio Securities
2015 SEMI-ANNUAL REPORT
PRIORITY INCOME FUND, INC. 8
|
| | | | | | | | |
Statement of Assets and Liabilities (unaudited) |
| As of December 31, 2014 |
| | | | | | | |
| Assets | | | |
| Investments, at value (amortized cost: $28,270,864 ) | $ | 28,196,223 |
|
| Cash | 2,452,045 |
|
| Due from Adviser | 2,144,108 |
|
| Due from Administrator (note 5) | 6,551 |
|
| Prepaid expenses | 76,008 |
|
| | | | | Total assets | 32,874,935 |
|
| Liabilities | |
| Due to Adviser (note 5) | 4,533,561 |
|
| Payable for investment securities purchased | 1,807,500 |
|
| Accrued expenses | 308,351 |
|
| | | | | Total liabilities | 6,649,412 |
|
| Net assets | $ | 26,225,523 |
|
| | | | | | | |
| Components of net assets: | |
| Common stock, $0.01 par value; 200,000,000 shares authorized; | |
| | 2,173,482 shares issued and outstanding | $ | 21,735 |
|
| Paid-in capital in excess of par | 26,737,955 |
|
| Distributions in excess of net investment income | (466,003 | ) |
| Accumulated net realized gain | 6,477 |
|
| Net unrealized depreciation on investments | (74,641 | ) |
| | | | | Net assets | $ | 26,225,523 |
|
| | | | | | | |
| Net asset value per share | $ | 12.07 |
|
| See accompanying notes to financial statements. |
2015 SEMI-ANNUAL REPORT
PRIORITY INCOME FUND, INC. 9
|
| | | | | | | | |
Statement of Operations (unaudited) |
| For the Six Months Ended December 31, 2014 |
| | |
| Investment income | |
| Interest income from investments | $ | 964,873 |
|
| | | | | Total investment income | 964,873 |
|
| Expenses | |
| Administrator fees | 206,373 |
|
| Base management fee | 189,663 |
|
| Incentive fee | 87,533 |
|
| Valuation services | 183,720 |
|
| Audit and tax expense | 145,850 |
|
| Insurance expense | 59,341 |
|
| Amortization of offering costs | (30,141 | ) |
| Organization expenses | (48,022 | ) |
| General and administrative | 99,079 |
|
| | | | | Total expenses | 893,396 |
|
| | | | | Expense support reimbursement (note 5) | (893,396 | ) |
| | | | | Net expenses | — |
|
| | | | | Net investment income | 964,873 |
|
| Realized and unrealized gain (loss) from investments | |
| Net realized gain from investments | 6,477 |
|
| Net unrealized depreciation on investments | (48,206 | ) |
| | | | | Net realized and unrealized loss from investments | (41,729 | ) |
| Net increase in net assets resulting from operations | $ | 923,144 |
|
| See accompanying notes to financial statements. |
2015 SEMI-ANNUAL REPORT
PRIORITY INCOME FUND, INC. 10
|
| | | | | | | | | | | | |
| Statements of Changes in Net Assets |
| | | | | | | | | |
| | | | | | | Six Months Ended | | Year Ended |
| | | | | | | December 31, 2014 | | June 30, 2014 |
| | | | | | | (unaudited) | | |
| Increase (Decrease) in net assets resulting from operations: | | | |
| Net investment income (loss) | $ | 964,873 |
| | $ | (932,743 | ) |
| Net realized gain from investments | 6,477 |
| | — |
|
| Net unrealized depreciation on investments | (48,206 | ) | | (26,435 | ) |
| | | | | Net increase (decrease) in net assets resulting from operations | 923,144 |
| | (959,178 | ) |
| Dividends to shareholders: | | | |
| Dividend from net investment income (note 7) | (1,091,828 | ) | | (274,840 | ) |
| | | | | Total dividends to shareholders | (1,091,828 | ) | | (274,840 | ) |
| Capital transactions: | | | |
| Net proceeds from shares sold | 19,755,539 |
| | 9,408,676 |
|
| Offering costs | (608,301 | ) | | (1,044,315 | ) |
| Reinvestment of dividends | 459,925 |
| | 106,297 |
|
| | | | | Net increase in net assets from capital transactions | 19,607,163 |
| | 8,470,658 |
|
| | | | | Total increase in net assets | 19,438,479 |
| | 7,236,640 |
|
| Net assets: | | | |
| Beginning of year or period | 6,787,044 |
| | (449,596 | ) |
End of year or period(a) | $ | 26,225,523 |
| | $ | 6,787,044 |
|
| | | | | | | | | |
(a)Includes dividends in excess of net investment income of: | $ | (466,003 | ) | | $ | (268,670 | ) |
| See accompanying notes to financial statements. |
2015 SEMI-ANNUAL REPORT
PRIORITY INCOME FUND, INC. 11
|
| | | | | | | | |
Statement of Cash Flows (unaudited) |
| For the Six Months Ended December 31, 2014 |
| | | | | | | |
| Cash flows from operating activities: | |
| Net increase in net assets resulting from operations | $ | 923,144 |
|
| Adjustments to reconcile net increase in net assets resulting from operations to | |
| | net cash used in operating activities: | |
| | | Purchase of investments | (20,522,588 | ) |
| | | Proceeds from collection of investment principal | 659,285 |
|
| | | Accretion of purchase discount, net | (468,079 | ) |
| | | Net unrealized depreciation on investments | 48,206 |
|
| | | Realized loss from investments | 8,805 |
|
| | | (Increase) Decrease in operating assets: | |
| | | | Due from Adviser | (893,397 | ) |
| | | | Due from Administrator | (6,551 | ) |
| | | | Prepaid expenses | 26,798 |
|
| | | Increase (Decrease) in operating liabilities: | |
| | | | Due to Adviser | 1,087,302 |
|
| | | | Due to Administrator | (575,223 | ) |
| | | | Payable for investment securities purchased | 528,750 |
|
| | | | Accrued expenses | 68,807 |
|
| | | | | Net cash used in operating activities | (19,114,741 | ) |
| Cash flows provided by financing activities: | |
| Net proceeds from shares sold | 20,606,295 |
|
| Offering costs | (608,301 | ) |
| Dividends paid to shareholders | (631,903 | ) |
| | | | | Net cash provided by financing activities | 19,366,091 |
|
| Net increase in cash | 251,350 |
|
| Cash, beginning of period | 2,200,695 |
|
| Cash, end of period | $ | 2,452,045 |
|
| Supplemental non-cash information | |
| Reinvestment of shares issued in connection with distribution reinvestment plan | $ | 459,925 |
|
| See accompanying notes to financial statements. |
2015 SEMI-ANNUAL REPORT
PRIORITY INCOME FUND, INC. 12
|
| | | | | | | | | | | | | | | | | | | | | | | | |
| Schedule of Investments |
| As of December 31, 2014 | | | | | | | | | | | | |
| | | | | | | | | | | | | |
| | | | | | | | | | | | | | | | | |
Portfolio Investments(1) | | Industry | | Investment | | Estimated Yield(2) | | Maturity | | Principal Amount | | Amortized Cost | | Fair Value(3) | | % of Net Assets |
| Collateralized Loan Obligation - Equity Class (Cayman Islands) |
| Adams Mill 2014-1A | | Structured Finance | | Subordinated notes | | 12.86 | % | | 7/15/2016 | | $ | 500,000 |
| | $ | 510,628 |
| | $ | 477,723 |
| | 1.8 | % |
| Apidos 2014-18A | | Structured Finance | | Subordinated notes | | 11.59 | % | | 7/22/2026 | | 750,000 |
| | 753,467 |
| | 706,174 |
| | 2.7 | % |
| BABSN 2014-IIA | | Structured Finance | | Subordinated notes | | 14.08 | % | | 10/17/2016 | | 1,000,000 |
| | 950,210 |
| | 952,919 |
| | 3.6 | % |
BABSN 2014-3A(4) | | Structured Finance | | Subordinated notes | | 14.71 | % | | 1/15/2026 | | 250,000 |
| | 244,167 |
| | 240,678 |
| | 0.9 | % |
| Blue Mountain 2014-1A | | Structured Finance | | Subordinated notes | | 14.67 | % | | 4/30/2026 | | 250,000 |
| | 229,671 |
| | 235,497 |
| | 0.9 | % |
| Carlyle Global Market Strategies CLO 2011-1A | | Structured Finance | | Subordinated notes | | 9.10 | % | | 8/10/2021 | | 713,706 |
| | 707,820 |
| | 749,188 |
| | 2.9 | % |
Cent CLO 2014-21A(4) | | Structured Finance | | Subordinated notes | | 10.55 | % | | 7/27/2026 | | 500,000 |
| | 488,183 |
| | 460,520 |
| | 1.8 | % |
| CIFC Funding 2006-II | | Structured Finance | | Preferred shares | | 11.53 | % | | 3/1/2021 | | 406,629 |
| | 182,237 |
| | 189,199 |
| | 0.7 | % |
| CIFC Funding 2013-II | | Structured Finance | | Subordinated notes | | 13.48 | % | | 4/21/2025 | | 250,000 |
| | 246,231 |
| | 267,776 |
| | 1.0 | % |
| CIFC Funding 2014-1A | | Structured Finance | | Income notes | | 13.55 | % | | 4/18/2025 | | 250,000 |
| | 217,445 |
| | 238,252 |
| | 0.9 | % |
CIFC Funding 2014-4A(4) | | Structured Finance | | Income notes | | 11.32 | % | | 10/17/2026 | | 1,000,000 |
| | 953,132 |
| | 912,557 |
| | 3.5 | % |
| COV 2014-1A | | Structured Finance | | Subordinated notes | | 12.60 | % | | 7/20/2026 | | 274,390 |
| | 217,383 |
| | 208,748 |
| | 0.8 | % |
| COV 2014-2A | | Structured Finance | | Subordinated notes | | 17.82 | % | | 10/17/2026 | | 2,196,078 |
| | 1,735,392 |
| | 1,983,504 |
| | 7.6 | % |
| Flagship 2006-1A | | Structured Finance | | Subordinated securities | | 2.03 | % | | 9/20/2019 | | 150,000 |
| | 41,523 |
| | 37,069 |
| | 0.1 | % |
Galaxy 2014-17A(4) | | Structured Finance | | Subordinated notes | | 10.31 | % | | 7/15/2026 | | 250,000 |
| | 234,233 |
| | 218,067 |
| | 0.8 | % |
| Galaxy 2014-18A | | Structured Finance | | Subordinated notes | | 10.37 | % | | 10/15/2026 | | 250,000 |
| | 226,545 |
| | 211,904 |
| | 0.8 | % |
| Halcyon Loan Investors 2006-1A | | Structured Finance | | Income notes | | 8.62 | % | | 11/20/2020 | | 504,000 |
| | 233,329 |
| | 243,755 |
| | 0.9 | % |
Halcyon Loan Advisers 2014-2A(4) | | Structured Finance | | Subordinated notes | | 16.89 | % | | 4/28/2025 | | 400,000 |
| | 361,316 |
| | 382,300 |
| | 1.5 | % |
| Halcyon Loan Advisers 2014-3A | | Structured Finance | | Subordinated notes | | 14.27 | % | | 10/22/2025 | | 500,000 |
| | 485,954 |
| | 483,765 |
| | 1.8 | % |
| LCM XV | | Structured Finance | | Income notes | | 12.12 | % | | 8/25/2024 | | 250,000 |
| | 214,775 |
| | 228,849 |
| | 0.9 | % |
| LCM XVI | | Structured Finance | | Income notes | | 15.13 | % | | 7/15/2026 | | 4,500,000 |
| | 3,767,119 |
| | 3,723,835 |
| | 14.2 | % |
| LCM XVII | | Structured Finance | | Income notes | | 13.20 | % | | 10/15/2026 | | 500,000 |
| | 457,925 |
| | 418,691 |
| | 1.6 | % |
| Madison Park Funding 2014-13A | | Structured Finance | | Subordinated notes | | 13.35 | % | | 1/19/2025 | | 250,000 |
| | 220,611 |
| | 242,681 |
| | 0.9 | % |
| Madison Park Funding 2014-14X | | Structured Finance | | Subordinated notes | | 10.62 | % | | 7/20/2026 | | 750,000 |
| | 748,934 |
| | 733,846 |
| | 2.8 | % |
| Madison Park Funding 2014-15A | | Structured Finance | | Subordinated notes | | 12.11 | % | | 1/27/2026 | | 3,000,000 |
| | 2,791,851 |
| | 2,783,812 |
| | 10.6 | % |
| MC Funding 2006-1 | | Structured Finance | | Preferred shares | | 3.61 | % | | 12/20/2020 | | 387,965 |
| | 190,453 |
| | 159,339 |
| | 0.6 | % |
2015 SEMI-ANNUAL REPORT
PRIORITY INCOME FUND, INC. 13
|
| | | | | | | | | | | | | | | | | | | | | | | | |
| Schedule of Investments |
| As of December 31, 2014 | | | | | | | | | | | | |
| | | | | | | | | | | | | |
| | | | | | | | | | | | | | | | | |
Portfolio Investments(1) | | Industry | | Investment | | Estimated Yield(2) | | Maturity | | Principal Amount | | Amortized Cost | | Fair Value(3) | | % of Net Assets |
| Collateralized Loan Obligation - Equity Class (Cayman Islands) (continued) |
| MVW 2014-1A | | Structured Finance | | Income notes | | 12.58 | % | | 10/15/2026 | | 1,000,000 |
| | 938,826 |
| | 920,134 |
| | 3.5 | % |
| Ocean Trails CLO II 2007-2X | | Structured Finance | | Subordinated notes | | 16.47 | % | | 6/27/2022 | | 367,064 |
| | 184,901 |
| | 205,701 |
| | 0.8 | % |
| OCT20 2014-1A | | Structured Finance | | Subordinated notes | | 13.12 | % | | 8/12/2026 | | 500,000 |
| | 499,385 |
| | 480,537 |
| | 1.8 | % |
| OCT22 2014-1A | | Structured Finance | | Subordinated notes | | 14.42 | % | | 11/22/2025 | | 2,000,000 |
| | 1,826,190 |
| | 1,834,279 |
| | 7.0 | % |
| OCTLF 2014-1A | | Structured Finance | | Subordinated notes | | 12.77 | % | | 11/18/2026 | | 2,000,000 |
| | 1,809,607 |
| | 1,701,950 |
| | 6.5 | % |
| OZLM 2014-8A | | Structured Finance | | Subordinated notes | | 11.84 | % | | 5/30/2023 | | 750,000 |
| | 708,155 |
| | 689,557 |
| | 2.6 | % |
| Phoenix III (formerly, Avenue CLO 2007-6A) | | Structured Finance | | Subordinated notes | | 17.76 | % | | 7/17/2019 | | 556,629 |
| | 204,449 |
| | 256,268 |
| | 1.0 | % |
| Regatta IV Funding | | Structured Finance | | Subordinated notes | | 14.32 | % | | 7/25/2026 | | 250,000 |
| | 219,402 |
| | 230,499 |
| | 0.9 | % |
| Symphony 2013-11A | | Structured Finance | | Subordinated notes | | | | 1/17/2025 | | 2,000,000 |
| | 1,810,255 |
| | 1,770,000 |
| | 6.7 | % |
Symphony 2014-14A(4) | | Structured Finance | | Subordinated notes | | 10.34 | % | | 7/14/2026 | | 750,000 |
| | 769,077 |
| | 720,585 |
| | 2.7 | % |
Voya CLO 2014-1 (formerly, ING Investment Management CLO 2014-I)(4) | | Structured Finance | | Subordinated notes | | 13.48 | % | | 4/18/2026 | | 250,000 |
| | 235,589 |
| | 245,883 |
| | 0.9 | % |
| Voya CLO 2014-4A | | Structured Finance | | Subordinated notes | | 14.59 | % | | 10/14/2026 | | 1,000,000 |
| | 938,576 |
| | 930,856 |
| | 3.5 | % |
Washington Mill 2014-1A(4) | | Structured Finance | | Subordinated notes | | 14.30 | % | | 4/20/2026 | | 400,000 |
| | 355,266 |
| | 379,970 |
| | 1.4 | % |
| West 2014-1A | | Structured Finance | | Subordinated notes | | 12.15 | % | | 7/18/2026 | | 375,000 |
| | 360,652 |
| | 339,356 |
| | 1.3 | % |
| Total Collateralized Loan Obligation - Equity Class | | | | | | | | 28,270,864 |
| | 28,196,223 |
| | 107.2 | % |
| Total Investments | | | | | | | | $ | 28,270,864 |
| | 28,196,223 |
| | |
| Liabilities in excess of other assets | | | | | | | | | | (1,970,700 | ) | | (7.2 | )% |
| Net Assets | | | | | | | | | | $ | 26,225,523 |
| | 100.0 | % |
| | | | | | | | | | | | | | | | | |
(1) The Company does not "control" and is not an "affiliate" of any of the portfolio investments, each term as defined in the Investment Company Act of 1940, as amended (the "1940 Act"). In general, under the 1940 Act, the Company would be presumed to "control" a portfolio company if the Company owned 25% or more of its voting securities and would be an "affiliate" of a portfolio company if the Company owned 5% or more of its voting securities. |
(2) The CLO subordinated notes/securities, income notes and preference/preferred shares are considered equity positions in the CLOs. Equity investments are entitled to distributions, which are generally equal to the remaining cash flow of the payments made by the underlying loans less contractual payments to debt holders and expenses. The estimated yield indicated is based upon the current projection (as of December 31, 2014) of the amount and timing of these distributions and the estimated amount of repayment of the investment. Such projections are periodically reviewed and adjusted, and the estimated yield may not ultimately be realized. |
(3) Fair value is determined in good faith by the board of directors of the Company (see note 2). |
(4) Co-investment with another fund managed by an affiliate of the Adviser. |
| | | | | | | | | | | | | | | | | |
| See accompanying notes to financial statements. |
2015 SEMI-ANNUAL REPORT
PRIORITY INCOME FUND, INC. 14
Notes to Financial Statements (unaudited)
December 31, 2014
Note 1. Principal Business and Organization
Priority Income Fund, Inc. (the "Company," "us," "our," or "we") was incorporated under the general corporation laws of the State of Maryland on July 19, 2012 as an externally managed, non-diversified, closed-end management investment company under the Investment Company Act of 1940, as amended (the "1940 Act"), and commenced operations on May 9, 2013. In addition, the Company has elected to be treated for tax purposes as a regulated investment company, or "RIC," under Subchapter M of the Internal Revenue Code of 1986, as amended (the "Code"). The Company’s investment objective is to generate current income, and as a secondary objective, long-term capital appreciation. We expect to seek to achieve our investment objective by investing, under normal circumstances, in senior secured loans made to companies whose debt is rated below investment grade or, in limited circumstances, unrated, which we collectively refer to as "Senior Secured Loans," with an emphasis on current income. Our investments may take the form of the purchase of Senior Secured Loans (either in the primary or secondary markets) or through investments in the equity and junior debt tranches of collateralized loan obligation ("CLO") vehicles that in turn own pools of Senior Secured Loans. The Company intends to invest in both the primary and secondary markets.
The Company is managed by Priority Senior Secured Income Management, LLC (the "Adviser"), which is registered as an investment adviser under the Investment Advisers Act of 1940, as amended.
The Company is offering up to 100,000,000 shares of its common stock, on a best efforts basis, at an initial offering price of $15.00 per share and expects the share offering period to last for up to 36 months from the date of the commencement of the offering (May 9, 2013). On January 6, 2014, the Company satisfied its minimum offering requirement by raising over $2.5 million from selling shares to persons not affiliated with the Company or the Adviser (the "Minimum Offering Requirement"), and as a result, broke escrow and commenced making investments.
Note 2. Summary of Significant Accounting Policies
The following is a summary of significant accounting policies followed by the Company in the preparation of its financial statements.
Basis of Presentation
The accompanying financial statements have been prepared in accordance with U.S. generally accepted accounting principles ("U.S. GAAP").
Use of Estimates
The preparation of financial statements in conformity with U.S. GAAP requires management to make estimates and assumptions that affect the reported amounts of assets and liabilities and disclosure of contingent assets and liabilities at the date of the financial statements and the reported amounts of income, expenses and gains (losses) during the reporting period. Actual results could differ from those estimates and those differences could be material.
Cash
The Company considers all highly liquid investments, with original maturities of 90 days or less when purchased, as cash equivalents.
Investment Valuation
The Company follows guidance under U.S. GAAP, which classifies the inputs used to measure fair values into the following hierarchy:
Level 1. Unadjusted quoted prices in active markets for identical assets or liabilities that the Company has the ability to access at the measurement date.
Level 2. Quoted prices for similar assets or liabilities in active markets, or quoted prices for identical or similar assets or liabilities on an inactive market, or other observable inputs other than quoted prices.
2015 SEMI-ANNUAL REPORT
PRIORITY INCOME FUND, INC. 15
Level 3. Unobservable inputs for the asset or liability.
In all cases, the level in the fair value hierarchy within which the fair value measurement in its entirety falls is determined
based on the lowest level input that is significant to the fair value measurement in its entirety. The assessment of the
significance of a particular input to the fair value measurement in its entirety requires judgment and considers factors specific to each investment.
Investments for which market quotations are readily available are valued at such market quotations and are classified in
level 1 of the fair value hierarchy.
U.S. government securities for which market quotations are available are valued at a price provided by an independent
pricing agent or primary dealer. The pricing agent or primary dealer provides these prices usually after evaluating inputs
including yield curves, credit rating, yield spreads, default rates, cash flows, broker quotes and reported trades. U.S.
government securities are categorized in level 2 of the fair value hierarchy.
With respect to investments for which market quotations are not readily available, or when such market quotations are
deemed not to represent fair value, the board of directors (the "Board") has approved a multi-step valuation process for each quarter, as described below, and such investments are classified in level 3 of the fair value hierarchy:
(1) the quarterly valuation process begins with the investment valuation firm engaged by the Board determining preliminary valuations for each portfolio security based on financial information received from the portfolio securities, and providing the Board with a recommended valuation or a valuation range for each portfolio security;
(2) each portfolio security report from the independent valuation firm is reviewed by investment professionals of the Adviser and the finance group for completeness and accuracy of the underlying data;
(3) the audit committee of the Board (the "Audit Committee") reviews and discusses the preliminary valuations proposed by the Adviser based on the report of the independent valuation firm. The independent valuation firm and the Adviser are queried, as necessary, to supplement the valuation conclusions to reflect any comments provided by the Audit Committee; and
(4) the Board discusses valuations and determines the fair value of each investment in the portfolio, in good faith, based on
the input of the Adviser, the independent valuation firm and the Audit Committee.
The types of factors that are taken into account in fair value determination include, as relevant, market changes in
expected returns for similar investments, performance improvement or deterioration, the nature and realizable value of any
collateral, the issuer's ability to make payments and its earnings and cash flows, the markets in which the issuer does business,
comparisons to traded securities, and other relevant factors.
Securities Transactions
Securities transactions are recorded on trade date.
Revenue Recognition
Interest income from investments in the "equity" positions of CLO funds (typically income notes or subordinated notes) is recorded based on an estimation of an effective yield to expected maturity utilizing assumed future cash flows. The Company monitors the expected cash inflows from CLO equity investments, including the expected residual payments, and the estimated effective yield is determined and updated periodically, as needed.
Realized gains or losses on investments are calculated by using the specific identification method.
Offering Expenses
Offering costs prior to the commencement of operations were capitalized on the Company’s statement of assets and liabilities as deferred charges until operations began. Thereafter, offering costs were amortized as an expense over a twelve month period ended May 9, 2014 on a straight-line basis. The Company charged all offering costs incurred after the commencement of operations against paid-in capital in excess of par value on the statement of assets and liabilities.
2015 SEMI-ANNUAL REPORT
PRIORITY INCOME FUND, INC. �� 16
Dividends and Distributions
Dividends and distributions to shareholders, which are determined in accordance with federal income tax regulations, are recorded on the record date. The amount to be paid out as a dividend or distribution is approved by the Board. Net realized capital gains, if any, are generally distributed or deemed distributed at least annually.
Income Taxes
The Company has elected to be treated as a RIC for tax purposes under the Code. To qualify for RIC tax treatment, the Company is required to, among other things, meet certain source-of-income and quarterly asset diversification requirements. The Company must also annually distribute at least 90% of its investment company taxable income, as defined in the Code. It is the policy of the Company to qualify, and continue qualifying, as a RIC, if such qualification is in the best interests of its shareholders, by complying with the applicable provisions of the Code, and to make distributions of taxable income sufficient to relieve it from substantially all federal income and excise taxes.
The tax basis components of distributable earnings differ from the amounts reflected in the statement of assets and liabilities due to temporary book/tax differences primarily arising from investments in CLO equity and permanent book/tax differences primarily attributable to non-deductible excise taxes. These amounts will be finalized before filing the federal tax return.
Management has analyzed the Company's tax positions taken on income tax returns for all open tax years and has concluded that as of December 31, 2014, no provision for income tax is required in the Company's financial statements. All federal and state income tax returns for each tax year in the two-year period ended June 30, 2014 remain subject to examination by the Internal Revenue Service and state departments of revenue.
Recent Accounting Pronouncements
In August 2014, the FASB issued Accounting Standards Update 2014-015, Presentation of Financial Statements - Going Concern (Subtopic 205-40): Disclosure of Uncertainties about an Entity's Ability to Continue as a Going Concern ("ASC 2014-15"). ASU 2014-15 will explicitly require management to assess an entity’s ability to continue as a going concern, and to provide related footnote disclosure in certain circumstances. The new standard will be effective for all entities in the first annual period ending after December 15, 2016. Earlier adoption is permitted. The adoption of the amended guidance in ASU 2014-15 is not expected to have a significant effect on the Company's financial statements and disclosures.
Note 3. Portfolio Investments
The following table summarizes the inputs used to value the Company's investments measured at fair value as of December 31, 2014.
|
| | | | | | | | | | | | | | | |
| | Quoted Prices in | | | | Significant | | |
| | Active Markets for | | Significant Other | | Unobservable | | |
| | Identical Securities | | Observable Inputs | | Inputs | | |
| | (Level 1) | | (Level 2) | | (Level 3) | | Total |
| Assets | | | | | | | |
| Collateralized Loan Obligations - Equity Class | $ | — |
| | $ | — |
| | $ | 28,196,223 |
| | $ | 28,196,223 |
|
2015 SEMI-ANNUAL REPORT
PRIORITY INCOME FUND, INC. 17
The following is a reconciliation of investments for which level 3 inputs were used in determining fair value.
|
| | | |
| | Collateralized Loan Obligation - Equity Class |
| Balance at June 30, 2014 | $ | 7,921,852 |
|
| Realized loss | (8,805 | ) |
| Net change in unrealized depreciation | (48,206 | ) |
| Purchases of portfolio investments | 20,522,588 |
|
| Repayments of portfolio investments | (659,285 | ) |
| Accretion of purchase discount, net | 468,079 |
|
Transfers into level 3(1) | — |
|
Transfers out of level 3(1) | — |
|
| Balance at December 31, 2014 | $ | 28,196,223 |
|
| | |
| Net change in unrealized depreciation attributable to level 3 investments still held at the end of the period | $ | (48,206 | ) |
| | |
(1) Transfers are assumed to have occurred at the beginning of the year. There were no transfers between level 1 and level 2 during the year. |
The following table provides quantitative information about significant unobservable inputs used in the fair value
measurement of level 3 investments as of December 31, 2014.
|
| | | | | | | | | | | | |
| | | | | | | Unobservable Input |
| Asset Category | | Fair Value | | Primary Valuation Technique | | Input | | Range | | Weighted Average |
| Collateral Loan Obligations - Equity Class | | $ | 28,196,223 |
| | Discounted Cash Flow | | Discount Rate | | 5.45% - 15.44% | | 13.21% |
In determining the range of fair value for investments in CLOs, management and the independent valuation firm used a discounted cash flow model. The valuations were accomplished through the analysis of the CLO deal structures to identify the risk exposures from the modeling point of view. For each CLO security, the most appropriate valuation approach was chosen from alternative approaches to ensure the most accurate valuation for such security. A cash flow model is used to store the collateral data, generate collateral cash flows from the assets based on various assumptions for the risk factors, and distribute the cash flows to the liability structure based on the payment priorities, and discount the cash flows back using proper discount rates.
The discounted cash flow model considers the CLO structure as well as current asset and liability characteristics based upon information derived from data sources such as the CLOs' trustee reports and indentures. Key model inputs include reinvestment asset spread, expected prepayment rate, default rate and recovery rate for the underlying collateral held in the CLOs. These inputs are derived by reference to a variety of market sources and historical performance metrics. A discount rate is applied to the expected future cash flows from the CLOs derived from the third-party cash flow model, which reflects the perceived level of risk that would be used by another market participant in determining fair value. An analysis of the observable risk premium data as well as the structural strength and credit quality of the CLOs is undertaken in determining the discount rate.
The fair value calculations for the CLOs are sensitive to the key model inputs, including amongst other things, default and recovery rates. The default rate, recovery rate and other assumptions are determined by reference to a variety of observable market sources and applied according to the quality and asset class mix of the underlying collateral and the historical track record of each particular collateral manager. The model assumptions are reviewed on a regular basis and adjusted as appropriate to factor in historic, current and potential market developments.
The significant unobservable input used to value the CLOs is the discount rate applied to the estimated future cash flows expected to be received from the underlying investment, which includes both future principal and interest payments. Included in the consideration and selection of the discount rate are the following factors: risk of default, comparable investments, and
2015 SEMI-ANNUAL REPORT
PRIORITY INCOME FUND, INC. 18
call provisions. An increase or decrease in the discount rate applied to projected cash flows, where all other inputs remain constant, would result in a decrease or increase, respectively, in the fair value measurement.
Due to the inherent uncertainty of determining the fair value of investments that do not have a readily available market
value, the fair value of the Company's investments may fluctuate from period to period. Additionally, the fair value of the
Company's investments may differ significantly from the values that would have been used had a ready market existed for such
investments and may differ materially from the values that the Company may ultimately realize. Further, such investments are
generally subject to legal and other restrictions on resale or otherwise are less liquid than publicly traded securities. If the
Company were required to liquidate a portfolio investment in a forced or liquidation sale, the Company could realize
significantly less than the value at which the Company has recorded it. In addition, changes in the market environment and
other events that may occur over the life of the investments may cause the gains or losses ultimately realized on these
investments to be different than the unrealized gains or losses reflected in the valuations currently assigned.
Note 4. Capital
The Company offers three classes of shares: Class R shares, Class RIA shares and Class I shares. Class R shares are available to the general public. Class RIA shares are only available to accounts managed by registered investment advisers. Class I shares are available for purchase only through (1) fee-based programs, also known as wrap accounts, of investment dealers, (2) participating broker-dealers that have alternative fee arrangements with their clients, (3) certain registered investment advisers or (4) bank trust departments or any other organization or person authorized to act in a fiduciary capacity for its clients or customers. These classes of shares differ only with respect to the sales load purchasers in the offering must pay, as follows:
•For Class R shares, purchasers pay selling commissions of up to 6.0% and dealer manager fees of 2.0%;
•For Class RIA shares, purchasers pay dealer manager fees of 2.0%, but no selling commissions; and
•For Class I shares, purchasers pay no selling commissions or dealer manager fees.
The Company’s authorized stock consists of 200,000,000 shares of stock, par value $0.01 per share, all of which are initially designated as common stock comprising 180,000,000 of Class R shares, 10,000,000 of Class RIA shares and 10,000,000 of Class I shares. Each class of shares has identical voting and distributions rights, and bear its own pro rata portion of the Company's expenses and have the same net asset value.
The Company entered into two stock purchase agreements with the Adviser. On October 10, 2012 and February 6, 2013,
the Adviser contributed cash consideration of $100,000 and $146,565 to purchase 11,111 and 6,754 shares of Class I common shares at $9.00 and $21.70 per share, respectively.
Transactions in shares of common stock were as follows during the six months and year ended December 31, 2014 and June 30, 2014, respectively:
|
| | | | | | | | | | | | | | | | | | | | |
| | Class R Shares | | Class RIA Shares | | Class I Shares |
| | Shares | | Amount | | Shares | | Amount | | Shares | | Amount |
| Six months ended December 31, 2014: | | | | | | | | | | | |
| Shares sold | 1,396,455 |
| | $ | 19,272,069 |
| | 7,199 |
| | $ | 99,470 |
| | 27,826 |
| | $ | 384,000 |
|
| Shares issued from reinvestment of distributions | 34,004 |
| | 448,695 |
| | 64 |
| | 841 |
| | 792 |
| | 10,389 |
|
| Shares reacquired | — |
| | — |
| | — |
| | — |
| | — |
| | — |
|
| Net increase from capital transactions | 1,430,459 |
| | $ | 19,720,764 |
| | 7,263 |
| | $ | 100,311 |
| | 28,618 |
| | $ | 394,389 |
|
| | | | | | | | | | | | |
| Year ended June 30, 2014: | | | | | | | | | | | |
| Shares sold | 643,685 |
| | $ | 8,883,076 |
| | — |
| | $ | — |
| | 38,087 |
| | $ | 525,600 |
|
| Shares issued from reinvestment of distributions | 6,930 |
| | 98,763 |
| | — |
| | — |
| | 575 |
| | 7,534 |
|
| Shares reacquired | — |
| | — |
| | — |
| | — |
| | — |
| | — |
|
| Net increase from capital transactions | 650,615 |
| | $ | 8,981,839 |
| | — |
| | $ | — |
| | 38,662 |
| | $ | 533,134 |
|
2015 SEMI-ANNUAL REPORT
PRIORITY INCOME FUND, INC. 19
Beginning with the first calendar quarter following the one-year anniversary of the date that the Company meets the Minimum Offering Requirement, and on a quarterly basis thereafter, the Company may offer to repurchase shares. The Company will not be required to repurchase shares and will only do so on such terms as may be determined by the Board.
Note 5. Transactions with Affiliates
Investment Advisory Agreement
On May 9, 2013, the Company entered into an investment advisory agreement (the "Investment Advisory Agreement")
with the Adviser. The Adviser is 50% owned by Prospect Capital Management L.P. and 50% by Behringer Harvard Holdings, LLC ("BHH"). The Adviser manages the day-to-day operations of, and provide investment advisory services to, the Company. For providing these services, the Adviser is paid a base management fee and an incentive fee. The base management fee, payable quarterly in arrears, is calculated at an annual rate of 2.0% based on the average of the total assets as of the end of the two most recently completed calendar quarters. The Company also pays routine non-compensation overhead expenses of the Adviser in an amount up to 0.0625% per quarter (0.25% annualized) of the Company's average total assets. The incentive fee is calculated and payable quarterly in arrears based on the Company’s pre-incentive fee net investment income for the immediately preceding quarter. For this purpose, pre-incentive fee net investment income means interest income, dividend income and any other income (including any other fees, such as commitment, origination, structuring, diligence and consulting fees or other fees received) accrued during the calendar quarter, minus operating expenses for the quarter (including the base management fee, expenses reimbursed under the Investment Advisory Agreement, the administration agreement and the investor services agreement, any interest expense and dividends paid on any issued and outstanding preferred shares, but excluding the organization and offering expenses and incentive fee). Pre-incentive fee net investment income includes, in the case of investments with a deferred interest feature (such as original issue discount, debt instruments with payment-in-kind interest and zero coupon securities), accrued income that we have not yet received in cash. Pre-incentive fee net investment income does not include any realized capital gains, realized capital losses or unrealized capital appreciation or depreciation. Pre-incentive fee net investment income, expressed as a rate of return on the value of the Company’s net assets at the end of the immediately preceding calendar quarter, is compared to the preferred return rate of 1.5% per quarter (6.0% annualized). The Company pays the Adviser an incentive fee with respect to its pre-incentive fee net investment income in each calendar quarter as follows: (1) no incentive fee in any calendar quarter in which the pre-incentive fee net investment income does not exceed the preferred return rate; (2) 100% of the pre-incentive fee net investment income, if any, that exceeds the preferred return rate but is less than 1.875% in any calendar quarter (7.5% annualized); and (3) 20.0% of the pre-incentive fee net investment income, if any, that exceeds 1.875% in any calendar quarter. These calculations are appropriately pro-rated for any period of less than three months.
Expense Support and Conditional Reimbursement Agreement
On February 10, 2014, the Company entered into an Expense Support and Conditional Reimbursement Agreement with the Adviser (as amended and restated on December 17, 2014 and February 24, 2015) (the "Expense Support Agreement"), whereby the Adviser has agreed to reimburse the Company for operating expenses in an amount equal to the difference between distributions to the Company’s shareholders for which a record date has occurred in each quarter less the sum of the Company’s net investment income, the net realized capital gains/losses, the unrealized losses and dividends paid to the Company from its portfolio investments during such quarter ("Expense Support Reimbursement"). To the extent that there are no dividends or other distributions to the Company’s shareholders for which a record date has occurred in any given quarter, then the Expense Support Reimbursement for such quarter shall be equal to such amount necessary in order for available operating funds for the month to equal zero. Available operating funds is the sum of (i) the Company's net investment income (minus any reimbursement payments payable to the Adviser), (ii) the Company's net realized capital gains/losses plus unrealized losses and (iii) dividends and other distributions paid to the Company on account of its portfolio investments ("Available Operating Funds"). The terms of the Expense Support Agreement commenced with the calendar quarter ended March 31, 2014 and continues quarterly thereafter until May 9, 2016, unless extended mutually by the Company and the Adviser. Any payments required to be made by the Adviser under the Expense Support Agreement (an "Expense Payment") for any quarter shall be paid by the Adviser to the Company in any combination of cash or other immediately available funds, and/or offsets against amounts otherwise due from the Company to the Adviser, no later than the earlier of (i) the date on which the Company closes the books for such quarter and (ii) sixty days after the end of such quarter, or at such later date as determined by the Company (the "Expense Payment Date"). The Company has a conditional obligation to reimburse the Adviser for any amounts funded by the Adviser under the Expense Support Agreement. Following any calendar quarter in which Available Operating Funds in such calendar quarter exceed the cumulative distributions to shareholders for which a record date has occurred in such calendar quarter ("Excess Operating Funds") on a date mutually agreed upon by the Adviser and the Company (each such date, a "Reimbursement Date), the Company shall pay such Excess Operating Funds, or a portion thereof, to the extent that the Company has cash available for such payment, to the Adviser until such time as all Expense Payments made by the Adviser to the Company have been reimbursed; provided that (i) the operating expense ratio as of such Reimbursement Date is equal to or less than the operating expense ratio as of the Expense Payment Date attributable to such specified Expense Payment; (ii) the
2015 SEMI-ANNUAL REPORT
PRIORITY INCOME FUND, INC. 20
annualized distribution rate, which includes all regular cash distributions paid and excludes special distributions or the effect of any stock dividends paid, as of such Reimbursement Date is equal to or greater than the annualized distribution rate as of the Expense Payment Date attributable to such specified Expense Payment; and (iii) such specified Expense Payment Date is not earlier than three years prior to the Reimbursement Date. The purpose of the Expense Support Agreement is to minimize such distributions from the Company being characterized as returns of capital for U.S. GAAP purposes and to reduce operating expenses until the Company has raised sufficient capital to be able to absorb such expenses.
The following table provides information regarding liabilities incurred by the Adviser pursuant to the Expense Support Agreement:
|
| | | | | | | | | | | | |
| Period Ended | Expense Support Payments Due from Adviser | Expense Support Payments Reimbursed to Adviser | Unreimbursed Support Payments | Operating Expense Ratio(1) | Annualized Distribution Rate(2) | Eligible to be Repaid Through |
| March 31, 2014 | $ | 668,599 |
| — | $ | 668,599 |
| 22.83 | % | 7.00 | % | March 31, 2017 |
| June 30, 2014 | 582,112 |
| — | 582,112 |
| 6.66 | % | 7.00 | % | June 30, 2017 |
| September 30, 2014 | 696,835 |
| — | 696,835 |
| 4.49 | % | 7.00 | % | September 30, 2017 |
| December 31, 2014 | 196,561 |
| — | 196,561 |
| 0.95 | % | 7.00 | % | December 31, 2017 |
| | | | | | | |
(1)Operating expense ratio is as of the date the expense support payment obligation was incurred by the Advisor and includes all expenses borne by the Company, except for organizational and offering expenses, base management fees, incentive fees and any interest expense attributable to indebtedness incurred by the Company. |
(2)Annualized distribution rate equals the annualized rate of distributions to shareholders based on the amount of the regular dividends paid immediately prior to the date the expense support payment obligation was incurred by the Advisor. Annualized distribution rate does not include bonus dividends paid to shareholders. |
Administration Agreement
Additionally, on May 9, 2013, the Company entered into an administration agreement (the "Administration Agreement") with Prospect Administration LLC (the "Administrator"), an affiliate of the Adviser. The Administrator performs, oversees and arranges for the performance of administrative services necessary for the operation of the Company. These services include, but are not limited to, accounting, finance and legal services. For providing these services, facilities and personnel, the Company reimburses the Administrator for the Company’s actual and allocable portion of expenses and overhead incurred by the Administrator in performing its obligations under the Administration Agreement, including rent.
Investor Services Agreement
The Company also entered into an investor services agreement (the "Investor Services Agreement") under which the
Company reimburses a subsidiary of BHH for providing investor relations support and related back-office services with respect
to the Company’s investors. For the six months ended December 31, 2014, the investor services fee was $50,000.
Dealer Manager
Behringer Securities, LP (the "Dealer Manager"), an indirect wholly-owned subsidiary of BHH, acts as dealer manager for
the offering and manages a group of participating broker-dealers, including other unaffiliated broker-dealers who enter into
participating broker-dealer agreements with the Dealer Manager. The Dealer Manager is expected to re-allow the full amount of
selling commissions to participating broker-dealers and may re-allow up to 1.15% of the dealer manager fee to participating broker-dealers for reimbursement of marketing expenses. For the six months ended December 31, 2014, the Dealer Manager received a fee of approximately $419,000.
For the six months ended December 31, 2014, fees and expenses incurred by the Company related to its affiliates or subsidiaries of its affiliates were as follows:
2015 SEMI-ANNUAL REPORT
PRIORITY INCOME FUND, INC. 21
|
| | | | | | | | |
| Related Party | | Source Agreement | | Description | | Six Months Ended December 31, 2014 |
| Priority Senior Secured Income Management LLC | | Investment Advisory Agreement | | Base management fee | | $ | 189,663 |
|
| Priority Senior Secured Income Management LLC | | Investment Advisory Agreement | | Routine non-compensation overhead expenses | | 21,414 |
|
| Priority Senior Secured Income Management LLC | | Investment Advisory Agreement | | Incentive fee | | 87,533 |
|
| Prospect Administration LLC | | Administration Agreement | | Administrator fee | | 206,373 |
|
| Prospect Administration LLC | | Administration Agreement | | Expense reimbursements | | 22,995 |
|
| Behringer Harvard Holdings, LLC | | Investor Services Agreement | | Investor services fee | | 50,000 |
|
| Behringer Securities, LP | | Dealer Manager Agreement | | Dealer manager fee | | 419,373 |
|
Organization and Offering Costs
The Adviser, on behalf of the Company, paid or incurred organization and offering costs of $153,526 and $3,254,464, respectively, through December 31, 2014. Offering expenses consist of costs for the registration, marketing and distribution of the Company’s shares. These expenses include, but are not limited to, expenses for legal, accounting, printing and marketing, and include salaries and direct expenses of the Adviser’s employees, employees of its affiliates and others for providing these services. Organization and offering costs attributable to the salaries and direct expenses of such employees for providing primarily legal and marketing services were $64,915 and $1,096,752, respectively, through December 31, 2014. In addition, the Adviser, on behalf of the Company, paid operating expenses of $934,353 through December 31, 2014.
Upon achieving the Minimum Offering Requirement, the Adviser is entitled to receive up to 5.0% of the gross proceeds from the offering as reimbursement for organizational and offering expenses that it has funded, until all of the organizational and offering costs listed above and any future offering expenses paid by the Adviser have been recovered. On January 8, 2014, the Adviser agreed to reduce such reimbursement and accept a maximum of 2% of the gross proceeds of the offering of the Company's securities until all of the organizational and offering expenses incurred and/or paid by the Adviser have been recovered.
Co-Investments
On February 10, 2014, the Company received an exemptive order from the SEC (the "Order") that gave it the ability to negotiate terms other than price and quantity of co-investment transactions with other funds managed by the Adviser or certain affiliates, including Prospect Capital Corporation and Pathway Energy Infrastructure Fund, Inc., subject to the conditions included therein. Under the terms of the relief permitting the Company to co-invest with other funds managed by the Company's Adviser or its affiliates, a “required majority” (as defined in Section 57(o) of the 1940 Act) of the Company's independent directors must make certain conclusions in connection with a co-investment transaction, including that (1) the terms of the proposed transaction, including the consideration to be paid, are reasonable and fair to the Company and its shareholders and do not involve overreaching of the Company or its shareholders on the part of any person concerned and (2) the transaction is consistent with the interests of the Company's shareholders and is consistent with the Company's investment objective and strategies. In certain situations where co-investment with one or more funds managed by the Adviser or its affiliates is not covered by the Order, such as when there is an opportunity to invest in different securities of the same issuer, the personnel of the Adviser or its affiliates will need to decide which fund will proceed with the investment. Such personnel will make these determinations based on policies and procedures, which are designed to reasonably ensure that investment opportunities are allocated fairly and equitably among affiliated funds over time and in a manner that is consistent with applicable laws, rules and regulations. Moreover, except in certain circumstances, when relying on the Order, the Company will be unable to invest in any issuer in which one or more funds managed by the Adviser or its affiliates has previously invested.
As of December 31, 2014, the Company had co-investments with Prospect Capital Corporation in the following CLOs: Babson CLO Ltd. 2014-III; Cent CLO 21 Limited; CIFC Funding 2014-IV Investor, Ltd.; Galaxy XVII CLO, Ltd.; Halcyon Loan Advisors Funding 2014-2 Ltd.; Symphony CLO XIV Ltd.; Voya CLO 2014-1, Ltd.; and Washington Mill CLO Ltd.
2015 SEMI-ANNUAL REPORT
PRIORITY INCOME FUND, INC. 22
Officers and Directors
Certain officers and directors of the Company are also officers and directors of the Adviser and its affiliates. There were no fees paid to the independent directors of the Company as the Company did not exceed the minimum net asset value required to receive a fee for the six months ended December 31, 2014. The officers do not receive any direct compensation from the Company.
Note 6. Dividends and Distributions
Dividends from net investment income and capital gain distributions are determined in accordance with U.S. federal income tax regulations, which differ from U.S. GAAP.
The following table reflects the distributions per share that the Company declared or paid to its shareholders since it commenced operations in May 2013. Shareholders of record as of each respective record date were or will be entitled to receive the distribution.
|
| | | | |
| Record Date | Payment Date | Total Amount per Share(a) |
| February 21, 2014 | February 24, 2014 | $ | 0.13521 |
|
| February 28, 2014 | March 3, 2014 | 0.02014 |
|
| March 7, 14, 21 and 28, 2014 | March 31, 2014 | 0.08056 |
|
| April 4, 11, 18 and 25, 2014 | April 28, 2014 | 0.08056 |
|
| May 2, 9, 16, 23 and 30, 2014 | June 2, 2014 | 0.10070 |
|
| June 6, 13, 20 and 27, 2014 | June 30, 2014 | 0.08056 |
|
| June 27, 2014 | June 30, 2014 | 0.11250 |
|
| July 7, 11, 18 and 25, 2014 | August 4, 2014 | 0.08056 |
|
| August 1, 8, 15, 22 and 29, 2014 | September 2, 2014 | 0.10070 |
|
| September 5, 12, 19 and 26, 2014 | September 29, 2014 | 0.08056 |
|
| September 26, 2014 | September 29, 2014 | 0.11250 |
|
| October 3, 10, 17, 24 and 31, 2014 | November 3, 2014 | 0.10070 |
|
| November 7, 2014 | November 10, 2014 | 0.05190 |
|
| November 7, 14, 21 and 28, 2014 | December 1, 2014 | 0.08056 |
|
| December 5, 12, 19 and 26, 2014 | December 29, 2014 | 0.08056 |
|
| December 26, 2014 | December 29, 2014 | 0.06060 |
|
| January 2, 9, 16, 23 and 30, 2015 | February 2, 2015 | 0.10070 |
|
| February 6, 13, 20 and 27, 2015 | March 2, 2015 | 0.08056 |
|
| March 6, 13, 20 and 27, 2015 | March 30, 2015 | 0.08056 |
|
| March 27, 2015 | March 30, 2015 | 0.11250 |
|
| | | |
(a)Total amount per share represents the total distribution rate for the record dates indicated. |
The Company may fund its distributions to shareholders from any sources of funds available, including offering proceeds, borrowings, net investment income from operations, capital gains proceeds from the sale of assets, non-capital gains proceeds from the sale of assets and expense reimbursements from the Adviser, which may constitute a return of capital and reduce the amount of capital available to the Company for investment. Any capital returned to shareholders through dividends will be distributed after payment of fees and expenses.
Following commencement of the Company's continuous public offering, substantial portions of the Company's dividends to shareholders have been funded through reimbursement of operating expenses by the Adviser that are subject to repayment by the Company. The purpose of this arrangement was to ensure that no portion of the Company's dividends to shareholders was paid from offering proceeds. Any such dividends funded through expense reimbursements were not based on the Company's investment performance. The reimbursement of these Expense Payments owed to the Adviser will reduce the future distributions to which shareholders would otherwise be entitled. For the six months ended December 31, 2014, the Company
2015 SEMI-ANNUAL REPORT
PRIORITY INCOME FUND, INC. 23
did not repay any amounts to the Adviser for Expense Payments. There can be no assurance that the Company will achieve the performance necessary to sustain its dividends or that the Company will be able to pay dividends at a specific rate or at all.
The determination of the tax characterization (i.e., paid from ordinary income, paid from net capital gains, and/or a return of capital which is a nontaxable distribution) of distributions is made annually at the end of the Company's fiscal year based upon its taxable income for the full year and dividends paid for the full year.
The Company has adopted an "opt in" distribution reinvestment plan pursuant to which shareholders may elect to have the full amount of distributions reinvested in additional shares. Shareholders will receive distributions in cash unless specifically "opting in" to the distribution reinvestment plan to have cash distributions reinvested in additional shares of the Company. Reinvested distributions will purchase shares at a price equal to 95% of the price that shares are sold in the offering at the closing immediately following the distribution payment date. There will be no selling commissions, dealer manager fees or other sales charges for shares issued under the distribution reinvestment plan.
Note 7. Income Taxes
Distributions to shareholders are determined in accordance with U.S. federal income tax regulations, which may differ from amounts determined in accordance with U.S. GAAP. These book-to-tax differences are either temporary or permanent in nature. To the extent these differences are permanent, they are reclassified among the Company's net assets components.
The tax cost of the Company's portfolio investments as of December 31, 2014 was as follows:
|
| | | | | | | | | | | |
| | | | Net Unrealized |
| | Unrealized | Unrealized | Appreciation/ |
| Tax Cost | Appreciation | (Depreciation) | (Depreciation) |
| $ | 28,165,460 |
| $ | 468,958 |
| $ | (438,195 | ) | $ | 30,763 |
|
The differences between book-basis and tax-basis for determining unrealized appreciation/(depreciation) relate primarily to (i) the realization for tax purposes of mark-to-market gains on certain investments in passive foreign investment companies and (ii) tax basis adjustments resulting from cash distributions from passive foreign investment companies in excess of earning and profits that are characterized as return of capital.
Note 8. Concentration of Credit Risk
Cash held at financial institutions, at times, may exceed the amount insured by the Federal Deposit Insurance Corporation. The Company's portfolio may be concentrated in a limited number of investments in CLO vehicles, which is subject to a risk of loss if that sector experiences a market downturn. The Company is subject to credit risk in the normal course of pursuing its investment objectives. The Company's maximum risk of loss from credit risk for portfolio investments is the inability of the CLO collateral managers to return up to the cost value due to loan defaults occurring in the underlying CLOs.
Note 9. Commitments and Contingencies
The Company has a conditional obligation to reimburse the Adviser for any amounts funded by the Adviser under the Expense Support Agreement if (and only to the extent that), following any fiscal quarter occurring within three years of the date on which the Adviser incurred a liability for such amount, Available Operating Funds exceeds the distributions paid by the Company to shareholders to the extent that the Company has cash available for such payment. The Company will only make reimbursement payments if its operating expense ratio is equal to or less than its operating expense ratio at the time the corresponding expense payment was incurred and if the annualized rate of the Company’s regular cash distributions to stockholders is equal to or greater than the annualized rate of its regular cash distributions to stockholders at the time the corresponding expense payment was incurred. No reimbursement will be paid to the Adviser more than three years after such corresponding expense payment was incurred. The Company is unable to estimate the amount that would be reimbursable to the Adviser at the time the above event occurs. However, the maximum exposure to the Company is the total Expense Payments from the Adviser.
On May 9, 2013, the Securities and Exchange Commission (“SEC”) declared effective our registration statement filed on Form N-2 (the “Registration Statement”). On September 9, 2014, we filed a post-effective amendment to the Registration Statement that included our audited financial statements as of and for the year ended June 30, 2014, as had been included in our annual report to stockholders for the year ended June 30, 2014 (the “2014 Annual Report”) and filed with the SEC on Form N-CSR. Although prospective investors were previously provided with a prospectus supplement containing our audited financial statements as of and for the year ended June 30, 2013, there were approximately three months when the Registration Statement,
2015 SEMI-ANNUAL REPORT
PRIORITY INCOME FUND, INC. 24
as declared effective, did not technically contain financial information that was current for purposes of Section 10(a)(3) under the Securities Act (the “Applicable Period”). During the Applicable Period, 695,952 shares of Class R common stock and 7,319 shares of Class I common stock were sold at purchase prices of $15.00 and $14.85, and $13.80 per share, respectively, for gross proceeds of approximately $10.5 million. Such shares may have been issued in violation of Section 5 under the Securities Act, and, as a result, the purchasers of those shares may have rescission rights or claims for damages. To ensure that our stockholders are not harmed by any claims for rescission, we have entered into an indemnification agreement with the Adviser whereby the Adviser has agreed to provide funds necessary for shareholder claims for rescission if we are unable to do so and to indemnify us for any losses arising from rescission claims and legal expenses incurred by us if we defend against shareholder claims for rescission.
The Company is not currently subject to any material legal proceedings and, to the Company's knowledge, no material legal proceedings are threatened against the Company. From time to time, the Company may be a party to certain legal proceedings in the ordinary course of business, including proceedings relating to the enforcement of the Company's rights under contracts with its portfolio companies. While the outcome of any legal proceedings cannot be predicted with certainty, the Company does not expect that any such proceedings will have a material adverse effect upon its financial condition or results of operations.
Note 10. Financial Highlights
The following is a schedule of financial highlights for the six months ended December 31, 2014 and the period from January 6, 2014 (the date non-affiliate shareholders were admitted into the Company) to June 30, 2014. The Company has omitted the financial highlights for the periods from July 1, 2013 to January 5, 2014 and July 19, 2012 (inception) to June 30, 2013 since the Company had not commenced investment operations. Although the Company offers three classes of shares, the difference is only with respect to the sales load purchasers in the offering must pay. Each class of shares has identical voting and distributions rights, and bears its own pro rata portion of the Company's expenses and has the same net asset value. As such, the schedule of financial highlights is presented for the Company as a whole.
2015 SEMI-ANNUAL REPORT
PRIORITY INCOME FUND, INC. 25
|
| | | | | | | | | | | | |
| | | | | | | Period Ended |
| | | | | | | December 31, 2014 | | June 30, 2014(a) |
| Per share data: | | | |
| Net asset value, beginning of period | $ | 9.60 |
| | $ | 13.80 |
|
| | | | |
Net investment income(b) | 0.68 |
| | 0.66 |
|
Net unrealized loss(b) | (0.03 | ) | | (0.06 | ) |
| | | | | Net increase in net assets resulting from operations | 0.65 |
| | 0.60 |
|
Dividends to shareholders from net investment income(d) | (0.75 | ) | | (0.61 | ) |
Offering costs(b) | (0.43 | ) | | (1.36 | ) |
Other(c) | 3.00 |
| | (2.83 | ) |
| Net asset value, end of period | $ | 12.07 |
| | $ | 9.60 |
|
| | | | | | | | | |
Total return, based on NAV(e) | 33.04 | % | | (27.15 | )% |
| Supplemental Data: | | | |
| Net assets, end of period | $ | 26,225,523 |
| | $ | 6,787,044 |
|
| Ratio to average net assets: | | | |
Expenses without reimbursements(f) | 10.84 | % | | 79.50 | % |
Reimbursements in excess of expenses(f) | — | % | | (2.50 | )% |
Net investment income(f) | 11.71 | % | | 18.02 | % |
| | | | | | | | | |
| Portfolio turnover | 121 | % | | 6 | % |
| | | | | | | | | |
(a)Represents the period from January 6, 2014 (the date non-affiliate shareholders were admitted into the Company) to June 30, 2014. |
(b)Calculated based on average shares outstanding. |
(c)The amount shown represents the balancing figure derived from the other figures in the schedule, and is primarily attributable to the accretive effects from the sales of the Company’s shares during the period. |
(d)The per share data for dividends is the actual amount of dividends paid or payable per share of common stock outstanding during the period. Dividends per share are rounded to the nearest $0.01. |
(e)Total return, which is not annualized, is based upon the change in net asset value per share between the opening and ending net asset values per share during the period and assumes that dividends are reinvested in accordance with the Company's dividend reinvestment plan. The computation does not the reflect sales load for Class R shares. Total return based on market value is not presented since the Company's shares are not publicly traded. |
(f)Annualized for periods less than one year. |
Note 11. Subsequent Events
On January 28, 2015, the Board declared a special distribution to shareholders in the amount of $0.11250 per share to be paid on March 30, 2015 to shareholders of record as of March 27, 2015.
The management of the Company has evaluated events and transactions through the date the financial statements were issued, and has determined that other than the above disclosure there are no material events that would require adjustment to or disclosure in the Company's financial statements.
2015 SEMI-ANNUAL REPORT
PRIORITY INCOME FUND, INC. 26
DISTRIBUTION REINVESTMENT PLAN
Subject to the Company's Board of Directors' discretion and applicable legal restrictions, the Company intends to authorize and declare ordinary cash distributions on a quarterly basis and pay such distributions on a monthly basis. The Company have adopted an "opt in" distribution reinvestment plan pursuant to which shareholders may elect to have the full amount of their cash distributions reinvested in additional shares. Any distributions of the Company's shares pursuant to the Company's distribution reinvestment plan are dependent on the continued registration of the Company's securities or the availability of an exemption from registration in the recipient's home state. Participants in the Company's distribution reinvestment plan are free to elect or revoke reinstatement in the distribution plan within a reasonable time as specified in the plan. If shareholders do not elect to participate in the plan, shareholders will automatically receive any distributions the Company declares in cash. For example, if the Company's Board of Directors authorizes, and the Company declares, a cash distribution, then if shareholders have "opted in" to the Company's distribution reinvestment plan, those shareholders will have their cash distributions reinvested in additional shares, rather than receiving cash distributions. During this offering, the Company generally intends to coordinate distribution payment dates so that the same price that is used for the closing date immediately following such distribution payment date will be used to calculate the purchase price for purchasers under the distribution reinvestment plan. In such case, shareholders reinvested distributions will purchase shares at a price equal to 95% of the price that shares are sold in the offering at the closing immediately following the distribution payment date. Shares issued pursuant to the Company's distribution reinvestment plan will have the same voting rights as shares offered pursuant to the prospectus.
If shareholders wish to receive their distribution in cash, no action will be required on their part to do so. If shareholders are a registered stockholder, they may elect to have their entire distribution reinvested in shares by notifying DST Systems, Inc., the reinvestment agent, and the Company's transfer agent and registrar, in writing so that such notice is received by the reinvestment agent no later than the record date for distributions to stockholders. If shareholders elect to reinvest their distributions in additional shares, the reinvestment agent will set up an account for shares shareholders acquire through the plan and will hold such shares in non-certificated form. If shareholders shares are held by a broker or other financial intermediary, shareholders may "opt in" to the Company's distribution reinvestment plan by notifying their broker or other financial intermediary of their election.
The Company intends to use newly issued shares to implement the plan and determine the number of shares the Company will issue to shareholders as follows:
To the extent the Company's shares are not listed on a national stock exchange or quoted on an over-the-counter market or a national market system (collectively, an "Exchange"):
| |
| • | during any period when the Company is making a "best-efforts" public offering of the Company's shares, the number of shares to be issued to shareholders shall be determined by dividing the total dollar amount of the distribution payable to shareholders by a price equal to 95% of the price that the shares are sold in the offering at the closing immediately following the distribution payment date; and |
| |
| • | during any period when the Company is not making a "best-efforts" offering of the Company's shares, the number of shares to be issued to shareholders shall be determined by dividing the total dollar amount of the distribution payable to shareholders by a price equal to the net asset value as determined by the Company's Board of Directors. |
To the extent the Company's shares are listed on an Exchange, the number of shares to be issued to shareholders shall be determined by dividing the total dollar amount of the distribution payable to shareholders by the market price per share of the Company's shares at the close of regular trading on such Exchange on the valuation date fixed by the Company's Board of Directors for such distribution.
There will be no selling commissions, dealer manager fees or other sales charges to shareholders if they elect to participate in the distribution reinvestment plan. The Company will pay the reinvestment agent's fees under the plan.
If shareholders receive their ordinary cash distributions in the form of shares, shareholders generally are subject to the same federal, state and local tax consequences as they would be had they elected to receive their distributions in cash. Shareholders' basis for determining gain or loss upon the sale of shares received in a distribution from the Company will be equal to the total dollar amount of the distribution payable in cash. Any shares received in a distribution will have a holding period for tax purposes commencing on the day following the day on which the shares are credited to shareholders' account.
2015 SEMI-ANNUAL REPORT
PRIORITY INCOME FUND, INC. 27
MANAGEMENT
Our Board of Directors oversees our management. Our Board of Directors currently consists of five members, three of
whom are not “interested persons” of us as defined in Section 2(a)(19) of the 1940 Act. We refer to these individuals as our
independent directors. M. Grier Eliasek is considered an interested person of us as a result of his position as President and Chief Executive Officer of us and President and Chief Operating Officer of our Adviser, and his executive positions at certain affiliates of our Adviser, and Robert S. Aisner is considered an interested person of us as a result of his executive positions at certain affiliates of our Adviser. Our Board of Directors elects our officers, who serve at the discretion of our Board of Directors. The responsibilities of each director will include, among other things, the oversight of our investment activity, the quarterly valuation of our assets, and oversight of our financing arrangements. Our Board of Directors has also established an Audit Committee and a Nominating and Corporate Governance Committee and may establish additional committees in the future.
Our directors and officers and their principal occupations during the past five years are set forth below. Our prospectus
includes additional information about our directors and is available, without charge, upon request by calling (212) 448-0702.
Board of Directors and Executive Officers
Directors
Information regarding the Board of Directors is as follows:
|
| | | | | |
| Name and Age | Position Held with the Company | Term and Length of Time Served | Principal Occupation(s) During Past Five Years | Number of Portfolios in Fund Complex Overseen by Director | Other Directorships Held by Director |
| Interested Directors | | | | |
| M. Grier Eliasek, 42 | Director, Chairman of the Board, Chief Executive Officer and President | Since 2012, expires 2015 | President and Chief Operating Officer of Priority Senior Secured Income Management, LLC; President, Co-Founder and Chief Operating Officer of Prospect Capital Corporation; Managing Director of Prospect Capital Management L.P. ("Prospect Capital Management") and Prospect Administration LLC ("Prospect Administration"); Director, Chairman of the Board, Chief Executive Officer and President of Pathway Energy Infrastructure Fund, Inc. | 3 | Prospect Capital Corporation, Pathway Energy Infrastructure Fund, Inc. |
| Robert S. Aisner, 68 | Director | Since 2012, expires 2017 | Executive positions of the following entities: TIER REIT, Inc., Behringer Harvard Opportunity REIT I, Inc., Behringer Harvard Opportunity REIT II, Inc., Monogram Residential Trust, Inc., and Behringer Harvard Holdings. | 2 | TIER REIT, Inc., Behringer Harvard Opportunity REIT II, Inc., Monogram Residential Trust, Inc., Pathway Energry Infrastructure Fund, Inc. |
2015 SEMI-ANNUAL REPORT
PRIORITY INCOME FUND, INC. 28
|
| | | | | |
| Name and Age | Position Held with the Company | Term and Length of Time Served | Principal Occupation(s) During Past Five Years | Number of Portfolios in Fund Complex Overseen by Director | Other Directorships Held by Director |
| Independent Directors | | | | |
| Andrew C. Cooper, 53 | Director | Since 2012, expires 2015 | Mr. Cooper is an entrepreneur, who over the last 19 years has founded, built, run and sold three companies. He is Co-CEO of Unison Energy, LLC, a co-generation company that engineers, installs, owns, and operates co-generation facilities, and previously was the Co-CEO of Unison Site Management, Inc., a specialty finance company focusing on cell site easements. He was a Managing Director of Carlyle Group and a Principal of Morgan Stanley. | 3 | Prospect Capital Corporation, Pathway Energy Infrastructure Fund, Inc. |
| William J. Gremp, 72 | Director | Since 2012, expires 2017 | Mr. Gremp has been responsible for traditional banking services, credit and lending, private equity and corporate cash management with Merrill Lynch & Co. from 1999 to present. | 3 | Prospect Capital Corporation, Pathway Energy Infrastructure Fund, Inc. |
| Eugene S. Stark, 57 | Director | Since 2012, expires 2016 | Principal Financial Officer, Chief Compliance Officer and Vice President - Administration of General American Investors Company, Inc. from May 2005 to present. | 3 | Prospect Capital Corporation, Pathway Energy Infrastructure Fund, Inc. |
The address for each of our directors is c/o Priority Income Fund, Inc., 10 East 40th Street, 42nd Floor, New York, NY 10016.
2015 SEMI-ANNUAL REPORT
PRIORITY INCOME FUND, INC. 29
Executive Officers Who Are Not Directors
|
| | | |
| Name and Age | Position | Term | Principal Occupation(s) During Past Five Years |
| Michael D. Cohen, 41 | Executive Vice President | Since July 2012 | Executive Vice President of Priority Senior Secured Income Management, LLC and of a number of other entities affiliated with Behringer Harvard; Executive Vice President of Pathway Energy Infrastructure Fund, Inc., Director of Behringer Harvard Opportunity REIT II, Inc., President and Director of Behringer Harvard Opportunity REIT I, Inc. |
| Brian H. Oswald, 53 | Chief Financial Officer, Chief Compliance Officer, Treasurer and Secretary | Since December 2014 | Chief Financial Officer, Chief Compliance Officer, Treasurer and Secretary of Prospect Capital Corporation and a Managing Director of Prospect Administration since November 2008. Mr. Oswald is also the Chief Financial Officer, Chief Compliance Officer, Treasurer and Secretary of our Adviser, Pathway Energy Infrastructure Management, LLC and Pathway Energy Infrastructure Fund, Inc. |
Compensation of Directors
The following table sets forth compensation of our directors for the six months ended December 31, 2014.
|
| | | | | | | | | | | | | | | |
| Name | | Fees Earned(1) | | All Other Compensation(2) | | Total |
| Interested Directors | | | | | | | | | |
| M. Grier Eliasek | | $ | — |
| | | $ | — |
| | | $ | — |
| |
| Robert S. Aisner | | — |
| | | — |
| | | — |
| |
| Independent Directors | | | | | | | | | |
| Andrew C. Cooper | | — |
| | | — |
| | | — |
| |
| William J. Gremp | | — |
| | | — |
| | | — |
| |
| Eugene S. Stark | | — |
| | | — |
| | | — |
| |
(1)For a discussion of the independent directors’ compensation, see below.
(2)We do not maintain a stock or option plan, non-equity incentive plan or pension plan for our directors.
Prior to meeting our minimum offering requirement, our directors are not entitled to compensation. Subsequent to meeting our minimum offering requirement, our directors who do not also serve in an executive officer capacity for us or our Adviser are entitled to receive annual cash retainer fees, determined based on our net asset value as of the end of each fiscal quarter. These directors will be Messrs. Cooper, Gremp and Stark. Amounts payable under this arrangement will be determined and paid quarterly in arrears as follows:
|
| | | | |
| Net Asset Value | | Annual Cash Retainer |
| $0 - $100,000,000 | | $ | — |
|
| $100,000,001 - $300,000,000 | | 35,000 |
|
| $300,000,001 - $500,000,000 | | 50,000 |
|
| $500,000,001 - $1 billion | | 75,000 |
|
| >$1 billion | | 100,000 |
|
We will also reimburse each of the above directors for all reasonable and authorized business expenses in accordance with our policies as in effect from time to time, including reimbursement of reasonable out-of-pocket expenses incurred in connection with attending each board meeting and each committee meeting not held concurrently with a board meeting.
We do not pay compensation to our directors who also serve in an executive officer capacity for us or our Adviser.
Compensation of Executive Officers
Our executive officers will not receive any direct compensation from us. We do not currently have any employees and do not expect to have any employees. Services necessary for our business are provided by individuals who are employees of Prospect Capital Management, Prospect Administration or Behringer Harvard or by individuals who were contracted by such entities to
2015 SEMI-ANNUAL REPORT
PRIORITY INCOME FUND, INC. 30
work on behalf of us, pursuant to the terms of the Investment Advisory Agreement between the Company and our Adviser, the Administration Agreement between the Company and Prospect Administration or the Investor Services Agreement between the Company and Behringer Harvard Priority Investor Services LLC, an affiliate of Behringer Harvard. Each of our executive officers is an employee of our Adviser, Prospect Capital Management, Prospect Administration, Behringer Harvard or an outside contractor, and the day-to-day investment operations and administration of our portfolio are managed by our Adviser. In addition, we reimburse Prospect Administration for our actual and allocable portion of expenses incurred by Prospect Administration, as applicable, in performing its obligations under the Administration Agreement, including the allocable portion of the cost of our chief financial officer, chief compliance officer, treasurer and secretary and other administrative support personnel under the Administration Agreement. We also reimburse Behringer Harvard Pathway Investor Services for
the costs and expenses incurred by Behringer Harvard Pathway Investor Services in performing its obligations and providing
personnel and facilities under the Investor Services Agreement.
2015 SEMI-ANNUAL REPORT
PRIORITY INCOME FUND, INC. 31
ADDITIONAL INFORMATION
Portfolio Information
The Company files its complete schedule of portfolio holdings with the Securities and Exchange Commission for the first and third quarters of each fiscal year on Form N-Q, within 60 days after the end of the relevant period. Form N-Q filings of the Company is available on the Commission’s website at http://www.sec.gov and may be reviewed and copied at the Commission’s Public Reference Room in Washington, DC. Information on the operation of the Public Reference Room may be obtained by calling 1-800-SEC-0330. This information will also be available free of charge by contacting the Company by mail at 10 East 40th Street, 42nd Floor, New York, NY 10016, by telephone at (212) 448-0702 or on its website at http://www.priority-incomefund.com.
Proxy Information
A description of the policies and procedures that the Company uses to determine how to vote proxies relating to portfolio securities is available (i) without charge, upon request, by calling collect (212) 448-0702; (ii) on the Company’s website at http://www.priority-incomefund.com and (iii) on the SEC’s website at http://www.sec.gov.
Tax Information
For tax purposes, dividends to shareholders during the six months ended December 31, 2014 were approximately $1.1 million.
Privacy Policy
We are committed to protecting your privacy. This privacy notice, which is required by federal law, explains our privacy policies and our affiliated companies. This notice supersedes any other privacy notice you may have received from us.
We will safeguard, according to strict standards of security and confidentiality, all information we receive about you. The only information we collect from you is your name, date of birth, address, citizenship status (and country of origin, if applicable), number of shares you hold and your social security number. This information is used only so that we can register your shares, send you periodic reports and other information about us, and send you proxy statements or other information required by law.
We do not share this information with any non-affiliated third-party except as described below:
| |
| • | Authorized personnel of our Adviser. It is our policy that only authorized personnel of our Adviser who need to know your personal information will have access to it. |
| |
| • | Service providers. We may disclose your personal information to companies that provide services on our behalf, such as record keeping, processing your trades and mailing you information. These companies are required to protect your information and use it solely for the purpose for which they received it. |
| |
| • | Courts and government officials. If required by law, we may disclose your personal information in accordance with a court order or at the request of government regulators. Only that information required by law, subpoena or court order will be disclosed. |
2015 SEMI-ANNUAL REPORT
PRIORITY INCOME FUND, INC. 32
BOARD OF DIRECTORS
Independent Directors
Andrew C. Cooper
William J. Gremp
Eugene S. Stark
Interested Directors(1)
M. Grier Eliasek
Robert S. Aisner
EXECUTIVE OFFICERS WHO ARE NOT DIRECTORS
Michael D. Cohen, Executive Vice President
Brian H. Oswald, Chief Financial Officer, Chief Compliance Officer, Treasurer and Secretary
ADVISER
Priority Senior Secured Income Management, LLC
10 East 40th Street, 42nd Floor
New York, NY 10016
____________
(1)As defined under the Investment Company Act of 1940, as amended.
2015 SEMI-ANNUAL REPORT
PRIORITY INCOME FUND, INC. 33
Item 2. Code of Ethics.
The information required by this item is not required in a semi-annual report on this Form N-CSRS.
Item 3. Audit Committee Financial Expert.
The information required by this item is not required in a semi-annual report on this Form N-CSRS.
Item 4. Principal Accountant Fees and Services.
The information required by this item is not required in a semi-annual report on this Form N-CSRS.
Item 5. Audit Committee of Listed Registrant.
The information required by this item is not required in a semi-annual report on this Form N-CSRS.
Item 6. Schedule of Investments.
Please see the schedule of investments contained in this report to Shareholders included under Item 1 of this Form N-CSRS.
Item 7. Disclosure of Proxy Voting Policies and Procedures for Closed-End Management Investment Companies.
The information required by this item is not required in a semi-annual report on this Form N-CSRS.
Item 8. Portfolio Managers of Closed-End Investment Companies.
| |
| (a) | The information required by this item is not required in a semi-annual report on this Form N-CSRS. |
| |
| (b) | There has been no change, as of the date of the filing of the semi-annual report on this Form N-CSRS, to any of the portfolio managers identified in response to paragraph (a)(1) of this item in the Registrant's most recent annual report on Form N-CSR. |
Item 9. Purchases of Equity Securities by Closed-End Management Investment Company and Affiliated Purchasers.
Neither the Registrant nor any affiliated purchasers, as defined in Rule 10b-18(a)(3) under the Securities Exchange Act of 1934, purchased any shares of the Registrant that are registered by the Registrant pursuant to Section 12 of the Securities Exchange Act of 1934, other than the 11,111 and 6,754 Class I shares that our Adviser purchased on October 10, 2012 and February 6, 2013, respectively, for $9.00 and $21.70 per share, respectively.
Item 10. Submission of Matters to a Vote of Security Holders.
Not applicable.
Item 11. Controls and Procedures.
| |
| (a) | Based on an evaluation of the Disclosure Controls and Procedures (as defined in Rule 30a-3(c) under the Investment Company Act of 1940, the “Disclosure Controls”) as of a date within 90 days prior to the filing date (the “Filing Date”) of this Form N-CSRS (the “Report”), the Chief Executive Officer (its principal executive officer) and Chief Financial Officer (its principal financial officer) have concluded that the Disclosure Controls are reasonably designed to ensure that information required to be disclosed by the Registrant in the Report is recorded, processed, summarized and reported by the Filing Date, including ensuring that information required to be disclosed in the Report is accumulated and communicated to the Registrant’s management, including the Registrant’s principal executive officer and principal financial officer, as appropriate to allow timely decisions regarding required disclosure. |
| |
| (b) | There was no change in the Registrant’s internal control over financial reporting (as defined in Rule 30a-3(d) under the 1940 Act) over the second fiscal quarter of the period covered by this report that has materially affected, or is reasonably likely to materially affect, the Registrant’s internal control over financial reporting. |
Item 12. Exhibits.
(a)(1) Not applicable.
(a)(2) Certifications of principal executive officer and principal financial officer as required by Rule 30a-2(a) under the Investment Company Act of 1940.
(a)(3) Not applicable.
(b) Certifications of principal executive officer and principal financial officer as required by Rule 30a-2(b) under the Investment Company Act of 1940.
SIGNATURES
Pursuant to the requirements of the Securities Exchange Act of 1934 and the Investment Company Act of 1940, the Registrant has duly caused this report to be signed on its behalf by the undersigned, thereunto duly authorized.
PRIORITY INCOME FUND, INC.
By: /s/ M. Grier Eliasek
M. Grier Eliasek
Chief Executive Officer and President
Date: February 27, 2015
Pursuant to the requirements of the Securities Exchange Act of 1934 and the Investment Company Act of 1940, this report has been signed below by the following persons on behalf of the Registrant and in the capacities and on the dates indicated.
By: /s/ M. Grier Eliasek
M. Grier Eliasek
Chief Executive Officer and President
Date: February 27, 2015
By: /s/ Brian H. Oswald
Brian H. Oswald
Chief Financial Officer, Chief Compliance Officer
Treasurer and Secretary
Date: February 27, 2015