UNITED STATES
SECURITIES AND EXCHANGE COMMISSION
Washington, D.C. 20549
FORM N-CSRS
CERTIFIED SHAREHOLDER REPORT OF REGISTERED
MANAGEMENT INVESTMENT COMPANIES
Investment Company Act file number 811-22725
Priority Income Fund, Inc.
(Exact name of registrant as specified in charter)
10 East 40th Street, 42nd Floor
New York, NY 10016
(Address of principal executive offices)
M. Grier Eliasek
Chief Executive Officer
Priority Income Fund, Inc.
10 East 40th Street, 42nd Floor
New York, NY 10016
(Name and address of agent for service)
Registrant’s telephone number, including area code: (212) 448-0702
Date of fiscal year end: June 30
Date of reporting period: December 31, 2018
Item 1. Report to Stockholders.
The semi-annual report to stockholders for the six months ended December 31, 2018 is filed herewith pursuant to Rule 30e-1 under the Investment Company Act of 1940, as amended.
Semi-Annual Report
December 31, 2018
priorityincome.com
Priority Income Fund, Inc. (the “Company”) is an externally managed, non-diversified, closed-end investment management company registered under the Investment Company Act of 1940, as amended. The Company has elected to be treated for tax purposes as a regulated investment company under Subchapter M of the Internal Revenue Code of 1986, as amended.
INVESTMENT OBJECTIVE
The Company’s investment objective is to generate current income and, as a secondary objective, long-term capital appreciation. We expect to seek to achieve our investment objective by investing, under normal circumstances at least 80% of our total assets, in senior secured loans made to companies whose debt is rated below investment grade or, in limited circumstances, unrated, which we collectively refer to as “Senior Secured Loans,” with an emphasis on current income. Our investments may take the form of the purchase of Senior Secured Loans (either in the primary or secondary markets) or through investments in the equity and junior debt tranches of collateralized loan obligation (“CLO”) vehicles that in turn own pools of Senior Secured Loans. The Company intends to invest in both the primary and secondary markets.
TABLE OF CONTENTS
|
| |
| |
| |
| | |
| Index to Financial Statements | |
| |
| |
| |
| |
| |
| |
| | |
| |
| |
| |
2019 SEMI-ANNUAL REPORT
PRIORITY INCOME FUND, INC. 4
Letter to Stockholders
Dear Stockholders,
We are pleased to present this semi-annual report of Priority Income Fund, Inc. (“we,” “us,” “our,” the “Company” or “Priority”) for the six months ended December 31, 2018. Priority has made regular monthly distributions for each month of the past twenty quarters and declared bonus distributions for each of the past twenty quarters.
Dividend Policy
To qualify for tax treatment as a regulated investment company, the Company is required to pay out distributions as determined in accordance with federal income tax regulations (distributable income), rather than accounting income. In certain periods, we expect our annual distributable income to be higher or lower than our reportable accounting income. In addition to net investment income, our dividend policy considers in part our estimate of our distributable income, which includes (1) interest income from our underlying collateralized loan obligation (“CLO”) equity investments, (2) recognition of certain mark-to-market gains or losses to the extent that the fair market value of our CLO investments is determined to deviate from its adjusted tax basis, and (3) acceleration of unamortized fees and expenses following the refinancing or reset of a CLO’s liabilities. As a result, distributable income may differ from accounting income, as expressed by net investment income.
Our distributions may exceed our earnings, and therefore, portions of the distributions that we make may be a return of the money that you originally invested and represent a return of capital to you for tax purposes.
Market Commentary
In this semi-annual report, we refer to “Senior Secured Loans” collectively as senior secured loans made to primarily U.S. companies whose debt is rated below investment grade or, in some circumstances, unrated. These investments, which are often referred to as “junk” or “high yield,” have predominantly speculative characteristics with respect to the issuer’s capacity to pay interest and repay principal. They may also be difficult to value and illiquid.
Calendar year 2018 represented a year where we continued to implement Priority’s strategy of targeting attractive risk-adjusted investments in CLO debt and CLO equity that further our primary objective of providing our stockholders with current income. Priority accomplished the following in calendar year 2018:
| |
| (i) | Invested in 33 CLO equity investments totaling $129.8 million in par value and $98.2 million in cost basis and 8 CLO debt investments totaling $35.8 million in par value and $34.6 million in cost basis. |
| |
| (ii) | Increased the base dividend from 7.0% (as a percentage of our gross offering price) to 8.0% in September 2018. |
| |
| (iii) | Continued to pay a base dividend and bonus dividend totaling 10.0% based on our original gross offering price of $15.00 per share. |
| |
| (iv) | Issued its inaugural preferred stock offering (NYSE: PRIFA) in June 2018 totaling $34.0 million with a coupon of 6.375% and a second preferred stock offering (NYSE: PRIFB) in October 2018 totaling $25.0 million with a coupon of 6.25%. The preferred offering resulted in a ratio of 0.17x preferred to common equity as of December 31, 2018. Our goal is to target 0.50x debt plus preferred to common equity over time. |
Since our last annual report period end date of June 30, 2018, Priority invested in 19 CLO equity investments totaling $65.0 million in par value and $52.3 million in cost basis and 7 CLO debt investments totaling $35.8 million in par value and $34.5 million in cost basis. We increased our exposure to CLO debt investments as the volatility in the second half of 2018 resulted in higher returns for CLO debt and attractive risk adjusted returns.
As of December 31, 2018, Priority held 97 CLO equity investments and 8 CLO debt investment with an underlying collateral pool of over 2,800 Senior Secured Loans.
On a macro level, the calendar year 2018 was a tale of two halves. In the first 6 months of the year, we saw the following themes: (1) strong issuance in the Senior Secured Loan and CLO markets, (2) spread compression in the Senior Secured Loan
2019 SEMI-ANNUAL REPORT
PRIORITY INCOME FUND, INC. 5
market, and (3) the repeal of the risk retention requirements under the Dodd Frank Wall Street Reform and Consumer Protection Act applicable to U.S. CLOs (“Risk Retention”).
In the last 6 months of the year and specifically the fourth quarter of 2018, we saw considerable volatility in equity and fixed income markets that resulted in (1) a decline in issuance in the Senior Secured Loan market, (2) a limited amount of repricings and refinancings in the Senior Secured Loan market, resulting in the weighted average spread of Priority’s underlying Senior Secured Loan portfolio increasing for the first time in two years from 3.37% at June 30, 2018 to 3.42% at December 31, 2018, and (3) the S&P / LSTA Leveraged Loan Index declining from 98.61% at September 30, 2018 to 93.84% at December 31, 2018.1
U.S. CLO issuance in 2018 was $128.86 billion2, a 9.1% increase from 2017, narrowly surpassing the prior record of $124.1 billion in 2014. While CLO issuance in 2018 was the highest on record, it was in line with analyst projections of $100 billion to $140 billion. Strong CLO issuance in 2018 led to the CLO market size increasing to $579 billion at December 31, 20183, and CLOs represented 67.8% of the buyer base in the institutional Senior Secured Loan market4, highlighting the importance of the CLO market.
CLO research analysts are projecting issuance volumes in 2019 in the range of $90 billion to $140 billion5:
| |
| • | Bank of America Merrill Lynch: $105 billion |
| |
| • | Deutsche Bank: $110 billion |
| |
| • | JP Morgan: $130 billion - $140 billion |
| |
| • | Morgan Stanley: $90 billion |
| |
| • | Wells Fargo: $110 billion |
There was continued elevated volume of CLO refinancings and CLO resets (also known as extensions) in 2018. A CLO refinancing is an occurrence where all or part of the CLO liabilities are refinanced at a lower spread without a change in CLO maturity. The CLO refinancing at lower rates directly benefits the equity investors in CLOs given such refinancing reduces the spread cost of CLO financing. A CLO reset is an occurrence where all of the CLO liabilities are refinanced and the CLO reinvestment period is extended typically by two to five years. In 2018, $122.09 billion of CLOs were reset and $33.8 billion of CLOs were refinanced.2 CLO resets were more prevalent than CLO refinancings due to the repeal of Risk Retention. Prior to the repeal of Risk Retention, a CLO was previously required to be Risk Retention compliant in order to complete a CLO reset and the reset typically required CLO managers to inject additional capital into the CLO.
Priority participated in resets, which extended the liabilities, in 34 CLOs in its portfolio in 2018, reducing the spread cost of CLO financing by an average of 20 basis points and extending the reinvestment period by an average of 4.3 years. We continue to actively manage the portfolio and maximize value through resetting CLOs in our portfolio to help offset the spread compression in the Senior Secured Loan market and lengthen the life of a CLO as much as possible. Priority also refinanced the liabilities in 9 additional CLOs in 2018, reducing the liability spreads by an average of 45 basis points.
Issuance in the institutional Senior Secured Loan market (including refinancings) remained strong in the first six calendar months of 2018 with $270.4 billion in issuance.6 Issuance slowed down in the last six calendar months of 2018 to $165.6 billion due to the aforementioned volatility.6 We observed a continuance in the rate of Senior Secured Loan refinancings and repricings in the first six calendar months of 2018 with $85.6 billion of refinancings and an additional $233.4 billion of repricings.6 Repricings are instances where corporate borrowers are able to reduce the spread over Libor via an amendment. The pace of refinancings and repricings slowed considerably in the last six calendar months of 2018 with $30.8 billion of refinancings and $37.3 billion of repricings due to the market volatility.6
Priority’s Net Asset Value per share ("NAV") stood at $13.05 at December 31, 2018 compared to $13.47 at June 30, 2018, representing a 3.1% decline. The decline in NAV since June 30, 2018 is primarily a function of unrealized valuation changes driven by the volatility experienced in financial markets.
We believe the market volatility in the fourth quarter of 2018 is beneficial for Priority for the following reasons: (1) it halted the spread compression in the underlying Senior Secured Loans we had experienced over the past 2 years, (2) it increased the new issue spreads for Senior Secured Loans, which helped increase the weighted average spread of the underlying Senior Secured Loan portfolio for Priority, (3) it allows each of our CLOs to purchase loans at discounted prices as the S&P / LSTA leverage loan Index declined to 93.84% at December 31, 2018, (4) the financings for each individual CLO is typically locked-in for 10
2019 SEMI-ANNUAL REPORT
PRIORITY INCOME FUND, INC. 6
to 13 years so the financing cost for each CLO is not increasing, and (5) we believe fundamentals in the Senior Secured Loan market continue to remain strong.
We continue to believe that the following factors indicate that long-term fundamentals in the CLO market remain solid:
| |
| • | The equity tranches of U.S. cash flow CLOs have delivered over 21.0% annual cash average yields from January 2003 through December 2018.7 |
| |
| • | Default rates for Senior Secured Loans continue to remain below the historical average in the U.S. of 2.24% from January 1, 2003 to December 31, 2018.6 The market trailing 12-month (“TTM”) default rate as of December 31, 2018 was 1.63% compared to 0.46% default rate in the Senior Secured Loans underlying the CLOs held by Priority.6 Priority’s TTM default rate continues to outperform the market default rate with a current Priority outperformance of 1.17%. |
| |
| • | We continue to be underweight in both the retail and oil & gas industries relative to the concentration of these loans in the Senior Secured Loan market due to the underperformance seen in both markets. At December 31, 2018, Priority’s exposure to the oil & gas industry was 2.19% compared to 2.86% in the Senior Secured Loan market4 and 15.7% in the U.S. high-yield bond market.8 Priority’s exposure to the retail industry was 4.12% compared to 4.48% in the Senior Secured Loan market at December 31, 2018.4 We have evaluated our oil & gas and retail exposures with our collateral managers, and we continue to monitor our positions in this sector. |
| |
| • | We believe the health of corporations continued to improve in 2018. Year-over-year earnings before interest, taxes, depreciation and amortization (“EBITDA”) growth among Senior Secured Loan borrowers remained robust at 13.31% in the third calendar quarter of 2018.6 |
| |
| • | Despite the Federal Reserve increasing short-term interest rates four times in 2018 and three times in 2017, cash flow coverage of borrowers in the Senior Secured Loans underlying the CLOs continues to be solid. The average ratio of EBITDA less capital expenditures to cash interest was 2.78x, and the average ratio of EBITDA to cash interest was 3.55x in 2018, illustrating borrowers have a cushion to continue making ongoing interest payments.4 |
We believe the following factors indicate that the long-term fundamentals for the investments held by Priority remain attractive: (1) Priority continues to be underweight in the oil & gas and retail industries, (2) Priority’s portfolio TTM default rate as of December 31, 2018 stood at 0.46% (significantly less than the market TTM default rate of 1.63%), and (3) the underlying Senior Secured Loan portfolio in Priority experienced an increase in the weighted average spread for the first time in 2 years.
M. Grier Eliasek
Chief Executive Officer
This letter may contain certain forward-looking statements within the meaning of the Private Securities Litigation Reform Act of 1995, including statements regarding the future performance of Priority Income Fund, Inc. Words such as “believes,” “expects,” and “future” or similar expressions are intended to identify forward-looking statements. Any such statements, other than statements of historical fact, are highly likely to be affected by unknowable future events and conditions, including elements of the future that are or are not under the control of Priority Income Fund, Inc., and that Priority Income Fund, Inc. may or may not have considered. Accordingly, such statements cannot be guarantees or assurances of any aspect of future performance. Actual developments and results may vary materially from any forward-looking statements. Such statements speak only as of the time when made. Priority Income Fund, Inc. undertakes no obligation to publicly update or revise any forward-looking statements, whether as a result of new information, future events or otherwise. We caution investors that the past performance described above is not indicative of future returns. Index and asset class performance quoted above does not reflect the fees, expenses or taxes that a stockholder may incur. The results described above may not be representative of our portfolio.
_____________________________________
1. S&P Capital IQ - S&P-LSTA Leveraged Loan Index
2. S&P Capital IQ - CLO Global Databank
3. Wells Fargo - The CLO Monthly Market Overview, January 3, 2019 - Page 17
4. S&P Capital IQ - LCD Quarterly Review 4Q’18 - Slide 114 (CLO as a % of loan market), Slide 177 (industry breakdown), Slide 8 (interest coverage)
5. S&P Capital IQ - 2019 US CLO Outlook: Braced for turbulence but not expecting crash, December 21, 2018
6. S&P Capital IQ - Wrap Charts 4Q 2018 - Chart 1 (new issue volume), Chart 9 (refinancing and repricing volume), Chart 29 (defaults), Chart 30 (EBITDA Growth)
7. Citigroup Global Markets Research, January 23, 2019
8. Bank of America Merrill Lynch
2019 SEMI-ANNUAL REPORT
PRIORITY INCOME FUND, INC. 7
|
| | | | | | | | | | |
| Portfolio Composition - At a Glance |
| | | | | | | | | |
| Top Ten Holdings | | | | | | | | |
| As of December 31, 2018 | | | | | | | | |
| | | | | | | | | |
| Portfolio Investment | | Investment | | Legal Maturity | | Fair Value | | % of Net Assets |
| OZLM XXII, Ltd. | | Subordinated Notes | | 1/17/2031 | | 14,720,278 |
| | 4.2 | % |
| Carlyle Global Market Strategies CLO 2014-3-R, Ltd. | | Subordinated Notes | | 7/28/2031 | | 13,325,574 |
| | 3.8 | % |
| Carlyle Global Market Strategies CLO 2013-1, Ltd. | | Subordinated Notes | | 8/14/2030 | | 12,210,769 |
| | 3.5 | % |
| Octagon Investment Partners XXIII, Ltd. | | Subordinated Notes | | 7/15/2027 | | 11,128,522 |
| | 3.2 | % |
| Venture 28A CLO, Ltd. | | Subordinated Notes | | 10/20/2029 | | 10,635,433 |
| | 3.1 | % |
| Madison Park Funding XIV, Ltd. | | Subordinated Notes | | 10/22/2030 | | 9,967,589 |
| | 2.9 | % |
| Voya CLO 2018-1, Ltd. | | Subordinated Notes | | 4/19/2031 | | 9,314,161 |
| | 2.7 | % |
| West CLO 2014-1 Ltd. | | Subordinated Notes | | 7/18/2026 | | 9,054,865 |
| | 2.6 | % |
| Madison Park Funding XIII, Ltd. | | Subordinated Notes | | 1/19/2025 | | 9,043,703 |
| | 2.6 | % |
| Carlyle Global Market Strategies CLO 2017-5, Ltd. | | Subordinated Notes | | 1/20/2030 | | 8,954,438 |
| | 2.6 | % |
Portfolio Composition
|
| | |
| Number of Loans Underlying the Company’s CLO Investments | 2,839 |
|
| Dollar Amount of Loans Underlying the Company’s CLO Investments | $52.0 billion |
|
| Percentage of Collateral Underlying the Company’s CLO Investments that are in Default | 0.21% |
|
| Last Twelve Months Default Rate of Collateral Underlying the Company’s CLO Investments | 0.46% |
|
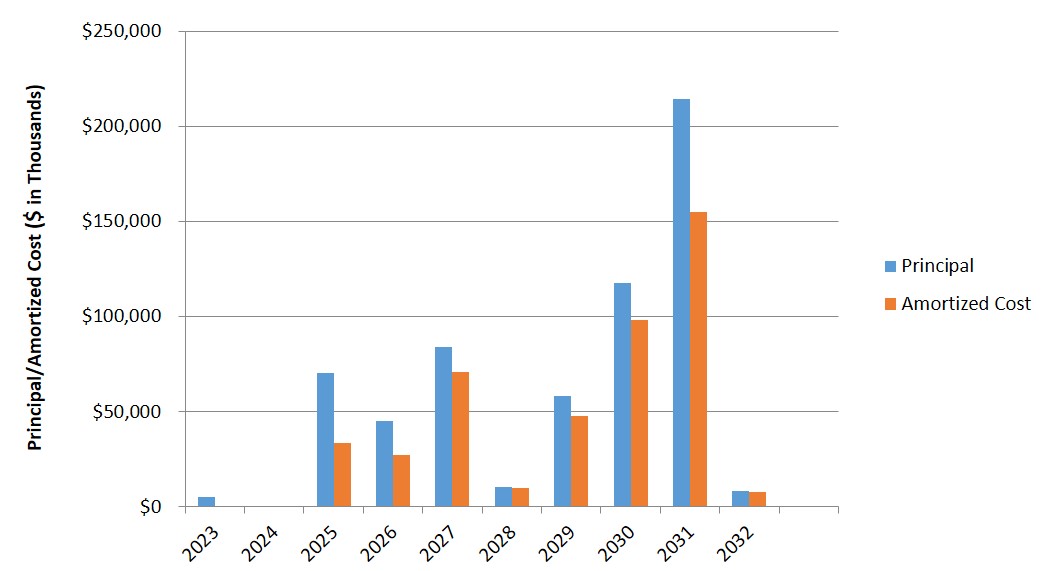
Legal Maturity of Portfolio Securities
2019 SEMI-ANNUAL REPORT
PRIORITY INCOME FUND, INC. 8
Collateral Summary
|
| | |
| Number of loans underlying the Company’s CLO investments | 2,839 |
|
| Largest exposure to any individual borrower | 0.88 | % |
| Average individual borrower exposure | 0.07 | % |
| Aggregate exposure to 10 largest borrowers | 6.31 | % |
| Aggregate exposure to senior secured loans | 98.46 | % |
| Weighted average stated spread | 3.42 | % |
| Weighted average LIBOR floor | 0.96 | % |
| Weighted average percentage of floating rate loans with LIBOR floors | 53.21 | % |
| Weighted average credit rating of underlying collateral based on average Moody’s rating | B2/B3 |
|
| Weighted average maturity of underlying collateral | 5.0 |
|
| U.S. dollar currency exposure | 100 | % |
|
| | | | | | | |
Underlying Secured Loan Rating Distribution (Moody’s / S&P)(1) |
| Quarter-End | Aaa/AAA | A/A | Baa/BBB | Ba/BB | B/B | Caa/CCC and Lower | Unrated |
| 12/31/2018 | 0.00% / 0.00% | 0.07% / 0.00% | 3.64% / 1.76% | 26.46% / 23.32% | 62.89% / 67.04% | 4.26% / 4.53% | 1.51% / 2.17% |
(1)Excludes structured product assets and newly issued transactions for which collateral data is not yet available. |
| |
| Cash is included within the denominator of the above calculations, but is not rated by Moody’s/S&P. |
2019 SEMI-ANNUAL REPORT
PRIORITY INCOME FUND, INC. 9
|
| | | | | | | | |
Statement of Assets and Liabilities (unaudited) |
| As of December 31, 2018 |
| | | | | | | |
| Assets | |
| Investments, at fair value (amortized cost $449,559,629) | $ | 413,193,877 |
|
| Cash | 2,430,543 |
|
| Receivable for capital shares sold | 1,759,776 |
|
| Interest receivable | 530,174 |
|
| Deferred offering costs (Note 5) | 153,563 |
|
| Due from affiliate (Note 5) | 134,717 |
|
| Prepaid expenses | 115,454 |
|
| | | | | Total assets | 418,318,104 |
|
| Liabilities | |
Mandatorily redeemable preferred stock; ($0.01 par value; 15,000,000 shares authorized; 1,360,000 Series A Term Preferred Stock outstanding with net of offering costs of $304,622 and unamortized discount of $1,003,628; 1,000,000 Series B Term Preferred Stock outstanding with net offering costs of $273,097 and unamortized discount of $758,146) (Note 7) | 56,660,507 |
|
| Payable for investment securities purchased | 8,640,000 |
|
| Due to Adviser (Note 5) | 4,798,414 |
|
| Accrued expenses | 1,276,550 |
|
| Due to Administrator (Note 5) | 37,572 |
|
| Due to affiliate (Note 5) | 10,048 |
|
| Preferred dividend payable | 2,020 |
|
| | | | | Total liabilities | 71,425,111 |
|
| Commitments and contingencies (Note 10) | — |
|
| Net assets | $ | 346,892,993 |
|
| | |
| Components of net assets: | |
| Common stock, $0.01 par value; 185,000,000 shares authorized; 26,573,578 shares issued and | |
| | outstanding (Note 4) | $ | 265,736 |
|
| Paid-in capital in excess of par | 343,328,677 |
|
| Accumulated undistributed net investment income | 43,957,965 |
|
| Accumulated net realized loss | (4,293,634 | ) |
| Net unrealized loss on investments | (36,365,751 | ) |
| Net assets | $ | 346,892,993 |
|
| | | | | | | |
| Net asset value per share | $ | 13.05 |
|
| |
| See accompanying notes to financial statements. |
2019 SEMI-ANNUAL REPORT
PRIORITY INCOME FUND, INC. 10
|
| | | | | | | | |
Statement of Operations (unaudited) |
| For the six months ended December 31, 2018 |
| | |
| Investment income | |
| Interest income from investments | $ | 34,268,609 |
|
| | | | | Total investment income | 34,268,609 |
|
| Expenses | |
| Incentive fee (Note 5) | 5,251,199 |
|
| Base management fee (Note 5) | 3,940,263 |
|
| Total investment advisory fees | 9,191,462 |
|
| | |
| Preferred dividend expense | 1,517,927 |
|
| Transfer agent fees and expenses | 663,334 |
|
| Audit and tax expense | 459,302 |
|
| Valuation services | 406,857 |
|
| Adviser shared service expense (Note 5) | 228,903 |
|
| Report and notice to shareholders | 213,393 |
|
| General and administrative | 165,102 |
|
| Amortization of offering costs (Note 5) | 137,460 |
|
| Administrator costs (Note 5) | 128,986 |
|
| Legal expense | 113,823 |
|
| Insurance expense | 99,723 |
|
| Director fees | 75,000 |
|
| Total expenses | 13,401,272 |
|
| Expense support repayment (Note 5) | — |
|
| Net expenses | 13,401,272 |
|
| Net investment income | 20,867,337 |
|
| Net realized and unrealized loss on investments | |
| Net realized loss on investments | (2,188,274 | ) |
| Net increase in unrealized loss on investments | (11,432,521 | ) |
| Net realized and unrealized loss on investments | (13,620,795 | ) |
| Net increase in net assets resulting from operations | $ | 7,246,542 |
|
| |
| See accompanying notes to financial statements. |
2019 SEMI-ANNUAL REPORT
PRIORITY INCOME FUND, INC. 11
|
| | | | | | | | | | | | |
| Statements of Changes in Net Assets |
| | | | | | | | | |
| | | | | | | Six Months Ended | Year Ended | |
| | | | | | | December 31, 2018 | June 30, 2018 | |
| | | | | | | (unaudited) | | |
| Net increase in net assets resulting from operations: | | | |
| Net investment income | $ | 20,867,337 |
| $ | 36,126,816 |
| |
| Net realized loss on investments | (2,188,274 | ) | (943,705 | ) | |
| Net increase in unrealized loss on investments | (11,432,521 | ) | (25,902,826 | ) | |
| | | | | Net increase in net assets resulting from operations | 7,246,542 |
| 9,280,285 |
| |
| Distributions to stockholders: | | | |
| Dividends from net investment income (Notes 6 and 8) | (7,671,449 | ) | (18,937,383 | ) | |
| Return of capital (Notes 6 and 8) | (11,293,866 | ) | (14,430,036 | ) | |
| Capital gain (Notes 6 and 8) | — |
| (573,782 | ) | |
| | | | | Total distributions to stockholders | (18,965,315 | ) | (33,941,201 | ) | |
| Capital transactions: | | | |
| Gross proceeds from shares sold (Note 4) | 25,241,679 |
| 76,497,782 |
| |
| Commissions and fees on shares sold (Note 5) | (1,858,465 | ) | (5,824,712 | ) | |
| Reinvestment of dividends (Note 4) | 10,954,447 |
| 15,807,913 |
| |
| Repurchase of common shares (Note 4) | (8,407,807 | ) | (14,171,501 | ) | |
| | | | | Net increase in net assets from capital transactions | 25,929,854 |
| 72,309,482 |
| |
| | | | | Total increase in net assets | 14,211,081 |
| 47,648,566 |
| |
| Net assets: | | | |
| Beginning of year or period | 332,681,912 |
| 285,033,346 |
| |
End of year or period (a) | $ | 346,892,993 |
| $ | 332,681,912 |
| |
| | | | | | | | | |
(a)Includes accumulated undistributed net investment income of (Note 8): | $ | 43,957,965 |
| $ | 30,762,077 |
| |
| |
| See accompanying notes to financial statements. |
2019 SEMI-ANNUAL REPORT
PRIORITY INCOME FUND, INC. 12
|
| | | | | | | | |
Statement of Cash Flows (unaudited) |
| For the six months ended December 31, 2018 |
| | | | | | | |
| Cash flows used in operating activities: | |
| Net increase in net assets resulting from operations | $ | 7,246,542 |
|
| Adjustments to reconcile net increase in net assets resulting from operations to | |
| net cash used in operating activities: | |
| Amortization of common stock offering costs | 137,460 |
|
| Amortization of purchase discount, net | (1,479,399 | ) |
| Amortization of preferred stock offering costs | 25,755 |
|
| Amortization of preferred stock discount | 81,648 |
|
| Purchases of investments | (86,851,112 | ) |
| Proceeds from sales of investments | — |
|
| Distributions received from investments | 4,988,156 |
|
| Net realized loss on investments | 2,188,274 |
|
| Net increase in unrealized loss on investments | 11,432,521 |
|
| (Increase) Decrease in operating assets: | |
| Deferred offering costs (Note 5) | 11,997 |
|
| Interest receivable | (453,822 | ) |
| Due from affiliate (Note 5) | (14,624 | ) |
| Prepaid expenses | 57,678 |
|
| Increase (Decrease) in operating liabilities: | |
| Payable for investment securities purchased | (1,011,717 | ) |
| Due to Adviser (Note 5) | (389,787 | ) |
| Accrued expenses | 225,906 |
|
| Due to Administrator (Note 5) | (45,557 | ) |
| Due to affiliate (Note 5) | (18,972 | ) |
| Preferred dividend payable | (4,001 | ) |
| Net cash used in operating activities | (63,873,054 | ) |
| Cash flows provided by financing activities: | |
| Gross proceeds from shares sold (Note 4) | 24,500,782 |
|
| Commissions and fees on shares sold (Note 5) | (1,801,240 | ) |
| Distributions paid to stockholders | (12,906,693 | ) |
| Repurchase of common shares (Note 4) | (8,407,807 | ) |
| Proceeds from the issuance of mandatorily redeemable preferred stock (Note 7) | 24,218,750 |
|
| Deferred issuance costs for the issuance of preferred stock | (337,555 | ) |
| Net cash provided by financing activities | 25,266,237 |
|
| Net increase in cash | (38,606,817 | ) |
| Cash, beginning of period | 41,037,360 |
|
| Cash, end of period | $ | 2,430,543 |
|
| | |
| Supplemental information | |
| Value of shares issued through reinvestment of dividends | $ | 10,954,447 |
|
| |
| See accompanying notes to financial statements. |
2019 SEMI-ANNUAL REPORT
PRIORITY INCOME FUND, INC. 13
|
| | | | | | | | | | | | | | |
Schedule of Investments (unaudited) |
| As of December 31, 2018 |
|
| | | | | | | | | | | | | | | | | | | | | | | | |
Portfolio Investments(1)(9) | | Investment | | Estimated Yield(2)/Interest Rate | | Legal Maturity | | Acquisition date(11) | | Principal Amount | | Amortized Cost | | Fair Value(3)
Level 3 | | % of Net Assets |
| Collateralized Loan Obligation - Equity Class (Cayman Islands) |
| Adams Mill CLO Ltd. | | Subordinated Notes | | 3.99 | % | | 7/15/2026 | | 8/12/2014 | | $ | 500,000 |
| | $ | 319,076 |
| | $ | 223,625 |
| | 0.1 | % |
Apidos CLO XVIII(5)(10) | | Subordinated Notes | | — | % | | 7/22/2026 | | 7/29/2014 | | 750,000 |
| | 156,774 |
| | 29,697 |
| | — | % |
| Apidos CLO XVIII-R | | Subordinated Notes | | 18.41 | % | | 10/22/2030 | | 10/22/2018 | | 410,000 |
| | 443,816 |
| | 418,124 |
| | 0.1 | % |
| Apidos CLO XXI | | Subordinated Notes | | 15.58 | % | | 7/18/2027 | | 6/18/2015 | | 5,000,000 |
| | 4,362,381 |
| | 3,595,210 |
| | 1.0 | % |
Apidos CLO XXII(4) | | Subordinated Notes | | 10.72 | % | | 10/20/2027 | | 10/14/2015 | | 3,000,000 |
| | 2,711,022 |
| | 2,349,948 |
| | 0.7 | % |
Babson CLO Ltd. 2014-II(5)(10) | | Subordinated Notes | | — | % | | 10/17/2026 | | 9/18/2014 | | 1,000,000 |
| | 368,052 |
| | 65,381 |
| | — | % |
| Babson CLO Ltd. 2015-I | | Subordinated Notes | | 16.16 | % | | 1/20/2031 | | 4/29/2015 | | 3,400,000 |
| | 2,502,931 |
| | 1,981,098 |
| | 0.6 | % |
Barings CLO Ltd. 2018-III(4) | | Subordinated Notes | | 14.28 | % | | 7/20/2029 | | 11/18/2014 | | 397,600 |
| | 244,046 |
| | 201,008 |
| | 0.1 | % |
BlueMountain CLO 2012-1 Ltd.(5)(10) | | Subordinated Notes | | —% |
| | 7/20/2023 | | 5/3/2016 | | 5,000,000 |
| | 122,860 |
| | 7,830 |
| | — | % |
| BlueMountain CLO 2012-2 Ltd. | | Subordinated Notes | | 11.86 | % | | 11/20/2028 | | 1/14/2015 | | 3,000,000 |
| | 2,525,957 |
| | 1,981,383 |
| | 0.6 | % |
| BlueMountain CLO 2013-2 Ltd. | | Subordinated Notes | | 11.26 | % | | 10/22/2030 | | 10/6/2015 | | 1,900,000 |
| | 1,425,118 |
| | 1,048,420 |
| | 0.3 | % |
| BlueMountain Fuji US CLO II Ltd. | | Subordinated Notes | | 14.08 | % | | 10/20/2030 | | 9/28/2017 | | 2,500,000 |
| | 2,354,581 |
| | 2,090,813 |
| | 0.6 | % |
California Street CLO XI Limited Partnership(5)(10) | | LP Certificates | | — | % | | 1/17/2025 | | 12/23/2014 | | 18,330,000 |
| | 344,683 |
| | 58,308 |
| | — | % |
| California Street CLO XII, Ltd. | | Subordinated Notes | | 1.38 | % | | 10/15/2025 | | 9/17/2015 | | 14,500,000 |
| | 8,304,925 |
| | 6,763,349 |
| | 1.9 | % |
| Carlyle Global Market Strategies CLO 2013-1, Ltd. | | Subordinated Notes | | 19.36 | % | | 8/14/2030 | | 6/30/2016 | | 17,550,000 |
| | 13,065,059 |
| | 12,210,769 |
| | 3.5 | % |
| Carlyle Global Market Strategies CLO 2013-4, Ltd. | | Income Notes | | 21.06 | % | | 1/15/2031 | | 12/28/2016 | | 11,839,488 |
| | 7,080,103 |
| | 6,958,676 |
| | 2.0 | % |
| Carlyle Global Market Strategies CLO 2014-1, Ltd. | | Income Notes | | 31.51 | % | | 4/17/2025 | | 3/3/2016 | | 12,870,000 |
| | 6,806,933 |
| | 8,785,580 |
| | 2.5 | % |
| Carlyle Global Market Strategies CLO 2014-3-R, Ltd. | | Subordinated Notes | | 16.85 | % | | 7/28/2031 | | 6/15/2018 | | 15,000,000 |
| | 12,992,104 |
| | 13,325,574 |
| | 3.8 | % |
| Carlyle Global Market Strategies CLO 2016-1, Ltd. | | Subordinated Notes | | 24.78 | % | | 4/20/2027 | | 4/20/2016 | | 6,500,000 |
| | 5,864,241 |
| | 6,127,408 |
| | 1.8 | % |
Carlyle Global Market Strategies CLO 2016-3, Ltd.(4) | | Subordinated Notes | | 17.13 | % | | 10/20/2029 | | 9/13/2016 | | 1,400,000 |
| | 1,449,796 |
| | 1,248,483 |
| | 0.4 | % |
Carlyle Global Market Strategies CLO 2017-5, Ltd.(4) | | Subordinated Notes | | 16.17 | % | | 1/20/2030 | | 1/30/2018 | | 10,000,000 |
| | 9,837,096 |
| | 8,954,438 |
| | 2.6 | % |
| Cedar Funding II CLO, Ltd. | | Subordinated Notes | | 15.22 | % | | 6/10/2030 | | 9/29/2017 | | 2,500,000 |
| | 1,962,798 |
| | 1,829,068 |
| | 0.5 | % |
| Cedar Funding IV CLO, Ltd. | | Subordinated Notes | | 12.94 | % | | 7/23/2030 | | 6/23/2017 | | 9,592,857 |
| | 9,358,077 |
| | 8,123,168 |
| | 2.3 | % |
| Cedar Funding V CLO, Ltd. | | Subordinated Notes | | 17.41 | % | | 7/17/2031 | | 10/17/2018 | | 2,358,000 |
| | 2,439,784 |
| | 2,308,015 |
| | 0.7 | % |
| Cedar Funding VI CLO, Ltd. | | Subordinated Notes | | 16.85 | % | | 10/20/2028 | | 8/10/2017 | | 3,000,000 |
| | 2,953,513 |
| | 2,738,559 |
| | 0.8 | % |
Cent CLO 21 Limited(4) | | Subordinated Notes | | 15.80 | % | | 7/27/2030 | | 6/18/2014 | | 510,555 |
| | 382,962 |
| | 315,191 |
| | 0.1 | % |
| CIFC Funding 2013-I, Ltd. | | Subordinated Notes | | 19.86 | % | | 7/16/2030 | | 6/7/2018 | | 3,000,000 |
| | 1,600,839 |
| | 1,514,345 |
| | 0.4 | % |
| CIFC Funding 2013-II, Ltd. | | Income Notes | | 10.68 | % | | 10/18/2030 | | 2/11/2014 | | 305,000 |
| | 205,108 |
| | 145,472 |
| | — | % |
| CIFC Funding 2014, Ltd. | | Income Notes | | 15.60 | % | | 1/18/2031 | | 3/13/2014 | | 2,758,900 |
| | 1,784,926 |
| | 1,481,939 |
| | 0.4 | % |
2019 SEMI-ANNUAL REPORT
PRIORITY INCOME FUND, INC. 14
|
| | | | | | | | | | | | | | | | | | | | | | | | |
Portfolio Investments(1)(9) | | Investment | | Estimated Yield(2)/Interest Rate | | Legal Maturity | | Acquisition date(11) | | Principal Amount | | Amortized Cost | | Fair Value(3)
Level 3 | | % of Net Assets |
| Collateralized Loan Obligation - Equity Class (Cayman Islands) |
| CIFC Funding 2014-III, Ltd. | | Income Notes | | 18.86 | % | | 10/22/2031 | | 11/17/2016 | | $ | 11,700,000 |
| | $ | 7,306,169 |
| | $ | 6,766,870 |
| | 2.0 | % |
CIFC Funding 2014-IV-R, Ltd.(4) | | Income Notes | | 17.34 | % | | 10/17/2030 | | 9/3/2014 | | 4,286,000 |
| | 2,593,153 |
| | 2,308,583 |
| | 0.7 | % |
| CIFC Funding 2015-I, Ltd. | | Subordinated Notes | | 19.89 | % | | 1/22/2031 | | 11/30/2015 | | 7,500,000 |
| | 5,726,912 |
| | 5,316,004 |
| | 1.5 | % |
| CIFC Funding 2015-III, Ltd. | | Subordinated Notes | | 20.45 | % | | 4/19/2029 | | 5/31/2018 | | 10,000,000 |
| | 7,872,024 |
| | 7,585,808 |
| | 2.2 | % |
| CIFC Funding 2015-IV, Ltd. | | Subordinated Notes | | 12.74 | % | | 10/20/2027 | | 5/2/2016 | | 9,100,000 |
| | 7,479,079 |
| | 7,035,189 |
| | 2.0 | % |
CIFC Funding 2016-I, Ltd.(4) | | Subordinated Notes | | 13.64 | % | | 10/21/2028 | | 12/21/2016 | | 2,000,000 |
| | 1,830,072 |
| | 1,665,906 |
| | 0.5 | % |
| CIFC Funding 2017-I, Ltd. | | Subordinated Notes | | 12.61 | % | | 4/21/2029 | | 3/9/2017 | | 8,000,000 |
| | 7,534,156 |
| | 6,500,450 |
| | 1.9 | % |
| CIFC Funding 2017-IV, Ltd. | | Subordinated Notes | | 15.36 | % | | 10/24/2030 | | 9/19/2017 | | 10,000,000 |
| | 9,778,055 |
| | 8,333,833 |
| | 2.4 | % |
Covenant Credit Partners CLO II, Ltd.(5)(6)(10) | | Subordinated Notes | | — | % | | 10/17/2026 | | 11/12/2014 | | 4,392,156 |
| | 506,873 |
| | 658,020 |
| | 0.2 | % |
Galaxy XIX CLO, Ltd.(4) | | Subordinated Notes | | 14.09 | % | | 7/24/2030 | | 12/8/2016 | | 2,750,000 |
| | 1,837,443 |
| | 1,384,303 |
| | 0.4 | % |
Galaxy XXVIII CLO, Ltd.(4) | | Subordinated Notes | | 11.92 | % | | 7/15/2031 | | 6/27/2014 | | 250,000 |
| | 181,628 |
| | 127,374 |
| | — | % |
GoldenTree Loan Opportunities IX, Ltd.(4) | | Subordinated Notes | | 14.91 | % | | 10/29/2029 | | 7/24/2017 | | 3,250,000 |
| | 2,369,748 |
| | 1,753,729 |
| | 0.5 | % |
Halcyon Loan Advisors Funding 2014-2 Ltd.(4)(10) | | Subordinated Notes | | — | % | | 4/28/2025 | | 4/28/2014 | | 400,000 |
| | 219,217 |
| | 125,750 |
| | — | % |
| Halcyon Loan Advisors Funding 2014-3 Ltd. | | Subordinated Notes | | 7.75 | % | | 10/22/2025 | | 9/29/2014 | | 500,000 |
| | 324,242 |
| | 238,774 |
| | 0.1 | % |
| Halcyon Loan Advisors Funding 2015-1 Ltd. | | Subordinated Notes | | 17.11 | % | | 4/20/2027 | | 4/16/2015 | | 3,000,000 |
| | 2,050,209 |
| | 1,814,975 |
| | 0.5 | % |
| Halcyon Loan Advisors Funding 2015-2 Ltd. | | Subordinated Notes | | 19.39 | % | | 7/25/2027 | | 6/24/2015 | | 3,000,000 |
| | 2,260,746 |
| | 2,001,251 |
| | 0.6 | % |
Halcyon Loan Advisors Funding 2015-3 Ltd.(4) | | Subordinated Notes | | 18.20 | % | | 10/18/2027 | | 9/3/2015 | | 7,000,000 |
| | 6,038,222 |
| | 5,360,349 |
| | 1.5 | % |
HarbourView CLO VII-R, Ltd.(4) | | Subordinated Notes | | 22.02 | % | | 7/18/2031 | | 6/10/2015 | | 275,000 |
| | 191,680 |
| | 183,010 |
| | 0.1 | % |
Jefferson Mill CLO Ltd.(4) | | Subordinated Notes | | 13.49 | % | | 10/20/2031 | | 7/28/2015 | | 6,049,689 |
| | 4,650,496 |
| | 3,267,469 |
| | 0.9 | % |
| LCM XV Limited Partnership | | Income Notes | | 7.66 | % | | 7/20/2030 | | 2/25/2014 | | 250,000 |
| | 187,153 |
| | 125,789 |
| | — | % |
| LCM XVI Limited Partnership | | Income Notes | | 11.74 | % | | 10/15/2031 | | 6/19/2014 | | 6,814,685 |
| | 4,361,201 |
| | 3,087,270 |
| | 0.9 | % |
| LCM XVII Limited Partnership | | Income Notes | | 17.62 | % | | 10/15/2031 | | 10/15/2014 | | 1,000,000 |
| | 684,265 |
| | 630,648 |
| | 0.2 | % |
Madison Park Funding XIII, Ltd.(4) | | Subordinated Notes | | 21.86 | % | | 1/19/2025 | | 2/27/2014 | | 13,000,000 |
| | 9,343,255 |
| | 9,043,703 |
| | 2.6 | % |
Madison Park Funding XIV, Ltd.(4) | | Subordinated Notes | | 16.32 | % | | 10/22/2030 | | 8/6/2014 | | 14,000,000 |
| | 10,478,113 |
| | 9,967,589 |
| | 2.9 | % |
| Madison Park Funding XV, Ltd. | | Subordinated Notes | | 17.86 | % | | 1/27/2026 | | 12/29/2014 | | 4,000,000 |
| | 3,032,067 |
| | 3,017,114 |
| | 0.9 | % |
| Mountain View CLO 2014-1 Ltd. | | Income Notes | | 6.19 | % | | 10/15/2026 | | 9/25/2014 | | 1,000,000 |
| | 597,316 |
| | 345,414 |
| | 0.1 | % |
Mountain View CLO IX Ltd.(4) | | Subordinated Notes | | 18.64 | % | | 7/15/2031 | | 6/25/2015 | | 5,000,000 |
| | 3,291,124 |
| | 3,472,589 |
| | 1.0 | % |
Octagon Investment Partners XIV, Ltd.(4) | | Income Notes | | 17.97 | % | | 7/15/2029 | | 12/6/2017 | | 6,150,000 |
| | 3,842,040 |
| | 3,286,958 |
| | 0.9 | % |
Octagon Investment Partners XVII, Ltd.(7) | | Subordinated Notes | | 22.15 | % | | 1/27/2031 | | 7/2/2018 | | 16,153,000 |
| | 7,896,256 |
| | 7,941,548 |
| | 2.3 | % |
Octagon Investment Partners 18-R Ltd.(4) | | Subordinated Notes | | 18.46 | % | | 4/16/2031 | | 8/4/2015 | | 4,568,944 |
| | 2,732,884 |
| | 2,523,126 |
| | 0.7 | % |
Octagon Investment Partners XX, Ltd.(10) | | Subordinated Notes | | — | % | | 8/14/2026 | | 8/12/2014 | | 500,000 |
| | 340,150 |
| | 240,376 |
| | 0.1 | % |
Octagon Investment Partners XXI, Ltd.(4) | | Subordinated Notes | | 14.66 | % | | 11/14/2026 | | 1/13/2016 | | 10,700,000 |
| | 6,464,140 |
| | 6,361,019 |
| | 1.8 | % |
| Octagon Investment Partners XXII, Ltd. | | Subordinated Notes | | 19.35 | % | | 1/22/2030 | | 11/25/2014 | | 6,625,000 |
| | 4,800,376 |
| | 4,299,078 |
| | 1.2 | % |
2019 SEMI-ANNUAL REPORT
PRIORITY INCOME FUND, INC. 15
|
| | | | | | | | | | | | | | | | | | | | | | | | |
Portfolio Investments(1)(9) | | Investment | | Estimated Yield(2)/Interest Rate | | Legal Maturity | | Acquisition date(11) | | Principal Amount | | Amortized Cost | | Fair Value(3)
Level 3 | | % of Net Assets |
| Collateralized Loan Obligation - Equity Class (Cayman Islands) |
| Octagon Investment Partners XXIII, Ltd. | | Subordinated Notes | | 26.67 | % | | 7/15/2027 | | 2/8/2016 | | $ | 12,000,000 |
| | $ | 9,647,451 |
| | $ | 11,128,522 |
| | 3.2 | % |
| Octagon Investment Partners 27, Ltd. | | Subordinated Notes | | 18.87 | % | | 7/15/2030 | | 11/2/2018 | | 5,000,000 |
| | 3,711,193 |
| | 3,492,408 |
| | 1.0 | % |
Octagon Investment Partners 30, Ltd.(4) | | Subordinated Notes | | 15.35 | % | | 3/17/2030 | | 11/20/2017 | | 9,525,000 |
| | 9,139,316 |
| | 7,860,690 |
| | 2.3 | % |
| Octagon Investment Partners 33, Ltd. | | Subordinated Notes | | 17.46 | % | | 1/20/2031 | | 7/11/2018 | | 2,850,000 |
| | 2,599,460 |
| | 2,648,434 |
| | 0.8 | % |
| Octagon Loan Funding, Ltd. | | Subordinated Notes | | 14.19 | % | | 11/18/2031 | | 9/17/2014 | | 3,240,000 |
| | 2,250,446 |
| | 1,983,727 |
| | 0.6 | % |
| OZLM VI, Ltd. | | Subordinated Notes | | 14.29 | % | | 4/17/2031 | | 11/3/2016 | | 15,688,991 |
| | 10,586,633 |
| | 8,099,124 |
| | 2.3 | % |
| OZLM VII, Ltd. | | Subordinated Notes | | 11.39 | % | | 7/17/2029 | | 11/6/2015 | | 2,654,467 |
| | 1,674,512 |
| | 1,400,794 |
| | 0.4 | % |
| OZLM VIII, Ltd. | | Subordinated Notes | | 8.01 | % | | 10/17/2029 | | 9/9/2014 | | 950,000 |
| | 600,136 |
| | 455,334 |
| | 0.1 | % |
| OZLM IX, Ltd. | | Subordinated Notes | | 13.75 | % | | 10/20/2031 | | 2/27/2017 | | 15,000,000 |
| | 11,235,195 |
| | 8,902,011 |
| | 2.6 | % |
OZLM XII, Ltd.(4) | | Subordinated Notes | | 13.47 | % | | 4/30/2027 | | 1/20/2017 | | 12,122,952 |
| | 9,825,534 |
| | 7,634,557 |
| | 2.2 | % |
| OZLM XXII, Ltd. | | Subordinated Notes | | 18.81 | % | | 1/17/2031 | | 5/16/2017 | | 27,343,000 |
| | 15,672,081 |
| | 14,720,278 |
| | 4.2 | % |
Regatta IV Funding Ltd.(5)(10) | | Subordinated Notes | | — | % | | 7/27/2026 | | 6/26/2014 | | 250,000 |
| | 4,958 |
| | 1,749 |
| | — | % |
Romark WM-R Ltd.(4) | | Subordinated Notes | | 13.26 | % | | 4/20/2031 | | 5/15/2014 | | 490,713 |
| | 393,046 |
| | 281,821 |
| | 0.1 | % |
| Sound Point CLO 2017-3, Ltd. | | Subordinated Notes | | 17.29 | % | | 10/20/2030 | | 7/13/2018 | | 4,000,000 |
| | 3,939,471 |
| | 3,888,007 |
| | 1.1 | % |
| Sound Point CLO XVIII, Ltd. | | Subordinated Notes | | 16.52 | % | | 1/20/2031 | | 10/31/2018 | | 4,000,000 |
| | 4,214,207 |
| | 3,881,672 |
| | 1.1 | % |
Symphony CLO XIV, Ltd.(4)(10) | | Subordinated Notes | | — | % | | 7/14/2026 | | 5/29/2014 | | 750,000 |
| | 500,944 |
| | 348,493 |
| | 0.1 | % |
| Symphony CLO XVI, Ltd. | | Subordinated Notes | | 10.21 | % | | 10/15/2031 | | 7/15/2015 | | 5,000,000 |
| | 4,316,053 |
| | 3,325,733 |
| | 1.0 | % |
THL Credit Wind River 2013-1 CLO, Ltd.(4) | | Subordinated Notes | | 16.21 | % | | 7/20/2030 | | 11/3/2017 | | 10,395,000 |
| | 7,870,770 |
| | 6,138,920 |
| | 1.8 | % |
| THL Credit Wind River 2013-2 CLO, Ltd. | | Income Notes | | 17.68 | % | | 10/18/2030 | | 12/29/2017 | | 3,250,000 |
| | 2,003,206 |
| | 1,679,614 |
| | 0.5 | % |
| THL Credit Wind River 2014-1 CLO, Ltd. | | Subordinated Notes | | 20.59 | % | | 7/18/2031 | | 7/13/2018 | | 11,800,000 |
| | 7,017,698 |
| | 7,441,700 |
| | 2.1 | % |
| Venture XVIII CLO, Ltd. | | Subordinated Notes | | 22.12 | % | | 10/15/2029 | | 7/18/2018 | | 4,750,000 |
| | 3,294,457 |
| | 3,300,586 |
| | 1.0 | % |
| Venture 28A CLO, Ltd. | | Subordinated Notes | | 17.95 | % | | 10/20/2029 | | 7/18/2018 | | 12,000,000 |
| | 10,677,138 |
| | 10,635,433 |
| | 3.1 | % |
| Venture XXX CLO, Ltd. | | Subordinated Notes | | 17.54 | % | | 1/15/2031 | | 7/18/2018 | | 5,100,000 |
| | 4,554,715 |
| | 4,496,946 |
| | 1.3 | % |
| Venture XXXII CLO, Ltd. | | Subordinated Notes | | 18.90 | % | | 7/18/2031 | | 10/11/2018 | | 7,929,328 |
| | 7,959,400 |
| | 7,505,968 |
| | 2.2 | % |
Voya IM CLO 2013-1, Ltd.(4) | | Income Notes | | 15.30 | % | | 10/15/2030 | | 6/14/2016 | | 4,174,688 |
| | 2,764,424 |
| | 2,269,959 |
| | 0.7 | % |
| Voya IM CLO 2013-3, Ltd. | | Subordinated Notes | | 9.12 | % | | 10/18/2031 | | 2/23/2015 | | 4,000,000 |
| | 2,377,878 |
| | 1,783,719 |
| | 0.5 | % |
Voya IM CLO 2014-1, Ltd.(4) | | Subordinated Notes | | 14.42 | % | | 4/18/2031 | | 3/13/2014 | | 314,774 |
| | 226,145 |
| | 174,668 |
| | 0.1 | % |
| Voya CLO 2014-3, Ltd. | | Subordinated Notes | | 10.79 | % | | 7/25/2026 | | 4/15/2015 | | 7,000,000 |
| | 4,135,739 |
| | 3,110,612 |
| | 0.9 | % |
| Voya CLO 2014-4, Ltd. | | Subordinated Notes | | 14.09 | % | | 7/14/2031 | | 11/25/2014 | | 1,000,000 |
| | 780,587 |
| | 596,789 |
| | 0.2 | % |
| Voya CLO 2015-2, Ltd. | | Subordinated Notes | | 14.72 | % | | 7/23/2027 | | 7/23/2015 | | 500,000 |
| | 421,883 |
| | 340,989 |
| | 0.1 | % |
Voya CLO 2016-1, Ltd.(4) | | Subordinated Notes | | 20.30 | % | | 1/21/2031 | | 2/25/2016 | | 7,750,000 |
| | 6,795,015 |
| | 6,702,264 |
| | 1.9 | % |
Voya CLO 2016-3, Ltd.(4) | | Subordinated Notes | | 13.32 | % | | 10/18/2031 | | 10/27/2016 | | 5,000,000 |
| | 4,855,605 |
| | 4,046,285 |
| | 1.2 | % |
Voya CLO 2017-3, Ltd.(4) | | Subordinated Notes | | 12.61 | % | | 7/20/2030 | | 7/12/2017 | | 5,750,000 |
| | 6,290,316 |
| | 5,527,667 |
| | 1.6 | % |
2019 SEMI-ANNUAL REPORT
PRIORITY INCOME FUND, INC. 16
|
| | | | | | | | | | | | | | | | | | | | | | | | |
Portfolio Investments(1)(9) | | Investment | | Estimated Yield(2)/Interest Rate | | Legal Maturity | | Acquisition date(11) | | Principal Amount | | Amortized Cost | | Fair Value(3)
Level 3 | | % of Net Assets |
| Collateralized Loan Obligation - Equity Class (Cayman Islands) |
| Voya CLO 2018-1, Ltd. | | Subordinated Notes | | 15.63 | % | | 4/19/2031 | | 4/6/2018 | | $ | 10,000,000 |
| | $ | 9,931,048 |
| | $ | 9,314,161 |
| | 2.7 | % |
| West CLO 2014-1 Ltd. | | Subordinated Notes | | 13.59 | % | | 7/18/2026 | | 7/24/2014 | | 13,375,000 |
| | 9,924,073 |
| | 9,054,865 |
| | 2.6 | % |
| Total Collateralized Loan Obligation - Equity Class | | | $ | 414,960,758 |
| | $ | 377,825,246 |
| | 108.9 | % |
| | | | | | | | | | | | | | | | | |
Collateralized Loan Obligation - Debt Class (Cayman Islands)(7) |
Cent CLO 21 Limited(4) | | Class E Notes | | 11.16% (LIBOR + 8.65%) | | 7/27/2030 | | 7/27/2018 | | $ | 109,122 |
| | $ | 102,986 |
| | $ | 111,203 |
| | — | % |
CIFC Funding 2014-V, Ltd.(4) | | Class F Notes | | 11.32% (LIBOR + 8.50%) | | 10/17/2031 | | 9/27/2018 | | 750,000 |
| | 729,027 |
| | 757,137 |
| | 0.2 | % |
CIFC Funding 2015-IV, Ltd.(8) | | Class E-R Notes | | LIBOR + 8.65% | | 10/20/2027 | | 1/22/2019 | | 9,000,000 |
| | 8,640,000 |
| | 8,602,489 |
| | 2.5 | % |
Galaxy XXVIII CLO, Ltd.(4) | | Class F Junior Notes | | 10.92% (LIBOR + 8.48%) | | 7/15/2031 | | 7/16/2018 | | 41,713 |
| | 38,761 |
| | 42,414 |
| | — | % |
| HarbourView CLO VII-R, Ltd. | | Class F Notes | | 10.71% (LIBOR + 8.27%) | | 7/18/2031 | | 10/31/2018 | | 6,000,000 |
| | 5,782,760 |
| | 6,042,193 |
| | 1.7 | % |
| Mountain View CLO IX Ltd. | | Class E Notes | | 10.46% (LIBOR + 8.02%) | | 7/15/2031 | | 10/31/2018 | | 3,625,000 |
| | 3,484,452 |
| | 3,586,455 |
| | 1.0 | % |
| OZLM VIII, Ltd. | | Class E Notes | | 10.79% (LIBOR + 8.17%) | | 10/17/2029 | | 11/15/2018 | | 8,400,000 |
| | 8,154,422 |
| | 8,364,756 |
| | 2.4 | % |
| Venture XIX CLO, Ltd. | | Class F-RR Notes | | 10.93% (LIBOR + 8.50%) | | 1/15/2032 | | 12/11/2018 | | 7,900,000 |
| | 7,666,463 |
| | 7,861,984 |
| | 2.3 | % |
| Total Collateralized Loan Obligation - Equity Class | | | $ | 34,598,871 |
| | $ | 35,368,631 |
| | 10.2 | % |
| | | | | | | | | | | | | | | | | |
| Total Portfolio Investments | | | | | | | | $ | 449,559,629 |
| | $ | 413,193,877 |
| | 119.1 | % |
| Other liabilities in excess of assets | | | | | | | | | | (66,300,884 | ) | | (19.1 | )% |
| Net Assets | | | | | | | | | | $ | 346,892,993 |
| | 100.0 | % |
| | | | | | | | | | | | | | | | | |
(1) The Company does not "control" and is not an "affiliate" of any of the portfolio investments, each term as defined in the Investment Company Act of 1940, as amended (the "1940 Act"). In general, under the 1940 Act, the Company would be presumed to "control" a portfolio company if the Company owned 25% or more of its voting securities and would be an "affiliate" of a portfolio company if the Company owned 5% or more of its voting securities. |
(2) The CLO subordinated notes/securities/fee notes, income notes and preferred shares are considered equity positions in the CLOs. The CLO equity investments are entitled to recurring distributions which are generally equal to the excess cash flow generated from the underlying investments after payment of the contractual payments to debt holders and fund expenses. The current estimated yield is based on the current projections of this excess cash flow taking into account assumptions which have been made regarding expected prepayments, losses and future reinvestment rates. These assumptions are periodically reviewed and adjusted. Ultimately, the actual yield may be higher or lower than the estimated yield if actual results differ from those used for the assumptions. |
(3) Fair value is determined by or under the direction of the Company’s Board of Directors. As of December 31, 2018, all of the Company’s investments were classified as Level 3. ASC 820 classifies such unobservable inputs used to measure fair value as Level 3 within the valuation hierarchy. See Notes 2 and 3 within the accompanying notes to financial statements for further discussion. |
(4) Co-investment with other entities managed by an affiliate of the Adviser (see Note 5). |
(5) Security was called for redemption and the liquidation of the underlying loan portfolio is ongoing. |
(6) Principal amount of subordinated notes and subordinated fee note is $4,000,000 and $392,156, respectively. |
(7) The interest rate on these investments is subject to the base rate of 3-Month LIBOR, which was 2.80% at December 31, 2018. The current base rate for each investment may be different from the reference rate on December 31, 2018. |
(8) This investment was not settled as of December 31, 2018 and therefore was not accruing income. |
(9) Restricted securities for which quotations are not readily available are valued at fair value, as determined by the Board of Directors. |
2019 SEMI-ANNUAL REPORT
PRIORITY INCOME FUND, INC. 17
|
| | | | | | | | | | | | | | | | | | | | | | | | |
(10) The effective yield has been estimated to be 0% as expected future cash flows are anticipated to not be sufficient to repay the investment at cost. If the expected investment proceeds increase, there is a potential for future investment income from the investment. Distributions, once received, will be recognized as return of capital with any remaining unamortized investment costs written off if the actual distributions are less than the amortized investment cost. If an investment has been impaired upon being called, any future distributions will be recorded as a return of capital. To the extent that the impaired CLO’s cost basis is fully recovered, any future distributions will be recorded as realized gains. |
(11)In accordance with endnote 8 of Regulation S-X Rule 12-12 - Form and Content of Schedules - Investments in securities of unaffiliated issuers, we have updated the presentation of our Schedule of Investments to include the acquisition dates of our investments. |
| See accompanying notes to financial statements. |
2019 SEMI-ANNUAL REPORT
PRIORITY INCOME FUND, INC. 18
Notes to Financial Statements (unaudited)
December 31, 2018
Note 1. Principal Business and Organization
Priority Income Fund, Inc., (the “Company,” “us,” “our,” or “we”) was incorporated under the general corporation laws of the State of Maryland on July 19, 2012 as an externally managed, nondiversified, closed-end management investment company under the Investment Company Act of 1940, as amended (the “1940 Act”), and commenced operations on May 9, 2013. In addition, the Company has elected to be treated for tax purposes as a regulated investment company (“RIC”) under Subchapter M of the Internal Revenue Code of 1986, as amended (the “Code”). The Company’s investment objective is to generate current income, and as a secondary objective, long-term capital appreciation. We seek to achieve our investment objective by investing, under normal circumstances, in senior secured loans made to companies whose debt is rated below investment grade or, in limited circumstances, unrated (“Senior Secured Loans”) with an emphasis on current income. Our investments may take the form of the purchase of Senior Secured Loans (either in the primary or secondary markets) or through investments in the equity and junior debt tranches of collateralized loan obligation (“CLO”) vehicles that in turn own pools of Senior Secured Loans. The Company intends to invest in both the primary and secondary markets.
The Company is managed by Priority Senior Secured Income Management, LLC (the “Adviser”), which is registered as an investment adviser under the Investment Advisers Act of 1940, as amended. The Adviser is 50% owned by Prospect Capital Management, L.P. (“PCM”) and 50% by Stratera Holdings, LLC (“Stratera Holdings”).
The Company is offering up to 100,000,000 shares of its common stock, on a best efforts basis. The Company commenced the offering on May 9, 2013, at an initial offering price of $15.00 per share, for an initial offering period of 36 months from the date of the commencement of the offering. On January 6, 2014, the Company satisfied its minimum offering requirement by raising over $2.5 million from selling shares to persons not affiliated with the Company or the Adviser (the “Minimum Offering Requirement”), and as a result, broke escrow and commenced making investments.
On February 9, 2016 the Company’s Board of Directors approved an 18-month extension to the offering period for the sale of shares through November 9, 2017. Subsequently, on May 30, 2017, our Board of Directors approved a continuation of this offering for an additional two years, extending this offering until the earlier of (i) November 2, 2019, or (ii) the date upon which 150,000,000 shares have been sold in the course of the offering of the Company's shares, unless further extended by our Board of Directors.
Note 2. Summary of Significant Accounting Policies
The following is a summary of significant accounting policies followed by the Company in the preparation of its financial statements.
Basis of Presentation
The accompanying financial statements have been prepared in accordance with U.S. generally accepted accounting principles (“U.S. GAAP”) pursuant to the requirements of ASC 946, Financial Services - Investment Companies (“ASC 946”), and Articles 6 and 12 of Regulation S-X.
Use of Estimates
The preparation of financial statements in conformity with U.S. GAAP requires management to make estimates and assumptions that affect the reported amounts of assets and liabilities and disclosure of contingent assets and liabilities at the date of the financial statements and the reported amounts of income, expenses and gains (losses) during the reporting period. Actual results could differ from those estimates and those differences could be material.
Cash
Cash are funds deposited with financial institutions.
2019 SEMI-ANNUAL REPORT
PRIORITY INCOME FUND, INC. 19
Investment Valuation
The Company follows guidance under U.S. GAAP, which classifies the inputs used to measure fair values into the following hierarchy:
Level 1. Unadjusted quoted prices in active markets for identical assets or liabilities that the Company has the ability to access at the measurement date.
Level 2. Quoted prices for similar assets or liabilities in active markets, or quoted prices for identical or similar assets or liabilities on an inactive market, or other observable inputs other than quoted prices.
Level 3. Unobservable inputs for the asset or liability.
In all cases, the level in the fair value hierarchy within which the fair value measurement in its entirety falls is determined based on the lowest level input that is significant to the fair value measurement in its entirety. The assessment of the significance of a particular input to the fair value measurement in its entirety requires judgment and considers factors specific to each investment.
Investments for which market quotations are readily available are valued at such market quotations and are classified in Level 1 of the fair value hierarchy.
U.S. government securities for which market quotations are available are valued at a price provided by an independent pricing agent or primary dealer. The pricing agent or primary dealer provides these prices usually after evaluating inputs including yield curves, credit rating, yield spreads, default rates, cash flows, broker quotes and reported trades. U.S. government securities are categorized in Level 2 of the fair value hierarchy.
With respect to investments for which market quotations are not readily available, or when such market quotations are deemed not to represent fair value, the board of directors (the “Board”) has approved a multi-step valuation process for each quarter, as described below, and such investments are classified in Level 3 of the fair value hierarchy:
| |
| 1. | Each portfolio investment is reviewed by investment professionals of the Adviser with the independent valuation firm engaged by the Board. |
| |
| 2. | The independent valuation firm prepares independent valuations based on its own independent assessments and issue its report. |
| |
| 3. | The Audit Committee of the Board (the “Audit Committee”) reviews and discusses with the independent valuation firm the valuation report, and then makes a recommendation to the Board of the value for each investment. |
| |
| 4. | The Board discusses valuations and determines the fair value of such investments in the Company’s portfolio in good faith based on the input of the Adviser, the respective independent valuation firm and the Audit Committee. |
The Company's investments in CLOs are classified as Level 3 fair value measured securities under ASC 820 and are valued using both a discounted single-path cash flow model and a discounted multi-path cash flow model. The CLO structures are analyzed to identify the risk exposures and to determine an appropriate call date (i.e., expected maturity). These risk factors are sensitized in the multi-path cash flow model using Monte Carlo simulations, which is a simulation used to model the probability of different outcomes, to generate probability-weighted (i.e., multi-path) cash flows from the underlying assets and liabilities. These cash flows, after payments to debt tranches senior to our equity positions, are discounted using appropriate market discount rates, and relevant data in the CLO market as well as certain benchmark credit indices are considered, to determine the value of each CLO investment. In addition, we generate a single-path cash flow utilizing our best estimate of expected cash receipts, and assess the reasonableness of the implied discount rate that would be effective for the value derived from the multi-path cash flows. We are not responsible for and have no influence over the asset management of the portfolios underlying the CLO investments we hold, as those portfolios are managed by non-affiliated third party CLO collateral managers. The main risk factors are default risk, prepayment risk, interest rate risk, downgrade risk, and credit spread risk.
The types of factors that are taken into account in fair value determination include, as relevant, market changes in expected returns for similar investments, performance improvement or deterioration, the nature and realizable value of any collateral, the issuer’s ability to make payments and its earnings and cash flows, the markets in which the issuer does business, comparisons to traded securities, and other relevant factors.
Securities Transactions
Securities transactions are recorded on trade date. Realized gains or losses on investments are calculated by using the specific identification method. In accordance with ASC 325-40, Beneficial Interest in Securitized Financial Assets, investments in CLOs
2019 SEMI-ANNUAL REPORT
PRIORITY INCOME FUND, INC. 20
are periodically assessed for other-than-temporary impairment (“OTTI”). When the Company determines that a CLO has OTTI, the amortized cost basis of the CLO is written down to its fair value as of the date of the determination based on events and information evaluated and that write-down is recognized as a realized loss.
Revenue Recognition
Interest income from investments in the “equity” positions of CLOs (typically income notes, subordinated notes or preferred shares) is recorded based on an estimation of an effective yield to expected maturity utilizing assumed future cash flows. The Company monitors the expected cash inflows from CLO equity investments, including the expected residual payments, and the estimated effective yield is updated periodically. Interest income from investments in the “debt” positions of CLOs, adjusted for amortization of premium and accretion of discount, is recorded on an accrual basis.
Preferred Stock
The Company carries its mandatorily redeemable preferred stock at accreted cost on the Statement of Assets and Liabilities, and not fair value. Refer to “Note 7. Mandatorily Redeemable Preferred Stock” for further details. In accordance with ASC 480-10-25, the Company's mandatorily redeemable preferred stock has been classified as a liability on the Statement of Assets and Liabilities. Dividend payments relating to the mandatorily redeemable preferred stock are included in preferred dividend payable on the Statement of Assets and Liabilities and preferred dividend expense on the Statement of Operations.
Offering Costs
Offering costs are capitalized to deferred offering costs on the Statement of Assets and Liabilities and amortized to expense over the 12 month period following such capitalization on a straight line basis.
Offering expenses consist of costs for the registration, certain marketing and distribution of the Company’s shares. These expenses include, but are not limited to, expenses for legal, accounting, printing and certain marketing, and include salaries and direct expenses of the Adviser’s employees, employees of its affiliates and others for providing these services.
Due to Adviser
Amounts due to our Adviser consist of expense support repayments, base management fees, incentive fees, routine non-compensation overhead, operating expenses paid on behalf of the Company and offering expenses paid on behalf of the Company. All balances due to the Adviser are settled quarterly.
Dividends and Distributions
Dividends and distributions to stockholders, which are determined in accordance with federal income tax regulations, are recorded on the record date. The amount to be paid out as a dividend or distribution is approved by the Board. Net realized capital gains, if any, are generally distributed or deemed distributed at least annually.
Income Taxes
The Company has elected to be treated as a RIC for U.S. federal income tax purposes and intends to comply with the requirement of the Code applicable to RICs. In order to continue to qualify for RIC tax treatment among other things, the Company is required to distribute at least 90% of its investment company taxable income (the “Annual Distribution Requirement”) and intends to distribute all of the Company’s investment company taxable income and net capital gain to stockholders; therefore, the Company has made no provision for income taxes. The character of income and gains that the Company will distribute is determined in accordance with income tax regulations that may differ from U.S. GAAP. Book and tax basis differences relating to stockholder dividends and distributions and other permanent book and tax differences are reclassified to paid-in capital.
As of December 31, 2018, the cost basis of investments for tax purposes was $407,166,874 resulting in estimated gross unrealized appreciation and depreciation of $31,012,989 and $24,985,986, respectively.
If the Company does not distribute (or is not deemed to have distributed) at least (1) 98% of its calendar year ordinary income; (2) 98.2% of its capital gains for the one-year period ending October 31 in that calendar year; and (3) any income recognized but not distributed in the preceding years and on which the Company paid no corporate-level tax, the Company will generally be required to pay an excise tax equal to 4% of such excess amounts. To the extent that the Company determines that its estimated current calendar year taxable income will be in excess of estimated current calendar year dividend distributions from such taxable income, the Company accrues excise taxes, if any, on estimated excess taxable income. As of and for the calendar year ended December 31, 2018, we determined that the Company met the distribution requirements and therefore was not required to pay excise tax. Additionally, as of Decmber 31, 2018, we do not expect to have any excise tax due for 2018 calendar year. Thus, we have not accrued any excise tax for this period.
2019 SEMI-ANNUAL REPORT
PRIORITY INCOME FUND, INC. 21
If the Company fails to satisfy the Annual Distribution Requirement or otherwise fails to qualify as a RIC in any taxable year, the
Company would be subject to tax on all of its taxable income at regular corporate rates. The Company would not be able to deduct distributions to stockholders, nor would the Company be required to make distributions. Distributions would generally be taxable to the Company’s individual and other non-corporate taxable stockholders as ordinary dividend income eligible for the reduced maximum rate applicable to qualified dividend income to the extent of the Company’s current and accumulated earnings and profits, provided certain holding period and other requirements are met. Subject to certain limitations under the Code, corporate distributions would be eligible for the dividends-received deduction. To qualify again to be taxed as a RIC in a subsequent year, the Company would be required to distribute to its stockholders the Company’s accumulated earnings and profits attributable to non-RIC years reduced by an interest charge of 50% of such earnings and profits payable by us as an additional tax. In addition, if the Company failed to qualify as a RIC for a period greater than two taxable years, then, in order to qualify as a RIC in a subsequent year, the Company would be required to elect to recognize and pay tax on any net built-in gain (the excess of aggregate gain, including items of income, over aggregate loss that would have been realized if the Company had been liquidated) or, alternatively, be subject to taxation on such built-in gain recognized for a period of five years.
In September 2016, the IRS and U.S. Treasury Department issued proposed regulations that, if finalized, would provide that the income inclusions from a Passive Foreign Investment Company (“PFIC”) with a Qualified Electing Fund (“QEF”) or a Controlled Foreign Corporation (“CFC”) would not be good income for purposes of the 90% Income Test unless the Company receives a cash distribution from such entity in the same year attributable to the included income. If such income were not considered “good income” for purposes of the 90% income test, the Company may fail to qualify as a RIC.
It is unclear whether or in what form these regulations will be adopted or, if adopted, whether such regulations would have a significant impact on the income that could be generated by the Company. If adopted, the proposed regulations would apply to taxable years of the Company beginning on or after 90 days after the regulations are published as final. The Company is monitoring the status of the proposed regulations and is assessing the potential impact of the proposed tax regulation on its operations.
The Company follows ASC 740, Income Taxes (“ASC 740”). ASC 740 provides guidance for how uncertain tax positions should be recognized, measured, presented, and disclosed in the financial statements. ASC 740 requires the evaluation of tax positions taken or expected to be taken in the course of preparing the Company’s tax returns to determine whether the tax positions are “more-likely-than-not” of being sustained by the applicable tax authority. Tax positions not deemed to meet the more-likely-than not threshold are recorded as a tax benefit or expense in the current year. As of December 31, 2018 and for the six months then ended, the Company did not have a liability for any unrecognized tax benefits, respectively. Management has analyzed the Company’s positions taken and expected to be taken on its income tax returns for all open tax years and for the year ended June 30, 2018, and has concluded that as of December 31, 2018, no provision for uncertain tax position is required in the Company’s financial statements. Our determinations regarding ASC 740 may be subject to review and adjustment at a later date based upon factors including, but not limited to, an on-going analysis of tax laws, regulations and interpretations thereof. All federal and state income tax returns for each tax year in the three-year period ended June 30, 2018 remain subject to examination by the Internal Revenue Service and state departments of revenue.
Recent Accounting Pronouncement
In June 2016, the FASB issued ASU 2016-13, Financial Instruments-Credit Losses (Topic 326): Measurement of Credit Losses on Financial Instruments (“ASU 2016-13”), which amends the financial instruments impairment guidance so that an entity is required to measure expected credit losses for financial assets based on historical experience, current conditions and reasonable and supportable forecasts. As such, an entity will use forward-looking information to estimate credit losses. ASU 2016-13 also amends the guidance in FASB ASC Subtopic No. 325-40, Investments-Other, Beneficial Interests in Securitized Financial Assets, related to the subsequent measurement of accretable yield recognized as interest income over the life of a beneficial interest in securitized financial assets under the effective yield method. ASU 2016-13 is effective for financial statements issued for fiscal years beginning after December 15, 2019, including interim periods within those fiscal years. Early adoption is permitted as of the fiscal years beginning after December 15, 2018, including interim periods within those fiscal years. We are currently evaluating the impact, if any, of adopting this ASU on our financial statements.
In August 2016, the FASB issued ASU 2016-15, Statement of Cash Flows (Topic 230): Classification of Certain Cash Receipts and Cash Payments (“ASU 2016-15”), which addresses certain aspects of cash flow statement classification. One such amendment requires cash payments for debt prepayment or debt extinguishment costs to be classified as cash outflows for financing activities. ASU 2016-15 is effective for financial statements issued for fiscal years beginning after December 15, 2017, and interim periods within those fiscal years. The amended guidance in ASU 2016-15 did not have a significant effect on our financial statements and disclosures.
2019 SEMI-ANNUAL REPORT
PRIORITY INCOME FUND, INC. 22
In May 2014, the FASB issued ASU No. 2014-09, Revenue from Contracts with Customers (Topic 606), which amends accounting guidance for revenue recognition arising from contracts with customers. Under the new guidance, an entity should recognize revenue to depict the transfer of promised goods or services to customers in an amount that reflects the consideration the entity expects to be entitled to in exchange for those goods or services. In August 2015, the FASB also issued ASU 2015-14, Revenue from Contracts with Customers (Topic 606): Deferral of the Effective Date, which deferred the effective date of the standard for one year. As a result, the guidance is effective for financial statements issued for fiscal years beginning after December 15, 2017, and interim periods within those fiscal years. Based on the scope exception in Topic 606, this guidance had no impact on the Company.
In August 2018, the FASB issued ASU No. 2018-13, Fair Value Measurement (Topic 820): Disclosure Framework—Changes to the Disclosure Requirements for Fair Value Measurement. The standard will modify the disclosure requirements for fair value measurements by removing, modifying, or adding certain disclosures. ASU No. 2018-13 is effective for annual reporting periods beginning after December 15, 2019, including interim periods within that reporting period. Early adoption is permitted upon issuance of this ASU. We are currently evaluating the impact of adopting this ASU on our financial statements.
Note 3. Portfolio Investments
Purchases of investment securities (excluding short-term securities) for six months ended December 31, 2018 were $86,851,112. Six investments have been called for redemption and the liquidation of the underlying portfolios is ongoing. During the six months ended December 31, 2018, the Company recorded OTTI on these investments, resulting in realized losses of $2,270,417. The Company received $82,143 from liquidating payments on investments that were previously written-off for tax purposes which resulted in a realized gain.
The following table summarizes the inputs used to value the Company’s investments measured at fair value as of December 31, 2018:
|
| | | | | | | | | | | | | | | |
| | Level 1 | | Level 2 | | Level 3 | | Total |
| Assets | | | | | | | |
| Collateralized Loan Obligations - Equity Class | $ | — |
| | $ | — |
| | $ | 377,825,246 |
| | $ | 377,825,246 |
|
| Collateralized Loan Obligations - Debt Class | — |
| | — |
| | 35,368,631 |
| | 35,368,631 |
|
| | $ | — |
| | $ | — |
| | $ | 413,193,877 |
| | $ | 413,193,877 |
|
2019 SEMI-ANNUAL REPORT
PRIORITY INCOME FUND, INC. 23
The following is a reconciliation of investments for which Level 3 inputs were used in determining fair value:
|
| | | | | | | | | |
| | Collateralized Loan Obligation - Equity Class | Collateralized Loan Obligation - Debt Class | Total |
| Fair value at June 30, 2018 | $ | 343,433,732 |
| $ | 38,585 |
| $ | 343,472,317 |
|
| Net realized loss on investments | (2,188,274 | ) | — |
| (2,188,274 | ) |
| Net increase in unrealized loss on investments | (12,202,281 | ) | 769,760 |
| (11,432,521 | ) |
| Purchases of investments | 52,315,400 |
| 34,535,712 |
| 86,851,112 |
|
| Distributions received from investments | (4,988,156 | ) | — |
| (4,988,156 | ) |
| Proceeds from sales of investments | — |
| — |
| — |
|
| Amortization of purchase discount, net | 1,454,825 |
| 24,574 |
| 1,479,399 |
|
Transfers into Level 3(1) | — |
| — |
| — |
|
Transfers out of Level 3(1) | — |
| — |
| — |
|
| Fair value at December 31, 2018 | $ | 377,825,246 |
| $ | 35,368,631 |
| $ | 413,193,877 |
|
| | | | |
| Net increase in unrealized loss attributable to Level 3 investments still held at the end of the period | $ | (12,627,158 | ) | $ | 769,760 |
| $ | (11,857,398 | ) |
| | | | |
(1) Transfers are assumed to have occurred at the beginning of the quarter during which the asset was transferred. There were no transfers in or out of Level 3 during the six months ended December 31, 2018. |
The following table provides quantitative information about significant unobservable inputs used in the fair value measurement of Level 3 investments as of December 31, 2018:
|
| | | | | | | | | | | | |
| | | | | | | Unobservable Input |
| Asset Category | | Fair Value | | Primary Valuation Technique | | Input | | Range(1)(2) | | Weighted Average(1)(2) |
| Collateral Loan Obligations - Equity Class | | $ | 377,825,246 |
| | Discounted Cash Flow | | Discount Rate | | 14.31% - 40.05% | | 20.16% |
| Collateral Loan Obligations - Debt Class | | 35,368,631 |
| | Discounted Cash Flow | | Discount Rate | | 10.64% - 12.44% | | 11.32% |
| Total Level 3 Investments | | $ | 413,193,877 |
| | | | | | | | |
(1) Excludes investments that have been called for redemption.
(2) Represents the implied discount rate based on our internally generated single-path cash flows that are derived from the fair value estimated by the corresponding multi-path cash flow model utilized by the independent valuation firm.
In determining the range of values for our investments in CLOs, the independent valuation firm uses a discounted multi-path cash flow model. The valuations were accomplished through the analysis of the CLO deal structures to identify the risk exposures from the modeling point of view as well as to determine an appropriate call date (i.e., expected maturity). These risk factors are sensitized in the multi-path cash flow model using Monte Carlo simulations to generate probability-weighted (i.e., multi-path) cash flows for the underlying assets and liabilities. These cash flows are discounted using appropriate market discount rates, and relevant data in the CLO market and certain benchmark credit indices are considered, to determine the value of each CLO investment. In addition, we generate a single-path cash flow utilizing our best estimate of expected cash receipts, and assess the reasonableness of the implied discount rate that would be effective for the value derived from the corresponding multi-path cash flow model.
The significant unobservable input used to value the CLOs is the discount rate applied to the estimated future cash flows expected to be received from the underlying investment, which includes both future principal and interest payments. Included in the consideration and selection of the discount rate are the following factors: risk of default, comparable investments, and call provisions. An increase or decrease in the discount rate applied to projected cash flows, where all other inputs remain constant, would result in a decrease or increase, respectively, in the fair value measurement.
2019 SEMI-ANNUAL REPORT
PRIORITY INCOME FUND, INC. 24
The Company is not responsible for and has no influence over the management of the portfolios underlying the CLO investments the Company holds as those portfolios are managed by non-affiliated third party CLO collateral managers. CLO investments may be riskier and less transparent to the Company than direct investments in underlying companies. CLOs typically will have no significant assets other than their underlying senior secured loans. Therefore, payments on CLO investments are and will be payable solely from the cash flows from such senior secured loans.
The Company’s portfolio primarily consists of residual interests investments in CLOs, which involve a number of significant risks. CLOs are typically highly levered (10 - 14 times), and therefore the residual interest tranches that the Company invests in are subject to a higher degree of risk of total loss. In particular, investors in CLO residual interests indirectly bear risks of the underlying loan investments held by such CLOs. The Company generally has the right to receive payments only from the CLOs, and generally do not have direct rights against the underlying borrowers or the entity that sponsored the CLO. While the CLOs the Company targets generally enable the investor to acquire interests in a pool of senior loans without the expenses associated with directly holding the same investments, the Company’s prices of indices and securities underlying CLOs will rise or fall. These prices (and, therefore, the values of the CLOs) will be influenced by the same types of political and economic events that affect issuers of securities and capital markets generally. The failure by a CLO investment in which the Company invests to satisfy financial covenants, including with respect to adequate collateralization and/or interest coverage tests, could lead to reductions in its payments to the Company. In the event that a CLO fails certain tests, holders of debt senior to the Company may be entitled to additional payments that would, in turn, reduce the payments the Company would otherwise be entitled to receive. Separately, the Company may incur expenses to the extent necessary to seek recovery upon default or to negotiate new terms with a defaulting CLO or any other investment the Company may make. If any of these occur, it could materially and adversely affect the Company’s operating results and cash flows.
The interests the Company has acquired in CLOs are generally thinly traded or have only a limited trading market. CLOs are typically privately offered and sold, even in the secondary market. As a result, investments in CLOs may be characterized as illiquid securities. In addition to the general risks associated with investing in debt securities, CLO residual interests carry additional risks, including, but not limited to: (i) the possibility that distributions from collateral securities will not be adequate to make interest or other payments; (ii) the quality of the collateral may decline in value or default; (iii) the fact that the Company’s investments in CLO tranches will likely be subordinate to other senior classes of note tranches thereof; and (iv) the complex structure of the security may not be fully understood at the time of investment and may produce disputes with the CLO investment or unexpected investment results. The Company’s net asset value may also decline over time if the Company’s principal recovery with respect to CLO residual interests is less than the price that the Company paid for those investments. The Company’s CLO investments and/or the underlying senior secured loans may prepay more quickly than expected, which could have an adverse impact on its value.
An increase in LIBOR would materially increase the CLO’s financing costs. Since most of the collateral positions within the CLOs have LIBOR floors, there may not be corresponding increases in investment income (if LIBOR increases but stays below the LIBOR floor rate of such investments) resulting in materially smaller distribution payments to the residual interest investors.
On July 27, 2017, the Financial Conduct Authority (“FCA”) announced that it will no longer persuade or compel banks to submit rates for the calculation of the LIBOR rates after 2021 (the “FCA Announcement”). Furthermore, in the United States, efforts to identify a set of alternative U.S. dollar reference interest rates include proposals by the Alternative Reference Rates Committee of the Federal Reserve Board and the Federal Reserve Bank of New York. On August 24, 2017, the Federal Reserve Board requested public comment on a proposal by the Federal Reserve Bank of New York, in cooperation with the Office of Financial Research, to produce three new reference rates intended to serve as alternatives to LIBOR. These alternative rates are based on overnight repurchase agreement transactions secured by U.S. Treasury Securities. On December 12, 2017, following consideration of public comments, the Federal Reserve Board concluded that the public would benefit if the Federal Reserve Bank of New York published the three proposed reference rates as alternatives to LIBOR (the “Federal Reserve Board Notice”). Recently, the CLOs we have invested in have included, or have been amended to include, language permitting the CLO investment manager to implement a market replacement rate (like those proposed by the Alternative Reference Rates Committee of the Federal Reserve Board and the Federal Reserve Bank of New York) upon the occurrence of certain material disruption events. However, we cannot ensure that all CLOs in which we are invested will have such provisions, nor can we ensure the CLO investment managers will undertake the suggested amendments when able.
At this time, it is not possible to predict the effect of the FCA Announcement, the Federal Reserve Board Notice, or other regulatory changes or announcements, any establishment of alternative reference rates or any other reforms to LIBOR that may be enacted in the United Kingdom, the United States or elsewhere. As such, the potential effect of any such event on our net investment income cannot yet be determined. The CLOs in which the Company is invested generally contemplate a scenario where LIBOR is no longer available by requiring the CLO administrator to calculate a replacement rate primarily through dealer polling on the applicable measurement date. However, there is uncertainty regarding the effectiveness of the dealer polling processes, including
2019 SEMI-ANNUAL REPORT
PRIORITY INCOME FUND, INC. 25
the willingness of banks to provide such quotations, which could adversely impact our net investment income. In addition, the effect of a phase out of LIBOR on U.S. senior secured loans, the underlying assets of the CLOs in which we invest, is currently unclear. To the extent that any replacement rate utilized for senior secured loans differs from that utilized for a CLO that holds those loans, the CLO would experience an interest rate mismatch between its assets and liabilities which could have an adverse impact on the Company’s net investment income and portfolio returns.
If the Company owns more than 10% of the shares in a foreign corporation that is treated as a CFC (including residual interest tranche investments in a CLO investment treated as a CFC), for which the Company is treated as receiving a deemed distribution (taxable as ordinary income) each year from such foreign corporation in an amount equal to its pro rata share of the corporation’s income for the tax year (including both ordinary earnings and capital gains), the Company is required to include such deemed distributions from a CFC in its income and the Company is required to distribute such income to maintain its RIC tax treatment regardless of whether or not the CFC makes an actual distribution during such year.
The Company owns shares in PFICs (including residual interest tranche investments in CLOs that are PFICs), therefore the Company may be subject to federal income tax on a portion of any “excess distribution” or gain from the disposition of such shares even if such income is distributed as a taxable dividend to its stockholders. Certain elections may be available to mitigate or eliminate such tax on excess distributions, but such elections (if available) will generally require the Company to recognize its share of the PFICs income for each year regardless of whether the Company receives any distributions from such PFICs. The Company must nonetheless distribute such income to maintain its tax treatment as a RIC.
If the Company is required to include amounts in income prior to receiving distributions representing such income, the Company may have to sell some of its investments at times and/or at prices management would not consider advantageous, raise additional debt or equity capital or forgo new investment opportunities for this purpose. If the Company is not able to obtain cash from other sources, it may fail to qualify for RIC tax treatment and thus become subject to corporate-level income tax.
The Company’s portfolio is concentrated in CLO vehicles, which is subject to a risk of loss if that sector experiences a market downturn. The Company is subject to credit risk in the normal course of pursuing its investment objectives. The Company’s maximum risk of loss from credit risk for its portfolio investments is the inability of the CLO collateral managers to return up to the cost value due to defaults occurring in the underlying loans of the CLOs.
Investments in CLO residual interests generally offer less liquidity than other investment grade or high-yield corporate debt, and may be subject to certain transfer restrictions. The Company’s ability to sell certain investments quickly in response to changes in economic and other conditions and to receive a fair price when selling such investments may be limited, which could prevent the Company from making sales to mitigate losses on such investments. In addition, CLOs are subject to the possibility of liquidation upon an event of default of certain minimum required coverage ratios, which could result in full loss of value to the CLO residual interests and junior debt investors.
The fair value of the Company’s investments may be significantly affected by changes in interest rates. The Company’s investments in senior secured loans through CLOs are sensitive to interest rate levels and volatility. In the event of a significant rising interest rate environment and/or economic downturn, loan defaults may increase and result in credit losses which may adversely affect the Company’s cash flow, fair value of its investments and operating results. In the event of a declining interest rate environment, a faster than anticipated rate of prepayments is likely to result in a lower than anticipated yield.
Due to the inherent uncertainty of determining the fair value of investments that do not have a readily available market value, the fair value of the Company’s investments may fluctuate from period to period. Additionally, the fair value of the Company’s investments may differ significantly from the values that would have been used had a ready market existed for such investments and may differ materially from the values that we may ultimately realize. Further, such investments are generally subject to legal and other restrictions on resale or otherwise are less liquid than publicly traded securities. If the Company was required to liquidate a portfolio investment in a forced or liquidation sale, the Company could realize significantly less than the value at which the Company has recorded it.
In addition, changes in the market environment and other events that may occur over the life of the investments may cause the gains or losses ultimately realized on these investments to be different than the unrealized gains or losses reflected in the currently assigned valuations.
2019 SEMI-ANNUAL REPORT
PRIORITY INCOME FUND, INC. 26
Note 4. Capital
The Company offers its shares of common stock with varying up-front sales loads and has elected to designate each level of sales load as a “class” solely as a means of identifying those differing sales loads and the different channels through which shares are sold. Shares available to the general public are charged selling commissions and dealer manager fees and are referred to as “Class R Shares”. Shares available to accounts managed by registered investment advisers are charged dealer manager fees but no selling commissions and are referred to as “Class RIA Shares”. Shares available for purchase through (1) fee-based programs, also known as wrap accounts, of investment dealers, (2) participating broker-dealers that have alternative fee arrangements with their clients, (3) certain registered investment advisors or (4) bank trust departments or any other organization or person authorized to act in a fiduciary capacity for its clients or customers are charged no selling commissions or dealer manager fees and are referred to as “Class I Shares.” Although the Company uses “Class” designations to indicate its differing sales load structures, the Company does not operate as a multi-class fund.
The Company’s authorized stock consists of 200,000,000 shares of stock, par value $0.01 per share, 15,000,000 of which are classified as Term Preferred Stock, par value $0.01 per share, or “Term Preferred Stock”, and 185,000,000 of which are classified as common stock. All shares of Common Stock have identical voting and distributions rights, and bear their own pro rata portion of the Company’s expenses and have the same net asset value.
Transactions in shares of common stock were as follows during the six months ended December 31, 2018 and the year ended June 30, 2018:
|
| | | | | | | |
| | | Total |
| | | Shares | | Amount |
| Six Months Ended December 31, 2018: | |
| | |
| Shares sold | | 1,679,573 |
| | $ | 25,241,679 |
|
| Shares issued from reinvestment of distributions | | 824,398 |
| | 10,954,447 |
|
| Repurchase of common shares | | (629,010 | ) | | (8,407,807 | ) |
| Net increase from capital transactions | | 1,874,961 |
| | $ | 27,788,319 |
|
| | | | | |
| Year Ended June 30, 2018: | | | | |
| Shares sold | | 4,822,552 |
| | $ | 76,497,782 |
|
| Shares issued from reinvestment of distributions | | 1,133,607 |
| | 15,807,913 |
|
| Repurchase of common shares | | (1,010,627 | ) | | (14,171,501 | ) |
| Net increase from capital transactions | | 4,945,532 |
| | $ | 78,134,194 |
|
At December 31, 2018, the Company has 26,573,578 shares issued and outstanding.
At June 30, 2018, the Company has 24,698,617 shares issued and outstanding.
Share Repurchase Program
The Company conducts quarterly tender offers pursuant to its share repurchase program. The Company’s Board considers the following factors, among others, in making its determination regarding whether to cause us to offer to repurchase shares and under what terms:
| |
| • | the effect of such repurchases on our qualification as a RIC (including the consequences of any necessary asset sales); |
| |
| • | the liquidity of the Company’s assets (including fees and costs associated with disposing of assets); |
| |
| • | the Company’s investment plans and working capital requirements; |
| |
| • | the relative economies of scale with respect to the Company’s size; |
| |
| • | the Company’s history in repurchasing shares or portions thereof; and |
| |
| • | the condition of the securities markets. |
The Company limits the number of shares to be repurchased in any calendar year to 20% of the weighted average number of shares outstanding in the prior calendar year, or 5% in each quarter, though the actual number of shares that the Company offers to repurchase may be less in light of the limitations noted below. At the discretion of the Company’s Board, the Company may use cash on hand, and cash from the sale of investments as of the end of the applicable period to repurchase shares. In addition, the Company currently limits the number of shares to be repurchased during any calendar year to the number of shares the Company
2019 SEMI-ANNUAL REPORT
PRIORITY INCOME FUND, INC. 27
can repurchase with the proceeds the Company receives from the sale of its shares under its distribution reinvestment plan. The Company will offer to repurchase such shares at a price equal to the net asset value per share of our common stock specified in the tender offer. The Company’s Board may suspend or terminate the share repurchase program at any time. The first such tender offer commenced in May 2015.
The following table sets forth the number of common shares that were repurchased by the Company in each tender offer:
|
| | | | | | | | | | | | | | | | |
| Quarter | | Repurchase Date | | Shares Repurchased | | Percentage of Shares Tendered That Were Repurchased | | Repurchase Price Per Share | | Aggregate Consideration for Repurchased Shares |
| For the Six Months Ended December 31, 2018 |
| June 30, 2018 | | July 27, 2018 | | 306,581 |
| | 62.16 | % | | $ | 13.50 |
| | $ | 4,138,842 |
|
| September 30, 2018 | | November 1, 2018 | | 322,429 |
| | 53.07 | % | | 13.24 |
| | 4,268,965 |
|
| Total for the six months ended December 31, 2018 | | 629,010 |
| | | | | | $ | 8,407,807 |
|
| | | | | | | | | | | |
| For year ended June 30, 2018 | | | | | | | | |
| June 30, 2017 | | July 31, 2017 | | 213,636 |
| | 79.39 | % | | 14.46 |
| | 3,089,170 |
|
| September 30, 2017 | | October 27, 2017 | | 235,220 |
| | 100.00 | % | | 14.10 |
| | 3,316,611 |
|
| December 31, 2017 | | January 26, 2018 | | 272,534 |
| | 91.22 | % | | 13.87 |
| | 3,780,039 |
|
| March 31, 2018 | | April 30, 2018 | | 289,237 |
| | 36.51 | % | | 13.78 |
| | 3,985,681 |
|
| Total for the year ended June 30, 2018 | | 1,010,627 |
| | | | | | $ | 14,171,501 |
|
On December 13, 2018, the Company made an offer to purchase up to $4,228,041 in aggregate amount of the Company’s issued and outstanding common shares. The offer began on December 20, 2018 and expired at 12:00 Midnight, Eastern Time, on January 21, 2019, and a total of 442,448 shares were validly tendered and not withdrawn pursuant to the offer as of such date. In accordance with the terms of the offer, the Company purchased 323,491 shares at a purchase price of $13.07 per share for an aggregate purchase price of approximately $4,228,041. The purchase price per Share was equal to the net asset value per Share as of January 18, 2019.
Note 5. Transactions with Affiliates
Investment Advisory Agreement
On May 9, 2013, the Company entered into an investment advisory agreement (the “Investment Advisory Agreement”) with the Adviser. The Adviser manages the day-to-day investment operations of, and provides investment advisory services to, the Company. For providing these services, the Adviser is paid a base management fee and an incentive fee. The base management fee, payable quarterly in arrears, is calculated at an annual rate of 2.0% based on the average of the total assets as of the end of the two most recently completed calendar quarters. The Company also pays routine non-compensation overhead expenses of the Adviser in an amount up to 0.0625% per quarter (0.25% annualized) of the Company’s average total assets. The incentive fee is calculated and payable quarterly in arrears based on the Company’s pre-incentive fee net investment income for the immediately preceding quarter. For this purpose, pre-incentive fee net investment income means interest income, dividend income and any other income (including any other fees, such as commitment, origination, structuring, diligence and consulting fees or other fees received) accrued during the calendar quarter, minus operating expenses for the quarter (including the base management fee, expenses reimbursed under the Investment Advisory Agreement, the administration agreement and the investor services agreement, any interest expense and dividends paid on any issued and outstanding preferred shares, but excluding the organization and offering expenses and incentive fee). Pre-incentive fee net investment income includes, in the case of investments with a deferred interest feature (such as original issue discount, debt instruments with payment-in-kind interest and zero coupon securities), accrued income that we have not yet received in cash. Pre-incentive fee net investment income does not include any realized capital gains, realized capital losses or unrealized capital appreciation or depreciation. Pre-incentive fee net investment income, expressed as a rate of return on the value of the Company’s net assets at the end of the immediately preceding calendar quarter, is compared to the preferred return rate of 1.5% per quarter (6.0% annualized). The Company pays the Adviser an incentive fee with respect to its pre-incentive fee net investment income in each calendar quarter as follows: (1) no incentive fee in any calendar quarter in which the pre-incentive fee net investment income does not exceed the preferred return rate; (2) 100% of the pre-incentive fee net investment income, if any, that exceeds the preferred return rate but is less than 1.875% in any calendar quarter (7.5% annualized); and (3) 20.0% of the pre-incentive fee net investment income, if any, that exceeds 1.875% in any calendar quarter. These calculations are appropriately pro-rated for any period of less than three months.
2019 SEMI-ANNUAL REPORT
PRIORITY INCOME FUND, INC. 28
For the six months ended December 31, 2018, expenses incurred by the Company and the payable remaining at December 31, 2018 in connection with the Investment Advisory Agreement were as follows:
|
| | | | | | | | |
| Description | | Expense | | Payable |
Base management fee(1) | | $ | 3,940,263 |
| | $ | 2,031,689 |
|
Incentive fee(1) | | 5,251,199 |
| | 2,683,272 |
|
Routine non-compensation overhead expenses(2) | | 52,665 |
| | 25,362 |
|
| | | | | |
(1) The payable amount is presented as part of Due to Adviser on the Statement of Assets and Liabilities. |
| | | |
(2) The payable amount is presented as part of Due to Adviser on the Statement of Assets and Liabilities and as part of Adviser shared service expense in the Statement of Operations. |
Expense Support and Conditional Reimbursement Agreement
We entered into an expense support and conditional reimbursement agreement (the “Expense Support Agreement”) with our Adviser, whereby our Adviser agreed to reimburse us for operating expenses in an amount equal to the difference between distributions to our common stockholders for which a record date has occurred in each quarter less the sum of our net investment income, the net realized capital gains/losses and dividends and other distributions paid to us from our portfolio investments during such period (“Expense Support Reimbursement”). To the extent that there were no dividends or other distributions to our common stockholders for which a record date occurred in any given quarter, then the Expense Support Reimbursement for such quarter was equal to such amount necessary in order for Available Operating Funds (as defined below) for the quarter to equal zero. Any payments required to be made by our Adviser under the Expense Support Agreement for any quarter was paid by our Adviser to us in any combination of cash or other immediately available funds, and/or offsets against amounts otherwise due from us to our Adviser, no later than the earlier of (i) the date on which we closed our books for such quarter and (ii) sixty days after the end of such quarter, or at such later date as determined by us (the “Expense Payment Date”). We have a conditional obligation to reimburse our Adviser for any amounts funded by our Adviser under the Expense Support Agreement. Following any calendar quarter in which Available Operating Funds in such calendar quarter exceed the cumulative distributions to common stockholders for which a record date has occurred in such calendar quarter (“Excess Operating Funds”) on a date mutually agreed upon by our Adviser and us (each such date, a “Reimbursement Date”), we shall pay such Excess Operating Funds (“Expense Support Repayment”), or a portion thereof, to the extent that we have cash available for such payment, to our Adviser until such time as all Expense Payments made by our Adviser to us have been reimbursed; provided that (i) the operating expense ratio as of such Reimbursement Date is equal to or less than the operating expense ratio as of the Expense Payment Date attributable to such specified Expense Payment; (ii) the annualized distribution rate, which includes all regular cash distributions paid and excludes special distributions or the effect of any stock dividends paid, as of such Reimbursement Date is equal to or greater than the annualized distribution rate as of the Expense Payment Date attributable to such specified Expense Payment; and (iii) such specified Expense Payment Date is not earlier than three years prior to the Reimbursement Date.
On March 29, 2016, we amended and restated the Expense Support Agreement to revise the definition on Available Operating Funds. Available Operating Funds is now defined as the sum of (i) our net investment income (minus any reimbursement payments payable to our Adviser), (ii) our net realized capital gains/losses and (iii) dividends and other distributions paid to us on account of our portfolio investments. However, for Expense Payments made under the prior version of the Expense Support Agreement, we will calculate Available Operating Funds for the purpose of determining whether we are obligated to make reimbursements to our Adviser as the sum of (i) our net investment income, (ii) the net realized capital gains/losses, (iii) the changes in unrealized losses, and (iv) dividends and other distributions paid to us from our portfolio investments. The calculation of changes in unrealized losses shall only reflect further reduction in value of individual investments from the largest previously recorded unrealized loss for such individual investment. Realized losses will only include the amount in excess of the largest previously recorded unrealized loss for the same investment.
On May 24, 2018, the Company's Board voted in favor of terminating the Third Amended and Restated Expense Support and Conditional Reimbursement Agreement, dated as of March 30, 2016 (the "ESA"), between the Company and the Adviser, effective as of July 1, 2018. The Company will continue to be obligated to reimburse any payments made by the Adviser to the Company that have not yet been reimbursed.
The purpose of the Expense Support Agreement was to minimize such distributions from us being characterized as returns of capital for U.S. GAAP purposes and to reduce operating expenses until we raised sufficient capital to be able to absorb such expenses. However, such distributions may still have been characterized as a return of capital for U.S. federal income tax purposes.
2019 SEMI-ANNUAL REPORT
PRIORITY INCOME FUND, INC. 29
The following table provides information regarding liabilities incurred by the Adviser pursuant to the Expense Support Agreement:
|
| | | | | | | | | | | | | | |
| Period Ended | Expense Support Reimbursements Made by Adviser | Expense Support Repayments to Adviser | Unreimbursed Expense Payments | Operating Expense Ratio(1) | Annualized Distribution Rate(2) | Eligible to be Repaid Through |
| March 31, 2016 | $ | 2,586,427 |
| $ | — |
| $ | 2,586,427 |
| 0.60 | % | 7.19 | % | March 31, 2019 |
| June 30, 2016 | — |
| — |
| — |
| 0.47 | % | 7.19 | % | June 30, 2019 |
| September 30, 2016 | — |
| — |
| — |
| 0.43 | % | 6.88 | % | September 30, 2019 |
| December 31, 2016 | — |
| — |
| — |
| 0.38 | % | 7.01 | % | December 31, 2019 |
| March 31, 2017 | — |
| — |
| — |
| 0.39 | % | 7.00 | % | March 31, 2020 |
| June 30, 2017 | — |
| — |
| — |
| 0.29 | % | 7.00 | % | June 30, 2020 |
| September 30, 2017 | — |
| — |
| — |
| 0.35 | % | 7.12 | % | September 30, 2020 |
| December 31, 2017 | — |
| — |
| — |
| 0.33 | % | 7.12 | % | December 31, 2020 |
| March 31, 2018 | 1,206,778 |
| (675,148 | ) | 531,630 |
| 0.34 | % | 7.43 | % | March 31, 2021 |
| June 30, 2018 | — |
| — |
| — |
| 0.29 | % | 7.43 | % | June 30, 2021 |
| September 30, 2018 | — |
| — |
| — |
| 0.31 | % | 8.00 | % | September 30, 2021 |
| December 31, 2018 | — |
| — |
| — |
| 0.42 | % | 7.79 | % | December 31, 2021 |
| Total | $ | 3,793,205 |
| $ | (675,148 | ) | $ | 3,118,057 |
| | | |
| | | | | | | |
(1)Operating expense ratio is as of the date the expense support payment obligation was incurred by the Adviser and includes all expenses borne by the Company, except for organizational and offering expenses, base management fees, incentive fees and any interest expense attributable to indebtedness incurred by the Company. |
(2)Annualized distribution rate equals the annualized rate of distributions to stockholders based on the amount of the regular distributions paid immediately prior to the date the expense support payment obligation was incurred by the Adviser. Annualized distribution rate does not include bonus dividends paid to stockholders. |
As of December 31, 2018, there were no Expense Support Repayment obligations payable to the Adviser.
Administration Agreement
On May 9, 2013, the Company entered into an administration agreement (the “Administration Agreement”) with Prospect Administration LLC (the “Administrator”), an affiliate of the Adviser. The Administrator performs, oversees and arranges for the performance of administrative services necessary for the operation of the Company. These services include, but are not limited to, accounting, finance and legal services. For providing these services, facilities and personnel, the Company reimburses the Administrator for the Company’s actual and allocable portion of expenses and overhead incurred by the Administrator in performing its obligations under the Administration Agreement, including rent and the Company’s allocable portion of the costs of its Chief Financial Officer and Chief Compliance Officer and her staff. During the six months ended December 31, 2018, $128,986 in administrator costs were incurred by the Company, $37,572 of which is included on the Statement of Assets and Liabilities as a payable under Due to Administrator.
Commissions and fees on shares of common stock sold
Provasi Securities, LP (the “Dealer Manager”), an indirect wholly-owned subsidiary of Stratera Holdings, acts as dealer manager for the offering and manages a group of participating broker-dealers, including other unaffiliated broker-dealers who enter into participating broker-dealer agreements with the Dealer Manager. The Company has agreed to pay the Dealer Manager selling commissions in the amount of 6.0% of the selling price of each share of common stock designated as “Class R” for which a sale is completed from the shares offered in the offering.
As compensation for acting as the Dealer Manager, the Company has agreed to pay the Dealer Manager a dealer manager fee in the amount of 2.0% of the selling price of each share of common stock designated as “Class R” or “Class RIA” for which a sale is completed. The Dealer Manager is expected to re-allow the full amount of selling commissions to participating broker-dealers and may re-allow up to 1.15% of the dealer manager fee to participating broker-dealers for reimbursement of marketing expenses.
During the six months ended December 31, 2018, the total sales load incurred through the offering of our common stock was $1,858,465, which includes $1,366,163 of selling commissions and $492,302 of dealer manager fees. These fees are charged against additional paid-in capital in the Statement of Assets and Liabilities.
2019 SEMI-ANNUAL REPORT
PRIORITY INCOME FUND, INC. 30
Investor Services Agreement
The Company has an investor services agreement (the “Investor Services Agreement”) under which the Company reimburses Destra Investor Services, LLC for providing investor relations support and related back-office services with respect to the Company’s investors. For the six months ended December 31, 2018, the total investor services expense was $176,238 which is presented as part of Adviser shared services expense in the Statement of Operations.
Offering Costs
The Adviser, on behalf of the Company, had overaccrued for offering costs totaling $11,997 for the six months ended December 31, 2018. As of December 31, 2018, $153,563 remains as a deferred asset on the Statement of Assets and Liabilities, while $137,460 has been amortized to expense in the Statement of Operations during the six months ended December 31, 2018 .
Offering expenses consist of costs for the registration, certain marketing activities and distribution of the Company’s shares. These expenses include, but are not limited to, expenses for legal, accounting, printing and certain marketing activities, and include salaries and direct expenses of the Adviser’s employees, employees of its affiliates and others for providing these services.
At December 31, 2018, the total due to the Adviser for organization and offering costs and operating expenses paid on behalf of the Company was $38,091, which is included within Due to Adviser on the Statement of Assets and Liabilities, and is broken out as follows:
|
| | | | | | | | | | | | |
| Fiscal Year or Period Ended | | Organization and Offering Costs (O&O) | | Operating Expenses (OpEx) paid on behalf of the Company | | Total Due to Adviser for O&O and OpEx paid on behalf of the Company |
| June 30, 2013 | | $ | 1,893,108 |
| | $ | — |
| | $ | 1,893,108 |
|
| June 30, 2014 | | 984,744 |
| | 558,394 |
| | 1,543,138 |
|
| June 30, 2015 | | 591,821 |
| | 1,418,046 |
| | 2,009,867 |
|
| June 30, 2016 | | 442,107 |
| | 1,148,321 |
| | 1,590,428 |
|
| June 30, 2017 | | 456,146 |
| | 730,938 |
| | 1,187,084 |
|
| June 30, 2018 | | 419,077 |
| | 24,239 |
| | 443,316 |
|
| December 31, 2018 | | (11,997 | ) | | 25,333 |
| | 13,336 |
|
| Total reimbursements made | | (4,736,915 | ) | | (3,885,271 | ) | | (8,622,186 | ) |
| | | $ | 38,091 |
| | $ | 20,000 |
| | $ | 58,091 |
|
Upon achieving the Minimum Offering Requirement, the Adviser was entitled to receive up to 5.0% of the gross proceeds from the offering as reimbursement for organization and offering costs that it has funded, until all of the organization and offering costs incurred and/or paid by the Adviser have been recovered. On January 8, 2014, the Adviser agreed to reduce such reimbursement and accept a maximum of 2% of the gross proceeds of the offering of the Company’s securities until all of the organization and offering costs incurred and/or paid by the Adviser have been recovered.
Co-Investments
On February 10, 2014, the Company received an exemptive order from the SEC (the “Order”) that gave it the ability to negotiate terms other than price and quantity of co-investment transactions with other funds managed by the Adviser or certain affiliates, including Prospect Capital Corporation (“PSEC”) and Pathway Capital Opportunity Fund, Inc. (“Pathway”), subject to the conditions included therein. Under the terms of the relief permitting the Company to co-invest with other funds managed by the Adviser or its affiliates, a “required majority” (as defined in Section 57(o) of the 1940 Act) of the Company’s independent directors must make certain conclusions in connection with a co-investment transaction, including that (1) the terms of the proposed transaction, including the consideration to be paid, are reasonable and fair to the Company and its stockholders and do not involve overreaching of the Company or its stockholders on the part of any person concerned and (2) the transaction is consistent with the interests of the Company’s stockholders and is consistent with the Company’s investment objective and strategies. In certain situations where co-investment with one or more funds managed by the Adviser or its affiliates is not covered by the Order, such as when there is an opportunity to invest in different securities of the same issuer, the personnel of the Adviser or its affiliates will need to decide which fund will proceed with the investment. Such personnel will make these determinations based on policies and procedures, which are designed to reasonably ensure that investment opportunities are allocated fairly and equitably among affiliated funds over time and in a manner that is consistent with applicable laws, rules and regulations. Moreover, except in certain circumstances, when relying on the Order, the Company will be unable to invest in any issuer in which one or more funds managed by the Adviser or its affiliates has previously invested.
2019 SEMI-ANNUAL REPORT
PRIORITY INCOME FUND, INC. 31
As of December 31, 2018, the Company had co-investments with PSEC in the following: Apidos CLO XXII, Barings CLO Ltd. 2018-III, Carlyle Global Market Strategies CLO 2016-3, Ltd., Cent CLO 21 Limited, Cent CLO 21 Limited Class E, CIFC Funding 2014-IV-R, Ltd., CIFC Funding 2014-V, Ltd. Class F, CIFC Funding 2016-I, Ltd., Galaxy XXVIII CLO, Ltd., Galaxy XXVIII CLO, Ltd. Class F, Halcyon Loan Advisors Funding 2014-2 Ltd., Halcyon Loan Advisors Funding 2015-3 Ltd., HarbourView CLO VII-R, Ltd., Jefferson Mill CLO Ltd., Mountain View CLO IX Ltd., Octagon Investment Partners 18-R Ltd., Romark WM-R Ltd., Symphony CLO XIV Ltd., Voya IM CLO 2014-1 Ltd., Voya CLO 2016-3, Ltd. and Voya CLO 2017-3, Ltd.; however HarbourView CLO VII-R, Ltd. and Octagon Investment Partners 18-R Ltd. are not considered co-investments pursuant to the Order as they were purchased on the secondary market.
As of December 31, 2018, the Company had co-investments with Pathway in the following: Carlyle Global Market Strategies CLO 2017-5, Ltd., Galaxy XIX CLO, Ltd., GoldenTree Loan Opportunities IX, Ltd., Madison Park Funding XIII, Ltd., Madison Park Funding XIV, Ltd., Octagon Investment Partners XIV, Ltd., Octagon Investment Partners XXI, Ltd., Octagon Investment Partners 30, Ltd., OZLM XII, Ltd., THL Credit Wind River 2013-1 CLO, Ltd.,Voya IM CLO 2013-1, Ltd. and Voya CLO 2016-1, Ltd.; however only Voya CLO 2016-1, Ltd. is a co-investment pursuant to the Order because all the others were purchased on the secondary market.
Allocation of Expenses
For CLO investments held by each of the Company, PSEC and Pathway, the cost of valuation services with regard to such investments is initially borne by the Company, which then allocates to PSEC and Pathway their proportional share of such expense based on the number of positions held by each entity. During the six months ended December 31, 2018, the Company incurred $134,717 in expenses related to valuation services that are attributable to PSEC and Pathway, of which $134,717 is still owed to the Company. Additionally, PSEC incurred $10,048 of expense on behalf of the Company related to financial reporting software and insurance, of which $10,048 is due and payable as of December 31, 2018.
Officers and Directors
Certain officers and directors of the Company are also officers and directors of the Adviser and its affiliates. For the six months ended December 31, 2018, $75,000 was paid to the independent directors of the Company, which is included within the Statement of Operations. The officers do not receive any direct compensation from the Company.
Note 6. Dividends and Distributions
Dividends from net investment income and capital gain distributions are determined in accordance with U.S. federal income tax regulations, which differ from U.S. GAAP.
The following tables reflect the distributions per share that the Company declared and paid or are payable to its stockholders during the six months ended December 31, 2018. Stockholders of record as of each respective record date were or will be entitled to receive the distribution.
|
| | | | | | | | | | |
| Record Date | | Payment Date | | Total Amount per Share(a) | | Amount Distributed |
| July 6, 13, 20 and 27, 2018 | | July 30, 2018 | | $ | 0.08780 |
| | $ | 2,188,860 |
|
| August 3, 10, 17, 24 and 31, 2018 | | September 4, 2018 | | 0.10975 |
| | 2,740,516 |
|
September 7, 14, 21 and 28, 2018(b) | | October 1, 2018 | | 0.16691 |
| | 4,234,090 |
|
| October 5, 12, 19 and 26, 2018 | | October 29, 2018 | | 0.09212 |
| | 2,397,381 |
|
| November 2, 9, 16, 23 and 30, 2018 | | December 3, 2018 | | 0.11515 |
| | 3,000,591 |
|
December 7, 14, 21 and 28, 2018(b) | | December 31, 2018 | | 0.16691 |
| | 4,403,877 |
|
| Total declared and distributed for the six months ended December 31, 2018 | | $ | 18,965,315 |
|
| | |
(a)Total amount per share represents the total distribution rate for the record dates indicated. | |
(b)Includes bonus distributions. | |
2019 SEMI-ANNUAL REPORT
PRIORITY INCOME FUND, INC. 32
Dividends and distributions to stockholders are recorded on the record date. The table above includes distributions with record dates during the six months ended December 31, 2018 and does not include distributions previously declared to stockholders of record on any future dates, as those amounts are not yet determinable. The following distributions were previously declared and have record dates subsequent to December 31, 2018 for the common shares:
|
| | | | | | |
| Record Date | | Payment Date | | Total Amount per Share(a) |
| January 4, 11, 18 and 25, 2019 | | January 28, 2019 | | $ | 0.09212 |
|
| February 1, 8, 15 and 22, 2019 | | February 25, 2019 | | $ | 0.09212 |
|
| | | | | |
(a)Total amount per share represents the total distribution rate for the record dates indicated. |
The Company may fund its distributions to stockholders from any sources of funds available, including offering proceeds, borrowings, net investment income from operations, capital gains proceeds from the sale of assets, and non-capital gains proceeds from the sale of assets. Any capital returned to stockholders through distributions will be distributed after payment of fees and expenses.
Following commencement of the Company’s continuous public offering, substantial portions of the Company’s dividends to stockholders have been funded through Expense Support Reimbursements that are subject to repayment by the Company. The purpose of this arrangement was to ensure that no portion of the Company’s dividends to stockholders was paid from offering proceeds. Any such dividends funded through Expense Support Reimbursements were not based on the Company’s investment performance. The repayment of these Expense Support Reimbursements owed to the Adviser will reduce the future distributions to which stockholders would otherwise be entitled. As of December 31, 2018, there were no Expense Support Repayment obligations payable to the Adviser. There can be no assurance that the Company will achieve the performance necessary to sustain its distributions or that the Company will be able to pay distributions at a specific rate or at all.
The Company has adopted an “opt in” distribution reinvestment plan pursuant to which stockholders may elect to have the full amount of distributions reinvested in additional shares. Stockholders will receive distributions in cash unless specifically “opting in” to the distribution reinvestment plan to have cash distributions reinvested in additional shares of the Company. Reinvested distributions will purchase shares at a price equal to 95% of the price that shares are sold in the offering at the closing immediately following the distribution payment date. There will be no selling commissions, dealer manager fees or other sales charges for shares issued under the distribution reinvestment plan.
The Company issued 824,398 and 1,133,607 shares of its common stock in connection with the distribution reinvestment plan for the six months ended December 31, 2018 and year ended June 30, 2018, respectively.
Note 7. Mandatorily Redeemable Preferred Stock
The Company has authorized 15,000,000 shares of mandatorily redeemable preferred stock, at a par value of $0.01 per share, and had 2,360,000 shares issued and outstanding at December 31, 2018.
The Company completed an underwritten public offerings of 1,360,000 shares of its 6.375% Series A Term Preferred Stock Due 2025 (the “Series A Term Preferred Stock”) on June 30, 2018. Proceeds received from the offering were $32,937,500. The Company is required to redeem all of the outstanding Series A Term Preferred Stock on its redemption date of June 30, 2025, at a redemption price equal to $25 per share plus an amount equal to accumulated but unpaid dividends, if any, to the date of the redemption. The Company cannot effect any amendment, alteration, or repeal of the Company’s obligation to redeem all of the Series A Term Preferred Stock without the prior unanimous vote or consent of the holders of such Series A Term Preferred Stock. At any time on or after June 20, 2021 (the optional redemption date), at the Company’s sole option, the Company may redeem the Series A Term Preferred Stock at a redemption price per share equal to the sum of the $25 liquidation preference per share plus an amount equal to accumulated but unpaid dividends, if any, on such Series A Term Preferred Stock. The Company, with the authorization by the Board, may repurchase any of the Series A Term Preferred Stock from time to time in the open market after June 30, 2021 and effectively extinguish the preferred stock. The fair value per share of the Term Preferred Shares as of December 31, 2018 is $24.17 for a total fair value of $32,871,200.
The Company completed an underwritten public offering of 900,000 shares of its 6.25% Series B Term Preferred Stock Due 2023 (the “Series B Term Preferred Stock”) on October 23, 2018. The Company issued an additional 100,000 shares pursuant to the underwriters’ partial exercise of their overallotment option on November 2, 2018. Proceeds received from the offering were $24,218,750. The Company is required to redeem all of the outstanding Series B Term Preferred Stock on its redemption date of December 31, 2023, at a redemption price equal to $25 per share plus an amount equal to accumulated but unpaid dividends, if any, to the date of the redemption. The Company cannot effect any amendment, alteration, or repeal of the Company’s obligation to redeem all of the Series B Term Preferred Stock without the prior unanimous vote or consent of the holders of such Series B Term Preferred Stock. At any time on or after October 23, 2020 (the optional redemption date), at the Company’s sole option, the Company may redeem the Series B Term Preferred Stock at a redemption price per share equal to the sum of the $25 liquidation preference per share plus an amount equal to accumulated but unpaid dividends, if any, on such Series B Term Preferred Stock. The Company, with the authorization by the Board, may repurchase any of the Series B Term Preferred Stock from time to time in the open market after June 30, 2021 and effectively extinguish the preferred stock. The fair value per share of the Term Preferred Shares as of December 31, 2018 is $24.12 for a total fair value of $24,120,000.
|
| | | | | | |
| | Series A Term Preferred Stock Due 2025 | Series B Term Preferred Stock Due 2023 |
| Principal Value | $ | 34,000,000 |
| $ | 25,000,000 |
|
| Unamortized deferred offering cost | (304,622 | ) | (273,097 | ) |
| Unamortized discount | (1,003,628 | ) | (758,146 | ) |
| Carrying value | $ | 32,691,750 |
| $ | 23,968,757 |
|
Note 8. Income Taxes
The information presented in this footnote is based on our most recent tax year ended June 30, 2018.
For income tax purposes, distributions made to shareholders are reported as ordinary income, capital gains, non-taxable return of capital, or a combination thereof. The expected tax character of distributions declared and paid to shareholders during the year ended June 30, 2018 was as follows:
|
| | | |
| | Year ended June 30, 2018 |
| Ordinary income | $ | 18,937,383 |
|
| Capital gain | 573,782 |
|
| Return of capital | 14,430,036 |
|
| Total dividends declared and paid to shareholders | $ | 33,941,201 |
|
As of August 29, 2018 when our prior N-CSR was filed for the year ended June 30, 2018, we estimated our distributions of ordinary income to be $22,088,184, capital gain to be $540,750 and return of capital to be $11,312,267. Subsequent to our filing date, we obtained more information from our underlying investments as to the character of the distributions received which resulted in changes to our N-CSR filing. As a result of the change, we estimated our distributions of ordinary income to be $18,937,383, capital gain changed to be $573,782 and return of capital to be $14,430,036.
While the tax character of distributions paid to shareholders for the year ended June 30, 2018 are expected to be characterized as ordinary income, capital gain and return of capital, the final determination of the tax character of distributions for this year will not be made until we file our tax return for the tax year ended June 30, 2018.
As of June 30, 2018, the estimated components of distributable earnings on a tax basis were as follows:
|
| | | |
| Overdistributed Ordinary Income | $ | (13,490,401 | ) |
| Temporary Differences | 13,442,181 |
|
| Net Unrealized Gain on Investments | 3,771,710 |
|
As a result of the changes in the character of the distributions for the year ended June 30, 2018, the components of accumulated earnings on a tax basis were adjusted from our prior N-CSR filing. Per the prior N-CSR filing, overdistributed ordinary income, temporary differences and net unrealized gain on investments were $(15,919,517), $13,458,865 and $3,066,373, respectively. The revised estimated components of earnings for as of June 30, 2018 for overdistributed ordinary income, temporary differences and net unrealized gain on investments were $(13,490,401), $(13,442,181), and $3,771,710, respectively.
2019 SEMI-ANNUAL REPORT
PRIORITY INCOME FUND, INC. 33
In general, we may make certain adjustments to the classification of net assets as a result of permanent book-to-tax differences, which may include differences in the book and tax basis of certain assets and liabilities, amortization of offering costs and nondeductible federal excise taxes, among other items. For the year ended June 30, 2018, we increased accumulated undistributed net investment income by $461,584 and decreased paid-in capital in excess of par by $461,584.
Note 9. Concentration and Credit Risks
Cash held at financial institutions, at times, may exceed the amount insured by the Federal Deposit Insurance Corporation. The Company’s portfolio may be concentrated in a limited number of investments in CLO vehicles, which is subject to a risk of loss if that sector experiences a market downturn. The Company is subject to credit risk in the normal course of pursuing its investment objectives. The Company’s maximum risk of loss from credit risk for its portfolio investments is the inability of the CLO collateral managers to return up to the cost value due to loan defaults occurring in the underlying collateral within the CLOs.
Note 10. Commitments and Contingencies
The Company has a conditional obligation to reimburse the Adviser for any amounts funded by the Adviser under the Expense Support Agreement if (and only to the extent that), following any fiscal quarter occurring within three years of the date on which the Adviser incurred the liability for such amount, Available Operating Funds exceeds the distributions paid by the Company to stockholders to the extent that the Company has cash available for such payment. The Company will only make Expense Support Repayments if its operating expense ratio is equal to or less than its operating expense ratio at the time the corresponding Expense Support Reimbursement was incurred and if the annualized rate of the Company’s regular cash distributions to stockholders is equal to or greater than the annualized rate of its regular cash distributions to stockholders at the time the corresponding Expense Support Reimbursement was incurred. No reimbursement will be paid to the Adviser more than three years after such corresponding Expense Support Reimbursement was incurred. The Company is unable to estimate the amount that would be reimbursable to the Adviser at the time the above event occurs. However, the maximum exposure to the Company is the total of the Expense Support Reimbursements from the Adviser. As of December 31, 2018, the amount of expense support that is conditionally reimbursable by the Company to its Adviser is $3,118,057.
The Company is not currently subject to any material legal proceedings and, to the Company’s knowledge, no material legal proceedings are threatened against the Company. From time to time, the Company may be a party to certain legal proceedings in the ordinary course of business, including proceedings relating to the enforcement of the Company’s rights under contracts with its portfolio companies. While the outcome of any legal proceedings cannot be predicted with certainty, the Company does not expect that any such proceedings will have a material adverse effect upon its financial condition or results of operations.
On December 21, 2019, the Company entered into a definitive agreement (the “Merger Agreement”) pursuant to which the Company agreed, subject to the satisfaction of certain closing conditions, to acquire Stira Alcentra Global Credit Fund, a Delaware statutory trust (“Stira Alcentra”), in a common stock transaction (the “Stira Alcentra Acquisition”). The Stira Alcentra Acquisition and the Merger Agreement have each been approved by the Board of Directors of the Company. The Company has filed a registration statement on Form N-14 with the Securities and Exchange Commission relating to the Stira Alcentra Acquisition and the shares of its common stock to be issued in connection with the Stira Alcentra Acquisition. The Stira Alcentra Acquisition cannot be completed unless and until the registration statement is declared effective. In addition, the Stira Alcentra Acquisition is subject to the approval of the Stira Alcentra shareholders and a meeting of Stira Alcentra shareholders has not yet been scheduled. There can be no assurance that the Stira Alcentra Acquisition will be completed as scheduled, or at all.
2019 SEMI-ANNUAL REPORT
PRIORITY INCOME FUND, INC. 34
Note 11. Financial Highlights
The following is a schedule of financial highlights for the six months ended December 31, 2018, years ended June 30, 2018, 2017, 2016 and 2015, and the period from January 6, 2014 (the date non-affiliate stockholders were admitted into the Company) to June 30, 2014. The Company has omitted the financial highlights for the periods prior to January 6, 2014 since non-affiliated shareholders were not yet admitted to the Company nor did the Company commence investment operations. Although the Company has designated its differing up-front sale loads as different “share classes”, the Company does not operate as a multi-class fund and each share of the Company has the same net asset value, as well as identical voting and distributions rights, and bears its own pro rata portion of the Company’s expenses.
|
| | | | | | | | | | | | | | | | | | | | | | | | | | | | |
| | | | | | | Six Months Ended | | Year Ended | | Year Ended | | Year Ended | | Year Ended | | Period Ended(a) |
| | | | | | | December 31, 2018 | | June 30, 2018 | | June 30, 2017 | | June 30, 2016 | | June 30, 2015 | | June 30, 2014 |
| Per share data: | | | | | | | | | | | |
| Net asset value, beginning of year or period | $ | 13.47 |
| | $ | 14.43 |
| | $ | 14.24 |
| | $ | 13.39 |
| | $ | 9.60 |
| | $ | 13.80 |
|
Net investment income(b)(h) | 0.81 |
| | 1.60 |
| | 1.76 |
| | 2.03 |
| | 1.64 |
| | 0.66 |
|
Net realized and unrealized gain (loss) on investments(b) | (0.53 | ) | | (1.19 | ) | | (0.22 | ) | | 0.27 |
| | 0.58 |
| | (0.06 | ) |
| Net increase in net assets resulting from operations | 0.28 |
| | 0.41 |
| | 1.54 |
| | 2.30 |
| | 2.22 |
| | 0.60 |
|
Distributions to stockholders(g) | | | | | | | | | | | |
Dividends from net investment income (b) | (0.30 | ) | | (0.83 | ) | | (1.30 | ) | | (1.50 | ) | | (1.50 | ) | | (0.61 | ) |
Capital gain(b) | — |
| | (0.03 | ) | | — |
| | — |
| | — |
| | — |
|
Return of capital(b) | (0.44 | ) | | (0.64 | ) | | (0.21 | ) | | — |
| | — |
| | — |
|
Total distributions(c) | (0.74 | ) | | (1.50 | ) | | (1.51 | ) | | (1.50 | ) | | (1.50 | ) | | (0.61 | ) |
Offering costs(b) | — |
| | — |
| | — |
| | (0.02 | ) | | (0.27 | ) | | (1.36 | ) |
Other(d) | 0.04 |
| | 0.13 |
| | 0.16 |
| | 0.07 |
| | 3.34 |
| | (2.83 | ) |
| Net asset value, end of year or period | $ | 13.05 |
| | $ | 13.47 |
| | $ | 14.43 |
| | $ | 14.24 |
| | $ | 13.39 |
| | $ | 9.60 |
|
| | | | | | | | | | | | | | | | | |
Total return, based on NAV(e) | 2.45 | % | | 3.94 | % | | 12.82 | % | | 19.13 | % | | 56.24 | % | | (27.15 | )% |
| Supplemental Data: | | | | | | | | | | | |
| Net assets, end of year or period | $ | 346,892,993 |
| | $ | 332,681,912 |
| | $ | 285,033,346 |
| | $ | 182,280,330 |
| | $ | 69,237,648 |
| | $ | 6,787,044 |
|
| Ratio to average net assets: | | | | | | | | | | | |
Total expenses excluding expense support (reimbursements)/repayments(h)(i) | 7.76 | % | | 6.41 | % | | 6.91 | % | | 7.11 | % | | 9.76 | % | | 79.50 | % |
Expenses after expense support (reimbursements)/repayments, net(f)(i) | 7.76 | % | | 6.25 | % | | 7.52 | % | | 3.49 | % | | — | % | | (2.50 | )% |
Net investment income(i) | 12.08 | % | | 11.46 | % | | 12.22 | % | | 14.94 | % | | 13.04 | % | | (18.02 | )% |
| | | | | | | | | | | | | | | | | |
| Portfolio turnover | — | % | | 1 | % | | 1 | % | | 1 | % | | 1 | % | | 6 | % |
2019 SEMI-ANNUAL REPORT
PRIORITY INCOME FUND, INC. 35
|
| | | | | | | | | | | | | | | | | | | | | | | | | | | | |
| | | | | | | | | | | | | | | | | |
(a) Represents the period from January 6, 2014 (the date non-affiliate stockholders were admitted into the Company) to June 30, 2014. The net asset value at the beginning of the period is the net offering price as of January 6, 2014, which is the date that the Company satisfied its minimum offering requirement by raising over $2.5 million from selling shares to persons not affiliated with the Company or the Adviser (the “Minimum Offering Requirement”), and as a result, broke escrow and commenced making investments. |
(b) Calculated based on weighted average shares outstanding during the year or period. |
(c) The per share data for distributions is the actual amount of distributions paid or payable per share of common stock outstanding during the year or period. Distributions per share are rounded to the nearest $0.01. Distributions paid on shares of preferred stock during the six months ended December 31, 2018 was $1,414,523. |
(d) The amount shown represents the balancing figure derived from the other figures in the schedule, and is primarily attributable to the accretive effects from the sales of the Company’s shares and the effects of share repurchases during the year or period. |
(e) Total return is based upon the change in net asset value per share between the opening and ending net asset values per share during the year or period and assumes that dividends are reinvested in accordance with the Company’s dividend reinvestment plan. The computation does not reflect the sales load for any shares. Total return based on market value is not presented since the Company’s shares are not publicly traded. For periods less than one year, total return is not annualized. |
(f) For the year/period ended June 30, 2018, 2017, 2016, 2015, and 2014 there were Expense Support Repayments (Reimbursements), net of ($675,148), $1,441,093, ($4,630,655), ($1,593,549), and ($1,250,711), respectively. There were no Expense Support Repayments (Reimbursements) for the six months ended December 31 2018. |
(g) The amounts reflected for the year ended June 30, 2018 were updated based on tax information received subsequent to the N-CSR filing. |
(h) Net Investment Income ratios reflect income earned and expenses incurred on assets attributable to preferred shares (as described in Note 7. Mandatorily Redeemable Preferred Shares). Preferred shares are only outstanding for periods after June 27, 2018 and the ratio of preferred dividend expense to average net assets applicable to the common shares for the six months ended December 31, 2018 is 0.44%. |
(i) Annualized for the six months ended December 31, 2018. |
|
| | | | | | | | | | | | | |
Manditorily Redeemable Preferred Shares at the End of the Year(a) |
| Year | Aggregate Amount Outstanding | Asset Coverage per Preferred Share | Involuntary Liquidating Price per Preferred share | Average market value per unit(b) |
| 2018 | $ | 59,000,000 | | $ | 171.00 |
| $ | 25.00 |
| $ | 24.15 |
|
| | | | | | |
(a)For financial reporting purposes, preferred shares are considered to be debt. The Asset Coverage amounts per $25 of Preferred shares (the dollar amount per share) reflects the amount of Fund total assets (less all liabilities not represented by borrowings and preferred shares) per $25 Preferred Share of the combined amount of borrowings and outstanding preferred shares and the Asset Coverage amounts per financial reporting purposes. |
(b)The average market value is the settlement price as of December 31, 2018. |
Note 12. Subsequent Events
During the period from January 1, 2019 through February 28, 2019, we raised $6.5 million of capital, net of offering proceeds, through the issuance of 456,121 shares.
During the period from January 1, 2019 through February 28, 2019, we made 1 CLO equity investment totaling $1.2 million which was an add-on to an existing investment.
The Company completed an underwritten public offerings of the Series C Term Preferred Shares on February 20, 2019. We issued 1,400,000 Series C Term Preferred Shares and proceeds received from the offering was $33,906,250. The Company is required to redeem all of the outstanding Series C Term Preferred Shares on the redemption date of June 30, 2024, at a redemption price equal to $25 per share plus an amount equal to accumulated but unpaid dividends, if any, to the date of the redemption. We granted the underwriters an option to purchase up to an additional 210,000 shares of Series C Term Preferred Stock at the public offering price, less underwriting discounts and commissions, for 30 days after the date of the prospectus relating to the Series C Term Preferred Shares solely to cover overallotments. Concurrently with the issuance of the primary shares in the offering, the Company issued an additional 100,000 shares of Series C Term Preferred Shares for net proceeds of $2,421,875. On February 28, 2019, the
2019 SEMI-ANNUAL REPORT
PRIORITY INCOME FUND, INC. 36
Company received notice of the underwriters exercise of the overallotment option to purchase the remaining 110,000 shares of Series C Term Preferred Stock. Closing on the overallotment exercise is scheduled for March 4, 2019 and estimated for net proceeds are $2,664,063.
On February 25, 2019, our Board of Directors declared a series of distributions for the months of March through May
2019 reflected in the following table. Stockholders of record as of each respective record date will be entitled to receive the
distribution.
|
| | | | | | |
| Record Date | | Payment Date | | Total Amount per Share(a) |
March 1, 8, 15, 22 and 29, 2019(b) | | April 1, 2019 | | $ | 0.18777 |
|
| April 4, 12, 19 and 26, 2019 | | April 29, 2019 | | 0.09320 |
|
| May 3, 10, 17, 24 and 31, 2019 | | June 3, 2019 | | 0.11650 |
|
| | | | | |
(a)Total amount per share represents the total distribution rate for the record dates indicated. |
(b)Includes bonus distributions. |
2019 SEMI-ANNUAL REPORT
PRIORITY INCOME FUND, INC. 37
DISTRIBUTION REINVESTMENT PLAN
Subject to the Company’s Board of Directors’ discretion and applicable legal restrictions, the Company intends to authorize and declare ordinary cash distributions on a quarterly basis and pay such distributions on a monthly basis. The Company have adopted an “opt in” distribution reinvestment plan pursuant to which stockholders may elect to have the full amount of their cash distributions reinvested in additional shares. Any distributions of the Company’s shares pursuant to the Company’s distribution reinvestment plan are dependent on the continued registration of the Company’s securities or the availability of an exemption from registration in the recipient’s home state. Participants in the Company’s distribution reinvestment plan are free to elect or revoke reinstatement in the distribution plan within a reasonable time as specified in the plan. If stockholders do not elect to participate in the plan, stockholders will automatically receive any distributions the Company declares in cash. For example, if the Company’s Board of Directors authorizes, and the Company declares, a cash distribution, then if stockholders have “opted in” to the Company’s distribution reinvestment plan, those stockholders will have their cash distributions reinvested in additional shares, rather than receiving cash distributions. During this offering, the Company generally intends to coordinate distribution payment dates so that the same price that is used for the closing date immediately following such distribution payment date will be used to calculate the purchase price for purchasers under the distribution reinvestment plan. In such case, stockholders reinvested distributions will purchase shares at a price equal to 95% of the price that shares are sold in the offering at the closing immediately following the distribution payment date. Shares issued pursuant to the Company’s distribution reinvestment plan will have the same voting rights as shares offered pursuant to the prospectus.
If stockholders wish to receive their distribution in cash, no action will be required on their part to do so. If stockholders are a registered stockholder, they may elect to have their entire distribution reinvested in shares by notifying DST Systems, Inc., the reinvestment agent, and the Company’s transfer agent and registrar, in writing so that such notice is received by the reinvestment agent no later than the record date for distributions to stockholders. If stockholders elect to reinvest their distributions in additional shares, the reinvestment agent will set up an account for shares stockholders acquire through the plan and will hold such shares in non-certificated form. If stockholders shares are held by a broker or other financial intermediary, stockholders may “opt in” to the Company’s distribution reinvestment plan by notifying their broker or other financial intermediary of their election.
The Company intends to use newly issued shares to implement the plan and determine the number of shares the Company will issue to stockholders as follows:
To the extent the Company’s shares are not listed on a national stock exchange or quoted on an over-the-counter market or a national market system (collectively, an “Exchange”):
| |
| • | during any period when the Company is making a “best-efforts” public offering of the Company’s shares, the number of shares to be issued to stockholders shall be determined by dividing the total dollar amount of the distribution payable to stockholders by a price equal to 95% of the price that the shares are sold in the offering at the closing immediately following the distribution payment date; and |
| |
| • | during any period when the Company is not making a “best-efforts” offering of the Company’s shares, the number of shares to be issued to stockholders shall be determined by dividing the total dollar amount of the distribution payable to stockholders by a price equal to the net asset value as determined by the Company’s Board of Directors. |
To the extent the Company’s shares are listed on an Exchange, the number of shares to be issued to stockholders shall be determined by dividing the total dollar amount of the distribution payable to stockholders by the market price per share of the Company’s shares at the close of regular trading on such Exchange on the valuation date fixed by the Company’s Board of Directors for such distribution.
There will be no selling commissions, dealer manager fees or other sales charges to stockholders if they elect to participate in the distribution reinvestment plan. The Company will pay the reinvestment agent’s fees under the plan.
If stockholders receive their ordinary cash distributions in the form of shares, stockholders generally are subject to the same federal, state and local tax consequences as they would be had they elected to receive their distributions in cash. Stockholders’ basis for determining gain or loss upon the sale of shares received in a distribution from the Company will be equal to the total dollar amount of the distribution payable in cash. Any shares received in a distribution will have a holding period for tax purposes commencing on the day following the day on which the shares are credited to stockholders’ account.
2019 SEMI-ANNUAL REPORT
PRIORITY INCOME FUND, INC. 38
MANAGEMENT
Our Board of Directors oversees our management. Our Board of Directors currently consists of five members, three of whom are not “interested persons” of us as defined in Section 2(a)(19) of the 1940 Act. We refer to these individuals as our independent directors. M. Grier Eliasek is considered an interested person of us as a result of his position as President and Chief Executive Officer of us and President and Chief Operating Officer of our Adviser, and his executive positions at certain affiliates of our Adviser, and Frank Muller is considered an interested person of us as a result of his executive positions at certain affiliates of our Adviser. Our Board of Directors elects our officers, who serve at the discretion of our Board of Directors. The responsibilities of each director will include, among other things, the oversight of our investment activity, the quarterly valuation of our assets, and oversight of our financing arrangements. Our Board of Directors has also established an Audit Committee and a Nominating and Corporate Governance Committee and may establish additional committees in the future.
Our directors and officers and their principal occupations during the past five years are set forth below. Our prospectus includes additional information about our directors and is available, without charge, upon request by calling (212) 448-0702.
Board of Directors and Executive Officers
Directors
Information regarding the Board of Directors is as follows:
|
| | | | | | |
Name (Age) Position(s) with the Company (Since) Address(1) | |
Term Expires | | Number of Companies in the Fund Complex overseen by Director(2) | | Principal
Occupation(s) and Other Public Company Directorships Held During the Past 5 Years |
Interested Directors(4) | | | | | | |
M. Grier Eliasek (45) Chairman of the Board, Director, Chief Executive Officer and President (February 2013) | | 2021 | | 3 | | President and Chief Operating Officer of the Adviser, President and Chief Operating Officer of the Adviser of Pathway, Chief Execuitve Officer of Pathway, President and Chief Operating Officer of PSEC, Managing Director of PCM and Prospect Administration |
Frank Muller (56) Director (January 2018) | | 2020 | | 2 | | Chief Executive Officer of Provasi Capital Partners LP and other senior executive positions at Stratera. |
| Independent Directors | | | | | | |
Andrew C. Cooper (57) Director (February 2013) | | 2021 | | 3 | | Mr. Cooper is an entrepreneur, who over the last 15 years has founded, built, run and sold three companies. He is Co-Chief Executive Officer of Unison Energy, LLC, a company that develops, owns and operates, distributed combined heat and power co-generation solutions. |
William J. Gremp (75) Director (February 2013) | | 2020 | | 3 | | Mr. Gremp has been responsible for traditional banking services, credit and lending, private equity and corporate cash management with Merrill Lynch & Co. from 1999 to present. |
Eugene S. Stark (60) Director (February 2013) | | 2019 | | 3 | | Principal Financial Officer, Chief Compliance Officer and Vice President—Administration of General American Investors Company, Inc. from May 2005 to present. |
| |
| (1) | The business address of each director of the Company is c/o Priority Income Fund, Inc., 10 East 40th Street, 42nd Floor, New York, New York 10016. |
| |
| (2) | The Fund Complex consists of the Company, Pathway, and PSEC. |
| |
| (3) | Mr. Eliasek is an interested director as defined in the 1940 Act because of his positions with PCM and our Adviser. Mr. Muller is an interested director as defined in the 1940 Act because of his position as an officer of Stratera. |
2019 SEMI-ANNUAL REPORT
PRIORITY INCOME FUND, INC. 39
Executive Officers Who Are Not Directors
|
| | | | | | |
| Name, Address and Age | | Position(s) Held with the Funds | | Term at Office and Length of Time Served | | Principal Occupation(s) During Past 5 Years |
Kristin Van Dask, 39(1) | | Chief Financial Officer, Chief Compliance Officer, Treasurer and Secretary | | Since April 2018 | | Ms. Van Dask has been the Chief Financial Officer, Chief Compliance Officer, Treasurer and Secretary of the Company since April 2018. Ms. Van Dask previously served as controller at Prospect Administration. Ms. Van Dask is also the Chief Financial Officer, Chief Compliance Officer, Treasurer and Secretary of the Adviser, the Adviser of Pathway, Pathway and PSEC. |
Michael D. Cohen, 44(1) | | Executive Vice President | | Since July 2012 | | Mr. Cohen is also the Executive Vice President of the Adviser, the Adviser for Pathway and Pathway, is the President of Vertical Capital Income Fund since July 2015, and has served in numerous executive roles with other entities affiliated with Stratera Holdings since 2005. |
| |
| (1) | The business address of Ms. Van Dask and Mr. Cohen is c/o Priority Income Fund, Inc., 10 East 40th Street, 42nd Floor, New York, New York 10016. |
Compensation of Directors
The following table sets forth compensation of our directors for six months ended December 31, 2018.
|
| | | | | | | | | | | | | | | |
| Name | | Fees Earned(1) | | All Other Compensation(2) | | Total |
| Interested Directors | | | | | | | | | |
| M. Grier Eliasek | | $ | — |
| | | $ | — |
| | | $ | — |
| |
| Frank Muller | | — |
| | | — |
| | | — |
| |
| Independent Directors | | | | | | | | | |
| Andrew C. Cooper | | 25,000 |
| | | — |
| | | 25,000 |
| |
| William J. Gremp | | 25,000 |
| | | — |
| | | 25,000 |
| |
| Eugene S. Stark | | 25,000 |
| | | — |
| | | 25,000 |
| |
| | Total director compensation | $ | 75,000 |
| |
(1)For a discussion of the independent directors’ compensation, see below.
(2)We do not maintain a stock or option plan, non-equity incentive plan or pension plan for our directors.
Prior to meeting our minimum offering requirement, our directors are not entitled to compensation. Subsequent to meeting our minimum offering requirement, our directors who do not also serve in an executive officer capacity for us or our Adviser will be entitled to receive annual cash retainer fees, determined based on our net asset value as of the end of each fiscal quarter. These directors will be Messrs. Cooper, Gremp and Stark. Amounts payable under this arrangement will be determined and paid quarterly in arrears as follows:
|
| | | | |
| Net Asset Value | | Annual Cash Retainer |
| $0 - $100,000,000 | | $ | — |
|
| $100,000,001 - $300,000,000 | | 35,000 |
|
| $300,000,001 - $500,000,000 | | 50,000 |
|
| $500,000,001 - $1 billion | | 75,000 |
|
| >$1 billion | | 100,000 |
|
We will also reimburse each of the above directors for all reasonable and authorized business expenses in accordance with our policies as in effect from time to time, including reimbursement of reasonable out-of-pocket expenses incurred in connection with attending each board meeting and each committee meeting not held concurrently with a board meeting.
We do not pay compensation to our directors who also serve in an executive officer capacity for us or our Adviser.
2019 SEMI-ANNUAL REPORT
PRIORITY INCOME FUND, INC. 40
Compensation of Executive Officers
Our executive officers will not receive any direct compensation from us. We do not currently have any employees and do not expect to have any employees. Services necessary for our business are provided by individuals who are employees of Prospect Capital Management, Prospect Administration or Stratera Holdings or by individuals who were contracted by such entities to work on behalf of us, pursuant to the terms of the Investment Advisory Agreement between the Company and our Adviser, the Administration Agreement between the Company and Prospect Administration or the Investor Services Agreement between the Company and Destra Investor Services, LLC. Each of our executive officers is an employee of our Adviser, Prospect Capital Management, Prospect Administration, Stratera Holdings or an outside contractor, and the day-to-day investment operations and administration of our portfolio are managed by our Adviser. In addition, we reimburse Prospect Administration for our actual and allocable portion of expenses incurred by Prospect Administration, as applicable, in performing its obligations under the Administration Agreement, including the allocable portion of the cost of our chief financial officer, chief compliance officer, treasurer and secretary and other administrative support personnel under the Administration Agreement. We also reimburse Destra Investor Services for the costs and expenses incurred by Destra Investor Services in performing its obligations and providing personnel and facilities under the Investor Services Agreement.
ADDITIONAL INFORMATION
Portfolio Information
The Company files its complete schedule of portfolio holdings with the Securities and Exchange Commission for the first and third quarters of each fiscal year on Form N-Q, within 60 days after the end of the relevant period. Form N-Q filings of the Company is available on the Commission’s website at http://www.sec.gov. Information on the operation of the Public Reference Room may be obtained by calling 202-551-8090. This information will also be available free of charge by contacting the Company by mail at 10 East 40th Street, 42nd Floor, New York, NY 10016, by telephone at (212) 448-0702 or on its website at http://www.priorityincome.com.
Proxy Information
A description of the policies and procedures that the Company uses to determine how to vote proxies relating to portfolio securities is available (i) without charge, upon request, by calling collect (212) 448-0702; (ii) on the Company’s website at http://www.priority-incomefund.com and (iii) on the SEC’s website at http://www.sec.gov.
Tax Information
For tax purposes, distributions to stockholders during the six months ended December 31, 2018 was approximately $7,671,449 for distributions from net investment income and $11,293,866 from return of capital.
Privacy Policy
We are committed to protecting your privacy. This privacy notice, which is required by federal law, explains our privacy policies and our affiliated companies. This notice supersedes any other privacy notice you may have received from us.
We will safeguard, according to strict standards of security and confidentiality, all information we receive about you. The only information we collect from you is your name, date of birth, address, citizenship status (and country of origin, if applicable), number of shares you hold and your social security number. This information is used only so that we can register your shares, send you periodic reports and other information about us, and send you proxy statements or other information required by law.
We do not share this information with any non-affiliated third-party except as described below:
| |
| • | Authorized personnel of our Adviser. It is our policy that only authorized personnel of our Adviser who need to know your personal information will have access to it. |
| |
| • | Service providers. We may disclose your personal information to companies that provide services on our behalf, such as record keeping, processing your trades and mailing you information. These companies are required to protect your information and use it solely for the purpose for which they received it. |
| |
| • | Courts and government officials. If required by law, we may disclose your personal information in accordance with a court order or at the request of government regulators. Only that information required by law, subpoena or court order will be disclosed. |
2019 SEMI-ANNUAL REPORT
PRIORITY INCOME FUND, INC. 41
BOARD OF DIRECTORS
Independent Directors
Andrew C. Cooper
William J. Gremp
Eugene S. Stark
Interested Directors(1)
M. Grier Eliasek
Frank Muller
EXECUTIVE OFFICERS WHO ARE NOT DIRECTORS
Michael D. Cohen, Executive Vice President
Kristin Van Dask, Chief Financial Officer, Chief Compliance Officer, Treasurer and Secretary
ADVISER
Priority Senior Secured Income Management, LLC
10 East 40th Street, 42nd Floor
New York, NY 10016
____________
(1)As defined under the Investment Company Act of 1940, as amended.
2019 SEMI-ANNUAL REPORT
PRIORITY INCOME FUND, INC. 42
Item 2. Code of Ethics.
The Registrant has adopted a code of ethics which applies to, among others, its senior officers, including its Chief Executive Officer (its principal executive officer) and Chief Financial Officer (its principal financial officer), as well as every officer, director and employee of Priority Income Fund, Inc. The Registrant’s code of ethics can be accessed via its website at http:// www.priorityincomefund.com. There were no amendments to the code of ethics during the period covered by this report. The Registrant did not grant any waivers, including implicit waivers, from any provisions of the code of ethics during the period covered by this report. This information is also available free of charge by contacting the Company by mail at 10 East 40th Street, 42nd Floor, New York, NY 10016, by telephone at (212) 448-0702 or on its website at http://www.priorityincomefund.com.
Item 3. Audit Committee Financial Expert.
The information required by this item is not required in a semi-annual report on this Form N-CSRS.
Item 4. Principal Accountant Fees and Services.
The information required by this item is not required in a semi-annual report on this Form N-CSRS.
Item 5. Audit Committee of Listed Registrant.
The information required by this item is not required in a semi-annual report on this Form N-CSRS.
Item 6. Schedule of Investments.
Please see the schedule of investments contained in the report to stockholders included under Item 1 of this Form N-CSRS.
Item 7. Disclosure of Proxy Voting Policies and Procedures for Closed-End Management Investment Companies.
The information required by this item is not required in a semi-annual report on this Form N-CSRS.
Item 8. Portfolio Managers of Closed-End Investment Companies.
(a) The information required by this item is not required in a semi-annual report on this Form N-CSRS.
(b) There has been no change, as of the date of the filing of the semi-annual report on this Form N-CSRS, to any of the portfolio managers identified in response to paragraph (a)(1) of this item in the Registrant's most recent annual report on Form N-CSR.
Item 9. Purchases of Equity Securities by Closed-End Management Investment Company and Affiliated Purchasers.
Neither the Registrant nor any affiliated purchasers, as defined in Rule 10b-18(a)(3) under the Securities Exchange Act of 1934, purchased any shares of the Registrant that are registered by the Registrant pursuant to Section 12 of the Securities Exchange Act of 1934, other than the 11,111 and 6,754 Class I Common Stock that our Adviser purchased on October 10, 2012 and February 6, 2013, respectively, for $9.00 and $21.70 per share, respectively.
Item 10. Submission of Matters to a Vote of Security Holders.
Not applicable.
Item 11. Controls and Procedures.
| |
| (a) | Based on an evaluation of the Disclosure Controls and Procedures (as defined in Rule 30a-3(c) under the Investment Company Act of 1940, the “Disclosure Controls”) as of a date within 90 days prior to the filing date (the “Filing Date”) of this Form N-CSRS (the “Report”), the Chief Executive Officer (its principal executive officer) and Chief Financial Officer (its principal financial officer) have concluded that the Disclosure Controls are reasonably designed to ensure that information required to be disclosed by the Registrant in the Report is recorded, processed, summarized and reported by the Filing Date, including ensuring that information required to be disclosed in the Report is accumulated and communicated to the Registrant’s management, including the Registrant’s principal executive officer and principal financial officer, as appropriate to allow timely decisions regarding required disclosure. |
| |
| (b) | There was no change in the Registrant’s internal control over financial reporting (as defined in Rule 30a-3(d) under the 1940 Act) over the second fiscal quarter of the period covered by this report that has materially affected, or is reasonably likely to materially affect, the Registrant’s internal control over financial reporting. |
Item 12. Exhibits.
(a)(1) Not applicable.
(a)(2) Certifications of principal executive officer and principal financial officer as required by Rule 30a-2(a) under the Investment Company Act of 1940.
(a)(3) Not applicable.
(b) Certifications of principal executive officer and principal financial officer as required by Rule 30a-2(b) under the Investment Company Act of 1940.
SIGNATURES
Pursuant to the requirements of the Securities Exchange Act of 1934 and the Investment Company Act of 1940, the Registrant has duly caused this report to be signed on its behalf by the undersigned, thereunto duly authorized.
PRIORITY INCOME FUND, INC.
By: /s/ M. Grier Eliasek
M. Grier Eliasek
Chief Executive Officer and President
Date: February 28, 2019
Pursuant to the requirements of the Securities Exchange Act of 1934 and the Investment Company of 1940, this report has been signed below by the following persons on behalf of the Registrant and in the capacities and on the dates indicated.
By: /s/ M. Grier Eliasek
M. Grier Eliasek
Chief Executive Officer and President
Date: February 28, 2019
By: /s/ Kristin Van Dask
Kristin Van Dask
Chief Financial Officer, Chief Compliance Officer
Treasurer and Secretary
Date: February 28, 2019