UNITED STATES
SECURITIES AND EXCHANGE COMMISSION
Washington, D.C. 20549
FORM N-CSR
CERTIFIED SHAREHOLDER REPORT OF REGISTERED
MANAGEMENT INVESTMENT COMPANIES
Investment Company Act file number 811-22734
Western Asset Middle Market Debt Fund Inc.
(Exact name of registrant as specified in charter)
620 Eighth Avenue, 49th Floor, New York, NY 10018
(Address of principal executive offices) (Zip code)
Robert I. Frenkel, Esq.
Legg Mason & Co., LLC
100 First Stamford Place
Stamford, CT 06902
(Name and address of agent for service)
Registrant’s telephone number, including area code: (888)777-0102
Date of fiscal year end: April 30
Date of reporting period: October 31, 2014
ITEM 1 REPORT TO STOCKHOLDERS.
The Semi-Annual Report to Stockholders is filed herewith.

| Semi-Annual Report | October 31, 2014 |
WESTERN ASSET
MIDDLE MARKET
DEBT FUND INC.

| INVESTMENT PRODUCTS: NOT FDIC INSURED • NO BANK GUARANTEE • MAY LOSE VALUE |
Fund objectives
The Fund’s primary investment objective is to provide high income. As a secondary investment objective, the Fund seeks capital appreciation.

Dear Shareholder,
We are pleased to provide the semi-annual report of Western Asset Middle Market Debt Fund Inc. for the six-month reporting period ended October 31, 2014. Please read on for Fund performance information and a detailed look at prevailing economic and market conditions during the Fund’s reporting period.
As always, we remain committed to providing you with excellent service and a full spectrum of investment choices. We also remain committed to supplementing the support you receive from your financial advisor. One way we accomplish this is through our website, www.lmcef.com. Here you can gain immediate access to market and investment information, including:
| Ÿ | Fund prices and performance, |
| Ÿ | Market insights and commentaries from our portfolio managers, and |
| Ÿ | A host of educational resources. |
We look forward to helping you meet your financial goals.
Sincerely,

Kenneth D. Fuller
Chairman, President and Chief Executive Officer
November 28, 2014
| II | Western Asset Middle Market Debt Fund Inc. |
Economic review
Since the end of the Great Recession, the U.S. economy has expanded at a slower than usual pace, compared to recent history. U.S. gross domestic product (“GDP”)i growth, as reported by the U.S. Department of Commerce’s revised figures, was 4.5% during the third quarter of 2013, its best reading since the fourth quarter of 2011. Towards the beginning of the six months ended October 31, 2014 (the “reporting period”), the severe winter weather played a key role in a sharp reversal in the economy, a 2.1% contraction during the first quarter of 2014. This was the first negative GDP report in three years. Negative contributions were widespread: private inventory investment, exports, state and local government spending and nonresidential and residential fixed investment. Thankfully, this setback was very brief, as second quarter GDP growth was 4.6%, suggesting the recovery has some resilience and the economy continues to recover from the severe consequences of the Great Recession. The second quarter rebound in GDP growth was driven by several factors, including an acceleration in personal consumption expenditures (“PCE”), increased private inventory investment and exports, as well as an upturn in state and local government spending. After the reporting period ended, the Department of Commerce’s second estimate for third quarter GDP growth was 3.9% driven by contributions from PCE, exports, nonresidential fixed investment and government spending.
The U.S. manufacturing sector continued to support the economy during the reporting period. Based on figures for the Institute for Supply Management’s Purchasing Managers’ Index (“PMI”)ii, U.S. manufacturing expanded during all six months of the reporting period (a reading below 50 indicates a contraction, whereas a reading above 50 indicates an expansion). After a reading of 55.4 in May 2014, the PMI generally rose over the next several months, reaching a high of 59.0 in August, its best reading since March 2011. While PMI dipped to 56.6 in September, it rose back to 59.0 in October.
The U.S. job market improved during the reporting period. When the period began, unemployment, as reported by the U.S. Department of Labor, was 6.3%. Unemployment generally declined throughout the reporting period and reached a low of 5.8% in October 2014, the lowest level since July 2008.
| Western Asset Middle Market Debt Fund Inc. | III |
Investment commentary (cont’d)
Market review
Q. How did the Federal Reserve Board (“Fed”)iii respond to the economic environment?
A. The Fed took a number of actions as it sought to meet its dual mandate of fostering maximum employment and price stability. As it has since December 2008, the Fed kept the federal funds rateiv at a historically low range between zero and 0.25%. The Fed also took steps to end its asset purchase program that was announced in December 2012. At that time, the Fed said it would continue purchasing $40 billion per month of agency mortgage-backed securities (“MBS”), as well as $45 billion per month of longer-term Treasuries. Following the meeting that concluded on December 18, 2013, prior to the beginning of the reporting period, the Fed announced that it would begin reducing its monthly asset purchases, saying “Beginning in January 2014, the Committee will add to its holdings of agency MBS at a pace of $35 billion per month rather than $40 billion per month, and will add to its holdings of longer-term Treasury securities at a pace of $40 billion per month rather than $45 billion per month.”
At each of the Fed’s next six meetings (January, March, April, June, July and September 2014), it announced further $10 billion tapering of its asset purchases. At its meeting that ended on October 29, 2014, the Fed announced that its asset purchase program had concluded. The Fed also said that it “currently anticipates that, even after employment and inflation are near mandate-consistent levels, economic conditions may, for some time, warrant keeping the target federal funds rate below levels the Committee views as normal in the longer run.”
Q. Did Treasury yields trend higher or lower during the reporting period ended October 31, 2014?
A. Short-term Treasury yields moved higher, whereas long-term Treasury yields declined during the reporting period. When the reporting period began, the yield on the two-year Treasury was 0.42%. It fell as low as 0.34% on October 15, 2014, and was as high as 0.59% in mid-September 2014, before ending the period at 0.50%. The yield on the ten-year Treasury began the period at 2.67%, its peak for the six-months ended October 31, 2014. It fell as low as 2.15% on October 15, 2014 and ended the period at 2.35%.
Q. What factors impacted the spread sectors (non-Treasuries) during the reporting period?
A. While there were several periods of weakness, the spread sectors generated positive results during the reporting period. Spread sectors generated positive results in May and June 2014 as intermediate- and long-term interest rates declined and investor demand was solid. Performance fluctuated with investor sentiment over the last four months of the reporting period given uncertainties regarding future Fed monetary policy, concerns over global growth and a host of escalating geopolitical issues. The overall bond market, as measured by the Barclays U.S. Aggregate Indexv, gained 2.35% during the six months ended October 31, 2014.
| IV | Western Asset Middle Market Debt Fund Inc. |
Q. How did the high-yield bond market perform over the reporting period ended October 31, 2014?
A. The U.S. high-yield bond market returned 1.05% for the six months ended October 31, 2014. The asset class, as measured by the Barclays U.S. Corporate High Yield — 2% Issuer Cap Indexvi, posted positive returns during the first two months covered by the reporting period. Supporting the high yield market were generally solid investor demand and low defaults. However, weakening demand and geopolitical issues led to a setback in the asset class in July 2014. After rallying sharply in August, the high yield market fell sharply in September, given increased investor risk aversion. It then rallied again in October.
Q. How did the emerging market debt asset class perform over the reporting period?
A. Despite periods of weakness, emerging markets debt was among the best performing spread sectors during the six months ended October 31, 2014. The asset class posted positive returns during each of the first four months covered by the reporting period. Demand was strong overall as investors looked to generate incremental yield in the low interest rate environment. However, the asset class experienced a sharp selloff in September, triggered by a number of factors, including rising U.S. interest rates, expectations for future Fed rate hikes, concerns over global growth and weak investor demand. The asset class ended the reporting period by rallying in October as Treasury yields generally declined and demand was solid. Overall, the JPMorgan Emerging Markets Bond Index Global (“EMBI Global”)vii gained 3.78% during the six months ended October 31, 2014.
Performance review
For the six months ended October 31, 2014, Western Asset Middle Market Debt Fund Inc. returned -1.76% based on its net asset value (“NAV”).viii The Fund’s unmanaged benchmarks, the Barclays U.S. High Yield — 2% Issuer Cap Caa Component Indexix returned -1.06% for the same period. The Lipper High Yield Closed-End Funds Category Averagex returned -0.14% over the same time frame. Please note that Lipper performance returns are based on each fund’s NAV.
During the reporting period, the Fund made distributions to shareholders totaling $41.50 per share. As of October 31, 2014, the Fund estimates that all of the distributions were paid from net investment income.* The performance table shows the Fund’s six-month total return based on its NAV as of October 31, 2014. Past performance is no guarantee of future results.
| * | These estimates are not for tax purposes. The Fund will issue a Form 1099 with final composition of the distributions for tax purposes after year-end. A return of capital is not taxable and results in a reduction in the tax basis of a shareholder’s investment. For more information about a distribution’s composition, please refer to the Fund’s distribution press release or, if applicable, the Section 19 notice located in the press release section of our website, www.lmcef.com. |
| Western Asset Middle Market Debt Fund Inc. | V |
Investment commentary (cont’d)
| Performance Snapshot as of October 31, 2014 (unaudited) | ||||
| Price Per Share | 6-Month Total Return** | |||
| $971.79 (NAV) | -1.76%† | |||
All figures represent past performance and are not a guarantee of future results. Performance figures for periods shorter than one year represent cumulative figures and are not annualized.
** Total return is based on changes in NAV. Return reflects the deduction of all Fund expenses, including management fees, operating expenses, and other Fund expenses. Return does not reflect the deduction of brokerage commissions or taxes that investors pay on distributions or the disposition of shares.
† Total return assumes the reinvestment of all distributions, including returns of capital, if any, at NAV.
Looking for additional information?
The Fund’s daily NAV is available on-line under the symbol “XWAMX” on most financial websites. In a continuing effort to provide information concerning the Fund, shareholders may call 1-888-777-0102 (toll free), Monday through Friday from 8:00 a.m. to 5:30 p.m. Eastern Time, for the Fund’s current NAV and other information.
Thank you for your investment in Western Asset Middle Market Debt Fund Inc. As always, we appreciate that you have chosen us to manage your assets and we remain focused on achieving the Fund’s investment goals.
Sincerely,
Kenneth D. Fuller
Chairman, President and Chief Executive Officer
November 28, 2014
RISKS: An investment in the Fund involves a high degree of risk. The Fund should be considered an illiquid investment. This Fund is not publicly traded and is closed to new investors. The Fund does not intend to apply for an exchange listing, and it is highly unlikely that a secondary market will exist for the purchase and sale of the Fund’s shares. Investors could lose some or all of their investment. An investment in the Fund is not appropriate for all investors and is not intended to be a complete investment program. The Fund is designed as a long-term investment for investors who are prepared to hold the Fund’s Common Stock until the expiration of its term, and is not a trading vehicle. All investments are subject to risk, including possible loss of principal. Fixed-income securities are subject to numerous risks, including but not limited to, credit, inflation, income, prepayment and interest rates risks. As interest rates rise, the value of fixed-income securities falls. Middle market companies have additional risks due to their limited operating histories, limited financial resources, less predictable operating results, narrower product lines and other factors. Securities of middle market issuers are typically considered high-yield. High-yield fixed income securities of below-investment-grade quality are regarded as having predominantly speculative characteristics with respect to the issuer’s capacity to pay interest and repay
| VI | Western Asset Middle Market Debt Fund Inc. |
principal. High-yield bonds (“junk bonds”) are subject to higher credit risk and a greater risk of default. The Fund may invest all or a portion of its Managed Assets in illiquid securities. The Fund may make significant investments in securities for which there are no observable market prices; the prices must be estimated by Western Asset, the Fund’s subadviser. Investments in foreign securities involve risks, including the possibility of losses due to changes in currency exchange rates and negative developments in the political, economic or regulatory structure of specific countries or regions. These risks are greater in emerging markets. Leverage may result in greater volatility of the net asset value of common shares and increases a shareholder’s risk of loss. Derivative instruments can be illiquid, may disproportionately increase losses and have a potentially large impact on Fund performance. Distributions are not guaranteed and are subject to change.
All investments are subject to risk including the possible loss of principal. Past performance is no guarantee of future results. All index performance reflects no deduction for fees, expenses or taxes. Please note that an investor cannot invest directly in an index.
The information provided is not intended to be a forecast of future events, a guarantee of future results or investment advice. Views expressed may differ from those of the firm as a whole.
| i | Gross domestic product (“GDP”) is the market value of all final goods and services produced within a country in a given period of time. |
| ii | The Institute for Supply Management’s PMI is based on a survey of purchasing executives who buy the raw materials for manufacturing at more than 350 companies. It offers an early reading on the health of the U.S. manufacturing sector. |
| iii | The Federal Reserve Board (“Fed”) is responsible for the formulation of policies designed to promote economic growth, full employment, stable prices and a sustainable pattern of international trade and payments. |
| iv | The federal funds rate is the rate charged by one depository institution on an overnight sale of immediately available funds (balances at the Federal Reserve) to another depository institution; the rate may vary from depository institution to depository institution and from day to day. |
| v | The Barclays U.S. Aggregate Index is a broad-based bond index comprised of government, corporate, mortgage- and asset-backed issues, rated investment grade or higher, and having at least one year to maturity. |
| vi | The Barclays U.S. Corporate High Yield — 2% Issuer Cap Index is an index of the 2% Issuer Cap component of the Barclays U.S. Corporate High Yield Index, which covers the U.S. dollar-denominated, non-investment grade, fixed-rate, taxable corporate bond market. |
| vii | The JPMorgan Emerging Markets Bond Index Global (“EMBI Global”) tracks total returns for U.S. dollar-denominated debt instruments issued by emerging market sovereign and quasi-sovereign entities: Brady bonds, loans, Eurobonds and local market instruments. |
| viii | Net asset value (“NAV”) is calculated by subtracting total liabilities, including liabilities associated with financial leverage (if any) from the closing value of all securities held by the Fund (plus all other assets) and dividing the result (total net assets) by the total number of the common shares outstanding. The NAV fluctuates with changes in the market prices of securities in which the Fund has invested. |
| ix | The Barclays U.S. Corporate High Yield — 2% Issuer Cap Caa Component Index is an index of the 2% Issuer Cap component of the Barclays U.S. Corporate High Yield Index, and is comprised of Caa-rated securities included in this Index. |
| x | Lipper, Inc., a wholly-owned subsidiary of Reuters, provides independent insight on global collective investments. Returns are based on the six-month period ended October 31, 2014, including the reinvestment of all distributions, including returns of capital, if any, calculated among the 7 funds in the Fund’s Lipper category. |
| Western Asset Middle Market Debt Fund Inc. | VII |
Investment breakdown (%) as a percent of total investments
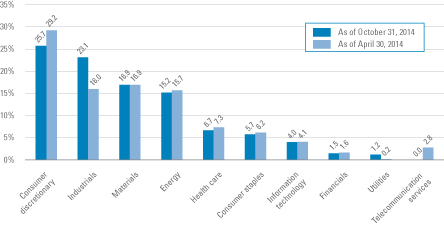
| † | The bar graph above represents the composition of the Fund’s investments as of October 31, 2014 and April 30, 2014 and does not include derivatives, such as forward foreign currency contracts. The Fund is actively managed. As a result, the composition of the Fund’s investments is subject to change at anytime. |
| Western Asset Middle Market Debt Fund Inc. 2014 Semi-Annual Report | 1 |
Economic exposure — October 31, 2014
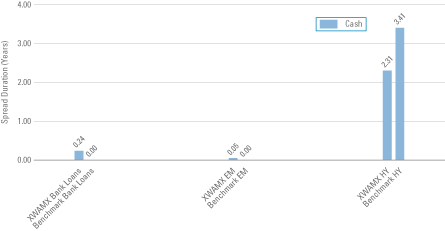
Total Spread Duration | ||
XWAMX | — 2.60 years | |
| Benchmark | — 3.41 years | |
Spread duration measures the sensitivity to changes in spreads. The spread over Treasuries is the annual risk-premium demanded by investors to hold non-Treasury securities. Spread duration is quantified as the % change in price resulting from a 100 basis points change in spreads. For a security with positive spread duration, an increase in spreads would result in a price decline and a decline in spreads would result in a price increase. This chart highlights the market sector exposure of the Fund’s sectors relative to the selected benchmark sectors as of the end of the reporting period.
| Benchmark | — Barclays U.S. Corporate High Yield — 2% Issuer Cap Caa Component Index | |
| EM | — Emerging Markets | |
| HY | — High Yield | |
| XWAMX | — Western Asset Middle Market Debt Fund Inc. |
| 2 | Western Asset Middle Market Debt Fund Inc. 2014 Semi-Annual Report |
Effective duration (unaudited)
Interest rate exposure — October 31, 2014
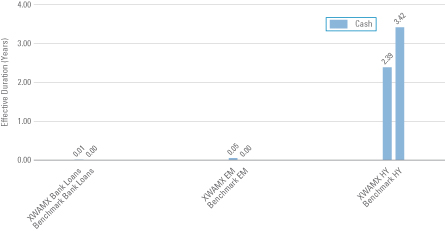
Total Effective Duration | ||
XWAMX | — 2.45 years | |
| Benchmark | — 3.42 years | |
Effective duration measures the sensitivity to changes in relevant interest rates. Effective duration is quantified as the % change in price resulting from a 100 basis points change in interest rates. For a security with positive effective duration, an increase in interest rates would result in a price decline and a decline in interest rates would result in a price increase. This chart highlights the interest rate exposure of the Fund’s sectors relative to the selected benchmark sectors as of the end of the reporting period.
| Benchmark | — Barclays U.S. Corporate High Yield — 2% Issuer Cap Caa Component Index | |
| EM | — Emerging Markets | |
| HY | — High Yield | |
XWAMX | — Western Asset Middle Market Debt Fund Inc. |
| Western Asset Middle Market Debt Fund Inc. 2014 Semi-Annual Report | 3 |
Schedule of investments (unaudited)
October 31, 2014
Western Asset Middle Market Debt Fund Inc.
| Security | Rate | Maturity Date | Face Amount† | Value | ||||||||||||
| Corporate Bonds & Notes — 94.0% | ||||||||||||||||
| Consumer Discretionary — 25.0% | ||||||||||||||||
Diversified Consumer Services — 0.9% | ||||||||||||||||
Ceridian LLC/Comdata Inc., Senior Notes | 8.125 | % | 11/15/17 | 400,000 | $ | 401,000 | (a) | |||||||||
StoneMor Partners LP/Cornerstone Family Services of WV, Senior Notes | 7.875 | % | 6/1/21 | 1,000,000 | 1,047,500 | (a)(b) | ||||||||||
Total Diversified Consumer Services | 1,448,500 | |||||||||||||||
Hotels, Restaurants & Leisure — 7.9% | ||||||||||||||||
24 Hour Holdings III LLC, Senior Notes | 8.000 | % | 6/1/22 | 1,000,000 | 950,000 | (a) | ||||||||||
Bossier Casino Venture Holdco Inc. | 11.000 | % | 2/9/18 | 92,365 | 93,695 | (a)(c)(d) | ||||||||||
Caesars Entertainment Operating Co. Inc., Senior Notes | 10.750 | % | 2/1/16 | 1,500,000 | 281,250 | |||||||||||
Caesars Entertainment Operating Co. Inc., Senior Secured Notes | 11.250 | % | 6/1/17 | 1,000,000 | 755,000 | |||||||||||
CEC Entertainment Inc., Senior Notes | 8.000 | % | 2/15/22 | 1,750,000 | 1,688,750 | (a) | ||||||||||
Greektown Holdings LLC/Greektown Mothership Corp., Senior Secured Notes | 8.875 | % | 3/15/19 | 290,000 | 292,900 | (a) | ||||||||||
Inn of the Mountain Gods Resort & Casino, Senior Secured Notes | 9.250 | % | 11/30/20 | 1,881,488 | 1,834,451 | (a) | ||||||||||
Landry’s Holdings II Inc., Senior Notes | 10.250 | % | 1/1/18 | 1,500,000 | 1,567,500 | (a) | ||||||||||
Mastro’s Restaurants LLC/RRG Finance Corp., Senior Secured Notes | 12.000 | % | 6/1/17 | 1,493,375 | 1,694,981 | (a) | ||||||||||
MTR Gaming Group Inc., Secured Notes | 11.500 | % | 8/1/19 | 2,000,000 | 2,205,000 | |||||||||||
Seven Seas Cruises S de RL LLC, Senior Secured Notes | 9.125 | % | 5/15/19 | 1,500,000 | 1,601,250 | |||||||||||
Total Hotels, Restaurants & Leisure | 12,964,777 | |||||||||||||||
Household Durables — 2.3% | ||||||||||||||||
APX Group Inc., Senior Notes | 8.750 | % | 12/1/20 | 4,000,000 | 3,480,000 | (b) | ||||||||||
William Lyon Homes PNW Finance Corp., Senior Notes | 7.000 | % | 8/15/22 | 380,000 | 394,250 | (a) | ||||||||||
Total Household Durables | 3,874,250 | |||||||||||||||
Leisure Products — 0.8% | ||||||||||||||||
Cirsa Funding Luxembourg SA, Senior Notes | 8.750 | % | 5/15/18 | 1,000,000 | EUR | 1,286,170 | (a) | |||||||||
Media — 7.3% | ||||||||||||||||
American Media Inc., Senior Secured Notes | 11.500 | % | 12/15/17 | 3,000,000 | 3,135,000 | (b) | ||||||||||
iHeartCommunications Inc., Senior Notes | 10.000 | % | 1/15/18 | 370,000 | 310,569 | |||||||||||
MediaNews Group Inc. | 12.000 | % | 12/24/18 | 2,700,000 | 2,700,000 | (d) | ||||||||||
New Cotai LLC/New Cotai Capital Corp., Senior Secured Notes | 10.625 | % | 5/1/19 | 1,000,000 | 1,145,000 | (a)(e) | ||||||||||
Ono Finance II PLC, Senior Bonds | 10.875 | % | 7/15/19 | 2,800,000 | 3,006,640 | (a) | ||||||||||
Visant Corp., Senior Notes | 10.000 | % | 10/1/17 | 2,000,000 | 1,770,000 | (b) | ||||||||||
Total Media | 12,067,209 | |||||||||||||||
See Notes to Financial Statements.
| 4 | Western Asset Middle Market Debt Fund Inc. 2014 Semi-Annual Report |
Western Asset Middle Market Debt Fund Inc.
| Security | Rate | Maturity Date | Face Amount† | Value | ||||||||||||
Specialty Retail — 4.6% | ||||||||||||||||
Edcon Holdings Pty Ltd., Senior Secured Subordinated Bonds | 13.375 | % | 6/30/19 | 290,000 | EUR | $ | 179,192 | (a) | ||||||||
Edcon Pty Ltd., Senior Secured Notes | 9.500 | % | 3/1/18 | 2,000,000 | EUR | 2,080,229 | (a) | |||||||||
GRD Holdings III Corp., Senior Secured Notes | 10.750 | % | 6/1/19 | 1,500,000 | 1,663,125 | (a) | ||||||||||
Hot Topic Inc., Senior Secured Notes | 9.250 | % | 6/15/21 | 2,500,000 | 2,700,000 | (a) | ||||||||||
Spencer Spirit Holdings Inc., Senior Notes | 9.000 | % | 5/1/18 | 1,000,000 | 1,012,500 | (a)(e) | ||||||||||
Total Specialty Retail | 7,635,046 | |||||||||||||||
Textiles, Apparel & Luxury Goods — 1.2% | ||||||||||||||||
Empire Today LLC/Empire Today Finance Corp., Senior Secured Notes | 11.375 | % | 2/1/17 | 2,000,000 | 2,010,000 | (a) | ||||||||||
Total Consumer Discretionary | 41,285,952 | |||||||||||||||
| Consumer Staples — 3.3% | ||||||||||||||||
Beverages — 1.4% | ||||||||||||||||
Carolina Beverage Group LLC/Carolina Beverage Group Finance Inc., Secured Notes | 10.625 | % | 8/1/18 | 1,820,000 | 1,888,250 | (a) | ||||||||||
Crestview DS Merger Subordinated II Inc., Secured Notes | 10.000 | % | 9/1/21 | 420,000 | 466,200 | |||||||||||
Total Beverages | 2,354,450 | |||||||||||||||
Food & Staples Retailing — 1.4% | ||||||||||||||||
Beverages & More Inc., Senior Secured Notes | 10.000 | % | 11/15/18 | 2,370,000 | 2,260,388 | (a) | ||||||||||
Food Products — 0.3% | ||||||||||||||||
Simmons Foods Inc., Secured Notes | 7.875 | % | 10/1/21 | 530,000 | 537,950 | (a) | ||||||||||
Media — 0.2% | ||||||||||||||||
SiTV LLC/SiTV Finance Inc., Senior Secured Notes | 10.375 | % | 7/1/19 | 230,000 | 223,100 | (a) | ||||||||||
Total Consumer Staples | 5,375,888 | |||||||||||||||
| Energy — 14.6% | ||||||||||||||||
Energy Equipment & Services — 2.0% | ||||||||||||||||
Hercules Offshore Inc., Senior Notes | 10.250 | % | 4/1/19 | 1,000,000 | 727,500 | (a) | ||||||||||
Sierra Hamilton LLC/Sierra Hamilton Finance Inc., Senior Secured Notes | 12.250 | % | 12/15/18 | 2,540,000 | 2,590,800 | (a) | ||||||||||
Total Energy Equipment & Services | 3,318,300 | |||||||||||||||
Oil, Gas & Consumable Fuels — 12.6% | ||||||||||||||||
Armstrong Energy Inc., Senior Secured Notes | 11.750 | % | 12/15/19 | 2,000,000 | 2,160,000 | (b) | ||||||||||
Gastar Exploration Inc., Senior Secured Notes | 8.625 | % | 5/15/18 | 2,000,000 | 1,932,500 | |||||||||||
Globe Luxembourg SCA, Senior Secured Notes | 9.625 | % | 5/1/18 | 1,500,000 | 1,552,500 | (a) | ||||||||||
Halcon Resources Corp., Senior Notes | 8.875 | % | 5/15/21 | 1,000,000 | 825,000 | |||||||||||
Iracore International Holdings Inc., Senior Secured Notes | 9.500 | % | 6/1/18 | 1,500,000 | 1,042,500 | (a) | ||||||||||
Magnum Hunter Resources Corp., Senior Notes | 9.750 | % | 5/15/20 | 3,500,000 | 3,500,000 | |||||||||||
Natural Resource Partners LP/Natural Resource Partners Finance Corp., Senior Notes | 9.125 | % | 10/1/18 | 780,000 | 783,900 | (b) | ||||||||||
See Notes to Financial Statements.
| Western Asset Middle Market Debt Fund Inc. 2014 Semi-Annual Report | 5 |
Schedule of investments (unaudited) (cont’d)
October 31, 2014
Western Asset Middle Market Debt Fund Inc.
| Security | Rate | Maturity Date | Face Amount† | Value | ||||||||||||
Oil, Gas & Consumable Fuels — continued | ||||||||||||||||
New Gulf Resources LLC/NGR Finance Corp., Senior Secured Notes | 11.750 | % | 5/15/19 | 2,000,000 | $ | 1,870,000 | ||||||||||
Quicksilver Resources Inc., Senior Notes | 11.000 | % | 7/1/21 | 3,000,000 | 1,545,000 | |||||||||||
Samson Investment Co., Senior Notes | 9.750 | % | 2/15/20 | 1,000,000 | 745,000 | |||||||||||
Saratoga Resources Inc., Senior Secured Notes | 12.500 | % | 7/1/16 | 1,450,000 | 804,750 | |||||||||||
Sidewinder Drilling Inc., Senior Notes | 9.750 | % | 11/15/19 | 2,000,000 | 1,880,000 | (a) | ||||||||||
Westmoreland Coal Co./Westmoreland Partners, Senior Secured Notes | 10.750 | % | 2/1/18 | 2,000,000 | 2,100,000 | (b) | ||||||||||
Total Oil, Gas & Consumable Fuels | 20,741,150 | |||||||||||||||
Total Energy | 24,059,450 | |||||||||||||||
| Financials — 1.6% | ||||||||||||||||
Banks — 0.5% | ||||||||||||||||
Royal Bank of Scotland PLC, Subordinated Notes | 13.125 | % | 3/19/22 | 830,000 | AUD | 858,052 | (f)(g) | |||||||||
Consumer Finance — 1.1% | ||||||||||||||||
Stearns Holdings Inc., Senior Secured Notes | 9.375 | % | 8/15/20 | 1,770,000 | 1,831,950 | (a)(b) | ||||||||||
Total Financials | 2,690,002 | |||||||||||||||
| Health Care — 5.5% | ||||||||||||||||
Health Care Equipment & Supplies — 1.2% | ||||||||||||||||
Lantheus Medical Imaging Inc., Senior Notes | 9.750 | % | 5/15/17 | 2,130,000 | 2,015,512 | |||||||||||
Health Care Providers & Services — 4.3% | ||||||||||||||||
DJO Finance LLC/DJO Finance Corp., Senior Subordinated Notes | 9.750 | % | 10/15/17 | 1,000,000 | 1,020,000 | |||||||||||
ExamWorks Group Inc., Senior Notes | 9.000 | % | 7/15/19 | 3,600,000 | 3,870,000 | |||||||||||
MedImpact Holdings Inc., Senior Secured Notes | 10.500 | % | 2/1/18 | 2,000,000 | 2,144,750 | (a) | ||||||||||
Total Health Care Providers & Services | 7,034,750 | |||||||||||||||
Total Health Care | 9,050,262 | |||||||||||||||
| Industrials — 21.4% | ||||||||||||||||
Aerospace & Defense — 2.2% | ||||||||||||||||
Erickson Inc., Secured Notes | 8.250 | % | 5/1/20 | 1,775,000 | 1,686,250 | (b) | ||||||||||
Heligear Acquisition Co., Senior Secured Bonds | 10.250 | % | 10/15/19 | 2,000,000 | 1,945,000 | (a) | ||||||||||
Total Aerospace & Defense | 3,631,250 | |||||||||||||||
Building Products — 1.3% | ||||||||||||||||
U.S. Concrete Inc., Senior Secured Notes | 8.500 | % | 12/1/18 | 2,000,000 | 2,150,000 | (b) | ||||||||||
Commercial Services & Supplies — 3.0% | ||||||||||||||||
Cenveo Corp., Senior Notes | 11.500 | % | 5/15/17 | 2,000,000 | 2,040,000 | (b) | ||||||||||
Garda World Security Corp., Senior Notes | 7.250 | % | 11/15/21 | 1,800,000 | 1,800,000 | (a) | ||||||||||
Monitronics International Inc., Senior Notes | 9.125 | % | 4/1/20 | 1,050,000 | 1,086,750 | (b) | ||||||||||
Total Commercial Services & Supplies | 4,926,750 | |||||||||||||||
See Notes to Financial Statements.
| 6 | Western Asset Middle Market Debt Fund Inc. 2014 Semi-Annual Report |
Western Asset Middle Market Debt Fund Inc.
| Security | Rate | Maturity Date | Face Amount† | Value | ||||||||||||
Construction & Engineering — 5.5% | ||||||||||||||||
Brundage-Bone Concrete Pumping Inc., Senior Secured Notes | 10.375 | % | 9/1/21 | 1,690,000 | $ | 1,738,587 | (a)(b) | |||||||||
Michael Baker Holdings LLC/Micahel Baker Finance Corp., Senior Notes | 8.875 | % | 4/15/19 | 1,750,000 | 1,741,250 | (a)(e) | ||||||||||
Michael Baker International LLC/CDL Acquisition Co. Inc., Senior Secured Notes | 8.250 | % | 10/15/18 | 1,070,000 | 1,091,400 | (a)(b) | ||||||||||
Modular Space Corp., Secured Notes | 10.250 | % | 1/31/19 | 4,400,000 | 4,499,000 | (a)(b) | ||||||||||
Total Construction & Engineering | 9,070,237 | |||||||||||||||
Electrical Equipment — 1.2% | ||||||||||||||||
Interface Master Holdings Inc., Senior Notes | 12.500 | % | 8/1/18 | 2,000,000 | 2,055,000 | (a)(e) | ||||||||||
Machinery — 0.3% | ||||||||||||||||
CTP Transportation Products LLC/CTP Finance Inc., Senior Secured Notes | 8.250 | % | 12/15/19 | 420,000 | 455,700 | (a)(b) | ||||||||||
Marine — 1.7% | ||||||||||||||||
Horizon Lines LLC, Secured Notes | 13.000 | % | 10/15/16 | 1,068,374 | 911,318 | (e) | ||||||||||
Horizon Lines LLC, Senior Secured Notes | 11.000 | % | 10/15/16 | 1,960,000 | 1,964,900 | |||||||||||
Total Marine | 2,876,218 | |||||||||||||||
Road & Rail — 1.9% | ||||||||||||||||
Florida East Coast Holdings Corp., Senior Notes | 9.750 | % | 5/1/20 | 630,000 | 644,962 | (a) | ||||||||||
Florida East Coast Holdings Corp., Senior Secured Notes | 6.750 | % | 5/1/19 | 320,000 | 331,002 | (a) | ||||||||||
Jack Cooper Holdings Corp., Senior Secured Notes | 9.250 | % | 6/1/20 | 2,000,000 | 2,152,500 | (a) | ||||||||||
Total Road & Rail | 3,128,464 | |||||||||||||||
Trading Companies & Distributors — 1.2% | ||||||||||||||||
Light Tower Rentals Inc., Senior Secured Notes | 8.125 | % | 8/1/19 | 2,060,000 | 2,039,400 | (a) | ||||||||||
Transportation — 3.1% | ||||||||||||||||
CMA CGM, Senior Notes | 8.500 | % | 4/15/17 | 2,500,000 | 2,525,000 | (a) | ||||||||||
Neovia Logistics Intermediate Holdings LLC/Logistics Intermediate Finance Corp., Senior Notes | 10.000 | % | 2/15/18 | 2,500,000 | 2,587,500 | (a)(e) | ||||||||||
Total Transportation | 5,112,500 | |||||||||||||||
Total Industrials | 35,445,519 | |||||||||||||||
| Information Technology — 3.7% | ||||||||||||||||
Electronic Equipment, Instruments & Components — 2.5% | ||||||||||||||||
Interface Security Systems Holdings Inc./Interface Security Systems LLC, Senior Secured Notes | 9.250 | % | 1/15/18 | 2,040,000 | 2,085,900 | |||||||||||
KEMET Corp., Senior Secured Notes | 10.500 | % | 5/1/18 | 2,000,000 | 2,100,000 | |||||||||||
Total Electronic Equipment, Instruments & Components |
| 4,185,900 | ||||||||||||||
Internet Software & Services — 1.2% | ||||||||||||||||
Ancestry.com Inc., Senior Notes | 9.625 | % | 10/15/18 | 2,000,000 | 2,005,000 | (a)(b)(e) | ||||||||||
Total Information Technology | 6,190,900 | |||||||||||||||
See Notes to Financial Statements.
| Western Asset Middle Market Debt Fund Inc. 2014 Semi-Annual Report | 7 |
Schedule of investments (unaudited) (cont’d)
October 31, 2014
Western Asset Middle Market Debt Fund Inc.
| Security | Rate | Maturity Date | Face Amount† | Value | ||||||||||||
| Materials — 17.6% | ||||||||||||||||
Chemicals — 2.5% | ||||||||||||||||
Eco Services Operations LLC/Eco Finance Corp., Senior Notes | 8.500 | % | 11/1/22 | 250,000 | $ | 258,750 | (a) | |||||||||
HIG BBC Intermediate Holdings LLC/HIG BBC Holdings Corp., Senior Notes | 10.500 | % | 9/15/18 | 1,030,000 | 1,032,575 | (a)(e) | ||||||||||
Jac Holding Corp., Senior Secured Notes | 11.500 | % | 10/1/19 | 2,820,000 | 2,876,400 | (a) | ||||||||||
Total Chemicals | 4,167,725 | |||||||||||||||
Construction Materials — 0.3% | ||||||||||||||||
Hardwoods Acquisition Inc., Senior Secured Notes | 7.500 | % | 8/1/21 | 430,000 | 436,450 | (a)(b) | ||||||||||
Containers & Packaging — 1.8% | ||||||||||||||||
Consolidated Container Co. LLC/Consolidated Container Capital Inc., Senior Notes | 10.125 | % | 7/15/20 | 1,250,000 | 1,181,250 | (a) | ||||||||||
Pactiv LLC, Senior Notes | 7.950 | % | 12/15/25 | 750,000 | 789,375 | (b) | ||||||||||
PaperWorks Industries Inc., Senior Secured Notes | 9.500 | % | 8/15/19 | 990,000 | 1,015,987 | (a)(b) | ||||||||||
Total Containers & Packaging | 2,986,612 | |||||||||||||||
Metals & Mining — 11.8% | ||||||||||||||||
Barminco Finance Pty Ltd., Senior Notes | 9.000 | % | 6/1/18 | 2,390,000 | 2,067,350 | (a)(b) | ||||||||||
JW Aluminum Co., Senior Secured Notes | 11.500 | % | 11/15/17 | 3,500,000 | 3,605,000 | (a)(b) | ||||||||||
Magnetation LLC/Mag Finance Corp., Senior Secured Notes | 11.000 | % | 5/15/18 | 2,880,000 | 2,599,200 | (a)(b) | ||||||||||
Mirabela Nickel Ltd., Subordinated Notes | 1.000 | % | 9/10/44 | 25,315 | 0 | (c)(d)(h) | ||||||||||
Noranda Aluminum Acquisition Corp., Senior Notes | 11.000 | % | 6/1/19 | 3,200,000 | 3,232,000 | (b) | ||||||||||
Optima Specialty Steel Inc., Senior Secured Notes | 12.500 | % | 12/15/16 | 1,000,000 | 1,068,750 | (a)(b) | ||||||||||
Permian Holdings Inc., Senior Secured Notes | 10.500 | % | 1/15/18 | 2,000,000 | 2,010,000 | (a)(b) | ||||||||||
Ryerson Inc./Joseph T. Ryerson & Son Inc., Senior Notes | 11.250 | % | 10/15/18 | 1,337,000 | 1,464,015 | (b) | ||||||||||
St. Barbara Ltd., Senior Secured Notes | 8.875 | % | 4/15/18 | 1,700,000 | 1,377,000 | (a) | ||||||||||
Thompson Creek Metals Co. Inc., Senior Notes | 12.500 | % | 5/1/19 | 2,000,000 | 2,120,000 | (b) | ||||||||||
Total Metals & Mining | 19,543,315 | |||||||||||||||
Paper & Forest Products — 1.2% | ||||||||||||||||
Appvion Inc., Secured Notes | 9.000 | % | 6/1/20 | 1,160,000 | 922,200 | (a)(b) | ||||||||||
Verso Paper Holdings LLC/Verso Paper Inc., Senior Secured Notes | 11.750 | % | 1/15/19 | 1,000,000 | 1,010,000 | |||||||||||
Total Paper & Forest Products | 1,932,200 | |||||||||||||||
Total Materials | 29,066,302 | |||||||||||||||
| Utilities — 1.3% | ||||||||||||||||
Independent Power and Renewable Electricity Producers — 1.3% |
| |||||||||||||||
First Wind Holdings Inc., Senior Secured Notes | 10.250 | % | 6/1/18 | 310,000 | 329,763 | (a) | ||||||||||
Mirant Mid Atlantic LLC, Pass-Through Certificates | 10.060 | % | 12/30/28 | 1,705,015 | 1,865,926 | |||||||||||
Total Utilities | 2,195,689 | |||||||||||||||
Total Corporate Bonds & Notes (Cost — $159,507,929) |
| 155,359,964 | ||||||||||||||
See Notes to Financial Statements.
| 8 | Western Asset Middle Market Debt Fund Inc. 2014 Semi-Annual Report |
Western Asset Middle Market Debt Fund Inc.
| Security | Rate | Maturity Date | Face Amount† | Value | ||||||||||||
| Convertible Bonds & Notes — 0.6% | ||||||||||||||||
| Materials — 0.6% | ||||||||||||||||
Metals & Mining — 0.6% | ||||||||||||||||
Mirabela Nickel Ltd., Senior Secured Bonds (Cost — $1,127,000) | 9.500 | % | 6/20/19 | 1,127,000 | $ | 1,003,030 | (a)(c)(d) | |||||||||
| Senior Loans — 11.9% | ||||||||||||||||
| Consumer Discretionary — 3.0% | ||||||||||||||||
Hotels, Restaurants & Leisure — 1.6% | ||||||||||||||||
AP Gaming I LLC, USD Term Loan B | 9.250 | % | 12/21/20 | 1,985,000 | 1,989,962 | (i)(j) | ||||||||||
Burger King Newco, Senior Secured Bridge Loan | — | 11/26/14 | 530,000 | 530,000 | (c)(d)(k) | |||||||||||
Total Hotels, Restaurants & Leisure | 2,519,962 | |||||||||||||||
Media — 0.7% | ||||||||||||||||
AP NMT Acquisition BV, USD Second Lien Term Loan | 10.000 | % | 8/13/22 | 550,000 | 534,875 | (i)(j) | ||||||||||
Lee Enterprises Inc., Term Loan | 7.250 | % | 3/31/19 | 634,900 | 635,281 | (i)(j) | ||||||||||
Total Media | 1,170,156 | |||||||||||||||
Textiles, Apparel & Luxury Goods — 0.7% | ||||||||||||||||
TOMS Shoes LLC, Term Loan B | — | 10/28/20 | 1,260,000 | 1,159,200 | (k) | |||||||||||
Total Consumer Discretionary | 4,849,318 | |||||||||||||||
| Consumer Staples — 3.0% | ||||||||||||||||
Food Products — 2.2% | ||||||||||||||||
AdvancePierre Foods Inc., Second Lien Term Loan | 9.500 | % | 10/10/17 | 1,500,000 | 1,489,687 | (i)(j) | ||||||||||
CPM Acquisition Corp., Second Lien Term Loan | 10.250 | % | 3/1/18 | 1,500,000 | 1,522,500 | (i)(j) | ||||||||||
CSM Bakery Supplies LLC, Second Lien Term Loan | 8.750 | % | 7/3/21 | 710,000 | 694,913 | (i)(j) | ||||||||||
Total Food Products | 3,707,100 | |||||||||||||||
Household Products — 0.8% | ||||||||||||||||
WNA Holdings Inc., USD Second Lien Term Loan | 8.500 | % | 12/7/20 | 1,270,000 | 1,255,713 | (i)(j) | ||||||||||
Total Consumer Staples | 4,962,813 | |||||||||||||||
| Energy — 2.0% | ||||||||||||||||
Oil, Gas & Consumable Fuels — 2.0% | ||||||||||||||||
Arch Coal Inc., Term Loan B | — | 5/16/18 | 2,000,000 | 1,776,428 | (k) | |||||||||||
Bowie Resource Holdings LLC, Second Lien Delayed Draw Term Loan | 11.750 | % | 2/16/21 | 1,560,000 | 1,579,500 | (i)(j) | ||||||||||
Total Energy | 3,355,928 | |||||||||||||||
| Health Care — 0.9% | ||||||||||||||||
CRC Health Corp., Second Lien Term Loan | 9.000 | % | 9/28/21 | 1,450,000 | 1,487,610 | (i)(j) | ||||||||||
| Industrials — 2.4% | ||||||||||||||||
Aerospace & Defense — 0.6% | ||||||||||||||||
WP CPP Holdings LLC, New Second Lien Term Loan | 8.750 | % | 4/30/21 | 1,000,000 | 998,125 | (i)(j) | ||||||||||
See Notes to Financial Statements.
| Western Asset Middle Market Debt Fund Inc. 2014 Semi-Annual Report | 9 |
Schedule of investments (unaudited) (cont’d)
October 31, 2014
Western Asset Middle Market Debt Fund Inc.
| Security | Rate | Maturity Date | Face Amount† | Value | ||||||||||||
Transportation — 1.8% | ||||||||||||||||
Commercial Barge Line Co., Second Lien Term Loan | 10.750 | % | 3/22/20 | 3,000,000 | $ | 3,022,500 | (i)(j) | |||||||||
Total Industrials | 4,020,625 | |||||||||||||||
| Information Technology — 0.6% | ||||||||||||||||
Electronic Equipment, Instruments & Components — 0.6% | ||||||||||||||||
Allflex Holdings III Inc., New Second Lien Term Loan | 8.000 | % | 7/19/21 | 1,000,000 | 990,000 | (i)(j) | ||||||||||
Total Senior Loans (Cost — $19,436,265) |
| 19,666,294 | ||||||||||||||
| Shares | ||||||||||||||||
| Common Stocks — 1.1% | ||||||||||||||||
| Health Care — 0.9% | ||||||||||||||||
Health Care Providers & Services — 0.9% | ||||||||||||||||
Physiotherapy Associates Holdings Inc. | 30,000 | 1,440,000 | *(c)(d) | |||||||||||||
| Materials — 0.2% | ||||||||||||||||
Metals & Mining — 0.2% | ||||||||||||||||
Mirabela Nickel Ltd. | 5,022,817 | 322,666 | *(d) | |||||||||||||
Total Common Stocks (Cost — $3,164,366) |
| 1,762,666 | ||||||||||||||
| Preferred Stocks — 1.2% | ||||||||||||||||
| Industrials — 1.2% | ||||||||||||||||
Trading Companies & Distributors — 1.2% | ||||||||||||||||
General Finance Corp. (Cost — $1,996,875) | 8.125 | % | 79,875 | 2,032,819 | ||||||||||||
Total Investments — 108.8% (Cost — $185,232,435#) |
| 179,824,773 | ||||||||||||||
Liabilities in Excess of Other Assets — (8.8)% |
| (14,556,201 | ) | |||||||||||||
Total Net Assets — 100.0% |
| $ | 165,268,572 | |||||||||||||
| † | Face amount denominated in U.S. dollars, unless otherwise noted. |
| * | Non-income producing security. |
| (a) | Security is exempt from registration under Rule 144A of the Securities Act of 1933. This security may be resold in transactions that are exempt from registration, normally to qualified institutional buyers. This security has been deemed liquid pursuant to guidelines approved by the Board of Directors, unless otherwise noted. |
| (b) | All or a portion of this security is pledged as collateral pursuant to the loan agreement (See Note 6). |
| (c) | Illiquid security. |
| (d) | Security is valued in good faith in accordance with procedures approved by the Board of Directors (See Note 1). |
| (e) | Payment-in-kind security for which the issuer has the option at each interest payment date of making interest payments in cash or additional debt securities. |
| (f) | Security is exempt from registration under Regulation S of the Securities Act of 1933. Regulation S applies to securities offerings that are made outside of the United States and do not involve direct selling efforts in the United States. This security has been deemed liquid pursuant to guidelines approved by the Board of Directors, unless otherwise noted. |
| (g) | Variable rate security. Interest rate disclosed is as of the most recent information available. |
| (h) | Value is less than $1. |
See Notes to Financial Statements.
| 10 | Western Asset Middle Market Debt Fund Inc. 2014 Semi-Annual Report |
Western Asset Middle Market Debt Fund Inc.
| (i) | Interest rates disclosed represent the effective rates on senior loans. Ranges in interest rates are attributable to multiple contracts under the same loan. |
| (j) | Senior loans may be considered restricted in that the Fund ordinarily is contractually obligated to receive approval from the agent bank and/or borrower prior to the disposition of a senior loan. |
| (k) | All or a portion of this loan is unfunded as of October 31, 2014. The interest rate for fully unfunded term loans is to be determined. |
| # | Aggregate cost for federal income tax purposes is substantially the same. |
Abbreviations used in this schedule: | ||
| AUD | — Australian Dollar | |
| EUR | — Euro | |
See Notes to Financial Statements.
| Western Asset Middle Market Debt Fund Inc. 2014 Semi-Annual Report | 11 |
Statement of assets and liabilities (unaudited)
October 31, 2014
| Assets: | ||||
Investments, at value (Cost — $185,232,435) | $ | 179,824,773 | ||
Foreign currency, at value (Cost — $48,642) | 47,937 | |||
Cash | 2,469,122 | |||
Interest receivable | 5,176,541 | |||
Unrealized appreciation on forward foreign currency contracts | 239,368 | |||
Receivable for securities sold | 48,500 | |||
Prepaid expenses | 3,263 | |||
Total Assets | 187,809,504 | |||
| Liabilities: | ||||
Loan payable (Note 6) | 17,800,000 | |||
Payable for securities purchased | 4,504,903 | |||
Investment management fee payable | 195,842 | |||
Interest payable (Note 6) | 5,060 | |||
Directors’ fees payable | 3,792 | |||
Accrued expenses | 31,335 | |||
Total Liabilities | 22,540,932 | |||
| Total Net Assets | $ | 165,268,572 | ||
| Net Assets: | ||||
Par value ($0.001 par value, 170,067 shares issued and outstanding; 100,000,000 shares authorized) | $ | 170 | ||
Paid-in capital in excess of par value | 169,482,558 | |||
Undistributed net investment income | 1,394,220 | |||
Accumulated net realized loss on investments and foreign currency transactions | (435,157) | |||
Net unrealized depreciation on investments and foreign currencies | (5,173,219) | |||
| Total Net Assets | $ | 165,268,572 | ||
| Shares Outstanding | 170,067 | |||
| Net Asset Value | $971.79 | |||
See Notes to Financial Statements.
| 12 | Western Asset Middle Market Debt Fund Inc. 2014 Semi-Annual Report |
Statement of operations (unaudited)
For the Six Months Ended October 31, 2014
| Investment Income: | ||||
Interest | $ | 8,625,301 | ||
Dividends | 59,941 | |||
Total Investment Income | 8,685,242 | |||
| Expenses: | ||||
Investment management fee (Note 2) | 1,145,283 | |||
Audit and tax fees | 40,248 | |||
Legal fees | 19,666 | |||
Interest expense (Note 6) | 19,657 | |||
Fund accounting fees | 16,924 | |||
Directors’ fees | 14,442 | |||
Shareholder reports | 14,286 | |||
Transfer agent fees | 8,580 | |||
Insurance | 2,157 | |||
Custody fees | 971 | |||
Miscellaneous expenses | 4,041 | |||
Total Expenses | 1,286,255 | |||
| Net Investment Income | 7,398,987 | |||
| Realized and Unrealized Gain (Loss) on Investments and Foreign Currency Transactions (Notes 1, 3 and 4): | ||||
Net Realized Gain (Loss) From: | ||||
Investment transactions | (1,801,621) | |||
Foreign currency transactions | 32,116 | |||
Net Realized Loss | (1,769,505) | |||
Change in Net Unrealized Appreciation (Depreciation) From: | ||||
Investments | (8,710,316) | |||
Foreign currencies | 336,713 | |||
Change in Net Unrealized Appreciation (Depreciation) | (8,373,603) | |||
| Net Loss on Investments and Foreign Currency Transactions | (10,143,108) | |||
| Decrease in Net Assets from Operations | $ | (2,744,121) | ||
See Notes to Financial Statements.
| Western Asset Middle Market Debt Fund Inc. 2014 Semi-Annual Report | 13 |
Statements of changes in net assets
| For the Six Months Ended October 31, 2014 (unaudited) and the Year Ended April 30, 2014 | October 31 | April 30 | ||||||
| Operations: | ||||||||
Net investment income | $ | 7,398,987 | $ | 14,219,237 | ||||
Net realized gain (loss) | (1,769,505) | 1,766,715 | ||||||
Change in net unrealized appreciation (depreciation) | (8,373,603) | 176,532 | ||||||
Increase (Decrease) in Net Assets From Operations | (2,744,121) | 16,162,484 | ||||||
| Distributions to Shareholders From (Note 1): | ||||||||
Net investment income | (7,215,190) | (13,839,169) | ||||||
Net realized gains | — | (532,959) | ||||||
Decrease in Net Assets From Distributions to Shareholders | (7,215,190) | (14,372,128) | ||||||
| Fund Share Transactions (Note 5): | ||||||||
Cost of shares repurchased (7,586 and 0 shares repurchased, respectively) | (7,809,863) | — | ||||||
Increase (Decrease) in Net Assets From Fund Share Transactions | (7,809,863) | — | ||||||
Increase (Decrease) in Net Assets | (17,769,174) | 1,790,356 | ||||||
| Net Assets: | ||||||||
Beginning of period | 183,037,746 | 181,247,390 | ||||||
End of period* | $ | 165,268,572 | $ | 183,037,746 | ||||
*Includesundistributed net investment income of: | $1,394,220 | $1,210,423 | ||||||
See Notes to Financial Statements.
| 14 | Western Asset Middle Market Debt Fund Inc. 2014 Semi-Annual Report |
| For a share of capital stock outstanding throughout each year ended April 30, unless otherwise noted: | ||||||||||||
| 20141,2 | 20141 | 20131,3 | ||||||||||
| Net asset value, beginning of period | $1,030.31 | $1,020.23 | $998.00 | 4 | ||||||||
| Income (loss) from operations: | ||||||||||||
Net investment income | 42.65 | 80.04 | 9.84 | |||||||||
Net realized and unrealized gain (loss) | (59.67) | 10.94 | 17.39 | |||||||||
Total income (loss) from operations | (17.02) | 90.98 | 27.23 | |||||||||
| Less distributions from: | ||||||||||||
Net investment income | (41.50) | † | (77.90) | (5.00) | ||||||||
Net realized gains | — | (3.00) | — | |||||||||
Total distributions | (41.50) | (80.90) | (5.00) | |||||||||
| Net asset value, end of period | $971.79 | $1,030.31 | $1,020.23 | |||||||||
Total return5 | (1.76) | % | 9.35 | % | 2.73 | % | ||||||
| Net assets, end of period (000s) | $165,269 | $183,038 | $181,246 | |||||||||
| Ratios to average net assets: | ||||||||||||
Gross expenses | 1.44 | %6 | 1.39 | % | 1.59 | %6 | ||||||
Net expenses7 | 1.44 | 6 | 1.39 | 1.48 | 6,8 | |||||||
Net investment income | 8.28 | 6 | 7.88 | 2.73 | 6 | |||||||
| Portfolio turnover rate | 20 | % | 60 | % | 6 | % | ||||||
| Supplemental data: | ||||||||||||
Loans Outstanding, End of Period (000s) | $17,800 | — | — | |||||||||
Asset Coverage for Loan Outstanding | 1,028 | % | — | — | ||||||||
Weighted Average Loan (000s) | $4,422 | — | — | |||||||||
Weighted Average Interest Rate on Loans | 0.85 | % | — | — | ||||||||
| 1 | Per share amounts have been calculated using the average shares method. |
| 2 | For the six months ended October 31, 2014 (unaudited). |
| 3 | For the period December 20, 2012 (inception date) to April 30, 2013. |
| 4 | Initial public offering price of $1,000.00 per share, exclusive of sales load, less offering costs of $2.00 per share. |
| 5 | Performance figures may reflect compensating balance arrangements, fee waivers and/or expense reimbursements. In the absence of compensating balance arrangements, fee waivers and/or expense reimbursements, the total return would have been lower. Past performance is no guarantee of future results. Total returns for periods of less than one year are not annualized. |
| 6 | Annualized. |
| 7 | The impact of compensating balance arrangements, if any, was less than 0.01%. |
| 8 | The investment manager has agreed to reimburse all organizational expenses. |
| † | The actual source of the Fund’s current fiscal year distributions may be from net investment income, return of capital or a combination of both. Shareholders will be informed of the tax characteristics of the distributions after the close of the fiscal year. |
See Notes to Financial Statements.
| Western Asset Middle Market Debt Fund Inc. 2014 Semi-Annual Report | 15 |
Notes to financial statements (unaudited)
1. Organization and significant accounting policies
Western Asset Middle Market Debt Fund Inc. (the “Fund”) was incorporated in Maryland on July 23, 2012 and is registered as a non-diversified, closed-end management investment company under the Investment Company Act of 1940, as amended (the “1940 Act”). The Fund’s primary investment objective is to provide high income. As a secondary investment objective, the Fund seeks capital appreciation. The Fund seeks to achieve its investment objectives by investing, under normal market conditions, at least 80% of its managed assets, which are the net assets of the Fund plus the principal amount of any borrowings, in below-investment-grade debt securities, including loans, issued by middle market companies. For investment purposes, “middle market” refers to companies with annual revenues of between $100 million and $1 billion at the time of investment by the Fund. It is anticipated that the Fund will terminate on or before December 31, 2020. Upon its termination, it is anticipated that the Fund will have distributed substantially all of its net assets to stockholders, although securities for which no market exists or securities trading at depressed prices, if any, may be placed in a liquidating trust.
The following are significant accounting policies consistently followed by the Fund and are in conformity with U.S. generally accepted accounting principles (“GAAP”). Estimates and assumptions are required to be made regarding assets, liabilities and changes in net assets resulting from operations when financial statements are prepared. Changes in the economic environment, financial markets and any other parameters used in determining these estimates could cause actual results to differ. Subsequent events have been evaluated through the date the financial statements were issued.
(a) Investment valuation. The valuations for fixed income securities (which may include, but are not limited to, corporate, government, municipal, mortgage-backed, collateralized mortgage obligations and asset-backed securities) and certain derivative instruments are typically the prices supplied by independent third party pricing services, which may use market prices or broker/dealer quotations or a variety of valuation techniques and methodologies. The independent third party pricing services use inputs that are observable such as issuer details, interest rates, yield curves, prepayment speeds, credit risks/spreads, default rates and quoted prices for similar securities. Short-term fixed income securities that will mature in 60 days or less are valued at amortized cost, unless it is determined that using this method would not reflect an investment’s fair value. Equity securities for which market quotations are available are valued at the last reported sales price or official closing price on the primary market or exchange on which they trade. When the Fund holds securities or other assets that are denominated in a foreign currency, the Fund will normally use the currency exchange rates as of 4:00 p.m. (Eastern Time). If independent third party pricing services are unable to supply prices for a portfolio investment, or if the prices supplied are deemed by the manager to be unreliable, the market price may be determined by the manager using quotations from one or more broker/dealers or at the transaction price if the security has recently been purchased and no value has yet been obtained from a pricing service or pricing broker. When reliable prices are not readily available, such as when the value of a security has been significantly affected by events after the close of the exchange
| 16 | Western Asset Middle Market Debt Fund Inc. 2014 Semi-Annual Report |
or market on which the security is principally traded, but before the Fund calculates its net asset value, the Fund values these securities as determined in accordance with procedures approved by the Fund’s Board of Directors.
The Board of Directors is responsible for the valuation process and has delegated the supervision of the daily valuation process to the Legg Mason North American Fund Valuation Committee (the “Valuation Committee”). The Valuation Committee, pursuant to the policies adopted by the Board of Directors, is responsible for making fair value determinations, evaluating the effectiveness of the Fund’s pricing policies, and reporting to the Board of Directors. When determining the reliability of third party pricing information for investments owned by the Fund, the Valuation Committee, among other things, conducts due diligence reviews of pricing vendors, monitors the daily change in prices and reviews transactions among market participants.
The Valuation Committee will consider pricing methodologies it deems relevant and appropriate when making fair value determinations. Examples of possible methodologies include, but are not limited to, multiple of earnings; discount from market of a similar freely traded security; discounted cash-flow analysis; book value or a multiple thereof; risk premium/yield analysis; yield to maturity; and/or fundamental investment analysis. The Valuation Committee will also consider factors it deems relevant and appropriate in light of the facts and circumstances. Examples of possible factors include, but are not limited to, the type of security; the issuer’s financial statements; the purchase price of the security; the discount from market value of unrestricted securities of the same class at the time of purchase; analysts’ research and observations from financial institutions; information regarding any transactions or offers with respect to the security; the existence of merger proposals or tender offers affecting the security; the price and extent of public trading in similar securities of the issuer or comparable companies; and the existence of a shelf registration for restricted securities.
For each portfolio security that has been fair valued pursuant to the policies adopted by the Board of Directors, the fair value price is compared against the last available and next available market quotations. The Valuation Committee reviews the results of such back testing monthly and fair valuation occurrences are reported to the Board of Directors quarterly.
The Fund uses valuation techniques to measure fair value that are consistent with the market approach and/or income approach, depending on the type of security and the particular circumstance. The market approach uses prices and other relevant information generated by market transactions involving identical or comparable securities. The income approach uses valuation techniques to discount estimated future cash flows to present value.
GAAP establishes a disclosure hierarchy that categorizes the inputs to valuation techniques used to value assets and liabilities at measurement date. These inputs are summarized in the three broad levels listed below:
| Ÿ | Level 1 — quoted prices in active markets for identical investments |
| Ÿ | Level 2 — other significant observable inputs (including quoted prices for similar investments, interest rates, prepayment speeds, credit risk, etc.) |
| Western Asset Middle Market Debt Fund Inc. 2014 Semi-Annual Report | 17 |
Notes to financial statements (unaudited) (cont’d)
| Ÿ | Level 3 — significant unobservable inputs (including the Fund’s own assumptions in determining the fair value of investments) |
The inputs or methodologies used to value securities are not necessarily an indication of the risk associated with investing in those securities.
The following is a summary of the inputs used in valuing the Fund’s assets carried at fair value:
| ASSETS | ||||||||||||||||||
| Description | Quoted Prices (Level 1) | Other Significant Observable Inputs (Level 2) | Significant Unobservable Inputs (Level 3) | Total | ||||||||||||||
| Long-term investments†: | ||||||||||||||||||
Corporate bonds & notes: | ||||||||||||||||||
Consumer discretionary | — | $ | 38,492,257 | $ | 2,793,695 | $ | 41,285,952 | |||||||||||
Materials | — | 29,066,302 | 0 | * | 29,066,302 | |||||||||||||
Other corporate bonds & notes | — | 85,007,710 | — | 85,007,710 | ||||||||||||||
Convertible Bonds & Notes | — | 1,003,030 | — | 1,003,030 | ||||||||||||||
Senior Loans | — | 19,666,294 | — | 19,666,294 | ||||||||||||||
Common stocks: | ||||||||||||||||||
Health care | — | — | 1,440,000 | 1,440,000 | ||||||||||||||
Materials | — | 322,666 | — | 322,666 | ||||||||||||||
Preferred Stocks | $ | 2,032,819 | — | — | 2,032,819 | |||||||||||||
| Total investments | $ | 2,032,819 | $ | 173,558,259 | $ | 4,233,695 | $ | 179,824,773 | ||||||||||
| Other financial instruments: | ||||||||||||||||||
Forward foreign currency contracts | — | $ | 239,368 | — | $ | 239,368 | ||||||||||||
| Total | $ | 2,032,819 | $ | 173,797,627 | $ | 4,233,695 | $ | 180,064,141 | ||||||||||
| † | See Schedule of Investments for additional detailed categorizations. |
| * | Amount represents less than $1. |
The following is a reconciliation of investments in which significant unobservable inputs (Level 3) were used in determining fair value:
| Corporate Bonds & Notes | Common Stocks | |||||||||||||||
| Investments in Securities | Consumer Discretionary | Materials | Health Care | Total | ||||||||||||
| Balance as of April 30, 2014 | $ | 2,700,000 | $ | 132,500 | $ | 1,440,000 | $ | 4,272,500 | ||||||||
| Accrued premiums/discounts | — | 9,877 | — | 9,877 | ||||||||||||
| Realized gain (loss)1 | — | 897 | — | 897 | ||||||||||||
| Change in unrealized appreciation (depreciation)2 | 1,330 | (10,774) | — | (9,444) | ||||||||||||
| Purchases | 92,365 | 0 | * | — | 92,365 | |||||||||||
| Sales | — | (132,500) | — | (132,500) | ||||||||||||
| Transfers into Level 3 | — | — | — | — | ||||||||||||
| Transfers out of Level 3 | — | — | — | — | ||||||||||||
| Balance as of October 31, 2014 | $ | 2,793,695 | $ | 0 | * | $ | 1,440,000 | $ | 4,233,695 | |||||||
| Net change in unrealized appreciation (depreciation) for investments in securities still held at October 31, 20142 | $ | 1,330 | — | — | $ | 1,330 | ||||||||||
| 18 | Western Asset Middle Market Debt Fund Inc. 2014 Semi-Annual Report |
The Fund’s policy is to recognize transfers between levels as of the end of the reporting period.
| * | Amount represents less than $1. |
| 1 | This amount is included in net realized gain (loss) from investment transactions in the accompanying Statement of Operations. |
| 2 | This amount is included in the change in net unrealized appreciation (depreciation) in the accompanying Statement of Operations. Change in unrealized appreciation (depreciation) includes net unrealized appreciation (depreciation) resulting from changes in investment values during the reporting period and the reversal of previously recorded unrealized appreciation (depreciation) when gains or losses are realized. |
(b) Repurchase agreements. The Fund may enter into repurchase agreements with institutions that its investment adviser has determined are creditworthy. Each repurchase agreement is recorded at cost. Under the terms of a typical repurchase agreement, the Fund acquires a debt security subject to an obligation of the seller to repurchase, and of the Fund to resell, the security at an agreed-upon price and time, thereby determining the yield during the Fund’s holding period. When entering into repurchase agreements, it is the Fund’s policy that its custodian or a third party custodian, acting on the Fund’s behalf, take possession of the underlying collateral securities, the market value of which, at all times, at least equals the principal amount of the repurchase transaction, including accrued interest. To the extent that any repurchase transaction maturity exceeds one business day, the value of the collateral is marked-to-market and measured against the value of the agreement in an effort to ensure the adequacy of the collateral. If the counterparty defaults, the Fund generally has the right to use the collateral to satisfy the terms of the repurchase transaction. However, if the market value of the collateral declines during the period in which the Fund seeks to assert its rights or if bankruptcy proceedings are commenced with respect to the seller of the security, realization of the collateral by the Fund may be delayed or limited.
(c) Loan participations. The Fund may invest in loans arranged through private negotiation between one or more financial institutions. The Fund’s investment in any such loan may be in the form of a participation in or an assignment of the loan. In connection with purchasing participations, the Fund generally will have no right to enforce compliance by the borrower with the terms of the loan agreement related to the loan, or any rights of off-set against the borrower and the Fund may not benefit directly from any collateral supporting the loan in which it has purchased the participation.
The Fund assumes the credit risk of the borrower, the lender that is selling the participation and any other persons interpositioned between the Fund and the borrower. In the event of the insolvency of the lender selling the participation, the Fund may be treated as a general creditor of the lender and may not benefit from any off-set between the lender and the borrower.
(d) Unfunded loan commitments. The Fund may enter into certain credit agreements where all or a portion of which may be unfunded. The Fund is obligated to fund these commitments at the borrower’s discretion. The commitments are disclosed in the accompanying Schedule of Investments. At October 31, 2014, the Fund had sufficient cash and/or securities to cover these commitments.
| Western Asset Middle Market Debt Fund Inc. 2014 Semi-Annual Report | 19 |
Notes to financial statements (unaudited) (cont’d)
(e) Forward foreign currency contracts. The Fund enters into a forward foreign currency contract to hedge against foreign currency exchange rate risk on its non-U.S. dollar denominated securities or to facilitate settlement of a foreign currency denominated portfolio transaction. A forward foreign currency contract is an agreement between two parties to buy and sell a currency at a set price with delivery and settlement at a future date. The contract is marked-to-market daily and the change in value is recorded by the Fund as an unrealized gain or loss. When a forward foreign currency contract is closed, through either delivery or offset by entering into another forward foreign currency contract, the Fund recognizes a realized gain or loss equal to the difference between the value of the contract at the time it was opened and the value of the contract at the time it is closed.
Forward foreign currency contracts involve elements of market risk in excess of the amounts reflected on the Statement of Assets and Liabilities. The Fund bears the risk of an unfavorable change in the foreign exchange rate underlying the forward foreign currency contract. Risks may also arise upon entering into these contracts from the potential inability of the counterparties to meet the terms of their contracts.
(f) Foreign currency translation. Investment securities and other assets and liabilities denominated in foreign currencies are translated into U.S. dollar amounts based upon prevailing exchange rates on the date of valuation. Purchases and sales of investment securities and income and expense items denominated in foreign currencies are translated into U.S. dollar amounts based upon prevailing exchange rates on the respective dates of such transactions.
The Fund does not isolate that portion of the results of operations resulting from fluctuations in foreign exchange rates on investments from the fluctuations arising from changes in market prices of securities held. Such fluctuations are included with the net realized and unrealized gain or loss on investments.
Net realized foreign exchange gains or losses arise from sales of foreign currencies, including gains and losses on forward foreign currency contracts, currency gains or losses realized between the trade and settlement dates on securities transactions, and the difference between the amounts of dividends, interest, and foreign withholding taxes recorded on the Fund’s books and the U.S. dollar equivalent of the amounts actually received or paid. Net unrealized foreign exchange gains and losses arise from changes in the values of assets and liabilities, other than investments in securities, on the date of valuation, resulting from changes in exchange rates.
Foreign security and currency transactions may involve certain considerations and risks not typically associated with those of U.S. dollar denominated transactions as a result of, among other factors, the possibility of lower levels of governmental supervision and regulation of foreign securities markets and the possibility of political or economic instability.
(g) Foreign investment risks. The Fund’s investments in foreign securities may involve risks not present in domestic investments. Since securities may be denominated in foreign currencies, may require settlement in foreign currencies or pay interest or dividends in foreign
| 20 | Western Asset Middle Market Debt Fund Inc. 2014 Semi-Annual Report |
currencies, changes in the relationship of these foreign currencies to the U.S. dollar can significantly affect the value of the investments and earnings of the Fund. Foreign investments may also subject the Fund to foreign government exchange restrictions, expropriation, taxation or other political, social or economic developments, all of which affect the market and/or credit risk of the investments.
(h) Credit and market risk. The Fund invests in high-yield and emerging market instruments that are subject to certain credit and market risks. The yields of high-yield and emerging market debt obligations reflect, among other things, perceived credit and market risks. The Fund’s investments in securities rated below investment grade typically involve risks not associated with higher rated securities including, among others, greater risk related to timely and ultimate payment of interest and principal, greater market price volatility and less liquid secondary market trading. The consequences of political, social, economic or diplomatic changes may have disruptive effects on the market prices of investments held by the Fund. The Fund’s investments in non-U.S. dollar denominated securities may also result in foreign currency losses caused by devaluations and exchange rate fluctuations.
(i) Counterparty risk and credit-risk-related contingent features of derivative instruments. The Fund may invest in certain securities or engage in other transactions, where the Fund is exposed to counterparty credit risk in addition to broader market risks. The Fund may invest in securities of issuers, which may also be considered counterparties as trading partners in other transactions. This may increase the risk of loss in the event of default or bankruptcy by the counterparty or if the counterparty otherwise fails to meet its contractual obligations. The Fund’s investment manager attempts to mitigate counterparty risk by (i) periodically assessing the creditworthiness of its trading partners, (ii) monitoring and/or limiting the amount of its net exposure to each individual counterparty based on its assessment and (iii) requiring collateral from the counterparty for certain transactions. Market events and changes in overall economic conditions may impact the assessment of such counterparty risk by the investment manager. In addition, declines in the values of underlying collateral received may expose the Fund to increased risk of loss.
The Fund has entered into master agreements with certain of its derivative counterparties that provide for general obligations, representations, agreements, collateral, events of default or termination and credit related contingent features. The credit related contingent features include, but are not limited to, a percentage decrease in the Fund’s net assets or NAV over a specified period of time. If these credit related contingent features were triggered, the derivatives counterparty could terminate the positions and demand payment or require additional collateral.
Collateral requirements differ by type of derivative. Collateral or margin requirements are set by the broker or exchange clearinghouse for exchange traded derivatives while collateral terms are contract specific for over-the-counter traded derivatives. Cash collateral that has been pledged to cover obligations of the Fund under derivative contracts, if any, will be reported separately in the Statement of Assets and Liabilities. Securities pledged as collateral, if any, for the same purpose are noted in the Schedule of Investments.
| Western Asset Middle Market Debt Fund Inc. 2014 Semi-Annual Report | 21 |
Notes to financial statements (unaudited) (cont’d)
Absent an event of default by the counterparty or a termination of the agreement, the terms of the master agreements do not result in an offset of reported amounts of financial assets and financial liabilities in the Statement of Assets and Liabilities across transactions between the Fund and the applicable counterparty. The enforceability of the right to offset may vary by jurisdiction.
As of October 31, 2014, the Fund did not have any open derivative transactions with credit related contingent features in a net liability position.
(j) Security transactions and investment income. Security transactions are accounted for on a trade date basis. Interest income, adjusted for amortization of premium and accretion of discount, is recorded on the accrual basis. Dividend income is recorded on the ex-dividend date. Foreign dividend income is recorded on the ex-dividend date or as soon as practicable after the Fund determines the existence of a dividend declaration after exercising reasonable due diligence. The cost of investments sold is determined by use of the specific identification method. To the extent any issuer defaults or a credit event occurs that impacts the issuer, the Fund may halt any additional interest income accruals and consider the realizability of interest accrued up to the date of default or credit event.
(k) Distributions to shareholders. Distributions from net investment income of the Fund, if any, are declared and paid on a quarterly basis. The actual source of the Fund’s quarterly distributions may be from net investment income, return of capital or a combination of both. Shareholders will be informed of the tax characteristics of the distributions after the close of the fiscal year. Distributions of net realized gains, if any, are declared at least annually. Distributions to shareholders of the Fund are recorded on the ex-dividend date and are determined in accordance with income tax regulations, which may differ from GAAP.
(l) Compensating balance arrangements. The Fund has an arrangement with its custodian bank whereby a portion of the custodian’s fees is paid indirectly by credits earned on the Fund’s cash on deposit with the bank.
(m) Federal and other taxes. It is the Fund’s policy to comply with the federal income and excise tax requirements of the Internal Revenue Code of 1986 (the “Code”), as amended, applicable to regulated investment companies. Accordingly, the Fund intends to distribute its taxable income and net realized gains, if any, to shareholders in accordance with timing requirements imposed by the Code. Therefore, no federal or state income tax provision is required in the Fund’s financial statements. However, due to the timing of when distributions are made by the Fund, the Fund may be subject to an excise tax of 4% of the amount by which 98% of the Fund’s annual taxable income and 98.2% of net realized gains exceed the distributions from such taxable income and realized gains for the calendar year.
Management has analyzed the Fund’s tax positions taken on income tax returns for all open tax years and has concluded that as of October 31, 2014, no provision for income tax is required in the Fund’s financial statements. The Fund’s federal and state income and federal excise tax returns for tax years for which the applicable statutes of limitations have not expired are subject to examination by the Internal Revenue Service and state departments of revenue.
| 22 | Western Asset Middle Market Debt Fund Inc. 2014 Semi-Annual Report |
(n) Reclassification. GAAP requires that certain components of net assets be reclassified to reflect permanent differences between financial and tax reporting. These reclassifications have no effect on net assets or net asset value per share.
2. Investment management agreement and other transactions with affiliates
Legg Mason Partners Fund Advisor, LLC (“LMPFA”) is the Fund’s investment manager. Western Asset Management Company (“Western Asset”) is the Fund’s subadviser. Western Asset Management Company Limited (“Western Asset Limited”) serves as an additional subadviser to the Fund, under a subadvisory agreement with Western Asset. LMPFA, Western Asset and Western Asset Limited are wholly-owned subsidiaries of Legg Mason, Inc. (“Legg Mason”).
LMPFA provides administrative and certain oversight services to the Fund. The Fund pays LMPFA an investment management fee, calculated daily and paid monthly, at an annual rate of 1.25% of the Fund’s average daily managed assets, which are net assets of the Fund plus the principal amount of any borrowings.
LMPFA delegates to Western Asset the day-to-day portfolio management of the Fund. Western Asset Limited provides certain advisory services to the Fund relating to currency transactions and investments in non-U.S. dollar denominated debt securities. For its services, LMPFA pays Western Asset 90% of the net management fee it receives from the Fund. In turn, Western Asset pays Western Asset Limited a fee for its services at no additional expense to the Fund. Western Asset Limited receives a fee from Western Asset, payable monthly, in an amount equal to 100% of the management fee paid to Western Asset on the assets that Western Asset allocates to Western Asset Limited to manage.
During periods in which the Fund utilizes financial leverage, the fees which are payable to the investment manager as a percentage of the Fund’s net assets will be higher than if the Fund did not utilize leverage because the fees are calculated as a percentage of the Fund’s assets, including those investments purchased with leverage.
All officers and one Director of the Fund are employees of Legg Mason or its affiliates and do not receive compensation from the Fund.
3. Investments
During the six months ended October 31, 2014, the aggregate cost of purchases and proceeds from sales of investments (excluding short-term investments) were as follows:
| Purchases | $ | 48,647,997 | ||
| Sales | 34,657,549 |
At October 31, 2014, the aggregate gross unrealized appreciation and depreciation of investments for federal income tax purposes were substantially as follows:
| Gross unrealized appreciation | $ | 4,173,848 | ||
| Gross unrealized depreciation | (9,581,510) | |||
| Net unrealized depreciation | $ | (5,407,662) |
| Western Asset Middle Market Debt Fund Inc. 2014 Semi-Annual Report | 23 |
Notes to financial statements (unaudited) (cont’d)
At October 31, 2014, the Fund had the following open forward foreign currency contracts:
| Currency Purchased | Currency Sold | Counterparty | Settlement Date | Unrealized Appreciation | ||||||||||
| USD 3,906,877 | EUR 2,926,444 | HSBC Bank USA, N.A. | 11/14/14 | $ | 239,368 | |||||||||
4. Derivative instruments and hedging activities
GAAP requires enhanced disclosure about an entity’s derivative and hedging activities.
Below is a table, grouped by derivative type, that provides information about the fair value and the location of derivatives within the Statement of Assets and Liabilities at October 31, 2014.
| ASSET DERIVATIVES1 | ||||
| Foreign Exchange Risk | ||||
| Forward foreign currency contracts | $ | 239,368 | ||
| 1 | Generally, the balance sheet location for asset derivatives is receivables/net unrealized appreciation (depreciation) and for liability derivatives is payables/net unrealized appreciation (depreciation). |
The following tables provide information about the effect of derivatives and hedging activities on the Fund’s Statement of Operations for the six months ended October 31, 2014. The first table provides additional detail about the amounts and sources of gains (losses) realized on derivatives during the period. The second table provides additional information about the change in unrealized appreciation (depreciation) resulting from the Fund’s derivatives and hedging activities during the period.
| AMOUNT OF REALIZED GAIN (LOSS) ON DERIVATIVES RECOGNIZED | ||||
| Foreign Exchange Risk | ||||
| Forward foreign currency contracts1 | $ | 50,177 | ||
| 1 | Net realized gain (loss) from forward foreign currency contracts is reported in net realized gain (loss) from foreign currency transactions in the Statement of Operations. |
| CHANGE IN UNREALIZED APPRECIATION (DEPRECIATION) ON DERIVATIVES RECOGNIZED | ||||
| Foreign Exchange Risk | ||||
| Forward foreign currency contracts1 | $ | 342,895 | ||
| 1 | The change in unrealized appreciation (depreciation) from forward foreign currency contracts is reported in the change in net unrealized appreciation (depreciation) from foreign currencies in the Statement of Operations. |
During the six months ended October 31, 2014, the volume of derivative activity for the Fund was as follows:
| Average Market Value | ||||
| Forward foreign currency contracts (to buy)† | $ | 237,359 | ||
| Forward foreign currency contracts (to sell) | 4,121,286 | |||
| † | At October 31, 2014, there were no open positions held in this derivative. |
| 24 | Western Asset Middle Market Debt Fund Inc. 2014 Semi-Annual Report |
The following table presents by financial instrument, the Fund’s derivative assets net of the related collateral received by the Fund at October 31, 2014:
| Gross Amount of Derivative Assets in the Statement of Assets and Liabilities1 | Collateral Received | Net Amount | ||||||||||
| Forward foreign currency contracts | $ | 239,368 | — | $ | 239,368 | |||||||
| 1 | Absent an event of default or early termination, derivative assets and liabilities are presented gross and not offset in the Statement of Assets and Liabilities. |
5. Tender offer
In May 2014, the Fund’s Board of Directors approved a tender offer for up to 10% of the Fund’s outstanding shares of common stock. The tender offer period commenced on June 23, 2014 and expired on July 22, 2014. The tender offer was conducted at a price equal to the Fund’s net asset value per share of common stock on the day on which the tender offer expired. All shares that were validly tendered and not withdrawn during the offering period were accepted for payment. The Fund accepted for payment 7,586 shares of common stock valued at $7,809,863, which represented approximately 4% of the Fund’s then outstanding shares.
6. Loan
Effective July 15, 2014, the Fund has a revolving credit agreement with Pershing LLC that allows the Fund to borrow up to an aggregate amount of $60,000,000 and renews daily for a 180-day term unless notice to the contrary is given to the Fund. The interest on the loan is calculated at a variable rate based on the one-month LIBOR plus any applicable margin. To the extent of the borrowing outstanding, the Fund is required to maintain collateral in a special custody account at the Fund’s custodian on behalf of Pershing LLC. The Fund’s credit agreement contains customary covenants that, among other things, may limit the Fund’s ability to pay distributions in certain circumstances, incur additional debt, change its fundamental investment policies and engage in certain transactions, including mergers and consolidations, and require asset coverage ratios in addition to those required by the 1940 Act. In addition, the credit agreement may be subject to early termination under certain conditions and may contain other provisions that could limit the Fund’s ability to utilize borrowing under the agreement. Interest expense related to this loan for the six months ended October 31, 2014 was $19,657. For the six months ended October 31, 2014, the Fund had an average daily loan balance outstanding of $4,421,739 and the weighted average interest rate was 0.85%. At October 31, 2014, the Fund had $17,800,000 of borrowings outstanding.
7. Distributions subsequent to October 31, 2014
The following distributions have been declared by the Fund’s Board of Directors and are payable subsequent to the period end of this report:
| Record Date | Payable Date | Amount | ||||||
| 12/19/14 | 12/26/14 | $ | 22.0000 | Income | ||||
| 12/31/14 | 1/30/15 | $ | 7.9300 | Short-term capital gain | ||||
| 12/31/14 | 1/30/15 | $ | 0.3461 | Long-term capital gain | ||||
| Western Asset Middle Market Debt Fund Inc. 2014 Semi-Annual Report | 25 |
Western Asset
Middle Market Debt Fund Inc.
Directors
Carol L. Colman
Daniel P. Cronin
Paolo M. Cucchi
Kenneth D. Fuller
Chairman
Leslie H. Gelb
William R. Hutchinson
Eileen A. Kamerick
Riordan Roett
Jeswald W. Salacuse*
Officers
Kenneth D. Fuller
President and Chief Executive Officer
Richard F. Sennett
Principal Financial Officer
Ted P. Becker
Chief Compliance Officer
Vanessa A. Williams
Identity Theft Prevention Officer
Robert I. Frenkel
Secretary and Chief Legal Officer
Thomas C. Mandia
Assistant Secretary
Steven Frank
Treasurer
Jeanne M. Kelly
Senior Vice President
Western Asset Middle Market Debt Fund Inc.
620 Eighth Avenue
49th Floor
New York, NY 10018
Investment manager
Legg Mason Partners Fund Advisor, LLC
Subadvisers
Western Asset Management Company
Western Asset Management Company Limited
Custodian
State Street Bank and Trust Company
1 Lincoln Street
Boston, MA 02111
Transfer agent
American Stock Transfer & Trust Company
6201 15th Avenue
Brooklyn, NY 11219
Independent registered public accounting firm
KPMG LLP
345 Park Avenue
New York, NY 10154
Legal counsel
Simpson Thacher & Bartlett LLP
425 Lexington Avenue
New York, NY 10017
| * | Mr. Salacuse retired from the Board of Directors on June 30, 2014. |
Legg Mason Funds Privacy and Security Notice
Your Privacy and the Security of Your Personal Information is Very Important to the Legg Mason Funds
This Privacy and Security Notice (the “Privacy Notice”) addresses the Legg Mason Funds’ privacy and data protection practices with respect to nonpublic personal information the Funds receive. The Legg Mason Funds include any funds sold by the Funds’ distributor, Legg Mason Investor Services, LLC, as well as Legg Mason-sponsored closed-end funds and certain closed-end funds managed or sub-advised by Legg Mason or its affiliates. The provisions of this Privacy Notice apply to your information both while you are a shareholder and after you are no longer invested with the Funds.
The Type of Nonpublic Personal Information the Funds Collect About You
The Funds collect and maintain nonpublic personal information about you in connection with your shareholder account. Such information may include, but is not limited to:
| Ÿ | Personal information included on applications or other forms; |
| Ÿ | Account balances, transactions, and mutual fund holdings and positions; |
| Ÿ | Online account access user IDs, passwords, security challenge question responses; and |
| Ÿ | Information received from consumer reporting agencies regarding credit history and creditworthiness (such as the amount of an individual’s total debt, payment history, etc.). |
How the Funds Use Nonpublic Personal Information About You
The Funds do not sell or share your nonpublic personal information with third parties or with affiliates for their marketing purposes, or with other financial institutions or affiliates for joint marketing purposes, unless you have authorized the Funds to do so. The Funds do not disclose any nonpublic personal information about you except as may be required to perform transactions or services you have authorized or as permitted or required by law. The Funds may disclose information about you to:
| Ÿ | Employees, agents, and affiliates on a “need to know” basis to enable the Funds to conduct ordinary business or comply with obligations to government regulators; |
| Ÿ | Service providers, including the Funds’ affiliates, who assist the Funds as part of the ordinary course of business (such as printing, mailing services, or processing or servicing your account with us) or otherwise perform services on the Funds’ behalf, including companies that may perform marketing services solely for the Funds; |
| Ÿ | The Funds’ representatives such as legal counsel, accountants and auditors; and |
| Ÿ | Fiduciaries or representatives acting on your behalf, such as an IRA custodian or trustee of a grantor trust. |
| NOT PART OF THE SEMI-ANNUAL REPORT |
Legg Mason Funds Privacy and Security Notice (cont’d)
Except as otherwise permitted by applicable law, companies acting on the Funds’ behalf are contractually obligated to keep nonpublic personal information the Funds provide to them confidential and to use the information the Funds share only to provide the services the Funds ask them to perform.
The Funds may disclose nonpublic personal information about you when necessary to enforce their rights or protect against fraud, or as permitted or required by applicable law, such as in connection with a law enforcement or regulatory request, subpoena, or similar legal process. In the event of a corporate action or in the event a Fund service provider changes, the Funds may be required to disclose your nonpublic personal information to third parties. While it is the Funds’ practice to obtain protections for disclosed information in these types of transactions, the Funds cannot guarantee their privacy policy will remain unchanged.
Keeping You Informed of the Funds’ Privacy and Security Practices
The Funds will notify you annually of their privacy policy as required by federal law. While the Funds reserve the right to modify this policy at any time they will notify you promptly if this privacy policy changes.
The Funds’ Security Practices
The Funds maintain appropriate physical, electronic and procedural safeguards designed to guard your nonpublic personal information. The Funds’ internal data security policies restrict access to your nonpublic personal information to authorized employees, who may use your nonpublic personal information for Fund business purposes only.
Although the Funds strive to protect your nonpublic personal information, they cannot ensure or warrant the security of any information you provide or transmit to them, and you do so at your own risk. In the event of a breach of the confidentiality or security of your nonpublic personal information, the Funds will attempt to notify you as necessary so you can take appropriate protective steps. If you have consented to the Funds using electronic communications or electronic delivery of statements, they may notify you under such circumstances using the most current email address you have on record with them.
In order for the Funds to provide effective service to you, keeping your account information accurate is very important. If you believe that your account information is incomplete, not accurate or not current, or if you have questions about the Funds’ privacy practices, write the Funds using the contact information on your account statements, email the Funds by clicking on the Contact Us section of the Funds’ website at www.leggmason.com, or contact the Fund at 1-888-777-0102.
Revised April 2011
| NOT PART OF THE SEMI-ANNUAL REPORT |
Western Asset Middle Market Debt Fund Inc.
Western Asset Middle Market Debt Fund Inc.
620 Eighth Avenue
49th Floor
New York, NY 10018
Notice is hereby given in accordance with Section 23(c) of the Investment Company Act of 1940, as amended, that from time to time, the Fund may purchase, at market prices, shares of its common stock in the open market.
The Fund files its complete schedule of portfolio holdings with the Securities and Exchange Commission (“SEC”) for the first and third quarters of each fiscal year on Form N-Q. The Fund’s Forms N-Q are available on the SEC’s website at www.sec.gov. The Fund’s Forms N-Q may be reviewed and copied at the SEC’s Public Reference Room in Washington D.C., and information on the operation of the Public Reference Room may be obtained by calling 1-800-SEC-0330. To obtain information on Form N-Q from the Fund, shareholders can call 1-888-777-0102.
Information on how the Fund voted proxies relating to portfolio securities during the prior 12-month period ended June 30th of each year and a description of the policies and procedures that the Fund uses to determine how to vote proxies related to portfolio transactions are available (1) without charge, upon request, by calling 1-888-777-0102, (2) on the Fund’s website at www.lmcef.com and (3) on the SEC’s website at www.sec.gov.
This report is transmitted to the shareholders of Western Asset Middle Market Debt Fund Inc. for their information. This is not a prospectus, circular or representation intended for use in the purchase or sale of shares of the Fund or any securities mentioned in this report.
American Stock Transfer & Trust Company
6201 15th Avenue,
Brooklyn, NY 11219
WASX016045 12/14 SR14-2353
| ITEM 2. | CODE OF ETHICS. |
Not applicable.
| ITEM 3. | AUDIT COMMITTEE FINANCIAL EXPERT. |
Not applicable.
| ITEM 4. | PRINCIPAL ACCOUNTANT FEES AND SERVICES. |
Not applicable.
| ITEM 5. | AUDIT COMMITTEE OF LISTED REGISTRANTS. |
Not applicable.
| ITEM 6. | SCHEDULE OF INVESTMENTS. |
Included herein under Item 1.
| ITEM 7. | DISCLOSURE OF PROXY VOTNG POLICIES AND PROCEDURES FOR CLOSED-END MANAGEMENT INVESTMENT COMPANIES. |
Not applicable.
| ITEM 8. | INVESTMENT PROFESSIONALS OF CLOSED-END MANAGEMENT INVESTMENT COMPANIES. |
Not applicable
| ITEM 9. | PURCHASES OF EQUITY SECURITIES BY CLOSED-END MANAGEMENT INVESTMENT COMPANY AND AFFILIATED PURCHASERS. |
Not applicable.
| ITEM 10. | SUBMISSION OF MATTERS TO A VOTE OF SECURITY HOLDERS. |
Not applicable.
| ITEM 11. | CONTROLS AND PROCEDURES. |
| (a) | The registrant’s principal executive officer and principal financial officer have concluded that the registrant’s disclosure controls and procedures (as defined in Rule 30a- 3(c) under the Investment Company Act of 1940, as amended (the “1940 Act”)) are effective as of a date within 90 days of the filing date of this report that includes the disclosure required by this paragraph, based on their evaluation of the disclosure controls and procedures required by Rule 30a-3(b) under the 1940 Act and 15d-15(b) under the Securities Exchange Act of 1934. |
| (b) | There were no changes in the registrant’s internal control over financial reporting (as defined in Rule 30a-3(d) under the 1940 Act) that occurred during the second fiscal quarter of the period covered by this report that have materially affected, or are likely to materially affect the registrant’s internal control over financial reporting. |
| ITEM 12. | EXHIBITS. |
(a) (1) Not applicable.
Exhibit 99.CODE ETH
(a) (2) Certifications pursuant to section 302 of the Sarbanes-Oxley Act of 2002 attached hereto.
Exhibit 99.CERT
(b) Certifications pursuant to Section 906 of the Sarbanes-Oxley Act of 2002 attached hereto.
Exhibit 99.906CERT
SIGNATURES
Pursuant to the requirements of the Securities Exchange Act of 1934 and the Investment Company Act of 1940, the registrant has duly caused this Report to be signed on its behalf by the undersigned, there unto duly authorized.
| Western Asset Middle Market Debt Fund Inc. | ||
| By: | /s/ Kenneth D. Fuller | |
| Kenneth D. Fuller | ||
| Chief Executive Officer | ||
| Date: | December 23, 2014 | |
Pursuant to the requirements of the Securities Exchange Act of 1934 and the Investment Company Act of 1940, this report has been signed below by the following persons on behalf of the registrant and in the capacities and on the dates indicated.
| By: | /s/ Kenneth D. Fuller | |
| Kenneth D. Fuller | ||
| Chief Executive Officer | ||
| Date: December 23, 2014 | ||
| By: | /s/ Richard F. Sennett | |
| Richard F. Sennett | ||
| Principal Financial Officer | ||
| Date: | December 23, 2014 | |