Exhibit 99.1
Investor Meetings
March 2013
1
Forward-Looking Statements TM
Some of the information included in this presentation constitutes “forward-looking statements” as defined in Section 27A of the Securities Act of 1933, as amended and Section 21E of the Securities Exchange Act of 1934, as amended. All statements in this presentation that express opinions, expectations, beliefs, plans, objectives, assumptions or projections with respect to anticipated future performance of SunCoke or the Partnership, in contrast with statements of historical facts, are forward-looking statements. Such forward-looking statements are based on management’s beliefs and assumptions and on information currently available. Forward-looking statements include information concerning possible or assumed future results of operations, business strategies, financing plans, competitive position, potential growth opportunities, potential operating performance improvements, the effects of competition and the effects of future legislation or regulations. Forward-looking statements include all statements that are not historical facts and may be identified by the use of forward-looking terminology such as the words “believe,” “expect,” “plan,” “intend,” “anticipate,” “estimate,” “predict,” “potential,” “continue,” “may,” “will,” “should” or the negative of these terms or similar expressions.
Although management believes that its plans, intentions and expectations reflected in or suggested by the forward-looking statements made in this presentation are reasonable, no assurance can be given that these plans, intentions or expectations will be achieved when anticipated or at all. Moreover, such statements are subject to a number of assumptions, risks and uncertainties. Many of these risks are beyond the control of SunCoke and the Partnership, and may cause actual results to differ materially from those implied or expressed by the forward-looking statements. Each of SunCoke and the Partnership has included in its filings with the Securities and Exchange Commission (including, in the case of the Partnership, its Form S-1) cautionary language identifying important factors (but not necessarily all the important factors) that could cause actual results to differ materially from those expressed in any forward-looking statement. For more information concerning these factors, see the Securities and Exchange Commission filings of SunCoke and the Partnership. All forward-looking statements included in this presentation are expressly qualified in their entirety by such cautionary statements.
Although forward-looking statements are based on current beliefs and expectations, caution should be taken not to place undue reliance on any such forward-looking statements because such statements speak only as of the date hereof. SunCoke and the Partnership do not have any intention or obligation to update publicly any forward-looking statement (or its associated cautionary language) whether as a result of new information or future events or after the date of this presentation, except as required by applicable law.
This presentation includes certain non-GAAP financial measures intended to supplement, not substitute for, comparable GAAP measures. Reconciliations of non-GAAP financial measures to GAAP financial measures are provided in the Appendix at the end of the presentation. Investors are urged to consider carefully the comparable GAAP measures and the reconciliations to those measures provided in the Appendix.
Investor Meetings—March 2013
ABOUT SUNCOKE
About SunCoke
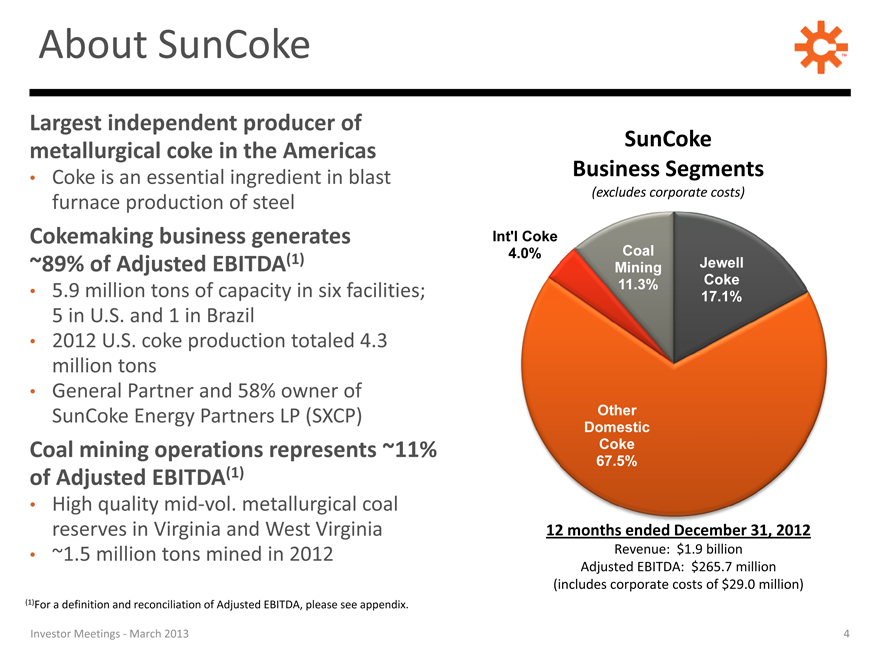
Largest independent producer of metallurgical coke in the Americas
Coke is an essential ingredient in blast furnace production of steel
Cokemaking business generates ~89% of Adjusted EBITDA(1)
5.9 million tons of capacity in six facilities; 5 in U.S. and 1 in Brazil
2012 U.S. coke production totaled 4.3 million tons
General Partner and 58% owner of SunCoke Energy Partners LP (SXCP)
Coal mining operations represents ~11% of Adjusted EBITDA(1)
High quality mid-vol. metallurgical coal reserves in Virginia and West Virginia
~1.5 million tons mined in 2012
(1)For a definition and reconciliation of Adjusted EBITDA, please see appendix.
Investor Meetings—March 2013
SunCoke
Business Segments
(excludes corporate costs)
Int’lCoke
Mining Jewell
17.1%
Other
Domestic
Coke
67.5%
12 months ended December 31, 2012
Revenue: $1.9 billion
Adjusted EBITDA: $265.7 million
(includes corporate costs of $29.0 million)
The Leading Independent Cokemaker
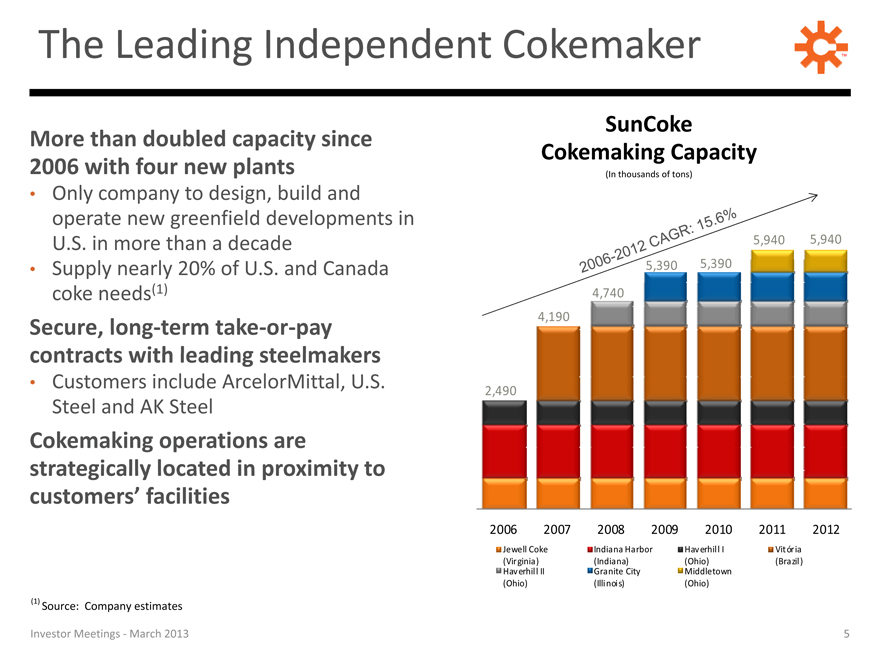
More than doubled capacity since 2006 with four ur new plants lan
Only company to design, build and operate new greenfield developments in U.S. in more than a decade
Supply nearly 20% of U.S. and Canada coke needs(1)
Secure, long-term take-or-pay contracts with leading steelmakers
Customers include ArcelorMittal, U.S. Steel and AK Steel
Cokemaking operations are strategically located in proximity to customers’ facilities
SunCoke
Cokemaking Capacity
(In thousands of tons)
5,940 5,940
5,390 5,390
4,740
4,190
2,490
2006 2007 2008 2009 2010 2011 2012
Jewell Coke Indiana Harbor Haverhill I Vitória
(Virginia)(Indiana)(Ohio)(Brazil)
Haverhill II Granite City Middletown
(Ohio)(Illinois)(Ohio)
Source: Company estimates
Investor Meetings—March 2013

SunCoke Operations
Our cokemaking operations are strategically located in
proximity to our customers’ integrated steelmaking facilities
Indiana Middletown*
Harbor
Granite
City
Haverhill 1* Haverhill 2*
Jewell Coal
Coke Mining
114M tons of
reserves
Our metallurgical coal
Vitoria, mining business is located
Brazil in Central Appalachia
Investor Meetings—March 2013
*65% owned by SXCP

STEELMAKING, COKE
& SUNCOKE’S COKEMAKING TECHNOLOGY
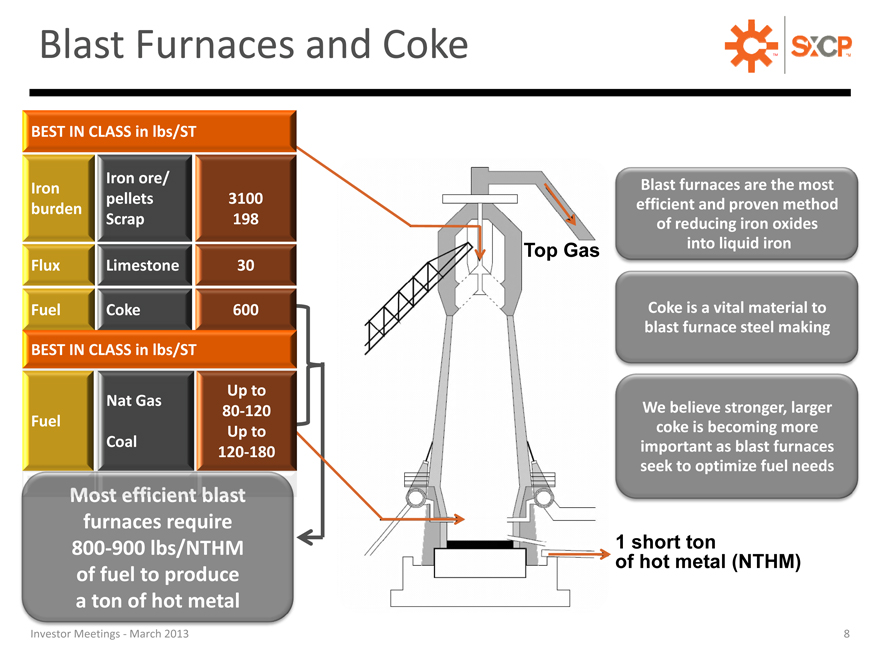
Blast Furnaces and Coke
BEST IN CLASS in lbs/ST
Iron ore/
Iron
pellets 3100
burden
Scrap 198
Flux Limestone 30
Fuel Coke 600
BEST IN CLASS in lbs/ST
Up to
Nat Gas
80-120
Fuel
Up to
Coal
120-180
furnaces require
800-900 lbs/NTHM
of fuel to produce
a ton of hot metal
Investor Meetings—March 2013
Blast furnaces are the most
efficient and proven method
of reducing iron oxides
Top Gas into liquid iron
Coke is a vital material to
blast furnace steel making
We believe stronger, larger
coke is becoming more
important as blast furnaces
seek to optimize fuel needs
of hot metal (NTHM)
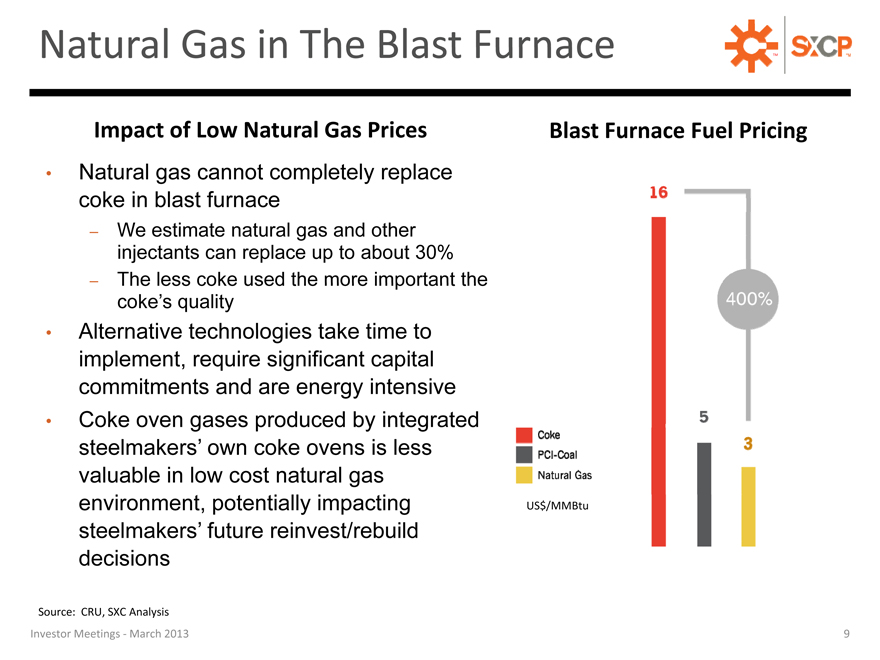
Natural Gas in The Blast Furnace
Impact of Low Natural Gas Prices
Natural gas cannot completely replace coke in blast furnace
We estimate natural gas and other injectants can replace up to about 30%
The less coke used the more important the coke’s quality
Alternative technologies take time to implement, require significant capital commitments and are energy intensive Coke oven gases produced by integrated steelmakers’ own coke ovens is less valuable in low cost natural gas environment, potentially impacting steelmakers’ future reinvest/rebuild decisions
Blast Furnace Fuel Pricing
US$/MMBtu
Source: CRU, SXC Analysis
Investor Meetings—March 2013
9
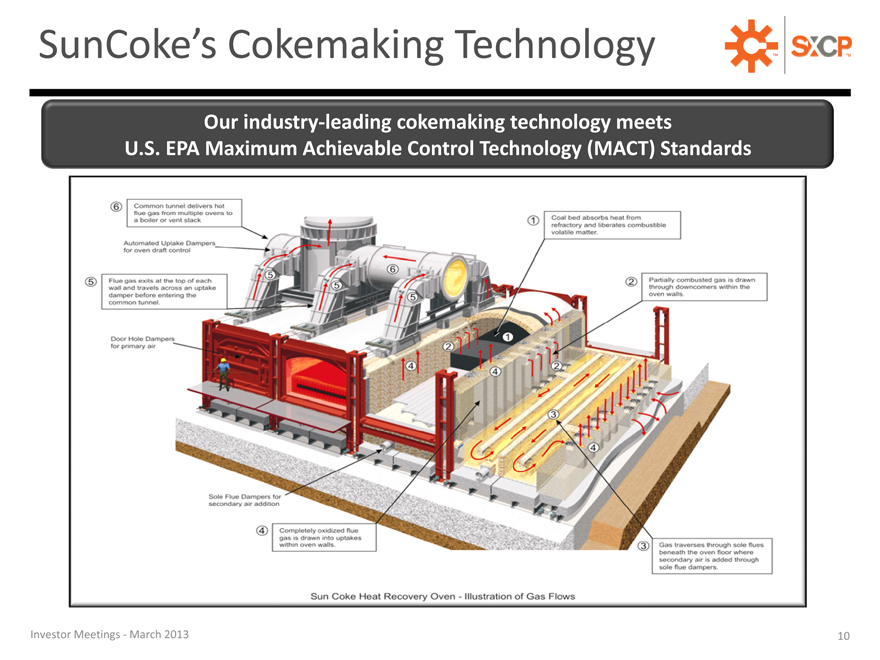
SunCoke’s Cokemaking Technology
Our industry-leading cokemaking technology meets U.S. EPA Maximum Achievable Control Technology (MACT) Standards
Investor Meetings—March 2013
10
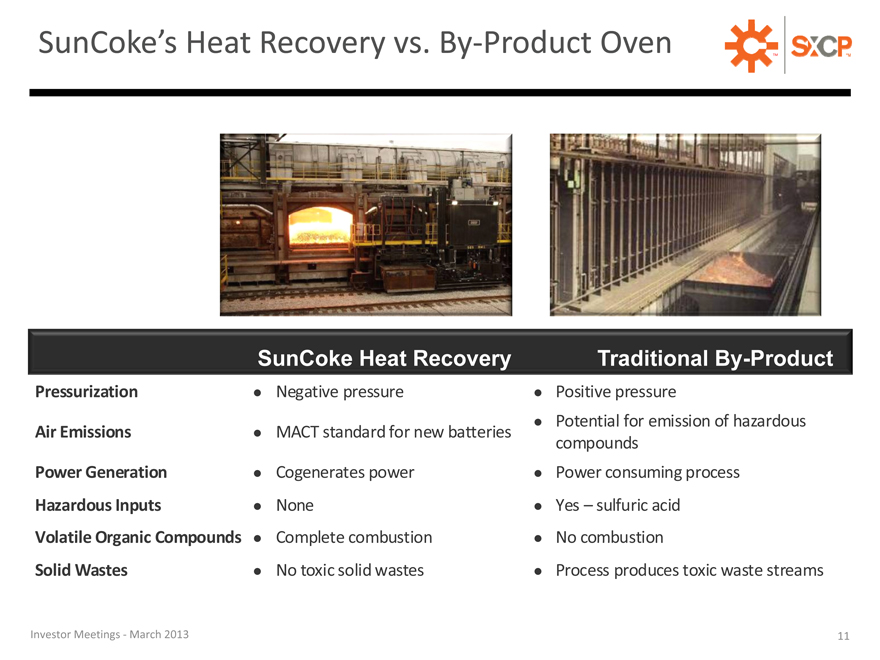
SunCoke’s Heat Recovery vs. By-Product Oven
SunCoke Heat Recovery Traditional By-Product
Pressurization Negative pressure Positive pressure
Potential for emission of hazardous
Air Emissions MACT standard for new batteries
compounds
Power Generationio Cogenerates power Power consumingon ng process
Hazardous Inputs None Yes sulfuric acid
Volatile Organic Compounds Complete combustion No combustion
Solid Wastes No toxic solid wastes Process produces toxic waste streams
Investor Meetings—March 2013
11
SUNCOKE S VALUE PROPOSITION & CONTRACT PROVISIONS
12
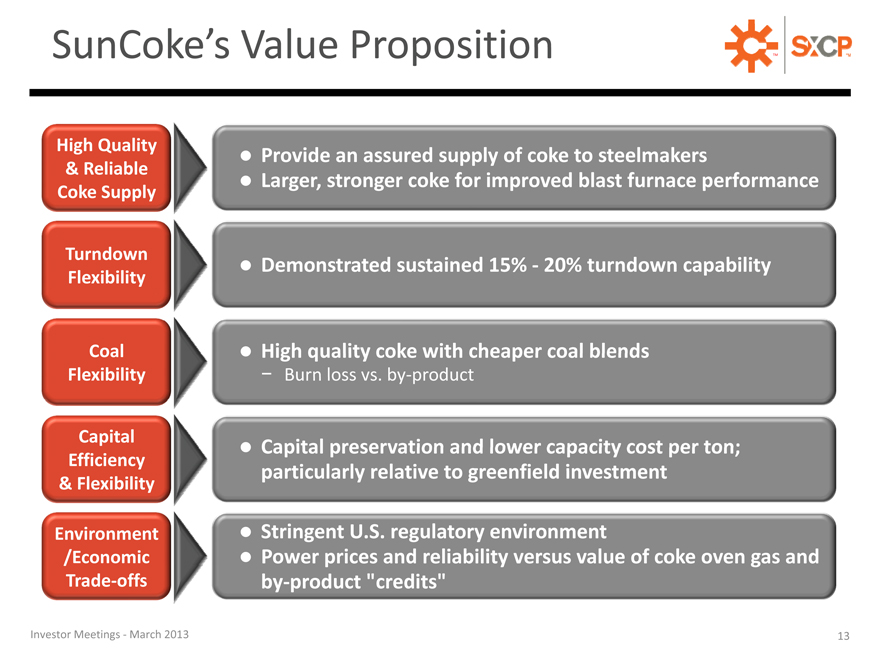
SunCoke’s Value Proposition
High Quality Provide an assured supply of coke to steelmakers
& Reliable
Coke Supply Larger, stronger coke for improved blast furnace performance
Turndown Demonstrated sustained 15%—20% turndown capability
Flexibility
Coal High quality coke with cheaper coal blends
Flexibility—Burn loss vs. by-product
Capital Capital preservation and lower capacity cost per ton;
Efficiency
& Flexibility particularly relative to greenfield investment
Environment Stringent U.S. regulatory environment
/Economic Power prices and reliability versus value of coke oven gas and
Trade-offs by-product “credits”
Investor Meetings—March 2013
13
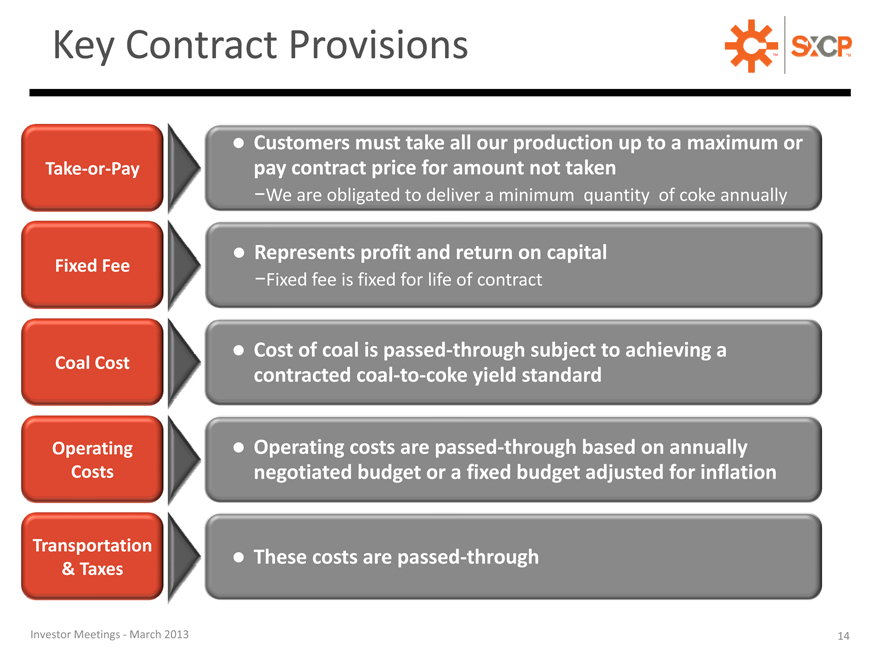
Key Contract Provisions
Customers must take all our production up to a maximum or
Take-or-Pay pay contract price for amount not taken
-We are obligated to deliver a minimum quantity of coke annually
Represents profit and return on capital
Fixed Fee
-Fixed fee is fixed for life of contract
Cost of coal is passed-through subject to achieving a
Coal Cost
contracted coal-to-coke yield standard
Operating Operating costs are passed-through based on annually
Costs negotiated budget or a fixed budget adjusted for inflation
Transportation These costs are passed-through
& Taxes
Investor Meetings—March 2013
14

GROWTH STRATEGY
15
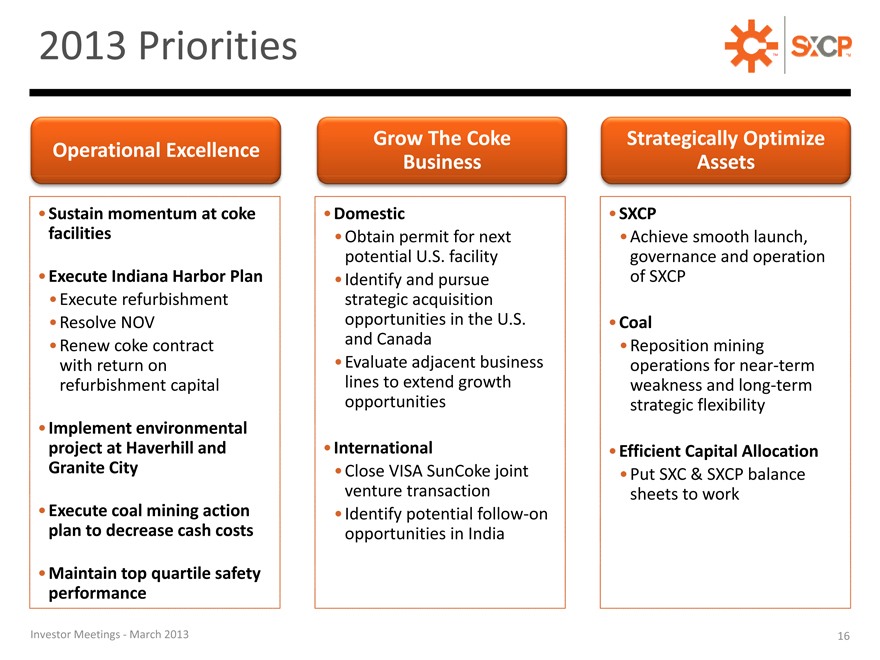
2013 Priorities TM
Operational Excellence Grow The Coke Strategically Optimize
Business Assets
Sustain momentum at coke Domestic SXCP
facilities Obtain permit for next Achieve smoothmooth launch,
potential U.S. facility governance and operation
Execute Indiana Harbor Plan Identify and pursue of SXCP
Execute refurbishment strategic acquisition
Resolve NOV opportunities in the U.S. Coal
Renew coke contract and Canada Reposition mining
with return on Evaluate adjacent business operations for near-term
refurbishment capital lines to extend growth weakness and long-term
opportunities strategic flexibility
Implement environmental
project at Haverhill and International Efficient Capital Allocation
Granite City Close VISA SunCoke joint Put SXC & SXCP balance
venture transaction sheets to work
Execute coal mining action Identify potential follow-on
plan to decrease cash costs opportunities in India
Maintain top quartile safety
performance
Investor Meetings—March 2013 16
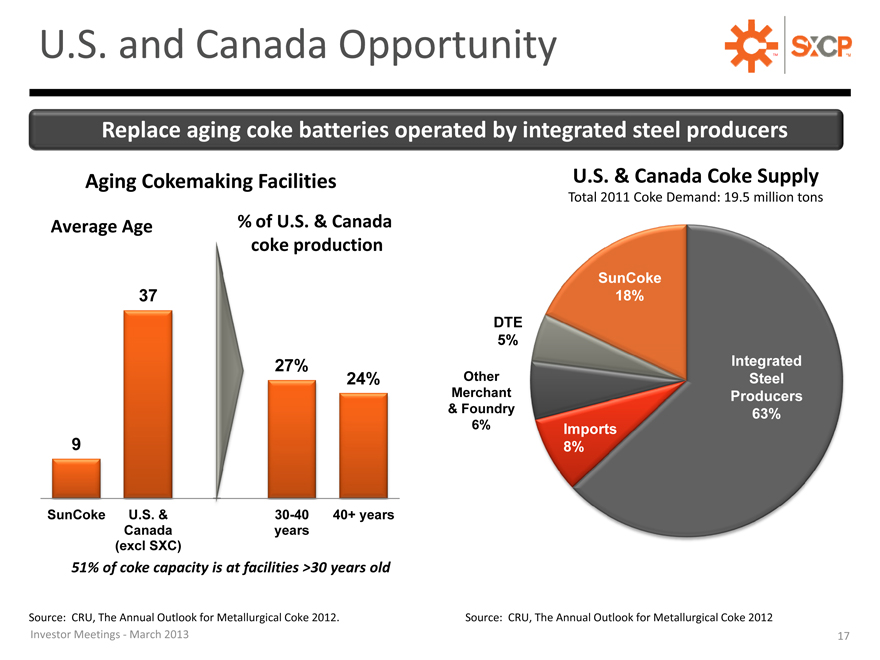
U.S. and Canada Opportunity
Replace aging coke batteries operated by integrated steel producers
Aging Cokemaking Facilities
Average Age% of U.S. & Canada
coke production
37
27%
24%
9
SunCoke U.S. & 30-40 40+ years
Canada years
(excl SXC)
51% of coke capacity is at facilities >30 years old
U.S. & Canada Coke Supply
Total 2011 Coke Demand: 19.5 million tons
SunCoke
18%
DTE
5%
Integrated
Other Steel
Merchant Producers
& Foundry 63%
6% Imports
8%
Source: CRU, The Annual Outlook for Metallurgical Coke 2012. Investor Meetings—March 2013
Source: CRU, The Annual Outlook for Metallurgical Coke 2012
17
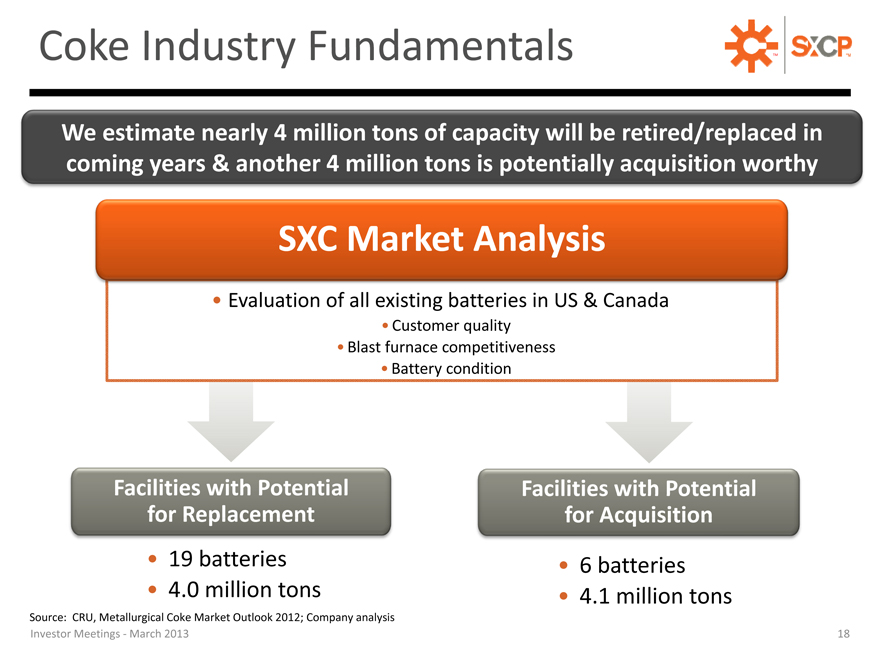
Coke Industry Fundamentals
We estimate nearly 4 million tons of capacity will be retired/replaced in coming years & another 4 million tons is potentially acquisition worthy
SXC Market Analysis
Evaluation of all existing batteries in US & Canada
Customer quality
Blast furnace competitiveness
Battery condition
Facilities with Potential Facilities with Potential
for Replacement for Acquisition
4.0 | | million tons 4.1 million tons |
Source: CRU, Metallurgical Coke Market Outlook 2012; Company analysis Investor Meetings—March 2013
18
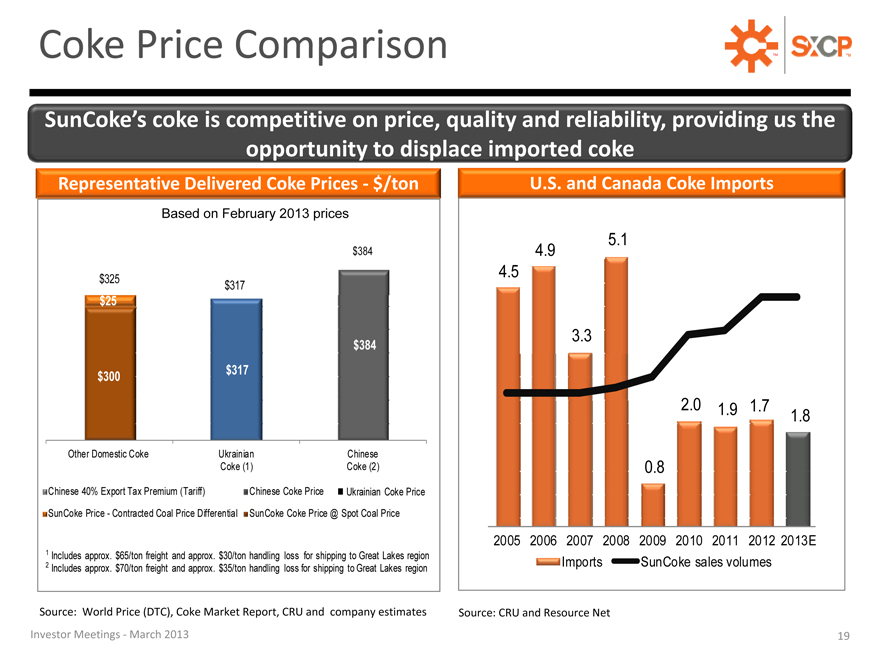
Coke Price Comparison
SunCoke s coke is competitive on price, quality and reliability, providing us the opportunity to displace imported coke
Representative Delivered Coke Prices—$/ton
Based on Februaryebruary 2013 prices
$384
$325 $317
$25
$384
$300 $317
Other Domestic Coke Ukrainian Chinese
Coke (1) Coke (2)
Chinese 40% Export Tax Premium (Tariff) Chinese Coke Price ??Ukrainian Coke Price
SunCoke Price—Contracted Coal Price Differential SunCoke Coke Price @ Spot Coal Price
1 | | Includes approx. $65/ton freight and approx. $30/ton handling loss for shipping to Great Lakes region |
2 | | Includes approx. $70/ton freight and approx. $35/ton handling loss for shipping to Great Lakes region |
Source: World Price (DTC), Coke Market Report, CRU and company estimates
Investor Meetings—March 2013
U.S. and Canada Coke Imports
4.5
3.3
0 8.
2005 2006 2007 2008 2009 2010 2011 2012 2013E
Imports SunCoke sales volumes
Source: CRU and Resource Net
19
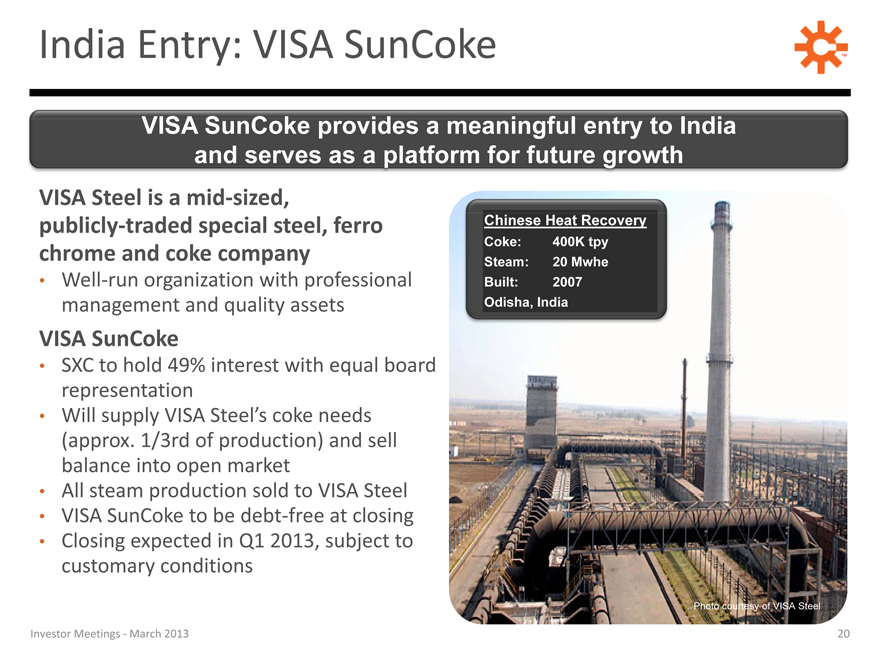
India Entry: VISA SunCoke
VISA SunCoke provides a meaningful entry to India and serves as a platform for future growth
VISA Steel is a mid-sized,
publicly-traded special steel, ferro
chrome and coke company
Well-run organization with professional
management and quality assets
VISA SunCoke
SXC to hold 49% interest with equal board
representation
Will supply VISA Steel’s coke needs
(approx. 1/3rd of production) and sell
balance into open market
All steam production sold to VISA Steel
VISA SunCoke to be debt-free at closing
Closing expected in Q1 2013, subject to
customary conditions
Chinese Heat Recovery
Coke: 400K tpy
Steam: 20 Mwhe
Built: 2007
Odisha, India
Photo courtesy of VISA Steel
Investor Meetings—March 2013
20

Our India Strategy
Initial Entry Near- ermTerm Long- ermTerm
Growth Vision
Form VISA Grow VISA Continue to
SunCoke joint SunCoke via leverage JV
venture follow-on and in-country
opportunities presence
Evaluate &
improve Reinvest free Pursue “Build-
existing asset cash flow Own-Operate”
operations model with
Utilize debt leading
Establish capacity of integrated
market VISA SunCoke steelmakers
presence
Develop
emerging
market plant
design
Investor Meetings—March 2013
21
SUNCOKE’S FINANCIAL RESULTS
22
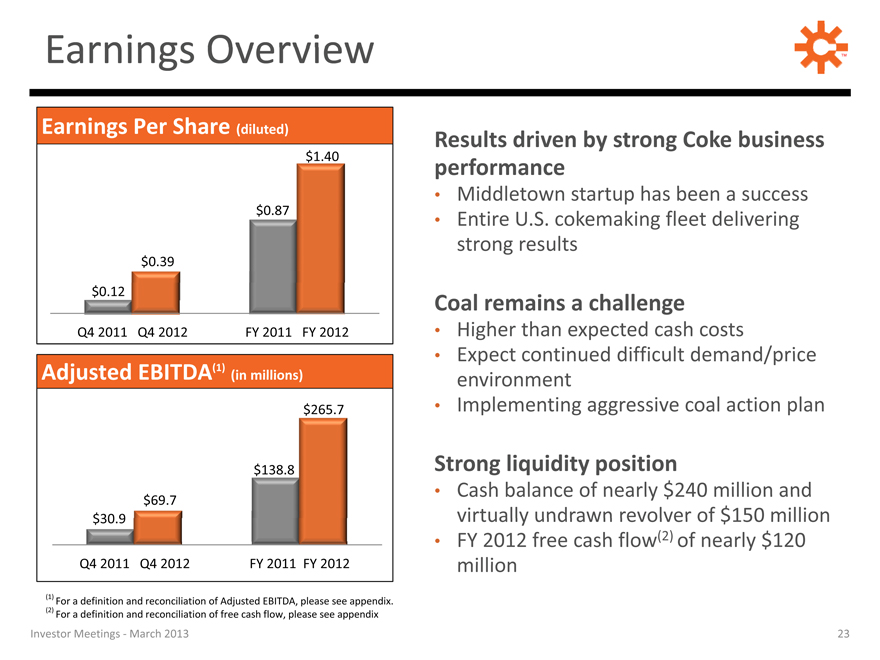
Earnings Overview
Results driven by strong Coke business performance
Middletown startup has been a success
Entire U.S. cokemaking fleet delivering strong results
Coal remains a challenge
Higher than expected cash costs
Expect continued inued difficult ficult demand/price environment
Implementing aggressive coal action plan
Strong liquidity position
Cash balance of nearly $240 million and virtually undrawn revolver of $150 million
FY 2012 free cash flow(2) of nearly $120 million
(diluted)
$1.40
$0.87
$0.39
$0.12
Q4 2011 Q4 2012 FY 2011 FY 2012
Adjusted EBITDA(1) (in millions)
$265.7
$138.8
$69.7
.
Q4 2011 Q4 2012 FY 2011 FY 2012
(1) | | For a definition and reconciliation of Adjusted EBITDA, please see appendix. |
(2) | | For a definition and reconciliation of free cash flow, please see appendix |
Investor Meetings—March 2013
23
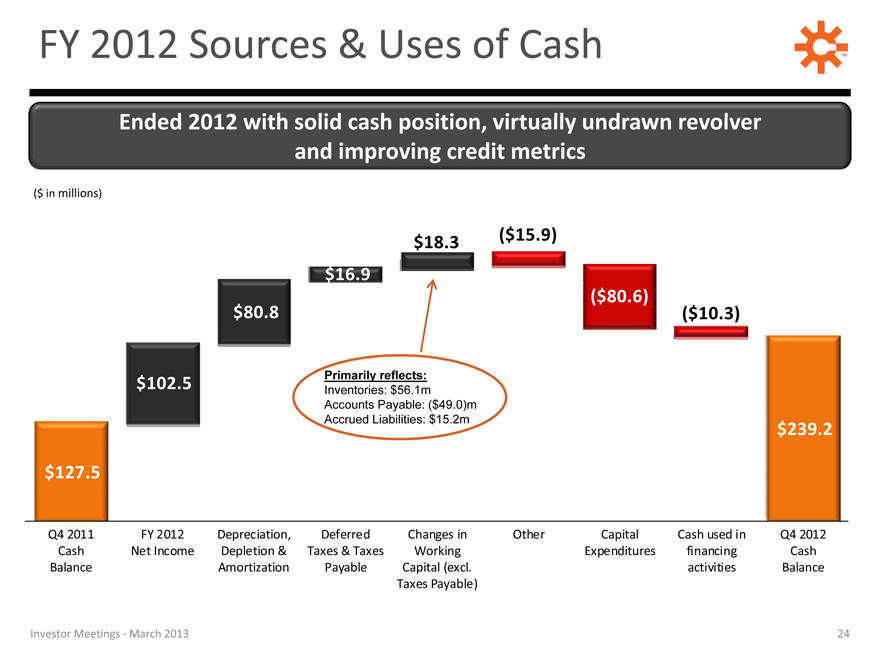
FY 2012 Sources & Uses of Cash
Ended 2012 with solid cash position, virtually undrawn revolver and improving credit metrics
($ in millions)
$18.3($15.9)
$16.9
($80.6)
$80.8($10.3)
Primarily reflects:
$102.5 | | Inventories: $56.1m |
Accounts Payable: ($49.0)m
Accrued Liabilities: $15.2m
$239.2
$127.5
Q4 2011 FY 2012 Depreciation, Deferred Changes in Other Capital Cash used in Q4 2012
Cash Net Income Depletion & Taxes & Taxes Working Expenditures financing Cash
Balance Amortization Payable Capital (excl. activities Balance
Taxes Payable)
Investor Meetings—March 2013
24
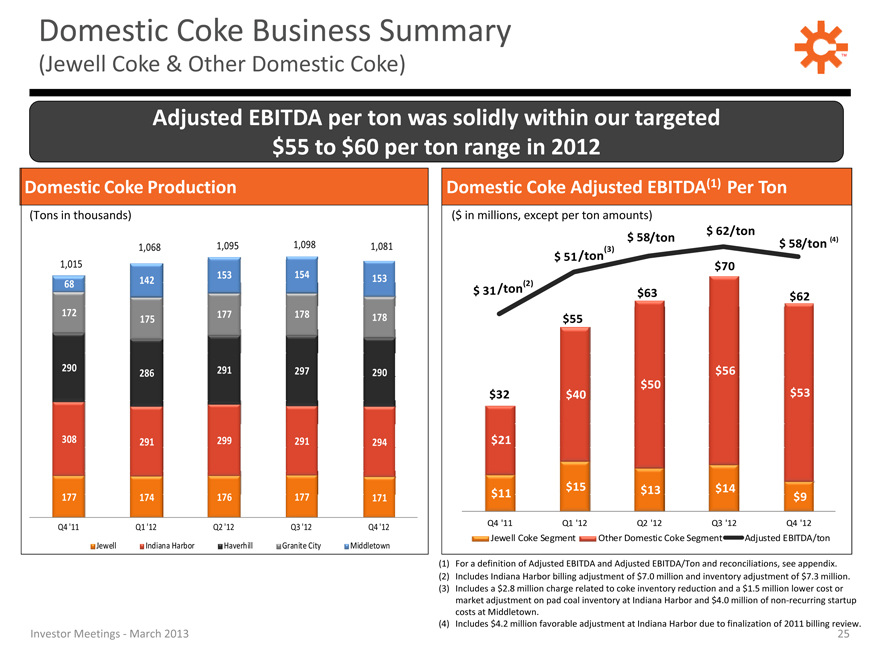
Domestic Coke Business Summary
(Jewell Coke & Other Domestic Coke)
Adjusted EBITDA per ton was solidly within our targeted $55 to $60 per ton range in 2012
Domestic Coke Production
(Tons in thousands)
1,068 1,095 1,098 1,081
1,015
142 153 154 153
68
172 175 177 178 178
290 286 291 297 290
308 291 299 291 294
177 174 176 177 171
Q4 ‘11 Q1 ‘12 Q2 ‘12 Q3 ‘12 Q4 ‘12
Jewell Indiana Harbor Haverhill Granite City Middletown
Domestic Coke Adjusted EBITDA(1) Per Ton
($ in millions, except per ton amounts)
$ 62/ton
$ 58/ton(4)
$ 51 /ton
$70
$ 31 /ton(2) $63
$62
$55
$56
$50
$32 $40 $53
$21
$15 $13 $14
$11 $9
Q4 ‘11 Q1 ‘12 Q2 ‘12 Q3 ‘12 Q4 ‘12
Jewell Coke Segment Other Domestic Coke Segment Adjusted EBITDA/ton
(1) | | For a definition of Adjusted EBITDA and Adjusted EBITDA/Ton and reconciliations, see appendix. |
(2) | | Includes Indiana Harbor billing adjustment of $7.0 million and inventory adjustment of $7.3 million. |
(3) | | Includes a $2.8 million charge related to coke inventory reduction and a $1.5 million lower cost or |
market adjustment on pad coal inventory at Indiana Harbor and $4.0 million of non-recurring startup
costs at Middletown.
(4) | | Includes $4.2 million favorable adjustment at Indiana Harbor due to finalization of 2011 billing review. |
Investor Meetings—March 2013
25
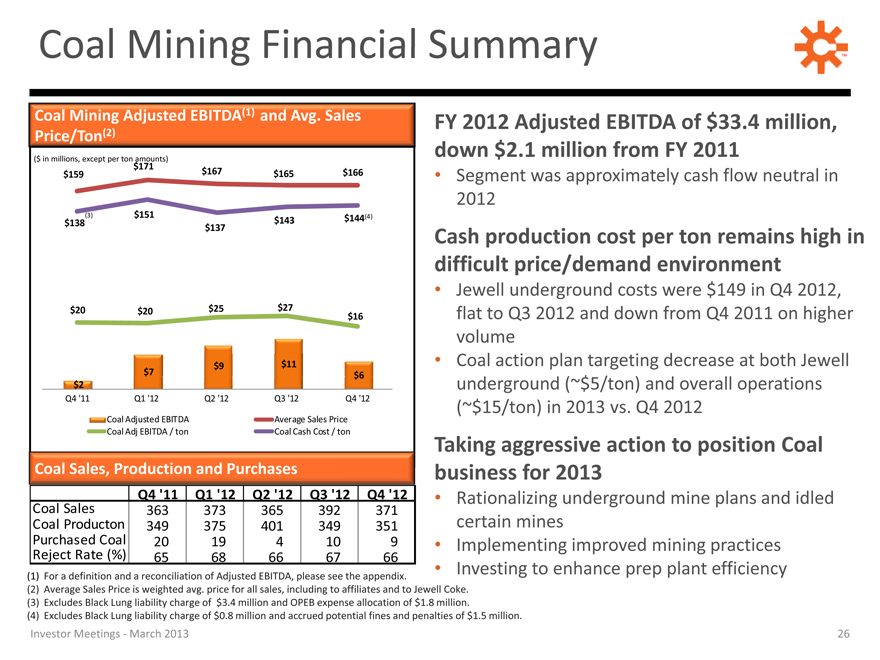
Coal Mining Financial Summary
Coal Mining Adjusted EBITDA(1) and Avg. Sales
Price/Ton(2)
($ in millions, except per ton amounts)
$171 $167
$159 $165 $166
$138 (3) $151 $143 $144(4)
$137
$20 $20 $25 $27 $16
$9 $11
$7 $6
$2
Q4 ‘11 Q1 ‘12 Q2 ‘12 Q3 ‘12 Q4 ‘12
Coal Adjusted EBITDA Average Sales Price
Coal Adj EBITDA / ton Coal Cash Cost / ton
Coal Sales, Production and Purchases
Q4 ‘11 Q1 ‘12 Q2 ‘12 Q3 ‘12 Q4 ‘12
Coal Sales 363 373 365 392 371
Coal Producton 349 375 401 349 351
Purchased Coal 20 19 4 10 9
Reject Rate (%) 65 68 66 67 66
FY 2012 Adjusted EBITDA of $33.4 million, down $2.1 million from FY 2011
Segment was approximately cash flow neutral in 2012
Cash production cost per ton remains high in difficult price/demand environment
Jewell underground costs were $149 in Q4 2012, flat to Q3 2012 and down from Q4 2011 on higher volume
Coal action plan targeting decrease at both Jewell underground (~$5/ton) and overall operations
(~$15/ton) in 2013 vs. Q4 2012
Taking aggressive action to position Coal business for or 2013
Rationalizing underground mine plans and idled certain mines
Implementing improved mining practices
Investing to enhance prep plant efficiency
(1) | | For a definition and a reconciliation of Adjusted EBITDA, please see the appendix. |
(2) Average Sales Price rice is weighted avg. price rice for all sales, including to affiliates and nd to Jewell Coke. (3) Excludes Black Lung liability charge of $3.4 million and OPEB expense allocation of $1.8 million.
(4) | | Excludes Black Lung liability charge of $0.8 million and accrued potential fines and penalties of $1.5 million. |
Investor Meetings—March 2013
26

SUNCOKE ENERGY PARTNERS, LP RESULTS
27
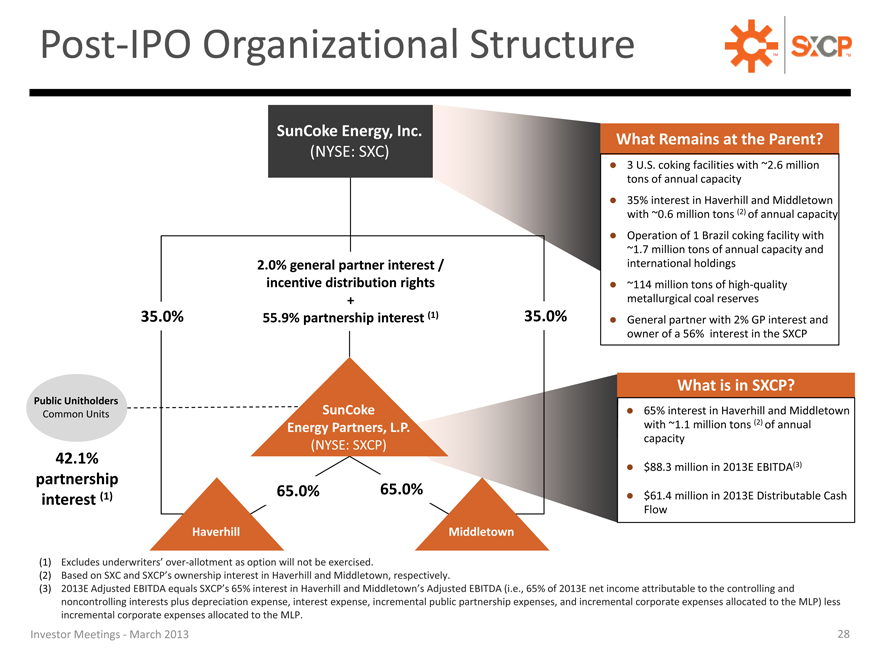
Post-IPO Organizational Structure
SunCoke Energy, Inc.
(NYSE: SXC)
2.0% general partner interest /
incentive distribution rights
+
35.0% | | 55.9% partnership interest (1) 35.0% |
Public UnitholdersUnitholders
Common Units SunCoke
Energy Partners, L.
(NYSE: SXCP)
42.1%
partnership
interest (1) 65.0% 65.0%
Haverhill Middletown
What Remains at the Parent?
3 | | U.S. coking facilities with ~2.6 million tons of annual capacity |
35% interest in Haverhill and Middletown with ~0.6 million tons (2) of annual capacity Operation of 1 Brazil coking facility with ~1.7 million tons of annual capacity and international holdings
~114 million tons of high-quality metallurgical coal reserves
General partner with 2% GP interest and owner of a 56% interest in the SXCP
What is in SXCP?
?65% interest in Haverhill and Middletown with ~1.1 million tons (2) of annual capacity
?$88.3 million in 2013E EBITDA(3)
?$61.4 million in 2013E Distributable Cash Flow
(1) | | Excludes underwriters’ over-allotment as option will not be exercised. |
(2) | | Based on SXC and SXCP’s ownership interest in Haverhill and Middletown, respectively. |
(3) 2013E Adjusted EBITDA equals SXCP’s 65% interest in Haverhill and Middletown’s Adjusted EBITDA (i.e., 65% of 2013E net income attributable to the controlling and noncontrolling interests plus depreciation expense, interest expense, incremental public partnership expenses, and incremental corporate expenses allocated to the MLP) less incremental corporate expenses allocated to the MLP.
Investor Meetings—March 2013
28
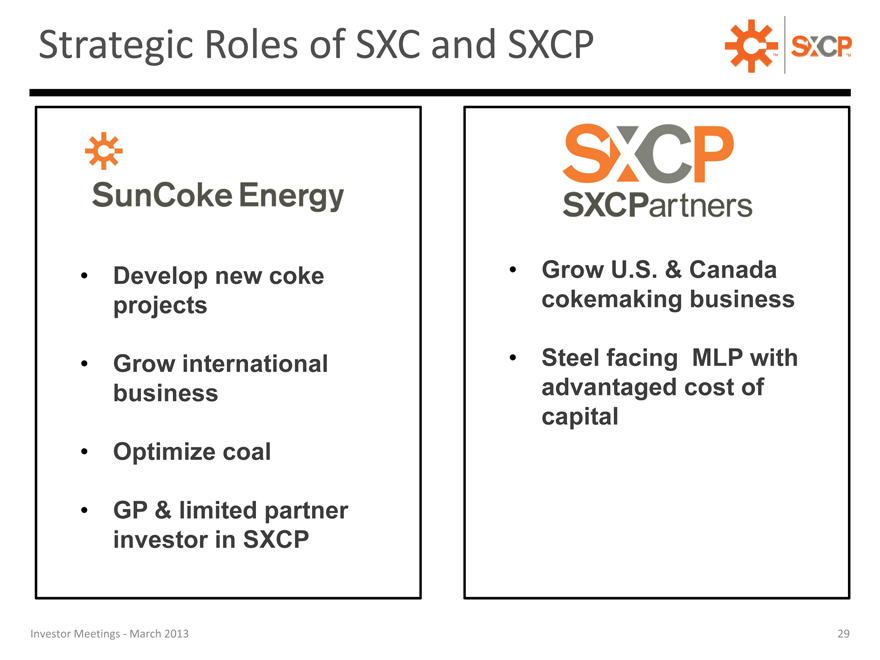
Strategic Roles of SXC and SXCP
Develop new coke projects
Grow international business
Optimize coal
GP & limited partner investor in SXCP
Grow U.S. & Canada cokemaking business
Steel facing MLP with advantaged cost of capital
Investor Meetings—March 2013
29
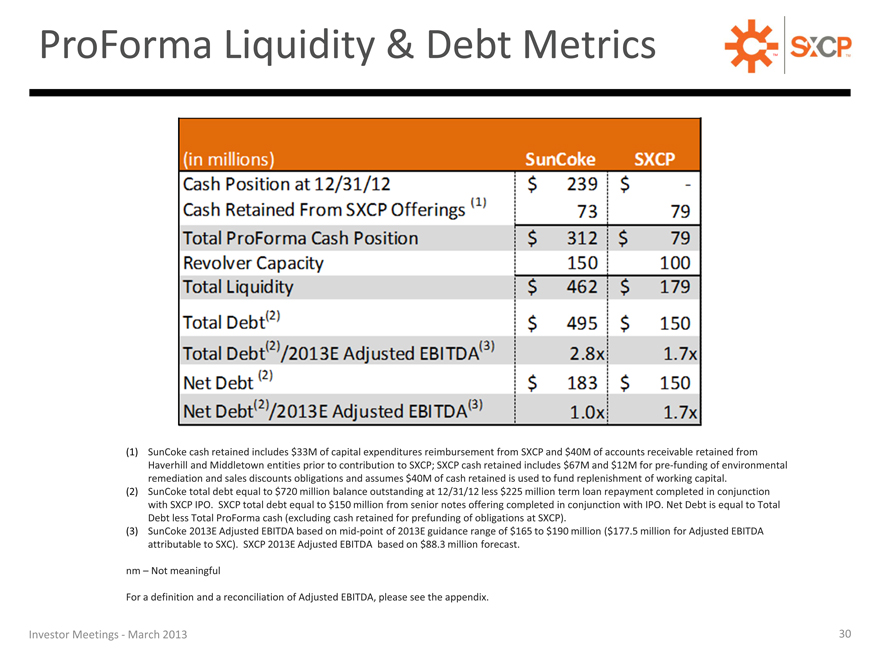
ProForma Liquidity & Debt Metrics
(1) SunCoke cash retained includes $33M of capital expenditures reimbursement from SXCP and $40M of accounts receivable retained from Haverhill and Middletown entities prior to contribution to SXCP; SXCP cash retained includes $67M and $12M for pre-funding of environmental remediation and sales discounts obligations and assumes $40M of cash retained is used to fund replenishment of working capital.
(2) SunCoke total debt equal to $720 million balance outstanding at 12/31/12 less $225 million term loan repayment completed in conjunction with SXCP IPO. SXCP total debt equal to $150 million from senior notes offering completed in conjunction with IPO. Net Debt is equal to Total Debt less Total ProForma cash (excluding cash retained for prefunding of obligations at SXCP).
(3) SunCoke 2013E Adjusted EBITDA based on mid-point of 2013E guidance range of $165 to $190 million ($177.5 million for Adjusted EBITDA attributable to SXC). SXCP 2013E Adjusted EBITDA based on $88.3 million forecast.
nm Not meaningful
For a definition and a reconciliation of Adjusted EBITDA, please see the appendix.
Investor Meetings—March 2013
30
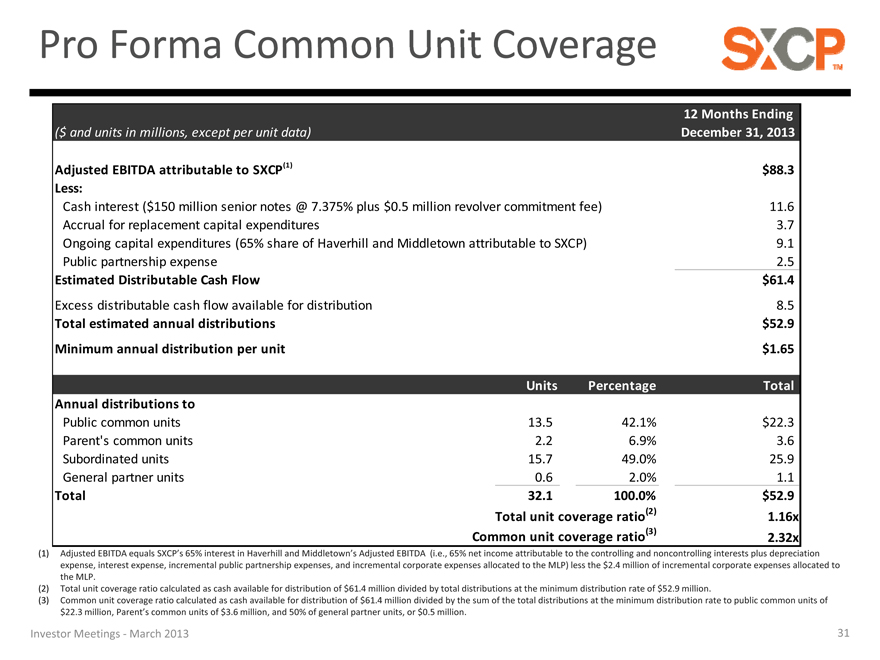
Pro Forma Common Unit Coverage
12 Months Ending
($ and units in millions, except per unit data) December 31, 2013
Adjusted EBITDA attributable to SXCP(1) $88.3
Less:
Cash interest ($150 million senior notes @ 7.375% plus $0.5 million revolver commitment fee) 11.6
Accrual for replacement capital expenditures 3.7
Ongoing capital expenditures (65% share of Haverhill and Middletown attributable to SXCP) 9.1
Public partnership expense 2.5
Estimated Distributable Cash Flow $61.4
Excess distributable cash flow available for distribution 8.5
Total estimated annual distributions $52.9
Minimum annual distribution per unit $1.65
Units Percentage Total
Annual distributions to
Public common units 13.5 42.1% $22.3
Parent’s common units 2.2 6.9% 3.6
Subordinated units 15.7 49.0% 25.9
General partner units 0.6 2.0% 1.1
Total 32.1 100.0% $52.9
Total unit coverage ratio(2) 1.16x
Common unit coverage ratio(3) 2.32x
(1) Adjusted EBITDA equals SXCP’s 65% interest in Haverhill and Middletown’s Adjusted EBITDA (i.e., 65% net income attributable to the controlling and noncontrolling interests plus depreciation expense, interest expense, incremental public partnership expenses, and incremental corporate expenses allocated to the MLP) less the $2.4 million of incremental corporate expenses allocated to the MLP.
(2) Total unit coverage ratio calculated as cash available for distribution of $61.4 million divided by total distributions at the minimum distribution rate of $52.9 million.
(3) Common unit coverage ratio calculated as cash available for distribution of $61.4 million divided by the sum of the total distributions at the minimum distribution rate to public common units of $22.3 million, Parent’s common units of $3.6 million, and 50% of general partner units, or $0.5 million.
Investor Meetings—March 2013
31

2013 GUIDANCE
32
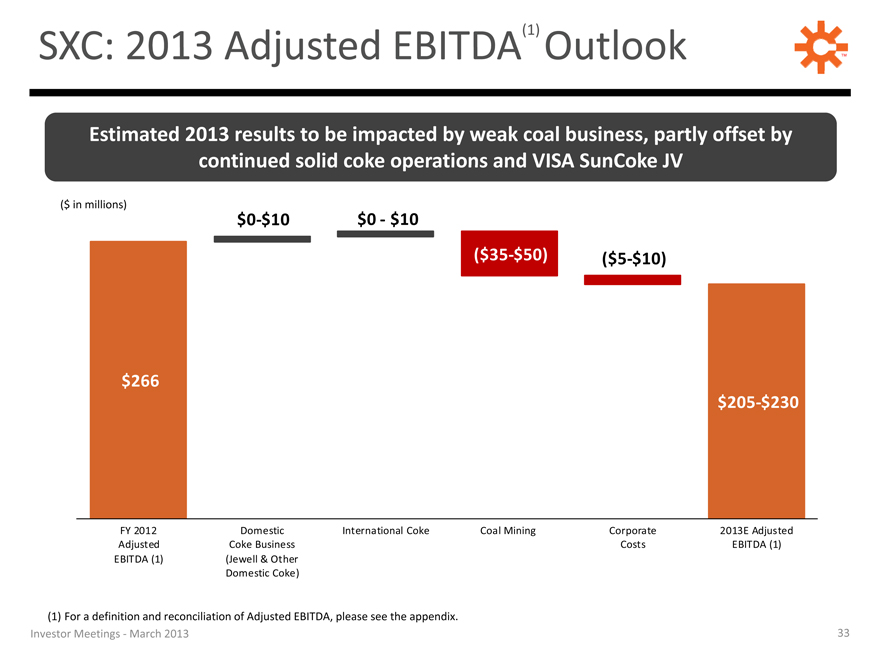
SXC: 2013 Adjusted EBITDA(1) Outlook
Estimated 2013 results to be impacted by weak coal business, partly offset by continued solid coke operations and VISA SunCoke JV
($ in millions)
$0-$10 $0—$10
($35-$50)($5-$10)
$266
$205-$230
FY 2012 Domestic International Coke Coal Mining Corporate 2013E Adjusted
Adjusted Coke Business Costs EBITDA (1)
EBITDA (1)(Jewell & Other
Domestic Coke)
(1) | | For a definition and reconciliation of Adjusted EBITDA, please see the appendix. Investor Meetings—March 2013 |
33

SXC: 2013 Diluted Earnings Per Share Outlook
(1),
EPS outlook reflects lower 2013E Adjusted EBITDA accelerated depreciation due to refurbishments and public ownership of SXCP
($0.45-
$0.80)
~($0.07)
~($0.30)
~$0.10
$0.60-
$0.85
$0.30-
$0.55
FY 2012 EPS 2013E EBITDA 2013E 2013E Indiana 2013E 2013E EPS 2013E 2013E EPS 2013E Income 2013E EPS
(Diluted) Depreciation, Harbor Income Taxes(Consolidated) Incremental Impact of Tax Impact of Attributable
Depletion & Accelerated Interest SXCP Public SXCP to SXC
Amortization Depreciation Expense Unitholders Public(Diluted)
(before tax) Unitholders
(1) | | For a definition and reconciliation of Adjusted EBITDA, please see the appendix. Investor Meetings—March 2013 |
34
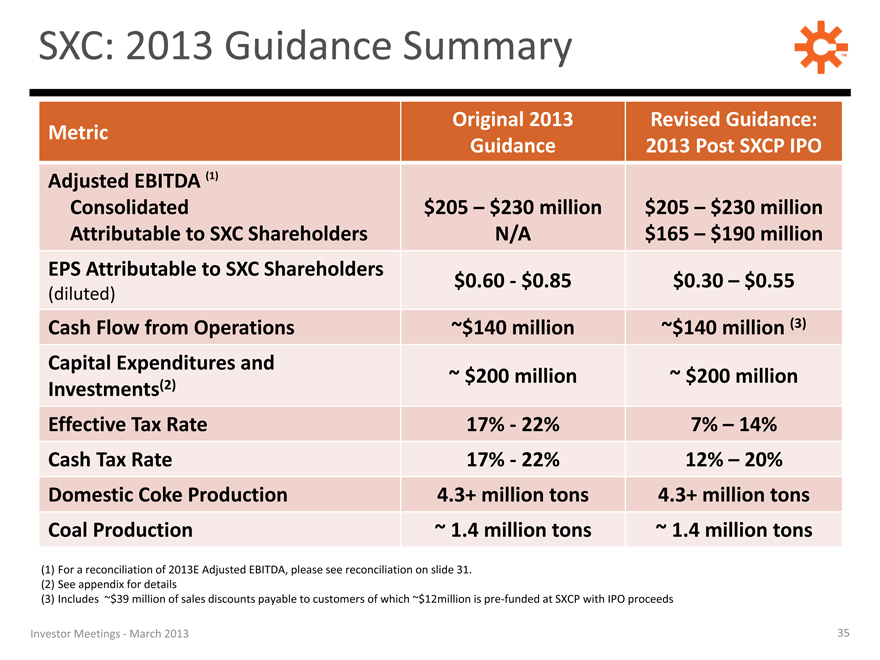
SXC: 2013 Guidance Summary
Original 2013 Revisedvised Guidance:uidance:
Metric
Guidance 2013 Post SXCP IPO
Adjusted EBITDA (1)
Consolidated $205 $230 million $205 $230 million
Attributable to SXC Shareholders N/A $165 $190 million
EPS Attributable to SXC Shareholders $0.60—$0.85 $0.30 $0.55
(diluted)
Cash Flow from Operations ~$140 million ~$140 million (3)
Capital Expenditures and
Investments(2) ~ $200 million ~ $200 million
Effective Tax Rate 17%—22% 7% 14%
Cash Tax Rate 17%—22% 12% 20%
Domestic Coke Production 4.3+ million tons 4.3+ million tons
Coal Production ~ 1.4 million tons ~ 1.4 million tons
(1) | | For a reconciliation of 2013E Adjusted EBITDA, please see reconciliation on slide 31. (2) See appendix for details |
(3) Includes ~$39 million of sales discounts payable to customers of which ~$12million is pre-funded at SXCP with IPO proceeds
Investor Meetings—March 2013
35
Investor Relations: 630-824-1907 www.suncoke.com
36

APPENDIX
37
Definitions
Adjusted EBITDA represents earnings before interest, taxes, depreciation, depletion and amortization (“EBITDA”) adjusted for sales discounts and the interest, taxes, depreciation, depletion and amortization attributable to equity earnings in our unconsolidated affiliates. EBITDA reflects sales discounts included as a reduction in sales and other operating revenue. The sales discounts represent the sharing with customers of a portion of nonconventional fuel tax credits, which reduce our income tax expense. However, we believe our Adjusted EBITDA would be inappropriately penalized if these discounts were treated as a reduction of EBITDA since they represent sharing of a tax benefit that is not included in EBITDA. Accordingly, in computing Adjusted EBITDA, we have added back these sales discounts. Our Adjusted EBITDA also includes EBITDA attributable to our unconsolidated affiliates. EBITDA and Adjusted EBITDA do not represent and should not be considered alternatives to net income or operating income under GAAP and may not be comparable to other similarly titled measures in other businesses. Adjusted EBITDA does not represent and should not be considered as an alternative to net income as determined by GAAP, and calculations thereof may not be comparable to those reported by other companies. We believe Adjusted EBITDA is an important measure of operating performance and provides useful information to investors because it highlights trends in our business that may not otherwise be apparent when relying solely on GAAP measures and because it eliminates items that have less bearing on our operating performance. Adjusted EBITDA is a measure of operating performance that is not defined by GAAP and should not be considered a substitute for net (loss) income as determined in accordance with GAAP.
Adjusted EBITDA attributable to SXC/SXCP equals Adjusted EBITDA less Adjusted EBITDA attributable to noncontrolling interests.
Adjusted EBITDA/Ton represents Adjusted EBITDA divided by tons sold. When applicable to Adjusted EBITDA attributable to SXC or SXCP, tons sold are prorated according to the respective ownership interest of SXC or SXCP as applicable.
Free Cash Flow equals cash from operations less cash used in investing activities less cash distributions to non-controlling interests. Management believes Free Cash Flow information enhances an investor’s understanding of a business’ ability to generate cash. Free Cash Flow does not represent and should not be considered an alternative to net income or cash flows from operating activities as determined under GAAP and may not be comparable to other similarly titled measures of other businesses.
Investor Meetings—March 2013
38
Definitions
Distributable Cash Flow equals Adjusted EBITDA less net cash paid for interest expense, on-going capital expenditures, accruals for replacement capital expenditures, and cash distributions to noncontrolling interests. Distributable Cash Flow is a non-GAAP supplemental financial measure that management and external users of the Partnership’s financial statements, such as industry analysts, investors, lenders, and rating agencies, use to assess:
the Partnership s operating performance as compared to other publicly traded partnerships, without regard to historical cost basis; the ability of the Partnership’s assets to generate sufficient cash flow to make distributions to the Partnership’s unitholders; the Partnership’s ability to incur and service debt and fund capital expenditures; and the viability of acquisitions and other capital expenditure projects and the returns on investment of various investment opportunities.
The Partnership believes that Distributable Cash Flow provides useful information to investors in assessing the Partnership’s financial condition and results of operations. Distributable Cash Flow should not be considered an alternative to net income, operating income, cash flows from operating activities, or any other measure of financial performance or liquidity presented in accordance with generally accepted accounting principles (GAAP). Distributable Cash Flow has important limitations as an analytical tool because it excludes some, but not all, items that affect net income and net cash provided by operating activities and used in investing activities. Additionally, because Distributable Cash Flow may be defined differently by other companies in the industry, the Partnership’s definition of Distributable Cash Flow may not be comparable to similarly titled measures of other companies, thereby diminishing their utility.
Investor Meetings—March 2013
39
Reconciliations
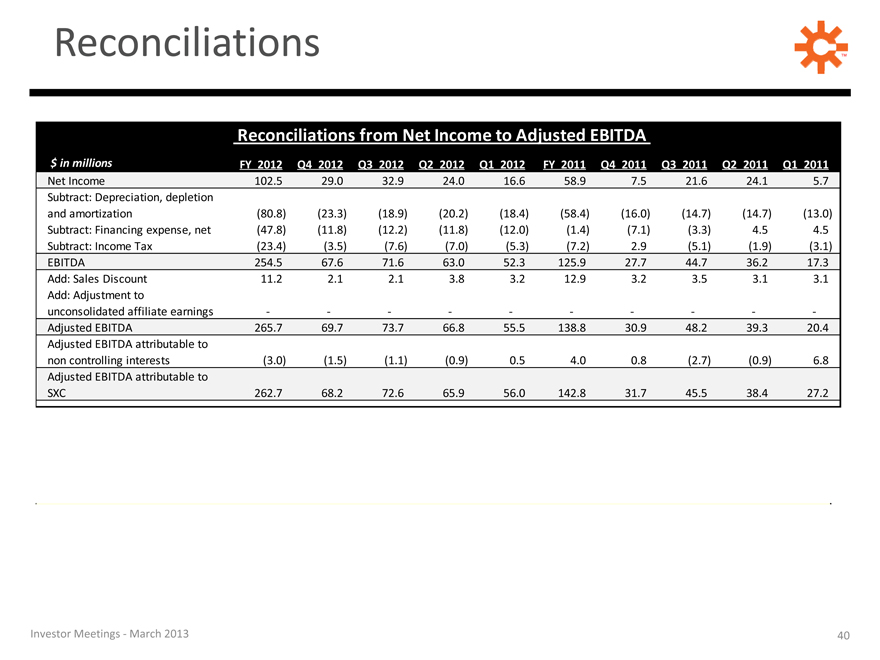
Reconciliations from Net Income to Adjusted EBITDA
$ in millions FY 2012 Q4 2012 Q3 2012 Q2 2012 Q1 2012 FY 2011 Q4 2011 Q3 2011 Q2 2011 Q1 2011
Net Income 102.5 29.0 32.9 24.0 16.6 58.9 7.5 21.6 24.1 5.7
Subtract: Depreciation, depletion
and amortization(80.8)(23.3)(18.9)(20.2)(18.4)(58.4)(16.0)(14.7)(14.7)(13.0)
Subtract: Financing expense, net(47.8)(11.8)(12.2)(11.8)(12.0)(1.4)(7.1)(3.3) 4.5 4.5
Subtract: Income Tax(23.4)(3.5)(7.6)(7.0)(5.3)(7.2) 2.9(5.1)(1.9)(3.1)
EBITDA 254.5 67.6 71.6 63.0 52.3 125.9 27.7 44.7 36.2 17.3
Add: Sales Discount 11.2 2.1 2.1 3.8 3.2 12.9 3.2 3.5 3.1 3.1
Add: Adjustment to
unconsolidated affiliate earnings — — — — —
Adjusted EBITDA 265.7 69.7 73.7 66.8 55.5 138.8 30.9 48.2 39.3 20.4
Adjusted EBITDA attributable to
non controlling interests(3.0)(1.5)(1.1)(0.9) 0.5 4.0 0.8(2.7)(0.9) 6.8
Adjusted EBITDA attributable to
SXC 262.7 68.2 72.6 65.9 56.0 142.8 31.7 45.5 38.4 27.2
Investor Meetings—March 2013
40
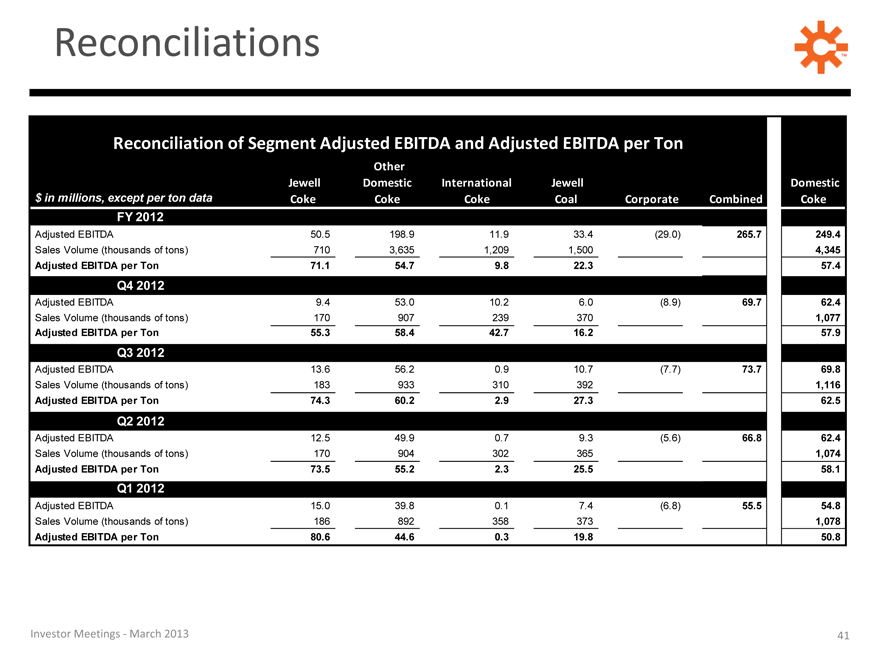
Reconciliations
Reconciliation of Segment Adjusted EBITDA and Adjusted EBITDA per Ton
Other
Jewell Domestic International Jewell Domestic
$ in millions, except per ton data Coke Coke Coke Coal Corporate Combined Coke
FY 2012
Adjusted EBITDA 50.5 198.9 11.9 33.4(29.0) 265.7 249.4
Sales Volume (thousands of tons) 710 3,635 1,209 1,500 4,345
Adjusted EBITDA per Ton 71.1 54.7 9.8 22.3 57.4
Q4 2012
Adjusted EBITDA 9.4 53.0 10.2 6.0(8.9) 69.7 62.4
Sales Volume (thousands of tons) 170 907 239 370 1,077
Adjusted EBITDA per Ton 55.3 58.4 42.7 16.2 57.9
Q3 2012
Adjusted EBITDA 13.6 56.2 0.9 10.7(7.7) 73.7 69.8
Sales Volume (thousands of tons) 183 933 310 392 1,116
Adjusted EBITDA per Ton 74.3 60.2 2.9 27.3 62.5
Q2 2012
Adjusted EBITDA 12.5 49.9 0.7 9.3(5.6) 66.8 62.4
Sales Volume (thousands of tons) 170 904 302 365 1,074
Adjusted EBITDA per Ton 73.5 55.2 2.3 25.5 58.1
Q1 2012
Adjusted EBITDA 15.0 39.8 0.1 7.4(6.8) 55.5 54.8
Sales Volume (thousands of tons) 186 892 358 373 1,078
Adjusted EBITDA per Ton 80.6 44.6 0.3 19.8 50.8
Investor Meetings—March 2013
41

Reconciliations
Reconciliation of Segment Adjusted EBITDA and Adjusted EBITDA per Ton
Other
Jewell Domestic International Jewell Domestic
$ in millions, except per ton data Coke Coke Coke Coal Corporate Combined Coke
FY 2011
Adjusted EBITDA 46.1 87.7 13.7 35.5(44.2) 138.8 133.8
Sales Volume (thousands of tons) 702 3,068 1,442 1,454 3,770
Adjusted EBITDA per Ton 65.7 28.6 9.5 24.4 35.5
Q4 2011
Adjusted EBITDA 10.6 20.8 10.2 2.5(13.2) 30.9 31.4
Sales Volume (thousands of tons) 166 837 295 363 1,003
Adjusted EBITDA per Ton 63.9 24.9 34.6 6.9 31.3
Q3 2011
Adjusted EBITDA 13.9 37.7 1.7 9.2(14.3) 48.2 51.6
Sales Volume (thousands of tons) 191 777 373 371 968
Adjusted EBITDA per Ton 72.8 48.5 4.6 24.8 53.3
Q2 2011
Adjusted EBITDA 10.6 26.9 0.8 11.5(10.5) 39.3 37.5
Sales Volume (thousands of tons) 170 757 412 334 927
Adjusted EBITDA per Ton 62.4 35.5 1.9 34.4 40.5
Q1 2011
Adjusted EBITDA 11.0 2.3 1.0 12.3(6.2) 20.4 13.3
Sales Volume (thousands of tons) 175 697 362 386 872
Adjusted EBITDA per Ton 62.9 3.3 2.8 31.9 15.3
Investor Meetings—March 2013
42
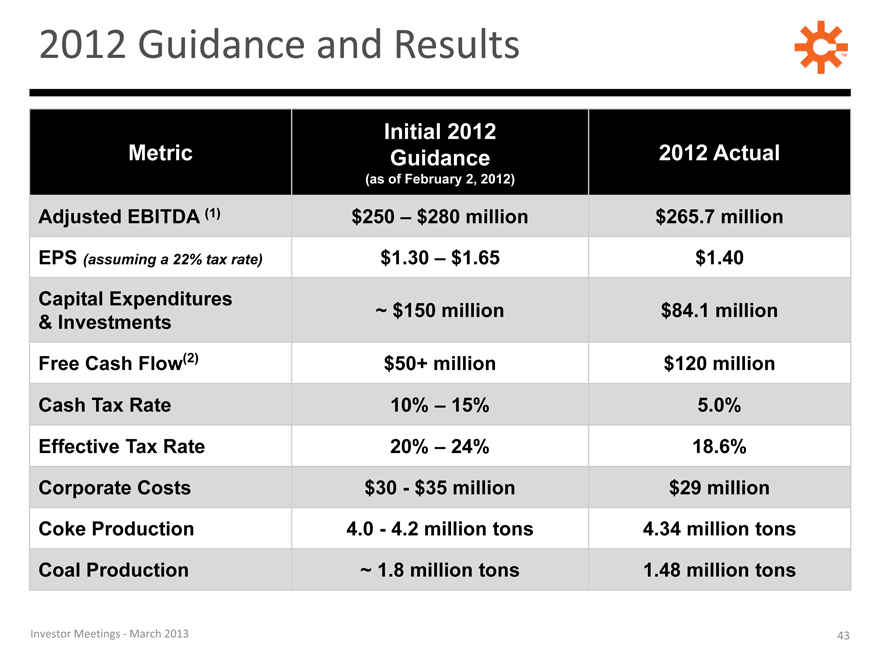
2012 Guidance and Results
Initial 2012
Metric Guidance 2012 Actual
(as of February 2, 2012)
Adjusted EBITDA (1) $250 $280 million $265.7 million
EPS (assuming a 22% tax rate) $1.30 $1.65 $1.40
Capital Expenditures ~ $150 million $84.1 million
& Investments
Free Cash Flow(2) $50+ million $120 million
Cash Tax Rate 10% 15% 5.0%
Effective Tax Rate 20% 24% 18.6%
Corporate Costs $30—$35 million $29 million
Coke Production 4.0—4.2 million tons 4.34 million tons
Coal Production ~ 1.8 million tons 1.48 million tons
Investor Meetings—March 2013
43
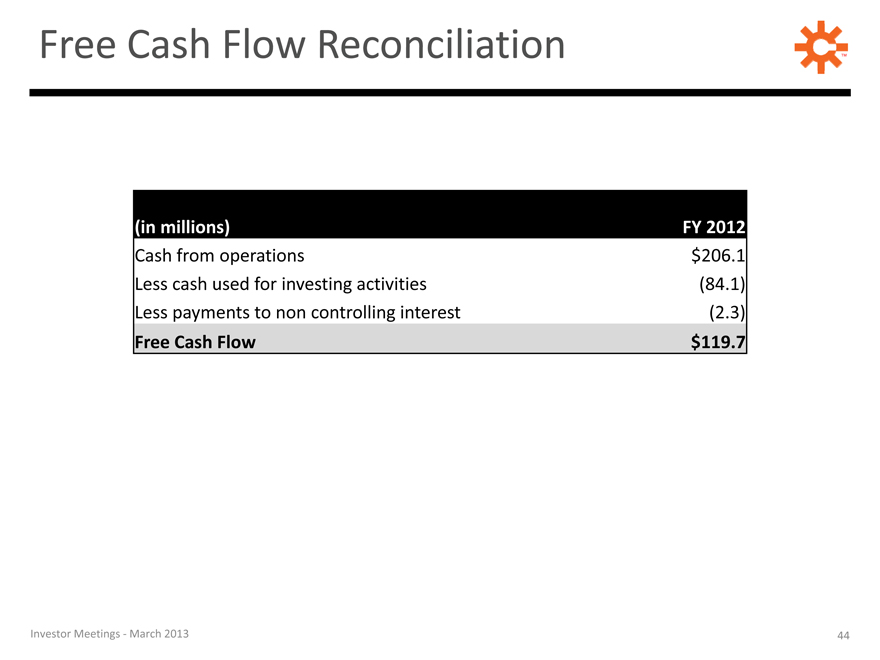
Free Cash Flow Reconciliation
(in millions) FY 2012
Cash from operations $206.1
Less cash sh used for investing activities ctivities (84.1) Less payments to non controlling interest (2.3)
Free Cash Flow $119.7
Investor Meetings—March 2013
44
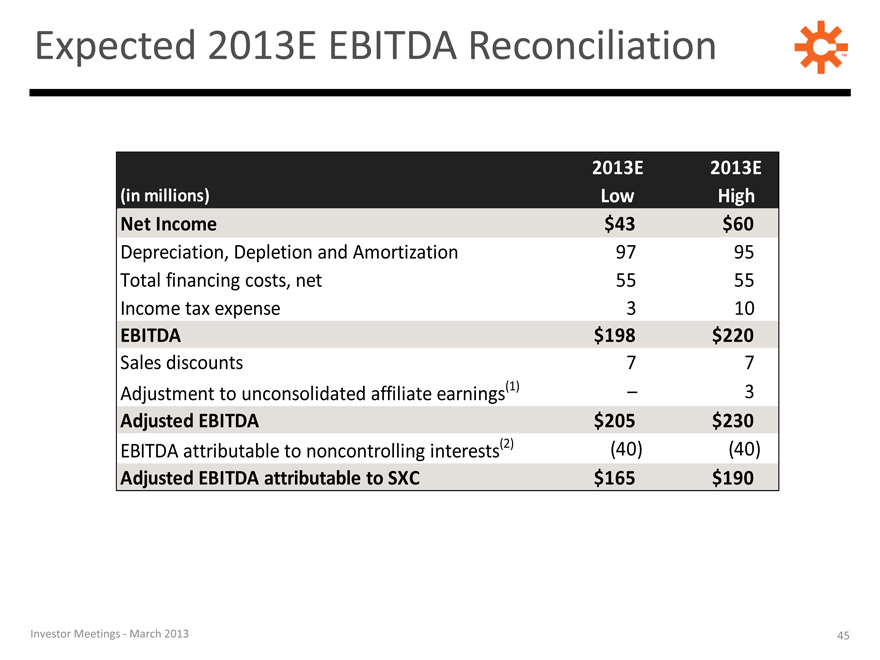
Expected 2013E EBITDA Reconciliation
2013E 2013E
(in millions) Low High
Net Income $43 $60
Depreciation, Depletion and Amortization 97 95
Total financing costs, net 55 55
Income tax expense 3 10
EBITDA $198 $220
Sales discounts 7 7
Adjustment to unconsolidated affiliate earnings(1) – 3
Adjusted EBITDA $205 $230
EBITDA attributable to noncontrolling interests(2)(40)(40)
Adjusted EBITDA attributable to SXC $165 $190
Investor Meetings—March 2013
45
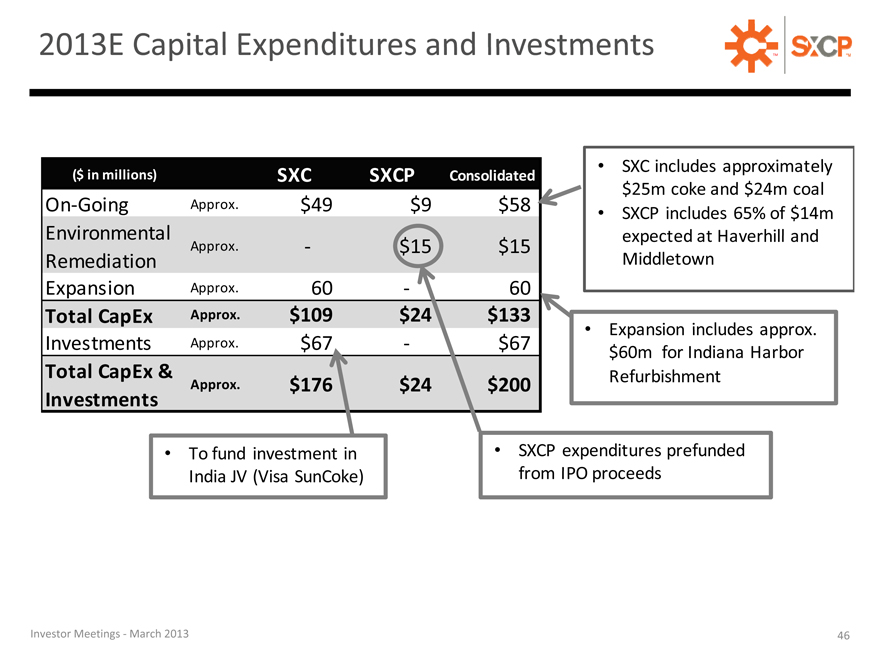
2013E Capital Expenditures and Investments
($ in millions) SXC SXCP Consolidated SXC includesnc approximately
$25m coke and $24m coal
On-Going Approx. $49 $9 $58 SXCP includese 65% of $14m
Environmental expected at Haverhill and
Approx.—$15 $15
Remediation Middletown
Expansion Approx. 60—60
Total CapEx Approx. $109 $24 $133 Expansion includes approx.
Investments Approx. $67—$67 $60m for Indiana Harbor
Total CapEx & Refurbishment
Approx. $176 $24 $200
Investments
To fund investment in SXCP expenditures prefunded
India JV (Visa SunCoke) from IPO proceeds
Investor Meetings—March 2013
46
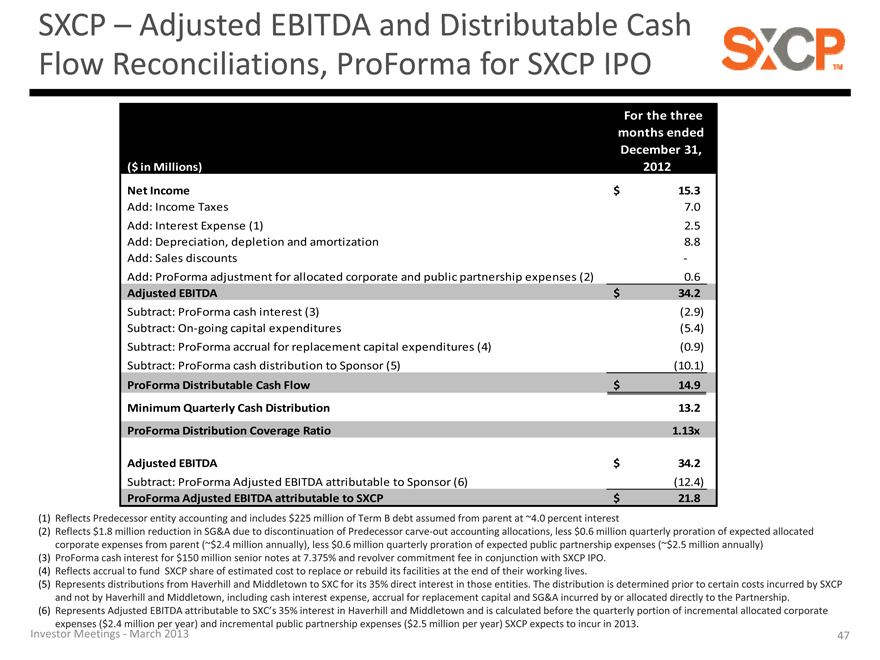
SXCP Adjusted EBITDA and Distributable Cash Flow Reconciliations, ProForma for SXCP IPO
For the three
months ended
December 31,
($ in Millions) 2012
Net Income $ 15.3
Add: Income Taxes 7.0
Add: Interest Expense (1) 2.5
Add: Depreciation, depletion and amortization 8.8
Add: Sales discounts -
Add: ProForma adjustment for allocated corporate and public partnership expenses (2) 0.6
Adjusted EBITDA $ 34.2
Subtract: ProForma cash interest (3)(2.9)
Subtract: On-going capital expenditures(5.4)
Subtract: ProForma accrual for replacement capital expenditures (4)(0.9)
Subtract: ProForma cash distribution to Sponsor (5)(10.1)
ProForma Distributable Cash Flow $ 14.9
Minimum Quarterly Cash Distribution 13.2
ProForma Distribution Coverage Ratio 1.13x
Adjusted EBITDA $ 34.2
Subtract: ProForma Adjusted EBITDA attributable to Sponsor (6)(12.4)
ProForma Adjusted EBITDA attributable to SXCP $ 21.8
(1) Reflects Predecessor entity accounting and includes $225 million of Term B debt assumed from parent at ~4.0 percent interest
(2) Reflects $1.8 million reduction in SG&A due to discontinuation of Predecessor carve-out accounting allocations, less $0.6 million quarterly proration of expected allocated corporate expenses from parent (~$2.4 million annually), less $0.6 million quarterly proration of expected public partnership expenses (~$2.5 million annually) (3) ProForma cash interest for $150 million senior notes at 7.375% and revolver commitment fee in conjunction with SXCP IPO.
(4) Reflects accrual to fund SXCP share of estimated cost to replace or rebuild its facilities at the end of their working lives.
(5) Represents distributions from Haverhill and Middletown to SXC for its 35% direct interest in those entities. The distribution is determined prior to certain costs incurred by SXCP and not by Haverhill and Middletown, including cash interest expense, accrual for replacement capital and SG&A incurred by or allocated directly to the Partnership.
(6) Represents Adjusted EBITDA attributable to SXC’s 35% interest in Haverhill and Middletown and is calculated before the quarterly portion of incremental allocated corporate expenses ($2.4 million per year) and incremental public partnership expenses ($2.5 million per year) SXCP expects to incur in 2013.
Investor Meetings—March 2013
47