Exhibit 99.2
Exhibit 99.2
NAPTP 2013 MLP
Investor Conference
May 22, 2013

Mark Newman
Senior Vice President and
Chief Financial Officer

Forward-Looking Statements
Some of the information included in this presentation constitutes “forward-looking statements” as defined in Section 27A of the Securities Act of 1933, as amended and Section 21E of the Securities Exchange Act of 1934, as amended. All statements in this presentation that express opinions, expectations, beliefs, plans, objectives, assumptions or projections with respect to anticipated future performance of SunCoke Energy, Inc. (“SunCoke”) or SunCoke Energy Partners, L.P. (“Partnership”), in contrast with statements of historical facts, are forward-looking statements. Such forward-looking statements are based on management’s beliefs and assumptions and on information currently available. Forward-looking statements include information concerning possible or assumed future results of operations, business strategies, financing plans, competitive position, potential growth opportunities, potential operating performance improvements, the effects of competition and the effects of future legislation or regulations. Forward-looking statements include all statements that are not historical facts and may be identified by the use of forward-looking terminology such as the words “believe,” “expect,” “plan,” “intend,” “anticipate,” “estimate,” “predict,” “potential,” “continue,” “may,” “will,” “should” or the negative of these terms or similar expressions.
Although management believes that its plans, intentions and expectations reflected in or suggested by the forward-looking statements made in this presentation are reasonable, no assurance can be given that these plans, intentions or expectations will be achieved when anticipated or at all. Moreover, such statements are subject to a number of assumptions, risks and uncertainties. Many of these risks are beyond the control of SunCoke and the Partnership, and may cause actual results to differ materially from those implied or expressed by the forward-looking statements. Each of SunCoke and the Partnership has included in its filings with the Securities and Exchange Commission (including, in the case of the Partnership, its Form S-1) cautionary language identifying important factors ( factors) that could cause actual results to differ materially from those expressed in any forward-looking statement. For more information concerning these factors, see the Securities and Exchange Commission filings of SunCoke and the Partnership. All forward-looking statements included in this presentation are expressly qualified in their entirety by such cautionary statements. Although forward-looking statements are based on current beliefs and expectations, caution should be taken not to place undue reliance on any such forward-looking statements because such statements speak only as of the date hereof. Neither SunCoke nor the Partnership has any intention or obligation to update publicly any forward-looking statement (or its associated cautionary language) whether events or after the date of this presentation, except as required by applicable law.
This presentation includes certain non-GAAP financial measures intended to supplement, not substitute for, comparable GAAP measures. Reconciliations of non-GAAP financial measures to GAAP financial measures are provided in the Appendix at the end of the presentation. Investors are urged to consider carefully the comparable GAAP measures and the reconciliations to those measures provided in the Appendix.
NAPTP 2013 MLP Annual Investor Conference
3
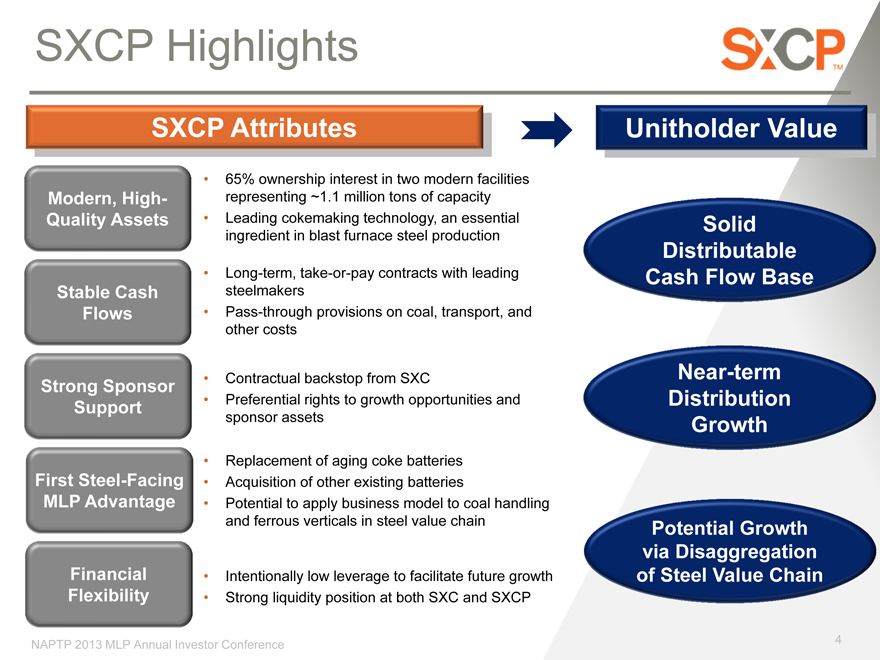
SXCP Highlights
SXCP Attributes
Modern, High-Quality Assets
Stable Cash Flows
Strong Sponsor Support
First Steel-Facing MLP Advantage
Financial Flexibility
65% ownership interest in two modern facilities representing ~1.1 million tons of capacity
Leading cokemaking technology, an essential ingredient in blast furnace steel production
Long-term, take-or-pay contracts with leading steelmakers
Pass-through provisions on coal, transport, and other costs
Contractual backstop from SXC
Preferential rights to growth opportunities and sponsor assets
Replacement of aging coke batteries
Acquisition of other existing batteries
Potential to apply business model to coal handling and ferrous verticals in steel value chain
Intentionally low leverage to facilitate future growth
Strong liquidity position at both SXC and SXCP
Unitholder Value
Solid Distributable Cash Flow Base
Near-term Distribution Growth
Potential Growth via Disaggregation of Steel Value Chain
NAPTP 2013 MLP Annual Investor Conference
4
Video: This is SXCP
The “This is SXCP” video is available for viewing on the SunCoke Energy Partners, L.P. website:
http://www.sxcpartners.com/phoenix.zhtml c=251513&p=index
NAPTP 2013 MLP Annual Investor Conference
5
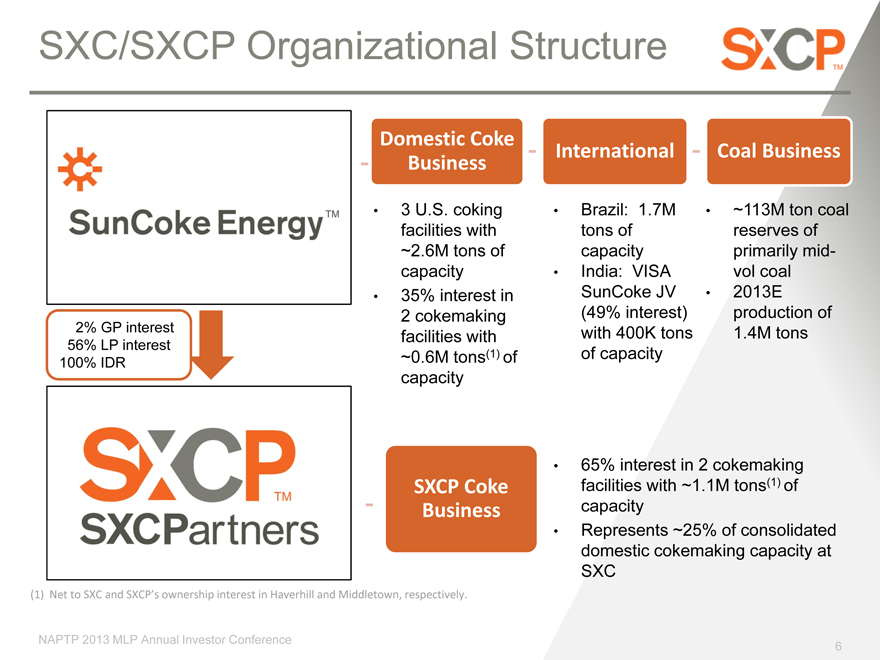
SXC/SXCP Organizational Structure
2% GP interest 56% LP interest 100% IDR
Domestic Coke
Business
• 3 U.S. coking
facilities with
~2.6M tons of
capacity
• 35% interest in
2 cokemaking
facilities with
~0.6M tons(1) of
capacity
International
• Brazil: 1.7M
tons of
capacity
• India: VISA
SunCoke JV
(49% interest)
with 400K tons
of capacity
Coal Business
~113M ton coal
reserves of
primarily mid-
vol coal
2013E
production of
1.4M tons
SXCP Coke Business
65% interest in 2 cokemaking facilities with ~1.1M tons(1) of capacity
Represents ~25% of consolidated domestic cokemaking capacity at SXC
(1) Net to SXC and SXCP’s ownership interest in Haverhill and Middletown, respectively.
NAPTP 2013 MLP Annual Investor Conference
6
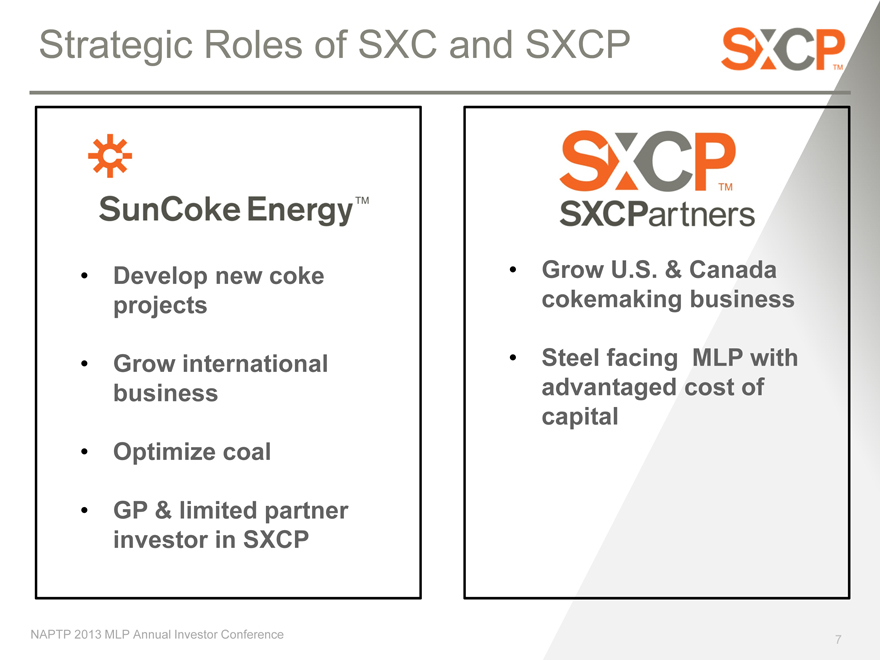
Strategic Roles of SXC and SXCP
Develop new coke projects
Grow international business
Optimize coal
GP & limited partner investor in SXCP
Grow U.S. & Canada cokemaking business
Steel facing MLP with advantaged cost of capital
NAPTP 2013 MLP Annual Investor Conference
7

SUNCOKE’S COKEMAKING TECHNOLOGY
& DOMESTIC BUSINESS MODEL
NAPTP 2013 MLP Annual Investor Conference
8
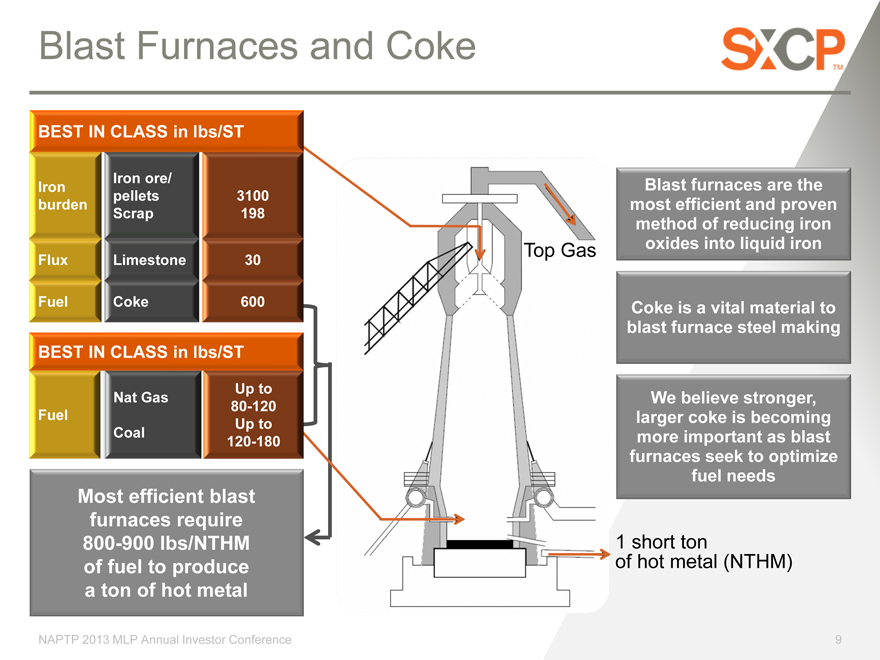
Blast Furnaces and Coke
BEST IN CLASS in lbs/ST
Iron ore/
Iron pellets 3100
burden Scrap 198
Flux Limestone 30
Fuel okeCoke 600
BEST IN CLASS in lbs/ST
Nat Gas Up to
Fuel 80-120
Up to
Coal 120-180
Most efficient blast furnaces require 800-900 lbs/NTHM of fuel to produce a ton of hot metal
Top Gas
Blast furnaces are the most efficient and proven method of reducing iron oxides into liquid iron
Coke is a vital material to blast furnace steel making
We believe stronger, larger coke is becoming more important as blast furnaces seek to optimize fuel needs
1 short ton of hot metal (NTHM)
NAPTP 2013 MLP Annual Investor Conference
9
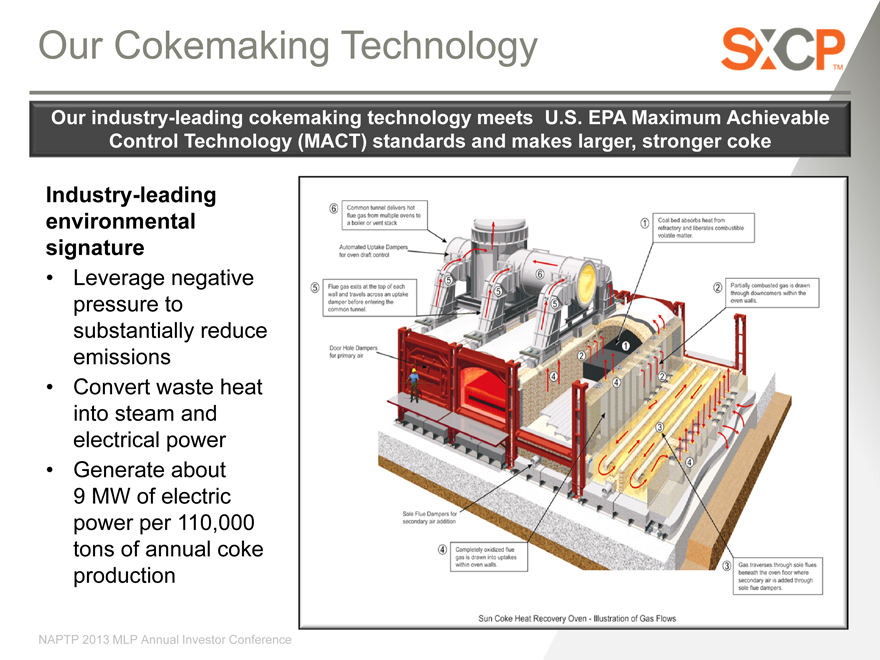
Our Cokemaking Technology
Our industry-leading cokemaking technology meets U.S. EPA Maximum Achievable Control Technology (MACT) standards and makes larger, stronger coke
Industry-leading
environmental
signature
• Leverage negative
pressure to
substantially reduce
emissions
• Convert waste heat
into steam and
electrical power
• Generate about
9 MW of electric
power per 110,000
tons of annual coke
production
NAPTP 2013 MLP Annual Investor Conference
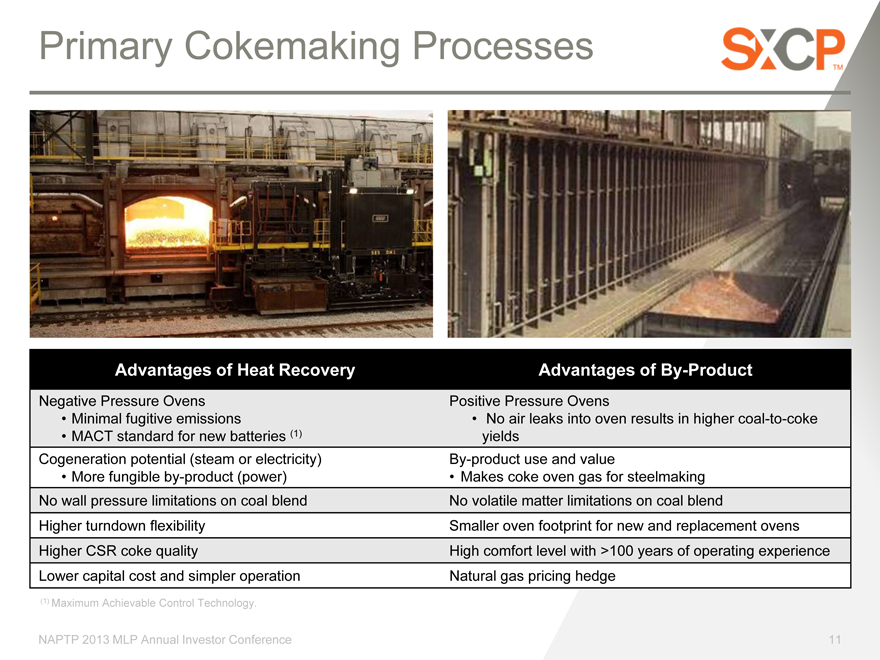
Primary Cokemaking Processes
Advantages of Heat Recovery
Negative Pressure Ovens
•
Minimal fugitive emissions
•
MACT standard for new batteries (1)
Cogeneration potential (steam or electricity)
•
More fungible by-product (power)
No wall pressure limitations on coal blend
Higher turndown flexibility
Higher CSR coke quality
Lower capital cost and simpler operation
Advantages of By-Product
Positive Pressure Ovens
• No air leaks into oven results in higher coal-to-coke
yields
By-product use and value
• Makes coke oven gas for steelmaking
No volatile matter limitations on coal blend
Smaller oven footprint for new and replacement ovens
High comfort level with >100 years of operating experience
Natural gas pricing hedge
(1) Maximum Achievable Control Technology.
NAPTP 2013 MLP Annual Investor Conference
11
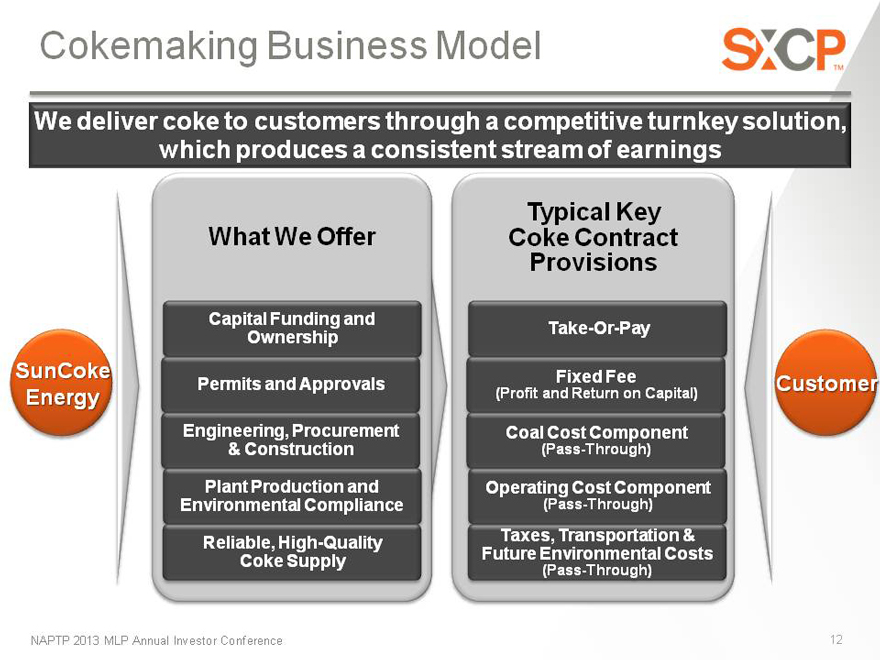
Cokemaking Business Model
We deliver coke to customers through a competitive turnkey solution, which produces a consistent stream of earnings
What We Offer
Capital Funding and
Ownership
Permits and Approvals
Engineering, Procurement
& Construction
Plant Production and
Environmental Compliance
Reliable, High-Quality
Coke Supply
Typical Key
Coke Contract
Provisions
Take-Or-Pay
Fixed Fee
(Profit and Return on Capital)
Coal Cost Component
(Pass-Through)
Operating Cost Component
(Pass-Through)
Taxes, Transportation &
Future Environmental Costs
(Pass-Through)
SunCoke Energy
Customer
NAPTP 2013 MLP Annual Investor Conference
12

OUR MARKET OPPORTUNITY
NAPTP 2013 MLP Annual Investor Conference
13
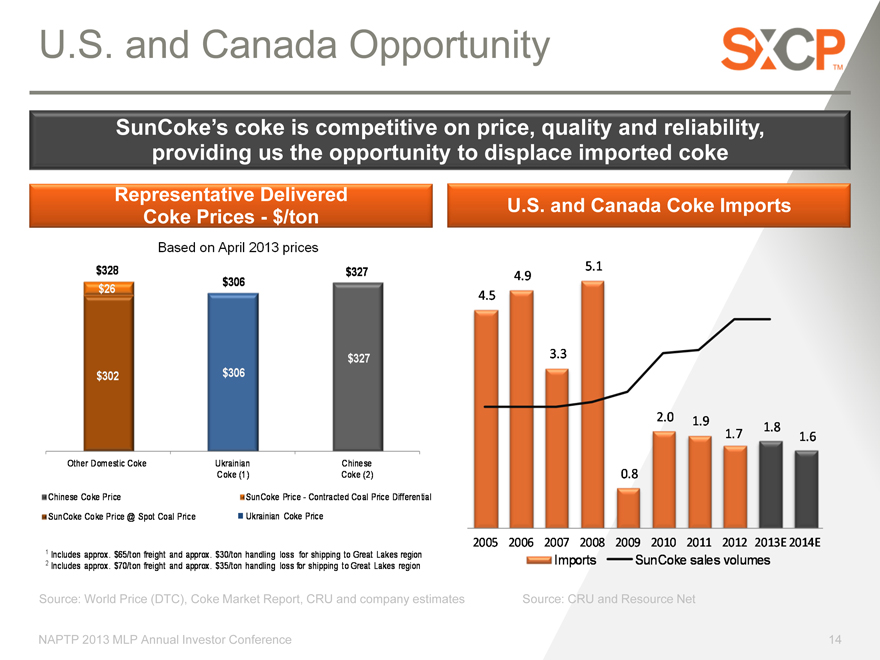
U.S. and Canada Opportunity
SunCoke’s coke is competitive on price, quality and reliability, providing us the opportunity to displace imported coke
Representative Delivered Coke Prices—$/ton n
Based on April 2013 prices
$328 $327 $306 $26
$327 $302 $306
Other Domestic Coke Ukrainian Chinese Coke (1) Coke (2)
Chinese Coke Price SunCoke Price—Contracted Coal Price Differential
SunCoke Coke Price @ Spot Coal Price „ Ukrainian Coke Price
Includes approx. $65/ton freight and approx. $30/ton handling loss for shipping to Great Lakes region
Includes approx. $70/ton freight and approx. $35/ton handling loss for shipping to Great Lakes region
U.S. and Canada Coke Imports
5.1
4.9
4.5
3.3
2.0 1.9 1.8
1.7 1.6
0.8
2005 2006 2007 2008 2009 2010 2011 2012 2013E 2014E
Imports SunCoke sales volumes
Source: World Price (DTC), Coke Market Report, CRU and company estimates
Source: CRU and Resource Net
NAPTP 2013 MLP Annual Investor Conference
14
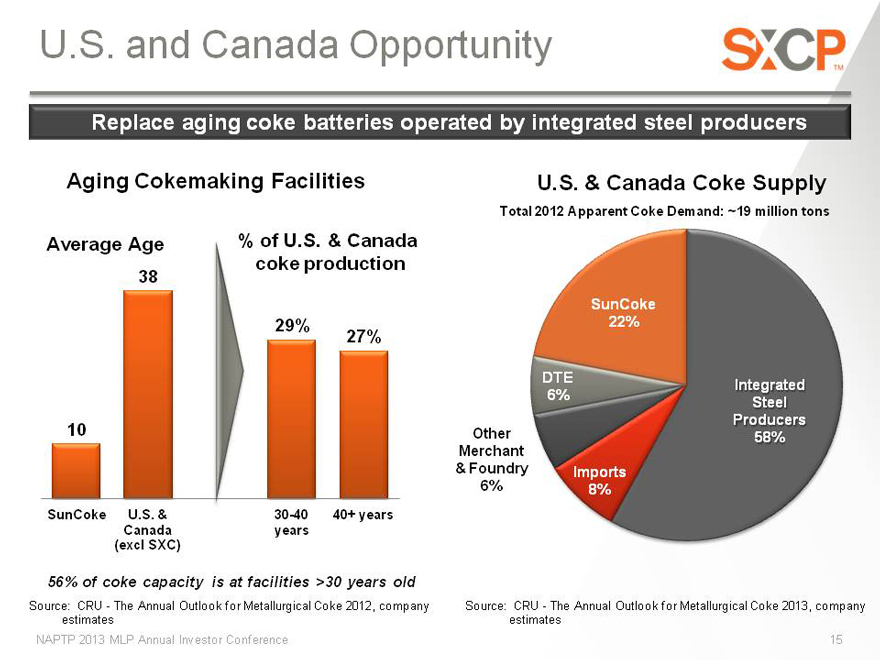
U.S. and Canada Opportunity
Replace aging coke batteries operated by integrated steel producers
Aging Cokemaking Facilities
Average Age
% of U.S. & Canada coke production
38
29%
27%
10
SunCoke U.S. & 30-40 40+ years Canada years (excl SXC)
56% of coke capacity is at facilities >30 years old
Source: CRU—The Annual Outlook for Metallurgical Coke 2012, company estimates
U.S. & Canada Coke Supply
Total 2012 Apparent Coke Demand: ~19 million tons
Other Merchant
& Foundry 6%
SunCoke 22%
DTE
Integrated 6% Steel Producers 58%
Imports 8%
Source: CRU—The Annual Outlook for Metallurgical Coke 2013, company estimates
NAPTP 2013 MLP Annual Investor Conference
15
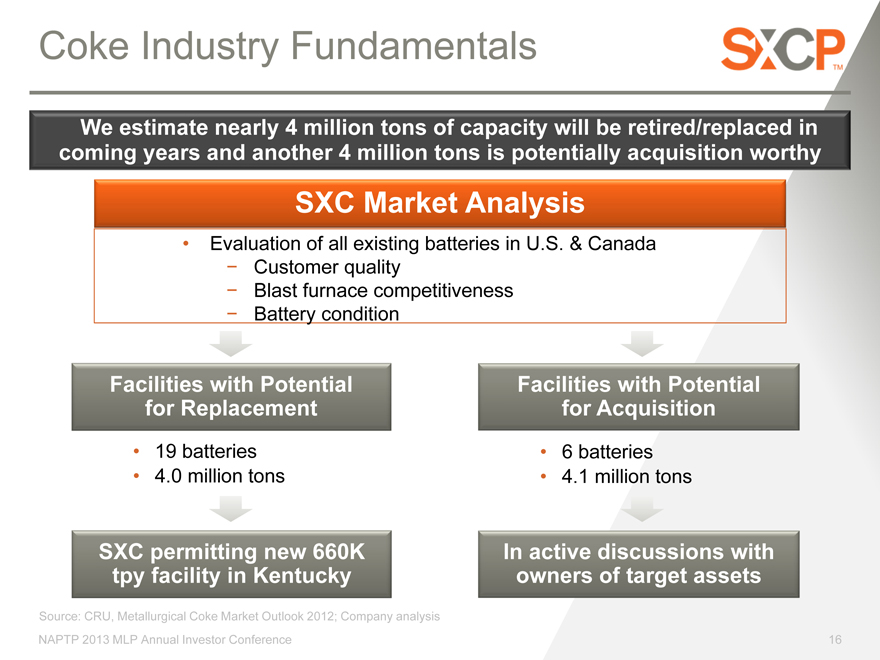
Coke Industry Fundamentals
We estimate nearly 4 million tons of capacity will be retired/replaced in coming years and another 4 million tons is potentially acquisition worthy
SXC Market Analysis
• Evaluation of all existing batteries in U.S. & Canada
- Customer quality
- Blast furnace competitiveness
- Battery condition
Facilities with Potential for Replacement
• 19 batteries
• 4.0 million tons
Facilities with Potential for Acquisition
• 6 batteries
• 4.1 million tons
SXC permitting new 660K tpy facility in Kentucky
Source: CRU, Metallurgical Coke Market Outlook 2012; Company analysis NAPTP 2013 MLP Annual Investor Conference
In active discussions with owners of target assets
16
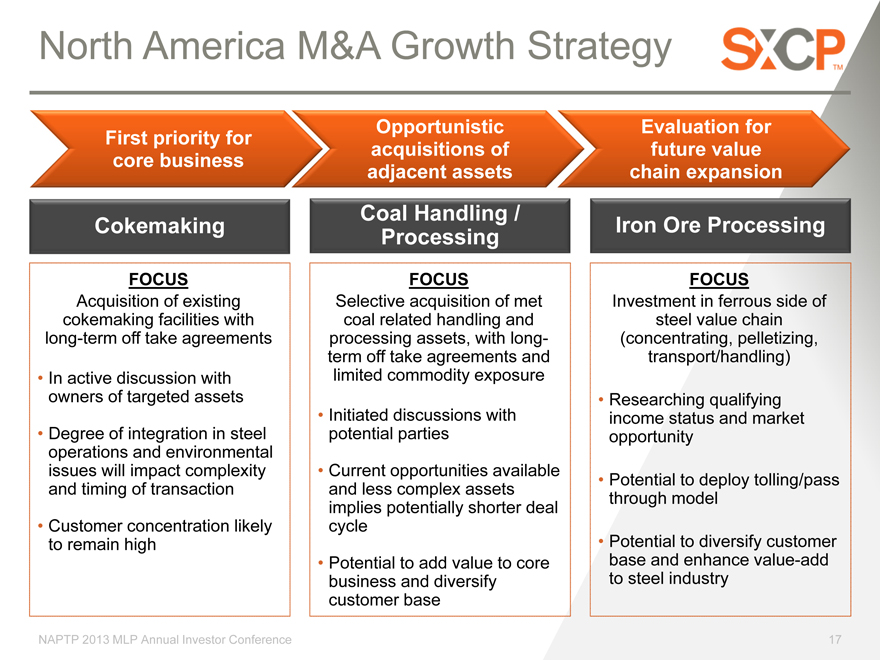
North America M&A Growth Strategy
Opportunistic Evaluation for First priority for acquisitions of future value core business adjacent assets chain expansion
Cokemaking
FOCUS
Acquisition of existing cokemaking facilities with long-term off take agreements
In active discussion with owners of targeted assets
Degree of integration in steel operations and environmental issues will impact complexity and timing of transaction
Customer concentration likely to remain high
Coal Handling /
Iron Ore Processing Processing
FOCUS FOCUS
Selective acquisition of met Investment in ferrous side of coal related handling and steel value chain processing assets, with long- (concentrating, pelletizing, term off take agreements and transport/handling) limited commodity exposure
Initiated discussions with Researching qualifying potential parties income status and market opportunity
Current opportunities available
Potential to deploy tolling/pass and less complex assets through model implies potentially shorter deal cycle Potential to diversify customer
Potential to add value to core base and enhance value-add business and diversify to steel industry customer base
NAPTP 2013 MLP Annual Investor Conference
17
1Q 2013 PERFORMANCE
& FINANCIAL POSITION
NAPTP 2013 MLP Annual Investor Conference
18
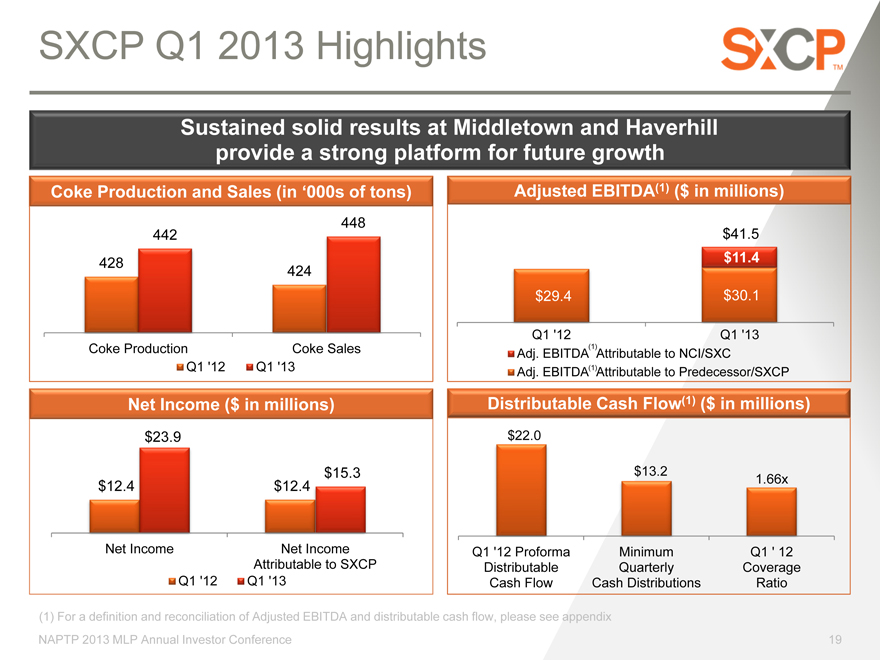
SXCP Q1 2013 Highlights
Sustained solid results at Middletown and Haverhill provide a strong platform for future growth
Coke Production and Sales (in ‘000s of tons)
448
442
428 424
Coke Production Coke Sales
Q1 ‘12 Q1 ‘13
Adjusted EBITDA(1) ($ in millions)
$ 41.5
$11.4
$29.4 $30.1
Q1 ‘12 Q1 ‘13
Adj. EBITDA(1) Attributable to Predecessor/SXCP
Adj. EBITDA(1)Attributable to NCI/SXC
Net Income ($ in millions)
$23.9
$15.3
$12.4 $12.4
Net Income Net Income
Attributable to SXCP
Q1 ‘12 Q1 ‘13
Distributable Cash Flow(1) ($ in millions)
$22.0
$13.2 1.66x
Q1 ‘12 Proforma Minimum Q1 ‘ 12
Distributable Quarterly Coverage
Cash Flow Cash Distributions Ratio
(1) For a definition and reconciliation of Adjusted EBITDA and distributable cash flow, please see appendix
NAPTP 2013 MLP Annual Investor Conference
19
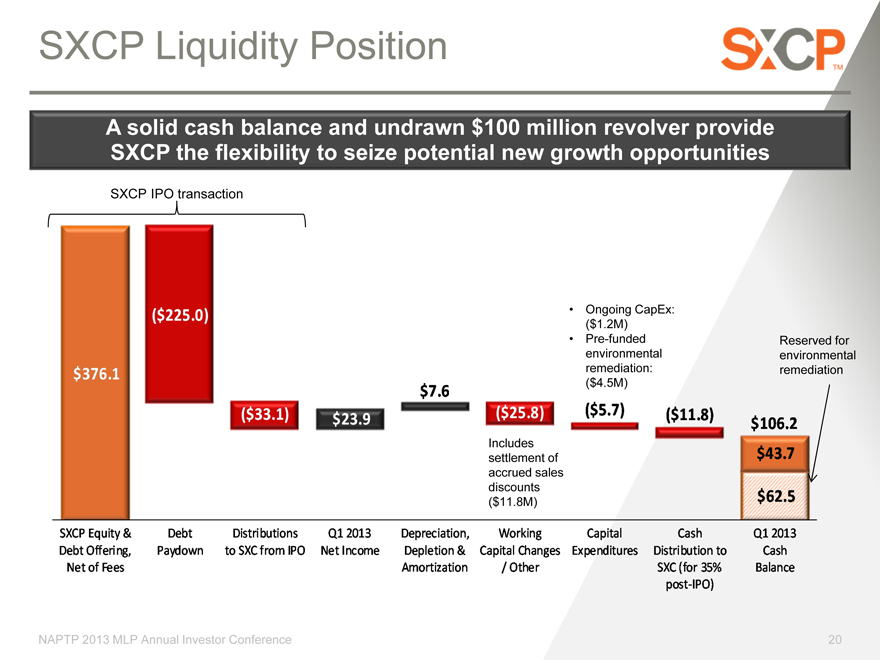
SXCP Liquidity Position
A solid cash balance and undrawn $100 million revolver provide SXCP the flexibility to seize potential new growth opportunities
SXCP IPO transaction
($225.0) Ongoing CapEx:
($1.2M)
Pre-funded Reserved for
environmental environmental
$376.1 remediation: remediation
($4.5M)
$7.6
($33.1) ($25.8) ($5.7) ($11.8)
$23.9 $106.2
Includes
settlement of $43.7
accrued sales
discounts
($11.8M) $62.5
SXCP Equity & Debt Distributions Q1 2013 Depreciation, Working Capital Cash Q1 2013
Debt Offering, Paydown to SXC from IPO Net Income Depletion & Capital Changes Expenditures Distribution to Cash
Net of Fees Amortization / Other SXC (for 35% Balance
NAPTP 2013 MLP Annual Investor Conference
20
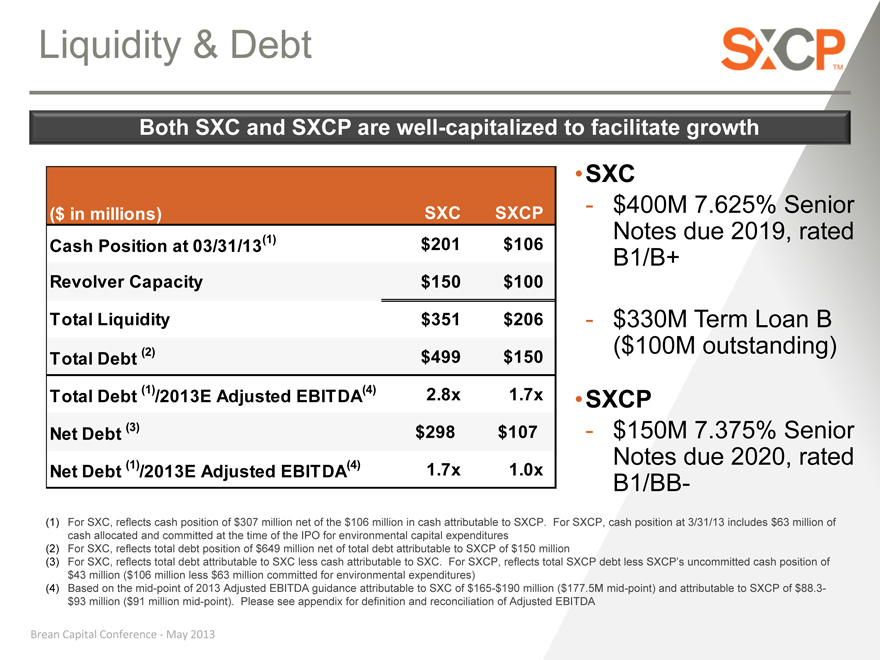
Liquidity & Debt
Both SXC and SXCP are well-capitalized to facilitate growth
($ in millions) SXC SXCP
Cash Position at 03/31/13(1) $201 $106
Revolver Capacity $150 $100
Total Liquidity $351 $206
Total Debt (2) $499 $150
Total Debt (1) /2013E Adjusted EBITDA(4) 2.8x 1.7x
Net Debt (3) $298 $107
Net Debt (1) /2013E Adjusted EBITDA(4) 1.7x 1.0x
SXC
$400M 7.625% Senior Notes due 2019, rated B1/B+
$330M Term Loan B
($100M outstanding)
SXCP
$150M 7.375% Senior Notes due 2020, rated B1/BB-
(1) For SXC, reflects cash position of $307 million net of the $106 million in cash attributable to SXCP. For SXCP, cash position at 3/31/13 includes $63 million of cash allocated and committed at the time of the IPO for environmental capital expenditures (2) For SXC, reflects total debt position of $649 million net of total debt attributable to SXCP of $150 million (3) For SXC, reflects total debt attributable to SXC less cash attributable to SXC. For SXCP, reflects total SXCP debt less SXCP’s uncommitted cash position of $43 million ($106 million less $63 million committed for environmental expenditures) (4) Based on the mid-point of 2013 Adjusted EBITDA guidance attributable to SXC of $165-$190 million ($177.5M mid-point) and attributable to SXCP of $88.3-$93 million ($91 million mid-point). Please see appendix for definition and reconciliation of Adjusted EBITDA
Brean Capital Conference—May 2013
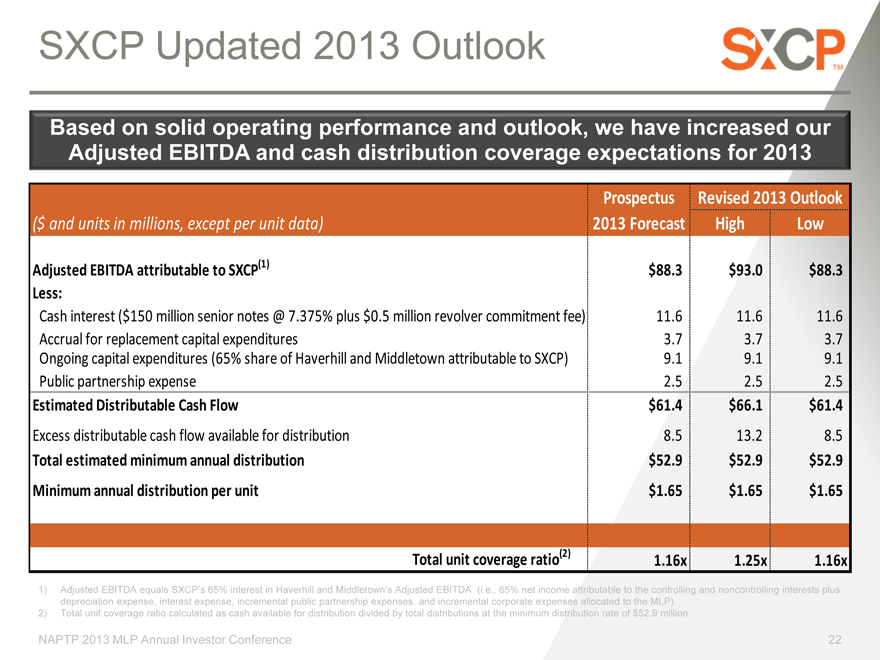
SXCP Updated 2013 Outlook
Based on solid operating performance and outlook, we have increased our Adjusted EBITDA and cash distribution coverage expectations for 2013
Prospectus Revised 2013 Outlook
($ and units in millions, except per unit data) 2013 Forecast High Low
Adjusted EBITDA attributable to SXCP(1) $ 88.3 $93.0 $ 88.3
Less:
Cash interest ($150 million senior notes @ 7.375% plus $0.5 million revolver commitment fee) 11.6 11.6 11.6
Accrual for replacement capital expenditures 3.7 3.7 3.7
Ongoing capital expenditures (65% share of Haverhill and Middletown attributable to SXCP) 9.1 9.1 9.1
Public partnership expense 2.5 2.5 2.5
Estimated Distributable Cash Flow $ 61.4 $66.1 $ 61.4
Excess distributable cash flow available for distribution 8.5 13.2 8.5
Total estimated minimum annual distribution $ 52.9 $52.9 $ 52.9
Minimum annual distribution per unit $ 1.65 $1.65 $ 1.65
Total unit coverage ratio(2) 1.16x 1.25x 1.16x
1) Adjusted EBITDA equals SXCP’s 65% interest in Haverhill and Middletown’s Adjusted EBITDA (i.e., 65% net income attributable to the controlling and noncontrolling interests plus depreciation expense, interest expense, incremental public partnership expenses, and incremental corporate expenses allocated to the MLP).
2) Total unit coverage ratio calculated as cash available for distribution divided by total distributions at the minimum distribution rate of $52.9 million.
NAPTP 2013 MLP Annual Investor Conference
22
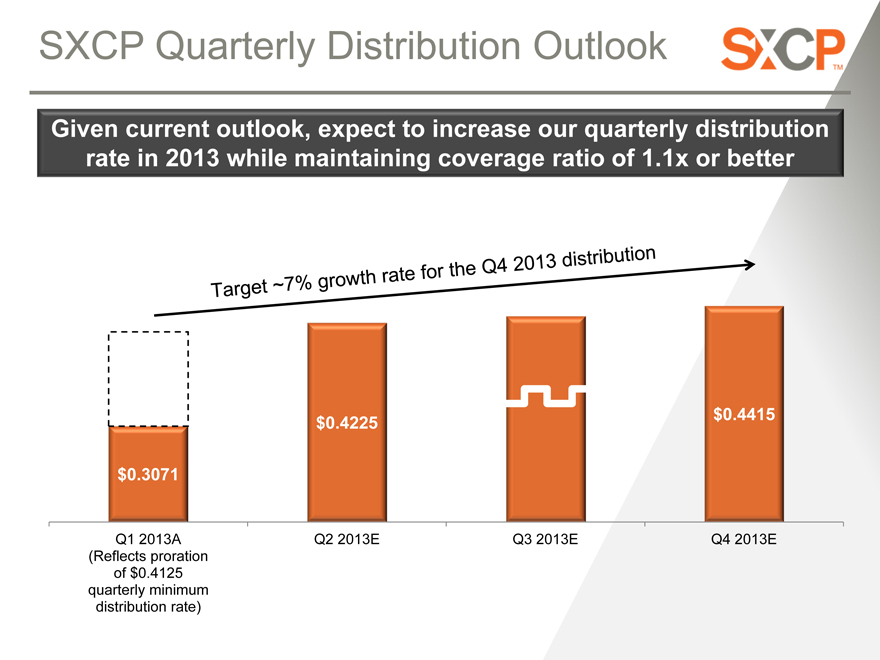
SXCP Quarterly Distribution Outlook
Given current outlook, expect to increase our quarterly distribution rate in 2013 while maintaining coverage ratio of 1.1x or better
$0.4225 $0.4415
$0.3071
Q1 2013A Q2 2013E Q3 2013E Q4 2013E
(Reflects proration
of $0.4125
quarterly minimum
distribution rate)

SXCP Highlights
SXCP Attributes
65% ownership interest in two modern facilities Modern, High- representing ~1.1 million tons of capacity Quality Assets • Leading cokemaking technology, an essential ingredient in blast furnace steel production
Long-term, take-or-pay contracts with leading
Stable Cash steelmakers
Flows Pass-through provisions on coal, transport, and other costs
Strong Sponsor Contractual backstop from SXC
Support Preferential rights to growth opportunities and sponsor assets
Replacement of aging coke batteries First Steel-Facing Acquisition of other existing batteries
MLP Advantage Potential to apply business model to coal handling and ferrous verticals in steel value chain
Financial Intentionally low leverage to facilitate future growth Flexibility Strong liquidity position at both SXC and SXCP
Unitholder Value
Solid Distributable Cash Flow Base
Near-term Distribution Growth
Potential Growth via Disaggregation of Steel Value Chain
NAPTP 2013 MLP Annual Investor Conference
24
QUESTIONS
NAPTP 2013 MLP Annual Investor Conference
25

Investor Relations: 630-824-1987 www.suncoke.com
APPENDIX
NAPTP 2013 MLP Annual Investor Conference
27
Definitions
Adjusted EBITDA represents earnings before interest, taxes, depreciation, depletion and amortization (“EBITDA”) adjusted for sales discounts and the interest, taxes, depreciation, depletion and amortization attributable to equity earnings in our unconsolidated affiliates. EBITDA reflects sales discounts included as a reduction in sales and other operating revenue. The sales discounts represent the sharing with customers of a portion of nonconventional fuel tax credits, which reduce our income tax expense. However, we believe our Adjusted EBITDA would be inappropriately penalized if these discounts were treated as a reduction of EBITDA since they represent sharing of a tax benefit that is not included in EBITDA. Accordingly, in computing Adjusted EBITDA, we have added back these sales discounts. Our Adjusted EBITDA also includes EBITDA attributable to our unconsolidated affiliates. EBITDA and Adjusted EBITDA do not represent and should not be considered alternatives to net income or operating income under GAAP and may not be comparable to other similarly titled measures in other businesses. Adjusted EBITDA does not represent and should not alternative to net income as determined by GAAP, and calculations thereof may not be comparable to those reported by other companies. We believe Adjusted EBITDA is an important measure of operating performance and provides useful information to investors because it highlights trends in our business that may not otherwise be apparent when relying solely on GAAP measures and because it eliminates items that have less bearing on our operating performance. Adjusted EBITDA is a measure of operating performance that is not defined by GAAP and should not be considered a substitute for net (loss) income as determined in accordance with GAAP.
Adjusted EBITDA attributable to SXC/SXCP equals Adjusted EBITDA less Adjusted EBITDA attributable to noncontrolling interests.
NAPTP 2013 MLP Annual Investor Conference
28
Definitions
Distributable Cash Flow equals Adjusted EBITDA less net cash paid for interest expense, on-going capital expenditures, accruals for replacement capital expenditures, and cash distributions to noncontrolling interests. Distributable Cash Flow is a non-GAAP supplemental financial measure that management and external users of the Partnership’s financial statements, such as industry analysts, investors, lenders, and rating agencies, use to assess:
the Partnership’s operating performance as compared to other publicly traded partnerships, without regard to historical cost basis; • the ability of the Partnership’s assets to generate sufficient cash flow to make distributions to the Partnership’s unitholders; • the Partnership’s ability to incur and service debt and fund capital expenditures; and • the viability of acquisitions and other capital expenditure projects and the returns on investment of various investment opportunities.
The Partnership believes that Distributable Cash Flow provides useful information to investors in assessing the
Partnership’s financial condition and results of operations. Distributable Cash Flow should not be considered an alternative to net income, operating income, cash flows from operating activities, or any other measure of financial performance or liquidity presented in accordance with generally accepted accounting principles (GAAP). Distributable Cash Flow has important limitations as an analytical tool because it excludes some, but not all, items that affect net income and net cash provided by operating activities and used in investing activities. Additionally, because Distributable Cash Flow may be defined differently by other companies in the industry, the Partnership’s definition of Distributable Cash Flow may not be comparable to similarly titled measures of other companies, thereby diminishing their utility.
NAPTP 2013 MLP Annual Investor Conference
29
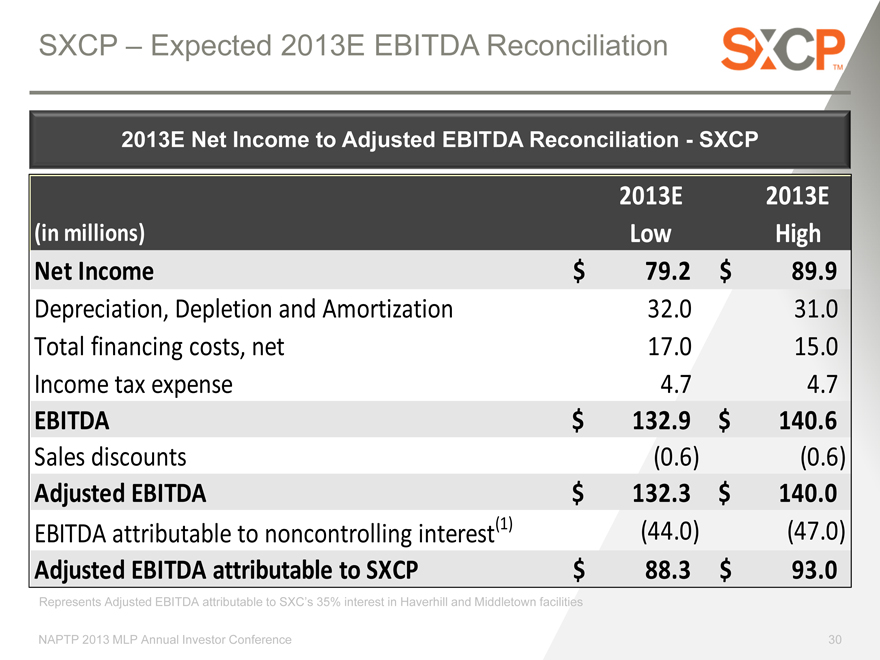
SXCP – Expected 2013E EBITDA Reconciliation
2013E Net Income to Adjusted EBITDA Reconciliation—SXCP
2013E 2013E
(in millions) Low High
Net Income $ 79.2 $ 89.9
Depreciation, Depletion and Amortization 32.0 31.0
Total financing costs, net 17.0 15.0
Income tax expense 4.7 4.7
EBITDA $ 132.9 $ 140.6
Sales discounts (0.6) (0.6)
Adjusted EBITDA $ 132.3 $ 140.0
EBITDA attributable to noncontrolling interest(1) (44.0) (47.0)
Adjusted EBITDA attributable to SXCP $ 88.3 $ 93.0
Represents Adjusted EBITDA attributable to SXC’s 35% interest in Haverhill and Middletown facilities
NAPTP 2013 MLP Annual Investor Conference
30
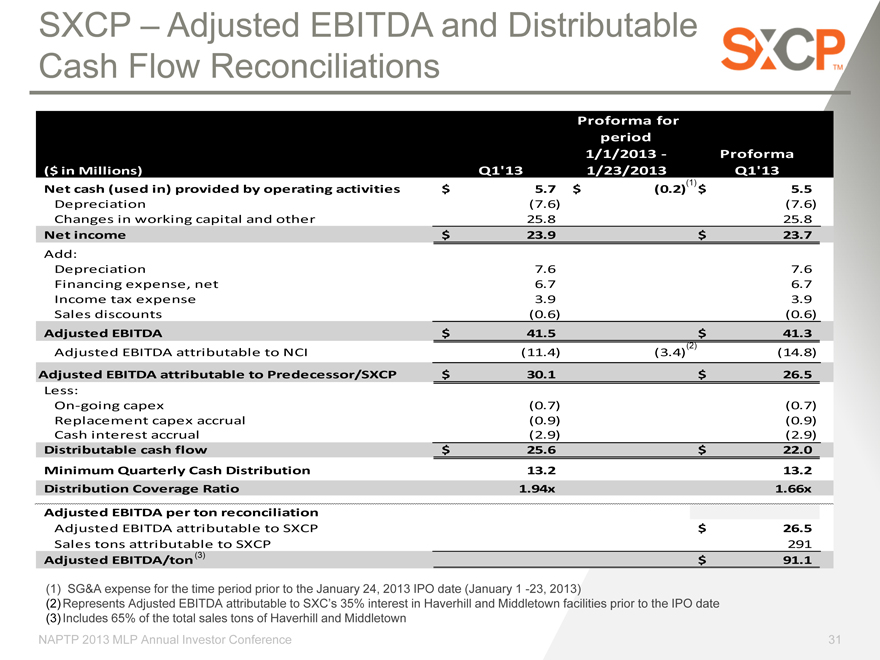
SXCP – Adjusted EBITDA and Distributable Cash Flow Reconciliations
Proforma for
period
1/1/2013— Proforma
($ in Millions) Q1’13 1/23/2013 Q1’13
Net cash (used in) provided by operating activities $ 5.7 $ (0.2)(1) $ .
Depreciation (7.6) (7.6)
Changes in working capital and other 25.8 25.8
Net income $ 23.9 $ 23.7
Add:
Depreciation 7.6 7.6
Financing expense, net 6.7 6.7
Income tax expense 3.9 3.9
Sales discounts (0.6) (0.6)
Adjusted EBITDA $ 41.5 $ 41.3
Adjusted EBITDA attributable to NCI (11.4) (3.4) (2) (14.8)
Adjusted EBITDA attributable to Predecessor/SXCP $ 30.1 $ 26.5
Less:
On-going capex (0.7) (0.7)
Replacement capex accrual (0.9) (0.9)
Cash interest accrual (2.9) (2.9)
Distributable cash flow $ 25.6 $ 22.0
Minimum Quarterly Cash Distribution 13.2 .
Distribution Coverage Ratio 1.94x 1.66x
Adjusted EBITDA per ton reconciliation
Adjusted EBITDA attributable to SXCP $ 26.5
Sales tons attributable to SXCP 291
Adjusted EBITDA/ton (3) $ 91.1
(1) SG&A expense for the time period prior to the January 24, 2013 IPO date (January 1 -23, 2013)
(2) Represents Adjusted EBITDA attributable to SXC’s 35% interest in Haverhill and Middletown facilities prior to the IPO date
(3) Includes 65% of the total sales tons of Haverhill and Middletown
NAPTP 2013 MLP Annual Investor Conference
31
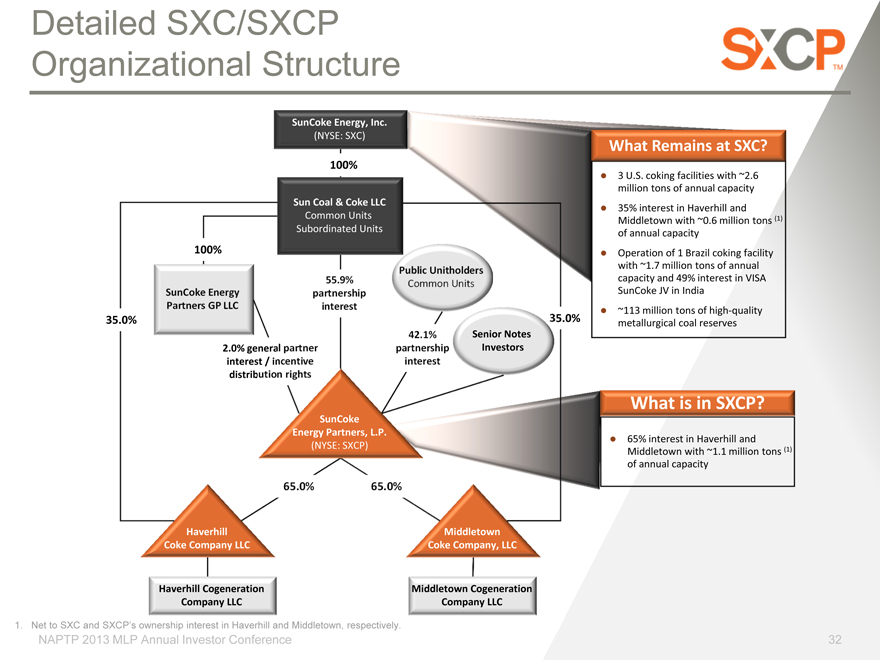
Detailed SXC/SXCP Organizational Structure
SunCoke Energy, Inc.
(NYSE: SXC)
What Remains at SXC
100%
z 3 U.S. coking facilities with ~2.6
million tons of annual capacity
Sun Coal & Coke LLC z 35% interest in Haverhill and
Common Units Middletown with ~0.6 million tons (1)
Subordinated Units of annual capacity
100% z Operation of 1 Brazil coking facility
Public Unitholders with ~1.7 million tons of annual
55.9% Common Units capacity and 49% interest in VISA
partnership SunCoke JV in India
interest z ~113 million tons of high-quality
35.0% 35.0% metallurgical coal reserves
42.1% Senior Notes
2.0% general partner partnership Investors
interest / incentive interest
distribution rights
What is in SXCP
SunCoke
Energy Partners, L.P.
z 65% interest in Haverhill and
(NYSE: SXCP) Middletown with ~1.1 million tons (1)
of annual capacity
65.0% 65.0%
Haverhill Middletown
Coke Company LLC Coke Company, LLC
Haverhill Cogeneration Middletown Cogeneration
Company LLC Company LLC
1. Net to SXC and SXCP’s ownership interest in Haverhill and Middletown, respectively.
NAPTP 2013 MLP Annual Investor Conference
32
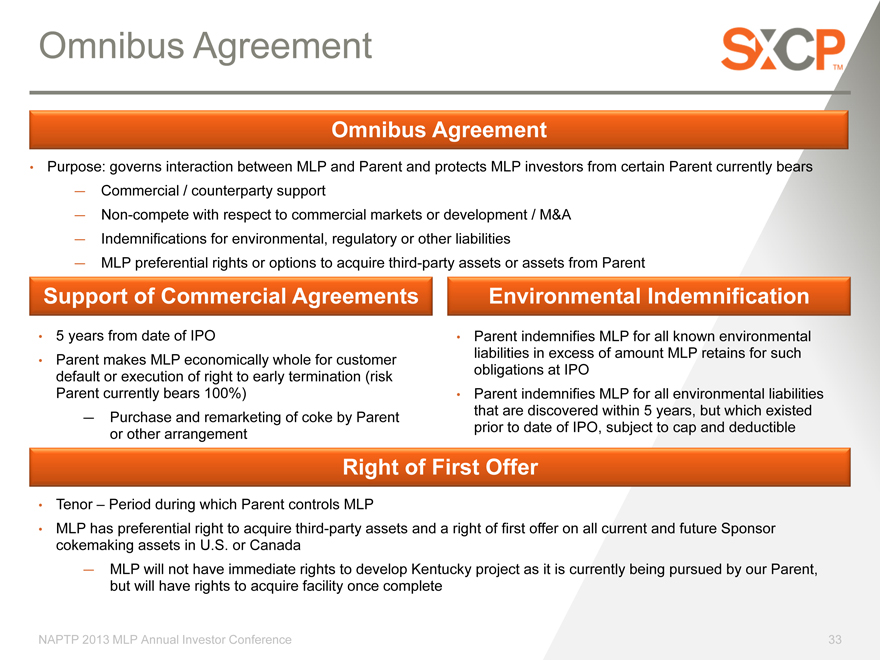
Omnibus Agreement
Omnibus Agreement
Purpose: governs interaction between MLP and Parent and protects MLP investors from certain Parent currently bears
Commercial / counterparty support
Non-compete with respect to commercial markets or development / M&A
Indemnifications for environmental, regulatory or other liabilities
MLP preferential rights or options to acquire third-party assets or assets from Parent
Support of Commercial Agreements Environmental Indemnification
5 years from date of IPO Parent indemnifies MLP for all known environmental liabilities in excess of amount MLP retains for such
Parent makes MLP economically whole for customer obligations at IPO default or execution of right to early termination (risk
Parent currently bears 100%) Parent indemnifies MLP for all environmental liabilities that are discovered within 5 years, but which existed
Purchase and remarketing of coke by Parent prior to date of IPO, subject to cap and deductible or other arrangement
Right of First Offer
Tenor – Period during which Parent controls MLP
MLP has preferential right to acquire third-party assets and a right of first offer on all current and future Sponsor cokemaking assets in U.S. or Canada
MLP will not have immediate rights to develop Kentucky project as it is currently being pursued by our Parent, but will have rights to acquire facility once complete
NAPTP 2013 MLP Annual Investor Conference
33