Exhibit 99.1
Exhibit 99.1
Goldman Sachs
Metals &
Mining/Steel
Conference
November 20, 2013
Forward-Looking Statements TM
Some of the information included in this presentation constitutes “forward-looking statements” as defined in Section 27A of the Securities Act of 1933, as amended and Section 21E of the Securities Exchange Act of 1934, as amended. All statements in this presentation that express opinions, expectations, beliefs, plans, objectives, assumptions or projections with respect to anticipated future performance of SunCoke Energy,
Inc. (“SunCoke”) or SunCoke Energy Partners, L.P. (“Partnership”), in contrast with statements of historical facts, are forward-looking statements. Such forward-looking statements are based on management’s beliefs and assumptions and on information currently available.
Forward-looking statements include information concerning possible or assumed future results of operations, business strategies, financing plans, competitive position, potential growth opportunities, potential operating performance improvements, the effects of competition and the effects of future legislation or regulations. Forward-looking statements include all statements that are not historical facts and may be identified by the use of forward-looking terminology such as the words “believe,” “expect,” “plan,” “intend,” “anticipate,” “estimate,” “predict,” “potential,” “continue,” “may,” “will,” “should” or the negative of these terms or similar expressions.
Although management believes that its plans, intentions and expectations reflected in or suggested by the forward-looking statements made in this presentation are reasonable, no assurance can be given that these plans, intentions or expectations will be achieved when anticipated or at all. Moreover, such statements are subject to a number of assumptions, risks and uncertainties. Many of these risks are beyond the control of SunCoke and the Partnership, and may cause actual results to differ materially from those implied or expressed by the forward-looking statements. Each of SunCoke and the Partnership has included in its filings with the Securities and Exchange Commission (including, in the case of the Partnership, its Form S-1) cautionary language identifying important factors (but not necessarily all the important factors) that could cause actual results to differ materially from those expressed in any forward-looking statement. For more information concerning these factors, see the Securities and Exchange Commission filings of SunCoke and the Partnership. All forward-looking statements included in this presentation are expressly qualified in their entirety by such cautionary statements. Although forward-looking statements are based on current beliefs and expectations, caution should be taken not to place undue reliance on any such forward-looking statements because such statements speak only as of the date hereof. Neither SunCoke nor the Partnership has any intention or obligation to update publicly any forward-looking statement (or its associated cautionary language) whether as a result of new information or future events or after the date of this presentation, except as required by applicable law.
This presentation includes certain non-GAAP financial measures intended to supplement, not substitute for, comparable GAAP measures. Reconciliations of non-GAAP financial measures to GAAP financial measures are provided in the Appendix at the end of the presentation. Investors are urged to consider carefully the comparable GAAP measures and the reconciliations to those measures provided in the Appendix.
Goldman Sachs Metals & Mining/Steel Conf.—Nov 2013
2
ABOUT SUNCOKE
Goldman Sachs Metals & Mining/Steel Conf.—Nov 2013
3
About SunCoke TM
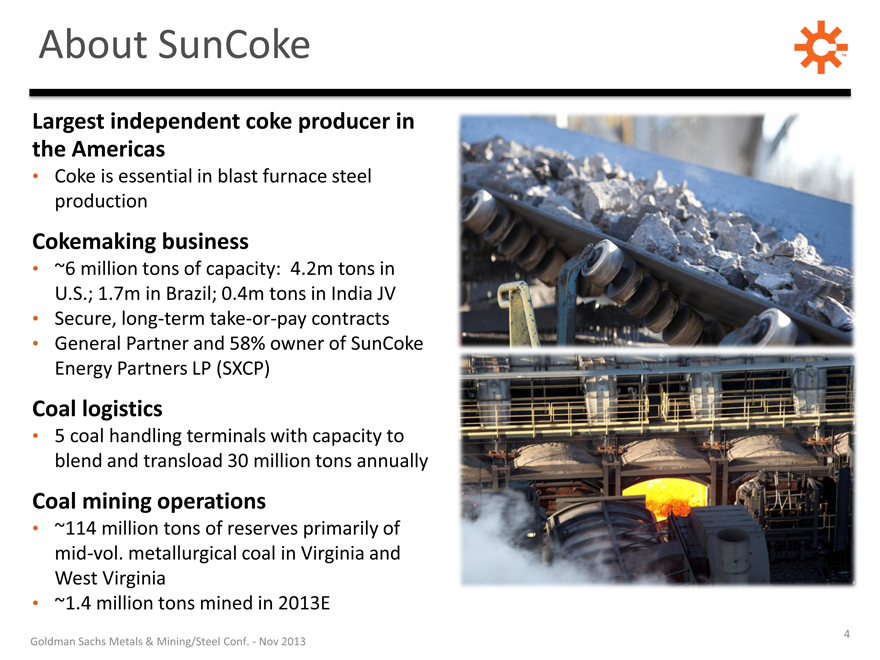
Largest independent coke producer in
the Americas
Coke is essential in blast furnace steel production
Cokemaking business
~6 million tons of capacity: 4.2m tons in U.S.; 1.7m in Brazil; 0.4m tons in India JV
Secure, long-term take-or-pay contracts
General Partner and 58% owner of SunCoke Energy Partners LP (SXCP)
Coal logistics
5 coal handling terminals with capacity to blend and transload 30 million tons annually
Coal mining operations
~114 million tons of reserves primarily of mid-vol. metallurgical coal in Virginia and West Virginia
~1.4 million tons mined in 2013E
Goldman Sachs Metals & Mining/Steel Conf.—Nov 2013
4
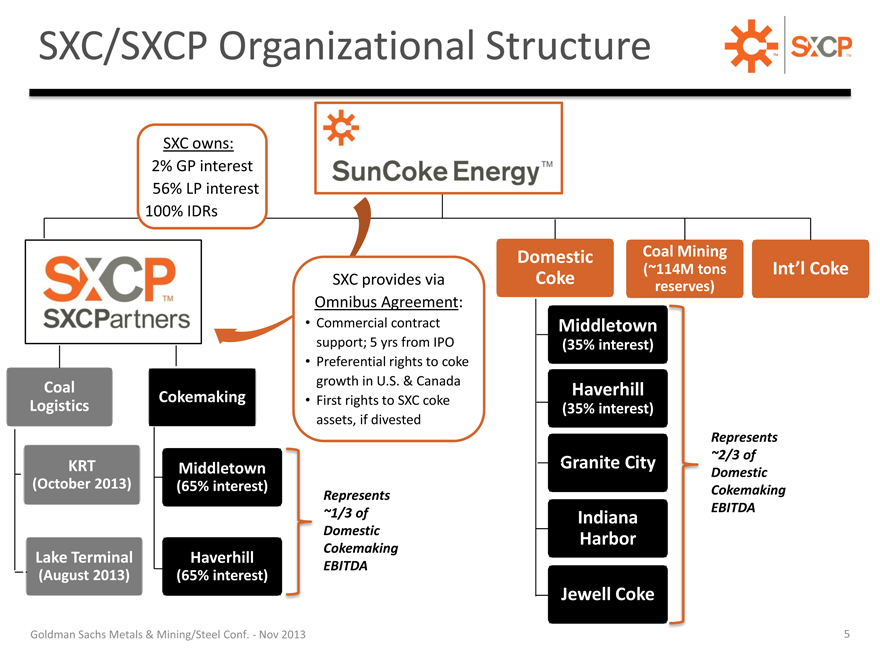
SXC/SXCP Organizational Structure TM
SXC owns:
2% GP interest
56% LP interest
100% IDRs
Domestic Coal Mining
(~114M tons Int’l Coke
SXC provides via Coke reserves)
Omnibus Agreement:
• Commercial contract Middletown
support; 5 yrs from IPO(35% interest)
• Preferential rights to coke
Coal growth in U.S. & Canada Haverhill
Cokemaking • First rights to SXC coke
Logistics(35% interest)
assets, if divested
Represents
Granite City ~2/3 of
KRT Middletown Domestic
(October 2013)(65% interest) Represents Cokemaking
~1/3 of Indiana EBITDA
Domestic Harbor
Cokemaking
Lake Terminal Haverhill EBITDA
(August 2013)(65% interest)
Jewell Coke
Goldman Sachs Metals & Mining/Steel Conf.—Nov 2013
5
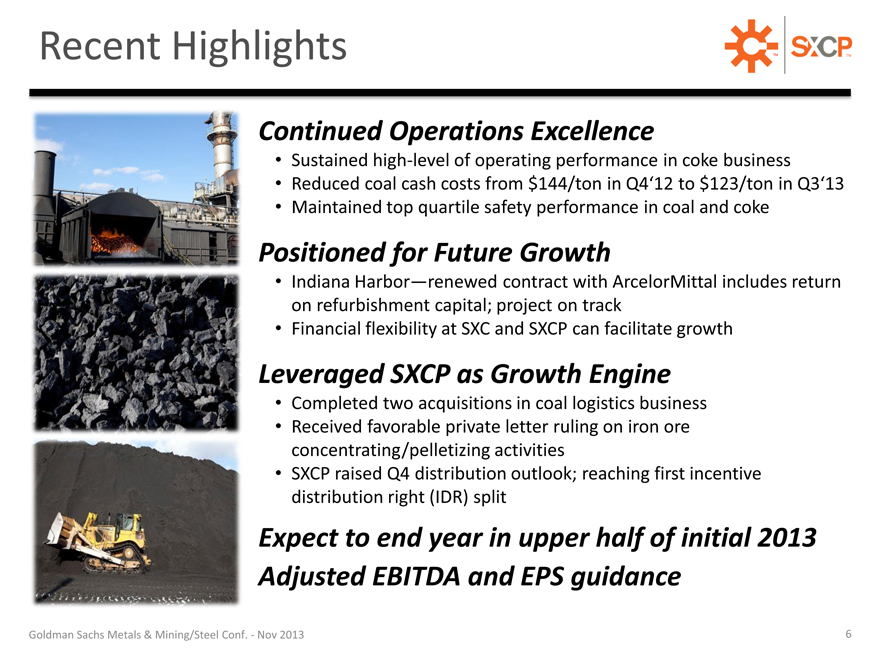
Recent Highlights TM
Continued Operations Excellence
Sustained high-level of operating performance in coke business
Reduced coal cash costs from $144/ton in Q4‘12 to $123/ton in Q3‘13
Maintained top quartile safety performance in coal and coke
Positioned for Future Growth
Indiana Harbor—renewed contract with ArcelorMittal includes return on refurbishment capital; project on track
Financial flexibility at SXC and SXCP can facilitate growth
Leveraged SXCP as Growth Engine
Completed two acquisitions in coal logistics business
Received favorable private letter ruling on iron ore concentrating/pelletizing activities
SXCP raised Q4 distribution outlook; reaching first incentive distribution right (IDR) split
Expect to end year in upper half of initial 2013 Adjusted EBITDA and EPS guidance
Goldman Sachs Metals & Mining/Steel Conf.—Nov 2013
6

OUR MARKET OPPORTUNITY
Goldman Sachs Metals & Mining/Steel Conf.—Nov 2013
7
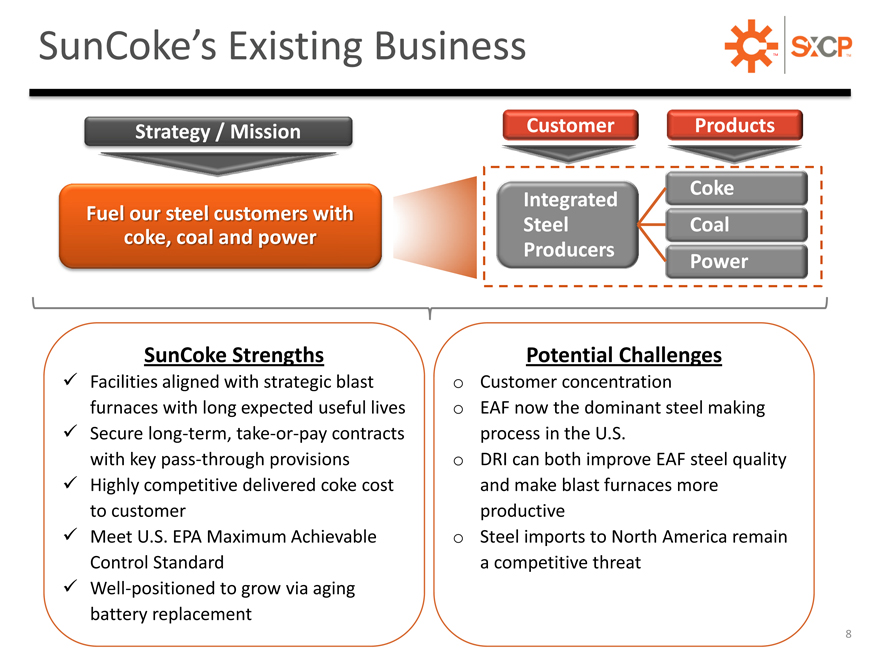
SunCoke’s Existing Business
Strategy / Mission
Fuel our steel customers with coke, coal and power
SunCoke Strengths
Facilities aligned with strategic blast furnaces with long expected useful lives
Secure long-term, take-or-pay contracts with key pass-through provisions
Highly competitive delivered coke cost to customer
Meet U.S. EPA Maximum Achievable Control Standard
Well-positioned to grow via aging battery replacement
Customer Products
Integrated Coke
Steel Coal
Producers Power
Potential Challenges
Customer concentration
EAF now the dominant steel making process in the U.S.
DRI can both improve EAF steel quality and make blast furnaces more productive
Steel imports to North America remain a competitive threat
8
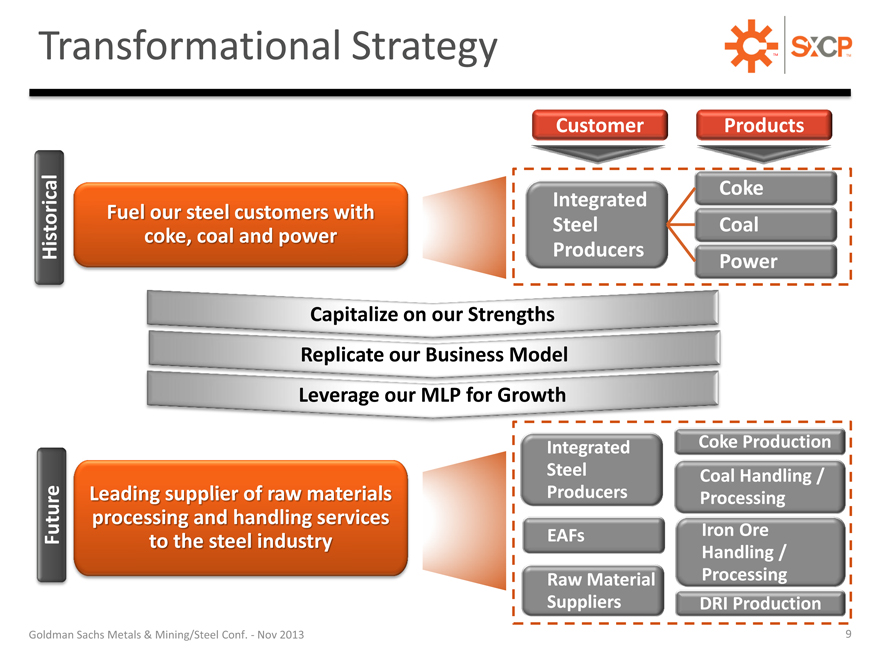
Transformational Strategy TM
Customer Products
Integrated Coke
Fuel our steel customers with
coke, coal and power Steel Coal
Historical Producers Power
Capitalize on our Strengths
Replicate our Business Model
Leverage our MLP for Growth
Integrated Coke Production
Steel Coal Handling /
Leading supplier of raw materials Producers Processing
processing and handling services
Future EAFs Iron Ore
to the steel industry Handling /
Raw Material Processing
Suppliers DRI Production
Goldman Sachs Metals & Mining/Steel Conf.—Nov 2013 9
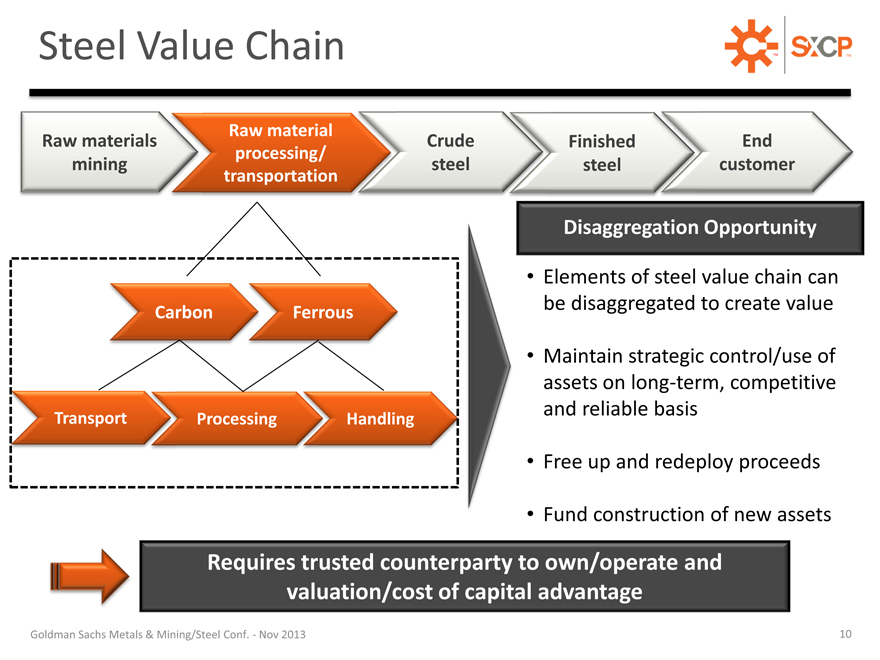
Steel Value Chain TM
Raw material
Raw materials Crude Finished End processing/ mining steel steel customer transportation
Disaggregation Opportunity
Carbon Ferrous
Transport Processing Handling
Elements of steel value chain can
be disaggregated to create value
Maintain strategic control/use of
assets on long-term, competitive
and reliable basis
Free up and redeploy proceeds
Fund construction of new assets
Requires trusted counterparty to own/operate and valuation/cost of capital advantage
Goldman Sachs Metals & Mining/Steel Conf.—Nov 2013
10
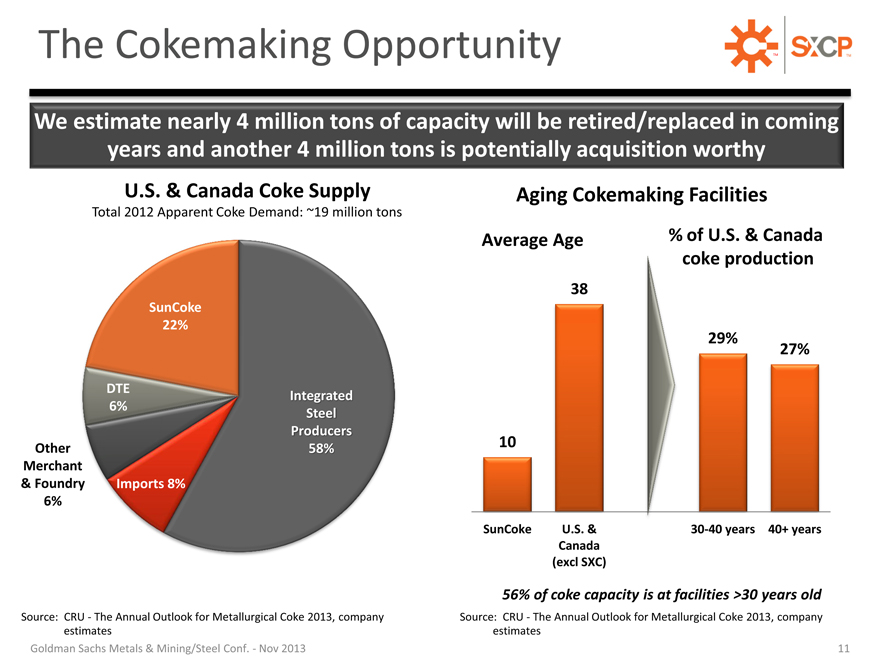
The Cokemaking Opportunity TM
We estimate nearly 4 million tons of capacity will be retired/replaced in coming
years and another 4 million tons is potentially acquisition worthy
U.S. & Canada Coke Supply Aging Cokemaking Facilities
Total 2012 Apparent Coke Demand: ~19 million tons
Average Age% of U.S. & Canada
coke production
38
SunCoke
22%
29%
27%
DTE Integrated
6% Steel
Producers
Other 58% 10
Merchant
& Foundry Imports 8%
6%
SunCoke U.S. & 30-40 years 40+ years
Canada
(excl SXC)
56% of coke capacity is at facilities >30 years old
Source: CRU—The Annual Outlook for Metallurgical Coke 2013, company Source: CRU—The Annual Outlook for Metallurgical Coke 2013, company
estimates estimates
Goldman Sachs Metals & Mining/Steel Conf.—Nov 2013 11
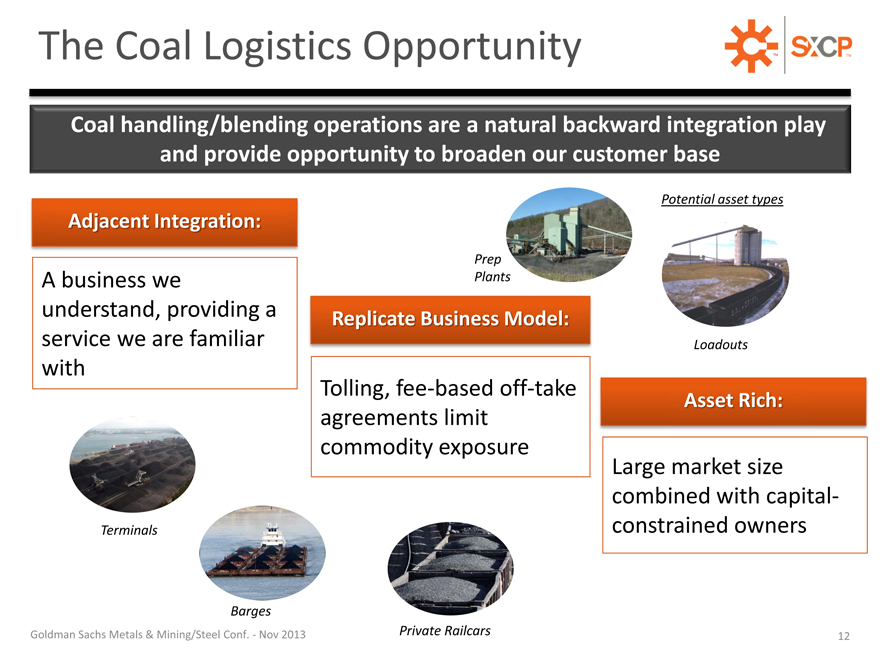
The Coal Logistics Opportunity TM
Coal handling/blending operations are a natural backward integration play
and provide opportunity to broaden our customer base
Potential asset types
Adjacent Integration:
Prep
A business we Plants
understand, providing a Replicate Business Model:
service we are familiar Loadouts
with
Tolling, fee-based off-take Asset Rich:
agreements limit
commodity exposure
Large market size
combined with capital-
Terminals constrained owners
Barges
Goldman Sachs Metals & Mining/Steel Conf.—Nov 2013 Private Railcars 12
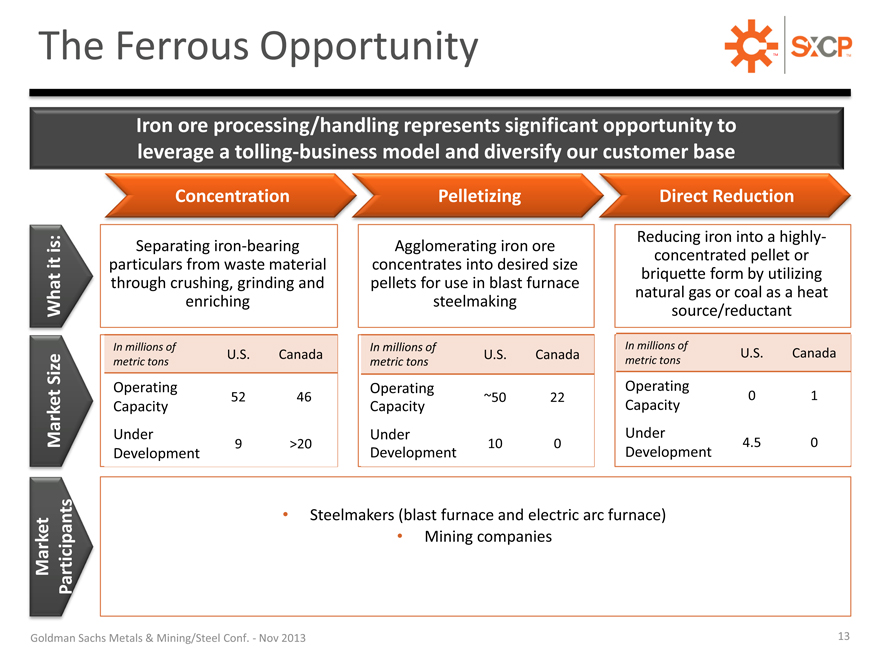
The Ferrous Opportunity TM
Iron ore processing/handling represents significant opportunity to leverage a tolling-business model and diversify our customer base
Concentration Pelletizing
is: Separating iron-bearing Agglomerating iron ore
it particulars from waste material concentrates into desired size
through crushing, grinding and pellets for use in blast furnace
What enriching steelmaking
In millions of In millions of
U.S. Canada U.S. Canada
Size metric tons metric tons
Operating Operating
52 46 ~50 22
Capacity Capacity
Market Under Under
9 >20 10 0
Development Development
Direct Reduction
Reducing iron into a highly-concentrated pellet or briquette form by utilizing natural gas or coal as a heat source/reductant
In millions of U.S. Canada
metric tons
Operating
0 1
Capacity
Under
4.5 0
Development
• Steelmakers (blast furnace and electric arc furnace)
Market Participants • Mining companies
Goldman Sachs Metals & Mining/Steel Conf.—Nov 2013
13
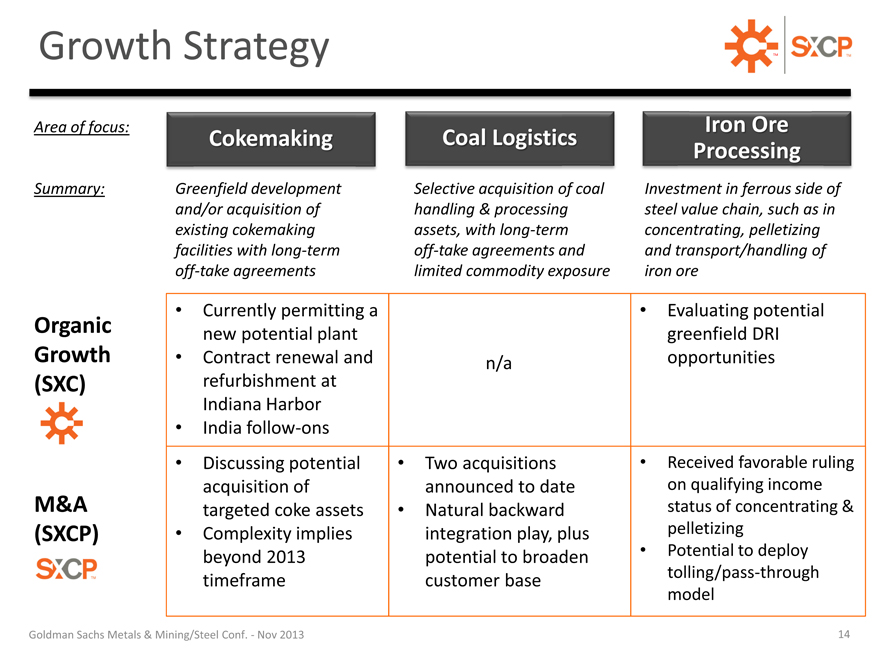
Growth Strategy
TM
Area of focus:
Cokemaking
Coal Logistics
Summary:
Greenfield development
Selective acquisition of coal
and/or acquisition of
handling & processing
existing cokemaking
assets, with long-term
facilities with long-term
off-take agreements and
off-take agreements
limited commodity exposure
Iron Ore
Processing
Investment in ferrous side of steel value chain, such as in concentrating, pelletizing and transport/handling of iron ore
Currently permitting a
Evaluating potential
Organic
new potential plant
greenfield DRI
Growth
Contract renewal and
n/a
opportunities
(SXC)
refurbishment at
Indiana Harbor
India follow-ons
Discussing potential
Two acquisitions
Received favorable ruling
acquisition of
announced to date
on qualifying income
M&A
targeted coke assets
Natural backward
status of concentrating &
(SXCP)
Complexity implies
integration play, plus
pelletizing
beyond 2013
potential to broaden
Potential to deploy
timeframe
customer base
tolling/pass-through
model
Goldman Sachs Metals & Mining/Steel Conf.—Nov 2013
14
QUESTIONS?
Goldman Sachs Metals & Mining/Steel Conf.—Nov 2013
15
APPENDIX
16
ABOUT SUNCOKE AND THE COKEMAKING PROCESS
17
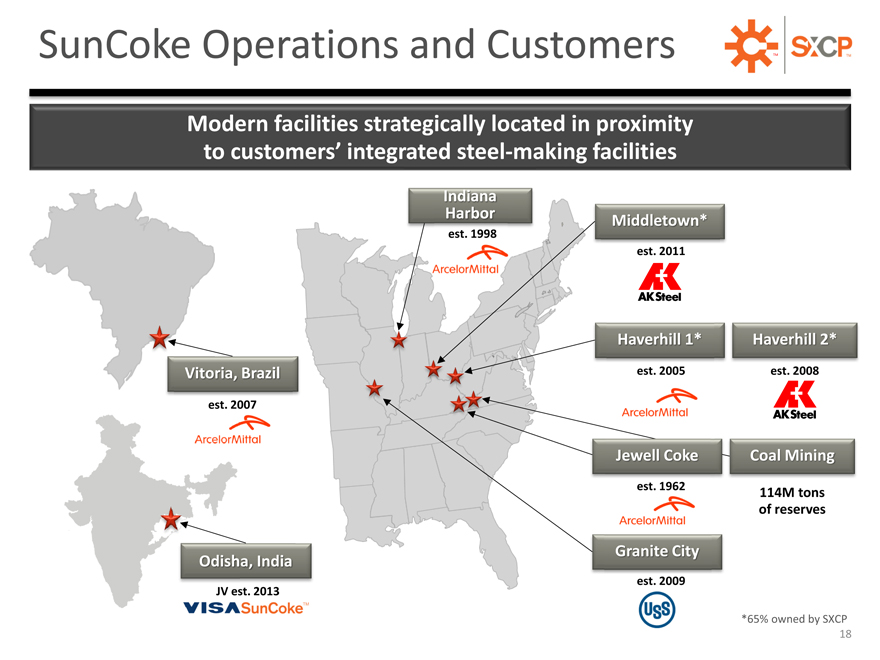
SunCoke Operations and Customers TM
Modern facilities strategically located in proximity
to customers’ integrated steel-making facilities
Indiana
Harbor Middletown*
est. 1998
est. 2011
Haverhill 1* Haverhill 2*
Vitoria, Brazil est. 2005 est. 2008
est. 2007
Jewell Coke Coal Mining
est. 1962 114M tons
of reserves
Granite City
Odisha, India
est. 2009
JV est. 2013
*65% owned by SXCP
18
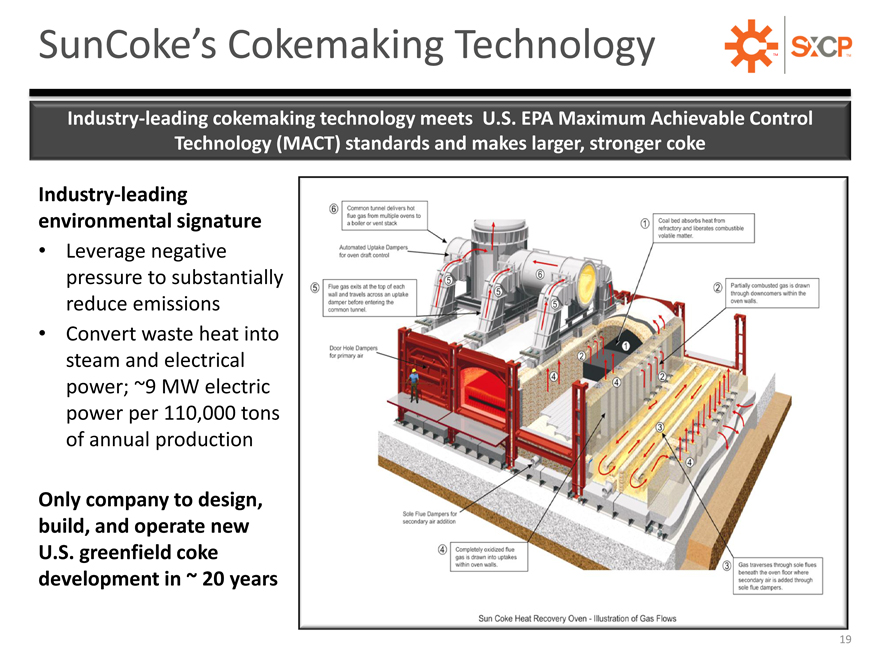
SunCoke’s Cokemaking Technology TM
Industry-leading cokemaking technology meets U.S. EPA Maximum Achievable Control
Technology (MACT) standards and makes larger, stronger coke
Industry-leading
environmental signature
Leverage negative pressure to substantially reduce emissions
Convert waste heat into steam and electrical power; ~9 MW electric power per 110,000 tons of annual production
Only company to design,
build, and operate new
U.S. greenfield coke
development in ~ 20 years
19
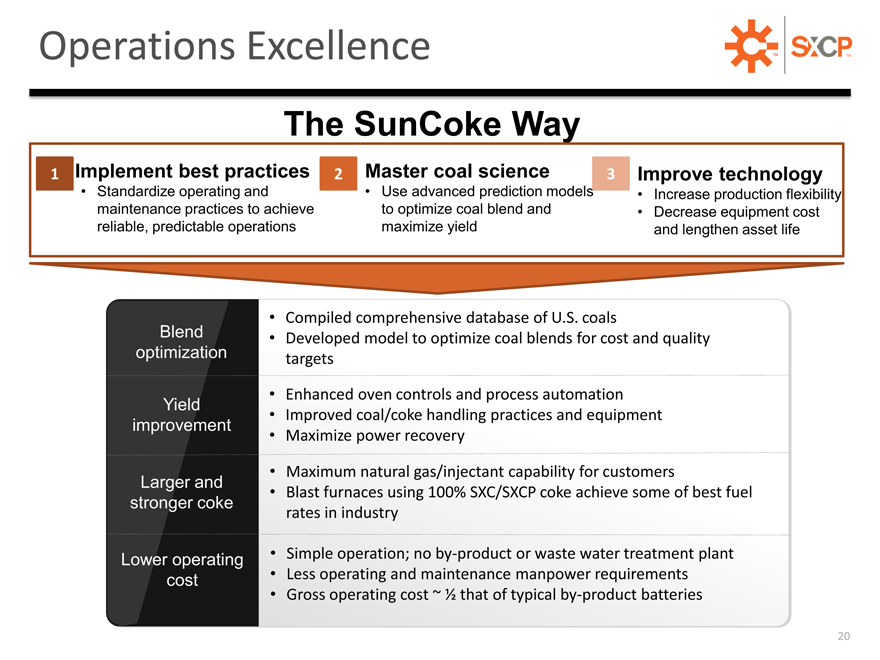
Operations Excellence TM
The SunCoke Way
1 Implement best practices 2 Master coal science 3 Improve technology
Standardize operating and Use advanced prediction models Increase production flexibility
maintenance practices to achieve to optimize coal blend and • Decrease equipment cost
reliable, predictable operations maximize yield and lengthen asset life
• Compiled comprehensive database of U.S. coals
Blend • Developed model to optimize coal blends for cost and quality
optimization targets
• Enhanced oven controls and process automation
Yield • Improved coal/coke handling practices and equipment
improvement • Maximize power recovery
• Maximum natural gas/injectant capability for customers
Larger and • Blast furnaces using 100% SXC/SXCP coke achieve some of best fuel
stronger coke rates in industry
Lower operating • Simple operation; no by-product or waste water treatment plant
cost • Less operating and maintenance manpower requirements
• Gross operating cost ~ 1/2 that of typical by-product batteries
20
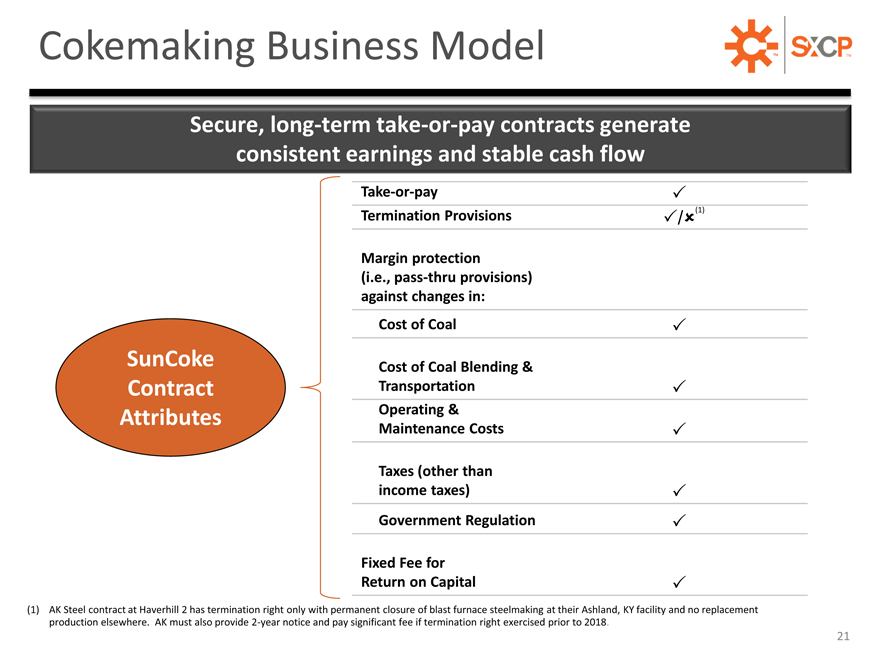
Cokemaking Business Model TM
Secure, long-term take-or-pay contracts generate consistent earnings and stable cash flow
Take-or-pay
Termination Provisions / (1)
Margin protection
(i.e., pass-thru provisions)
against changes in:
Cost of Coal
SunCoke Cost of Coal Blending &
Contract Transportation
Attributes Operating &
Maintenance Costs
Taxes (other than
income taxes)
Government Regulation
Fixed Fee for
Return on Capital
(1) AK Steel contract at Haverhill 2 has termination right only with permanent closure of blast furnace steelmaking at their Ashland, KY facility and no replacement production elsewhere. AK must also provide 2-year notice and pay significant fee if termination right exercised prior to 2018.
21
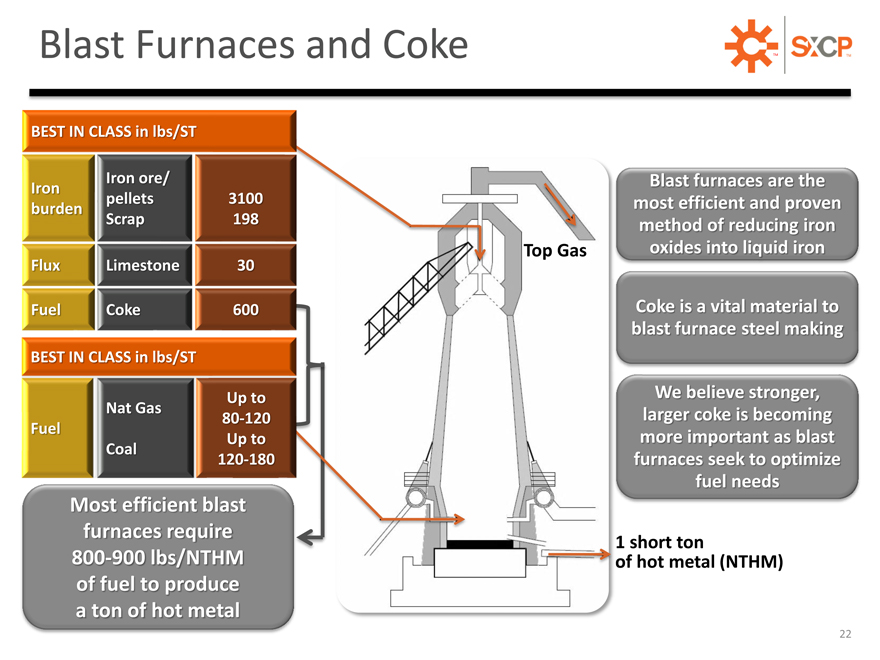
Blast Furnaces and Coke TM
BEST IN CLASS in lbs/ST
Iron Iron ore/ Blast furnaces are the
burden pellets 3100 most efficient and proven
Scrap 198 method of reducing iron
Top Gas oxides into liquid iron
Flux Limestone 30
Fuel Coke 600 Coke is a vital material to
blast furnace steel making
BEST IN CLASS in lbs/ST
Up to We believe stronger,
Nat Gas 80-120 larger coke is becoming
Fuel Up to more important as blast
Coal 120-180 furnaces seek to optimize
fuel needs
Most efficient blast
furnaces require 1 short ton
800 900 lbs/NTHM of hot metal (NTHM)
of fuel to produce
a ton of hot metal
22
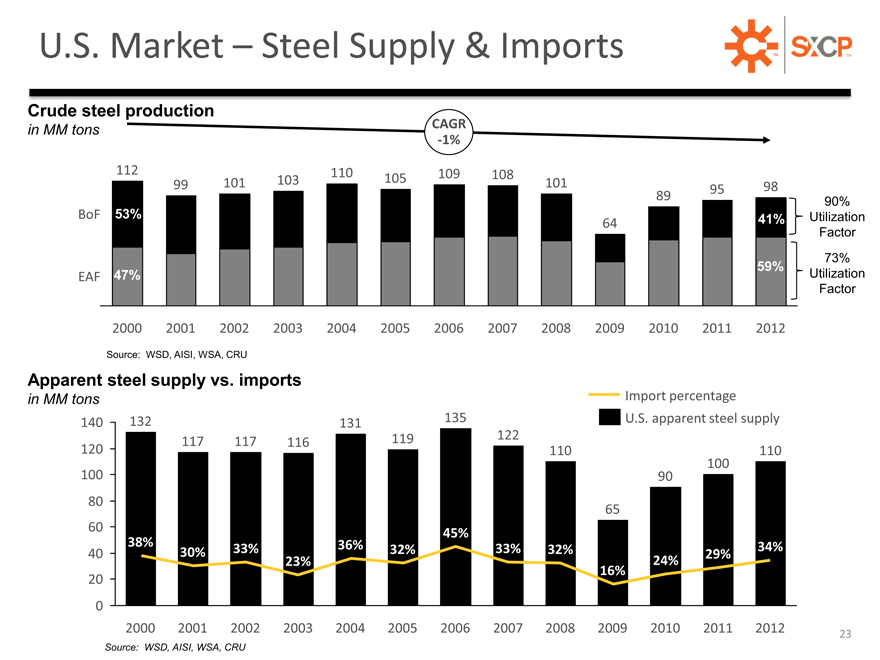
U.S. Market – Steel Supply & Imports TM
Crude steel production
in MM tons CAGR
-1%
112 110 105 109 108
99 101 103 101 95 98
89 90%
BoF 53% 41% Utilization
64
Factor
59% 73%
EAF 47% Utilization
Factor
2000 2001 2002 2003 2004 2005 2006 2007 2008 2009 2010 2011 2012
Source: WSD, AISI, WSA, CRU
Apparent steel supply vs. imports
in MM tons Import percentage
140 132 131 135 U.S. apparent steel supply
117 117 116 119 122
120 110 110
100
100 90
80 65
60 45%
40 38% 30% 33% 36% 32% 33% 32% 29% 34%
23% 24%
16%
20
0
2000 2001 2002 2003 2004 2005 2006 2007 2008 2009 2010 2011 2012 23
Source: WSD, AISI, WSA, CRU
SXC AND SXCP FINANCIAL RESULTS
24
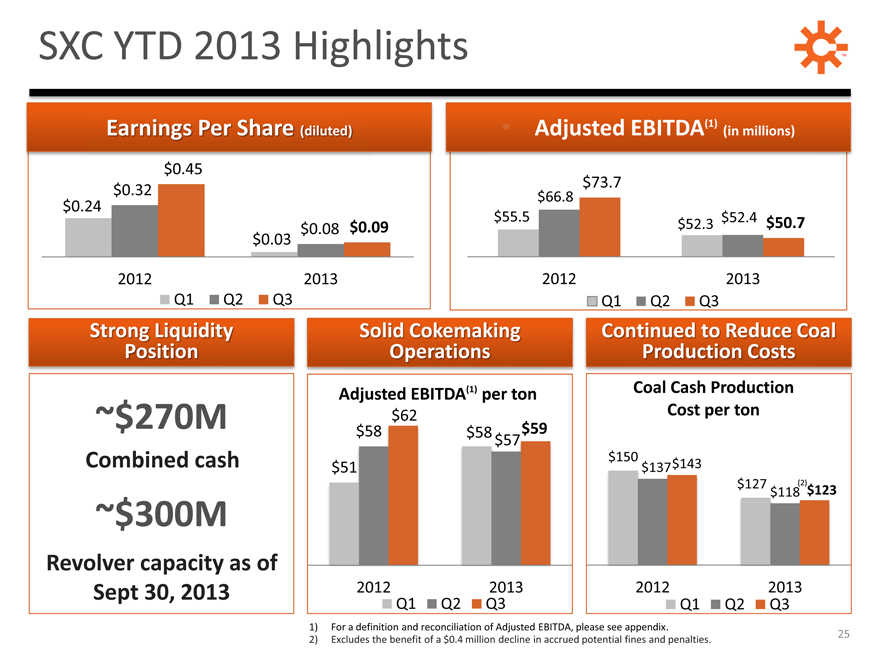
SXC YTD 2013 Highlights TM
Earnings Per Share (diluted) • Adjusted EBITDA(1) (in millions)
$0.45
$73.7
$0.32 $66.8
$0.24
$0.08 $0.09 $55.5 $52.3 $52.4 $50.7
$0.03
2012 2013 2012 2013
Q1 Q2 Q3 Q1 Q2 Q3
Strong Liquidity Solid Cokemaking Continued to Reduce Coal
Position Operations Production Costs
Adjusted EBITDA(1) per ton Coal Cash Production
~$270M $62 Cost per ton
$58 $58 $59
$57
Combined cash $51 $150 $137 $143
$127 $118(2) $123
~$300M
Revolver capacity as of
Sept 30, 2013 2012 2013 2012 2013
Q1 Q2 Q3 Q1 Q2 Q3
1) For a definition and reconciliation of Adjusted EBITDA, please see appendix.
2) Excludes the benefit of a $0.4 million decline in accrued potential fines and penalties. 25
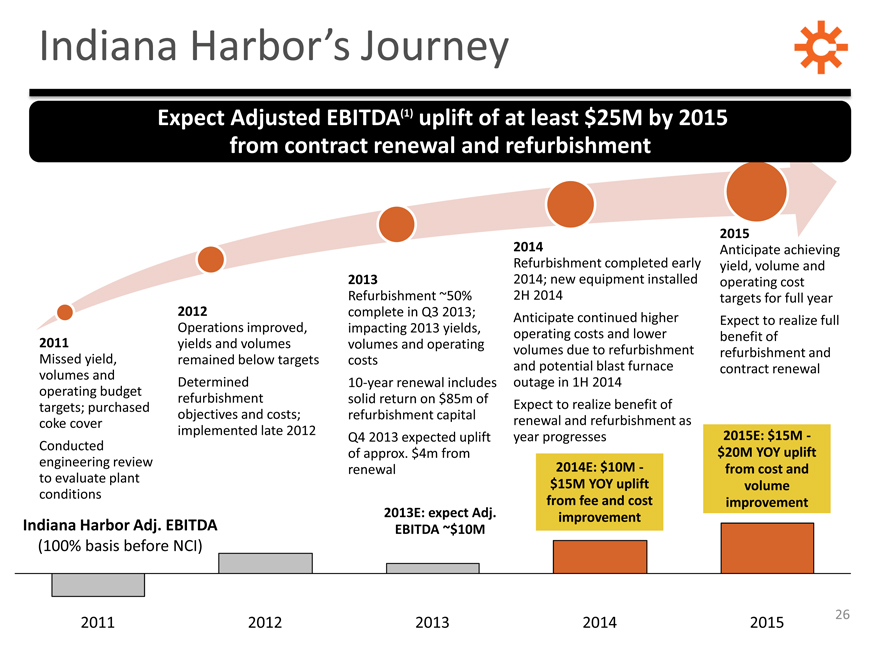
Indiana Harbor’s Journey
Expect Adjusted EBITDA(1) uplift of at least $25M by 2015
from contract renewal and refurbishment
2013
Refurbishment ~50%
2012 complete in Q3 2013;
Operations improved, impacting 2013 yields,
2011 yields and volumes volumes and operating
Missed yield, remained below targets costs
volumes and Determined 10-year renewal includes
operating budget refurbishment solid return on $85m of
targets; purchased objectives and costs; refurbishment capital
coke cover
implemented late 2012 Q4 2013 expected uplift
Conducted of approx. $4m from
engineering review renewal
to evaluate plant
conditions
2013E: expect Adj.
Indiana Harbor Adj. EBITDA EBITDA ~$10M
(100% basis before NCI)
2014
Refurbishment completed early 2014; new equipment installed
2H 2014
Anticipate continued higher operating costs and lower volumes due to refurbishment and potential blast furnace outage in 1H 2014 Expect to realize benefit of renewal and refurbishment as year progresses
2014E: $10M -$15M YOY uplift from fee and cost improvement
2015
Anticipate achieving yield, volume and operating cost targets for full year Expect to realize full benefit of refurbishment and contract renewal
2015E: $15M -$20M YOY uplift from cost and volume improvement
2011
2012
2013
2014
2015
26
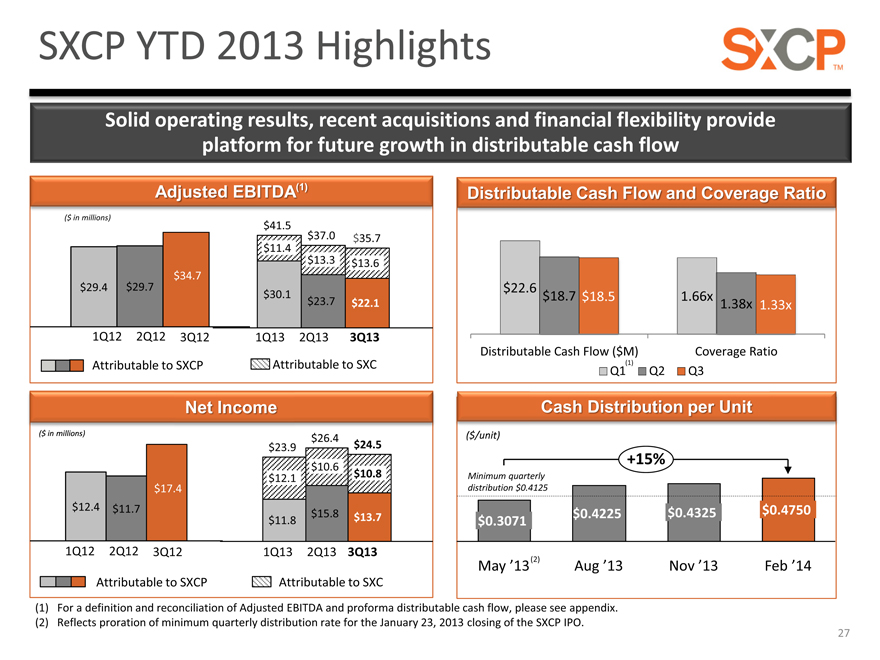
SXCP YTD 2013 Highlights
Solid operating results, recent acquisitions and financial flexibility provide
platform for future growth in distributable cash flow
Adjusted EBITDA(1)
($ in millions)
$41.5
$37.0 $35.7
$11.4
$13.3 $13.6
$34.7
$29.4 $29.7
$30.1
$23.7 $22.1
1Q12 2Q12 3Q12 1Q13 2Q13 3Q13
Attributable to SXCP Attributable to SXC
Net Income
($ in millions)
$26.4
$23.9 $24.5
$10.6
$12.1 $10.8
$17.4
$12.4 $11.7 $15.8
$11.8 $13.7
1Q12 2Q12 3Q12 1Q13 2Q13 3Q13
Attributable to SXCP Attributable to SXC
Distributable Cash Flow and Coverage Rati
$22.6
$18.7 $18.5 1.66x 1.38x 1.33x
Distributable Cash Flow ($M) Coverage Ratio
Q1(1) Q2 Q3
Cash Distribution per Unit
+15%
($/unit)
Minimum quarterly
distribution $0.4125
$0.3071 $0.4225 $0.4325 $0.4750
May ’13(2) Aug ’13 Nov ’13 Feb ’14
(1) For a definition and reconciliation of Adjusted EBITDA and proforma distributable cash flow, please see appendix.
(2) Reflects proration of minimum quarterly distribution rate for the January 23, 2013 closing of the SXCP IPO.
27
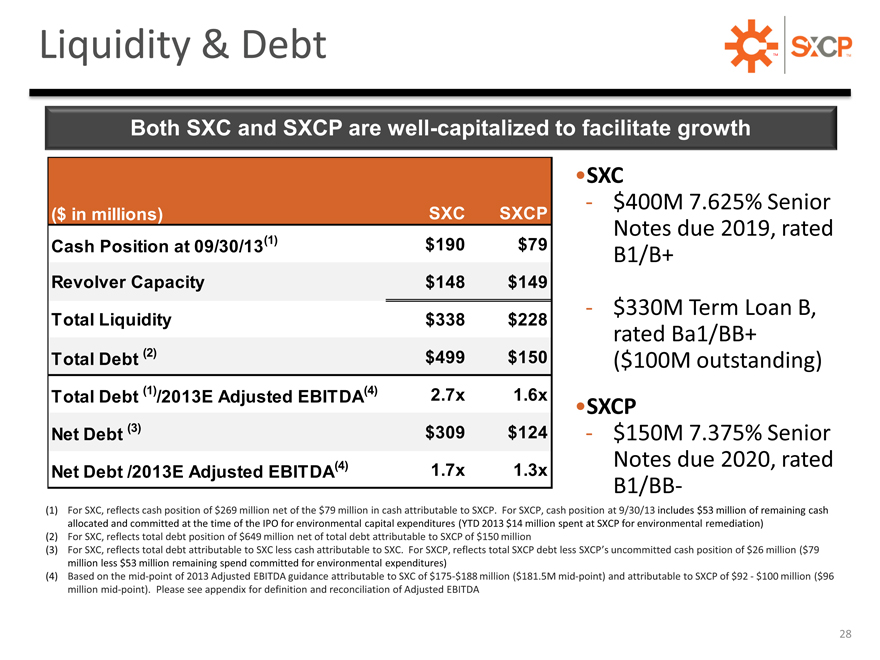
Liquidity & Debt TM
Both SXC and SXCP are well-capitalized to facilitate growth
($ in millions) SXC SXCP
Cash Position at 09/30/13(1) $190 $79
Revolver Capacity $148 $149
Total Liquidity $338 $228
Total Debt (2) $499 $150
Total Debt (1) /2013E Adjusted EBITDA(4) 2.7x 1.6x
Net Debt (3) $309 $124
Net Debt /2013E Adjusted EBITDA(4) 1.7x 1.3x
SXC
$400M 7.625% Senior Notes due 2019, rated B1/B+
$330M Term Loan B, rated Ba1/BB+ ($100M outstanding)
SXCP
$150M 7.375% Senior Notes due 2020, rated B1/BB-
For SXC, reflects cash position of $269 million net of the $79 million in cash attributable to SXCP. For SXCP, cash position at 9/30/13 includes $53 million of remaining cash allocated and committed at the time of the IPO for environmental capital expenditures (YTD 2013 $14 million spent at SXCP for environmental remediation)
For SXC, reflects total debt position of $649 million net of total debt attributable to SXCP of $150 million
For SXC, reflects total debt attributable to SXC less cash attributable to SXC. For SXCP, reflects total SXCP debt less SXCP’s uncommitted cash position of $26 million ($79 million less $53 million remaining spend committed for environmental expenditures)
Based on the mid-point of 2013 Adjusted EBITDA guidance attributable to SXC of $175-$188 million ($181.5M mid-point) and attributable to SXCP of $92—$100 million ($96 million mid-point). Please see appendix for definition and reconciliation of Adjusted EBITDA
28
DEFINITIONS AND RECONCILIATIONS
29
Definitions
Adjusted EBITDA represents earnings before interest, taxes, depreciation, depletion and amortization (“EBITDA”) adjusted for sales discounts and the interest, taxes, depreciation, depletion and amortization attributable to our equity method investment.
EBITDA reflects sales discounts included as a reduction in sales and other operating revenue. The sales discounts represent the sharing with customers of a portion of nonconventional fuel tax credits, which reduce our income tax expense. However, we believe our Adjusted EBITDA would be inappropriately penalized if these discounts were treated as a reduction of EBITDA since they represent sharing of a tax benefit that is not included in EBITDA. Accordingly, in computing Adjusted EBITDA, we have added back these sales discounts. Our Adjusted EBITDA also includes EBITDA attributable to our equity method investment. EBITDA and Adjusted EBITDA do not represent and should not be considered alternatives to net income or operating income under GAAP and may not be comparable to other similarly titled measures in other businesses. Management believes Adjusted EBITDA is an important measure of the operating performance of the Company’s net assets. We believe Adjusted EBITDA is an important measure of operating performance and provides useful information to investors because it highlights trends in our business that may not otherwise be apparent when relying solely on GAAP measures and because it eliminates items that have less bearing on our operating performance. Adjusted EBITDA is a measure of operating performance that is not defined by GAAP, does not represent and should not be considered a substitute for net income as determined in accordance with GAAP. Calculations of Adjusted EBITDA may not be comparable to those reported by other companies.
EBITDA represents earnings before interest, taxes, depreciation, depletion and amortization.
Adjusted EBITDA attributable to SXC/SXCP equals Adjusted EBITDA less Adjusted EBITDA attributable to noncontrolling interests.
Adjusted EBITDA/Ton represents Adjusted EBITDA divided by tons sold. When applicable to Adjusted EBITDA attributable to SXC or SXCP, tons sold are prorated according to the respective ownership interest of SXC or SXCP as applicable.
30
Definitions
Distributable Cash Flow equals Adjusted EBITDA less net cash paid for interest expense, on-going capital expenditures, accruals for replacement capital expenditures, and cash distributions to noncontrolling interests; plus amounts received under the Omnibus Agreement and acquisition expenses deemed to be Expansion Capital under our Partnership Agreement. Distributable Cash Flow is
a non-GAAP supplemental financial measure that management and external users of the Partnership’s financial statements, such as
industry analysts, investors, lenders and rating agencies use to assess:
the Partnership’s operating performance as compared to other publicly traded partnerships, without regard to historical cost basis; the ability of the Partnership’s assets to generate sufficient cash flow to make distributions to the Partnership’s unitholders; the Partnership’s ability to incur and service debt and fund capital expenditures; and the viability of acquisitions and other capital expenditure projects and the returns on investment of various investment opportunities.
The Partnership believes that Distributable Cash Flow provides useful information to investors in assessing the Partnership’s financial condition and results of operations. Distributable Cash Flow should not be considered an alternative to net income, operating income, cash flows from operating activities, or any other measure of financial performance or liquidity presented in accordance with generally accepted accounting principles (GAAP). Distributable Cash Flow has important limitations as an analytical tool because it excludes some, but not all, items that affect net income and net cash provided by operating activities and used in investing activities.
Additionally, because Distributable Cash Flow may be defined differently by other companies in the industry, the Partnership’s definition of Distributable Cash Flow may not be comparable to similarly titled measures of other companies, thereby diminishing their utility.
Ongoing capital expenditures (“capex”) are capital expenditures made to maintain the existing operating capacity of our assets and/or to extend their useful lives. Ongoing capex also include new equipment that improves the efficiency, reliability or effectiveness of existing assets. Ongoing capex does not include normal repairs and maintenance, which are expensed as incurred, or significant capital expenditures. For purposes of calculating distributable cash flow, the portion of ongoing capex attributable to SXCP is used.
Replacement capital expenditures (“capex”) represents an annual accrual necessary to fund SXCP’s share of the estimated costs to replace or rebuild our facilities at the end of their working lives. This accrual is estimated based on the average quarterly anticipated replacement capital that we expect to incur over the long term to replace our major capital assets at the end of their working lives. The replacement capex accrual estimate will be subject to review and prospective change by SXCP’s general partner at least annually and whenever an event occurs that causes a material adjustment of replacement capex, provided such change is approved by our conflicts committee.
31
Reconciliation from Net Income to Adjusted EBITDA
$ in millions
Q3 2013 Q2 2013 Q1 2013 FY 2012 Q4 2012 Q3 2012 Q2 2012 Q1 2012
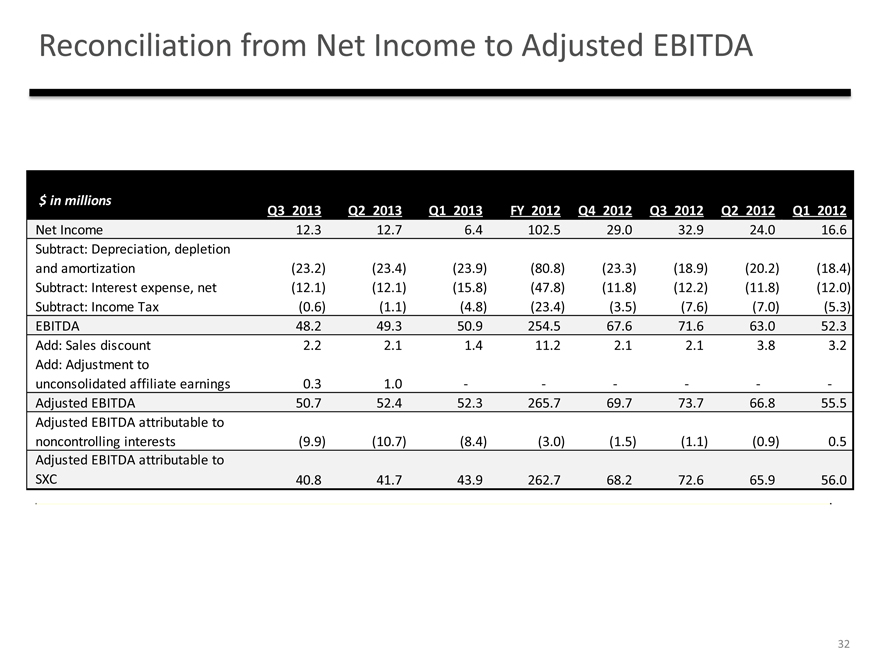
Net Income 12.3 12.7 6.4 102.5 29.0 32.9 24.0 16.6
Subtract: Depreciation, depletion
and amortization(23.2)(23.4)(23.9)(80.8)(23.3)(18.9)(20.2)(18.4)
Subtract: Interest expense, net(12.1)(12.1)(15.8)(47.8)(11.8)(12.2)(11.8)(12.0)
Subtract: Income Tax(0.6)(1.1)(4.8)(23.4)(3.5)(7.6)(7.0)(5.3)
EBITDA 48.2 49.3 50.9 254.5 67.6 71.6 63.0 52.3
Add: Sales discount 2.2 2.1 1.4 11.2 2.1 2.1 3.8 3.2
Add: Adjustment to
unconsolidated affiliate earnings 0.3 1.0 — — —
Adjusted EBITDA 50.7 52.4 52.3 265.7 69.7 73.7 66.8 55.5
Adjusted EBITDA attributable to
noncontrolling interests(9.9)(10.7)(8.4)(3.0)(1.5)(1.1)(0.9) 0.5
Adjusted EBITDA attributable to
SXC 40.8 41.7 43.9 262.7 68.2 72.6 65.9 56.0
32
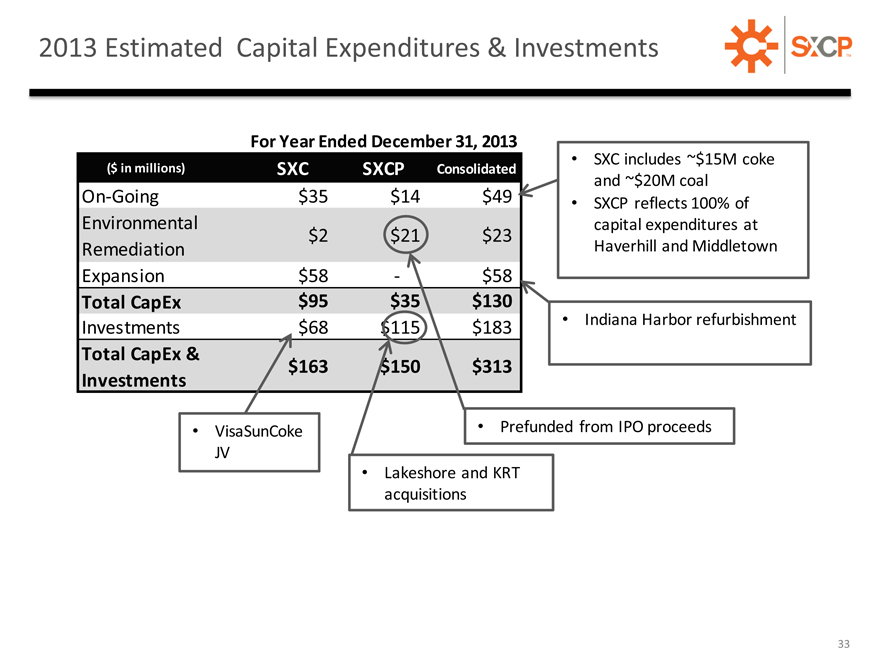
2013 Estimated Capital Expenditures & Investments
For Year Ended December 31, 2013
($ in millions)
SXC
SXCP
Consolidated
SXC includes ~$15M coke
and ~$20M coal
On-Going
$35
$14
$49
SXCP reflects 100% of
Environmental
capital expenditures at
$2
$21
$23
Remediation
Haverhill and Middletown
Expansion
$58
-
$58
Total CapEx
$95
$35
$130
Investments
$68
$115
$183
Indiana Harbor refurbishment
Total CapEx &
$163
$150
$313
Investments
VisaSunCoke
Prefunded from IPO proceeds
JV
Lakeshore and KRT acquisitions
33
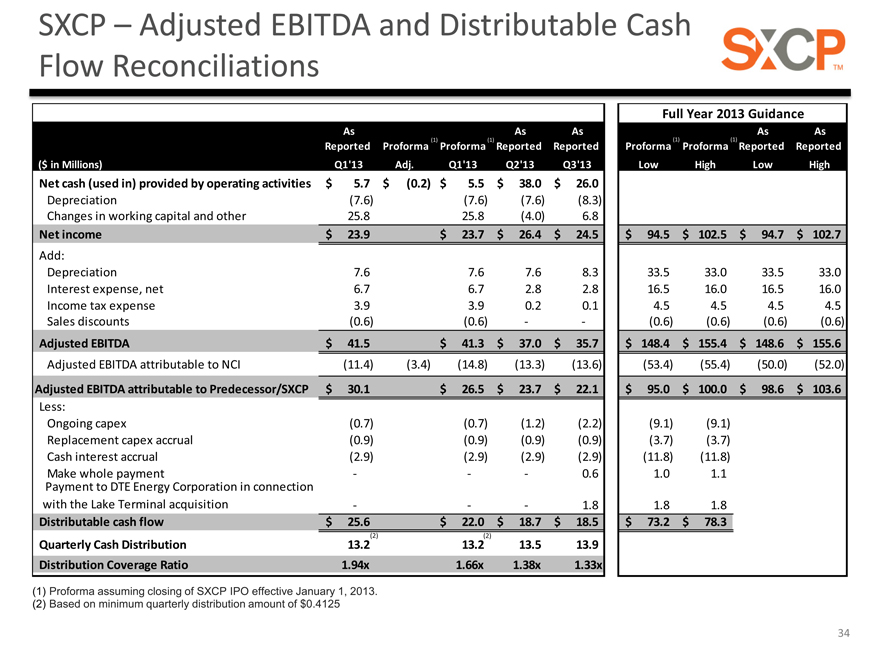
SXCP – Adjusted EBITDA and Distributable Cash
Flow Reconciliations
Full Year 2013 Guidance
As As As As As
Reported Proforma (1) Proforma (1) Reported Reported Proforma (1) Proforma (1) Reported Reported
($ in Millions) Q1’13 Adj. Q1’13 Q2’13 Q3’13 Low High Low High
Net cash (used in) provided by operating activities $ 5.7 $ (0.2) $ 5.5 $ 38.0 $ 26.0
Depreciation(7.6)(7.6)(7.6)(8.3)
Changes in working capital and other 25.8 25.8(4.0) 6.8
Net income $ 23.9 $ 23.7 $ 26.4 $ 24.5 $ 94.5 $ 102.5 $ 94.7 $ 102.7
Add:
Depreciation 7.6 7.6 7.6 8.3 33.5 33.0 33.5 33.0
Interest expense, net 6.7 6.7 2.8 2.8 16.5 16.0 16.5 16.0
Income tax expense 3.9 3.9 0.2 0.1 4.5 4.5 4.5 4.5
Sales discounts(0.6)(0.6) —(0.6)(0.6)(0.6)(0.6)
Adjusted EBITDA $ 41.5 $ 41.3 $ 37.0 $ 35.7 $ 148.4 $ 155.4 $ 148.6 $ 155.6
Adjusted EBITDA attributable to NCI(11.4)(3.4)(14.8)(13.3)(13.6)(53.4)(55.4)(50.0)(52.0)
Adjusted EBITDA attributable to Predecessor/SXCP $ 30.1 $ 26.5 $ 23.7 $ 22.1 $ 95.0 $ 100.0 $ 98.6 $ 103.6
Less:
Ongoing capex(0.7)(0.7)(1.2)(2.2)(9.1)(9.1)
Replacement capex accrual(0.9)(0.9)(0.9)(0.9)(3.7)(3.7)
Cash interest accrual(2.9)(2.9)(2.9)(2.9)(11.8)(11.8)
Make whole payment ——0.6 1.0 1.1
Payment to DTE Energy Corporation in connection
with the Lake Terminal acquisition ——1.8 1.8 1.8
Distributable cash flow $ 25.6 $ 22.0 $ 18.7 $ 18.5 $ 73.2 $ 78.3
(2)(2)
Quarterly Cash Distribution 13.2 13.2 13.5 13.9
Distribution Coverage Ratio 1.94x 1.66x 1.38x 1.33x
(1) Proforma assuming closing of SXCP IPO effective January 1, 2013.
(2) Based on minimum quarterly distribution amount of $0.4125
34
Investor Relations:
630-824-1987
www.suncoke.com