|
Exhibit 99.1 
|
Investor Meetings
SXCP Partners
March 2015
Forward-Looking Statements
Some of the information included in this presentation constitutes “forward-looking statements.” All statements in this presentation that express opinions, expectations, beliefs, plans, objectives, assumptions or projections with respect to anticipated future performance of SunCoke Energy, Inc. (SXC) or SunCoke Energy Partners, L.P. (SXCP), in contrast with statements of historical facts, are forward-looking statements. Such forward-looking statements are based on management’s beliefs and assumptions and on information currently available. Forward-looking statements include information concerning possible or assumed future results of operations, business strategies, financing plans, competitive position, potential growth opportunities, potential operating performance improvements, the effects of competition and the effects of future legislation or regulations. Forward-looking statements include all statements that are not historical facts and may be identified by the use of forward-looking terminology such as the words “believe,” “expect,” “plan,” “intend,” “anticipate,” “estimate,” “predict,” “potential,” “continue,” “may,” “will,” “should” or the negative of these terms or similar expressions.
Although management believes that its plans, intentions and expectations reflected in or suggested by the forward-looking statements made in this presentation are reasonable, no assurance can be given that these plans, intentions or expectations will be achieved when anticipated or at all. Moreover, such statements are subject to a number of assumptions, risks and uncertainties. Many of these risks are beyond the control of SXC and SXCP, and may cause actual results to differ materially from those implied or expressed by the forward-looking statements. Each of SXC and SXCP has included in its filings with the Securities and Exchange Commission cautionary language identifying important factors (but not necessarily all the important factors) that could cause actual results to differ materially from those expressed in any forward-looking statement. For more information concerning these factors, see the Securities and Exchange Commission filings of SXC and SXCP. All forward-looking statements included in this presentation are expressly qualified in their entirety by such cautionary statements. Although forward-looking statements are based on current beliefs and expectations, caution should be taken not to place undue reliance on any such forward-looking statements because such statements speak only as of the date hereof. SXC and SXCP do not have any intention or obligation to update publicly any forward-looking statement (or its associated cautionary language) after the date of this presentation whether as a result of new information or future events or otherwise, except as required by applicable law.
This presentation includes certain non-GAAP financial measures intended to supplement, not substitute for, comparable GAAP measures. Reconciliations of non-GAAP financial measures to GAAP financial measures are provided in the Appendix at the end of the presentation. Investors are urged to consider carefully the comparable GAAP measures and the reconciliations to those measures provided in the Appendix.
Investor Meetings – March 2015
SXC and SXCP
Investor Meetings – March 2015
WHO WE ARE
Investor Meetings – March 2015
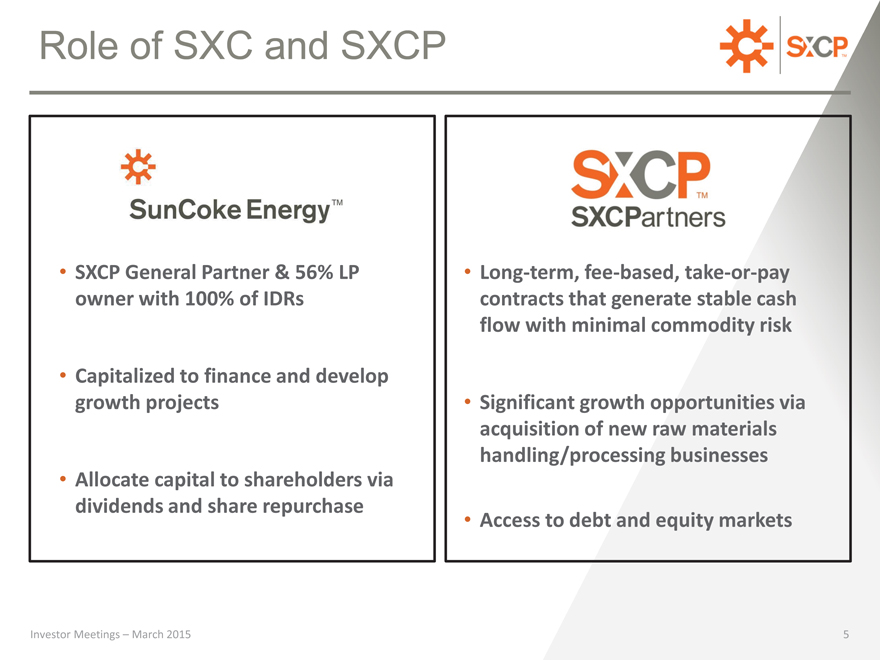
Role of SXC and SXCP
SXCP General Partner & 56% LP owner with 100% of IDRs
Capitalized to finance and develop growth projects
Allocate capital to shareholders via dividends and share repurchase
Long-term, fee-based, take-or-pay contracts that generate stable cash flow with minimal commodity risk
Significant growth opportunities via acquisition of new raw materials handling/processing businesses
Access to debt and equity markets
Investor Meetings – March 2015
5
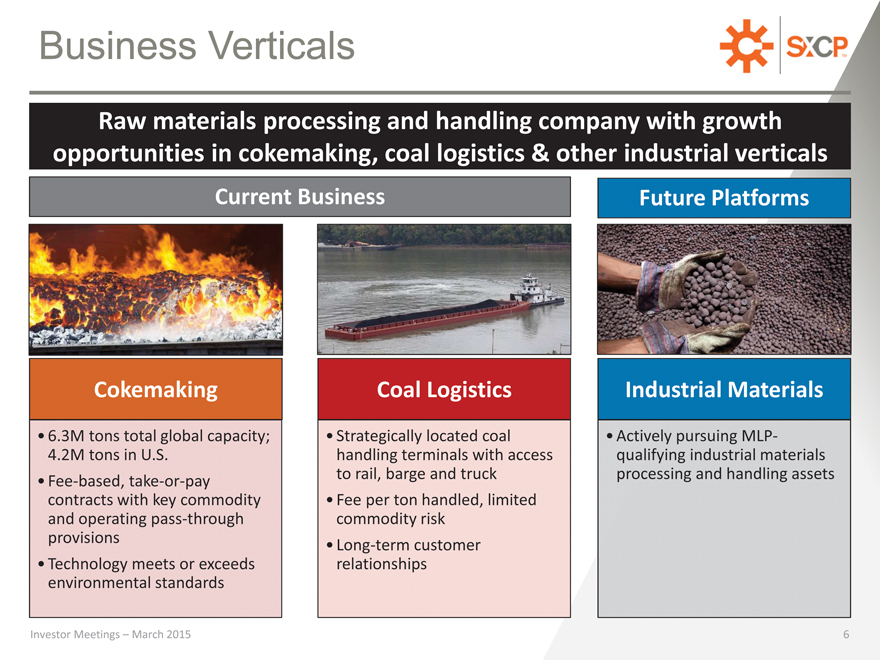
Business Verticals
Raw materials processing and handling company with growth opportunities in cokemaking, coal logistics & other industrial verticals
Current Business Future Platforms
Cokemaking Coal Logistics Industrial Materials
6.3M tons total global capacity;
4.2M tons in U.S.
Fee-based, take-or-pay contracts with key commodity and operating pass-through provisions
Technology meets or exceeds environmental standards
Strategically located coal handling terminals with access to rail, barge and truck
Fee per ton handled, limited commodity risk
Long-term customer relationships
Actively pursuing MLP-qualifying industrial materials processing and handling assets
Investor Meetings – March 2015
6
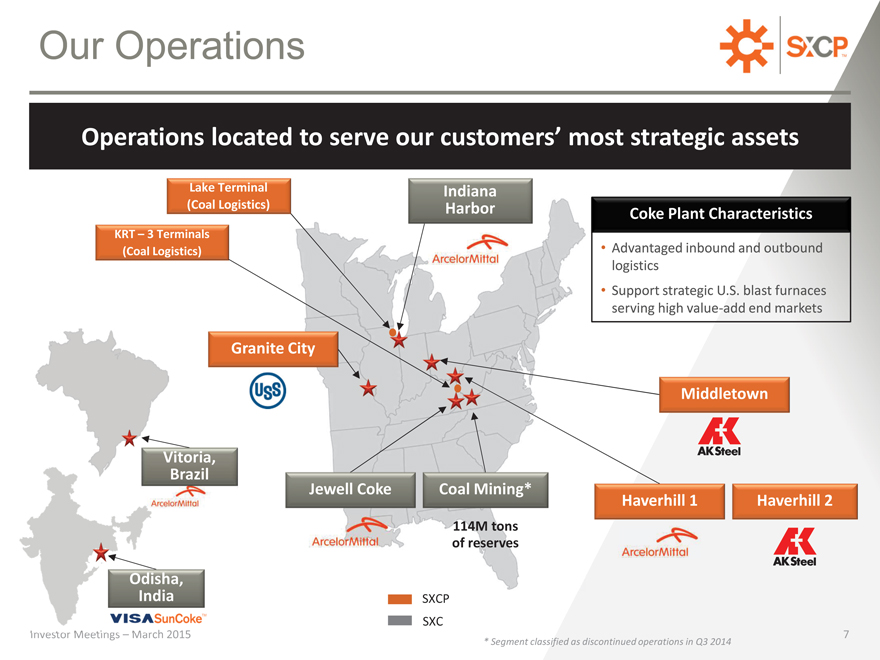
Our Operations
Operations located to serve our customers’ most strategic assets
Lake Terminal (Coal Logistics)
KRT – 3 Terminals (Coal Logistics)
Granite City
Vitoria, Brazil
Jewell Coke
Odisha, India
Investor Meetings – March 2015
Indiana
Harbor Coke Plant Characteristics
Advantaged inbound and outbound logistics
Support strategic U.S. blast furnaces serving high value-add end markets
Middletown
Coal Mining*
Haverhill 1 Haverhill 2
114M tons of reserves
SXCP
SXC
7
* Segment classified as discontinued operations in Q3 2014
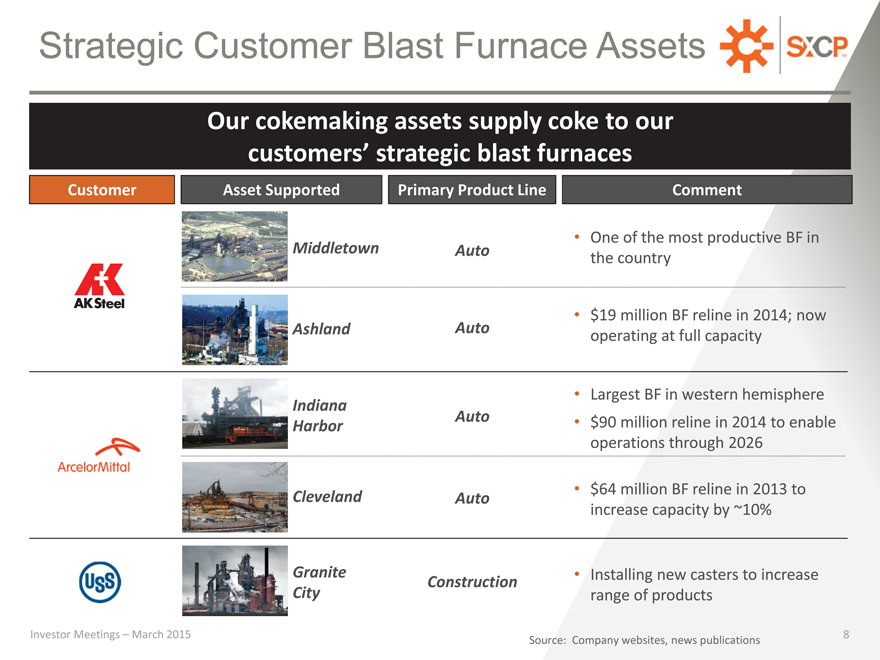
Strategic Customer Blast Furnace Assets
Our cokemaking assets supply coke to our customers’ strategic blast furnaces
Customer Asset Supported Primary Product Line Comment
One of the most productive BF in
Middletown Auto the country
$19 million BF reline in 2014; now
Ashland Auto operating at full capacity
Largest BF in western hemisphere
Indiana
Auto • $90 million reline in 2014 to enable
Harbor operations through 2026
$64 million BF reline in 2013 to Cleveland Auto increase capacity by ~10%
Granite • Installing new casters to increase
Construction
City range of products
Investor Meetings – March 2015 8 Source: Company websites, news publications
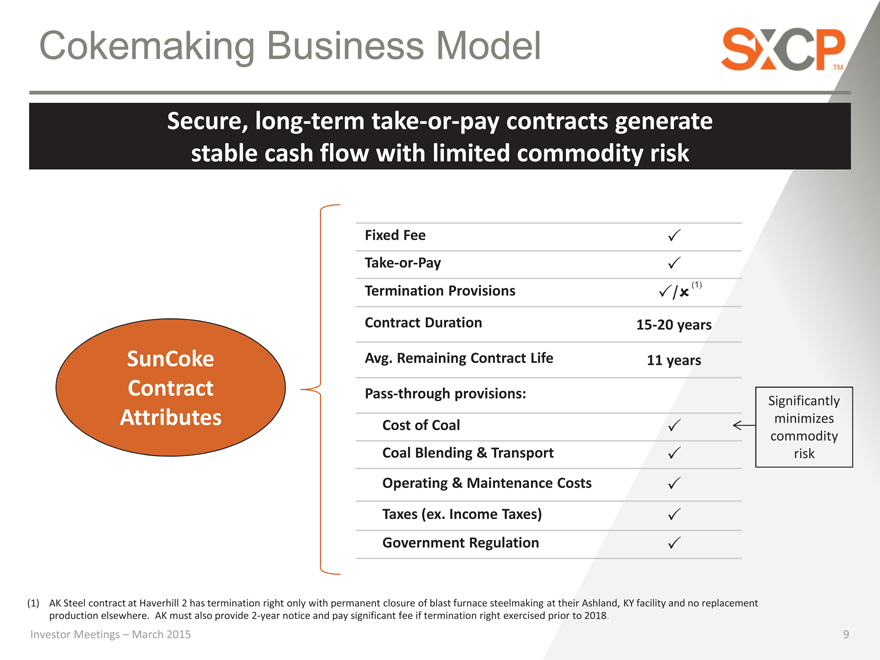
Cokemaking Business Model
Secure, long-term take-or-pay contracts generate stable cash flow with limited commodity risk
Fixed Fee _ Take-or-Pay _ Termination Provisions (1)
_/_
Contract Duration 15-20 years
SunCoke Avg. Remaining Contract Life 11 years Contract Pass-through provisions:
Significantly
Attributes minimizes
Cost of Coal _ commodity Coal Blending & Transport _ risk Operating & Maintenance Costs _ Taxes (ex. Income Taxes) _ Government Regulation _
(1) AK Steel contract at Haverhill 2 has termination right only with permanent closure of blast furnace steelmaking at their Ashland, KY facility and no replacement production elsewhere. AK must also provide 2-year notice and pay significant fee if termination right exercised prior to 2018.
Investor Meetings – March 2015
9
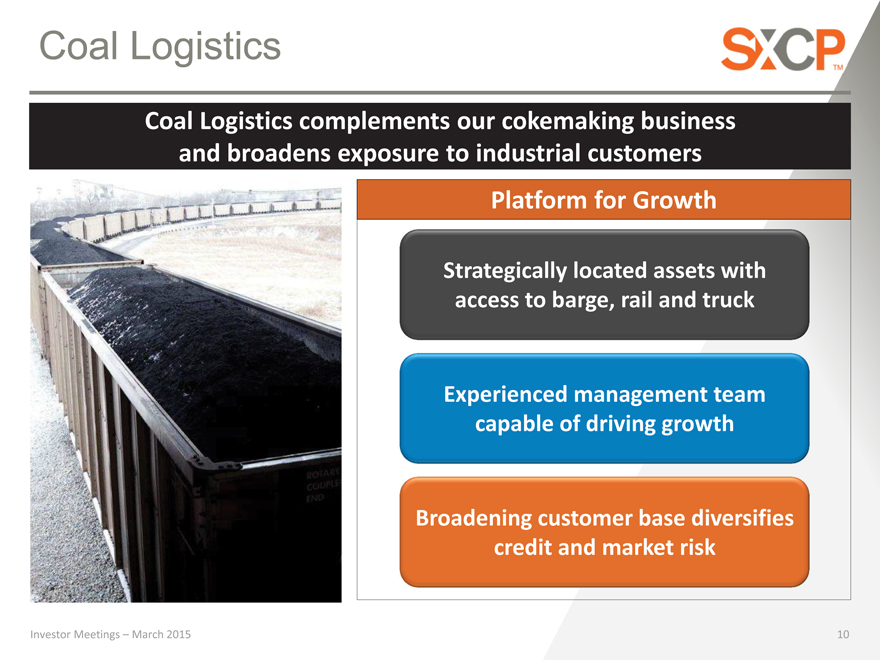
Coal Logistics
Coal Logistics complements our cokemaking business and broadens exposure to industrial customers
Platform for Growth
Strategically located assets with access to barge, rail and truck
Experienced management team capable of driving growth
Broadening customer base diversifies credit and market risk
Investor Meetings – March 2015
10
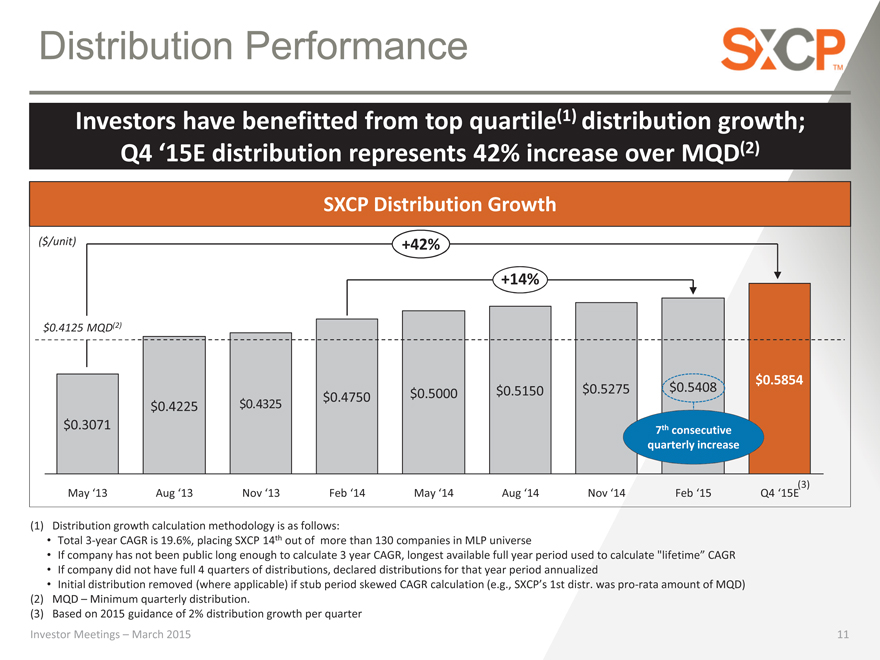
Distribution Performance
Investors have benefitted from top quartile(1) distribution growth; Q4 ‘15E distribution represents 42% increase over MQD(2)
SXCP Distribution Growth
($/unit) +42%
+14%
$0.4125 MQD(2)
$0.5854
$0.5150 $0.5275 $0.5408 $0.4325 $0.4750 $0.5000
$0.4225
$0.3071 th
7 consecutive quarterly increase
May ‘13 Aug ‘13 Nov ‘13 Feb ‘14 May ‘14 Aug ‘14 Nov ‘14 Feb ‘15 Q4 ‘15E(3)
(1) Distribution growth calculation methodology is as follows:
Total 3-year CAGR is 19.6%, placing SXCP 14th out of more than 130 companies in MLP universe
If company has not been public long enough to calculate 3 year CAGR, longest available full year period used to calculate “lifetime” CAGR
If company did not have full 4 quarters of distributions, declared distributions for that year period annualized
Initial distribution removed (where applicable) if stub period skewed CAGR calculation (e.g., SXCP’s 1st distr. was pro-rata amount of MQD) (2) MQD – Minimum quarterly distribution.
(3) Based on 2015 guidance of 2% distribution growth per quarter
Investor Meetings – March 2015
11
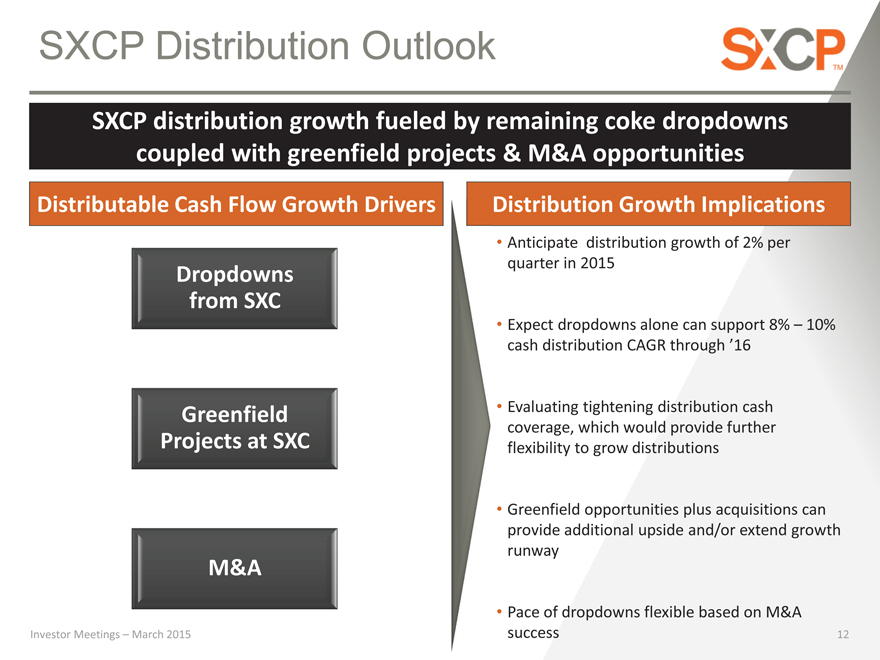
SXCP Distribution Outlook
SXCP distribution growth fueled by remaining coke dropdowns coupled with greenfield projects & M&A opportunities
Distributable Cash Flow Growth Drivers Distribution Growth Implications
Anticipate distribution growth of 2% per quarter in 2015
Dropdowns from SXC
Expect dropdowns alone can support 8% – 10% cash distribution CAGR through ’16
Greenfield • Evaluating tightening distribution cash coverage, which would provide further Projects at SXC flexibility to grow distributions
Greenfield opportunities plus acquisitions can provide additional upside and/or extend growth runway
M&A
Pace of dropdowns flexible based on M&A
Investor Meetings – March 2015
success
12
GROWTH STRATEGY
Investor Meetings – March 2015
13
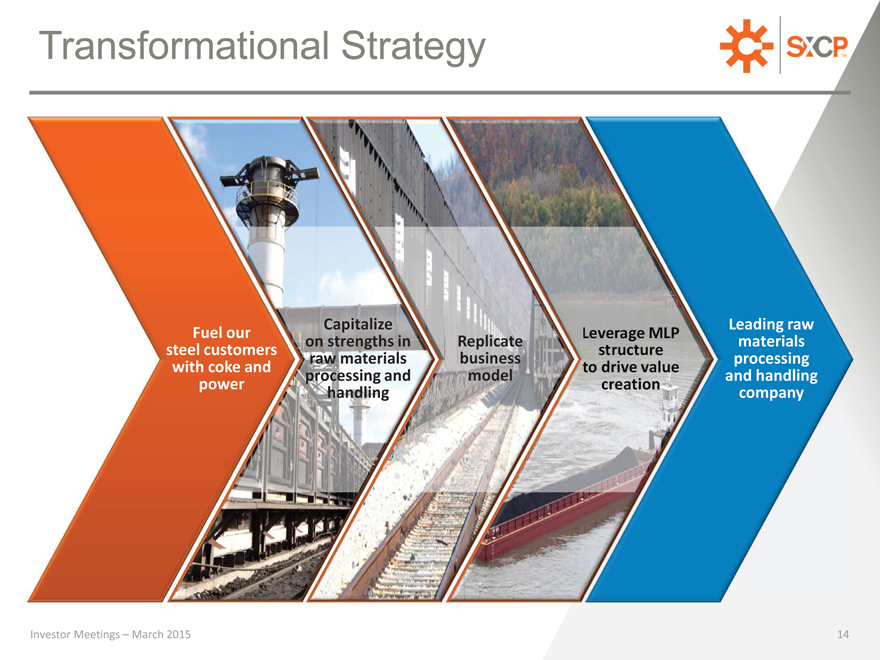
Transformational Strategy
Capitalize Leading raw Fuel our on strengths in Replicate materials steel customers raw materials business processing with coke and processing and model and handling power handling company
Investor Meetings – March 2015 14
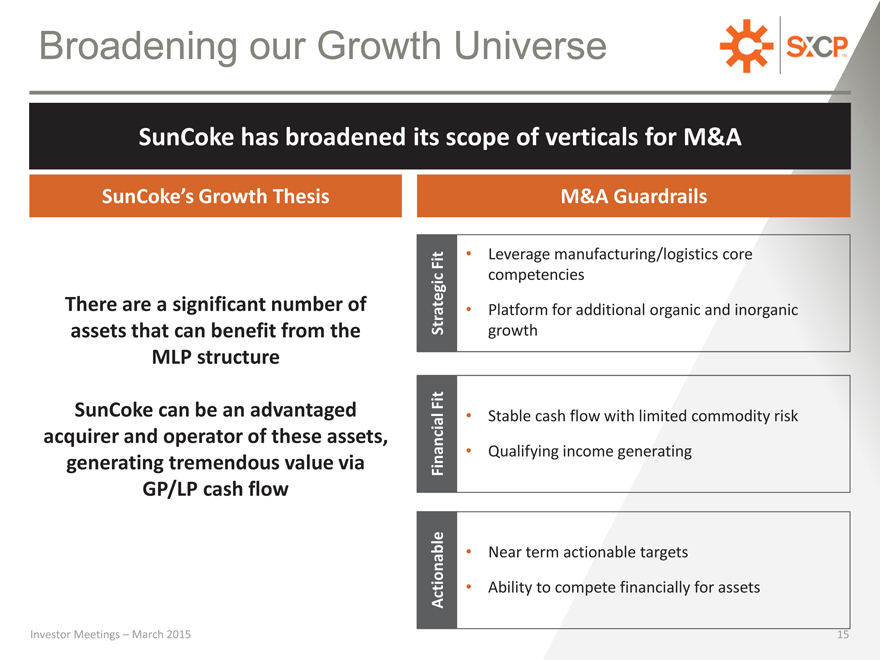
Broadening our Growth Universe
SunCoke has broadened its scope of verticals for M&A
SunCoke’s Growth Thesis M&A Guardrails
Fit • Leverage manufacturing/logistics core competencies There are a significant number of Strategic • Platform for additional organic and inorganic
assets that can benefit from the growth MLP structure
SunCoke can be an advantaged Fit • Stable cash flow with limited commodity risk
acquirer and operator of these assets,
Qualifying income generating
generating tremendous value via Financial GP/LP cash flow
Near term actionable targets
Actionable • Ability to compete financially for assets
Investor Meetings – March 2015
15
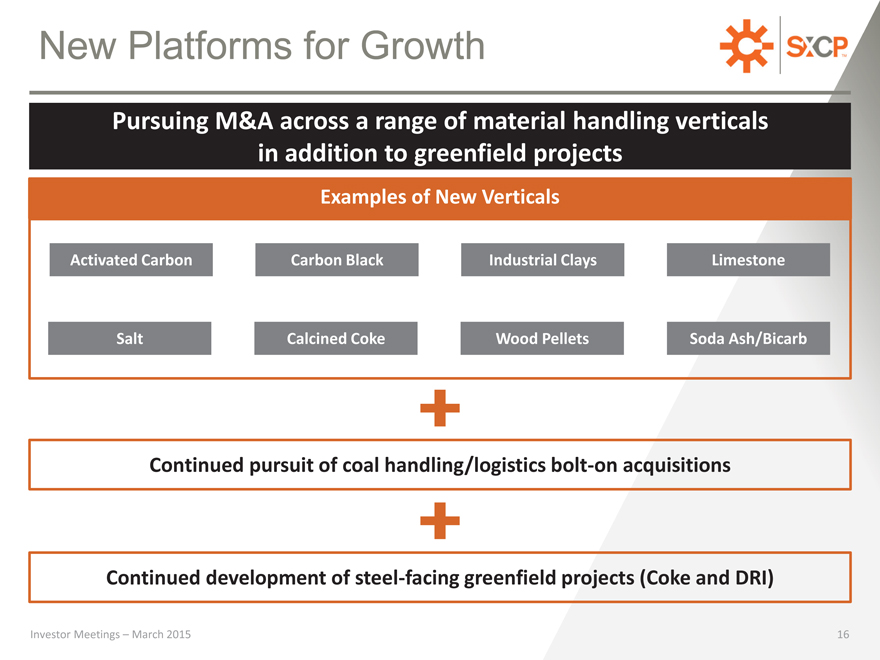
New Platforms for Growth
Pursuing M&A across a range of material handling verticals in addition to greenfield projects
Examples of New Verticals
Activated Carbon Carbon Black Industrial Clays Limestone
Salt Calcined Coke Wood Pellets Soda Ash/Bicarb
Continued pursuit of coal handling/logistics bolt-on acquisitions
Continued development of steel-facing greenfield projects (Coke and DRI)
Investor Meetings – March 2015 16
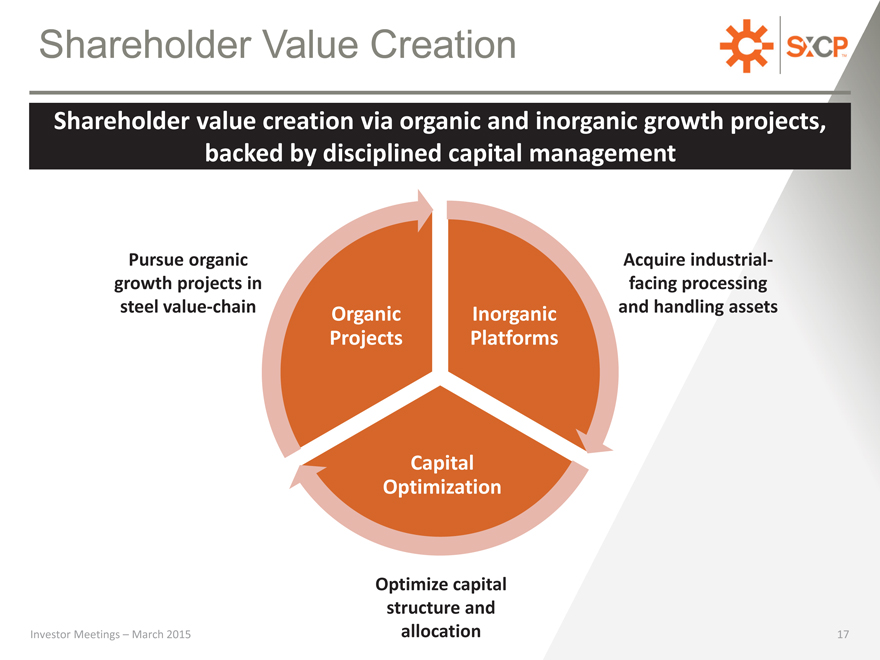
Shareholder Value Creation
Shareholder value creation via organic and inorganic growth projects, backed by disciplined capital management
Pursue organic Acquire industrial-growth projects in facing processing steel value-chain Organic Inorganic and handling assets
Projects Platforms
Capital Optimization
Optimize capital structure and
Investor Meetings – March 2015 allocation 17
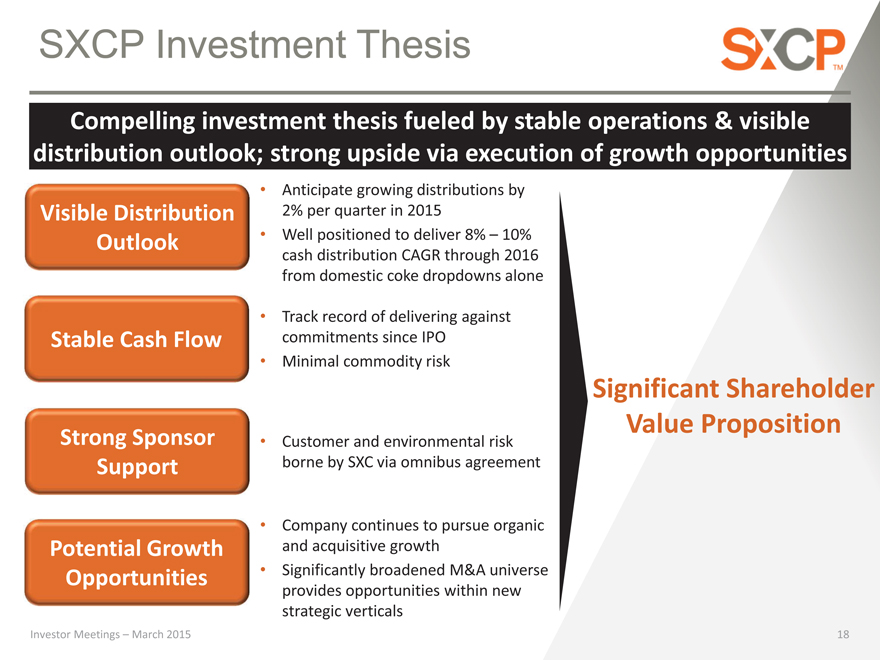
SXCP Investment Thesis
Compelling investment thesis fueled by stable operations & visible distribution outlook; strong upside via execution of growth opportunities
Anticipate growing distributions by
Visible Distribution 2% per quarter in 2015
Outlook • Well positioned to deliver 8% – 10% cash distribution CAGR through 2016 from domestic coke dropdowns alone
Track record of delivering against Stable Cash Flow commitments since IPO
Minimal commodity risk
Significant Shareholder Value Proposition
Strong Sponsor • Customer and environmental risk Support borne by SXC via omnibus agreement
Company continues to pursue organic Potential Growth and acquisitive growth Opportunities Significantly broadened M&A universe provides opportunities within new strategic verticals
Investor Meetings – March 2015 18
APPENDIX
Investor Meetings – March 2015
19
SXCP RECONCILIATIONS & 2015 GUIDANCE
Investor Meetings – March 2015
20
Definitions
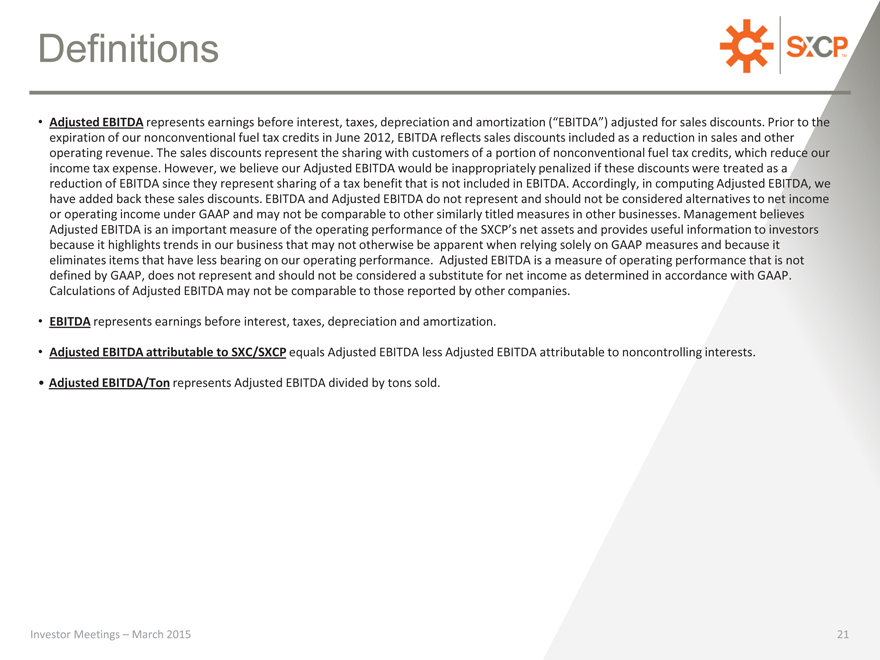
Adjusted EBITDA represents earnings before interest, taxes, depreciation and amortization (“EBITDA”) adjusted for sales discounts. Prior to the expiration of our nonconventional fuel tax credits in June 2012, EBITDA reflects sales discounts included as a reduction in sales and other operating revenue. The sales discounts represent the sharing with customers of a portion of nonconventional fuel tax credits, which reduce our income tax expense. However, we believe our Adjusted EBITDA would be inappropriately penalized if these discounts were treated as a reduction of EBITDA since they represent sharing of a tax benefit that is not included in EBITDA. Accordingly, in computing Adjusted EBITDA, we have added back these sales discounts. EBITDA and Adjusted EBITDA do not represent and should not be considered alternatives to net income or operating income under GAAP and may not be comparable to other similarly titled measures in other businesses. Management believes Adjusted EBITDA is an important measure of the operating performance of the SXCP’s net assets and provides useful information to investors because it highlights trends in our business that may not otherwise be apparent when relying solely on GAAP measures and because it eliminates items that have less bearing on our operating performance. Adjusted EBITDA is a measure of operating performance that is not defined by GAAP, does not represent and should not be considered a substitute for net income as determined in accordance with GAAP. Calculations of Adjusted EBITDA may not be comparable to those reported by other companies.
EBITDA represents earnings before interest, taxes, depreciation and amortization.
Adjusted EBITDA attributable to SXC/SXCP equals Adjusted EBITDA less Adjusted EBITDA attributable to noncontrolling interests.
Adjusted EBITDA/Ton represents Adjusted EBITDA divided by tons sold.
Investor Meetings – March 2015
21
Definitions
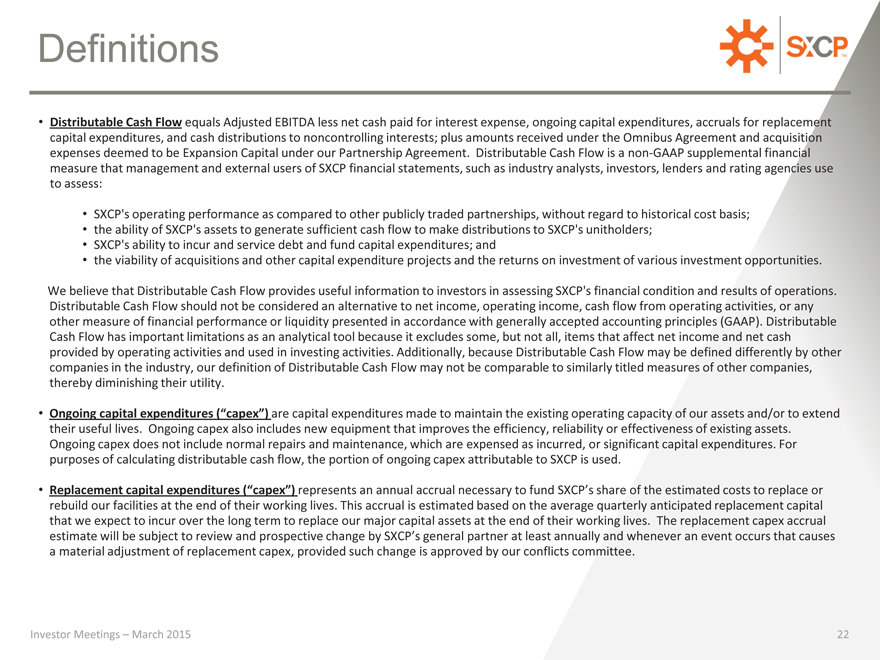
Distributable Cash Flow equals Adjusted EBITDA less net cash paid for interest expense, ongoing capital expenditures, accruals for replacement capital expenditures, and cash distributions to noncontrolling interests; plus amounts received under the Omnibus Agreement and acquisition expenses deemed to be Expansion Capital under our Partnership Agreement. Distributable Cash Flow is a non-GAAP supplemental financial measure that management and external users of SXCP financial statements, such as industry analysts, investors, lenders and rating agencies use to assess:
SXCP’s operating performance as compared to other publicly traded partnerships, without regard to historical cost basis; the ability of SXCP’s assets to generate sufficient cash flow to make distributions to SXCP’s unitholders;
SXCP’s ability to incur and service debt and fund capital expenditures; and
the viability of acquisitions and other capital expenditure projects and the returns on investment of various investment opportunities.
We believe that Distributable Cash Flow provides useful information to investors in assessing SXCP’s financial condition and results of operations. Distributable Cash Flow should not be considered an alternative to net income, operating income, cash flow from operating activities, or any other measure of financial performance or liquidity presented in accordance with generally accepted accounting principles (GAAP). Distributable Cash Flow has important limitations as an analytical tool because it excludes some, but not all, items that affect net income and net cash provided by operating activities and used in investing activities. Additionally, because Distributable Cash Flow may be defined differently by other companies in the industry, our definition of Distributable Cash Flow may not be comparable to similarly titled measures of other companies, thereby diminishing their utility.
Ongoing capital expenditures (“capex”) are capital expenditures made to maintain the existing operating capacity of our assets and/or to extend their useful lives. Ongoing capex also includes new equipment that improves the efficiency, reliability or effectiveness of existing assets. Ongoing capex does not include normal repairs and maintenance, which are expensed as incurred, or significant capital expenditures. For purposes of calculating distributable cash flow, the portion of ongoing capex attributable to SXCP is used.
Replacement capital expenditures (“capex”) represents an annual accrual necessary to fund SXCP’s share of the estimated costs to replace or rebuild our facilities at the end of their working lives. This accrual is estimated based on the average quarterly anticipated replacement capital that we expect to incur over the long term to replace our major capital assets at the end of their working lives. The replacement capex accrual estimate will be subject to review and prospective change by SXCP’s general partner at least annually and whenever an event occurs that causes a material adjustment of replacement capex, provided such change is approved by our conflicts committee.
Investor Meetings – March 2015
22
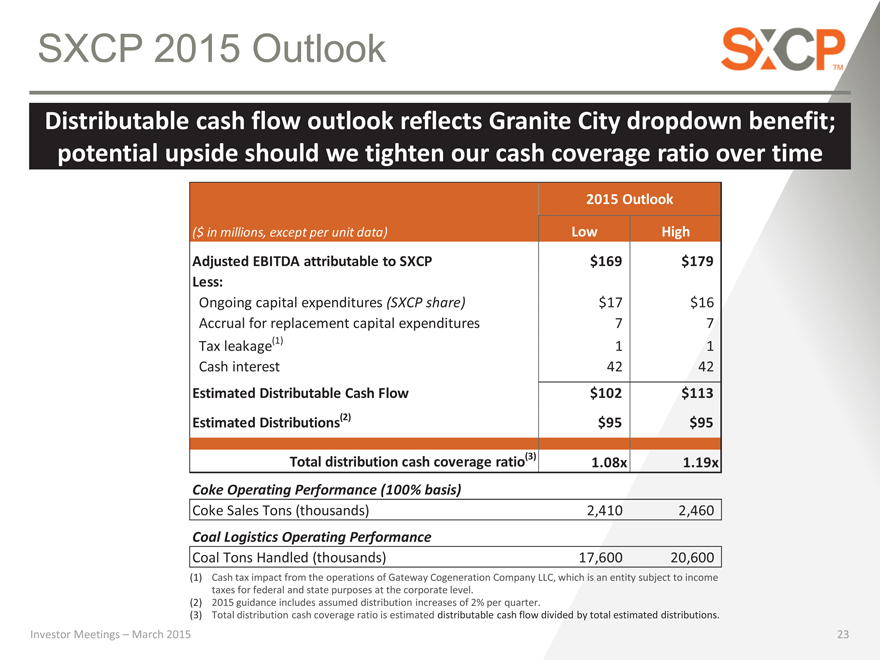
SXCP 2015 Outlook
Distributable cash flow outlook reflects Granite City dropdown benefit; potential upside should we tighten our cash coverage ratio over time
2015 Outlook
($ in millions, except per unit data) Low High
Adjusted EBITDA attributable to SXCP $169 $179 Less:
Ongoing capital expenditures (SXCP share) $17 $16 Accrual for replacement capital expenditures 7 7 Tax leakage(1) 1 1 Cash interest 42 42
Estimated Distributable Cash Flow $102 $113
Estimated Distributions(2) $95 $95
Total distribution cash coverage ratio(3)
1.08x 1.19x
Coke Operating Performance (100% basis)
Coke Sales Tons (thousands) 2,410 2,460
Coal Logistics Operating Performance
Coal Tons Handled (thousands) 17,600 20,600
(1) Cash tax impact from the operations of Gateway Cogeneration Company LLC, which is an entity subject to income taxes for federal and state purposes at the corporate level.
(2) | | 2015 guidance includes assumed distribution increases of 2% per quarter. |
(3) Total distribution cash coverage ratio is estimated distributable cash flow divided by total estimated distributions.
Investor Meetings – March 2015
23
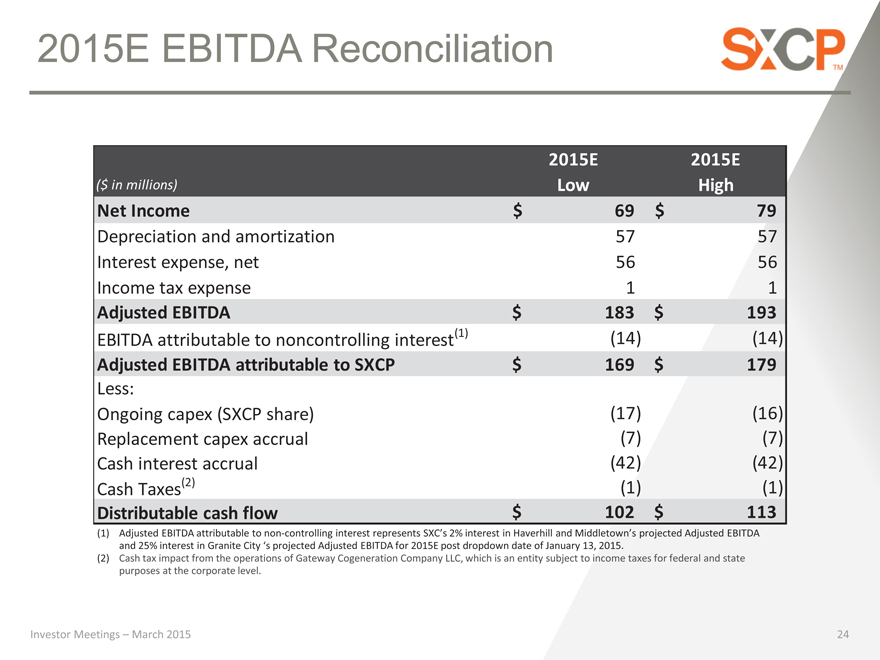
2015E EBITDA Reconciliation
2015E 2015E
($ in millions) Low High
Net Income $ 69 $ 79
Depreciation and amortization 57 57 Interest expense, net 56 56 Income tax expense 1 1
Adjusted EBITDA $ 183 $ 193
EBITDA attributable to noncontrolling interest(1) (14) (14)
Adjusted EBITDA attributable to SXCP $ 169 $ 179
Less:
Ongoing capex (SXCP share) (17) (16) Replacement capex accrual (7) (7) Cash interest accrual (42) (42) Cash Taxes(2) (1) (1)
Distributable cash flow $ 102 $ 113
(1) Adjusted EBITDA attributable to non-controlling interest represents SXC’s 2% interest in Haverhill and Middletown’s projected Adjusted EBITDA and 25% interest in Granite City ‘s projected Adjusted EBITDA for 2015E post dropdown date of January 13, 2015.
(2) Cash tax impact from the operations of Gateway Cogeneration Company LLC, which is an entity subject to income taxes for federal and state purposes at the corporate level.
Investor Meetings – March 2015
24
SXC RECONCILIATIONS & 2015 GUIDANCE
Investor Meetings – March 2015
25
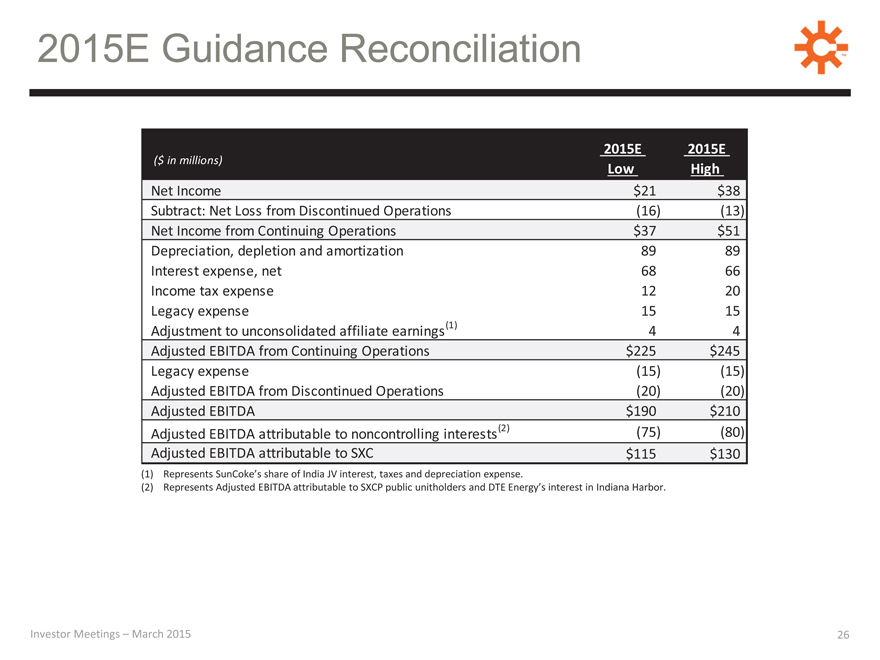
2015E Guidance Reconciliation
2015E 2015E
($ in millions)
Low High
Net Income $21 $38 Subtract: Net Loss from Discontinued Operations (16) (13) Net Income from Continuing Operations $37 $51 Depreciation, depletion and amortization 89 89 Interest expense, net 68 66 Income tax expense 12 20 Legacy expense 15 15
Adjustment to unconsolidated affiliate earnings 4 4 Adjusted EBITDA from Continuing Operations $225 $245 Legacy expense (15) (15) Adjusted EBITDA from Discontinued Operations (20) (20) Adjusted EBITDA $190 $210
(2) (75) (80) Adjusted EBITDA attributable to noncontrolling interests Adjusted EBITDA attributable to SXC $115 $130
(1) | | Represents SunCoke’s share of India JV interest, taxes and depreciation expense. |
(2) | | Represents Adjusted EBITDA attributable to SXCP public unitholders and DTE Energy’s interest in Indiana Harbor. |
Investor Meetings – March 2015
26
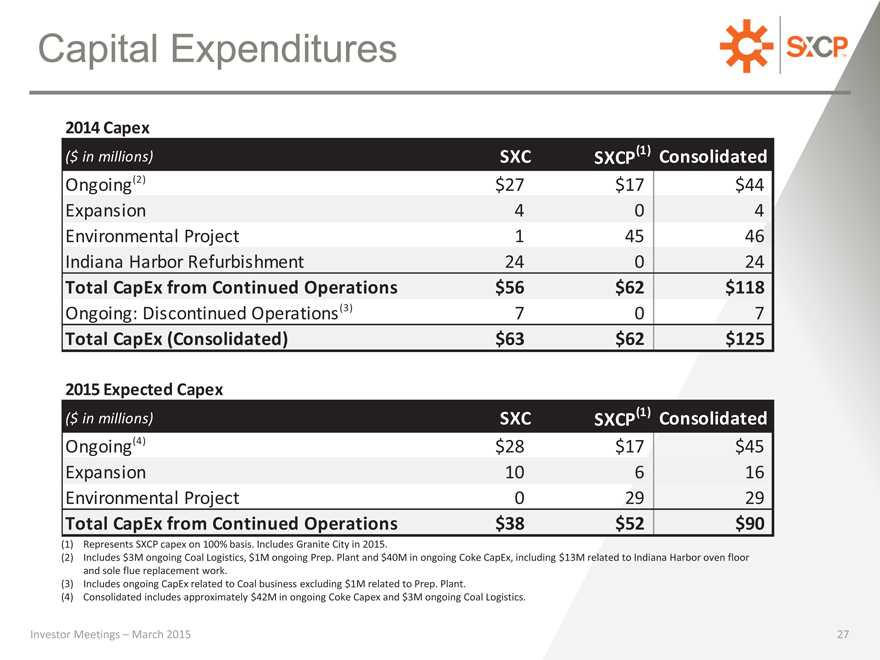
Capital Expenditures
2014 Capex
($ in millions) SXC SXCP Consolidated
Ongoing(2) $27 $17 $44 Expansion 4 0 4 Environmental Project 1 45 46 Indiana Harbor Refurbishment 24 0 24
Total CapEx from Continued Operations $56 $62 $118
Ongoing: Discontinued Operations(3) 7 0 7
Total CapEx (Consolidated) $63 $62 $125
2015 Expected Capex
($ in millions) SXC SXCP Consolidated
Ongoing(4) $28 $17 $45 Expansion 10 6 16 Environmental Project 0 29 29
Total CapEx from Continued Operations $38 $52 $90
(1) | | Represents SXCP capex on 100% basis. Includes Granite City in 2015. |
(2) Includes $3M ongoing Coal Logistics, $1M ongoing Prep. Plant and $40M in ongoing Coke CapEx, including $13M related to Indiana Harbor oven floor and sole flue replacement work.
(3) | | Includes ongoing CapEx related to Coal business excluding $1M related to Prep. Plant. |
(4) | | Consolidated includes approximately $42M in ongoing Coke Capex and $3M ongoing Coal Logistics. |
Investor Meetings – March 2015
27
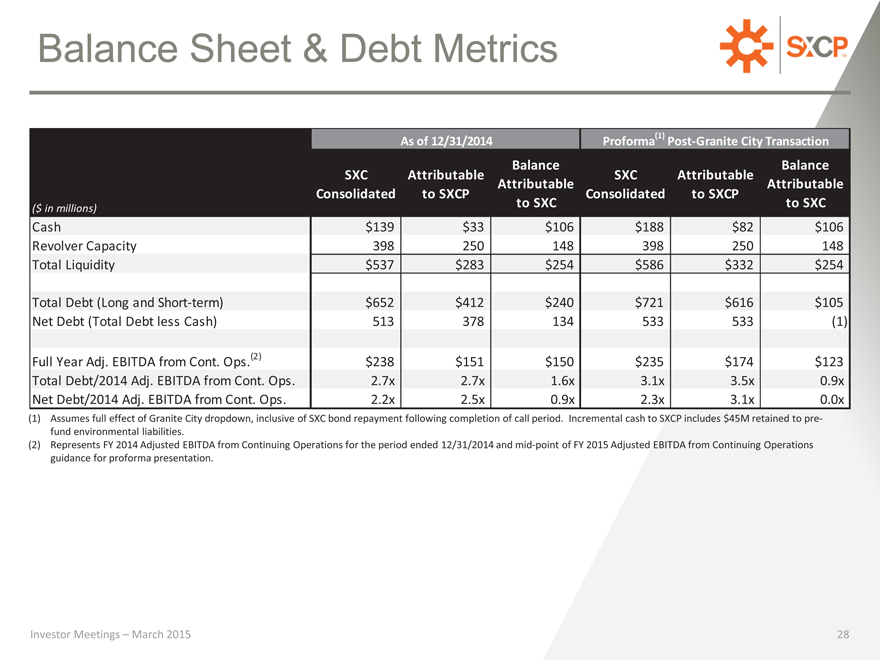
Balance Sheet & Debt Metrics
As of 12/31/2014 Proforma Post-Granite City Transaction
SXC Attributable Balance SXC Attributable Balance Consolidated to SXCP Attributable Consolidated to SXCP Attributable to SXC to SXC
($ in millions)
Cash $139 $33 $106 $188 $82 $106 Revolver Capacity 398 250 148 398 250 148 Total Liquidity $537 $283 $254 $586 $332 $254
Total Debt (Long and Short-term) $652 $412 $240 $721 $616 $105 Net Debt (Total Debt less Cash) 513 378 134 533 533 (1)
Full Year Adj. EBITDA from Cont. Ops. $238 $151 $150 $235 $174 $123 Total Debt/2014 Adj. EBITDA from Cont. Ops. 2.7x 2.7x 1.6x 3.1x 3.5x 0.9x Net Debt/2014 Adj. EBITDA from Cont. Ops. 2.2x 2.5x 0.9x 2.3x 3.1x 0.0x
(1) Assumes full effect of Granite City dropdown, inclusive of SXC bond repayment following completion of call period. Incremental cash to SXCP includes $45M retained to pre-fund environmental liabilities.
(2) Represents FY 2014 Adjusted EBITDA from Continuing Operations for the period ended 12/31/2014 and mid-point of FY 2015 Adjusted EBITDA from Continuing Operations guidance for proforma presentation.
Investor Meetings – March 2015
28
ADDITIONAL INFORMATION ABOUT SUNCOKE, OUR TECHNOLOGY
AND COKE DEMAND
Investor Meetings – March 2015
29
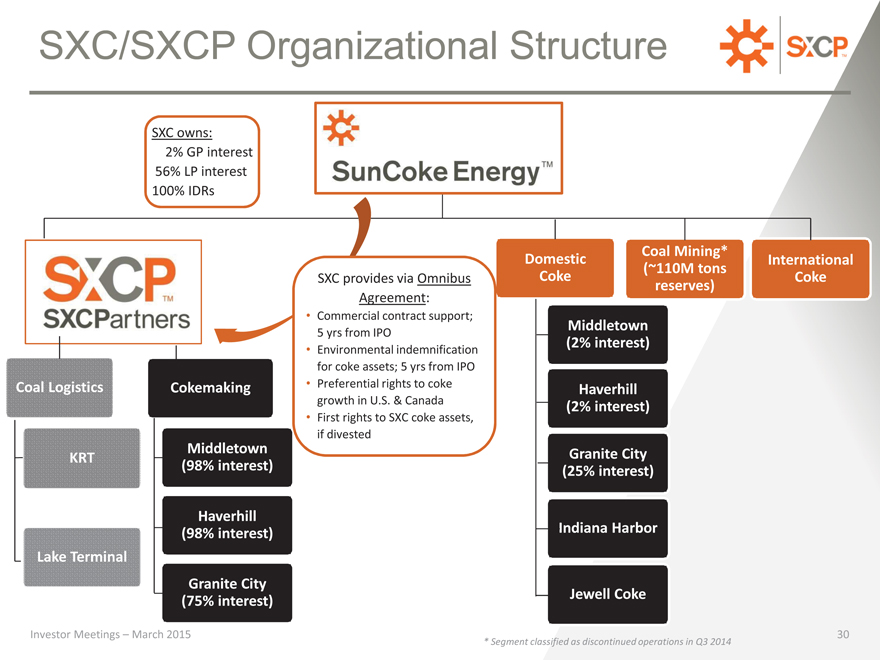
SXC/SXCP Organizational Structure
SXC owns:
2% GP interest
56% LP interest
100% IDRs
Coal Logistics Cokemaking
Middletown KRT
(98% interest)
Haverhill (98% interest) Lake Terminal
Granite City (75% interest)
Investor Meetings – March 2015
Coal Mining*
Domestic International (~110M tons
SXC provides via Omnibus Coke Coke reserves)
Agreement:
Commercial contract support;
Middletown
5 yrs from IPO
(2% interest)
Environmental indemnification for coke assets; 5 yrs from IPO
Preferential rights to coke Haverhill growth in U.S. & Canada
(2% interest)
First rights to SXC coke assets, if divested
Granite City
(25% interest)
Indiana Harbor
Jewell Coke
* Segment classified as discontinued operations in Q3 2014
30
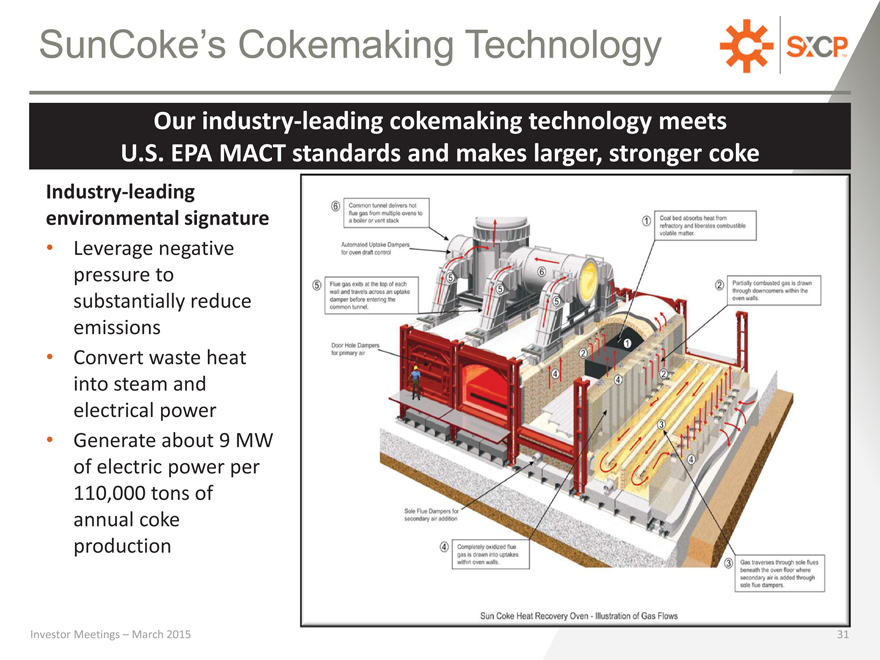
SunCoke’s Cokemaking Technology
Our industry-leading cokemaking technology meets U.S. EPA MACT standards and makes larger, stronger coke
Industry-leading
environmental signature
Leverage negative pressure to substantially reduce emissions
Convert waste heat into steam and electrical power
Generate about 9 MW of electric power per 110,000 tons of annual coke production
Investor Meetings – March 2015
31
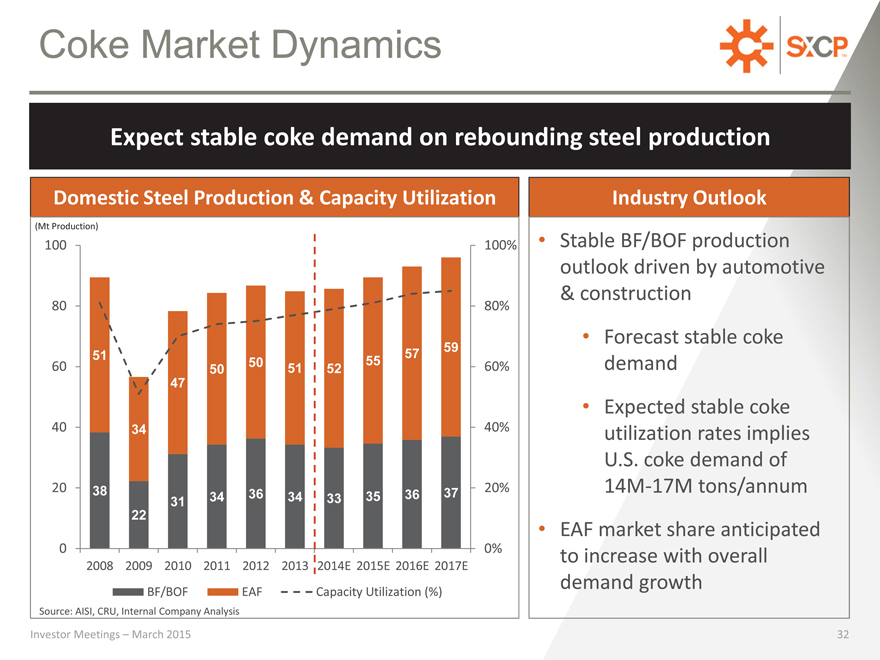
Coke Market Dynamics
Expect stable coke demand on rebounding steel production
Domestic Steel Production & Capacity Utilization
(Mt Production)
100 100%
80 80%
59
51 57
60 50 55 60%
50 51 52 47
40 34 40%
20 38 20%
34 36 34 35 36 37
31 33 22
0 0%
2008 2009 2010 2011 2012 2013 2014E 2015E 2016E 2017E
BF/BOF EAF Capacity Utilization (%)
Source: AISI, CRU, Internal Company Analysis
Investor Meetings – March 2015
Industry Outlook
Stable BF/BOF production outlook driven by automotive & construction
Forecast stable coke demand
Expected stable coke utilization rates implies U.S. coke demand of 14M-17M tons/annum
EAF market share anticipated to increase with overall demand growth
32
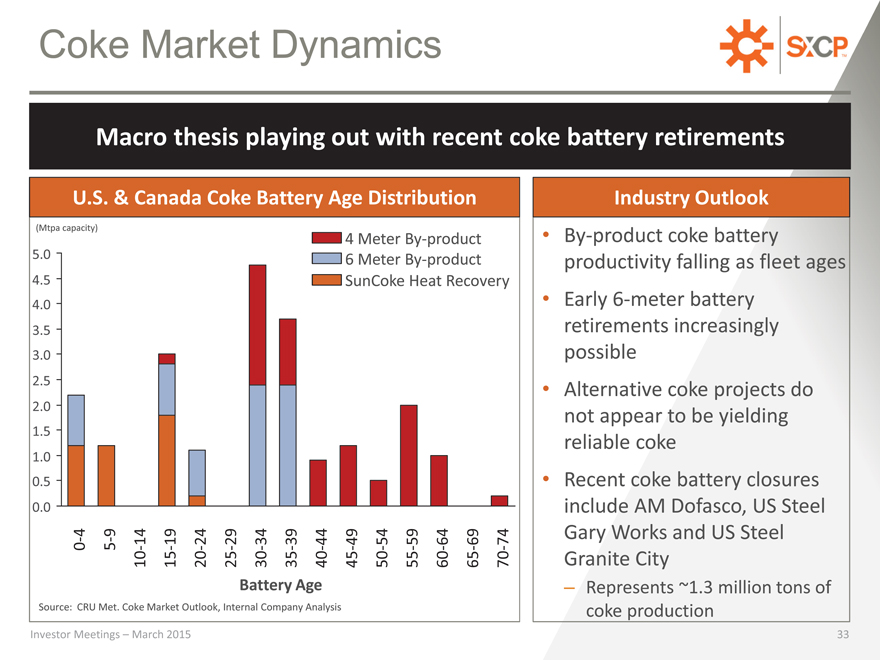
Coke Market Dynamics
Macro thesis playing out with recent coke battery retirements
U.S. & Canada Coke Battery Age Distribution
Industry Outlook
(Mtpa capacity)
5.0
4.5
4.0
3.5
3.0
2.5
2.0
1.5
1.0
0.5
0.0
- 4 0
5-9
10-14
15-19
20-24
25-29
Battery 30-34
Age 35-39
40-44
Source: CRU Met. Coke Market Outlook, Internal Company Analysis
Investor Meetings – March 2015
4 Meter By-product
6 Meter By-product SunCoke Heat Recovery
45-49
50-54
55-59
60-64
65-69
70-74
By-product coke battery productivity falling as fleet ages
Early 6-meter battery retirements increasingly possible
Alternative coke projects do not appear to be yielding reliable coke
Recent coke battery closures include AM Dofasco, US Steel Gary Works and US Steel Granite City
– Represents ~1.3 million tons of coke production
33
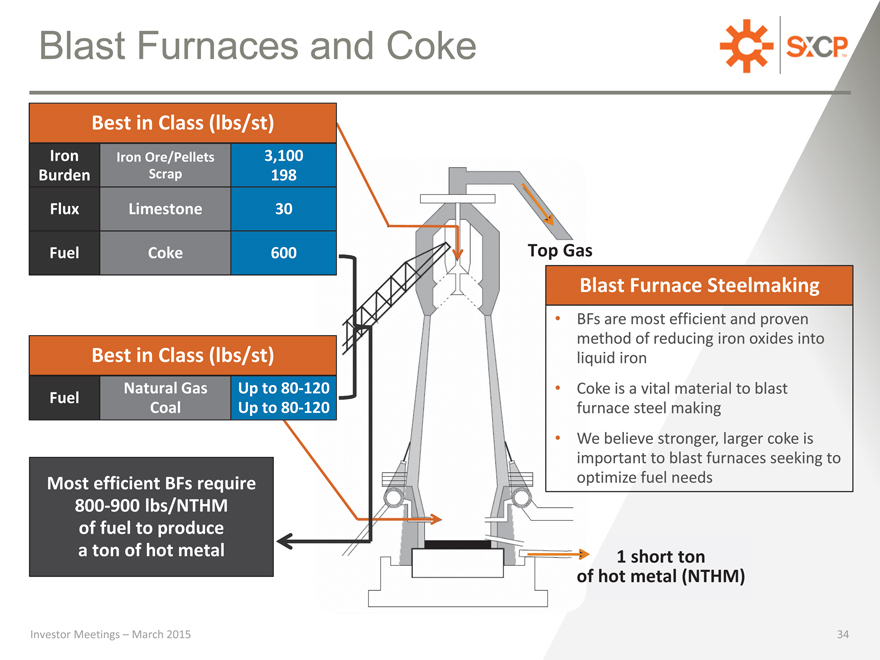
Blast Furnaces and Coke
Best in Class (lbs/st)
Iron Iron Ore/Pellets 3,100
Burden Scrap 198
Flux Limestone 30
Fuel Coke 600 Top Gas
Blast Furnace Steelmaking
Best in Class (lbs/st)
Natural Gas Up to 80-120 Fuel Coal Up to 80-120
Most efficient BFs require 800-900 lbs/NTHM of fuel to produce a ton of hot metal
BFs are most efficient and proven method of reducing iron oxides into liquid iron
Coke is a vital material to blast furnace steel making
We believe stronger, larger coke is important to blast furnaces seeking to optimize fuel needs
1 short ton
of hot metal (NTHM)
Investor Meetings – March 2015
34
Investor Relations: 630-824-1907 www.sxcpartners.com