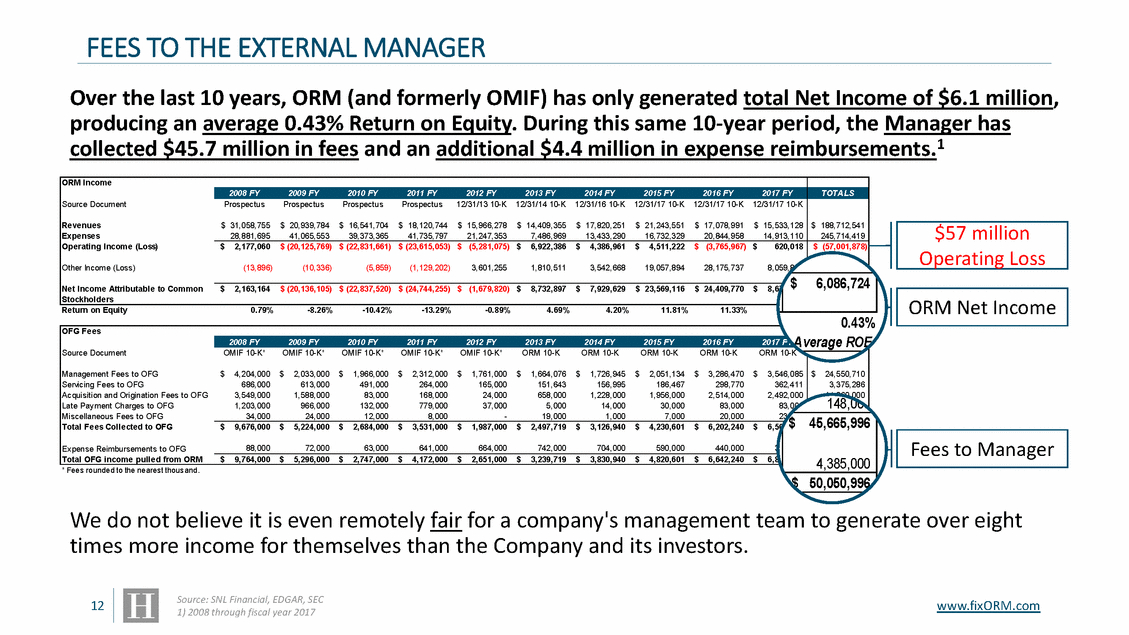
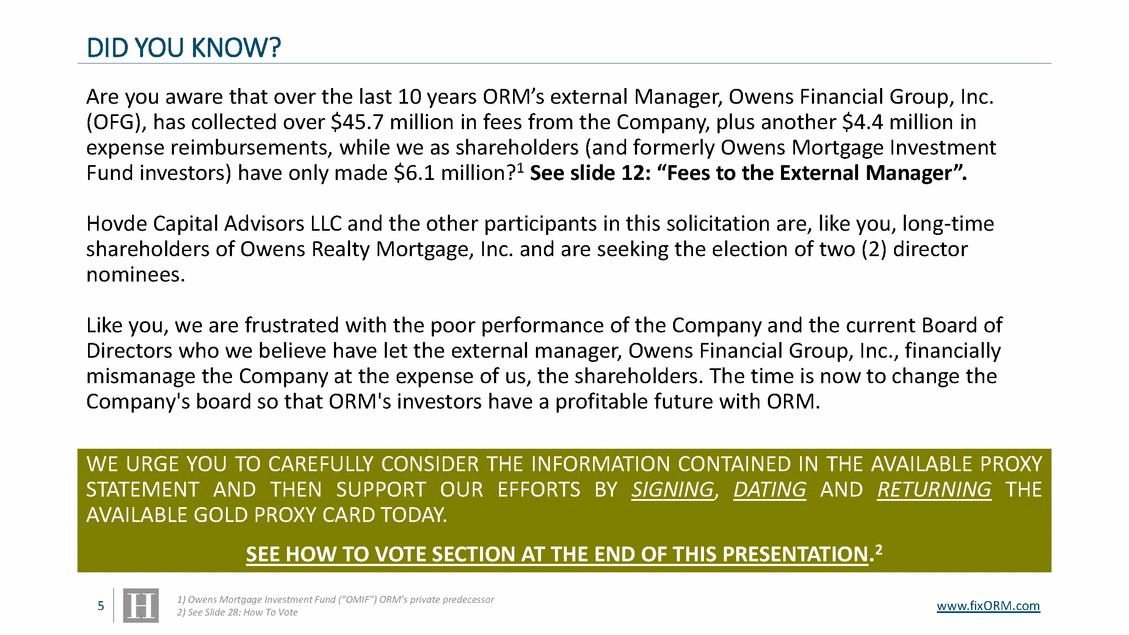
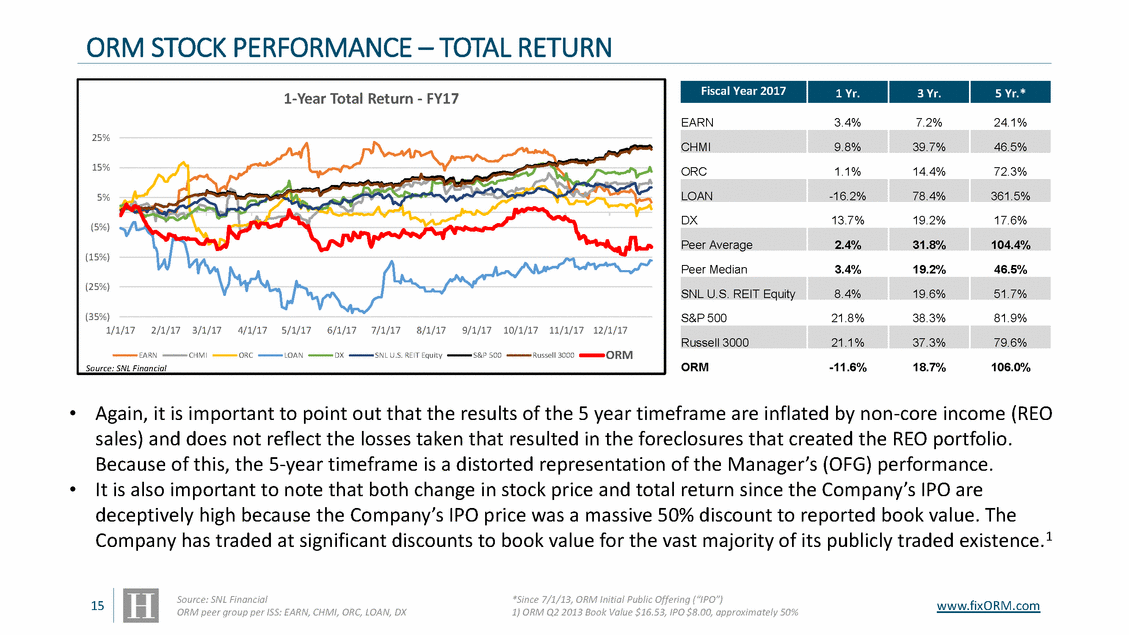
FEES TO THE EXTERNAL MANAGER Over the last 10 years, ORM (and formerly OMIF) has only generated total Net Income of $6.1 million, producing an average 0.43% Return on Equity. During this same 10-year period, the Manager has collected $45.7 million in fees and an additional $4.4 million in expense reimbursements.1 9,8$48 $6,068,0686,,72244 Averag0e .R4O3E% veraTOgTeALRSOE K 134,3832,,0000 $ 9,676,000 $ 5,224,000 $ 2,684,000 $ 3,531,000 $ 1,987,000 $ 2,497,719 $ 3,126,940 $ 4,230,601 $ 6,202,240 $ 6,50 * Fees rounded to the neares t thous and. $ 50,050,996 We do not believe it is even remotely fair for a company's management team to generate over eight times more income for themselves than the Company and its investors. Source: SNL Financial, EDGAR, SEC 1) 2008 through fiscal year 2017 12 www.fixORM.com 6,$496 4$5,4656,6565,,99966 $4,5308,050,,099060 Fees to Manager OFG Fees 2008 FY2009 FY2010 FY2011 FY2012 FY2013 FY2014 FY2015 FY2016 FY2017 FY A Source Document Management Fees to OFG Servicing Fees to OFG Acquisition and Origination Fees to OFG Late Payment Charges to OFG Miscellaneous Fees to OFG Total Fees Collected to OFG Expense Reimbursements to OFG Total OFG income pulled from ORM OMIF 10-K*OMIF 10-K*OMIF 10-K*OMIF 10-K*OMIF 10-K*ORM 10-KORM 10-KORM 10-KORM 10-KORM 10-$ 4,204,000 $ 2,033,000 $ 1,966,000 $ 2,312,000 $ 1,761,000 $ 1,664,076 $ 1,726,945 $ 2,051,134 $ 3,286,470 $ 3,546,0 686,000613,000491,000264,000165,000151,643156,995186,467298,770362,4 3,549,0001,588,00083,000168,00024,000658,0001,228,0001,956,0002,514,0002,492,0 1,203,000966,000132,000779,00037,0005,00014,00030,00083,00083,0 34,00024,00012,0008,000-19,0001,0007,00020,00023,0 85 11 00 00 $ 24,550,710 3,375,286 14,260,000 00 148,000 4,385,000 88,00072,00063,000641,000664,000742,000704,000590,000440,00038 1,000 $ 9,764,000 $ 5,296,000 $ 2,747,000 $ 4,172,000 $ 2,651,000 $ 3,239,719 $ 3,830,940 $ 4,820,601 $ 6,642,240 $ 6,88 7,496 ORM Net Income $57 million Operating Loss ORM Income 2008 FY2009 FY2010 FY2011 FY2012 FY2013 FY2014 FY2015 FY2016 FY2017 FY TOTALS Source Document Revenues Expenses Operating Income (Loss) Other Income (Loss) Net Income Attributable to Common Stockholders ProspectusProspectusProspectusProspectus12/31/13 10-K 12/31/14 10-K 12/31/16 10-K 12/31/17 10-K 12/31/17 10-K 12/31/17 10-K $ 31,058,755 $ 20,939,784 $ 16,541,704 $ 18,120,744 $ 15,966,278 $ 14,409,355 $ 17,820,251 $ 21,243,551 $ 17,078,991 $ 15,533,128 28,881,69541,065,55339,373,36541,735,79721,247,3537,486,96913,433,29016,732,32920,844,95814,913,110 $ 188,712,541 245,714,419 $ 2,177,060 $ (20,125,769) $ (22,831,661) $ (23,615,053) $ (5,281,075) $ 6,922,386 $ 4,386,961 $ 4,511,222 $ (3,765,967) $620, (13,896)(10,336)(5,859)(1,129,202)3,601,2551,810,5113,542,66819,057,89428,175,7378,059, 018 830 $ (57,001,878) 63,088,602 $ 2,163,164 $ (20,136,105) $ (22,837,520) $ (24,744,255) $ (1,679,820) $ 8,732,897 $ 7,929,629 $ 23,569,116 $ 24,409,770 $ 8,67 Return on Equity0.79%-8.26%-10.42%-13.29%-0.89%4.69%4.20%11.81%11.33% 4.32%0.43%
