Exhibit (d)
This description of FMS-WM and the Federal Republic is dated August 13, 2014 and appears as Exhibit (d) to the Annual Report on Form 18-K of FMS-WM for the fiscal year ended December 31, 2013.
TABLE OF CONTENTS
-1-
-2-
THIS DOCUMENT (OTHERWISE THAN AS PART OF A PROSPECTUS CONTAINED IN A REGISTRATION STATEMENT FILED UNDER THE U.S. SECURITIES ACT OF 1933, AS AMENDED) DOES NOT CONSTITUTE AN OFFER TO SELL OR THE SOLICITATION OF AN OFFER TO BUY ANY SECURITIES OF FMS-WM. THE DELIVERY OF THIS DOCUMENT AT ANY TIME DOES NOT IMPLY THAT THE INFORMATION HEREIN IS CORRECT AS OF ANY TIME SUBSEQUENT TO ITS DATE.
PRESENTATION OF FINANCIAL AND OTHER INFORMATION
In this description, references to “€”, “euro” or “EUR” are to the single European currency of the member states of the European Union participating in the euro and references to “U.S. dollars”, “$” or “USD” are to United States dollars. See “Exchange Rate Information” below for information regarding the rates of conversion of the euro into United States dollars and “The Federal Republic of Germany—General—The European Union and European Integration” for a discussion of the introduction of the euro.
FMS-WM’s accounts are kept, and the economic data on the Federal Republic is expressed, in euro.
Any discrepancies in the tables included in this prospectus between the amounts and the totals thereof are due to rounding.
In this document, references to the “Federal Republic” and “Germany” are to the Federal Republic of Germany and references to the “Federal Government” are to the government of the Federal Republic of Germany. The term “FMS-WM” refers to FMS Wertmanagement.
EXCHANGE RATE INFORMATION
FMS-WM files reports with the Securities and Exchange Commission giving financial and economic data expressed in euro.
The following table shows noon buying rates for euro, expressed as U.S. dollars per EUR 1.00, for the periods and dates indicated, as reported by the Federal Reserve Bank of New York. On January 1, 2009, the Federal Reserve Bank of New York discontinued daily publication of noon buying rates. As of this date, noon buying rates are as published on a weekly basis by the Federal Reserve Bank of New York.
| | | | | | | | | | | | | | | | |
Year ended December 31, | | Period End | | | Average(1) | | | High | | | Low | |
2009 | | | 1.4332 | | | | 1.3955 | | | | 1.5100 | | | | 1.2547 | |
2010 | | | 1.3269 | | | | 1.3216 | | | | 1.4536 | | | | 1.1959 | |
2011 | | | 1.2973 | | | | 1.4002 | | | | 1.4875 | | | | 1.2926 | |
2012 | | | 1.3186 | | | | 1.2909 | | | | 1.3463 | | | | 1.2062 | |
2013 | | | 1.3779 | | | | 1.3303 | | | | 1.3816 | | | | 1.2774 | |
| (1) | The average of the noon buying rates on the last business day of each month during the relevant period. |
The following table shows the high and low noon buying rates for euro, expressed as U.S. dollars per EUR 1.00, for each month from January 2014 through August 2014 (through August 8, 2014), as reported by the Federal Reserve Bank of New York.
| | | | | | | | |
2014 | | High | | | Low | |
January | | | 1.3682 | | | | 1.3500 | |
February | | | 1.3806 | | | | 1.3507 | |
March | | | 1.3927 | | | | 1.3731 | |
April | | | 1.3898 | | | | 1.3704 | |
May | | | 1.3924 | | | | 1.3596 | |
June | | | 1.3690 | | | | 1.3522 | |
July | | | 1.3681 | | | | 1.3378 | |
August (through August 8, 2014) | | | 1.3436 | | | | 1.3355 | |
-3-
No representation is made that the euro or U.S. dollar amounts referred to herein could have been or could be converted into U.S. dollars or euro, as the case may be, at any particular rate.
There are, except in limited embargo circumstances, no legal restrictions in the Federal Republic on international capital movements and foreign exchange transactions. However, for statistical purposes only, every individual or corporation residing in the Federal Republic must report to the Deutsche Bundesbank, the German Central Bank, subject to a number of exceptions, any payment received from or made to an individual or a corporation resident outside of the Federal Republic if such payment exceeds EUR 12,500 (or the equivalent in a foreign currency).
-4-
RECENT DEVELOPMENTS
FMS-WM
Partial Transfer of Operations to Rome Branch
FMS-WM acquired part of the operations of the Rome branch of Depfa Bank plc (“Depfa”) in a transaction (cessione di ramo d’azienda) effective February 3, 2014. These transferred operations, which will be continued by the Rome branch of FMS-WM established in 2013, almost exclusively comprise assets (as well as the funding of such assets) the risk positions of which were initially taken over from Depfa by way of guarantee as of October 1, 2010. As a result of the partial transfer of operations, contingent liabilities of FMS-WM were reduced by EUR 2.0 billion in the first quarter of 2014. Loans and advances to customers will increase by the same amount.
Termination of the Liquidity Facilities Granted to Depfa
On January 31, 2014, Depfa and FMS-WM agreed to terminate the liquidity facility of EUR 3.8 billion previously granted to Depfa by FMS-WM effective February 17, 2014. Under the terms of this agreement, draw-downs under the facility, which totaled EUR 2.3 billion as of December 31, 2013, were repaid in full in February 2014.
The second liquidity facility granted to Depfa by FMS-WM was a variable facility, which was used to fund certain risk positions transferred by way of guarantee from Depfa to FMS-WM as of October 1, 2010 and to finance the cash collateral that Depfa was required to provide in an amount equal to the negative fair value of derivatives serving to hedge the above-mentioned risk positions. The draw-downs under this facility, which totaled EUR 1.0 billion as of December 31, 2013, were repaid in full in February 2014.
Privatization of FMS Wertmanagement Service GmbH
On February 7, 2014, FMS-WM published a preliminary announcement regarding the privatization of FMS Wertmanagement Service GmbH (“FMS-WM Service”) in the online version of the Supplement to the Official Journal of the European Union. The privatization will take place as part of a European Union (“EU”)-wide competitive tendering procedure that is expected to be completed by the end of 2014.
Wind-down of Depfa by FMS-WM
On May 13, 2014, the German Federal Agency for Financial Market Stabilization’s (Bundesanstalt für Finanzmarktstabilisierung) inter-ministerial steering committee and an extraordinary general meeting of Hypo Real Estate Holding AG decided in favor of the preparation of a takeover and wind-down of Depfa by FMS-WM. Depfa will have to be wound down in accordance with an EU state aid decision of July 18, 2011. The transfer to, and wind down of Depfa under, FMS-WM is subject, inter alia, to the approvals of the Irish and Luxemboug Regulators. The takeover of Depfa as a regulated entity may have an impact on FMS-WM’s financial performance. As of December 31, 2013, Depfa’s consolidated total assets amounted to EUR 49 billion.
The Federal Republic of Germany
Overview of Key Economic Figures
The following economic information regarding the Federal Republic is derived from the public official documents cited below. Certain of the information is preliminary.
-5-
Gross Domestic Product (GDP)
GROSS DOMESTIC PRODUCT
(adjusted for price, seasonal and calendar effects)(1)
| | | | |
Reference period | | Percentage change on
previous quarter | | Percentage change on the same quarter in previous year |
1st quarter 2013 | | 0.0 | | -0.3 |
2nd quarter 2013 | | 0.7 | | 0.5 |
3rd quarter 2013 | | 0.3 | | 0.6 |
4th quarter 2013 | | 0.4 | | 1.4 |
1st quarter 2014 | | 0.8 | | 2.3 |
| (1) | Adjustment for seasonal and calendar effects according to the Census X-12-ARIMA method. |
Germany’s gross domestic product increased by 0.8% after price, seasonal and calendar adjustments in the first quarter of 2014 compared to the fourth quarter of 2013. One factor that contributed to the strong growth at the beginning of 2014 was the extremely mild weather. Positive contributions to this increase were made only by domestic demand. Final consumption expenditure for both households and government increased compared to the fourth quarter of 2013. A positive development was also recorded for fixed capital formation, which significantly increased both in construction and in machinery and equipment compared with the fourth quarter of 2013. Moreover, building inventories supported the GDP growth. Foreign trade, however, had a downward effect on economic growth.
In a year-on-year comparison, economic growth accelerated markedly. GDP in the first quarter of 2014 increased by 2.3% in price- and calendar-adjusted terms compared to the first quarter of 2013.
Source: Statistisches Bundesamt, Gross domestic product up 0.8% in 1st quarter of 2014, press release of May 15, 2014 (https://www.destatis.de/EN/PressServices/Press/pr/2014/05/PE14_167_811.html).
Inflation Rate
INFLATION RATE
(based on overall consumer price index)
| | | | |
Reference period | | Percentage change on previous month | | Percentage change on the same month in previous year |
July 2013 | | 0.5 | | 1.9 |
August 2013 | | 0.0 | | 1.5 |
September 2013 | | 0.0 | | 1.4 |
October 2013 | | -0.2 | | 1.2 |
November 2013 | | 0.2 | | 1.3 |
December 2013 | | 0.4 | | 1.4 |
January 2014 | | -0.6 | | 1.3 |
February 2014 | | 0.5 | | 1.2 |
March 2014 | | 0.3 | | 1.0 |
April 2014 | | -0.2 | | 1.3 |
May 2014 | | -0.1 | | 0.9 |
June 2014 | | 0.3 | | 1.0 |
July 2014 | | 0.3 | | 0.8 |
In July 2014, consumer prices in Germany rose by 0.8% compared to June 2013, marking the lowest year-on-year rate of price increase since February 2010.
Energy prices declined by 1.5% from July 2013 to July 2014, representing a larger decline in energy prices when compared to previous months. Most notably, prices for mineral oil products were down 3.8% compared to a year earlier. In addition, prices for solid fuels and charges for central and district heating decreased by 2.5% and 1.3%, respectively, while prices for electricity rose by 1.7%. Excluding energy prices, the inflation rate in July 2014 compared to July 2013 would have been 1.2%.
-6-
Food prices increased by 0.1% in July 2014 compared to July 2013. In particular, prices for vegetables fell 7.7%. Additionally, consumers paid 4.4% less for edible oils and fats and 4.8% less for fruit, while prices for dairy products rose by 8.7%.
Total goods prices also increased by 0.1% in July 2014 compared to July 2013. Service prices rose above-average by 1.5% in July 2014, due mainly to a 1.4% increase in net rents exclusive of heating expenses.
Compared with June 2014, consumer prices rose by 0.3% in July 2014. In particular, prices for package holidays and air tickets increased by 11.6% and 8.8%, respectively. Food prices and energy prices decreased by 0.2% and 0.3%, respectively, from June 2014 to July 2014.
Source: Statistisches Bundesamt, Consumer prices in July 2014: +0.8% on July 2013, press release of August 13, 2014 (https://www.destatis.de/EN/PressServices/Press/pr/2014/08/PE14_285_611.html).
Unemployment Rate
UNEMPLOYMENT RATE
(percent of unemployed persons in the total labor force according to the
International Labour Organization (ILO) definition)(1)
| | | | |
Reference period | | Original percentages | | Adjusted percentages(2) |
June 2013 | | 5.4 | | 5.3 |
July 2013 | | 5.3 | | 5.3 |
August 2013 | | 5.0 | | 5.3 |
September 2013 | | 5.1 | | 5.3 |
October 2013 | | 5.1 | | 5.2 |
November 2013 | | 5.0 | | 5.2 |
December 2013 | | 5.0 | | 5.2 |
January 2014 | | 5.6 | | 5.2 |
February 2014 | | 5.5 | | 5.2 |
March 2014 | | 5.5 | | 5.2 |
April 2014 | | 5.3 | | 5.2 |
May 2014 | | 5.0 | | 5.1 |
June 2014 | | 5.0 | | 5.1 |
| (1) | The time series on unemployment are based on the German Labour Force Survey. |
| (2) | Adjusted for seasonal and irregular effects (trend cycle component) using the X-12-ARIMA method. |
The number of employed persons increased by approximately 379,000 persons, or 0.9%, from June 2013 to June 2014. Compared to May 2014, the number of employed persons in June 2014 increased by approximately 16,000, after adjustment for seasonal fluctuations.
In June 2014, the number of unemployed persons decreased by approximately 166,000, or 7.4%, compared to June 2013. When adjusted for seasonal and irregular effects (trend cycle component), the number of unemployed persons in June 2014 decreased by 0.9% to 2.16 million compared to May 2014.
Sources: Statistisches Bundesamt, June 2014: labour market nearly unchanged on May, press release of July 31, 2014 (https://www.destatis.de/EN/PressServices/Press/pr/2014/07/PE14_270_132.html); Statistisches Bundesamt, Genesis-Online Datenbank, Tabelle 13231-0001, Erwerbslose, Erwerbstätige, Erwerbspersonen, Erwerbslosenquote: Deutschland, Monate, Original- und bereinigte Daten (https://www-genesis.destatis.de/genesis/online/logon?sequenz=tabelleErgebnis&selectionname=13231-0001&zeitscheiben=2&leerzeilen=false).
-7-
Current Account and Foreign Trade
CURRENT ACCOUNTAND FOREIGN TRADE(1)
| | | | | | | | |
| | | (balance in EUR billion)(2) | |
Item | | January to June 2014 | | | January to June 2013 | |
Trade in goods, including supplementary trade items | | | 106.2 | | | | 108.8 | |
Services | | | -15.8 | | | | -22.9 | |
Primary income | | | 24.8 | | | | 29.2 | |
Secondary income | | | -21.7 | | | | -22.6 | |
| | | | | | | | |
Current account | | | 93.5 | | | | 92.4 | |
| | | | | | | | |
| (1) | The table reflects an updated statistical framework for the German balance of payments, which, as of July 2014, has been brought into line with the revised standard of the International Monetary Fund. For more information, see Deutsche Bundesbank, Monthly Report June 2014, pp. 57-68 (http://www.bundesbank.de/Redaktion/EN/Downloads/Publications/Monthly_Report/2014/2014_06_monthly_report.pdf?__blob=publicationFile). |
| (2) | Figures may not add up due to rounding. |
Source: Statistisches Bundesamt, German exports in June 2014: +1.1% on June 2013, press release of August 8, 2014 (https://www.destatis.de/EN/PressServices/Press/pr/2014/08/PE14_280_51.html).
Other Recent Developments
Policy Responses to the Global Economic and Financial Crisis
On June 5, 2014, the European Central Bank (“ECB”) announced several measures designed to enhance the functioning of the monetary policy transmission mechanism by supporting lending to the real economy. In particular, the ECB decided to conduct a series of targeted longer-term refinancing operations (“TLTROs”). These TLTROs are aimed at improving bank lending to the euro area non-financial private sector (defined as euro area households and non-financial corporations), excluding loans to households for house purchase, for a period of two years.
Source: European Central Bank, ECB announces monetary policy measures to enhance the functioning of the monetary policy transmission mechanism, press release of June 5, 2014 (http://www.ecb.europa.eu/press/pr/date/2014/html/pr140605_2.en.html).
The European Union and European Integration
On July 23, 2014, the Council of the European Union formally approved the accession of Lithuania to the euro area as of January 1, 2015. The ECB will take over direct supervision of the biggest Lithuanian banks in January 2015, as the country is also joining the Single Supervisory Mechanism.
Source: European Central Bank, Lithuania to join euro area and single supervisory mechanism (SSM) on 1 January 2015, press release of July 23, 2014 (http://www.ecb.europa.eu/press/pr/date/2014/html/pr140723.en.html).
-8-
FMS WERTMANAGEMENT
Overview
FMS-WM is a wind-up institution (Abwicklungsanstalt) organized as a public law entity (Anstalt öffentlichen Rechts) under public law of the Federal Republic with partial legal capacity pursuant to Section 8a para 1 of the German Financial Market Stabilization Fund Act (Finanzmarktstabilisierungsfondsgesetz, “FMStFG”). Partial legal capacity, under German administrative law, means that FMS-WM does not have the right to bring an administrative proceeding against the German Federal Agency for Financial Market Stabilization (Bundesanstalt für Finanzmarktstabilisierung, “FMSA”) under its charter. FMS-WM has, however, full power and legal capacity to contract with third parties and sue and be sued in court. FMS-WM is fully owned by the German Financial Market Stabilization Fund (Finanzmarktstabilisierungsfonds, “SoFFin”), which is a special pool of assets (Sondervermögen) of the Federal Republic. FMS-WM is charged with liquidating a portfolio of risk positions and non-strategic assets/businesses in an original amount of EUR 175.7 billion (nominal volume) that it assumed from Hypo Real Estate Holding AG and its subsidiaries and special purpose entities (referred to herein collectively as the “HRE Group”) on October 1, 2010. As of 2007, the HRE Group was one of the largest commercial property lenders, issuers of covered bonds and providers of public finance in Germany. It encountered severe financial difficulties in 2008/09 in the course of the global financial markets crisis. Given the systemic importance of the HRE Group and the resulting public interest in stabilizing the HRE Group, the Federal Republic initiated support measures for this financial institution, including the transfer of risk positions and non-strategic assets/businesses to FMS-WM.
FMS-WM pursues its objective of managing and winding up its portfolio according to a strategic management framework known as the winding-up plan (Abwicklungsplan), which is updated and adapted on a regular basis. FMS-WM aims to maximize the value of its portfolio by managing and liquidating it in a value-preserving manner over an extended period of time. For any given part of the portfolio, the plan requires an assessment of whether FMS-WM should sell, hold, or restructure its holdings. As of December 31, 2013, FMS-WM had liquidated approximately EUR 56.6 billion of its initial portfolio of EUR 175.7 billion.
FMS-WM engages in funding activities, including the issuance of debt securities and/or obtaining financing from financial institutions, in order to refinance funding instruments associated with the portfolio it has assumed as they expire. FMS-WM will have to engage in refinancing activities on the capital markets until its portfolio has been liquidated. As of December 31, 2013, FMS-WM had subscribed capital of EUR 200,000, the total amount of which had been paid in.
FMS-WM’s obligations are backed by the full faith and credit of the Federal Republic. Pursuant to the FMStFG, FMS-WM’s obligations benefit from a statutory guarantee of SoFFin and under FMS-WM’s charter, SoFFin is obligated to cover all losses sustained by FMS-WM and to ensure that FMS-WM is able to pay all its liabilities at any time when due and in full. According to Section 5 of the FMStFG, the Federal Republic, in turn, is directly liable for all of SoFFin’s obligations.
FMS-WM is governed by two corporate bodies: the Supervisory Board (Verwaltungsrat) and the Executive Board (Vorstand). The six-member Supervisory Board is appointed by SoFFin and is responsible for the composition and oversight of the Executive Board as well as for major strategic decisions of FMS-WM. The Executive Board has a minimum of two members (currently three) and is appointed by the Supervisory Board. It is responsible for representing FMS-WM externally and for managing its business. In addition, a General Manager (Generalbevollmächtigter) was appointed by the Executive Board, who functions as Chief Operating Officer. In February 2014, the Supervisory Board decided that the Executive Board would assume the responsibilities previously assigned to the Management Board (Geschäftsleitung).
FMS-WM is registered with the commercial register (Handelsregister) of the local court (Amtsgericht) of Munich under HRA 96076. Its registered office and business address is at Prinzregentenstraße 56, 80538 Munich, Federal Republic of Germany. Its telephone number is +49 89 9547627-0. FMS-WM maintains a branch in Rome, Italy. The Italian branch was registered with the company register (Registro delle Imprese) of Rome on May 7, 2013 under registration number 12372371000. As at the date hereof, the registered status of the Italian branch is inactive. As of August 13, 2014, FMS-WM does not intend to open any additional branches.
Creation and Legal Status
FMS-WM’s creation and legal status are a direct result of the German Federal Government’s response to the global financial markets crisis. In October 2008, the German Federal Government enacted a comprehensive package of measures to support key German strategic financial institutions, most notably the HRE Group. This comprehensive package included the FMStFG, which provided for the implementation of SoFFin and established the FMSA, a federal agency under public law with legal personality (rechtsfähige Anstalt öffentlichen Rechts) supervised by the German Federal Ministry of Finance (Bundesfinanzministerium). Section 8a of the FMStFG grants the FMSA the power to create wind-up institutions. The purpose of these institutions is to assume distressed and non-strategic assets from systemically important financial institutions and to eventually dispose of or liquidate the risk positions transferred to them.
-9-
As of 2007, the HRE Group was one of the largest commercial property lenders and providers of public finance in Germany. Most of the commercial property loans were refinanced by the issuance of covered bonds, making the HRE Group the leading German issuer of covered bonds. In the course of the liquidity crisis in September 2008, the HRE Group encountered financial difficulties primarily caused by the heavy debt burden held by one of its subsidiaries, Depfa Bank plc (“Depfa”). Depfa had borrowed short-term money to fund higher interest-bearing long-term positions in public sector finance on a large scale. When the interbank lending market collapsed in September 2008, Depfa faced substantial refinancing problems. Within a short period of time, the entire HRE Group faced solvency issues as well. Due to the HRE Group’s importance for the German financial system, the Federal Republic initiated various support measures, which led to the SoFFin becoming the sole owner of Hypo Real Estate Holding AG (“HRE”) in October 2009. The government support measures also included the extension of liquidity guarantees by SoFFin and the creation of FMS-WM as a wind-up institution under Section 8a of the FMStFG on July 8, 2010. Risk positions and non-strategic assets/businesses of the HRE Group were then transferred to FMS-WM on October 1, 2010.
FMS-WM is a public law institution with partial legal capacity (teilrechtsfähige Anstalt des öffentlichen Rechts) created pursuant to German administrative law. It is fully-owned by the SoFFin and is subject to the supervision and control of the FMSA. FMS-WM may act in its own name, and may be subject to court proceedings. In order to achieve its mandate of winding-up the portfolio of risk positions and non-strategic assets/businesses assumed from the HRE Group, FMS-WM may engage in all kinds of banking and financial services transactions and all other transactions that directly or indirectly serve its purposes. FMS-WM is, however, neither a financial institution nor a financial services institution within the meaning of the German Banking Act (Kreditwesengesetz, “KWG”), nor a financial service provider within the meaning of the German Securities Trading Act (Wertpapierhandelsgesetz, “WpHG”), nor an insurance company within the meaning of the German Insurance Supervision Act (Versicherungsaufsichtsgesetz, “VAG”) nor regulated as such. As a consequence, FMS-WM is prohibited from engaging in transactions that would require a license under the EU Banking Directive (2006/48/EC) or the EU Directive on markets for financial instruments (2004/39/EC). Nonetheless, pursuant to its charter and the FMStFG, FMS-WM is subject to certain provisions of the KWG and the WpHG. In particular, FMS-WM is subject to banking supervision by the German Federal Financial Supervisory Authority (Bundesanstalt für Finanzdienstleistungsaufsicht) and must comply with the organizational obligations and restrictions on certain activities imposed by the KWG applicable to banks and financial institutions. FMS-WM is, however, exempted from the regulatory capital and liquidity requirements and the licensing requirements under the KWG. FMS-WM is also deemed to be a financial institution for purposes of the German Money Laundering Act (Geldwäschegesetz), and is therefore subject to the provisions thereof.
-10-
Relationship with the Federal Republic of Germany
The following chart provides an overview of the relationship between FMS-WM and the Federal Republic.
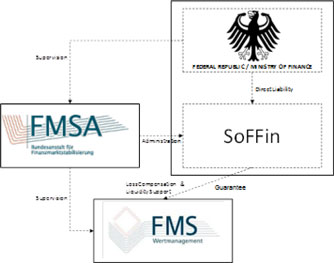
Relationship with SoFFin
SoFFin. FMS-WM is fully owned by SoFFin, which is established by law and designated to fulfill specific tasks of the German Federal Government assigned to it under the FMStFG. SoFFin is administered by FMSA. SoFFin is a special pool of assets (Sondervermögen) of the Federal Republic. The term special pool of assets (Sondervermögen) designates legally dependent assets of the Federal Republic. Accordingly, the FMStG provides that SoFFin shall have no legal capacity, although in legal relations SoFFin may act, sue and be sued in its own name. There shall be no attachment of, or other measures of compulsory execution against, SoFFin. Any debt incurred by SoFFin is accounted for as direct debt of the Federal Republic. In addition, Section 5 of the FMStFG provides that the Federal Republic is directly liable for the obligations of SoFFin. SoFFin’s obligations are thus effectively obligations of the Federal Republic.
SoFFin’s purpose is to stabilize the German financial sector by extending liquidity guarantees, providing equity capital, assuming risk positions, and setting up wind-up institutions. To this end, SoFFin has been authorized by the German legislature under Section 6 of the FMStFG to extend liquidity guarantees in a total aggregate amount of up to EUR 400 billion. In addition, Section 9 of the FMStFG authorizes the German Federal Ministry of Finance to incur debt in a total aggregate amount of up to EUR 80 billion to cover the cost of measures taken by SoFFin in connection with the provision of equity capital, the assumption of risk positions and the compensation of losses of wind-up institutions. Specifically, the authorization permits the German Federal Ministry of Finance to incur debt up to an amount of EUR 40 billion. Subject to the approval of the parliamentary control panel for financial market stabilization which is comprised of nine members of the budget committee of the German Bundestag, this amount can be increased by up to another EUR 30 billion and, subject to the approval of the budget committee of the German Bundestag, by up to another EUR 10 billion. Any financing required by SoFFin is obtained in the manner used by the Federal Republic to finance itself, i.e., through the issuance of debt instruments by the Federal Republic of Germany – Finance Agency (Bundesrepublik Deutschland – Finanzagentur GmbH). When the Federal Republic incurs debt for SoFFin, it results in an increase in the net borrowings and debt of the Federal Republic. Applications for stabilization measures extended by SoFFin could initially be made only until the end of 2010. As a consequence of developments in the euro area, however, the German Federal Government has re-opened the application period twice since then, initially until the end of 2012 and, subsequently, until the end of 2014.
Guarantee. With effect from January 1, 2014, Section 8a of the FMStFG, which deals with the establishment of wind-up institutions, was amended to provide that SoFFin guarantees all existing and future obligations of FMS-WM with respect to moneys, debt securities and derivative transactions as well as obligations of third parties that are expressly guaranteed by FMS-WM, which FMS-WM has borrowed, issued, entered into or incurred or which have been transferred to FMS-WM during the time period for which SoFFin is the sole obligor of the loss compensation obligation (alleiniger Verlustausgleichspflichtiger). For a description of SoFFin’s loss compensation obligation, see “–Loss Compensation and Liquidity Support Obligations” below. Accordingly, under the guarantee, if FMS-WM fails to make any payment of principal or interest or any other amount required to be paid with respect to securities issued by it when that payment is due and payable, SoFFin will be liable for that payment as and when it becomes due and payable, provided that the security was issued during the time period for which SoFFin was the sole obligor of the loss compensation
-11-
obligation. SoFFin’s obligation under the guarantee ranks equally, without any preference, with all of its other present and future unsecured and unsubordinated indebtedness. Holders of securities issued by FMS-WM may enforce this obligation directly against SoFFin without first having to take legal action against FMS-WM. If SoFFin fails to make any payment of principal or interest or any other amount required to be paid with respect to securities issued by FMS-WM when that payment is due and payable under the guarantee, the Federal Republic will be liable for that payment as and when it becomes due and payable pursuant to Section 5 of the FMStFG, as described above. The guarantee and the Federal Republic’s direct liability for SoFFin’s obligations pursuant to Section 5 of the FMStFG are strictly a matter of statutory law and are not evidenced by any contract or instrument. Potential claims based on the guarantee and on Section 5 of the FMStFG may be subject to defenses available to FMS-WM and SoFFin with respect to the obligations covered.
Loss Compensation and Liquidity Support Obligations. Under FMS-WM’s charter, which was enacted pursuant to Section 8a of the FMStFG, SoFFin is obligated to cover all losses sustained by FMS-WM and to ensure that FMS-WM is able to pay all its liabilities at all times when due and in full. As described above, pursuant to Section 5 of the FMStFG, the Federal Republic is directly liable for SoFFin’s obligations. Accordingly, SoFFin’s loss compensation and liquidity support obligations enable FMS-WM to pursue its operations and effectively mean that FMS-WM’s obligations, including the obligations to holders of debt securities issued by FMS-WM, are backed by the full faith and credit of the Federal Republic.
For the year ended December 31, 2013, SoFFin recorded a profit of EUR 23.0 million, largely due to valuation effects. As of December 31, 2013, the total outstanding stabilization measures provided by SoFFin amounted to EUR 17.1 billion, which related entirely to equity capital.
Relationship with FMSA
FMS-WM operates under the supervision and control of the Federal Republic, which is exercised through the FMSA. FMSA was established to manage SoFFin and to implement and monitor the stabilization measures extended by SoFFin. FMSA has the power to create wind-up institutions under Section 8a of FMStFG. FMSA is supervised by the German Federal Ministry of Finance (Bundesfinanzministerium), which ensures that FMSA acts in the public interest. In particular, the German Federal Ministry of Finance supervises FMSA’s activities and nominates the members of FMSA’s management committee (Leitungsausschuss). Certain decision-making powers have been delegated to the management committee by the FMStFG.
FMSA appoints the members of FMS-WM’s Supervisory Board. The Supervisory Board members, in turn, appoint the members of FMS-WM’s Executive Board. Both the Supervisory Board and FMSA may dismiss a member of the Executive Board for good cause.
FMSA is responsible for the legal supervision of FMS-WM. In particular, FMSA has to approve and supervise FMS-WM’s implementation of the winding-up plan as well as any deviations from, or amendments to, the winding-up plan. FMSA may give instructions to FMS-WM’s Executive Board and Supervisory Board in order to ensure that FMS-WM complies with applicable law and the requirements of its charter. Comprehensive reporting obligations by FMS-WM ensure that FMSA has a solid basis for exercising its control and instruction rights.
In keeping with its supervisory role, FMSA action is required for the dissolution of FMS-WM. While there is no set maximum duration for FMS-WM’s existence, FMS-WM’s charter provides that FMS-WM shall exist only until the transferred risk positions and non-strategic assets/businesses have been liquidated in full, at which point it is obligated to notify FMSA. FMSA may initiate the final dissolution process for FMS-WM if it has no remaining liabilities or if SoFFin has assumed any remaining liabilities. Any assets or profits remaining at the time of dissolution will be transferred to SoFFin.
Business and Operations
Introduction
FMS-WM is tasked with unwinding the portfolio of risk positions and non-strategic assets/businesses that it assumed on October 1, 2010 from the HRE Group in ways that maximize its value. As described in more detail under “—Outsourced Portfolio Administration,” the HRE Group ceased to provide asset management and financing services for FMS-WM as of September 30, 2013. As of October 1, 2013, FMS-WM Service has been tasked with administering the portfolio assumed by FMS-WM.
-12-
FMS-WM’s activities are characterized by the following strategic goals:
| | • | | Winding-up of the risk assets aimed at maximizing their value: FMS-WM aims to unwind the risk assets in a manner that maximizes their value, subject to defined wind-up and risk strategies that are adjusted on a continuous basis. The winding-up plan – which is the key strategic management tool of FMS-WM – serves as the basis for the implementation of its portfolio liquidation operations. Depending on the market situation and the asset category, the winding-up plan provides for the following strategies in connection with liquidating the portfolio assumed by FMS-WM: |
| | • | | Holding assets, which includes active management of loans and securities with a view to repaying outstanding amounts (e.g., where the risk/return profile is acceptable). |
| | • | | Selling assets to the extent it makes economic sense (e.g., to reduce positions with a higher risk profile and when market opportunities arise). |
| | • | | Restructuring, including workout, wind-up and reorganization measures, relating to both performing and non-performing financial instruments, particularly in the Infrastructure and Commercial Real Estate segments, with a view to maximizing the value of the liquidation measure related to the financial instrument (including by reducing risk). |
| | • | | Cost-effective servicing and management of the risk assets: The wind-up of the risk assets is carried out in part by FMS-WM itself and in part by FMS-WM Service (as of October 1, 2013; until September 30, 2013, the HRE Group functioned as the external service provider carrying out the wind-up of the risk assets in part) as portfolio servicer. FMS-WM remains solely responsible for the winding-up aimed at maximizing value and the cost-effective servicing and management of the portfolio. |
| | • | | Cost-effective funding and separate market access for FMS-WM: FMS-WM seeks to ensure cost-effective funding for the purpose of carrying out its mandate. Given its backing by the full faith and credit of the Federal Republic, FMS-WM is able to realize funding cost advantages that are not available to the HRE Group. |
In order to achieve its mandate of winding up the portfolio of risk positions and non-strategic assets/businesses assumed from the HRE Group, FMS-WM may engage in all kinds of banking and financial services transactions and all other transactions that directly or indirectly serve its purposes. FMS-WM is, however, neither a financial institution nor a financial services institution within the meaning of the KWG, nor a financial service provider within the meaning of the WpHG, nor an insurance company within the meaning of the VAG. FMS-WM is also prohibited from engaging in transactions that would require a license under the EU Banking Directive (2006/48/EC) or the EU Directive on markets for financial instruments (2004/39/EC).
The Portfolio
FMS-WM assumed a portfolio of risk positions and non-strategic assets/businesses in an original amount of EUR 175.7 billion (nominal volume) from the HRE Group on October 1, 2010. As of December 31, 2013, FMS-WM had liquidated approximately EUR 56.6 billion (December 31, 2012: EUR 38.8 billion) of its initial portfolio of EUR 175.7 billion. As of the same date, FMS-WM’s portfolio encompassed 3,855 individual exposures (December 31, 2012: 4,553) with 1,859 different counterparties (December 31, 2012: approximately 2,144) and a significant amount of derivatives. The individual exposures are located in 63 countries and denominated in 16 currencies. Geographically, the greatest concentrations are in Germany, the United States, the United Kingdom, Spain and Italy. About half (52%) of the exposures in the portfolio are denominated in euro, nearly a quarter (23%) in U.S. dollars, approximately 16% in GBP and approximately 4% in JPY. The portfolio is highly complex and diverse and consists of a particularly high proportion of illiquid exposures with extremely long maturities. To the extent that a legal transfer of risk assets could not be effected as of October 1, 2010 (for example, due to outstanding consent requirements), economic ownership of such risk positions was transferred synthetically to FMS-WM (for example, through subparticipations or guarantees). FMS-WM is currently working on the physical and legal transfer of these risk positions that to date have only been transferred synthetically from the HRE Group to FMS-WM, and exposures relating to synthetically transferred receivables and derivatives still awaiting novation were significantly reduced in 2013.
For purposes of risk management and the wind-up reports that FMS-WM submits to FMSA on a monthly basis in accordance with the winding-up plan, FMS-WM has classified the portfolio into four segments – Commercial Real Estate, Infrastructure, Public Sector and Structured Products. The Commercial Real Estate and Commercial Real Estate-Workout segments were merged to form the Commercial Real Estate segment in 2013. The segments in turn are broken down into 34 wind-up clusters. The assets of all four segments include syndicated loans.
-13-
Outsourced Portfolio Administration
Until September 30, 2013, the HRE Group served as an outside administrator of the portfolio transferred to FMS-WM. The work outsourced to the HRE Group pursuant to a cooperation agreement between FMS-WM and Deutsche Pfandbriefbank AG (“PBB”), the core financial institution of the HRE Group, included many of the administrative activities in connection with the portfolio assumed and, as of December 31, 2012, approximately 500 employees of the HRE Group were working for FMS-WM in connection with portfolio servicing at a cost of approximately EUR 21 million per month.
As the transfer of risk positions and non-strategic assets/businesses from the HRE Group to FMS-WM could be viewed as state aid, the transfer had to be approved by the European Commission. In this context, the Federal Republic committed to ensure that, after September 30, 2013, the HRE Group will provide neither asset management services nor refinancing services for FMS-WM and that, from an organizational point of view, those services can be assumed by third parties. Pursuant to this commitment, the cooperation agreement with PBB has been terminated with effect as of September 30, 2013.
Since October 1, 2013, FMS-WM Service, a service entity established by FMS-WM in April 2012, has been tasked with the full set of portfolio management services and operations services including collateral management, settlement functions and credit operations, while FMS-WM retains final decision-making powers and ultimate responsibility for the risk assets under management. The master agreement governing the outsourcing of business processes and services also grants FMS-WM extensive rights to obtain information and perform inspections, enabling it to monitor and control the servicing of the risk assets by FMS-WM Service. Further, IBM Deutschland GmbH, has assumed the provision of comprehensive information technology services as of October 1, 2013, and additional third-party service providers perform regulatory reporting and financial administration functions.
FMS-WM’s Segments
As described above, FMS-WM’s portfolio is grouped into four segments – Commercial Real Estate, Infrastructure, Public Sector and Structured Products.
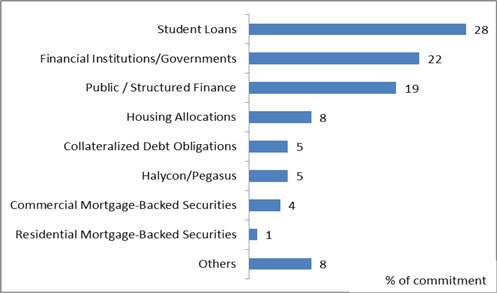
Structured Products
As of December 31, 2013, the Structured Products segment comprised assets with a nominal value of EUR 31.4 billion, which accounted for 26.4% of FMS-WM’s overall portfolio (December 31, 2012: EUR 36.3 billion). The Structured Products segment includes practically all types of structured credit instruments from asset-backed securities, commercial and residential mortgage-backed securities or collateralized debt obligations to exotic interest, inflation and credit derivatives. Many of the underlying assets of these structured products originated in the United States. The following chart reflects the proportion of the various asset classes in the segment.
-14-
The Structured Products segment succeeded in winding up exposures with a nominal value of approximately EUR 4.9 billion in 2013 (2012: EUR 5.9 billion). Forced sales of the exposures would have been possible only at substantial discounts, due to, among other reasons, changed market conditions, sharp cuts in external ratings and the poor quality of the assets that serve as collateral for these securities.
A hold strategy often is the best option for preventing losses on sales because most structured products are highly illiquid securities, i.e., they are rarely traded in the market. In some cases, restructuring the transactions increased their value or improved their tradability. Client derivatives in the acquired portfolio that were entered into with municipalities and cities in Europe and America present a particular challenge in this respect. Many of these derivatives must be restructured to maintain their value and minimize losses. The increase in the number of non-performing exposures in this category is also creating the need for additional workout efforts.
Infrastructure
As of December 31, 2013, the Infrastructure segment held 483 exposures with an aggregate nominal value of EUR 14.5 billion (12.1% of FMS-WM’s total portfolio) (December 31, 2012: EUR 16.4 billion). These exposures are spread across all five continents (with a focus on the United Kingdom, which makes up more than half of the segment’s total portfolio as of December 31, 2013) and encompass loans (approximately 46.7%) and securities (approximately 53.3%) which were used to finance regulated utilities (31%), social infrastructure (19%), roads (17%), non-roads (10%), airports and ports (8%), power/energy (7%), environmental water/waste (3%), telecommunications and others (3%) and asset finance (2%). Most of the loans in this segment have very long maturities and were closed at margins that are substantially below current market levels because many borrowers were either government or government-sponsored entities or are structures to which the public sector is a party in some other way, for instance as the entity that procures products and services. In view of the complexity of the portfolio held by this segment, activities of this segment focus on restructuring individual transactions to improve the chances of effecting a subsequent redemption, (partial) settlement by a third party or subsequent sale.
The portfolio held by this segment was reduced by approximately 61 exposures in 2013, corresponding to a reduction of approximately EUR 1.9 billion, or roughly 12% (December 31, 2012: EUR 0.7 billion), related to sales of ports and airports. It is very difficult to sell or prematurely repay individual exposures or entire sub-portfolios because the assumptions that were made at the time of entering into the exposures in many of these projects with respect to the degree of utilization or occupancy have in the meantime turned out to be too optimistic.
-15-
The economic success of infrastructure projects is generally dependent on external factors, including the growth of the gross domestic product (“GDP”), the unemployment rate and energy costs. Despite the uptake in infrastructure financing in 2013, the portfolio held by this segment continues to be adversely affected by the persistent financial and economic crisis.
Public Sector
As of December 31, 2013, the Public Sector segment held assets with an aggregate nominal value of EUR 59.8 billion, accounting for 50.3% of FMS-WM’s total portfolio (December 31, 2012: EUR 67.4 billion). The Public Sector segment accomplished a satisfactory unwinding result in 2013 with a share of around 68.2% in active sales (consisting of, in particular, Greek and Japanese bonds), accompanied by positive trends in the bond markets in the euro area, which led to higher securities prices. In particular, FMS-WM’s Greek exposures were further reduced to EUR 1.5 billion in fiscal year 2013, as FMS-WM effected targeted sales of small tranches of government bonds in the secondary market.
However, there was a deterioration in the ratings breakdown of the Public Sector segment’s portfolio. The year-on-year decline in the volume of financing with top ratings of “AAA”, “AA” and “A” by S&P was mainly due to sales of and exchange rate effects on Japanese government bonds, the repayment of loans and advances to the European Financial Stability Facility (“EFSF”) assumed in the course of restructuring the Greek bond position, and larger principal repayments from German states and regional state banks.
FMS-WM is working to improve its position in the medium and long term. To that end, FMS-WM negotiates directly with the issuers of the bonds or the counterparties of hedging transactions with the aim of unwinding, simplifying or untangling complex coupon or derivatives structures.
Commercial Real Estate
As of December 31, 2013, the Commercial Real Estate segment, which was merged with the former Commercial Real Estate-Workout segment during the course of 2013, held assets with a nominal value of EUR 13.4 billion, accounting for 11.3% of FMS-WM’s total portfolio (December 31, 2012: aggregate amount held by Commercial Real Estate and Commercial Real Estate-Workout segments was EUR 16.8 billion).
FMS-WM’s Commercial Real Estate segment is managed by FMS-WM’s Commercial Real Estate units. The portfolio of the segment had a volume of approximately EUR 27.2 billion when it was transferred in October 2010. It was reduced to approximately 727 counterparties and a volume of EUR 13.4 billion as of December 31, 2013 (December 31, 2012: EUR 16.8 billion), corresponding to a net reduction of approximately EUR 3.4 billion.
Loans secured by mortgages on commercial real estate account for the majority of the global portfolio managed by the Commercial Real Estate segment. On the one hand, the portfolio is composed of loans for office properties (39% of the nominal value) in European metropolitan areas, Asia and the United States; loans for shopping centers (13%), as well as hotels (7%) and hospitals; or residential properties (7%) in Europe, both in Germany and elsewhere.
The standard wind-up strategies of the segment are to “hold”, “restructure” and “sell”. The restructuring strategy approach is pursued when it becomes evident that a borrower cannot repay the loan upon maturity. The objective here is to stabilize the exposure and thus improve the outlook for later repayment or sale of the loan or collateral.
In some cases, FMS-WM carries out foreclosures to enforce claims. In very rare cases, rescue acquisitions are made in which FMS-WM takes over a financed property with the aim of selling it again as quickly as possible after further restructuring. The principle of maximizing value remains of the utmost importance in this case as well.
A major part of the unwinding of the Commercial Real estate segment’s portfolio is expected to be completed by 2020.
-16-
Winding-Up the Portfolio
The portfolio assumed by FMS-WM is managed and liquidated in accordance with a winding-up plan (Abwicklungsplan), which describes the wind-up measures FMS-WM intends to take and includes a timeline for liquidation measures relating to the risk positions and non-strategic assets/businesses. The winding-up plan is proposed by FMS-WM’s Executive Board and adopted by the Supervisory Board. In accordance with its charter, FMS-WM submits monthly reports to the FMSA, which include information on the process of recovery and liquidation under the winding-up plan. In its supervisory capacity, the FMSA has the right to request changes to the winding-up plan and approves and supervises FMS-WM’s implementation of the winding-up plan as well as any deviations from, or amendments to, the winding-up plan. FMS-WM monitors prevailing market conditions on an ongoing basis to determine whether the winding-up plan needs to be adapted.
The winding-up plan has been designed with a view to ensuring that FMS-WM at all times has sufficient liquidity to cover its three-month liquidity requirements under stress scenario assumptions over the entire wind-up period, independently of SoFFin’s duty to provide liquidity to FMS-WM and to offset losses incurred by it. It also provides that, in principle, FMS-WM may not engage in new business with the exception of refinancing and hedging transactions and selected new business that reduces portfolio risks in a cost efficient manner (e.g., prolongations as well as selective restructuring measures).
The process of selling individual assets follows detailed, fixed instructions. For instance, a sale has to be based on offers from several bidders and deviations from this process are only permitted under special circumstances. The sales process aims to ensure verification and documentation that bids reflect market prices.
In addition to actively reducing the portfolio volume, an important goal for the successful management of the portfolio is the improvement of the quality of the portfolio’s structure, which FMS-WM strives to achieve by restructuring loan exposures, securities holdings and derivative positions. In this way, FMS-WM substantially improved the medium- to long-term prospects for the realization of numerous exposures in 2013, for example through intensive negotiations with borrowers, consortium members and issuers. Such successfully implemented restructuring measures have the effect of reducing the portfolio’s complexity and risk.
Since taking over the portfolio from the HRE Group, the portfolio’s nominal value has been reduced from EUR 175.7 billion to EUR 119.1 billion by the end of 2013 (2012: EUR 136.9 billion). This corresponds to a reduction of 32.2%. Of the cumulative reduction in the portfolio by EUR 56.6 billion by December 31, 2013, active sales accounted for EUR 12.2 billion and contractual redemptions and amortizations accounted for the remainder of EUR 44.4 billion. The cumulative portfolio reduction of EUR 55.4 billion was positively impacted by currency effects of EUR 1.2 billion.
The following table shows the reconciliation of the nominal value of the portfolio excluding derivatives from the transfer date (October 1, 2010) to total assets as of December 31, 2013 and 2012 (translated at exchange rates as of December 31, 2013 and 2012, respectively):
| | | | | | | | |
| | | As of December 31, | |
| | | 2012 | | | 2013 | |
| | | (unaudited) | |
| | | (€ in billions) | |
Wind-up portfolio commitment as of October 1, 2010 | | | 175.7 | | | | 175.7 | |
– Cumulative portfolio wind-up | | | –41.3 | | | | –55.4 | |
+ Currency effects | | | +2.5 | | | | –1.2 | |
| | | | | | | | |
Wind-up portfolio commitment | | | 136.9 | | | | 119.1 | |
– Undrawn credit lines and guarantees | | | –6.4 | | | | –3.7 | |
+ Portfolio of own issues(1) | | | +65.2 | | | | +35.6 | |
+ Other receivables including portions thereof(2) | | | +50.7 | | | | +36.7 | |
| | | | | | | | |
Total assets | | | 246.4 | | | | 187.7 | |
| | | | | | | | |
| (1) | Nominal value before accrued interest. |
| (2) | Mainly contains the cash collateral for derivatives, amortized cost of derivatives taken over, receivables from liquidity facilities used, current credit balances, accrued interest and loss compensation claims against SoFFin. |
-17-
Based on nominal values broken down by segment, the portfolio was reduced as follows from October 1, 2010 to December 31, 2013 (translated at exchange rates as of December 31, 2013):
| | | | | | | | | | | | | | | | |
| | | October 1, 2010 | | | Portfolio wind-up | | | Currency effects | | | December 31, 2013 | |
| | | (unaudited) | |
| | | (€ in billions) | |
Structured Products | | | 43.9 | | | | –12.3 | | | | –0.2 | | | | 31.4 | |
Infrastructure | | | 18.0 | | | | –3.5 | | | | 0.0 | | | | 14.5 | |
Public Sector | | | 86.6 | | | | –25.8 | | | | –1.0 | | | | 59.8 | |
Commercial Real Estate | | | 27.2 | | | | –13.8 | | | | 0.0 | | | | 13.4 | |
| | | | | | | | | | | | | | | | |
Total | | | 175.7 | | | | –55.4 | | | | –1.2 | | | | 119.1 | |
| | | | | | | | | | | | | | | | |
The following table shows the remaining maturities of the assets broken down by segments as of December 31, 2013:
| | | | | | | | | | | | | | | | | | | | |
| | | 2013–2015 | | | 2016–2020 | | | 2021–2030 | | | 2031–2040 | | | After 2040 | |
| | | (unaudited) | |
| | | (€ in billions) | |
Structured Products | | | 6.0 | | | | 14.0 | | | | 11.1 | | | | 20.8 | | | | 7.9 | |
Infrastructure | | | 1,5 | | | | 1.1 | | | | 2.5 | | | | 3.0 | | | | 6.3 | |
Public Sector | | | 0.5 | | | | 4.5 | | | | 7.4 | | | | 8.6 | | | | 10.4 | |
Commercial Real Estate | | | 10.5 | | | | 2.3 | | | | 0.4 | | | | 0.0 | | | | 0.2 | |
| | | | | | | | | | | | | | | | | | | | |
Total | | | 18.5 | | | | 21.9 | | | | 21.4 | | | | 32.4 | | | | 24.8 | |
| | | | | | | | | | | | | | | | | | | | |
Exposure to Troubled Sovereigns and Concentration Risks
The portfolio of FMS-WM contains several significant concentration risks, including those in sovereign debt exposures. As the example of Greece showed in 2011, such concentration risks, which are vulnerable to macroeconomic or systemic risks, can cause significant losses in FMS-WM’s portfolio. In addition to Greece, there are major concentrations in the portfolio related to the other “PIIGS” countries (i.e., Portugal, Ireland, Italy, Greece, Spain), particularly in the Public Sector segment. In fiscal 2013, Italy comprised an important part of FMS-WM’s exposure at default (“EaD”), accounting for EUR 31.0 billion, representing approximately 22.7% of FMS-WM’s total EaD (2012: EUR 32.1 billion). For more information on the breakdown of FMS-WM’s credit portfolio by countries and regions, see “—Risk Report—Credit Risks—Breakdown of Credit Portfolio by Countries and Regions.”
The following table shows a breakdown of FMS-WM’s EaD by sector for bonds and loans concerning the PIIGS countries, including information on related microhedges, as of December 31, 2013.
| | | | | | | | | | | | | | | | | | | | | | | | |
| | | Exposure at Default – Bonds & Loans per Sector | | | | | | Microhedges(2) | |
Country(1) | | Gross
sovereign | | | Other
public
borrowers | | | Financial
institutions | | | Non-financial
corporations | | | Total EaD per
country | | | Additional (negative)
MtM of Microhedges | |
| | | (unaudited) | |
| | | (€ in millions) | |
Italy | | | 24,937 | | | | 3,050 | | | | 203 | | | | 2,761 | | | | 30,952 | | | | (2,277 | ) |
Spain | | | 1,132 | | | | 4,165 | | | | 1,305 | | | | 2,118 | | | | 8,720 | | | | (363 | ) |
Portugal | | | 1,206 | | | | 111 | | | | 201 | | | | 829 | | | | 2,347 | | | | (90 | ) |
Greece | | | 1,550 | | | | 0 | | | | 0 | | | | 5 | | | | 1,555 | | | | (53 | ) |
Ireland | | | 0 | | | | 346 | | | | 362 | | | | 609 | | | | 1,316 | | | | (28 | ) |
| | | | | | | | | | | | | | | | | | | | | | | | |
Total | | | 28,825 | | | | 7,671 | | | | 2,072 | | | | 6,321 | | | | 44,889 | | | | (2,812 | ) |
| | | | | | | | | | | | | | | | | | | | | | | | |
| (1) | The allocation is based on the country of the economic risk (e.g., location of the collateral), which may be different from the legal domicile of the debtor/issuer in individual cases. |
| (2) | The exposure-at-default definition applied by FMS-WM already accounts for negative mark-to-market (MtM) values of microhedges as of the date of the asset transfer from the HRE Group in October 2010. In order to avoid redundancies, and different from the presentations in the prior year’s table, only the current negative mark-to-market values of microhedge instruments to the extent that they exceed their October 2010 values are included in this table. In 2013, market developments resulted in a MtM-increase, i.e., a decrease of negative MtM of PIIGS microhedge instruments of about EUR 3.5 billion. |
-18-
Treasury, Capital Markets Funding
FMS-WM engages in funding activities, including the issuing of debt securities and/or obtaining financing from financial institutions, in order to refinance funding instruments associated with the assumed portfolio as they expire. FMS-WM will have to engage in refinancing activities until its portfolio has been liquidated. In the first quarter of fiscal 2012, refinancing from the European Central Bank (“ECB”), which had amounted to EUR 35.2 billion as of December 31, 2011, was fully replaced by the inflow of funds from FMS-WM’s own money and capital markets issuances. In fiscal year 2013, the funding requirement saw a year-on-year decline of EUR 24 billion, as a loss compensation claim in respect of SoFFin amounting to EUR 7.3 billion was recognized as cash in the first quarter of 2013, complementing the accelerated portfolio wind-up. FMS-WM monitors its financing needs and liquidity requirements by means of a liquidity management system similar to the ones used by financial institutions. FMS-WM seeks to ensure that it has sufficient liquidity to cover its three-month liquidity requirements under stress scenario assumptions at all times.
Treasury
Treasury’s core tasks are short-term liquidity management and the management of interest rate and foreign exchange risks. In addition, FMS-WM’s treasury group is responsible for improving FMS-WM’s funding structure on an ongoing basis with the aim of generating positive contributions to FMS-WM’s earnings.
As part of its short-term liquidity management, FMS-WM utilizes instruments with maturities of up to one year. In fiscal year 2013, FMS-WM’s issuing activity under its existing money market program, namely the European Commercial Paper (“ECP”) / Certificates of Deposit (“CD”) program and the U.S. Asset-Backed Commercial Paper (“US ABCP”) program further contributed to a stable and sustainable funding structure for FMS-WM. As of December 31, 2013, the ECP/CD program had a volume of EUR 29.1 billion (December 31, 2012: EUR 30 billion), and the US ABCP program had a volume of EUR 15.3 billion (December 31, 2012: EUR 18.8 billion).
Interest rate and foreign exchange risks are managed in a centralized fashion on an income-oriented basis guided by a risk aversion policy within the limit system. The aim is to minimize the fluctuations in the fair value and profit / loss due to market risks. To this end, treasury enters into hedging transactions for individual exposures (micro hedges) or at the portfolio level (macro hedges).
Capital Markets Funding
Capital markets funding’s main task is to raise long-term funds in the international capital markets. Maturities generally range from one to ten years, with the majority of bonds having a tenor of three to five years. In fiscal year 2013, FMS-WM further optimized its funding base, as it successfully raised about EUR 11 billion via the capital markets. In this context, the share of funding with an initial maturity of more than one year was further increased as planned and, as of December 31, 2013, accounted for approximately 46% of the aggregate funding volume (December 31, 2012: 35%). As of December 31, 2013, FMS-WM reported a total outstanding capital market issues of approximately EUR 60 billion with an average remaining maturity of around 3.5 years.
FMS-WM’s bonds are being offered in a broad range of formats, including benchmark format, non-benchmark public format and private placements as well as different currencies, e.g. EUR, USD and GBP, in order to fund the wind-up portfolio at matching currencies. In fiscal year 2013, FMS-WM focused in particular on obtaining USD funding on the U.S. capital market through its issuance program in global format established in the United States, and it successfully raised a total of USD 5.5 billion through three USD benchmark issues with maturities of between three to five years.
-19-
Capitalization and Indebtedness
The following table sets forth FMS-WM’s actual capitalization and indebtedness as of December 31, 2013.
| | | | |
| | | As of
December 31, 2013 | |
| | | audited | |
| | | (in € millions) | |
Debt | | | | |
Short-term debt | | | 257 | |
Bonds and notes | | | 121,189 | |
Loans and advances to bank and loans and advances to customers (not payable on demand) | | | 47,947 | |
Other borrowings and other liabilities | | | 18,152 | |
Equity | | | | |
Total equity | | | 119 | |
| | | | |
Total capitalization | | | 187,664 | |
| | | | |
-20-
Economic Conditions and Market Developments
The following sections contain an overview of economic conditions and market developments, which affected the value of FMS-WM’s portfolio and its business in general in 2013.
Macroeconomic Developments
According to International Monetary Fund (“IMF”) estimates, the global economy grew at an average rate of 3.0% in 2013.
The euro area saw a 0.4% decline in economic output in 2013. However, the systemic risk of a wave of sovereign bankruptcies in the euro area and of a dissolution of the euro area has decreased considerably. This is attributable in particular to the ECB’s announcement in the summer of 2012 to launch a purchasing program for bonds issued by those Member States whose currency is the euro (“Euro Area Member States”) (so-called “outright monetary transactions”). The situation on the capital markets subsequently stabilized, a trend that continued throughout the remainder of 2013. The establishment of a banking union was further advanced and helped to mitigate systemic risks.
Due to declining inflation rates, the ECB sharply lowered the interest rate for securities and repo transactions to reach a new historical low of 0.25% during the course of 2013. In addition, it introduced forward guidance, reiterating its decision to keep key interest rates at or below current levels for an extended period of time. The secondary market spreads for government bonds issued by peripheral Euro Area Member States narrowed during the year, and yields on short term instruments hit new historical lows. The euro gained substantial ground against not only the Japanese yen, but also emerging market currencies.
Real Estate Markets
Developments in the real estate markets in which FMS-WM’s real estate collateral is located presented a varied picture in 2013. The same held true for investor interest in the acquisition of real estate and receivables in the relevant markets. In geographical terms, FMS-WM’s receivables portfolio focused on Germany, the United States and the United Kingdom.
In Germany, financing was focused on office, residential, commercial and retail properties. Vacancy rates were generally steady, while metropolitan areas generally saw more positive development than economically weaker regions. In the case of residential real estate, movement to cities continued and vacancy rates rose in rural regions.
The improved economic performance of the United Kingdom had positive effects on its real estate market in 2013. There were initial signs of the market overheating in London’s real estate sector, which led to a slight upturn even in some non-first rate locations. However, the real estate market remained stagnant outside of major urban areas.
In the United States, real estate market performance varied depending on the regional markets and segments in 2013. Due to improved purchasing power, the commercial and retail markets experienced a slight recovery, in particular in major metropolitan areas. A trend toward moving to larger urban centers was also evident in the United States, leading to imbalances in regional real estate markets. Major east and west coast cities benefited disproportionately from this development. These effects were particularly pronounced in the second half of 2013.
Infrastructure Markets
Led by the energy and infrastructure sectors, total worldwide project finance volume in 2013 marked a new all-time high with significant growth in the private finance initiative / public private partnership (“PFI/PPP”) segment, in particular. Infrastructure financing was the primary focus, accounting for nearly 80% of the total global project finance volume.
While banks remained reticent to provide financing in 2013, this was more than compensated for by financing through the capital markets. Driven by an improved outlook for returns and relatively low default rates, institutional investors such as insurance companies and pension funds increasingly sought project financing investments having good credit ratings as an alternative to conventional investments in government or corporate bonds.
-21-
For a large number of ongoing projects, however, the persistent financial and economic crisis, supplemented by weak macroeconomic data from many countries, continued to cause problems in achieving planned capacity utilization or meeting contractually agreed interest and principal payment deadlines.
Financial Institutions and Covered Bonds
In 2013, bonds issued by financial institutions benefited from the easing of the sovereign debt crisis. As a result of certain capitalization measures taken by some banks in peripheral Euro Area Member States, such as credit sales and capital increases, the ECB’s announcement to carry out stress tests for euro-area banks in 2014 did not have any adverse effects on the financial sector. Compared to 2012, the volatility of risk premiums was much lower in 2013.
Public Sector
At the end of 2013, the global economic environment was subdued, as a result of slowing growth rates in China and the currency crises in the emerging markets of India, Turkey, South Africa and Argentina.
Nevertheless, due to the continued relief experienced by the financial markets, resulting from the ECB’s introduction of outright monetary transactions and the implementation of various monetary policies, yields in the peripheral Euro Area Member States continued to decline steadily in 2013. Yields on ten-year German government bonds rose sharply from 1.3% at the start of 2013 to around 1.9% at the end of December 2013, whereas Spain’s ten-year bonds achieved a yield of 4% by the end of 2013 (start of 2013: 5%). Yields on Greek government bonds also declined during 2013, with the yield on ten-year bonds amounting to a little over 8% by the end of the year (end of 2012: 11%). In the case of the Italian ten-year government bonds, yields managed to settle at a lower level (below 4%) at the end of the year, after a difficult government formation process. Yields on ten-year UK government bonds rose sharply during the reporting period by 120 basis points to 3% against the backdrop of a strong upturn in UK growth.
On the income side, the financial situation of the public-sector in the United States tracked the performance of the U.S. economy as a whole. The increase in taxes collected by the states had dropped to a normal level by year-end after seeing rapid growth in previous quarters. The stabilizing real estate market and continued revival in United States’ economic growth resulted in a strong year-on-year upturn in yields of ten-year U.S. treasuries, rising 125 basis points to 3% at the end of 2013.
The situation on the U.S. municipal bond market was difficult in 2013, chiefly due to higher yield expectations, credit uncertainties and a significant outflow of funds.
ABS Markets
In 2013, ABS markets continued to recover worldwide. The performance of U.S. commercial mortgage-backed securities (CMBSs) paralleled the positive developments in the residential and commercial real estate markets. Accordingly, spreads tightened in the course of 2013 and the market for new issues in the United States also recovered. Securities backed by student loans delivered steady performance in 2013, although the high level of student debt remains a burdening factor.
-22-
Financial Report – Net Assets, Financial Position and Results of Operations
Net Assets
The asset transfer from the HRE Group as of October 1, 2010 continued to have a major impact on the net assets of FMS-WM as of December 31, 2012 and 2013. FMS-WM took over assets, liabilities, provisions, accrued and deferred items, derivative financial instruments as well as other executory contracts from the transferring legal entities for accounting purposes effective October 1, 2010.
In fiscal year 2013, asset swap packages with a nominal value of EUR 1.3 billion were transferred to FMS-WM, resulting in an asset upgrade. The risk positions underlying these asset swap packages had initially been transferred to FMS-WM by way of guarantee with effect from October 1, 2010. Consequently, the off-balance sheet items (contingent liabilities and other obligations) decreased by EUR 1.3 billion, and the balance sheet items affected by asset upgrades increased by the amount of the purchase price of the assets and related derivatives.
Taking contingent liabilities and other obligations into account, FMS-WM posted a transaction volume (total equity and liabilities plus contingent liabilities plus other obligations) of EUR 201,732 million as of December 31, 2013 compared to a transaction volume of EUR 262,479 million as of December 31, 2012. The table below provides an overview of the amount and composition of the transaction volume of FMS-WM as of December 31, 2012 and 2013 (numbers may not add up due to rounding differences):
| | | | | | | | |
| | | As of December 31, | |
| | | 2012 | | | 2013 | |
| | | (€ in millions) | |
Assets | | | | | | | | |
Cash reserve | | | — | | | | 383 | |
Loans and advances to banks | | | 39,667 | | | | 23,609 | |
Loans and advances to customers | | | 24,427 | | | | 28,359 | |
Debt instruments | | | 169,618 | | | | 130,918 | |
Other long-term equity investments | | | 7 | | | | 7 | |
Shares in affiliated companies | | | 381 | | | | 386 | |
Intangible and tangible fixed assets | | | 2 | | | | 11 | |
Other assets | | | 7,413 | | | | 51 | |
Prepaid expenses | | | 4,908 | | | | 3,940 | |
| | | | | | | | |
Total assets | | | 246,423 | | | | 187,664 | |
| | | | | | | | |
| |
| | | As of December 31, | |
| | | 2012 | | | 2013 | |
| | | (€ in millions) | |
Equity and liabilities | | | | | | | | |
Liabilities to banks | | | 42,109 | | | | 21,837 | |
Liabilities to customers | | | 37,427 | | | | 26,367 | |
Securitized liabilities | | | 147,234 | | | | 121,189 | |
Other liabilities | | | 751 | | | | 373 | |
Deferred income | | | 17,506 | | | | 16,559 | |
Provisions | | | 1,361 | | | | 1,220 | |
Equity | | | 35 | | | | 119 | |
| | | | | | | | |
Total equity and liabilities | | | 246,423 | | | | 187,664 | |
Contingent liabilities | | | 10,669 | | | | 8,115 | |
Other obligations | | | 5,387 | | | | 5,953 | |
| | | | | | | | |
Transaction volume | | | 262,479 | | | | 201,732 | |
| | | | | | | | |
-23-
Lending Business
The transferred risk positions that arise from the underlying lending business encompass receivables, disbursement obligations under irrevocable loan commitments and guarantees. Some of the contingent liabilities stem from guarantees granted by FMS-WM for certain assets that are being held by HRE Group companies and could not be transferred to FMS-WM.
The lending business had a volume of EUR 61,234 million as of December 31, 2013, compared to a volume of EUR 74,609 million as of December 31, 2012, and was broken down into the following balance sheet and below-the-line items:
| | | | | | | | |
| | | As of December 31, | |
| | | 2012 | | | 2013 | |
| | | (unaudited) | |
| | | (in € millions) | |
Loans and advances to banks | | | 39,667 | | | | 23,609 | |
Loans and advances to customers | | | 24,427 | | | | 28,359 | |
Contingent liabilities (excluding credit default swaps) | | | 5,128 | | | | 3,313 | |
Other obligations | | | 5,387 | | | | 5,953 | |
| | | | | | | | |
Lending business | | | 74,609 | | | | 61,234 | |
| | | | | | | | |
The decrease in loans and advances to banks is mainly attributable to an agreement reached with PBB in August 2013 on what is referred to as the “Ersatzdeckungslösung”, or the substitute cover solution. This concerns a portfolio of loans and advances that had been transferred to FMS-WM as of October 1, 2010 through limited cash subparticipations, as these items were still being used by the transferor at the transfer date in order to cover mortgage-backed Pfandbrief securities (covered bonds) the transferor had issued. On the basis of the agreement, this portfolio was removed from PBB’s mortgage cover register and, as with other subparticipations, passed into the beneficial ownership of FMS-WM. As of December 31, 2013, this portfolio of loans and advances is thus recognized under loans and advances to customers, whereas as of December 31, 2012 it was still recognized as a limited cash subparticipation under loans and advances to banks (to PBB) in the amount of EUR 6.9 billion. Accordingly, loans and advances to customers increased following the substitute cover solution.
In connection with the agreement on the substitute cover solution, FMS-WM has pledged to pay out up to EUR 2,994 million to PBB upon PBB’s request. Likewise, a disbursement would give rise to a claim of FMS-WM against PBB. In this respect, FMS-WM is exposed to a default risk vis-à-vis PBB, which is primarily offset by a reduction in irrevocable loan commitments to third parties of EUR 640 million, as well as the partial repayment of the liquidity facility with Depfa in the amount of EUR 1,628 million.
Securities Holdings
Holdings of securities in the amount of EUR 130,918 million were recognized as debt instruments as of December 31, 2013, compared to an amount of EUR 169,618 million as of December 31, 2012. As of December 31, 2013, the amount of securities holdings included debt instruments issued by FMS-WM of EUR 35,660 million that were repurchased, compared to EUR 65,250 million as of December 31, 2012. The repurchased debt instruments were allocated to the liquidity reserve and partly pledged as collateral. The holdings of debt instruments issued by FMS-WM solely concern marketable bonds and other fixed-income securities, which are classified as holdings of financial investments. The holdings of securities are hedged against interest rate and foreign exchange risks through the use of derivatives.
Shares in Affiliated Companies and Other Long-Term Equity Investments
As of December 31, 2013, a book value of EUR 393 million was recognized for shares in affiliated companies and other long-term equity investments (December 31, 2012: EUR 388 million). The changes in fiscal year 2013 resulted mainly from the additions with respect to the affiliated companies Awareness (EUR 18 million) and Airen (EUR 2 million), as well as from countervailing currency effects.
-24-
Liabilities
Issuing bonds and engaging in repos in accordance with FMS-WM’s funding strategy had a significant impact on the following balance sheet items: (i) liabilities to banks, (ii) liabilities to customers and (iii) securitized liabilities.
As of December 31, 2013, FMS-WM recognized liabilities to banks of EUR 21,837 million (December 31, 2012: EUR 42,109 million), which was primarily comprised of repo transactions in a nominal amount of EUR 16,764 million (December 31, 2012: EUR 35,479 million).
As of December 31, 2013, liabilities to customers amounted to EUR 26,367 million (December 31, 2012: EUR 37,427 million) and mainly included repo transactions in a nominal amount of EUR 21,747 million (December 31, 2012: EUR 33,205 million).
In addition, FMS-WM recognized securitized liabilities of EUR 121,189 million as of December 31, 2013 (December 31, 2012: EUR 147,234 million). In connection therewith, the holdings of FMS-WM’s own debt issues, including pro rata interest, as of December 31, 2013 were EUR 92,139 million (December 31, 2012: EUR 117,705 million). As of December 31, 2013, this item also included EUR 29,050 million in commercial paper from the ECP/CD Program launched in fiscal year 2011 (December 31, 2012: EUR 29,529 million). For further details, please see “Financial Position — Issuing Activity and Funding.”
Prepaid Expenses and Deferred Income
Prepaid expenses in the total amount of EUR 3,940 million as of December 31, 2013 (December 31, 2012: EUR 4,908 million) included EUR 2,541 million (December 31, 2012: EUR 3,505 million) of derivatives costs that have not yet been amortized, as well as EUR 1,281 million (December 31, 2012: EUR 1,264 million) accrued from the lending business attributable to payments made by FMS-WM in 2010 for the hedge adjustments of the hedged items (receivables) taken over from the HRE Group companies in 2010.
Deferred income of EUR 16,559 million as of December 31, 2013 (December 31, 2012: EUR 17,506 million) included EUR 16,380 million (December 31, 2012: EUR 17,278 million) of payments not yet amortized, received in connection with the derivatives taken over as of October 1, 2010 from the transferring HRE Group companies. The book values of these financial instruments at the transfer date resulted, in particular, from the negative fair values of the financial instruments used to hedge interest rate risks.
Equity and Loss Compensation Claim
The capital base of FMS-WM is structured as follows:
HRE and PBB each made an equity contribution of EUR 1 million to FMS-WM in connection with the spin-off pursuant to Section 8a (1) and (8) of FMStFG in conjunction with Sections 123 (2) No. 1 and 131 of the German Reorganization and Transformation Act (Umwandlungsgesetz, “UmwG”).
No loss compensation claim was recognized against SoFFin as of December 31, 2013. The loss compensation claim against SoFFin in the amount of EUR 7,316 million recognized as of December 31, 2012 was settled in full through payments received in the amount of EUR 7,300 million as well as through appropriation of profits in the amount of EUR 16 million. As of December 31, 2013, FMS-WM recognized net retained profits of EUR 117 million (December 31, 2012: EUR 33 million).
Financial Position
The transfer of assets and liabilities from the HRE Group included funding items in fiscal years 2012 and 2013. Some of these holdings were repaid in connection with the restructuring of the funding and replaced by new FMS-WM issues. Securitized liabilities of EUR 121,189 million were recognized as of December 31, 2013 in connection with FMS-WM’s debt issuances, the ECP/CD program and accrued interest (December 31, 2012: EUR 147,234 million). As of December 31, 2013, FMS-WM had issued EUR 92,139 million in own debt instruments including pro rata interest (December 31, 2012: EUR 117,705 million); of this amount, EUR 35,660 million including pro rata interest (December 31, 2012: EUR 65,250 million) had been bought back and reported as an asset in the balance sheet under the “debt instruments” item.
-25-
Issuing Activity and Funding
In fiscal year 2013, FMS-WM met its self-imposed targets for its funding and investor relations strategy. The overriding aim is to ensure the solvency of FMS-WM at all times. This is accomplished by utilizing a broadly diversified funding structure, characterized by a wide range of products and the continuous expansion of a highly diversified, international investor base.
In the money market, the product range includes the following instruments:
| | • | | US ABCP (through an issuance vehicle in the United States); |
| | • | | Repos (bilateral, tri-party and Eurex repos); and |
| | • | | Deposits from institutional investors. |
Capital market funding is based on strategic benchmark issues, publicly offered issues and private placements. These three financing methods differ in issuance volume and secondary market liquidity. FMS-WM generally does not issue structured products but it can issue in different currencies – USD, GBP, CAD and AUD in addition to EUR.
The total 2013 issuance volume of all capital market instruments amounted to EUR 11.0 billion, with issuances in USD dominating the funding activities. In this context, the successful issuance of three strategic USD benchmark bonds to a broad range of investors and regions was of particular relevance. Furthermore, additional GBP benchmark issues were placed with international investors, and a CAD issue was launched for the first time in fiscal year 2013.
FMS-WM plans to further increase the proportion of long-term capital market financing in its overall funding volume.
Results of operations
The results of operations were mainly influenced by current income and expenses of risk positions transferred from the HRE Group and related valuation determinations. At EUR 389 million, current income and expenses (net interest and commission income less administrative expenses and depreciation / amortization of intangible and tangible fixed assets) were significantly higher than the negative balance of EUR 263 million from risk provisions and net income from investments items that were impacted by valuation determinations and sales results.
In fiscal year 2013, FMS-WM posted a positive result of EUR 146 million (2012: EUR 37 million) from ordinary activities (after deducting the balance of other operating income and expenses as well as the cost of loss absorption). Deducting the tax expense of EUR 29 million (2012: EUR 2 million) results in net income for the fiscal year of EUR 117 million (2012: EUR 35 million).
The table below provides an overview of the structure of the result from ordinary activities based on the items of the income statement:
INCOME STATEMENT
| | | | | | | | |
| | | January 1 –
December 31,
2012 | | | January 1 –
December 31,
2013 | |
| | | (audited) (€ in millions) | |
Net interest income | | | 729 | | | | 626 | |
Net commission income | | | 89 | | | | 100 | |
Other operating income (loss), net | | | (8 | ) | | | 25 | |
General and administrative expenses | | | (337 | ) | | | (334 | ) |
Depreciation and amortization | | | (1 | ) | | | (3 | ) |
Risk provisions for the lending business | | | 32 | | | | (440 | ) |
Net income from investments in the securities business | | | (465 | ) | | | 177 | |
Expenses from loss absorption | | | (2 | ) | | | (5 | ) |
| | | | | | | | |
Results from ordinary activities | | | 37 | | | | 146 | |
Taxes (incl. other taxes) | | | (2 | ) | | | (29 | ) |
Net income (loss) for the fiscal year | | | 35 | | | | 117 | |
Retained profits (accumulated losses) brought forward | | | (2 | ) | | | — | |
| | | | | | | | |
Net retained profits | | | 33 | | | | 117 | |
| | | | | | | | |
-26-
Net Interest Income
Net interest income in fiscal year 2013 amounted to EUR 626 million (2012: EUR 729 million). This decrease is partly attributable to the reduction in the portfolio volume resulting from the portfolio wind-up. FMS-WM’s funding advantages were also adversely affected by interest rates in the euro money market, which had fallen to historical lows.
Net Commission Income
Net commission income primarily comprises commission income from the lending and derivatives business. Commission expenses mainly includes premium payments for loan hedging derivatives. The increase in net commission income in fiscal year 2013 was essentially attributable to additional payments by PBB/Depfa for the assets transferred by way of guarantee.
Other Operating Income / Loss, Net
Other operating income of EUR 51 million in fiscal year 2013 (2012: EUR 7 million) included reversals of provisions. Other operating expenses of EUR 26 million in fiscal year 2013 (2012: EUR 15 million) mainly resulted from currency translation.
General and Administrative Expenses
General and administrative expenses amounted to EUR 334 million in fiscal year 2013 (2012: EUR 337 million).
The slight decrease in administrative expenses is primarily due to a lower level of expenses incurred in the context of service outsourcing (servicing of the portfolio assets, administrative and back office activities, IT services, accounting services). Until September 30, 2013, major components of the operating activities of FMS-WM were managed by the HRE Group companies under the cooperation agreement with PBB. For the nine-month period ending September 30, 2013, expenses of EUR 159 million were incurred for the tasks assigned to the HRE Group companies (full-year 2012: EUR 214 million). Since October 1, 2013, key components of activities previously outsourced to the HRE Group have been performed by FMS-WM Service. In addition, other service providers have been working for FMS-WM to provide certain services such as IT services (IBM Deutschland GmbH) or key areas of accounting (capco GmbH Wirtschaftsprüfungsgesellschaft). Including the payments made to such service providers since October 1, 2013, servicing expenses totaled EUR 194 million for fiscal year 2013 as a whole (2012: EUR 214 million).
Additional expenses of EUR 37 million were also incurred in fiscal year 2013 in connection with the spin-off and transfer of the IT systems from the HRE Group to IBM Deutschland GmbH. Other administrative expenses essentially comprise expenses for consulting services, particularly in connection with the transfer of servicing operations from the HRE Group to FMS-WM Service, expenses for other projects and legal consulting costs.
Personnel expenses for the staff of FMS-WM amounted to EUR 25 million 2013 (2012: EUR 21 million).
Risk Provisions and Net Income from Securities
The result from risk provisions (write-downs of and valuation allowances on receivables and certain securities, additions to loan loss provisions / income from reversals of write-downs of receivables and certain securities and from the reversal of loan loss provisions) fell to EUR -440 million in fiscal year 2013 (2012: EUR 32 million), primarily as a result of an increase in specific and general loan loss provisions.
-27-
Net income from investments (write-downs of and valuation allowances on shares in affiliated companies, other long-term equity investments and securities classified as fixed assets, income from reversals of write-downs of shares in affiliated companies, other long-term equity investments and securities classified as fixed assets) amounted to EUR 177 million in fiscal year 2013 (2012: net loss of EUR 465 million). The positive result in fiscal year 2013 mainly resulted from write-ups of securities. The negative net income from investments in fiscal year 2012 had mainly resulted from the closing-out of derivatives that were originally in a hedging relationship with Greek loans or securities.
Overall appraisal
On the whole, business developed positively for FMS-WM in fiscal year 2013. The favorable conditions in many market segments were used to accelerate the unwinding of the transferred portfolio. The commitment of the wind-up portfolio was reduced (before currency effects of EUR 1.2 billion) to EUR 120.3 billion as of December 31, 2013, corresponding to an unwinding of EUR 14.1 billion, or 12.1%, compared to December 31, 2012 and EUR 55.4 billion, or 31.5%, compared to October 1, 2010, exceeding the wind-up of approximately EUR 11 billion projected in the outlook for fiscal year 2013. The faster wind-up was in particular due to sales of assets in the Public Sector unit.
Results of operations also developed positively in fiscal year 2013, exceeding the projections in the outlook for fiscal year 2013. FMS-WM recognized net income of EUR 117 million for fiscal year 2013 (2012: EUR 35 million).
In fiscal year 2013, the aggregate of net interest income and net commission income exceeded general and administrative expenses plus depreciation and amortization of intangible and tangible fixed assets by EUR 389 million. As a result, income from the portfolio more than offset expenses from operating activities. This balance exceeded the balance of items determined by valuations (risk provisions and net income from investments) by EUR 126 million, with FMS-WM benefiting from favorable market developments. The loss compensation claim against SoFFin in the amount of EUR 7,316 million recognized as of December 31, 2012 was settled in whole in 2013 through payments received in the amount of EUR 7,300 million and the appropriation of net retained profits from fiscal year 2012.
With respect to FMS-WM’s issuance activities, the total issuance volume of all capital market instruments amounted to EUR 11.0 billion in fiscal year 2013 and was thus approximately EUR 3 billion lower than the issuance volume of EUR 14 billion forecast in the outlook for fiscal year 2013. This was largely due to the reduced need for borrowings, given that the portfolio wind-up progressed more rapidly than planned.
-28-
Risk Report
The risk report has been prepared in accordance with the requirements of the German Commercial Code (Handelsgesetzbuch, “HGB”) applicable to large corporations and the supplementary provisions applicable to banks.
The disclosures in the risk report take all risk positions into account, to the extent that FMS-WM has beneficial ownership thereof and bears the value at risk. This also encompasses synthetic transfers of risk positions and receivables of FMS-WM’s subsidiaries whereby FMS-WM has assumed all default risks, directly or indirectly resulting from these subsidiaries’ funding activities. Apart from risk positions, the risk report covers properties that were taken over in connection with the disposal of collateral. In addition, the risk report describes exposures where the risks were not transferred directly for a variety of reasons but instead by means of guarantees, for instance. These disclosures do not distinguish between on-balance sheet transactions (receivables, securities) and off-balance sheet transactions (especially guarantees, loan commitments, derivatives).
Basics of Risk Management
FMS-WM’s risk management is based on the winding-up plan and the risk strategy, and it is documented in FMS-WM’s Risk Manual. The key risk management functions and instruments were further refined in 2013. Aside from the sets of tools used to steer and monitor risk, this also includes reviewing and adjusting, as necessary, approaches to management, limit setting and reporting, given the special nature of FMS-WM.
FMS-WM’s risk strategy takes into account the requirements of Section 25a (1) KWG, Article 2 (4) of its charter and the relevant rules and regulations of the German Minimum Requirements for Risk Management (“MaRisk”), which specify the requirements of Section 25a of the KWG. MaRisk provides a framework for risk management at financial institutions. Furthermore, it refines the requirements placed on a business organization for outsourced activities and processes requiring financial institutions to take adequate measures to ensure that outsourcing does not result in an undue increase in risk. MaRisk provides for the establishment of appropriate internal governance structures. Within the meaning of MaRisk, risk management includes the determination of appropriate strategies, as well as the establishment of appropriate internal surveillance procedures while taking into account a financial institution’s risk-bearing capacity. The internal surveillance procedures comprise the internal control system and internal audit.
In particular, the internal control system has to cover:
| | • | | rules regarding the organizational and operational structure; and |
| | • | | processes for identifying, assessing, treating, monitoring and communicating risks. |
In addition, MaRisk contains specific requirements for the organization and management of counterparty default risks (credit risks), market risks, liquidity risks and operational risks.
Although FMS-WM is neither a financial institution nor a financial services institution within the meaning of the KWG, due to similarities of FMS-WM’s operations with such institutions, FMS-WM’s risk strategy complies with all relevant rules, regulations and standards applicable to banks and/or financial institutions to the extent advisable, required or stipulated in its charter. Prior to FMS-WM’s creation, extensive preliminary talks were conducted between FMS-WM and FMSA, its legal regulator, concerning the extent to which MaRisk rules and regulations would apply to FMS-WM.
The risk strategy defines long-term, general and consistent frameworks and principles for FMS-WM’s risk management to the extent that this is advisable and required in substantive terms. It provides the basis for managing and controlling different types of risks and fixes fundamental risk targets that govern all business decisions. Changes in rules, regulations and standards applicable to banks and/or financial institutions, such as the amendments made to MaRisk in 2012, are reviewed for applicability to FMS-WM and complied with, to the extent deemed advisable or required.
The current risk strategy is derived directly from FMS-WM’s objective as set out in its charter. FMS-WM follows a strategy of unwinding the portfolio in a way that maximizes its value to the extent possible. The efficiency and operational feasibility of all risk-steering activities constitute additional requirements for reducing risk. The risk tolerance of FMS-WM is described in the winding-up plan, which reflects the business strategy. The risk strategy derived from it is documented in the Risk Manual.
-29-
To refine its risk management, FMS-WM also adopted specific strategies for five relevant risk categories: credit risk, market risk, liquidity risk, operational risk and other risks.
Because the capital adequacy requirements of the KWG do not apply to FMS-WM, the absence of any obligation to prepare an internal capital adequacy assessment process to manage its business based on economic capital pursuant to MaRisk standards results in reduced requirements on FMS-WM’s reporting system compared to banks, among others. In particular, FMS-WM’s approach to risk management is designed to avoid seeking recourse with SoFFin under the latter’s obligation to compensate losses and limit any such resource to that which is inevitable.
The winding-up plan and the risk strategy — including the underlying assumptions — are reviewed on a regular basis (at least annually) and updated as necessary. Deviations from the plan that are identified in the wind-up report may also require further updates.
Organizational Structure of Risk Management
Responsibility for risk management rests with the Executive Board of FMS-WM, in particular the Chief Risk Officer/Chief Financial Officer. The chart below shows the organizational structure of risk management:
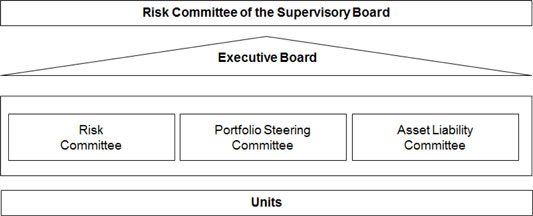
Risk Committee of the Supervisory Board
As far as loan and portfolio management are concerned, the Risk Committee of the Supervisory Board serves as the latter’s decision-making body tasked with making related decisions on a case-by-case basis that are particularly relevant to risk, have major effects on FMS-WM’s income or are of strategic significance. It reviews and approves transactions and measures, strategies and targets related to individual exposures in connection with unwinding the portfolio and monitors relevant loan decisions. All members delegated for this purpose by the Supervisory Board are entitled to vote.
Committees
The following committees, which generally meet weekly or monthly and can be convened at short notice, have been established at FMS-WM to support and advise the Executive Board as well as to make certain decisions:
| | • | | The Risk Committee is the corporate body for operational lending decisions at the management level of FMS-WM; it makes loan decisions on individual loans for all asset classes that fall within its scope. In May 2013, the former Real Estate Committee was merged into the Risk Committee. |
-30-
| | • | | The Portfolio Steering Committee is a strategic management and information committee at the Executive Board level whose duties include preparing decisions on adjustments to the winding-up plan and making decisions on methodological changes in risk controlling and concerning overall risk steering. |
| | • | | The Asset Liability Committee (“ALCO”) serves as the Executive Board’s key body tasked with information gathering, monitoring and management activities in connection with strategic decisions on issues related to the structure of the balance sheet, liquidity and market risk positions, funding and hedging strategies, limits as well as its methodological requirements for market and liquidity risks. |
Units
The units listed below are mainly responsible for risk management at FMS-WM.
The Risk Controlling department within the Risk Controlling, Finance & Portfolio Steering unit is responsible for carrying out all risk controlling activities in accordance with MaRisk for all risk types. This includes identification, analysis, assessment, monitoring and reporting of all risks. The Risk Controlling, Finance & Portfolio Steering unit is also responsible for carrying out the annual review of FMS-WM’s winding-up plan and for preparing the monthly wind-up report, which is the centralized reporting tool for all risk types.
The review of the adequacy of the models used to determine credit risk and model-based market price valuation is assigned to the Quantitative Analytics department within the Structured Products & Quantitative Analytics unit.
Managing credit risk is one of FMS-WM’s central tasks. The main tasks of the portfolio management units entail making decisions on loans and securities at both the individual and the portfolio level. This is where the decisions of the committees on whether or not to hold risk positions to maturity or sell or restructure them are prepared and carried out. Credit Portfolio Management comprises the following four units and departments, the responsibilities of which are defined on the basis of the relevant segments or product groups, which have been changed since 2012:
| | • | | The Structured Products department within the Structured Products & Quantitative Analytics unit manages the structured products. |
| | • | | The Sovereign & Public Finance, Financial Institutions unit is responsible for government bonds and the Public Sector and Financial Institutions portfolio segments. |
| | • | | The Corporate & Asset Finance unit is mainly responsible for infrastructure financing. |
| | • | | The Commercial Real Estate I unit handles exposures that are mostly performing, and comprises the former Commercial Real Estate I and II portfolios. |
| | • | | The Commercial Real Estate II unit handles exposures that are generally being restructured or require workout activities and corresponds to the former Commercial Real Estate III unit. |
The Treasury unit is responsible for the operational management of interest rate, foreign exchange and counterparty risks as well as for tactical liquidity management. The Capital Markets Funding unit handles long-term funding via capital market issues and manages strategic liquidity risk.
The Capital Markets Funding unit handles long-term funding via capital market issues and manages strategic liquidity risk.
In 2013, the Audit department was directly assigned to the Chief Risk Officer/Chief Financial Officer and performed risk-based and process-independent audits relating to the effectiveness and adequacy of risk management in general and the internal control system (“ICS”) in particular.
The Sourcing & Corporate Services department in the IT & Sourcing unit is tasked with service provider management and thus managing outsourcing risks.
-31-
Moreover, each individual department at FMS-WM must also manage the operational risks falling within the scope of its respective responsibility. For example, ensuring adequate rules of representation and carrying out measures to prevent losses are decentralized responsibilities.
Process Organization of Risk Management
Risk management at FMS-WM encompasses the
| | • | | monitoring / reporting of risks. |
The material types of risks associated with the business model of FMS-WM are:
An annual risk inventory is conducted to identify and review risks classified as material. Due to the size and complexity of the portfolio transferred, credit risk in the form of borrower and issuer risk is the most important type of risk to which FMS-WM is exposed. FMS-WM is also subject to considerable operational risk as a result of the extensive outsourcing of processes. The latter risk required considerable management attention in 2013, especially during the period in which portfolio services were being transferred to FMS-WM Service. Risk management also entails actively limiting, steering and monitoring the following risks in particular: credit risk in the form of counterparty risk, market risk and liquidity risk. Borrower and issuer risks are monitored and managed as part of the wind-up strategies for specific wind-up clusters within the segments. Credit risk in the form of counterparty risk, market risk, liquidity risk, operational risk and other risks are managed for the portfolio of FMS-WM in its entirety.
FMS-WM is fully liable for managing and monitoring each individual risk type. Until September 30, 2013, FMS-WM had used service level agreements to assign essential operational tasks and activities to the HRE Group as its portfolio servicer. These activities were taken over by FMS-WM Services beginning on October, 1 2013. The scope of services provided is set out in detailed service level agreements. As was the case with the previous portfolio servicer, however, FMS-WM Services has very limited decision-making authority.
As of October 1, 2013, key areas of IT operations have been outsourced to IBM Deutschland GmbH. Extensive service level agreements have been entered into to ensure FMS-WM’s day-to-day IT system functionality, also providing for future adaptability of the systems to meet the special needs of FMS-WM through change orders.
Since October 1, 2013, FMS-WM’s Internal Audit department has also fulfilled its duties with respect to FMS-WM’s risk assets managed by FMS-WM Service. Until September 30, 2013, these activities had been outsourced to the Group Internal Audit department of the HRE Group, and was monitored by the director of the Audit department of FMS-WM in his capacity as its Audit Officer in accordance with MaRisk requirements.
-32-
Credit Risks
Definitions
The credit risk of FMS-WM mainly comprises borrower and issuer risk, counterparty risk as well as country risk.
| | • | | Borrower and issuer risk comprises the risk that a contracting party, or a reference entity in the case of credit derivatives, does not fulfill the payment obligations resulting from loan agreements or securities issues in full and in a timely manner. The borrower and issuer risk is further classified into default and migration risks. |
| | • | | Default risk: The risk that a borrower cannot fulfill payment obligations in full or on time and that FMS-WM suffers a financial disadvantage as a result. In many cases, FMS-WM is in possession of marketable collateral, which can partly mitigate the loss in case of default. |
| | • | | Migration risk: Risk that a borrower’s or issuer’s creditworthiness might deteriorate over time. Such deterioration in creditworthiness does not entail direct losses on the balance sheet unless the borrower defaults. On the portfolio level, the deterioration is reflected in the rating profile. In case the borrower does not default – despite deterioration in its credit quality – the temporary impairment of the risk position is reversed in full. |
| | • | | Counterparty risk is the risk that a contracting party’s default makes it impossible to fully collect unrealized profits from derivatives and executory contracts. It includes replacement and settlement risk. |
| | • | | Replacement risk: If a derivative counterparty defaults, a contract must be replaced at conditions that are less favorable than the ones applicable when the contract was initially entered into. |
| | • | | Settlement risk: FMS-WM delivers an asset that it has sold to a counterparty or makes a payment but does not receive the stipulated monetary consideration or the asset, as the case may be. |
| | • | | Country risk comprises credit or counterparty risks arising from the dependence of the contracting party on the actions of the relevant foreign states or political or economic developments. In particular, this includes the risk that a debtor cannot service its liabilities due to any of the following: |
| | • | | the government or central bank of the debtor’s country cannot or will not make available the foreign currency required for such repayment, or |
| | • | | the government or central bank of the debtor’s country prohibits such repayment (transfer risk), or |
| | • | | the currency of the debtor’s country can no longer be converted due to a serious deterioration of the country’s economic or political situation (conversion risk). |
In 2013, collective country valuation allowances were recognized for borrowers in countries with discernible country risks.
Risk Strategy
FMS-WM’s credit risk strategy includes minimizing losses by holding assets to maturity or winding them up as profitably as possible. Taking on new business for purposes other than hedging risks is not permitted under the risk strategy and is not included in the winding-up plan. In individual cases, new business may be allowed to cost-effectively reduce risks from existing positions (e.g., prolongations, acquisitions of collateral and stabilization measures).
Risk Identification
A catalogue of early warning signs, which was initially prepared in cooperation with the HRE Group, and has been adopted by FMS-WM Service, is used to continuously monitor loan exposures in order to ensure early identification of problem assets. The latter are then classified into Facilities in Focus, Watchlist, Restructuring and Workout – in that order – if certain indications are present. Exposures are subject to increasingly intensified monitoring – in that order – to ensure that risks are detected earlier and steps aimed at reducing risk can be initiated.
-33-
The guidelines agreed with FMS-WM Service for credit processes determine the requisite steps for performing risk reviews and risk assessments as part of regular monitoring. Early warning indicators as well as the credit processes are reviewed on a regular basis but at least annually by FMS-WM Service and coordinated with the responsible units within FMS-WM.
Risk Analysis and Assessment
Credit risk is measured using internal models that calculate the expected amount of the receivable at the time of default (“EaD”), the probability of default (“PD”) and the potential loss given default (“LGD”). The models for determining these parameters are reviewed annually by FMS-WM.
The aforementioned parameters are in turn used to calculate the expected loss (“EL”) for one year. The EL is calculated on an individual transaction level and subsequently aggregated by segment and across the overall portfolio.
In addition, the cumulative expected loss for a longer planning horizon and over the entire term of the positions in the wind-up portfolio is calculated as a risk reference value to be used in managing the portfolio. Stress tests are conducted at both the portfolio and segment levels, and the unexpected loss is quantified with the help of a credit portfolio model. In various sensitivity analyses and both historical and hypothetical scenarios, stress situations are modelled for the key risk parameters PD and LGD, and their effects are measured on the cumulative EL.
Risk Steering
The credit portfolio management units and departments listed in the section entitled “—Organizational Structure of Risk Management” are responsible for steering credit risks. Restructuring and selling receivables are the two most important tools that are available to FMS-WM for steering credit risks.
In managing the portfolio, FMS-WM generally bases its decisions on the long-term (i.e., intrinsic) value of an exposure in order to decouple decision-making from short-term fluctuations in value. Changes in the market value are also used for internal credit rating analyses, as they can be timely and independent indicators of creditworthiness. Additional analyses of the borrower and issuer risk and potential write-downs are also performed in the event of material market value changes.
Counterparty risks are managed by means of suitable limits and by applying the “gross future exposure” measure, which takes into account the current market value and its possible future increases and covers both replacement as well as settlement risks. As a rule, transactions entailing a counterparty risk may not be made without a sufficient borrower-specific limit. The extent to which the limit has been utilized must be verified before any new transaction takes place (also known as “pre-deal limit check”). All transactions are applied to the given borrower-specific limits immediately.
Two dimensions are analyzed in connection with the limiting of counterparty risks and active management of the related exposures.
| | • | | Counterparty risks involving customers in the wind-up portfolio: The transferred risk positions also encompass derivatives with customers in lending and securities transactions. The counterparty risks arising from these derivatives are limited for the purpose of monitoring any potential increases in risk resulting from changed market conditions. Increases in exposures are possible only in exceptional cases, for example with the aim of stabilizing the overall exposure. Under the set of rules allocating authority, exposures of this nature must be both decided and approved in accordance with the governance framework set out in FMS-WM’s charter. |
| | • | | Counterparty risks involving capital market partners: The Treasury and Capital Markets Funding units enter into money market transactions, derivatives and repos to manage both the risk positions and the liquidity of FMS-WM. Managing these business activities requires limits that give both units enough flexibility while enabling Risk Controlling to carry out its monitoring duties. The activities of the Treasury and Capital Markets Funding units are limited to a defined pool of counterparties (white list) and are subject to Risk Controlling’s independent limit monitoring and escalation process. In the first half of 2013, a methodology for determining upper limits for trading counterparties was developed and implemented to enable risk-adequate management of counterparty risk. |
-34-
Risk Monitoring and Reporting
Primarily at the portfolio level, borrower and issuer risks are initially monitored pursuant to the current winding-up plan and described in the wind-up report that is to be prepared monthly for the Executive Board and the Supervisory Board. A detailed credit risk and stress test report for the Executive Board was also introduced in the first half of the year 2013. This report, which is prepared on a quarterly basis, evaluates stress scenarios across all relevant risk types and includes credit risk-specific stress test analyses.
At the level of individual exposures, FMS-WM Service monitors credit risk using approved processes applied by the former portfolio servicer, the HRE Group. The migration of the ratings of the largest exposures is reported to the Executive Board in the wind-up report. In addition, FMS-WM Service reports monthly on the development of the watchlist and problem assets to the responsible portfolio managers at FMS-WM. Based on the data delivered and their own analyses, the portfolio managers monitor the individual exposures for their segments with regard to the decisions required in the interest of economic value maximization.
Counterparty limits and their utilization at transaction level are also recorded in the daily counterparty risk report, monitored and reported to the Executive Board as well as the Treasury unit. An escalation process ensures timely reaction and communication to the Executive Board if limits are exceeded.
Risk Position
FMS-WM’s credit portfolio is managed through the Commercial Real Estate, Public Sector, Structured Products and Infrastructure segments. Exposures held in the Workout segment up to the end of 2012 were transferred to the Commercial Real Estate segment as of January 1, 2013. An EaD is determined for all portfolio segments based on uniform specifications. The EaD shows the potential amount of the claim against the borrower irrespective of the latter’s credit rating and any risk provisions already set up in that connection. Besides the current drawdown, the EaD also takes into account the pro rata interest payments in relation to which a borrower may default before an exposure is defined as having defaulted (maximum 90 days) as well as those loan commitments which a borrower will still be able to draw on in future despite a significant deterioration in creditworthiness. The EaD of derivatives is defined as the sum of the current market value (including collateral) and the prescribed regulatory add-on, which constitutes a cushion for possible future market value increases.
The EL, as an additional important short-term parameter for managing the credit portfolio, is determined for the entire portfolio for a period of one year. The only risk positions excepted from the determination of the EL are those for which a risk provision was already recognized or for which a risk provision was transferred in the takeover of the portfolio.
The disclosures below correspond to the presentation of internal risk reporting in the wind-up report.
Breakdown of the EaD and the EL of the Credit Portfolio
The following is a breakdown of the EaD and the EL of the credit portfolio by segment:
| | | | | | | | | | | | | | | | | | | | | | | | | | | | | | | | | | | | | | | | | | | | | | | | |
| | | Real Estate (incl.
Workout) | | | Public Sector | | | Structured
Products | | | Infrastructure | | | Total (excluding
derivatives) | | | Derivatives | |
| | | December 31, | |
| | | 2013 | | | 2012 | | | 2013 | | | 2012 | | | 2013 | | | 2012 | | | 2013 | | | 2012 | | | 2013 | | | 2012 | | | 2013 | | | 2012 | |
| | | (unaudited) | |
| | | (€ in billions) | |
EaD | | | 13.6 | | | | 17.1 | | | | 72.0 | | | | 80.4 | | | | 32.5 | | | | 37.4 | | | | 18.3 | | | | 19.4 | | | | 136.4 | | | | 154.3 | | | | 15.1 | | | | 17.6 | |
EL | | | 0.25 | | | | 0.20 | | | | 0.06 | | | | 0.07 | | | | 0.16 | | | | 0.14 | | | | 0.12 | | | | 0.06 | | | | 0.59 | | | | 0.47 | | | | 0.17 | | | | 0.26 | |
As of December 31, 2013, the EaD of the risk positions reported in the wind-up report (excluding derivatives) was EUR 136.4 billion – a decline of EUR 17.9 billion (12%) compared to December 31, 2012. The decrease was mainly due to the scheduled and unscheduled redemptions (EUR -7.6 billion), exchange rate effects (EUR -3.9 billion) and sales (EUR -3.6 billion). At EUR -2.2 billion, over 60% of the sales were attributable to Japanese government bonds and Japanese municipal / infrastructure financing.
-35-
As of December 31, 2013, the break-down of the portfolio wind-up by individual segments is as follows: Real Estate (including Workout): EUR -3.5 billion (-20%), Public Sector: EUR -8.4 billion (-10%), Structured Products: EUR -4.9 billion (-13%), and Infrastructure EUR -1.1 billion (-5%).
The wind-up portfolio does not include the receivables from the HRE Group companies. These are mainly derived from the method by which the sub-portfolios were transferred as well as from the corresponding cash collateral for derivatives for which novation has not yet been possible. Exposures relating to synthetically transferred receivables and derivatives still awaiting novation were significantly reduced in 2013.
As of December 31, 2013, the overall derivative position had a total EaD of EUR 15.1 billion based on the wind-up report. Compared to December 31, 2012, the EaD from derivatives was thus reduced by EUR 2.5 billion, or 14%. The EL from derivatives for one year decreased by EUR 0.09 billion, or 35%.
Although the exposure of the wind-up portfolio declined by 12% (not including derivatives) year-on-year, the one-year EL was up from the previous year, rising by approximately 25% to EUR 0.59 billion as of December 31, 2013. The increase of EUR 0.12 billion in the EL is mainly attributable to rating downgrades in the Commercial Real Estate and Infrastructure segments. In relation to the EUR 123.1 billion of exposure from loans and advances for which specific loan loss provisions have not yet been recognized (internal rating classes AAA to C–), this corresponds to a one-year EL rate of 0.48%.
Breakdown of Credit Portfolio by Rating Classes(1)
The following is a breakdown of the credit portfolio by internal rating classes (what is shown are the internal PD ratings that have been applied to an S&P rating scale):
| | | | | | | | | | | | | | | | | | | | | | | | | | | | | | | | | | | | | | | | |
| | | Real Estate
(incl. Workout) | | | Public Sector | | | Structured
Products | | | Infrastructure | | | Total | |
| | | December 31, | |
| | | 2013 | | | 2012 | | | 2013 | | | 2012 | | | 2013 | | | 2012 | | | 2013 | | | 2012 | | | 2013 | | | 2012 | |
| | | (unaudited) | |
| | | (EAD in € billions) | |
Group A | | | | | | | | | | | | | | | | | | | | | | | | | | | | | | | | | | | | | | | | |
Ratings AAA to A- | | | 0.0 | | | | 0.0 | | | | 27.3 | | | | 33.1 | | | | 17.6 | | | | 23.1 | | | | 0.2 | | | | 2.3 | | | | 45.1 | | | | 58.5 | |
Group BBB | | | | | | | | | | | | | | | | | | | | | | | | | | | | | | | | | | | | | | | | |
Ratings BBB+ to BBB- | | | 0.4 | | | | 0.4 | | | | 36.3 | | | | 37.9 | | | | 10.4 | | | | 9.3 | | | | 9.7 | | | | 7.8 | | | | 56.8 | | | | 55.4 | |
Group BB | | | | | | | | | | | | | | | | | | | | | | | | | | | | | | | | | | | | | | | | |
Ratings BB+ to BB- | | | 1.7 | | | | 4.2 | | | | 6.4 | | | | 7.3 | | | | 2.2 | | | | 2.6 | | | | 2.5 | | | | 2.9 | | | | 12.8 | | | | 17.0 | |
Group B | | | | | | | | | | | | | | | | | | | | | | | | | | | | | | | | | | | | | | | | |
Ratings B+ to B- | | | 4.5 | | | | 4.6 | | | | 0.2 | | | | 0.2 | | | | 0.8 | | | | 1.2 | | | | 1.4 | | | | 2.4 | | | | 6.9 | | | | 8.4 | |
Group C | | | | | | | | | | | | | | | | | | | | | | | | | | | | | | | | | | | | | | | | |
Ratings CCC+ to C- | | | 0.4 | | | | 0.1 | | | | 0.0 | | | | 0.0 | | | | 0.7 | | | | 0.2 | | | | 0.4 | | | | 0.1 | | | | 1.5 | | | | 0.4 | |
Group D | | | | | | | | | | | | | | | | | | | | | | | | | | | | | | | | | | | | | | | | |
Rating D | | | 6.6 | | | | 7.8 | | | | 1.8 | | | | 1.9 | | | | 0.8 | | | | 1.0 | | | | 4.1 | | | | 3.9 | | | | 13.3 | | | | 14.6 | |
| | | | | | | | | | | | | | | | | | | | | | | | | | | | | | | | | | | | | | | | |
Total | | | 13.6 | | | | 17.1 | | | | 72.0 | | | | 80.4 | | | | 32.5 | | | | 37.4 | | | | 18.3 | | | | 19.4 | | | | 136.4 | | | | 154.3 | |
| | | | | | | | | | | | | | | | | | | | | | | | | | | | | | | | | | | | | | | | |
| (1) | Excluding derivatives with an EaD of EUR 15.1 billion. |
During 2013, there was further deterioration in the portfolio’s ratings breakdown. Only one third of the portfolio held top ratings as defined by FMS-WM’s internal risk classification system (AAA, –AA or –A by S&P). Key reasons for the year-on-year decline in the volume of exposures with top ratings are as follows:
| | • | | Public Sector: sales of and exchange rate effects on Japanese government bonds, repayment of loans and advances to the EFSF assumed in the course of restructuring the Greek position, and larger principal repayments from German states and regional state banks. |
| | • | | Structured Products: numerous rating downgrades, mainly of U.S. municipal or state borrowers, principal repayments, sales and exchange rate effects relating to liabilities, which are largely denominated in U.S. dollars. |
| | • | | Infrastructure: rating downgrades of two major UK utility companies. |
-36-
Breakdown of Credit Portfolio by Countries and Regions(1)
| | | | | | | | | | | | | | | | | | | | | | | | | | | | | | | | | | | | | | | | |
| | | Real Estate
(incl. Workout) | | | Public Sector | | | Structured
Products | | | Infrastructure | | | Total | |
| | | December 31, | |
| | | 2013 | | | 2012 | | | 2013 | | | 2012 | | | 2013 | | | 2012 | | | 2013 | | | 2012 | | | 2013 | | | 2012 | |
| | | (unaudited) | |
| | | (EaD in € billions) | |
Country(2) | | | | | | | | | | | | | | | | | | | | | | | | | | | | | | | | | | | | | | | | |
PIIGS | | | 1.2 | | | | 1.3 | | | | 38.6 | | | | 40.5 | | | | 4.1 | | | | 4.7 | | | | 1.0 | | | | 1.1 | | | | 44.9 | | | | 47.6 | |
Of which Italy | | | 0.3 | | | | 0.3 | | | | 28.6 | | | | 29.6 | | | | 1.6 | | | | 1.7 | | | | 0.5 | | | | 0.5 | | | | 31.0 | | | | 32.1 | |
Of which Spain | | | 0.8 | | | | 0.9 | | | | 5.7 | | | | 6.5 | | | | 1.9 | | | | 2.3 | | | | 0.3 | | | | 0.3 | | | | 8.7 | | | | 10.1 | |
Of which Greece | | | 0.0 | | | | 0.0 | | | | 1.6 | | | | 1.7 | | | | 0.0 | | | | 0.0 | | | | 0.0 | | | | 0.1 | | | | 1.6 | | | | 1.8 | |
Of which Ireland | | | 0.0 | | | | 0.0 | | | | 0.7 | | | | 0.7 | | | | 0.5 | | | | 0.6 | | | | 0.1 | | | | 0.1 | | | | 1.3 | | | | 1.4 | |
Of which Portugal | | | 0.1 | | | | 0.1 | | | | 2.0 | | | | 2.0 | | | | 0.1 | | | | 0.1 | | | | 0.1 | | | | 0.1 | | | | 2.3 | | | | 2.3 | |
United Kingdom | | | 1.7 | | | | 1.8 | | | | 10.0 | | | | 10.2 | | | | 4.1 | | | | 4.6 | | | | 11.2 | | | | 10.7 | | | | 27.0 | | | | 27.3 | |
Germany | | | 6.0 | | | | 6.9 | | | | 4.4 | | | | 5.3 | | | | 1.6 | | | | 1.8 | | | | 0.1 | | | | 0.2 | | | | 12.1 | | | | 14.2 | |
Rest of Europe | | | 2.7 | | | | 3.8 | | | | 13.3 | | | | 15.2 | | | | 2.5 | | | | 2.8 | | | | 1.1 | | | | 1.2 | | | | 19.6 | | | | 23.0 | |
USA | | | 1.8 | | | | 2.7 | | | | 0.1 | | | | 0.1 | | | | 17.8 | | | | 20.7 | | | | 1.4 | | | | 1.8 | | | | 21.1 | | | | 25.3 | |
Japan | | | 0.2 | | | | 0.4 | | | | 3.5 | | | | 6.2 | | | | 0.0 | | | | 0.0 | | | | 0.0 | | | | 0.1 | | | | 3.7 | | | | 6.7 | |
Asia (excl. Japan) | | | 0.0 | | | | 0.1 | | | | 1.1 | | | | 1.5 | | | | 0.0 | | | | 0.0 | | | | 0.2 | | | | 0.3 | | | | 1.3 | | | | 1.9 | |
Rest of World | | | 0.0 | | | | 0.0 | | | | 1.0 | | | | 1.4 | | | | 2.4 | | | | 2.8 | | | | 3.3 | | | | 4.0 | | | | 6.7 | | | | 8.2 | |
| | | | | | | | | | | | | | | | | | | | | | | | | | | | | | | | | | | | | | | | |
Total | | | 13.6 | | | | 17.1 | | | | 72.0 | | | | 80.4 | | | | 32.5 | | | | 37.4 | | | | 18.3 | | | | 19.4 | | | | 136.4 | | | | 154.3 | |
| | | | | | | | | | | | | | | | | | | | | | | | | | | | | | | | | | | | | | | | |
| (1) | Excluding derivatives with an EaD of EUR 15.1 billion. |
| (2) | Allocation by country of the economic risk (e.g., location of the collateral), which, in individual cases, may be different from the legal domicile of the debtor/issuer. |
The breakdown of the credit portfolio by countries and regions as of December 31, 2013 reflected a high percentage of European borrowers (76%, a slight increase from 73% as of December 31, 2012). The increase in the European share of the aggregate portfolio is primarily due to the disproportionately low reduction of the exposure to Italian and UK borrowers (-3% and -1%, respectively) compared to the rest of the portfolio (-17%).
As of December 31, 2013, German real estate loans accounted for EUR 6.0 billion EaD and U.S. real estate loans for EUR 1.8 billion and thus the greater part of the exposures in the Real Estate segment (including Workout). The largest exposures in the “Rest of Europe” category comprised real estate loans in France (EUR 0.8 billion) and the Netherlands (EUR 0.6 billion).
As of December 31, 2013, the Public Sector segment had a financing portfolio with municipal, sovereign or other public-sector issuers as well as banks, with an EaD of EUR 72.0 billion. A sum amounting to EUR 38.6 billion EaD was attributable to the Euro Area Member States particularly affected by the European debt crisis, known as the PIIGS countries, of which nearly three fourths was attributable to Italy. Already substantially reduced through participation in the private sector involvement (PSI) exchange program in 2012, FMS-WM’s receivables in respect of Greece were further rolled back in 2013 by effecting selective sales. The largest exposures in the “Rest of Europe” region comprised government bonds and loans in Poland (EUR 2.2 billion), France (EUR 2.1 billion), the Netherlands (EUR 1.7 billion), Hungary (EUR 1.4 billion) and Austria (EUR 1.2 billion). Driven by sales and exchange rate effects, exposure to Japan in the corresponding segment decreased by EUR 2.7 billion (-44%) as of December 31, 2013, compared to December 31, 2012.
With an EaD of EUR 32.5 billion as of December 31, 2013, the Structured Products segment comprised all of FMS WM’s securitization transactions and other structured products. More than half of this amount, EUR 17.8 billion, was attributable to the United States, with EUR 8.5 billion comprising FFELP (Federal Family Education Loan Program) student loan securities and EUR 5.7 billion of securitized receivables with municipal borrowers. The segment’s EaD also included risk positions totaling EUR 4.1 billion in respect of the PIIGS countries (mostly Italy and Spain), EUR 4.1 billion with the United Kingdom, EUR 2.1 billion each in respect of Canada and the Netherlands, and EUR 1.6 billion in respect of Germany. The segment’s EaD was successfully reduced by a total of EUR 4.9 billion in fiscal year 2013, with a large share of this portfolio wind-up attributable to the United States. The wind-up was achieved mainly through principal repayments and exchange rate effects.
In the Infrastructure segment, over 60% of the EaD as of December 31, 2013 (EUR 11.2 billion out of a total of EUR 18.3 billion) was accounted for in the United Kingdom. Additional major infrastructure financing transactions related to Australia and Canada (EUR 1.5 billion each) and the United States (EUR 1.4 billion). Whereas the segment’s exposure outside the United Kingdom declined by 18% year-on-year, primarily due to unscheduled repayments and currency effects, the exposure to UK infrastructure financing grew 5% during the same period despite countervailing exchange rate effects. This increase is due to the transfer into FMS-WM’s portfolio of inflation-indexed securities formerly held as financial guarantees vis-à-vis the HRE Group.
-37-
Breakdown of Credit Portfolio by Remaining Maturities(1)
| | | | | | | | | | | | | | | | | | | | | | | | | | | | | | | | | | | | | | | | |
| | | Real Estate
(incl. Workout) | | | Public Sector | | | Structured
Products | | | Infrastructure | | | Total | |
| | | December 31, | |
| | | 2013 | | | 2012 | | | 2013 | | | 2012 | | | 2013 | | | 2012 | | | 2013 | | | 2012 | | | 2013 | | | 2012 | |
| | | (unaudited) | |
| | | (EaD in € billions) | |
Due | | | 3.2 | | | | 3.1 | | | | 0.0 | | | | 0.0 | | | | 0.0 | | | | 0.0 | | | | 0.0 | | | | 0.0 | | | | 3.2 | | | | 3.1 | |
Until 2015 | | | 7.5 | | | | 11.3 | | | | 6.2 | | | | 10.3 | | | | 0.5 | | | | 1.4 | | | | 1.5 | | | | 2.2 | | | | 15.7 | | | | 25.2 | |
2016 – 2020 | | | 2.3 | | | | 2.0 | | | | 15.0 | | | | 17.9 | | | | 4.7 | | | | 5.5 | | | | 1.1 | | | | 1.5 | | | | 23.1 | | | | 26.9 | |
2021 – 2030 | | | 0.4 | | | | 0.5 | | | | 12.7 | | | | 13.4 | | | | 8.0 | | | | 9.1 | | | | 2.6 | | | | 2.9 | | | | 23.7 | | | | 25.9 | |
2031 – 2040 | | | 0.0 | | | | 0.0 | | | | 26.7 | | | | 27.3 | | | | 8.9 | | | | 9.2 | | | | 3.2 | | | | 3.5 | | | | 38.8 | | | | 40.0 | |
> 2040 | | | 0.2 | | | | 0.2 | | | | 11.4 | | | | 11.5 | | | | 10.4 | | | | 12.2 | | | | 9.9 | | | | 9.3 | | | | 31.9 | | | | 33.2 | |
| | | | | | | | | | | | | | | | | | | | | | | | | | | | | | | | | | | | | | | | |
Total | | | 13.6 | | | | 17.1 | | | | 72.0 | | | | 80.4 | | | | 32.5 | | | | 37.4 | | | | 18.3 | | | | 19.4 | | | | 136.4 | | | | 154.3 | |
| | | | | | | | | | | | | | | | | | | | | | | | | | | | | | | | | | | | | | | | |
| (1) | Excluding derivatives with an EaD of EUR 15.1 billion. |
As of December 31, 2013, 55% of the remaining maturities (calendar year of the next term adjustment) of the receivables in the Real Estate portfolio (including Workout) mainly fell into the short-term category (until 2015). Another 24% of receivables mainly consist of called loans. Risk positions with an EaD of EUR 38.1 billion in the Public Sector portfolio have remaining maturities until at least until 2031. At EUR 19.3 billion, almost 60% of all exposures in the Structured Products segment have remaining maturities until at least 2031. In the Infrastructure segment, more than half of the EaD or exposures of EUR 9.9 billion had maturities beyond 2040 as of December 31, 2013.
Watchlist and Problem Assets
| | | | | | | | | | | | | | | | | | | | | | | | | | | | | | | | | | | | | | | | |
| | | Real Estate
(incl. Workout) | | | Public Sector | | | Structured
Products | | | Infrastructure | | | Total | |
| | | December 31, | |
| | | 2013 | | | 2012 | | | 2013 | | | 2012 | | | 2013 | | | 2012 | | | 2013 | | | 2012 | | | 2013 | | | 2012 | |
| | | (unaudited) | |
| | | (EaD in € billions) | |
Watchlist Assets | | | 0.8 | | | | 2.3 | | | | 0.1 | | | | 0.2 | | | | 0.7 | | | | 0.6 | | | | 0.6 | | | | 0.1 | | | | 2.2 | | | | 3.2 | |
Problem Assets | | | 7.1 | | | | 7.8 | | | | 2.8 | | | | 1.8 | | | | 1.0 | | | | 1.1 | | | | 4.2 | | | | 3.9 | | | | 15.1 | | | | 14.6 | |
Restructuring Assets | | | 6.2 | | | | 6.9 | | | | 2.8 | | | | 1.8 | | | | 1.0 | | | | 1.1 | | | | 4.2 | | | | 3.9 | | | | 14.2 | | | | 13.7 | |
Workout Assets | | | 0.9 | | | | 0.9 | | | | 0.0 | | | | 0.0 | | | | 0.0 | | | | 0.0 | | | | 0.0 | | | | 0.0 | | | | 0.9 | | | | 0.9 | |
| | | | | | | | | | | | | | | | | | | | | | | | | | | | | | | | | | | | | | | | |
Total | | | 7.9 | | | | 10.1 | | | | 2.9 | | | | 2.0 | | | | 1.7 | | | | 1.7 | | | | 4.8 | | | | 4.0 | | | | 17.3 | | | | 17.8 | |
| | | | | | | | | | | | | | | | | | | | | | | | | | | | | | | | | | | | | | | | |
Risk positions are classified as “Watchlist Assets” if the payment is delayed for more than 60 days or if another fixed criterion triggers intensified monitoring of the given risk position.
The “Restructuring Assets” category contains exposures for which specific loan loss provisions were recognized as well as exposures that have defaulted according to the Basel II criteria (e.g., payment past due > 90 days).
“Workout Assets” comprise risk positions where a restructuring seems unfeasible, where legal action has been initiated and where a valuation allowance has been recognized.
“Restructuring” and “Workout Assets” are combined in the “Problem Assets” category.
The early warning system is designed to identify and closely monitor borrowers of FMS-WM whose credit or collateral quality might deteriorate. Non-performing risk positions where the arrears exceed 90 days are assigned to the non-performing loan management (i.e., Restructuring, Workout). This involves testing for impairment at regular intervals and upon occurrence of certain predefined events (“trigger events”) to determine the need for write-downs. If this is the case, a proposal for specific loan loss provisions is prepared for approval by the Risk Committee of FMS-WM.
-38-
The amount of the general loan loss provisions is determined by considering the PD and the LGD.
Major Challenges from Counterparty Default Risks
The transferred portfolio imposes major risks on FMS-WM which can lead to further recourse to the Federal Republic of Germany’s loss compensation obligations and therefore to additional burdens on Germany’s federal budget. The most important of these risks are as follows:
| | • | | Portfolio concentration: The EL of a credit portfolio only constitutes the expected value of the credit losses occurring within a specific forecast horizon as a result of the default risks to which the portfolio is exposed. However, actual portfolio losses can be considerably larger. The danger of significant deviations of the actual losses compared to the expected portfolio losses becomes greater as the portfolio gets more concentrated (existence of concentration risks). The portfolio exhibits strong concentrations especially in the Public Sector segment, among others with respect to the so-called PIIGS countries. Adverse effects on income that may substantially surpass the determined EL are conceivable if a widening of the European sovereign debt crisis leads to further defaults. |
| | • | | Long maturities: In nearly 70% of the risk positions, the stipulated contractual maturities of the loans and securities assumed exceed the end of the original planning horizon of 2020 – in one third of these cases, contractual maturities are not until after 2040. In many cases, these are inflation-indexed securities the redemption amounts of which could increase over time. |
| | • | | Restructuring risks: In many cases FMS-WM took over syndicated loans; occasionally, it would hold junior positions that make it difficult to control or influence the structure. This in turn may trigger restructuring risks. |
| | • | | Financing structures: The financial and economic crisis has fundamentally changed the credit and capital markets. A significant number of FMS-WM’s risk positions comprise exposures that were liquid at one time but have turned out to be illiquid since the crisis. To make matters worse, in some market segments overall positive earnings contributions for FMS-WM are hardly realistic anymore, even in view of the extremely favorable current funding options, since the credit margins agreed at the time of entry into the agreement no longer correspond to today’s expectations of default for the risk positions. |
The implementation of requirements under the HGB for recognition of “adequate risk provisions” is proving challenging in view of the aforementioned risks. As a rule, FMS-WM recognizes specific loan loss provisions only on exposures that are either already non-performing or where full repayment at maturity is no longer to be expected from today’s vantage point. The adequate amount of the specific loan loss provisions for risk positions where FMS-WM expects to liquidate the provided collateral is determined by discounting the expected proceeds from collateral disposal using a risk-free interest rate. While general loan loss provisions are recognized for potential default risks based on the EL for a one-year forecast horizon, country risk provisions are recognized as generalized specific loan loss provisions for selected countries to address transfer and conversion risks.
Market Risks
Definition
Any impairment of the value of the risk positions due to changed market conditions and market price factors gives rise to market risks. The following types of market risks are particularly relevant to FMS-WM:
| | • | | Interest rate risk: This risk concerns the change in the present value of risk positions due to changes in the respective market interest rates. |
| | • | | Foreign exchange (“FX”) risk: This risk results from a change in foreign exchange rates and indicates how the given change will affect the value in euros of an FX exposure. |
| | • | | Credit spread risk: This risk concerns the change in the present value in the event of changes in the underlying credit default swap or credit spread curve. |
| | • | | Other market risks primarily include: |
-39-
| | • | | Basis risk: Cross-currency basis risk may arise if transactions in foreign currencies are funded in a different currency. Differences in the reference interest rates of transactions subject to variable interest rates may give rise to interest rate basis risks. |
| | • | | Inflation risk: Inflation risks arise when interest or principal payments for some products in the portfolio are linked to changes in certain national or regional consumer price indices (inflation rates). |
According to the current risk profile, the key market risk factors for FMS-WM are interest rate risk and foreign exchange risk.
As in the past, FMS-WM is not exposed to equity and commodity risks. Market liquidity risk is not considered material as fire sales at unacceptable prices can be ruled out almost entirely: this is due to the funding opportunities available and the commitment made by SoFFin to provide FMS-WM with liquidity in a crisis situation.
Risk Strategy
FMS-WM’s market risk strategy serves to limit fluctuations in the value of the portfolio that arise from factors affecting market risks and their impact on parameters that are relevant to earnings. This concerns the risks arising in connection with the transferred portfolio as well as new market risks arising in connection with Treasury activities. The ratio of the expenditure required for hedging purposes to the realizable benefits must be commercially reasonable. The goal is to unwind existing risk positions and avoid new ones.
In the first half of 2013, FMS-WM’s market risk strategy was adjusted to support the profit-oriented wind-up strategy adopted by FMS-WM’s portfolio management units. If requested by portfolio management, hedging derivatives can be unwound at any point in time regardless of the sale of the risk position, in order to increase the flexibility of planned short- to medium-term restructuring and wind-up activities. In a way identical to that used for the rest of the portfolio, the market risks of the relevant exposures from approved wind-up strategies are identified, measured, limited strictly and separately, and reported daily as a separate item. The approved wind-up strategies are monitored by the responsible portfolio managers and regularly reported on (at least quarterly) to the Executive Board.
While the Treasury and Capital Markets Funding units operate on the principle that FMS-WM will not open positions solely for the purpose of making gains, the Treasury unit has discretion to act within predetermined limits. Responsibility for the operational management of open positions lies with the market departments of the two units: Risk Controlling is in charge of monitoring, and the ALCO is in charge of setting limits and establishing principles in connection with risk steering.
Risk Identification
Market risks exist because of the structure of the portfolio, particularly in the form of interest rate and FX risks. The risks arising from changes in credit spreads are monitored in current reporting, but due to the general intention to hold the positions until final maturity, they are not actively limited. Recognition of all third-party securities using the moderate lower-of-cost-or-market principle prevents an increase in credit spreads from having a direct impact on profit or loss as long as an impairment is not permanent and FMS-WM holds the given securities to maturity.
The portfolio servicer’s daily data deliveries as well as both the information available in the IT systems along with current market data serve as the basis for identifying the market risks.
Risk Analysis and Assessment
Interest rate risks are measured using sensitivity analyses, i.e., the effects of a shift in interest rate curves by a basis point, at the net present value of the portfolio. Separate analyses by maturity ranges enable FMS-WM to perform more extensive analyses of interest rate risks besides their sensitivity to a parallel shift, e.g., when the curve turns. In addition to the detailed analysis by maturity range, separate assessments by currency are performed to take into account that every currency has a different interest rate curve.
-40-
With the aim of reducing fluctuations in parameters relevant to income, FMS-WM’s on-balance sheet foreign currency position is determined, analyzed and controlled on a monthly basis. In addition, FX risks are analyzed based on sensitivities via a change in the net present value (“NPV”) in case of changes in exchange rates by 1% relative to the euro.
Credit spread risks are determined using a current spread view, i.e., cash flows are discounted based on the current credit spreads. The parameter used in this case is the change in the NPV relative to changes in the credit spread by one basis point.
Suitable monthly stress tests based on hypothetical but plausible and historic interest rate, foreign exchange and credit spread scenarios complement risk measurement and analysis based on sensitivities. These stress scenarios encompass the scenario specifications of Deutsche Bundesbank with respect to the interest rate, FX and credit spread risks that are internally rated as relevant. Other relevant scenarios entail interest rate risk scenarios based on Basel II. Apart from these scenarios arising from univariate changes in one type of market risk, FMS-WM also examines the extent of the change in the net present value if extreme historical or hypothetical market shifts were to occur for all types of market risk. Since mid-2013, the effect of stress tests has been calculated using predetermined measurement formulas, instead of being approximated by changing risk factors.
Risk Steering
The Treasury unit opens risk positions only to a limited extent and subject to the existing limits for purposes of risk steering. This is particularly necessary for short-term liquidity management, which can expose FMS-WM to short-term interest rate risks. In addition, the management of interest rate and foreign exchange risks may give rise to a limited amount of open risk positions subject to the existing limits. For reasons of efficiency, risk positions are not effectively hedged unless they reach certain transaction volumes in order to avoid price surcharges in the case of smaller transaction volumes or short-term market distortions. In steering market risks, appropriate write-downs are recognized for risk positions.
The credit portfolio management units and the Treasury unit may only utilize approved financial instruments for hedging the risk positions.
Interest rate risks are managed using a limit system for interest rate sensitivities per primary currency and maturity range, including an escalation process for limit breaches. For interest rate risks from risk positions for which hedging derivatives were unwound pursuant to a wind-up strategy at a point in time regardless of whether the risk position has been sold, separate limits are determined on submission of the wind-up strategy for the relevant portfolio. Risk Controlling monitors these strict limits within the approved range. Reviews of the wind-up strategies are conducted at least quarterly and include the management of interest rate risks. The Treasury unit is tasked with the management of interest rate risks in accordance with the stipulations from the wind-up strategies.
The approach to managing the foreign-currency position is based on managing the on-balance sheet FX position calculated monthly such that the effects of fluctuations from changes in FX rates on income are as low as possible. To this end, limits are defined per primary currency along with an escalation process. The limits are monitored monthly based on the previous month’s on-balance sheet foreign-currency position as well as postings of FX transactions that are relevant to the balance sheet and have occurred in the interim. FX sensitivities are additionally calculated on a daily basis and monitored using a trigger system. Any breach of the triggers initiates a root cause analysis in order to ensure that any FX position relevant to the balance sheet can be hedged in a timely manner if necessary.
The risks from changes in credit spreads are not limited, since FMS-WM’s general task is to unwind the portfolio in a way that preserves its value. These risks are actively managed by Portfolio Management as part of portfolio wind-up.
Risk Monitoring and Reporting
Market risks may not exceed the sensitivity limits in the daily risk management process. Limits are monitored based on the daily market risk report that is prepared by the portfolio servicer and analyzed by FMS-WM’s Risk Controlling department. The report, which also includes the credit spread sensitivities, is made available to both the Executive Board and the Treasury unit on a daily basis. The defined review and escalation process applies whenever limits are exceeded. In case the approved limits for exposures from wind-up strategies are exceeded, the measures predefined for this event by the adopted strategies would be triggered.
Additionally, the ALCO report to the members of ALCO and the monthly wind-up report to both the Executive Board and the Supervisory Board discuss market risks in varying levels of detail.
-41-
Risk Position
The main factors affecting interest rate sensitivities are exposures in assets and liabilities with fixed interest rates where the interest rate risks are hedged largely through interest rate derivatives. As determined based on the method applied, the interest rate sensitivity as of December 31, 2013 was EUR -0.91 million (December 31, 2012: EUR 0.17 million). This means that the present value of the portfolio would decrease by EUR -0.91 million in case the interest rate curves of all currencies rise by one basis point simultaneously. Substantial interest rate sensitivity exposures concern the euro in the amount of EUR -0.60 million (2012: EUR 0.04 million), the U.S. dollar in the amount of EUR -0.24 million (2012: EUR 0.06 million) and the pound sterling in the amount of EUR -0.09 million (2012: EUR 0.08 million). The change in interest rate sensitivity is largely due to positions in the short-term maturity range; a further EUR -0.78 million is due to exposures from approved wind-up strategies.
On all trading days in fiscal year 2013, interest rate sensitivity lay within a bandwidth of between EUR -0.98 million and EUR 0.25 million. The interest rate sensitivity of exposures from agreed wind-up strategies ranged from EUR -0.86 million to EUR 0.00 million.
Given the stress scenarios defined for interest rate risks, a parallel increase in all interest rate curves by 200 basis points would have the greatest negative impact on the net present value in an amount of EUR 317 million as of December 31, 2013 (December 31, 2012: EUR 5 million in the case of a 200 basis point decline). As the year-on-year increase resulted from the change in interest rate sensitivity, it is primarily attributable to the exposures from short-term interest rate sensitivity and the risk positions from approved wind-up strategies.
FX risks are managed based on the balance sheet position and the derivative hedging positions subject to compliance with fixed limits. The open FX position as of December 31, 2013 amounted to EUR 11.9 million in aggregate for all currencies. The FX position shown in the balance sheet is closed to an extent that enables compliance with the approved limits. Stress scenarios are calculated comparable to the FX sensitivities that are determined on a daily basis. Given the defined FX stress scenarios, an increase by 15% in the value of the euro against all other currencies would have the greatest negative impact amounting to EUR 98 million (December 31, 2012: EUR -136 million) on the net present value.
Since interest rate exposure in the wind-up portfolio is largely closed except for a few individual exposures from approved wind-up strategies, any future changes in interest rate curves will only minimally influence the present value of FMS-WM’s portfolio.
Liquidity Risks
Definitions
FMS-WM distinguishes between tactical and strategic liquidity risks:
| | • | | Tactical liquidity risk concerns the risk of not being able to generate sufficient cash on short notice such that present or future payment obligations may not be fulfilled at all or not in full when due under the contract. |
| | • | | Strategic liquidity risk is the risk of only being able to implement the necessary measures described in the funding strategy in the market at greater expense. For instance, an unexpected rise in funding costs might result from general market distortions or idiosyncratic events. |
Risk Strategy
The tactical liquidity risk strategy aims to ensure at all times – even in stress scenarios – that FMS-WM would be solvent without having to seek recourse from the SoFFin. To that end, FMS-WM maintains a sufficient liquidity reserve (securities eligible for ECB funding purposes to hedge against unexpected cash outflows) and diversifies its funding (in respect of lenders as well as the maturities and the instruments used). Both the funding strategy and the funding plan, which is revised annually as part of the winding-up plan, serve to ensure its strategic liquidity.
-42-
Risk Identification
To identify the tactical liquidity risk, the liquidity maturity profile is:
| | • | | analyzed for each maturity range based on different scenarios and then compared to the liquidity cushion, and |
| | • | | analyzed by product group and compared to the internal control limits imposed by Treasury. |
Strategic liquidity risks are identified by means of an analysis of the expected funding costs based on the long-term funding structure and the expected cash outflows in accordance with the assumptions under both the winding-up plan and the funding plan.
Risk Analysis and Assessment
Analyzing the tactical liquidity risk requires determining the liquidity position by means of the maturity profile of all assets and liabilities (gap profile), which is based on the 24-month forecast for three components:
| | • | | Contractual cash inflows and outflows including nostro accounts; |
| | • | | Assumptions with respect to: |
| | • | | Extensions of available assets; |
| | • | | Drawdowns from credit lines granted; |
| | • | | Availability of the funding instruments; |
| | • | | Liquidity effect of market scenarios (including interest rate, FX and credit spread scenarios); and |
| | • | | Liquidity reserve encompassing liquid, free securities eligible for ECB funding purposes. |
In terms of assumptions, FMS-WM uses two scenarios with a methodology that reflects the special situation of FMS-WM. Both scenarios include the normal case as the basic assumption and a global financial market crisis as the stress scenario.
The assumptions for the stress scenario were amended in January 2013:
| | • | | Extension of 75% of all commercial real estate loans where term adjustments are due; |
| | • | | Drawdown of all credit lines granted; |
| | • | | Strong aversion to risk on investors’ part, resulting in flight to quality investments with demand for very well-secured instruments of issuers with good ratings; |
| | • | | Assumption of extension rates based on the normal case, taking into account a haircut of 50% for bilateral repos (with securities not eligible for ECB funding purposes), institutional deposits ECP and US ABCPs; and |
| | • | | Market scenarios that would worsen the current liquidity position for a period of 90 days with a confidence level of 95% based on a historical simulation of the market parameters since 2003. |
Monthly back-testing of the projected liquidity position compared with the actual liquidity position enables regular reviews of the adequacy of the assumptions in the scenarios. This review resulted in the extension assumptions on the funding side being updated in January 2013.
Strategic liquidity risk is determined by analyzing the deviation of the actual funding volume from the funding plan, the deviation of the funding costs from the funding plan as well as funding concentrations. Building on this, a quarterly analysis of the effects of an increase in FMS-WM’s own funding cost rate on net interest income is analyzed on a quarterly basis.
-43-
Risk Steering
Tactical liquidity is managed by the Treasury unit, which is responsible for ensuring availability of short-term liquidity at any time. Secured and unsecured money market instruments are available to this end based on an approved product catalogue.
Strategic liquidity is ensured by the Capital Markets Funding unit. The unit prepares the long-term funding strategy and the funding plan derived from such strategy. The plan is implemented by issuing long-term funding instruments on capital markets.
For the purpose of limiting liquidity risk, the scenario that would significantly affect FMS-WM, given its funding structure, was selected out of the defined stress scenarios. The global financial market crisis scenario and a minimum survival period of 90 days were fixed as the limit based on the experience of recent years. Within this period, the liquidity position must be positive even under the premises of the defined scenario such that FMS-WM remains solvent at all times by realizing its liquidity reserve.
The liquidity contingency plan fixes the actions that must be taken in the event of a liquidity shortfall.
Risk Monitoring and Reporting
FMS-WM’s liquidity profile is monitored daily and reported to both the Executive Board and the Treasury unit. The Risk Controlling department monitors compliance with the limit on a daily basis. The following escalation process is carried out in case of limit breaches:
| | • | | First: Treasury verifies the limit breach and gives its view of the expected duration of the breach and the actions required to cure it. |
| | • | | Second: Risk Controlling comments on these measures and monitors their implementation. |
| | • | | Third: The Executive Board is notified immediately of the limit breach. |
As long as the limit breach has not been cured, the Executive Board and the Treasury unit are kept abreast daily of the degree to which agreed-upon steps have been implemented. The ALCO is also informed of the limit breach as part of the regular reporting. In addition, the liquidity position is reported monthly to the Executive Board and the Supervisory Board as part of the wind-up report.
Risk Position
In 2013, FMS-WM’s funding strategy was validated in the money and capital markets by a further expansion of its investor base.
FMS-WM’s issuing activity under the existing money market programs, ECP/CD and US ABCP through its U.S. vehicle, Kells Funding LLC, Delaware, USA, further contributed to a stable and sustainable funding structure for FMS-WM in 2013. The average remaining maturity of money market instruments was kept constant at around 3 months.
FMS-WM has been a regular and reliable issuer on international capital markets since 2012. As a result, capital market issues in an amount equivalent to EUR 11.0 billion were placed by FMS-WM in 2013. This includes the equivalent of EUR 4.2 billion from strategic USD bond issues.
As of December 31, 2013, FMS-WM’s positive liquidity cushion is EUR 17.0 billion based on the assumptions of the stress scenario, global financial market crisis, and pursuant to the defined minimum survival period of 90 days (December 31, 2012: EUR 8.9 billion).
Operational Risks
Definitions
FMS-WM distinguishes three kinds of operational risks: (i) outsourcing risk, (ii) project risk and (iii) other operational risks.
-44-
| | • | | Outsourcing risk: Refers to potential losses from the outsourcing of services to third parties. Aside from the default of the service providers, this also includes the risk that services contracted for are not provided at all or not in the stipulated quality or within the stipulated time. |
| | • | | Project risk: Refers to the risk that FMS-WM cannot adequately fulfill key functions owing to unsuccessful or late implementation of the goals set out in its major strategic projects. |
| | • | | Other operational risks: This includes all risks of loss arising from the inadequacy or failure of internal processes, people or systems, or due to external events (e.g., defective data quality, process errors, fraud). This definition includes legal risks according to Basel II (particularly risks relating to the laws of obligations or property). |
Risk Strategy
The strategy for operational risk management, which also includes the operational risks at FMS-WM Service, is aimed at avoiding and reducing them through early detection, recording, analysis and monitoring. A timely and meaningful reporting to the management about events and actions concerning operational risks to the management as part of the wind-up report is in place. The aim is to ensure that sufficient data and analyses are available for minimizing existing operational risks in targeted fashion.
Risk Identification
FMS-WM has established a separate unit for managing and monitoring outsourcing given the substantial significance of the outsourcing risk. The relevant departments / units participate in identifying risks concerning the outsourced activities and processes.
The risks arising from major strategic projects, namely the transfer of servicing from the HRE Group to FMS-WM Service and the spin-off and transfer of IT systems from the HRE Group to IBM Deutschland GmbH, were managed successfully with the help of the Target Operating Model (“TOM”) program and a separate project risk office for the monitoring and early identification of project risks.
One major strategic project planned for 2014 is the optimization and privatization of FMS-WM Service, risks of which are currently managed by a separate project group, as was the case with strategic projects in 2013. As in 2013, potential risks are identified with respect to the aims of a given project in a three-stage process that comprises risk reporting, risk categorization and risk recording in a project risk database.
Other operational risks, identified in the annual operational risk self-assessment, and risk events at FMS-WM and FMS-WM Service are recorded in a group-wide, computerized system for recording and managing operational risks (“OpRisk system”). In addition, FMS-WM Service also collects data for developing risk-relevant early warning indicators, in order to identify potential risks within FMS-WM Service at an early stage.
The methodology and relevant historical data concerning other identified operational risks were transferred to FMS-WM Service upon termination of the relationship with PBB.
Risk Analysis and Assessment
The Sourcing department analyzes and assesses outsourcing risk as part of the risk analyses in workshops in conjunction with the affected departments / units and the Audit and Risk Controlling departments. In this context, the first step is to classify the outsourced activities according to materiality using a structured questionnaire with risk assessments. In the case of material outsourced activities, further risk analyses and assessments are conducted for the transition and for subsequent regular operations analogously to the operational risk self-assessment. These risk analyses are updated as necessary but at least once a year. Once material risks are identified, Sourcing requests immediate documentation of the risk by the department in the OpRisk system. Other risks are recorded in the course of the annual operational risk self-assessment.
Operational risks identified and assessed by the service provider itself are also regularly logged into the OpRisk system used throughout FMS-WM.
-45-
For each individual project risk identified in the major strategic projects of 2013, qualitative estimates were made of the risk’s probability of occurrence and its potential impact, using pre-defined five-stage scales. Combining the two parameters yielded an overall assessment that entails classifying each individual project risk into a risk matrix. This matrix defined which combinations are classified as low, high or critical. The risk assessment was the responsibility of the project risk office in conjunction with the program and project managers. Any remaining risks not ruled out were assigned for follow-up to FMS-WM and FMS-WM Service in line with their respective responsibilities.
Other operational risks at FMS-WM and at FMS-WM Service are analyzed and assessed as follows:
| | • | | ex post, via the recording of relevant loss events in a group-wide loss database within the OpRisk system; and |
| | • | | ex ante, during the standardized operational risk self-assessment conducted each year, by estimating the probability of occurrence and potential losses in a group-wide OpRisk system; and |
| | • | | by identifying early warning indicators. |
Risk Steering
Outsourcing risk is steered by agreeing qualitative performance indicators and by requesting regular assessment of the end products from the recipients of these deliverables.
The quality of the services rendered is evaluated on the basis of assessment criteria such as timeliness, formal accuracy, substantive completeness, substantive quality, degree to which the tasks and agreements have been implemented as well as internal or external audit comments. Service management software is used to document the assessments. The quality of performance is ensured through regular communication with the service providers and measures that are coordinated with them and followed up by FMS-WM. Inadequate services among other problems are discussed in this regard, and both parties work to bring about improvements. Escalation processes that start with the responsible staff member and end with the Executive Board have been defined for performance of the measures.
To manage material project risks for major strategic projects in the TOM program in 2013, the strategy adopted until September 30, 2013 was for suitable measures and “Plan B” scenarios to be adopted by program management and the project risk office, and, in the event of appropriately high criticality of the risks, by the program’s steering committee. The timely completion of the measures was tracked and reported jointly to the Executive Board by TOM program management and the project risk office. After the hand-over by the project risk office, management of the remaining risks from the two major projects has been handled by the responsible departments at FMS-WM and FMS-WM Service since October 1, 2013. Project risks associated with the planned privatization of FMS-WM Service are monitored and managed by the project group using the same method.
For other potential operational risks classified as critical in the operational risk self-assessment, action plans and measures must be agreed and implemented that serve to reduce the loss amount or the probability of occurrence. The measures are documented in the group-wide OpRisk system. These risks are managed by FMS-WM Service or by the relevant department of FMS-WM in accordance with assigned responsibilities. Potential steps serving to improve the at-risk situation include introducing the dual-control principle, personnel measures, IT precautions, operational rules and regulations, process documentation or the purchase of insurance policies. A contingency plan has been defined for all processes critical to operations with the aim of hedging operational risks within FMS-WM. The new-product process serves to lower risks arising in connection with operating new products or restructurings.
FMS-WM uses clearly defined governance structures and processes to manage legal risks. FMS-WM’s close cooperation with PBB and FMS-WM Service and supervisory bodies / regulators makes it possible to identify potential future risks early on and avoid them before they arise. External specialists are used as necessary in connection with legal matters. Prior to the portfolio transfer, the HRE Group disclosed legal risks which are rooted in the portfolio transferred to FMS-WM without prior due diligence. PBB was responsible until September 30, 2013 for identifying and managing the legal risks in connection with portfolio management and was required to minimize and preclude all impending legal risks to the greatest extent possible. This also applied in particular to litigation risks arising from the litigation taken over. The Legal department in the Legal & Compliance unit managed and reviewed the work of the portfolio servicer and monitored legal risks, which could arise for FMS-WM in its dealings with third parties. As of October 1, 2013, FMS-WM assumed the responsibilities of the former portfolio servicer for monitoring the legal risks of FMS-WM Service.
-46-
In particular, FMS-WM counteracts the risk of internal and external fraud based on an ICS and an internal audit unit, and by increasing employees’ risk consciousness and the need for vigilance.
Risk Monitoring and Reporting
Monitoring outsourcing risk is the responsibility of the Sourcing department together with the Risk Controlling department. The performance of outsourcing partners is reported on in a monthly wind-up report, and in a detailed service provider management report provided to FMS-WM and project management.
Until September 30, 2013, the project risk office consolidated the recorded project risks from the TOM program along with the agreed measures in a database and used this to prepare a project risk report. This report contained a detailed overview of all project risks classified as material, their possible causes and potential effects, the assessment of the risks pursuant to the risk matrix as well as recommended steps to manage them and the status thereof. The report was made available regularly to the Executive Board, program management, FMSA and the Supervisory Board. The duties of the project risk office with regard to the new strategic project of optimizing and privatizing FMS-WM Service have been assumed by the internal project management office.
Other operational risks that concern the services are monitored directly by FMS-WM Service. Losses incurred by the service entity or by FMS-WM are reported to the Executive Board and the Supervisory Board in the monthly wind-up report. The results of FMS-WM Service’s operational risk self-assessments are reported to the Executive Board and the Supervisory Board in an annual operational risk report, which also covers the loss events that occurred and the key risk indicators for FMS-WM Service.
FMS-WM Service publishes a quarterly report on certain relevant key risk indicators determined in cooperation with FMS-WM’s Risk Controlling department; this report addresses potential operational risks at FMS-WM Service and is presented annually to the Executive Board. Since October 2013, this report has also contained key risk indicators for service providers.
The reports described above provide the Executive Board with comprehensive reporting on operational risks, both at FMS-WM Service and at FMS-WM.
In fiscal year 2013, several improvement measures were implemented. Examples include the expansion of risk reporting and the completion of employee training, as well as the enhancement of the OpRisk system and its implementation at FMS-WM Service.
Risk Position
In fiscal year 2013, material operational risks related to the transfer of servicing activities from the HRE Group to the newly formed FMS-WM Service were eliminated as of September 30, 2013. Achievements in this context included the timely hiring of an appropriate number of well-qualified staff, the comprehensive hand-over of all documentation, and the training of the service entity’s employees by the HRE Group via the TOM project group specially formed for this purpose. The major operational risk mentioned last year, which arose from the ambitious timeframe set for separating the IT systems to ensure properly functional servicing, was also successfully mitigated through close monitoring of the project status by the project risk office.
The transfer of the majority of servicing activities to FMS-WM Service, a wholly-owned subsidiary of FMS-WM, substantially improved the options for managing the risk position.
FMS-WM also incurred a new material dependence, however, as a result of the separation of the IT systems from the HRE Group achieved by outsourcing IT services to IBM Deutschland GmbH. With respect to the provision of data and portfolio-related information, FMS-WM has options for both direct and indirect access to the IT systems.
FMS-WM made further progress in 2013 in setting up documented structures and processes that lower the risk of occurrence of other operational risks. Since processes and procedures were handed over from the HRE Group to FMS-WM Service largely unchanged, the material services for portfolio management provided by FMS-WM Service continue to be subject to risks, in particular other operational risks. These arise from the heterogeneity of the IT platforms running the wind-up and monitoring systems, as well as the numerous manual processes for recording transactions and conducting data quality assurance. In addition, there is still significant reliance on the expertise possessed by the key personnel who were transferred from the HRE Group to FMS-WM Service as part of the transfer of operations to ensure continuing progress on the one hand and handle day-to-day business operations on the other.
-47-
In 2013, financial losses of around EUR 23 thousand from operational risks were reported (2012: EUR 1 thousand).
Furthermore, FMS-WM is also subject to substantial risks from the legal complexity of the transferred portfolio.
Other Risks
In addition to the credit risk, market risk, liquidity risk and operational risk described above, the following risk types are also material to FMS-WM.
Strategic Risk
Given the business model of FMS-WM, the risk of management’s disadvantageous corporate decisions or lack of reaction from management to changes in FMS-WM’s business environment are particularly relevant to decisions on wind-up strategies and/or other strategic decisions. Detailed and diligent analyses of all advantages and disadvantages of the available options serve to minimize the risk of making wrong decisions.
Reputational Risk
Given the public’s interest in FMS-WM, the reputational risk has a material and direct impact on the market presence of FMS-WM as well as on assessments by potential funding and hedging partners of FMS-WM. Reputational risks are managed via coordinated and proactive external communication and the public relations work of the communications unit.
Tax Risk
Tax risk arises from potential changes in tax legislation, potential changes in tax jurisdiction, possible errors in the application of tax laws or inadequate deliveries of data. FMS-WM uses clearly defined processes to analyze and manage risks arising from tax laws. It turns to external advisers as necessary in connection with tax matters.
Equity Risk
Risks arising from the equity investments of FMS-WM are recorded, managed and monitored via the risk types contained in the given equity investments. The largest equity investments of FMS-WM include receivables or real estate and thus are recorded as part of the exposures related to the individual risk types described. The real estate properties are exposed to risks from changes in their value that are measured as described below.
Real Estate Risk
The Commercial Real Estate unit currently manages the real estate portfolio that encompasses nothing but rescue acquisitions (takeover of real estate collateral in property companies to limit losses in connection with the realization of collateral). This unit determines the properties’ market prices with the help of external experts and commissions repairs and maintenance measures to maximize the properties’ value. The associated risks are basically managed by selling such properties with the aim of unwinding the real estate portfolio in ways that maximize its value.
Assessment of the Overall Risk Exposure and Outlook
FMS-WM is mainly exposed to credit risks and operational risks, with operational risks including outsourcing and project risks constituting primary risks for FMS-WM in particular.
FMS-WM’s credit risks arise from the risk positions of the HRE Group transferred to FMS-WM in the past and as subsequently developed over time. With the exception of a few cases related to forced extensions, restructurings and rescue acquisitions subject to strict limits, FMS-WM may not engage in any new business that entails additional credit risks according to its charter.
In keeping with its wind-up strategy which seeks to generate a profit, FMS-WM intends to incrementally reduce the credit risks pursuant to the guidance in the wind-up plan.
-48-
The current portfolio of FMS-WM exhibits a high level of concentration risks, a significant proportion of which have very long maturities and have an effect on FMS-WM’s risk positions. The repayment of short-term risk positions could cause even greater concentrations over time. The greater the concentrations in the portfolio, the greater the danger that actual losses will differ significantly from the average losses expected at the overall portfolio level. Defaults in large positions in the portfolio could therefore put significant downward pressure on earnings.
In fiscal year 2013, active sales and early redemptions had the effect of reducing FMS-WM’s credit portfolio. The focus of the disposals was on the Public Sector segment; Greek and Japanese government bonds were sold in particular.
Regarding the other material risks and operational risks mentioned above, FMS-WM focused on preparing and carrying out the transfer of servicing responsibility from the HRE Group to a third party in accordance with the European Commission’s requirement that such services be assumed by a third party as from October 1, 2013. Servicing was transferred with effect from October 1, 2013 to FMS-WM Service, the service entity formed by FMS-WM in 2012.
To this end, all relevant IT systems were duplicated and all HRE Group processes and procedures were initially transferred with minimal changes, so as to limit project risk.
All relevant goals in this regard have been attained, in particular the timely spin-off of servicing from the HRE Group as of September 30, 2013, the resulting fulfilment of the EU requirement and the securing of operational stability in the initial months following the portfolio servicer changeover.
In 2014, FMS-WM will continue to pursue a profitable wind-up of the assets transferred to FMS-WM from the HRE Group, further optimization of the relevant processes and the planned privatization of FMS-WM Service.
-49-
Internal Control / Risk Management System Relevant to the Financial Reporting Process (ICS/RMS)
The internal control and risk management system relevant to the financial reporting process (ICS / RMS) of FMS-WM serves to ensure compliance with financial reporting standards and requirements and the reliability of the accounting.
Accounting (Finance department) is assigned to the Risk & Finance division and managed by the Head of Risk Controlling, Finance & Portfolio Steering.
Responsibility for the general accounting-related ICS rests with the central ICS body led by the Head of Operations Management (Financial Process Support department); this body is also assigned to the Risk & Finance division. Until September 30, 2013, FMS-WM had outsourced material aspects of its accounting to the HRE Group, the portfolio servicer. For this purpose, the portfolio servicer and FMS-WM had entered into a cooperation agreement on September 30, 2010. Service level agreements concerning the accounting services to be rendered were prepared to that end. The most important services relating to accounting outsourced to the portfolio servicer were as follows:
| | • | | Keeping the general and subsidiary ledgers, maintaining the ledger master data, current bookkeeping as well as payment transactions; |
| | • | | Preparations for the periodic closing of the books and delivery of all data relevant to bookkeeping and accounting required for preparing the financial statements (annual, monthly and quarterly reporting); and |
| | • | | Preparing reports under regulatory and supervisory requirements. |
In addition to services directly related to accounting, IT services were also outsourced to the portfolio servicer; these are also relevant to the accounting-related ICS. In this context, the HRE Group used further servicers in order to fulfill key aspects of these tasks.
FMS-WM and the portfolio servicer jointly established an ICS and an RMS in respect of the financial reporting process that is appropriate for FMS-WM’s business activities. The design and performance of selected controls at the portfolio servicer were audited by the portfolio servicer’s financial statement auditor in an audit pursuant to IDW PS951 and additionally monitored by FMS-WM’s units as part of operational service provider management.
Since October 1, 2013, the outsourced services described above have been provided by FMS-WM Service (primary focus: subledger maintenance and payment transactions), an external financial services provider (primary focus: general ledger maintenance activities, ongoing financial accounting and preparation of the annual financial statements), and another service provider (primary focus: preparation of regulatory notices).
IT services have also been outsourced to IBM Deutschland.
FMS-WM manages and monitors outsourced activities related more specifically to accounting by applying the criteria defined in the service level agreements; this is performed in particular by FMS-WM employees in the Finance department.
In addition, the Financial Process Support department conducts activities to ensure the quality of processes relevant to financial reporting. In addition, an interdepartmental New Product Process (NPP) managed by the Risk Controlling department aims to guarantee the correct representation of products not yet available at FMS-WM.
IT services are monitored by the Solution Definition department.
In addition to its responsibilities for monitoring and managing outsourced services, FMS-WM is also the ultimate authority for the following methods and decisions related to the financial reporting process:
| | • | | Making decisions on recognition, measurement and disclosure options; and |
| | • | | Providing incoming invoices and posting instructions, e.g., for posting valuations, provisions and deferred taxes. |
-50-
In the first six months of 2013, FMS-WM implemented a comprehensive, integrated, financial reporting-related ICS system that has been applicable throughout the organization since October 1, 2013. The structure of the ICS and proper performance of the controls were confirmed and monitored in an ICS control attestation by the relevant unit heads at FMS-WM, FMS-WM Service and its managing directors, and the external financial service provider.
In fiscal year 2013, the ICS was approved with regard to some aspects of the outsourcing of IT services by a report prepared pursuant to ISAE 3402. Furthermore, FMS-WM has performed additional IT controls relating to IT services to the extent needed. Further expansion and improvement of the IT service provider’s IT-based ICS is being pursued in fiscal year 2014.
The basic task of FMS-WM’s ICS is to fulfil the following important principles:
| | • | | Safeguarding the effectiveness and efficiency of operations; |
| | • | | Propriety and reliability of internal and external accounting; and |
| | • | | Compliance with legal requirements with relevance for the entity. |
Based on the target levels of customary market standards (COSO framework), the principal objectives for the ICS at FMS-WM were specified as follows:
| | • | | Increase transparency and reliability of management-related information for effective and efficient management; |
| | • | | Protect the business assets by reducing the potential for fraud; |
| | • | | Increase process reliability and/or reduce the likelihood of errors in the processes; |
| | • | | Create the means to be able to point out opportunities and undesirable developments more quickly; and |
| | • | | Ensure compliance with internal and external regulations. |
The planning and design of operational control procedures for the ICS takes into account FMS-WM’s internal business policy objectives and principles. To this end, individual control objectives that are derived from the overall objectives are defined for the planned control procedures. These accounting-related control objectives relate to the statements and disclosures in the annual financial statements as to completeness, recognition, accuracy, measurement, rights and obligations, presentation and compliance with the accrual basis of accounting.
The ICS framework at FMS-WM governs the specifics of the principles of the ICS for FMS-WM and its service providers.
In preparation for the transfer of servicing to FMS-WM Service and the external financial services provider, focused surveys were conducted in the relevant departments to systematically determine the risks related to financial reporting. Subsequently, these insights were correlated with existing controls and consolidated within a central ICS control database. During the integration of the risks and controls into organization-wide performance processes, additional control requirements were identified and implemented accordingly by the departments.
The relevant unit head is responsible for collecting information about risks, identifying the controls required and monitoring performance of the controls (control attestation). The identified control owner is responsible for defining and performing the relevant ICS controls.
The central ICS unit handles the centralized management of the ICS control database, the coordination of the standard ICS procedure, and the consolidation of the relevant risk assessments and ICS control confirmation in a high-level ICS report.
-51-
Overall responsibility for FMS-WM’s ICS lies with its Executive Board.
Process-independent audits are also utilized by Internal Auditing to assess the effectiveness and suitability of the FMS-WM ICS.
To ensure the effectiveness of FMS-WM’s ICS, the standards and conventions applied are regularly reviewed and continuously updated. FMS-WM also takes steps to ensure that the system is integrated sustainably into its units and at service providers.
-52-
Management and Employees
Supervisory Board
FMSA appointed the first Supervisory Board (Verwaltungsrat) concurrently with the creation of FMS-WM in July 2010. No particular professional qualifications are required apart from experience and expertise in economics and finance. Persons who have been convicted or are being prosecuted for a felony or property offense are precluded from serving, as are those who have been involved in insolvency proceedings or have otherwise declared bankruptcy. Since January 6, 2014, the Supervisory Board has been comprised of six members. Members of the Supervisory Board are generally appointed for three-year terms. Reappointments are permitted. As of July 9, 2013, Dr. Karl Kauermann (former chairman) and Dr. Eckart John von Freyend retired as members of the Supervisory Board, and Dr. Christopher Pleister took over the role of chairman and Prof. Dr. Harald Wiedmann the role of deputy chairman. With effect from January 6, 2014, FMSA appointed Jan Bettink and Klemens Breuer to the Supervisory Board. As of January 27, 2014, Jan Bettink replaced Dr. Christopher Pleister as the new chairman of the Supervisory Board, and Klemens Breuer assumed the role of deputy chairman of the Supervisory Board in conjunction with Prof. Dr. Harald Wiedmann until the latter stepped down from this role on May 31, 2014. With effect from June 17, 2014, FMSA appointed Dr. Axel Berger to the Supervisory Board. The following table sets forth the names and functions of the current members of FMS-WM’s Supervisory Board, the date of their appointment and their principal occupations outside of FMS-WM as of August 13, 2014.
| | | | |
Name | | Date of appointment | | Principal occupation |
Jan Bettink (Chairman since January 27, 2014) | | January 6, 2014 | | Chief Executive Officer of Berlin Hyp AG and President of the Association of German Pfandbrief Banks |
Klemens Breuer (Deputy Chairman since January 27, 2014) | | January 6, 2014 | | Member of the Management Board of Raiffeisen Bank International AG, Global Markets |
Dr. Christopher Pleister (Chairman from July 11, 2013 to January 27, 2014) | | July 8, 2010 | | Chairman of the Steering Committee of the Federal Agency for Financial Market Stabilisation |
Rita Geyermann | | August 20, 2010 | | Director Loan Securitization, KfW Bankengruppe |
Dr. Andreas Ricker | | August 20, 2010 | | Head of Strategy at Bundesrepublik Deutschland Finanzagentur GmbH |
Dr. Axel Berger | | June 17, 2014 | | Diplom-Kaufmann |
Employees of FMSA regularly take part in Supervisory Board meetings in their role as non-voting representatives of the legal regulatory body (FMSA) and as statutory agents of the owner (SoFFin).
As a whole, the Supervisory Board is charged with the oversight and management of the Executive Board (Vorstand) in particular and FMS-WM as a whole, including functions outsourced to the portfolio servicer. It is also responsible for deciding on the winding-up plan, resolutions concerning deviations from the winding-up plan, the annual wind-up report, appointing and removing members of the Executive Board, enacting rules of procedure for the Executive Board, appointing the auditor and adopting the final accounts. The Supervisory Board provides ongoing advice to the Executive Board on matters of particular strategic significance, and it may reserve decision-making for itself on a case-by-case basis.
In addition to its collective decision-making process, the Supervisory Board has also constituted specialized committees from its members, notably the Supervisory Board Risk Committee and the Supervisory Board Audit Committee. The Supervisory Board Risk Committee is tasked with making particularly important lending decisions on a case-by-case basis for loan applications received and voted upon by the Executive Board. In general, the Supervisory Board Risk Committee considers all cases that are particularly relevant to risk (as determined by the risk management process described in “Risk Report—Organizational Structure of Risk Management”), have major effects on profit or loss, or possess major strategic significance.
The Supervisory Board Audit Committee is tasked with providing the necessary information for and conducting the review of the annual financial statement and audit.
Subordinate to the Supervisory Board is the Executive Board and the rest of the operational management of FMS-WM.
Executive Board
The Executive Board manages the business of FMS-WM and represents it in and out of court.
-53-
The members of FMS-WM’s Executive Board (Vorstand) are appointed by the Supervisory Board. FMS-WM’s Executive Board currently has three members who are appointed for renewable terms, with each term being limited to a maximum of four years. Members of the Executive Board may be removed by either the Supervisory Board or the FMSA for good cause, such as a violation of the felony and bankruptcy provisions in FMS-WM’s charter or for gross violation of their duties.
FMS-WM’s charter requires the Executive Board members to exercise prudent, diligent, and sound business judgment and makes them jointly and severally liable for any losses resulting from a breach of that duty. The Executive Board is charged with the business management and legal representation of FMS-WM. It may make legally binding decisions jointly, or it may give power of attorney to one or more persons who may act in concert with each other or, in the case of one person, with another Executive Board Member.
Members of the Executive Board
FMS-WM’s Executive Board currently has three members: Dr. Christian Bluhm, Ernst-Albrecht Brockhaus and Norbert Kickum. Short biographies of the current Executive Board members are set forth below:
Dr. Christian Bluhm
Dr. Christian Bluhm (former head of credit portfolio management at Credit Suisse in Zurich) was appointed effective July 8, 2010. Dr. Bluhm serves as Chief Risk Officer and Chief Financial Officer of FMS-WM and is responsible for credit risk management, risk controlling & portfolio steering, structured products, quantitative analytics, corporate assets and public finance, sovereign finance and communications. In April 2012, Dr. Bluhm was appointed as Spokesman of the Executive Board and the Management Board.
After graduating with a doctorate in mathematics and spending time on research projects in the United States and Germany, Dr. Christian Bluhm worked in risk management for Deutsche Bank before moving to the risk management practice group at McKinsey. In 2001, he joined HypoVereinsbank, where he was responsible for the analysis and assessment of structured credit products as the team leader in credit portfolio management. In 2004, he became head of credit portfolio management at Credit Suisse in Zurich, where he last worked as managing director.
Ernst-Albrecht Brockhaus
Ernst-Albrecht Brockhaus (former director of group treasury and investor relations at Bayerische Landesbank in Munich) was appointed effective September 1, 2010. Mr. Brockhaus is responsible for treasury, capital markets funding, credit markets and derivatives and market advisory.
After graduating in business administration from the University of Cologne, Ernst-Albrecht Brockhaus began his professional career in 1988 as a senior trader for interest derivatives at Trinkaus & Burkhardt. This was followed by positions at Sal. Oppenheim, Commerzbank and Deutsche Bank in asset/liability and product/risk management. In 2000, he joined Deutsche Verkehrsbank as director of the group treasury. From 2002 on, Mr. Brockhaus worked for Bayerische Landesbank, most recently as director of group treasury and investor relations. In this position, he was responsible for both planning and securing liquidity for Bayerische Landesbank’s group-wide treasury governance.
Norbert Kickum
Norbert Kickum (former senior advisor to KPMG AG Wirtschaftsprüfungsgesellschaft) was appointed effective March 1, 2012. He serves as Commercial Real Estate Officer of FMS-WM and is responsible for commercial real estate and global workout.
After graduating from the University of Münster with a degree in business administration, Norbert Kickum began his career in 1982 at Bayerische Hypotheken- und Wechselbank AG, first as a credit analyst and corporate customer relationship manager and later as a branch and area manager in and outside Germany. He moved to Siemens AG in 1997 and became co-responsible for the newly founded Siemens Financial Services GmbH as one of its managing directors. In 2002, he was appointed as CFO of Thomas Cook AG and, in 2005, as a member of the management board of Aareal Bank AG with responsibility for the bank’s international commercial real estate business. Norbert Kickum was instrumental in establishing and expanding the bank’s business in the three continents of Europe, North America and Asia. Before joining FMS-WM, Norbert Kickum was a senior advisor for KPMG AG Wirtschaftsprüfungsgesellschaft.
-54-
Executive Board Committees
The Executive Board has formed several specialized committees to carry out various operational and strategic roles. These include the Executive Board’s Risk Committee, the Portfolio Steering Committee, and the ALCO.
The Risk Committee is the corporate body that makes lending decisions in operational terms at the management level of FMS-WM. All members of the Executive Board, FMS-WM’s General Manager, FMS-WM’s Head of Corporate & Asset Finance, Sales Advisory and FMS-WM’s Head of Risk Controlling, Finance & Portfolio Steering (if absent, their deputies) have the right to vote subject to applicable substitution rules. The Executive Board’s Risk Committee makes loan decisions that must be made at the management level because they are relevant to FMS-WM’s exposure to risk. In May 2013, the former Real Estate Committee, which was tasked with taking individual decisions related to the management of the real estate portfolio subject to a predefined set of rules allocating authority, was merged into the Risk Committee.
The Portfolio Steering Committee is primarily responsible for adjustments of the winding-up plan subject to approval by the Supervisory Board and FMSA; recognition of specific and general provisions; adjustments of methods (for all risk types); and strategic decisions in respect of segments (e.g., geographic regions, asset classes, etc.); and general risk management. All members of the Executive Board, FMS-WM’s General Manager, FMS-WM’s Head of Corporate & Asset Finance, Sales Advisory and FMS-WM’s Head of Risk Controlling, Finance & Portfolio Steering (if absent, their deputies) have the right to vote.
The ALCO serves as the Executive Board’s key body tasked with information gathering, monitoring and management activities in connection with strategic decisions related to the structure of FMS-WM’s balance sheet and related liquidity and market risks. All members of the Executive Board, FMS-WM’s General Manager, FMS-WM’s Head of Corporate & Asset Finance, Sales Advisory and FMS-WM’s Head of Risk Controlling, Finance & Portfolio Steering (if absent, their deputies) have the right to vote subject to applicable substitution rules. ALCO’s main tasks include monitoring the performance of FMS-WM and the structure of its balance sheet in respect of the winding-up plan, discussing its liquidity and market risk exposures (which includes adopting the requisite funding and hedging strategies) as well as fixing the relevant standards and guidelines for management of liquidity and market risks.
-55-
Employees
Recruiting highly qualified employees was an immediate priority for the Human Resources department of at FMS-WM following the launch of operations in October 2010. By the end of 2010, all second-tier management had been filled. As of December 31, 2013, 145 out of a target 170 positions had been filled (December 31, 2012: 133). The target number is dynamically adjusted to the requirements of portfolio management and refinancing efforts. Since the fourth quarter of 2012, open positions have, with few exceptions, been filled only temporarily in accordance with the plan to reduce the workforce in subsequent years following the successful establishment of FMS-WM’s target structure and to wind up the portfolio.
-56-
Independent Auditors
The financial statements for the year ended December 31, 2013, including the balance sheet, the income statement, the notes to the financial statements, the cash flow statement and the statement of changes in equity have been audited by PricewaterhouseCoopers Aktiengesellschaft Wirtschaftsprüfungsgesellschaft, independent auditor, as stated in their report appearing elsewhere herein, and are included in reliance upon their report.
The auditor’s report (Bestätigungsvermerk) has been issued in accordance with Section 322 of the HGB on the annual financial statements and the management report (Lagebericht) of FMS-WM as of and for the fiscal year ended December 31, 2013. The management report is neither included nor incorporated by reference in this Annual Report on Form 18-K.
-57-
Annual financial statements
Balance sheet
of FMS Wertmanagement as at 31 December 2013
| | | | | | | | | | | | | | | | | | | | | | |
Assets | | in € thousand | | | in € thousand | | | 31.12.2013
in € thousand | | | 31.12.2012
in € thousand | |
1. | | Cash reserve | | | | | | | | | | | | | | | | |
| | a) | | Balances with central banks | | | | | | | 382,955 | | | | | | | | 0 | |
| | | | of which: with deutsche Bundesbank € 382,955 thousand (previous year: € 0 thousand) | | | | | | | | | | | | | | | | |
| | | | | | | | | | | | | | | | | | | | | | |
| | | | | | | | | | | | | | | | | 382,955 | | | | 0 | |
2. | | Loans and advances to banks | | | | | | | | | | | | | | | | |
| | a) | | Payable on demand | | | | | | | 16,491,822 | | | | | | | | 24,644,812 | |
| | b) | | Other receivables | | | | | | | 7,117,045 | | | | | | | | 15,022,004 | |
| | | | | | | | | | | | | | | | | | | | | | |
| | | | | | | | | | | | | | | | | 23,608,867 | | | | 39,666,816 | |
3. | | Loans and advances to customers | | | | | | | | | | | 28,358,888 | | | | 24,427,329 | |
| | of which: secured by mortgages € 3,706,237 thousand (previous year:
€ 1,710,569 thousand) Public-sector loans EUR 6,898,253 thousand (previous year: € 7,810,799 thousand) | | | | | | | | | | | | | | | | |
4. | | Debt instruments | | | | | | | | | | | | | | | | |
| | a) | | Bonds and notes | | | | | | | | | | | | | | | | |
| | | | aa) | | Public-sector issuers | | | 47,646,776 | | | | | | | | | | | | 52,079,587 | |
| | | | | | of which: eligible as collateral for deutsche Bundesbank advances
€ 31,978,256 thousand (previous year: € 32,471,454 thousand) | | | | | | | | | | | | | | | | |
| | | | ab) | | Other issuers | | | 47,611,455 | | | | | | | | | | | | 52,288,112 | |
| | | | | | | | | | | | | | | | | | | | | | |
| | | | | | of which: eligible as collateral for deutsche Bundesbank advances
€ 11,141,109 thousand (previous year: € 12,281,458 thousand) | | | | | | | 95,258,231 | | | | | | | | 104,367,699 | |
| | b) | | Own debt instruments | | | | | | | 35,660,121 | | | | | | | | 65,249,913 | |
| | | | | | | | | | | | | | | | | | | | | | |
| | | | Principal amount € 35,646,674 thousand (previous year:
€ 65,232,874 thousand) | | | | | | | | | | | 130,918,352 | | | | 169,617,612 | |
5. | | Other long-term equity investments | | | | | | | | | | | 6,719 | | | | 6,719 | |
| | of which: in banks € 0 thousand (previous year: € 0 thousand) | | | | | | | | | | | | | | | | |
| | of which: in financial services institutions € 0 thousand (previous year:
€ 0 thousand) | | | | | | | | | | | | | | | | |
6. | | Shares in affiliated companies | | | | | | | | | | | 385,766 | | | | 380,956 | |
| | of which: in banks € 0 thousand (previous year: € 0 thousand) | | | | | | | | | | | | | | | | |
| | of which: in financial services institutions € 304,702 thousand (previous year:
€ 318,339 thousand) | | | | | | | | | | | | | | | | |
7. | | Fiduciary assets | | | | | | | | | | | 276 | | | | 276 | |
| | of which: Fiduciary loans € 276 thousand (previous year: € 495 thousand) | | | | | | | | | | | | | | | | |
8. | | Intangible fixed assets | | | | | | | | | | | 10,770 | | | | 1,476 | |
| | Purchased concessions, industrial and similar rights and assets, and licences in such rights and assets | | | | | | | | | | | | | | | | |
9. | | Tangible fixed assets | | | | | | | | | | | 753 | | | | 947 | |
10. | | Other assets | | | | | | | | | | | 51,380 | | | | 7,412,712 | |
11. | | Prepaid expenses | | | | | | | | | | | 3,939,661 | | | | 4,908,652 | |
Total assets | | | | | | | | | | | 187,664,387 | | | | 246,423,495 | |
F-1
| | | | | | | | | | | | | | | | |
Equity and liabilities | | in € thousand | | in € thousand | | | 31.12.2013
in € thousand | | | 31.12.2012
in € thousand | |
1. | | Liabilities to banks | | | | | | | | | | | | | | |
| | a) Payable on demand | | | | | 203,970 | | | | | | | | 1,275,888 | |
| | b) With agreed maturity or notice period | | | | | 21,633,160 | | | | | | | | 40,832,784 | |
| | | | | | | | | | | | | | | | |
| | | | | | | | | | | 21,837,130 | | | | 42,108,672 | |
2. | | Liabilities to customers | | | | | | | | | | | | | | |
| | Other liabilities | | | | | | | | | | | | | | |
| | a) Payable on demand | | | | | 52,637 | | | | | | | | 36,850 | |
| | b) With agreed maturity or notice period | | | | | 26,314,386 | | | | | | | | 37,390,345 | |
| | | | | | | | | | | | | | | | |
| | | | | | | | | | | 26,367,023 | | | | 37,427,195 | |
3. | | Securitised liabilities | | | | | | | | | | | | | | |
| | debt instruments issued | | | | | | | | | 121,189,000 | | | | 147,234,333 | |
4. | | Fiduciary liabilities | | | | | | | | | 276 | | | | 276 | |
| | of which: Fiduciary loans € 276 thousand (previous year: € 276 thousand) | | | | | | | | | | | | | | |
5. | | Other liabilities | | | | | | | | | 373,020 | | | | 750,705 | |
6. | | Deferred income | | | | | | | | | 16,559,398 | | | | 17,505,817 | |
7. | | Provisions | | | | | | | | | | | | | | |
| | a) Tax provision | | | | | 33,508 | | | | | | | | 0 | |
| | b) Other provisions | | | | | 1,186,386 | | | | | | | | 1,361,401 | |
| | | | | | | | | | | | | | | | |
| | | | | | | | | | | 1,219,894 | | | | 1,361,401 | |
8. | | Equity | | | | | | | | | | | | | | |
| | a) Subscribed capital | | | | | 200 | | | | | | | | 200 | |
| | b) Capital reserves | | | | | 1,800 | | | | | | | | 1,800 | |
| | c) Retained earnings | | | | | 0 | | | | | | | | 0 | |
| | d) Net retained profits | | | | | 116,646 | | | | | | | | 33,096 | |
| | | | | | | | | | | | | | | | |
| | | | | | | | | | | 118,646 | | | | 35,096 | |
Total equity and liabilities | | | | | | | | | 187,664,387 | | | | 246,423,495 | |
| | | | | |
1. | | Contingent liabilities | | | | | | | | | | | | | | |
| | Contingent liabilities from guarantees and indemnity agreements | | | | | | | | | 8,114,774 | | | | 10,669,169 | |
2. | | Other obligations | | | | | | | | | | | | | | |
| | Irrevocable loan commitments | | | | | | | | | 5,952,561 | | | | 5,386,641 | |
F-2
Income statement
of FMS Wertmanagement for the period from 1 January until 31 December 2013
| | | | | | | | | | | | | | | | | | | | | | |
Income statement | | in € thousand | | | in € thousand | | | 01.01. –
31.12.2013
in € thousand | | | 01.01. –
31.12.2012
in € thousand | |
1. | | Interest income from | | | | | | | | | | | | | | | | |
| | a) | | Lending and money market transactions | | | 6,038,831 | | | | | | | | | | | | 9,064,861 | |
| | b) | | Fixed-income securities and registered government debt | | | 2,618,391 | | | | | | | | | | | | 3,524,266 | |
| | | | | | | | | | | | | | | | | | | | | | |
| | | | | | | | | 8,657,222 | | | | | | | | 12,589,127 | |
2. | | Interest expenses | | | | | | | –8,031,121 | | | | | | | | –11,860,384 | |
| | | | | | | | | | | | | | | | | | | | | | |
| | | | | | | | | | | | | 626,101 | | | | 728,743 | |
3. | | Commission income | | | | | | | 139,266 | | | | | | | | 142,506 | |
4. | | Commission expenses | | | | | | | –39,037 | | | | | | | | –53,505 | |
| | | | | | | | | | | | | | | | | | | | | | |
| | | | | | | | | | | | | | | | | 100,229 | | | | 89,001 | |
5. | | Other operating income | | | | | | | | | | | 50,972 | | | | 7,071 | |
6. | | General and administrative expenses | | | | | | | | | | | | | | | | |
| | a) | | Personnel expenses | | | | | | | | | | | | | | | | |
| | | | aa) | | Wages and salaries | | | –22,213 | | | | | | | | | | | | –19,123 | |
| | | | ab) | | Social security, post-employment and other employee benefit costs | | | –2,896 | | | | | | | | | | | | –2,272 | |
| | | | | | | | | | | | | | | | | | | | | | |
| | | | | | of which: in respect of post-employment benefits € 1,046 thousand (previous year: € 826 thousand) | | | | | | | –25,109 | | | | | | | | –21,395 | |
| | b) | | Other administrative expenses | | | | | | | –308,938 | | | | | | | | –316,327 | |
| | | | | | | | | | | | | | | | | | | | | | |
| | | | | | | | | | | | | | | –334,047 | | | | –337,722 | |
7. | | Depreciation, amortisation and write-downs of intangible and tangible fixed assets | | | | | | | | | | | –2,659 | | | | –708 | |
8. | | Other operating expenses | | | | | | | | | | | –25,660 | | | | –15,446 | |
9. | | Write-downs of and valuation allowances on receivables and certain securities, and additions to loan loss provisions | | | | | | | –440,051 | | | | | | | | 0 | |
10. | | Income from reversals of write-downs of receivables and certain securities and from the reversal of loan loss provisions | | | | | | | 0 | | | | | | | | 32,335 | |
| | | | | | | | | | | | | | | | | | | | | | |
| | | | | | | | | | | | | | | | | –440,051 | | | | 32,335 | |
11. | | Write-downs of and valuation allowances on shares in affiliated companies, other long-term equity investments and securities classified as fixed assets | | | | | | | 0 | | | | | | | | –464,779 | |
12. | | Income from reversals of write-downs of other equity investments, shares in affiliated companies and securities classified as fixed assets | | | | | | | 176,587 | | | | | | | | 0 | |
| | | | | | | | | | | | | | | | | | | | | | |
13. | | Expenses from loss absorption | | | | | | | | | | | 176,587 | | | | –464,779 | |
| | | | | | | | | | | | | | | | | –5,351 | | | | –1,667 | |
14. | | Result from ordinary activities | | | | | | | | | | | 146,121 | | | | 36,828 | |
15. | | Taxes on income | | | | | | | | | | | –34,759 | | | | –5,025 | |
16. | | Other taxes not included in item 8 | | | | | | | | | | | 5,284 | | | | 3,293 | |
17. | | Net income for the fiscal year | | | | | | | | | | | 116,646 | | | | 35,096 | |
18. | | Profit brought forward (previous year: loss brought forward) | | | | | | | | | | | 0 | | | | –2,000 | |
19. | | Net retained profits | | | | | | | | | | | 116,646 | | | | 33,096 | |
F-3
Cash flow statement
of FMS Wertmanagement for the period from 1 January until 31 December 2013
| | | | | | | | | | | | | | | | |
Cash flow statement | | 01.01. –
31.12.2013
in € thousand | | | 01.01. –
31.12.2012
in € thousand | |
| | 1. | | | | | | | Net income / loss for the period | | | 116,646 | | | | 35,096 | |
| | | | | | | | Non-cash items included in net income/loss for the period and reconciliation to cash flow from operating activities | | | | | | | | |
| | 2. | | | | | + / – | | depreciation, amortisation, write-downs and reversals of write-downs on receivables, tangible fixed assets and financial assets as well as intangible assets | | | 305,203 | | | | 89,289 | |
| | 3. | | | | | + / – | | Increase /decrease in provisions | | | –141,508 | | | | –734,791 | |
| | 4. | | | | | + / – | | Other non-cash expenses/income | | | 18,906 | | | | 15,240 | |
| | 5. | | | | | – / + | | Profit / loss from the sale of financial assets and tangible fixed assets | | | 0 | | | | 0 | |
| | 6. | | | | | – / + | | Other adjustments (net) | | | –620,750 | | | | –660,628 | |
| | 7. | | | | | = | | Subtotal | | | –321,503 | | | | –1,255,794 | |
| | | | | | | | Change in assets and liabilities from operating activities | | | | | | | | |
| | 8. | | | | | | | Loans and advances | | | | | | | | |
| | | | a. | | + / – | | to banks | | | 13,147,884 | | | | 11,265,412 | |
| | | | b. | | + / – | | to customers | | | –5,007,458 | | | | 4,965,197 | |
| | 9. | | | | | + / – | | Securities | | | 9,222,356 | | | | 11,174,838 | |
| | 10. | | | | | + / – | | Other assets from operating activities | | | 1,001,340 | | | | 2,389,095 | |
| | 11. | | | | | | | Liabilities | | | | | | | | |
| | | | a. | | + / – | | to banks | | | –20,299,592 | | | | –70,457,412 | |
| | | | b. | | + / – | | to customers | | | –11,032,122 | | | | 15,865,796 | |
| | 12. | | | | | + / – | | Securitised liabilities | | | 3,544,460 | | | | 29,649,209 | |
| | 13. | | | | | + / – | | Other liabilities from operating activities | | | –1,335,518 | | | | –5,613,294 | |
| | 14. | | | | | + | | Interest and dividends received | | | 8,657,222 | | | | 12,589,127 | |
| | 15. | | | | | – | | Interest paid | | | –8,031,121 | | | | –11,860,384 | |
| | 16. | | | | | + | | Extraordinary receipts | | | 0 | | | | 0 | |
| | 17. | | | | | – | | Extraordinary payments | | | 0 | | | | 0 | |
| | 18. | | | | | + / – | | Income tax payments | | | 0 | | | | 0 | |
| | 19. | | | | | = | | Cash flows from operating activities | | | –10,454,052 | | | | –1,288,210 | |
| | 20. | | | | | | | Proceeds from disposal of | | | | | | | | |
| | | | a. | | + | | long-term financial assets | | | 0 | | | | –25 | |
| | | | b. | | + | | tangible fixed assets | | | 0 | | | | 0 | |
| | 21. | | | | | | | Payments for investments in | | | | | | | | |
| | | | a. | | – | | long-term financial assets | | | –18,447 | | | | 0 | |
| | | | b. | | – | | tangible fixed assets and intangible assets | | | –11,759 | | | | –721 | |
| | 22. | | | | | + | | Receipts from the disposal of affiliated companies | | | 0 | | | | 0 | |
| | 23. | | | | | – | | Payments for the acquisition of affiliated companies | | | 0 | | | | 0 | |
| | 24. | | | | | + / – | | Change in cash from other investing activities (net) | | | 0 | | | | 0 | |
| | 25. | | | | | = | | Cash flows from investing activities | | | –30,206 | | | | –746 | |
| | 26. | | | | | + | | Cash receipts from issue of capital | | | 0 | | | | 0 | |
| | 27. | | | | | | | Cash payments to shareholders | | | | | | | | |
| | | | a. | | – | | – dividend payments | | | 0 | | | | 0 | |
| | | | b. | | – | | – Other payments | | | –16,955 | | | | 0 | |
| | 28. | | | | | + / – | | Change in cash from other capital sources (net) | | | 7,300,000 | | | | 2,623,000 | |
| | 29. | | | | | = | | Cash flows from financing activities | | | 7,283,045 | | | | 2,623,000 | |
| | 30. | | | | | | | Net change in cash funds (sum total of items 19, 25, 29) | | | –3,201,213 | | | | 1,334,044 | |
| | 31. | | | | | + / – | | Effect on cash funds of exchange rate movements and remeasurement | | | 12,042 | | | | 5,997 | |
| | 32. | | | | | + | | Cash funds at beginning of period | | | 4,081,587 | | | | 2,741,546 | |
| | 33. | | | | | = | | Cash funds at end of period | | | 892,416 | | | | 4,081,587 | |
The cash flow statement was prepared using the indirect method. The cash funds reported comprise demand deposits with banks that are payable on demand and balances with Deutsche Bundesbank.
F-4
Statement of changes in equity
for the period from 1 January until 31 December 2013
| | | | | | | | | | | | | | | | |
Statement of changes in equity | | Balance at
01.01.2013
in € thousand | | | Appropriation
of net income/loss
in € thousand | | | Net income
for the year
in € thousand | | | Balance at
31.12.2013
in € thousand | |
Subscribed capital | | | 200 | | | | 0 | | | | 0 | | | | 200 | |
Capital reserves | | | 1,800 | | | | 0 | | | | 0 | | | | 1,800 | |
Retained earnings | | | 0 | | | | 0 | | | | 0 | | | | 0 | |
Net retained profits | | | 33,096 | | | | –33,096 | | | | 116,646 | | | | 116,646 | |
Equity as defined by German commercial law | | | 35,096 | | | | –33,096 | | | | 116,646 | | | | 118,646 | |
Statement of changes in equity
for the period from 1 January until 31 December 2012
| | | | | | | | | | | | | | | | |
Statement of changes in equity | | Balance at
01.01.2012
in € thousand | | | Appropriation
of net income/loss
in € thousand | | | Net income
for the year
in € thousand | | | Balance at
31.12.2012
in € thousand | |
Subscribed capital | | | 200 | | | | 0 | | | | 0 | | | | 200 | |
Capital reserves | | | 1,800 | | | | 0 | | | | 0 | | | | 1,800 | |
Retained earnings | | | 0 | | | | 0 | | | | 0 | | | | 0 | |
Net accumulated losses | | | –2,000 | | | | 0 | | | | 35,096 | | | | 33,096 | |
Equity as defined by German commercial law | | | 0 | | | | 0 | | | | 35,096 | | | | 35,096 | |
F-5
NOTES
General information
Legal framework
FMS Wertmanagement AöR (hereafter: FMS Wertmanagement) was founded on 8 July 2010 and recorded in the Commercial Register of the Munich Local Court on 13 September 2010.
Under agreements dated 29 and 30 September 2010, a portfolio with a nominal value of around EUR 175.7 billion (excluding derivatives) was transferred to FMS Wertmanagement effective 1 October 2010. For this, the Federal Agency for Financial Market Stabilisation (Bundesanstalt für Finanzmarktstabilisierung – FMSA) – acting as necessary on behalf of the German Financial Market Stabilisation Fund (Finanzmarktstabilisierungsfonds – SoFFin), Hypo Real Estate Holding AG (HRE), Deutsche Pfandbriefbank AG (pbb), Depfa Bank plc and other companies of the HRE Group as well as FMS Wertmanagement entered into a number of agreements pursuant to which certain risk positions and non-strategic operations of the HRE Group were to be transferred to FMS Wertmanagement in accordance with Section 8a of the German Law Establishing a Financial Market Stabilisation Fund (Gesetz zur Errichtung eines Finanzmarktstabilisierungsfonds – FMStFG).
The transferors, pbb and HRE, transferred risk positions and non-strategic operations to FMS Wertmanagement, partly by way of a spin-off for absorption, in accordance with Section 8a (1) and (8) FMStFG in conjunction with Section 123 (2) No. 1 and Section 131 of the German Reorganisation and Transformation Act (Umwandlungsgesetz – UmwG). The risk positions and non-strategic operations that were not transferred by way of the spin-off were transferred to FMS Wertmanagement by way of a subparticipation, assignment, novation or guarantee. Which approach was chosen depended on the different legal, regulatory and tax requirements of the respective countries governing the respective transaction. What is common to all means of transfer however, is that FMS Wertmanagement assumed the economic risk of the risk positions and non-strategic operations. The spin-offs from HRE and pbb were recorded in the respective German Commercial Register on 2 December 2010 for HRE and pbb as well as for FMS Wertmanagement.
The contracts signed on 29 and 30 September 2010 also included the intragroup “concentration agreements” between HRE on the one hand and pbb, Depfa Bank plc and other companies of the HRE Group on the other hand. These concentration agreements established that HRE had a claim to the transfer by the HRE Group companies of the risk positions and non-strategic operations. HRE spun off its contractual position and its claims and obligations under the concentration agreements to FMS Wertmanagement as part of the aforementioned spin-off. The concentration agreements were performed directly between the respective HRE Group company and FMS Wertmanagement by way of the aforementioned subparticipations, assignments, novations or guarantees.
F-6
FMS Wertmanagement is an organisationally and financially independent winding-up institution under public law with partial legal capacity that may engage in legal transactions in its own name, sue and be sued in court. It is regulated and supervised by FMSA and the Federal Financial Supervisory Authority (BaFin).
In accordance with the law and the Charter of FMS Wertmanagement, SoFFin is under an obligation to compensate all losses. Until FMS Wertmanagement is liquidated, SoFFin has the obligation under Article 7 (1) of the Charter of FMS Wertmanagement (i) to pay, on first demand by the Executive Board of FMS Wertmanagement, all amounts required in the Executive Board’s due assessment for ensuring that the winding-up institution can pay all its liabilities at any time when due and in full and (ii) to cover all losses of FMS Wertmanagement. Losses in this sense comprise all amounts that are payable to FMS Wertmanagement so that it can discharge its liabilities – as set out above – and that need not be repaid to SoFFin under the conditions set out in Article 7 (2) of the Charter.
Situation until 30 September 2013
In accordance with its Charter, FMS Wertmanagement utilised a notarised cooperation agreement to outsource the servicing of the risk assets transferred to it by the HRE Group to pbb as the portfolio servicer until 30 September 2013. In order to fulfil its responsibilities, pbb further outsourced activities to other companies of the HRE Group or external third parties. FMS Wertmanagement’s decision-making and auditing rights remained unaffected by the aforementioned. The work outsourced entailed many of the administrative activities connected with the portfolio taken over. The scope of this outsourcing was described in service level agreements concluded between FMS Wertmanagement and pbb. The agreement between FMS Wertmanagement and pbb ended effective 30 September 2013 on account of existing EU requirements.
Situation from 1 October 2013 onward
In 2012, FMS Wertmanagement established its own service entity (FMS Wertmanagement Service GmbH), which assumed responsibility for portfolio servicing and the provision of all associated services effective 1 October 2013. FMS Wertmanagement retains final decision-making powers and ultimate responsibility for the risk assets under management. The master agreement governing the outsourcing of business processes and services also grants FMS Wertmanagement extensive rights to obtain information and perform inspections, enabling the latter to monitor and control the servicing of the risk assets by FMS Wertmanagement Servicegesellschaft. FMS Wertmanagement Servicegesellschaft maintains a total of four offices, in Unterschleißheim, London, Dublin and New York.
IBM Deutschland GmbH (Ehningen) and other companies have also been hired to provide necessary IT services.
F-7
Accounting principles
These annual financial statements of FMS Wertmanagement were prepared in accordance with Section 8a (1) sentence 10 in conjunction with Section 3a (4) of the German Law Establishing a Financial Market Stabilisation Fund (Gesetz zur Errichtung eines Finanzmarktstabilisierungsfonds – FMStFG) and the supplementary provisions of its Charter pursuant to the provisions of the German Commercial Code for large corporations, the supplementary provisions of the German Commercial Code (Handelsgesetzbuch – HGB) for credit institutions and financial services institutions as well as the requirements of the German Accounting Directive for Banks and Financial Services Providers (Verordnung über die Rechnungslegung der Kreditinstitute und Finanzdienstleistungsinstitute – RechKredV).
Since FMS Wertmanagement is a capital market oriented organisation as defined by Section 264d HGB, it has expanded its annual financial statements to include a statement of changes in equity and a cash flow statement in accordance with Section 264 (1) Sentence 2 HGB. A management report has also been prepared.
Accounting policies
Assets, liabilities as well as prepaid expenses and deferred income are recognised in accordance with Section 246 ff. HGB. Assets, liabilities and executory contracts are measured based on the principles of Section 252 ff. HGB in conjunction with Section 340 ff. HGB. Pursuant to Section 2 (1) RechKredV, FMS Wertmanagement used Form 1 to structure the balance sheet and Form 3 (vertical presentation format) for the income statement.
FMS Wertmanagement took over assets, provisions, liabilities, prepaid expenses and deferred income as well as derivatives effective as at 1 October 2010 for accounting purposes. The transfer of assets is recognised in line with general principles; with respect of the assets taken over as part of the spin-off for absorption (Section 123 (2) No. 1 UmwG) recognition is based on Section 24 UmwG. FMS Wertmanagement made use of the option in Section 24 UmwG, which provides for a continuation of the transferring entity’s book values.
Those book values were used if the assets were transferred to FMS Wertmanagement under the concentration agreements described in the chapter entitled “legal framework”. If the transferor prepares its accounting pursuant to the International Financial Reporting Standards (IFRS), the IFRS book value corresponds to FMS Wertmanagement’s acquisition cost. The IFRS book value contains hedge adjustments for loans, advances and securities that were reported in micro hedges; the hedge adjustments related to securities are reported under the item “debt instruments” and those for loans under prepaid expenses and deferred income. The hedge adjustments for loans or securities are generally contrasted by the fair values of the hedging derivatives transferred. The payments that FMS Wertmanagement has received or made for the hedging derivatives are shown under prepaid expenses and deferred income. The hedge adjustments and the recognised items for accrued payments related to derivatives are amortised regularly over the remaining terms to maturity of the corresponding transactions. Expenses and income from such amortisation are reported under interest expense or interest income. Both amortisation and current premium payments related to credit default swap (CDS) exposures are reported under the item headings “Commission income” or “Commission expenses”.
F-8
The fact that the transferring entity’s book value represents the transfer price was to be taken into account as part of the acquisition process. Consequently, the write-downs recognised by the transferring entity were to be taken into account in the determination of the transfer price. The transfer price in turn represented FMS Wertmanagement’s cost.
Loans and advances to banks and loans and advances to customers are generally carried at their nominal value less “risk provision” in the form of specific and general loan loss provisions. Differences between the nominal value and the cost, which are similar in nature to interest, are accounted for in prepaid expenses and deferred income and recognised in profit or loss under net interest income over the term of the receivable using the straight-line method. The proportionate interest calculated at the reporting date is recognised together with the underlying receivable.
On the basis of proposals by the portfolio servicer, analyses by other expert third parties and analyses by FMS Wertmanagement itself, specific loan loss provisions and other provisions are recognised for individual risks that have arisen in the lending business. Expected future proceeds from the realisation of collateral were discounted over the realisation period as necessary using a market interest rate with matching maturities.
Latent risks in the lending business are covered by general loan loss provisions set up in line with the requirements of the IDW statement BFA 1/1990 on the recognition of general loan loss provisions. They are calculated based on the expected loss determined by the portfolio servicer, which is modelled for the case in question using several parameters: probability of default, amount of exposure in the event of a default and expected recovery rate in the event of a default. Estimating the calculation parameters of the anticipated loss is based on data of the portfolio servicer.
Collective country valuation allowances are also recognised for loans to borrowers in countries with discernible country risks. They are recognised in accordance with the methods required under German tax law. The countries to be included and the amount of the valuation allowances are determined on the basis of external country ratings that reflect current and expected economic data as well as the overall political situation in the countries in question.
Debt instruments are allocated to fixed assets (financial assets) because they are continuously used for operations. These are measured at amortised cost in accordance with Section 253 (1) and (3) HGB. If FMS Wertmanagement believes that the assets are permanently impaired, impairment losses are charged in accordance with Section 340e (1) Sentence 1 HGB. The existence of permanent impairment is determined in the case in question on the basis of information supplied by the portfolio servicer and commissioned expert third parties and obtained through FMS Wertmanagement’s own investigations. The test of whether there is permanent impairment is generally conducted similar to the test for impairment of loan receivables, except that market values representing an additional trigger in the test for impairment of wind-up clusters with a high percentage of securities traded on liquid markets are to be taken into account. Investment securities that are not permanently impaired are included in the measurement base for calculating the general loan loss provision. When the reasons for permanent impairment no longer apply, write-ups are charged in accordance with Section 253 (5) Sentence 1 HGB up to a maximum of the amortised cost.
F-9
Own bonds bought back are allocated to current assets (liquidity reserve). They are measured in accordance with the strict lower-of-cost-or-market principle in accordance with Section 253 (4) HGB. If the quoted or market price is lower than the amortised cost, these will be written down through profit or loss.
The fair values of securities and derivatives are determined either based on external rate sources (e.g. via stock exchanges or other providers such as Reuters) or based on fair values derived from internal measurement models (mark to model). Fair values of securities are largely determined on the basis of securities prices obtained from external sources. The fair value of own issues takes FMS Wertmanagement’s own credit risk into account. Derivatives are largely measured using specific measurement models, whereby the counterparty risk in the case of unsecured OTC derivatives is taken into account when determining any provisions for expected losses for hedge inefficiencies or for stand-alone derivatives.
In the measurement of secured derivatives, future cash flows were discounted in the reporting year for the first time on the basis of EONIA swap curves rather than the EURIBOR curves used in the past. In the case of stand-alone derivatives, the change generated an effect of EUR – 56.5 million.
Securities holdings are measured based on the following measurement hierarchy, which is oriented above all on the availability of plausible external market data:
| | • | | If an (indicative) market price (rate) is available for a liquid market, it is used. |
| | • | | If a market price is not available or the market is not sufficiently liquid, the measurement is converted to a proxy measurement based on the available market prices for similar securities. |
| | • | | If an appropriate proxy security cannot be identified, the measurement is carried out using the benchmark spreads or estimated spreads determined by the portfolio servicer’s experts. |
| | • | | Securities not measured based on market prices, proxies, or spreads, (e.g. structured inflation-linked bonds) are measured based on actuarial valuation models. |
The parameters for our internal measurement models (e.g. interest rate curves, volatilities, spreads) are derived from external sources and reviewed by Risk Controlling as to their plausibility and accuracy. The models used for measuring structured derivatives are initially calibrated on the basis of market data, with the subsequent measurement being based on the resulting model parameters. The portfolio servicer is responsible for collecting market data and calculating the fair values.
F-10
Differences that stem from the reporting of securities classified as fixed assets above their fair value based on application of the modified lower-of-cost-or-market principle are shown separately in the notes.
FMS Wertmanagement holds positions in asset-backed securities. These structured financial instruments are not required to be separated; they are carried as a uniform asset and in compliance with IDW AcP HFA 22.
Securities repurchase agreements (repos) are reported in accordance with the provisions of Section 340b HGB. The securities sold under genuine repurchase agreements are still reported in the balance sheet of FMS Wertmanagement. Depending on the transferee, the obligation to repurchase securities sold under repo agreements is presented under the balance sheet item, Liabilities to banks, or the balance sheet item, Liabilities to customers. If reverse repo transactions were entered into to place excess liquidity on the money market, the resulting receivables are recognised under the balance sheet item, Loans and advances to banks or the balance sheet item, Loans and advances to customers, depending on the transferor. The specific securities are not presented in FMS Wertmanagement’s balance sheet due to the lack of beneficial ownership.
Shares in affiliated companies and other long-term equity investments are recognised at cost. If impairment is expected to be permanent, write-downs to the lower fair value are recognised.
Tangible fixed assets are recognised at cost less depreciation. The useful life is determined based on the expected wear and tear of the tangible fixed assets.
Intangible assets are recognised at cost less amortisation. The useful life is determined based on factors expected to limit the longevity of the intangible assets.
For the sake of simplicity and in compliance with the tax regulations, assets costing EUR 150.00 or less before VAT are written down in full in the year of acquisition. Assets costing between EUR 150.00 and EUR 1,000.00 before VAT are presented in an omnibus account that is written down over five fiscal years using the straight-line method.
As in the previous year, FMS Wertmanagement does not make use of the option to carry the excess of deferred tax assets in the balance sheet in accordance with Section 274 (1) Sentence 2 HGB. The surplus of deferred tax assets at 31 December 2013 stems from temporary differences between the financial statements and the tax base, especially with respect to loans and advances to banks, loans and advances to customers, debt instruments, shares in affiliated companies as well as provisions for expected losses and litigation costs. Tax loss carryforwards also exist. In the general overview, FMS Wertmanagement’s deferred tax assets exceed its deferred tax liabilities. Deferred tax assets and deferred tax liabilities are calculated on temporary differences between the book values of the assets or liabilities and their tax base. The temporary differences identified are measured at a tax rate of 32.975%. The com- bined income tax rate comprises corporate income tax, trade tax and the solidarity surcharge. Based on the existing control and profit-and-loss transfer agreement dated 16 October 2012, there is a consolidated VAT, corporate income tax and trade tax group with FMS Wertmanagement Servicegesellschaft. Consequently, the German tax obligations of FMS Wertmanagement Servicegesellschaft are disclosed in FMS Wertmanagement’s financial statements.
F-11
Prepaid expenses include:
| | • | | Expenditures prior to the reporting date where these concern expenses in a certain period of time after the reporting date; |
| | • | | Deferrals in connection with the issuing business; |
| | • | | Deferrals in connection with derivative products. This primarily concerns payments made for the derivatives taken over from HRE Group companies (positive fair values). |
| | • | | Positive differences between the nominal value of receivables and the cost, which are similar in nature to interest, are included in the prepaid expenses. This basically concerns payments that FMS Wertmanagement has made for the hedge adjustments of the hedged items taken over from the HRE Group companies, provided the hedged items are loans. These hedged items were accounted for by the transferor in accordance with IFRSs, with the IFRS book value (including the IFRS hedge adjustment) constituting the transfer price. |
As a rule, prepaid expenses are amortised on a pro rata basis. To the extent that prepaid expenses include payments in connection with the takeover of derivatives and there are serious doubts regarding the contracts’ validity or the recoverability of the payments for the derivatives taken over that are recognised under prepaid expenses, these components of prepaid expenses are reversed through profit or loss. Prepaid expenses and other liabilities include EUR 49 million in restructuring effects from 2012.
Liabilities are carried at their settlement amount. Differences between the issue amount and the settlement amount of the liabilities are posted to deferred income or prepaid expenses and reversed through profit and loss on a pro rata basis.
Provisions for uncertain liabilities and provisions for expected losses from executory contracts are recognised at the settlement amount dictated by prudent business judgement. Provisions with a remaining maturity of more than one year are generally discounted in accordance with Section 253(2) HGB using the average market interest rate of the past seven fiscal years corresponding to their remaining maturity. The applicable interest rates are published by the Bundesbank. Provisions for expected losses from executory contracts (derivatives) were recognised in the amount of the existing excess of expected obligations over expected benefits.
Deferred income includes:
| | • | | Proceeds received prior to the reporting date where these concern income in a certain period of time after the reporting date; |
| | • | | Deferrals (premiums) in connection with the issuing business; |
| | • | | Deferrals in connection with derivative products. This mainly concerns payments that FMS Wertmanagement received for the derivatives taken over from HRE Group companies (negative fair values); |
| | • | | Deferrals in connection with the lending business (discounts on receivables). This basically concerns payments that FMS Wertmanagement has received for the hedge adjustments of the hedged items taken over from the HRE Group companies. These hedged items were accounted for by the transferor in accordance with IFRSs, with the IFRS book value (including the IFRS hedge adjustment) constituting the transfer price. |
F-12
Deferred income is amortised on a pro rata basis.
Derivative financial instruments are entered into to hedge interest rate risk in individual hedged items, to manage general interest rate risk and to hedge inflation, counterparty and currency risks.
| | • | | Derivative financial instruments serving to hedge the market risks (basically interest rate risks) of individual hedged items are aggregated into micro hedges along with the hedged items in accordance with Section 254 HGB. |
| | • | | Derivative financial instruments that are used to manage the general interest rate risk are aggregated into an offsetting item with the other transactions in the banking book (securities and loans) that are interest-based and regarded as non interest-induced as well as the issues floated for funding purposes. Prevailing opinion holds that this is not a hedge under Section 254 HGB but an accounting practice. |
| | • | | Derivatives such as credit default swaps are used to hedge counterparty risks. As a rule, these derivatives are not aggregated with other hedged items in hedges and are measured in accordance with the general principles of commercial law (in accordance with IDW BFA 1). |
| | • | | Derivative financial instruments such as currency and cross currency interest rate swaps serve to fund or manage FMS Wertmanagement’s liquidity in the individual foreign currencies. They are used in connection with the management of foreign currency positions to close open risk positions. |
Consistent with the specifications of risk management, documented hedging relationships are entered into at the transaction level (micro hedges) to hedge market risks. FMS Wertmanagement recognises these hedging relationships using the net hedge presentation method (“Einfrierungsmethode”) in accordance with Section 254 HGB. Where the offsetting changes in value resulting from the hedged risk (especially interest rate risk) are compensated, the changes in value in the hedged item or in the hedging instrument were not recognised. Where the offsetting changes in value resulting from the hedged risk of the hedged item and the hedging instrument are not compensated, the general accounting policies are used for this ineffective portion. In an existing excess obligation, the ineffective portion of the hedge’s hedged risk is recognised as an expense in accordance with the imparity principle pursuant to IDW RS HFA 35 through the recognition of a provision for expected losses. The ineffective portion is computed by comparing the change in value from the hedged risk of the hedged item with the change in value from the hedged risk of the hedging instrument. Excess obligations for unhedged risks are recognised in accordance with the imparity principle through the recognition of a provision for expected losses. Expenses from additions to provisions for expected losses are shown in the net revaluation gain / loss for the lending and securities business.
F-13
FMS Wertmanagement took over a portfolio consisting of synthetic US CMBS financial instruments. The totality of the instruments defined for this portfolio constitutes a hedge pursuant to Section 254 HGB which serves in particular to hedge the risks from US CMBS. Given their complex structures, the financial instruments contained in this portfolio are measured based on models. As at the end of the previous reporting period, FMS Wertmanagement performed a fundamental, model-based valuation of the financial instruments based on market data (especially ratings) because market liquidity remained insufficient during the reporting year.
The portfolio servicer carried out an effectiveness test of all hedges. The effectiveness of the hedges was examined primarily on the basis of linear regression.
In addition, FMS Wertmanagement holds credit derivatives (e.g. credit default swaps – CDS) where it is the guarantor. These credit derivatives are accounted for in accordance with IDW AcP BFA 1.
In addition to the necessary and recognised provisions for expected losses for hedges, the entire interest rate portfolio and/or banking book is evaluated for the existence of an excess obligation. All interest-based financial instruments (referred to in the German literature as a “Refinanzierungsverbund”) are included in this evaluation, including those that are designated as hedges under Section 254 HGB. Additional provisions for expected losses for the excess obligation are only recognised in accordance with the provisions under IDW AcP BFA 3 if an excess obligation existed in this offsetting item. SoFFin’s loss compensation obligation under Section 7 of FMS Wertmanagement’s Charter is included in the offsetting item.
For derivatives secured in hedges, the change in value resulting from the change in the measurement of secured derivatives (discounting of future cash flows on the basis of EONIA swap curves) was not considered a portion of the hedged risk and was recognised in connection with the determination of the overall excess obligation from the banking book. For the secured derivatives that are used to manage the general interest rate risk as an accounting practice, the new value resulting from this change was recognised as part of the determination of the overall excess obligation from the banking book. Consequently, the change in measurement of the secured derivatives in hedges or in the banking book did not have any effects on profit or loss.
Contingent liabilities are disclosed below the line at their nominal amount after deduction of any risk provisions.
Foreign currency items in the balance sheet are translated into the reporting currency (euros) in accordance with the provisions of Section 256a HGB in conjunction with Section 340a (1) and Section 340h HGB and pursuant to the provisions of IDW AcP BFA 4. FMS Wertmanagement performs its currency translation at the reporting date within the scope of specific coverage in accordance with Section 340h HGB. The assets, liabilities and executory contracts (foreign currency derivatives) allocated to hedge accounting were translated at the average spot rate as at 31 December 2013 using the respective reference exchange rate of the European Central Bank. If forward exchange transactions serve to hedge interest-bearing balance sheet items, the forward rate is split into its two elements (spot rate and swap rate) in order to account for them separately for the purpose of determining the result.
F-14
Expenses and income were translated into euros at the exchange rate on the transaction date. Expenses and income arising from the currency translation are presented net under other operating expenses or other operating income. In the reporting year, effects of EUR 24 million were recognised under other operating expenses that relate to the preceding years and were processed on a current account basis.
Interest income and interest expense for swaps entered into are presented gross, i. e. not netted, in the income statement.
FMS Wertmanagement avails itself of the options under Section 340f (3) HGB. Accordingly, income and expenses from the measurement of loans, advances and securities allocated to the liquidity reserve may be shown in a single item after offsetting against income and expenses from the disposal of such transactions. This also includes additions to or reversals of loan loss provisions.
FMS Wertmanagement avails itself of the options under Section 340c (2) HGB. Accordingly, expenses from write-downs on long-term equity investments, shares in affiliated companies and securities classified as fixed assets may be offset against the income from additions to such assets and shown in a single expense and income item. Under Section 340c HGB, the expenses and income from transactions involving such assets may also be included. FMS Wertmanagement also reports the profit / loss from the sale of securities as well as the profit / loss from the termination of related derivatives transactions in this item.
F-15
NOTES TO THE BALANCE SHEET
Assets
Cash reserve
The cash reserve item shows a credit balance with Deutsche Bundesbank in the amount of EUR 383 million (31 December 2012: EUR 0 million).
Loans and advances to banks
| | | | | | | | |
| | | 31.12.2013
in € million | | | 31.12.2012
in € million | |
a) Payable on demand | | | 16,492 | | | | 24,645 | |
b) Other receivables | | | 7,117 | | | | 15,022 | |
| | | | | | | | |
Total | | | 23,609 | | | | 39,667 | |
| | | | | | | | |
The decrease in receivables payable on demand mainly results from a reduced need for collateral provided in the form of cash for derivative positions.
The decrease in other loans and advances to banks is largely attributable to an agreement reached with pbb in August 2013 on the so-called “Ersatzdeckungslösung” (substitute cover solution). This concerns a portfolio of loans and advances that had been transferred to FMS Wertmanagement as at 1 October 2010 via limited cash subparticipation because these items were still being used by the transferor pbb at the transfer date to cover Pfandbrief securities the transferor had issued. On the basis of the agreement reached, this portfolio was removed from pbb’s mortgage cover register in August 2013 and, as with other subparticipations, passed into the beneficial ownership of FMS Wertmanagement. Since 30 September 2013, the portfolio has been recognised under loans and advances to customers, whereas as at 31 December 2012 it was still recognised as a limited cash subparticipation under loans and advances to banks (to pbb) in the amount of EUR 6.9 billion.
Accordingly, loans and advances to customers increased, with these effects attributable to the “Ersatzdeckungslösung” (substitute cover solution) compensating for the portfolio wind-up.
F-16
The remaining maturities of the other loans and advances to banks as at 31 December 2013 are as follows:
| | | | | | | | |
| | | 31.12.2013
in € million | | | 31.12.2012
in € million | |
Up to three months | | | 161 | | | | 2,373 | |
More than three months and up to one year | | | 2,107 | | | | 3,409 | |
More than one year and up to five years | | | 849 | | | | 3,271 | |
More than five years | | | 4,000 | | | | 5,969 | |
| | | | | | | | |
Total | | | 7,117 | | | | 15,022 | |
| | | | | | | | |
Loans and advances to customers
| | | | | | | | |
| | | 31.12.2013
in € million | | | 31.12.2012
in € million | |
Total | | | 28,359 | | | | 24,427 | |
Of which: to affiliated companies | | | 886 | | | | 1,302 | |
Of which: to other long-term equity investments | | | 7 | | | | 8 | |
The increase in loans and advances to customers is mainly due to the implementation of the “Ersatzdeckungslösung” (substitute cover solution) and the related asset swap from the “Loans and advances to banks” item. The reclassification more than compensates for effects from the portfolio wind-up. For more information on the “Ersatzdeckungslösung” (substitute cover solution), please refer to our comments under loans and receivables to banks.
The remaining maturities of the loans and advances to customers as at 31 December 2013 are as follows:
| | | | | | | | |
| | | 31.12.2013
in € million | | | 31.12.2012
in € million | |
Payable on demand | | | 476 | | | | 861 | |
Up to three months | | | 4,814 | | | | 1,404 | |
More than three months and up to one year | | | 4,187 | | | | 2,140 | |
More than one year and up to five years | | | 6,414 | | | | 7,717 | |
More than five years | | | 12,468 | | | | 12,305 | |
| | | | | | | | |
Total | | | 28,359 | | | | 24,427 | |
| | | | | | | | |
As previously, there are no loans and advances with indefinite maturity.
F-17
Debt instruments
The debt instruments item in the balance sheet is broken down as follows:
| | | | | | | | |
| | | 31.12.2013
in € million | | | 31.12.2012
in € million | |
Book value | | | 130,918 | | | | 169,618 | |
Of which: public-sector issuers | | | 47,647 | | | | 52,080 | |
Of which: other issuers | | | 47,611 | | | | 52,288 | |
Of which: own debt instruments | | | 35,660 | | | | 65,250 | |
| | |
Marketable securities | | | 130,918 | | | | 169,618 | |
Of which: listed | | | 112,865 | | | | 146,671 | |
Of which: not listed | | | 18,053 | | | | 22,947 | |
| | |
Securities sold under repurchase agreements | | | 36,858 | | | | 76,436 | |
Securities due in the following year | | | 28,108 | | | | 23,161 | |
Of the marketable securities, securities totalling EUR 95,258 million (31 December 2012: EUR 104,368 million) are measured as fixed assets in accordance with the moderate lower-of-cost-or-market principle.
In addition, the marketable securities include own debt instruments of EUR 35,660 million (31 December 2012: EUR 65,250 million) which, because these are treated as current assets, are measured using the strict lower-of-cost-or-market principle. The issues of FMS Wertmanagement serve to provide additional collateral and manage liquidity. The decrease in own bonds can be attributed primarily to a reduced need for securities for the liquidity reserve as well as to the further scaling-back of the repo business.
The deferred write-downs on debt instruments total EUR 9,883 million based on their fair values as at 31 December 2013 (31 December 2012: EUR 12,518 million). With respect to the securities that carry hidden losses as at 31 December 2013, FMS Wertmanagement assumes, given its, in part, long-term wind-up strategy and the securities’ expected performance, that their fair value will be less than the book value only temporarily. Corresponding write-downs were taken if there were any doubts as to collectability.
F-18
Especially in the case of PIIGS countries, write-downs were not recognised on the corresponding portfolio due to the measures taken by the EU in respect of the European rescue fund. The discount on the cost of debt instruments bearing lower-than-market interest added under the exchange programme for Greek government bonds was not unwound.
The “debt instruments” balance sheet item also includes the accrued but not yet amortised payments made by FMS Wertmanagement in 2010 for hedge adjustments on securities taken over from the HRE Group companies. As a result, the book values frequently exceed the nominal values. This has a corresponding effect on the hidden losses disclosed.
The book values and the fair values of the securities contained in the banking book, broken down by issuer group, follow from the overview below. Both the book values and the fair values contain deferred interest.
| | | | | | | | | | | | | | | | | | | | |
| | | Of which: | | | Other issuers | | | | | | | |
in € million | | public-sector
issuers | | | Of which:
banks | | | Of which:
other issuers | | | Total
31.12.2013 | | | Total
31.12.2012 | |
Book value | | | 47,647 | | | | 7,204 | | | | 40,407 | | | | 95,258 | | | | 104,368 | |
Fair value | | | 42,307 | | | | 7,153 | | | | 38,281 | | | | 87,741 | | | | 94,364 | |
hidden assets | | | 1,155 | | | | 229 | | | | 982 | | | | 2,366 | | | | 2,514 | |
hidden losses (deferred write-downs) | | | –6,495 | | | | –280 | | | | –3,108 | | | | –9,883 | | | | –12,518 | |
| | | | | |
of which: | | | | | | | | | | | | | | | | | | | | |
hidden losses, ABS | | | | | | | | | | | | | | | 1,593 | | | | 2,207 | |
of which: | | | | | | | | | | | | | | | | | | | | |
hidden losses, PIIGS countries* | | | | | | | | | | | | | | | 6,379 | | | | 8,662 | |
of which: | | | | | | | | | | | | | | | | | | | | |
Portugal | | | | | | | | | | | | | | | 317 | | | | 394 | |
Ireland | | | | | | | | | | | | | | | 71 | | | | 156 | |
Italy | | | | | | | | | | | | | | | 5,369 | | | | 6,950 | |
Greece | | | | | | | | | | | | | | | 0 | | | | 0 | |
Spain | | | | | | | | | | | | | | | 622 | | | | 1,162 | |
| * | Issuer’s country of domicile |
The hidden losses from ABS as at 31 December 2013 in the amount of EUR 444 million include those losses attributable to risks related to the PIIGS countries (31 December 2012: EUR 718 million).
F-19
Shares in affiliated companies and other long-term equity investments
None of the other long-term equity investments and shares in affiliated companies held by FMS Wertmanagement are marketable.
| | | | | | | | |
Other long-term equity investments | | 31.12.2013
in € million | | | 31.12.2012
in € million | |
Book value | | | 7 | | | | 7 | |
Of which: other long-term equity investments in banks | | | 0 | | | | 0 | |
Of which: other long-term equity investments in financial services institutions | | | 0 | | | | 0 | |
| | | | | | | | |
Shares in affiliated companies | | 31.12.2013
in € million | | | 31.12.2012
in € million | |
Book value | | | 386 | | | | 381 | |
Of which: shares in affiliated companies (banks) | | | 0 | | | | 0 | |
Of which: shares in affiliated companies (financial services institutions) | | | 305 | | | | 318 | |
The shares in affiliated companies essentially concern Hypo Real Estate Capital Corp., New York, and WH-Erste Grundstücks GmbH & Co. KG, Schönefeld. The changes in fiscal year 2013 are mainly due to additions to shares in affiliated companies and countervailing currency effects.
Fiduciary assets
| | | | | | | | |
| | | 31.12.2013
in € million | | | 31.12.2012
in € million | |
Loans and advances to customers | | | 0.3 | | | | 0.3 | |
| | | | | | | | |
Total | | | 0.3 | | | | 0.3 | |
| | | | | | | | |
F-20
Changes in fixed assets
| | | | | | | | | | | | | | | | | | | | | | | | | | | | |
| | | | | | | | | | | | Depreciation / amortisation | | | | | | | |
in € million | | Cost
01.01.2013 | | | Additions
2013 | | | Disposals
2013 | | | Current year
2013 | | | Cumulative
31.12.2013 | | | Book value
31.12.2013 | | | Book value
31.12.2012 | |
Intangible fixed assets | | | 2.5 | | | | 11.7 | | | | 0 | | | | 2.5 | | | | 3.5 | | | | 10.7 | | | | 1.5 | |
Tangible fixed assets | | | 1.3 | | | | 0 | | | | 0 | | | | 0.2 | | | | 0.6 | �� | | | 0.7 | | | | 0.9 | |
| | | | | | | | | | | | | | | | |
Other long-term equity
investments | | | 7 | | | | 0* | | | | 7 | | | | 7 | |
Shares in affiliated companies | | | 381 | | | | 5* | | | | 386 | | | | 381 | |
Securities classified as
fixed assets | | | 104,368 | | | | –9,110* | | | | 95,258 | | | | 104,368 | |
| * | The option to combine items in accordance with Section 34 (3) Rechkredv was used. |
The intangible assets as at 31 December 2013 solely concern software licenses purchased for consideration.
The tangible fixed assets as at 31 December 2013 solely comprise operating and office equipment.
Other assets
The other assets of EUR 51 million recognised as at 31 December 2013 (31 December 2012: EUR 7,413 million) mainly include loans and advances to pbb from repayment claims arising from servicing.
At EUR 7,316 million, the comparative figure for 31 December 2012 included a receivable from the loss compensation claim against SoFFin that was repaid in full in the reporting year.
F-21
Prepaid expenses
Prepaid expenses are comprised of the following items:
| | | | | | | | |
| | | 31.12.2013
in € million | | | 31.12.2012
in € million | |
Unamortised cost of derivatives | | | 2,541 | | | | 3,505 | |
Lending business (premium from receivables) | | | 1,281 | | | | 1,264 | |
Issuing business / loans taken out | | | 111 | | | | 136 | |
Other | | | 7 | | | | 3 | |
| | | | | | | | |
Total | | | 3,940 | | | | 4,908 | |
| | | | | | | | |
Payments that FMS Wertmanagement has made for the fair values of derivatives accounted for by the transferors as at the transfer date are amortised on a pro rata basis. The portion not yet amortised mainly represents the amount recognised under “Unamortised cost of derivatives”.
The prepaid expenses from the lending business also include the deferred, unamortised payments that FMS Wertmanagement made for the hedge adjustments of the hedged items (loan receivables) that were transferred from HRE Group companies. These hedged items (receivables) were accounted for by the transferor in accordance with IFRSs, with the IFRS book value (including the IFRS hedge adjustment) constituting the transfer price.
The prepaid expenses are reversed proportionately over the remaining term of the respective underlying transactions.
Subordinated assets
The following items on the assets side of the balance sheet contain subordinated assets:
| | | | | | | | |
| | | 31.12.2013
in € million | | | 31.12.2012
in € million | |
Loans and advances to banks | | | 510 | | | | 510 | |
debt instruments | | | 43 | | | | 46 | |
| | | | | | | | |
Total | | | 553 | | | | 556 | |
| | | | | | | | |
F-22
Equity and liabilities
Liabilities to banks
| | | | | | | | |
| | | 31.12.2013
in € million | | | 31.12.2012
in € million | |
a) Payable on demand | | | 204 | | | | 1,276 | |
b) With agreed maturity or notice period | | | 21,633 | | | | 40,833 | |
| | | | | | | | |
Total | | | 21,837 | | | | 42,109 | |
| | | | | | | | |
The decrease in liabilities to banks is mainly attributable to repo transactions which, based on the nominal value, decreased by EUR 18,716 million.
The remaining maturities of the liabilities with agreed maturity or notice period as at 31 December 2013 are as follows:
| | | | | | | | |
| | | 31.12.2013
in € million | | | 31.12.2012
in € million | |
Up to three months | | | 10,052 | | | | 24,679 | |
More than three months and up to one year | | | 8,711 | | | | 14,084 | |
More than one year and up to five years | | | 820 | | | | 20 | |
More than five years | | | 2,050 | | | | 2,050 | |
| | | | | | | | |
Total | | | 21,633 | | | | 40,833 | |
| | | | | | | | |
Liabilities to customers
| | | | | | | | |
| | | 31.12.2013
in € million | | | 31.12.2012
in € million | |
a) Payable on demand | | | 53 | | | | 37 | |
b) With agreed maturity or notice period | | | 26,314 | | | | 37,390 | |
| | | | | | | | |
Total | | | 26,367 | | | | 37,427 | |
| | | | | | | | |
to affiliated companies | | | 363 | | | | 386 | |
to other long-term equity investments | | | 0 | | | | 0 | |
The decrease in liabilities to customers is due almost exclusively to repo transactions which, based on the nominal value, decreased by EUR 11,458 million.
The remaining maturities of the liabilities with agreed maturity or notice period as at 31 December 2013 are as follows:
| | | | | | | | |
| | | 31.12.2013
in € million | | | 31.12.2012
in € million | |
Up to three months | | | 13,063 | | | | 20,193 | |
More than three months and up to one year | | | 11,848 | | | | 15,795 | |
More than one year and up to five years | | | 46 | | | | 6 | |
More than five years | | | 1,357 | | | | 1,396 | |
| | | | | | | | |
Total | | | 26,314 | | | | 37,390 | |
| | | | | | | | |
F-23
Securitised liabilities
| | | | | | | | |
| | | 31.12.2013
in EUR Mio | | | 31.12.2012
in € million | |
Book value | | | 121,189 | | | | 147,234 | |
Of which: to affiliated companies | | | 0 | | | | 0 | |
Of which: to other long-term equity investments | | | 0 | | | | 0 | |
Amounts due in the following year | | | 65,291 | | | | 55,581 | |
The securitised liabilities comprise EUR 91,727 million (31 December 2012: EUR 117,326 million) in debt instruments issued, EUR 29,050 million (31 December 2012: EUR 29,529 million) in issuing activities (European Commercial Paper and Certificates of Deposit) and EUR 412 million (31 December 2012: EUR 379 million) in accrued interest.
Of the securitised liabilities issued, debt instruments including accrued interest amounting to EUR 35,660 million (31 December 2012: EUR 65,250 million) were bought back.
Fiduciary liabilities
| | | | | | | | |
| | | 31.12.2013
in € million | | | 31.12.2012
in € million | |
Liabilities to banks | | | 0.3 | | | | 0.3 | |
| | | | | | | | |
Total | | | 0.3 | | | | 0.3 | |
| | | | | | | | |
F-24
Other liabilities
Of the other liabilities of EUR 373 million (31 December 2012: EUR 751 million), EUR 326 million (31 December 2012: EUR 709 million) basically includes the balancing item for foreign currency translation of off-balance sheet transactions related to special coverage under Section 340h HGB.
Deferred income
Deferred income is comprised of the following items:
| | | | | | | | |
| | | 31.12.2013
in € million | | | 31.12.2012
in € million | |
Unamortised payments received for derivatives | | | 16,380 | | | | 17,278 | |
Lending business (discount on receivables) | | | 54 | | | | 82 | |
Other | | | 125 | | | | 146 | |
| | | | | | | | |
Total | | | 16,559 | | | | 17,506 | |
| | | | | | | | |
Payments that FMS Wertmanagement has received for the fair values of derivatives accounted for by the transferors as at the transfer date are amortised on a pro rata basis. The portion not yet amortised mainly represents the amount recognised under “Unamortised payments received for derivatives”, with the continuous amortisation of the item offset by countervailing effects. In connection with the acquisition of legal or beneficial ownership (asset upgrade) of risk positions transferred via guarantee in the past, the related derivatives were also taken over with a fair value of EUR 1.2 billion recognised by the transferor. This increased the unamortised purchase costs of derivatives.
Deferred income from the lending business also includes deferred payments received by FMS Wertmanagement for the hedge adjustments of the hedged items (receivables) taken over from HRE Group companies. These hedged items (receivables) were accounted for by the transferor in accordance with IFRSs, with the IFRS book value (including the IFRS hedge adjustment) constituting the transfer price.
The deferred income was reversed proportionately over the remaining term of the respective underlying transactions.
F-25
Provisions
| | | | | | | | | | | | | | | | | | | | | | | | |
in € million | | Balance
31.12.2012 | | | Addition | | | Disposal | | | FX effect /
Other | | | Utilisation | | | Balance
31.12.2013 | |
Tax provisions | | | 0 | | | | 34 | | | | 0 | | | | 0 | | | | 0 | | | | 34 | |
Other | | | 1,361 | | | | 408 | | | | 385 | | | | –24 | | | | 174 | | | | 1,186 | |
Expected losses | | | 1,283 | | | | 376 | | | | 381 | | | | –24 | | | | 111 | | | | 1,143 | |
Non-personnel and personnel expenses | | | 60 | | | | 24 | | | | 0 | | | | 0 | | | | 60 | | | | 24 | |
Other | | | 18 | | | | 8 | | | | 4 | | | | 0 | | | | 3 | | | | 19 | |
| | | | | | | | | | | | | | | | | | | | | | | | |
Total | | | 1,361 | | | | 442 | | | | 385 | | | | –24 | | | | 174 | | | | 1,220 | |
| | | | | | | | | | | | | | | | | | | | | | | | |
The additions to the provisions for expected losses essentially result from ineffective portions of hedging relationships and from the measurement of stand-alone derivatives as well as a portfolio of US CMBS financial instruments. The reversals of provisions mainly relate to stand-alone derivatives.
The addition to provisions for taxes is mainly related to corporate income and trade tax in the current fiscal year.
Deferred taxes
FMS Wertmanagement does not make use of the option to recognise surplus deferred tax assets resulting from tax benefits arising in accordance with Section 274 (1) Sentence 2 HGB. The surplus of deferred tax assets at 31 December 2013 stems from temporary differences between the financial statements and the tax base, especially with respect to loans and advances to banks, loans and advances to customers, debt instruments as well as provisions for expected losses and loss absorption.
Deferred taxes are calculated on the basis of the combined income tax rate of FMS Wertmanagement of currently 32.975%. The combined income tax rate comprises corporate income tax, trade tax and the solidarity surcharge. Deferred tax assets arose in the fiscal year that were not recognised.
F-26
Contingent liabilities
FMS Wertmanagement reports its potential liability under guarantees in the amount of EUR 8,115 million (31 December 2012: EUR 10,669 million) and under irrevocable loan commitments in the amount of EUR 5,953 million (31 December 2012: EUR 5,387 million).
The transfer to FMS Wertmanagement of risk positions entailed assuming their economic risk in the form of guarantees as defined in Section 8a (1) FMStFG. The total volume of guarantees as at 31 December 2013 was EUR 3,313 million (31 December 2012: EUR 5,128 million). In respect of transfer guarantees, the assets guaranteed are still accounted for by the holders, Depfa Bank plc and pbb. The guarantees are designed as abstract, directly enforceable, irrevocable, unconditional guarantees.
This item also includes EUR 3,949 million in obligations arising from credit default swaps (with third parties as contracting partners) (31 December 2012: EUR 4,290 million) with FMS Wertmanagement as the guarantor.
FMS Wertmanagement also fully refinanced the existing business of its subsidiaries Hypo Real Estate Capital Corp., New York, and Flint Nominees Ltd., London, guaranteeing and hence assuming the default risks arising from this business through credit derivatives (credit default swaps). The nominal volume of the credit default swaps as at 31 December 2013 less risk provisions was EUR 853 million (31 December 2012: EUR 1,251 million). The loans and advances to these affiliated companies are capitalised in the balance sheet. The credit default swaps do not present an additional credit risk. Any potential default of the loans and advances underlying these credit default swaps materialises only once.
Any imminent risk of being held liable under the guarantees (including the credit default swap positions) is assessed analogous to the risk provision policy for the customary credit business. The risk provisions set up are deducted from the guarantees recognised.
Irrevocable loan commitments include liquidity facilities in the amount of EUR 2,764 million (31 December 2012: EUR 4,552 million). Of this amount, EUR 2,673 million (31 December 2012: EUR 4,298 million) can be attributed to three liquidity facilities granted to Depfa Bank plc and pbb in connection with the assumption of the economic risk related to risk positions. Of the three aforementioned liquidity facilities for the benefit of Depfa Bank plc and pbb, two have a fixed ceiling. The third facility is for the benefit of Depfa Bank plc, which had been drawn down in full by 31 December 2013. This liquidity facility is a variable facility granted for the refinancing of certain risk exposures transferred via guarantees from Depfa Bank plc to FMS Wertmanagement as at 1 October 2010 and to finance cash collateral that Depfa Bank plc had to provide to its counterparties in the amount of the negative fair value of derivatives serving to hedge the cited risk exposures. As at 31 December 2013, this facility comprised an amount of EUR 0.5 billion serving to finance risk positions transferred via guarantees and the negative fair value of the associated hedging derivatives in the net amount of EUR 0.5 billion. This negative fair value of the hedging derivatives can change over time. The amount of the liquidity facility increases or decreases accordingly.
F-27
In connection with the agreement on this “Ersatzdeckungslösung” (substitute cover solution), FMS Wertmanagement pledged to pbb to pay out up to EUR 2,994 million to pbb on request. Equally, a disbursement would give rise to a claim of FMS Wertmanagement against pbb. In this respect, FMS Wertmanagement is exposed to a default risk vis-à-vis the counterparty pbb. For more information, please refer to the explanation under “Loans and receivables to banks”. This is offset primarily by a reduction in the irrevocable loan commitments to third parties of EUR 640 million, as well as the partial repayment of the liquidity facility with Depfa Bank plc in the amount of EUR 1,628 million.
Assets pledged as collateral
Apart from the securities sold under repurchase agreements as at 31 December 2013 (see the description under debt instruments) in the amount of EUR 36,858 million (31 December 2012: EUR 76,436 million), there are no other assets pledged as collateral for liabilities or contingent liabilities of FMS Wertmanagement.
Derivative financial instruments
FMS Wertmanagement holds only OTC derivatives; none of them are held for trading. The fair values of the derivatives are determined by means of standard measurement models based on the measurement parameters available in the market.
The table below shows the breakdown of FMS Wertmanagement’s interest-based and currency-based derivatives and the total return swaps:
| | | | | | | | | | | | | | | | | | | | |
| | | Nominal values | |
| | | Remaining maturities, 31.12.2013 | | | Total 31.12.2013 | | | Total 31.12.2012 | |
in € million | | < 1 | | | 1 – 5 | | | > 5 | | | |
Interest-based transactions | | | 49,265 | | | | 104,301 | | | | 93,097 | | | | 246,663 | | | | 267,844 | |
Total return swaps | | | 0 | | | | 17 | | | | 5,608 | | | | 5,625 | | | | 6,206 | |
| | | | | |
Currency-based transactions | | | 13,052 | | | | 4,121 | | | | 6,193 | | | | 23,366 | | | | 35,647 | |
Of which: forward exchange transactions | | | 10,821 | | | | 0 | | | | 0 | | | | 10,821 | | | | 16,935 | |
Of which: cross currency swaps | | | 2,231 | | | | 4,121 | | | | 6,193 | | | | 12,545 | | | | 18,712 | |
| | | | | | | | | | | | | | | | | | | | |
Total | | | 62,317 | | | | 108,439 | | | | 104,898 | | | | 275,654 | | | | 309,697 | |
| | | | | | | | | | | | | | | | | | | | |
F-28
The fair value of secured derivatives was determined in the reporting year for the first time on the basis of EONIA swap curves rather than the EURIBOR curves used in the past. In addition, credit value adjustments were included in the calculation of the fair values of the financial and credit derivatives for the first time. To improve comparability with the previous year, the fair value that would have been calculated using the old method is also listed in the table below.
| | | | | | | | | | | | | | | | | | | | | | | | |
in € million | | Market values | |
| | | 31.12.2013 | | | 31.12.2012 | |
| | | New method | | | Old method | | | | | | | |
| | | Positive | | | Negative | | | Positive | | | Negative | | | Positive | | | Negative | |
Interest-based transactions | | | 5,907 | | | | –28,081 | | | | 6,271 | | | | –27,451 | | | | 10,292 | | | | –36,216 | |
Total return swaps | | | 993 | | | | –922 | | | | 984 | | | | –912 | | | | 1,336 | | | | –1,296 | |
| | | | | | |
Currency-based transactions | | | 983 | | | | –728 | | | | 973 | | | | –719 | | | | 963 | | | | –1,190 | |
Of which: forward exchange transactions | | | 117 | | | | –125 | | | | 118 | | | | –125 | | | | 216 | | | | –241 | |
Of which: cross currency swaps | | | 866 | | | | –603 | | | | 855 | | | | –594 | | | | 747 | | | | –949 | |
| | | | | | | | | | | | | | | | | | | | | | | | |
Total | | | 7,883 | | | | –29,731 | | | | 8,228 | | | | –29,082 | | | | 12,591 | | | | –38,702 | |
| | | | | | | | | | | | | | | | | | | | | | | | |
The book value of these derivatives (net amount of the book values recognised in assets and liabilities) as at 31 December 2013 is EUR – 14,006 million (31 December 2012: EUR – 14,128 million).
The table below shows the breakdown of FMS Wertmanagement’s credit derivatives:
| | | | | | | | | | | | | | | | | | | | |
in € million | | 31.12.2013 | | | 31.12.2012 | |
| | | Nominal
values | | | Market values | | | Nominal
values | | | Market
values | |
| | | | | | New
method | | | Old
method | | | | | | | |
Secured party credit default swaps | | | 1,482 | | | | 143 | | | | 143 | | | | 3,173 | | | | 172 | |
Guarantor credit default swaps | | | 4,141 | | | | –102 | | | | –101 | | | | 4,575 | | | | –191 | |
| | | | | | | | | | | | | | | | | | | | |
Total | | | 5,623 | | | | 41 | | | | 42 | | | | 7,748 | | | | –19 | |
| | | | | | | | | | | | | | | | | | | | |
The table shows the credit derivatives vis-à-vis third parties. The book value of these derivatives (net amount of the book values recognised in assets and liabilities) as at 31 December 2013 is EUR 167 million (31 December 2012: EUR 355 million).
Credit default swap exposures vis-à-vis the subsidiaries of FMS Wertmanagement – Hypo Real Estate Capital Corp., New York, and Flint Nominees Ltd., London – have a nominal value of EUR 853 million after deducting existing provisions (EUR 33 million).
F-29
Hedges
In accordance with Section 254 HGB, FMS Wertmanagement aggregates hedged items and hedging instruments into hedges. FMS Wertmanagement utilises the net hedge presentation method to account for the hedges. In particular, the hedged risk concerns the interest rateinduced risk of changes in value (interest rate risk). Hedged items with a nominal value of EUR 112,633 million (31 December 2012: EUR 102,323 million) were aggregated into hedges. Overall, this nominal value of these hedged items is comprised as follows:
| | | | | | | | |
| | | 31.12.2013 | | | 31.12.2012 | |
Nominal values of the hedged items in € million | | in € million | | | in € million | |
Assets | | | 58,158 | | | | 61,716 | |
Liabilities | | | 48,697 | | | | 40,607 | |
| | | | | | | | |
Total | | | 106,855 | | | | 102,323 | |
| | | | | | | | |
Furthermore, hedged items with a nominal value of EUR 5,778 million (31 December 2012: EUR 6,415 million) were combined with total return swaps pursuant to IDW RS BFA 1.
The following overviews contain the maturities for assets and liabilities that are combined in hedges as at 31 December 2013 and whose countervailing changes in value or cash flows can be expected to balance in the future.
| | | | | | | | |
in € million | | 31.12.2013 | | | 31.12.2012 | |
Up to three months | | | 120 | | | | 348 | |
More than three months and up to one year | | | 873 | | | | 993 | |
More than one year and up to five years | | | 9,759 | | | | 9,183 | |
More than five years | | | 47,406 | | | | 51,192 | |
| | | | | | | | |
Assets | | | 58,158 | | | | 61,716 | |
| | | | | | | | |
| | | | | | | | |
in € million | | 31.12.2013 | | | 31.12.2012 | |
Up to three months | | | 395 | | | | 0 | |
More than three months and up to one year | | | 5,444 | | | | 73 | |
More than one year and up to five years | | | 29,260 | | | | 25,096 | |
More than five years | | | 13,598 | | | | 15,438 | |
| | | | | | | | |
Liabilities | | | 48,697 | | | | 40,607 | |
| | | | | | | | |
F-30
The net hedge presentation method does not require presentation of the positive and negative changes in value (expenses and income) of the hedged risk in a micro hedge. Were the gross hedge presentation method to be applied, cumulative expenses and income of EUR 7,784 million (31 December 2012: EUR 12,952 million) would arise on the basis of the current measurements.
The interest rate risk-related changes in value of the hedged items and hedging instruments arising from hedges with negative ineffectiveness (interest rate risk hedge) can be seen in the following overview:
| | | | | | | | |
31.12.2013 in € million | | Negative change in value
(absolute figure) | | | Positive change in value
(absolute figure) | |
hedged items | | | 919 | | | | 3,420 | |
hedging instruments | | | 3,633 | | | | 828 | |
| | | | | | | | |
Total | | | 4,552 | | | | 4,248 | |
| | | | | | | | |
Of which: not recognised | | | 4,248 | | | | 4,248 | |
Of which: recognised as a provision for expected losses | | | 304 | | | | 0 | |
FMS Wertmanagement took over a portfolio consisting of US CMBS financial instruments. The totality of the instruments defined for this portfolio constitutes a hedge pursuant to Section 254 HGB. This portfolio hedges default risks associated with US CMBSs (commercial real estate loans). Given their complex structures, some of the financial instruments contained in this portfolio are measured based on models. As a result of the continued poor market liquidity in the reporting period, near-market measurement remains inappropriate. Therefore, as in the previous year, FMS Wertmanagement continues to assess the value of the portfolio using the same valuation method. Based on the valuation that was performed, the hidden reserves related to this portfolio are EUR 95 million and the hidden losses EUR 194 million. A total of EUR 99 million in provisions for expected losses were recognised for this reason. The portfolio contains EUR 2,654 million in guarantor positions (“long-risk”), which are contrasted by EUR 1,115 million in leveraged secured party positions (“short-risk”).
Foreign-currency items
Total assets in foreign currencies are EUR 70,268 million (31 December 2012: EUR 80,850 million). Liabilities in foreign currencies at year end are EUR 71,215 million (31 December 2012: EUR 76,996 million).
F-31
NOTES TO THE INCOME STATEMENT
Net interest income
| | | | | | | | |
| | | 01.01. – 31.12.2013
in € million | | | 01.01. – 31.12.2012
in € million | |
Interest income | | | 8,657 | | | | 12,589 | |
Lending and money market transactions | | | 6,039 | | | | 9,065 | |
Fixed-income securities and debt claims | | | 2,618 | | | | 3,524 | |
| | |
Interest expenses | | | 8,031 | | | | 11,860 | |
Lending and money market transactions | | | 6,139 | | | | 9,216 | |
Securitised liabilities | | | 871 | | | | 1,278 | |
Loans taken out | | | 91 | | | | 76 | |
Other | | | 930 | | | | 1,290 | |
| | | | | | | | |
Total | | | 626 | | | | 729 | |
| | | | | | | | |
The interest income of EUR 5,094 million (previous year: EUR 7,506 million) includes interest from derivative financial instruments. Derivative financial instruments account for EUR 5,918 million (previous year: EUR 8,425 million) in interest expenses.
The decrease in interest income on the one hand and in interest expense on the other compared with the prior-year period can be attributed to the lower interest rates and the portfolio wind-up.
As previously, Western Europe, the United States and Japan account for most of the interest income.
Provisions with a remaining maturity of more than one year are not discounted for reasons of materiality.
F-32
Net commission income
| | | | | | | | |
| | | 01.01. – 31.12.2013
in € million | | | 01.01. – 31.12.2012
in € million | |
Commission income | | | 139 | | | | 143 | |
Lending business | | | 82 | | | | 76 | |
derivatives business | | | 57 | | | | 56 | |
Other | | | 0 | | | | 11 | |
| | |
Commission expenses | | | 39 | | | | 54 | |
derivatives business | | | 28 | | | | 43 | |
Securities and issuing business | | | 7 | | | | 8 | |
Other | | | 4 | | | | 3 | |
| | | | | | | | |
Total | | | 100 | | | | 89 | |
| | | | | | | | |
The commission income of EUR 139 million comprises commission income from the derivatives business (EUR 57 million), commission on guarantees (EUR 67 million) and processing fees received (EUR 15 million). The commission income from the lending business includes one-off effects of EUR 14 million in connection with a subsequent payment by pbb / Depfa Bank plc for risk positions transferred by guarantee.
The commission income is contrasted by EUR 39 million in commission expenses. These mainly result from expenses in the derivatives business stemming from the continuous amortisation of credit default swaps.
General and administrative expenses
| | | | | | | | |
| | | 01.01. – 31.12.2013
in € million | | | 01.01. – 31.12.2012
in € million | |
Personnel expenses | | | 25 | | | | 22 | |
Other administrative expenses | | | 309 | | | | 316 | |
| | | | | | | | |
Total | | | 334 | | | | 338 | |
| | | | | | | | |
The increase in personnel expenses can be explained by the year-on-year increase in the number of employees.
F-33
Other administrative expenses include expenses in the amount of EUR 159 million for nine months (previous year: EUR 214 million for twelve months) for servicing tasks related to FMS Wertmanagement’s operating activities transferred to the HRE Group based on the cooperation agreement.
Since 1 October 2013, key components of activities previously outsourced to the HRE Group have been performed by FMS Wertmanagement Servicegesellschaft. In addition, other service providers have been working for FMS Wertmanagement in defined capacities such as IT services or key areas of accounting. Including the service providers employed since 1 October, servicing expenses totalled EUR 194 million for the 2013 fiscal year as a whole (previous year: EUR 214 million).
Expenses of EUR 37 million were also incurred in the reporting year in connection with the spin-off and transfer of the IT systems from the HRE Group to IBM Deutschland GmbH (Ehningen). As regards other administrative expenses, these essentially comprise expenses for consulting services, particularly in connection with the transfer of servicing operations from the HRE Group to FMS Wertmanagement Servicegesellschaft, expenses for other projects and legal consulting costs.
Other operating income / other operating expenses
Other operating income of EUR 51 million includes the reversals of provisions, while other operating expenses of EUR 26 million principally comprise effects from currency translation in the amount of EUR 19 million.
Write-downs of and valuation allowances on
receivables and certain securities, and additions to loan loss provisions
The following income and expenses are reported in this income statement item:
| | | | | | | | |
| | | 01.01. – 31.12.2013
in € million | | | 01.01. – 31.12.2012
in € million | |
Net revaluation gain / loss in the lending business | | | –433 | | | | 31 | |
Net revaluation gain / loss from securities classified as current assets | | | –7 | | | | 1 | |
| | | | | | | | |
Total | | | –440 | | | | 32 | |
| | | | | | | | |
F-34
The net revaluation loss in the lending business resulted, among other things, from net additions to specific and general loan loss provisions of EUR 428 million, net additions to provisions for expected losses of EUR 20 million and direct write-downs of EUR 15 million.
The net revaluation loss from securities classified as current assets resulted from write-downs on own debt instruments of EUR 7 million.
The previous year’s comparative figures shown in the table are presented in the income statement under “Income from reversals of write-downs of receivables and certain securities and from the reversal of loan loss provisions”.
Write-downs of and valuation allowances on shares in affiliated companies, other long-term equity investments and securities
classified as fixed assets
FMS Wertmanagement avails itself of the options under Section 340c (2) HGB.
The following income and expenses recognised in connection with the debt instruments classified as fixed assets were recorded in this income statement item:
| | | | | | | | |
| | | 01.01. – 31.12.2013
in € million | | | 01.01. – 31.12.2012
in € million | |
Net revaluation gain / loss from securities | | | 113 | | | | –1 | |
Net revaluation gain / loss from derivatives | | | 7 | | | | –197 | |
Net gain / loss on sale of securities incl. net gain / loss from derivatives | | | 58 | | | | –267 | |
Other expenses | | | –1 | | | | 0 | |
| | | | | | | | |
Total | | | 177 | | | | –465 | |
| | | | | | | | |
The net revaluation gain on securities mainly resulted from a net reversal of specific loan loss provisions of EUR 92 million, a reversal of the general loan loss provision of EUR 27 million and a net addition to the country risk provisions of EUR 6 million.
The net revaluation gain on derivatives includes net reversals of provisions for expected losses for stand-alone derivatives (EUR 26 million) as well as net additions due to ineffective portions of hedges (EUR 19 million).
The net gain / loss on sale of securities including net gain / loss from derivatives primarily resulted from the sale of securities as well as repayments of securities in excess of the purchase cost.
F-35
Taxes on income
The income taxes mainly result from the addition to provisions for corporate income tax, the solidarity surcharge and trade tax in the current fiscal year.
Other taxes
The other taxes include value added tax refunds of FMS Wertmanagement from 2011 and 2012.
OTHER DISCLOSURES
Auditor’s fee
The auditor’s fee for auditing services during the reporting period was EUR 3.3 million (previous year: EUR 2.7 million). In addition, a total of EUR 0.1 million (previous year: EUR 0.0 million) were expended for tax consultancy services, EUR 0.2 million (previous year: EUR 1.0 million) for other confirmation and valuation services as well as EUR 0.0 million (previous year: EUR 0.6 million) for other services.
Of the total expenses recognised in the reporting year, EUR 0.2 million (previous year: EUR 0.3 million) are related to the previous year. Of this amount, EUR 0.2 million (previous year: EUR 0.3 million) concern auditing services and EUR 0.0 million (previous year: EUR 0.0 million) tax consultancy services.
Shareholdings
The following overview shows the shareholdings of FMS Wertmanagement, each of which is based on the company’s most recent annual financial statements.
Shares in affiliated companies at 31 December 2013:
| | | | | | | | | | | | | | | | | | | | |
Name and registered office | | Share in
capital | | | Of which:
indirectly | | | Equity
in thousand | | | Result
in thousand | | | Currency | |
Airen Sostenible S.L., Barakaldo6 | | | 66.67 | % | | | | | | | 3,063 | 7 | | | | | | | EUR | |
Awareness Capital S.L., Barakaldo6 | | | 66.67 | % | | | | | | | 27,001 | 7 | | | | | | | EUR | |
Flint Nominees Ltd., London | | | 100.00 | % | | | | | | | 51,447 | 1 | | | 294 | 2 | | | GBP | |
hypo Property Investment (1992) Ltd., London | | | 100.00 | % | | | 100.00 | % | | | 1 | 1 | | | 0 | 2 | | | GBP | |
hypo Property Investment Ltd., London | | | 100.00 | % | | | 100.00 | % | | | 286 | 1 | | | –0 | 2 | | | GBP | |
hypo Property Services Ltd., London | | | 100.00 | % | | | 100.00 | % | | | 114 | 1 | | | 1 | 2 | | | GBP | |
FMS Wertmanagement Service Gmbh, Munich | | | 100.00 | % | | | | | | | 25 | | | | 0 | 5 | | | EUR | |
Wh-Erste Grundstücks verwaltungs Gmbh, Schönefeld | | | 100.00 | % | | | | | | | 138 | 1 | | | –42 | 2 | | | EUR | |
Wh-Zweite Grundstücks verwaltungs Gmbh, Schönefeld | | | 100.00 | % | | | 100.00 | % | | | 70 | 1 | | | –10 | 2 | | | EUR | |
Wh-Erste Grundstücks Gmbh & Co. kG, Schönefeld | | | 93.98 | % | | | | | | | 72,510 | 1 | | | 964 | 2 | | | EUR | |
Wh-Zweite Grundstücks Gmbh & Co. kG, Schönefeld | | | 100.00 | % | | | 100.00 | % | | | 40,548 | 1 | | | –54 | 2 | | | EUR | |
hypo Real Estate Capital Corp., New york | | | 100.00 | % | | | | | | | 554,141 | 1 | | | 6,458 | 2 | | | USd | |
Liffey NSyC, LLC, Wilmington / delaware | | | 100.00 | % | | | 100.00 | % | | | 2,600 | 1 | | | 0 | 2 | | | USd | |
Upgrade 1 LLC, Wilmington / delaware | | | 100.00 | % | | | 100.00 | % | | | 24,571 | 3 | | | 4,871 | 4 | | | USd | |
Snowmass Bv Member LLC, dover / delaware | | | 100.00 | % | | | 100.00 | % | | | 44,810 | 3 | | | 10 | 4 | | | USd | |
hypo Real Estate Transactions S.A.S., Paris | | | 100.00 | % | | | | | | | 90 | 1 | | | –0 | 2 | | | EUR | |
| 6 | Entity founded in the 2013 fiscal year |
F-36
Other long-term equity investments at 31 December 2013:
| | | | | | | | | | | | | | | | | | | | |
Name and registered office | | Share in
capital | | | Of which:
indirectly | | | Equity
in thousand | | | Result
in thousand | | | Currency | |
Aerodrom Bureau verwaltungs Gmbh, Berlin | | | 32.00 | % | | | | | | | –685 | 3 | | | 9 | 4 | | | EUR | |
Airport Bureau verwaltungs Gmbh, Berlin | | | 32.00 | % | | | | | | | –266 | 3 | | | 137 | 4 | | | EUR | |
vierte Airport Bureau Center kG Airport Bureau verwaltungs Gmbh & Co., Berlin | | | 32.00 | % | | | | | | | –2,354 | 3 | | | –427 | 4 | | | EUR | |
Burleigh Court (Barnsley) Management Limited, London | | | 20.00 | % | | | 20.00 | % | | | 0 | 1 | | | 0 | 2 | | | GBP | |
Inula Grundstücks- verwaltungsgesellschaft mbh & Co. kG, Grünwald | | | 10.00 | % | | | | | | | –34,312 | 1 | | | 2,908 | 2 | | | EUR | |
Projektentwicklung Schönefeld verwaltungsgesellschaft mbh, Schönefeld | | | 50.00 | % | | | | | | | 28 | 1 | | | 0 | 2 | | | EUR | |
SP Projektentwicklung Schönefeld Gmbh & Co. kG, Schönefeld | | | 50.00 | % | | | | | | | 16,184 | 1 | | | 913 | 2 | | | EUR | |
Sealion (Isle of Man) Limited, Fort Anne, douglas / Isle of Man | | | 13.45 | % | | | | | | | n.a. | | | | n.a. | | | | GBP | |
South Bay Expressway LLC, delaware | | | 8.186 | % | | | 8.186 | % | | | 8,318 | 2 | | | n.a. | | | | USd | |
Snowmass Bv holdco LLC, dover / delaware | | | 50.00 | % | | | 50.00 | % | | | 8,387 | 1 | | | –13,727 | 2 | | | USd | |
F-37
Corporate bodies of FMS Wertmanagement
Members of the Executive Board
Dr. Christian Bluhm, Chief Risk & Financial Officer
Ernst-Albrecht Brockhaus, Treasury / Markets
Norbert Kickum, Commercial Real Estate
Members of the Supervisory Board
Jan Bettink (since 6 January 2014)
Chairman of the Supervisory Board (since 27 January 2014)
Chief Executive Officer of Berlin Hyp AG and President of the Association of German
Pfandbrief Banks
Klemens Breuer (since 6 January 2014)
Deputy chairman of the Supervisory Board (since 27 January 2014)
Member of the Management Board of Raiffeisen Bank International AG, Global Markets
Prof. Dr. Harald Wiedmann
Deputy chairman of the Supervisory Board (until 27 January 2014)
Lawyer, auditor and tax adviser
Dr. Christopher Pleister
Chairman of the Supervisory Board (from 11 July 2013 to 27 January 2014)
Chairman of the Steering Committee of the Federal Agency for Financial Market Stabilisation
Rita Geyermann
Director Loan Securitisation at KfW Bankengruppe
Dr. Andreas Ricker
Head of Strategy at Bundesrepublik Deutschland Finanzagentur GmbH
Members who left the Supervisory Board during the 2013 fiscal year
Dr. Karl Kauermann (until 10 July 2013)
Chairman of the Supervisory Board
Businessman
Dr. Eckart John von Freyend (until 10 July 2013)
Businessman
F-38
Loans to members of the corporate bodies
At the reporting date, there were no claims in respect of incumbent members of the corporate bodies arising from loans or advances.
Remuneration of the corporate bodies
The members of FMS Wertmanagement’s Executive Board were paid remuneration of EUR 1,378 thousand for the 2013 fiscal year (previous year: EUR 1,275 thousand). They were also paid benefits in kind of EUR 54 thousand (previous year: EUR 43 thousand). In addition, a total of EUR 675 thousand (previous year: EUR 675 thousand) were expended in the reporting period for the pension plans applicable to the members of the Executive Board.
Total remuneration of EUR 99 thousand was paid to the members of FMS Wertmanagement’s Supervisory Board for 2013 (previous year: EUR 120 thousand).
Annual average number of employees
At 31 December 2013, FMS Wertmanagement had 145 employees (previous year: 133). The average number of employees in the 2013 fiscal year was:
| | | | | | | | | | | | |
| | | Women | | | Men | | | Total | |
Full-time employees | | | 38 | | | | 103 | | | | 141 | |
Seats held by Executive Board members and employees
In the fiscal year, neither members of the Executive Board nor employees of FMS Wertmanagement held seats on a supervisory board or other supervisory bodies of large corporations in accordance with Section 340a (4) No. 1 in conjunction with Section 267 (3) HGB.
F-39
RESPONSIBILITY STATEMENT IN ACCORDANCE WITH S ECTION 264 (2)
SENTENCE 5 HGB AND SECTION 289 (1) SENTENCE 5 HGB
To the best of our knowledge, and in accordance with the applicable reporting principles, the annual financial statements give a true and fair view of the assets, liabilities, financial position and profit or loss of FMS Wertmanagement, and the management report includes a fair review of the development and performance of the business and the position of FMS Wertmanagement, together with a description of the material opportunities and risks associated with the expected development of FMS Wertmanagement.
Munich, 10 April 2014
FMS Wertmanagement
The Executive Board
| | | | |
 | |  | |  |
| Dr. Christian Bluhm | | Ernst-Albrecht Brockhaus | | Norbert Kickum |
F-40
AUDITORS’ REPORT
We have audited the annual financial statements – comprising the balance sheet, the income statement, the notes to the financial statements, the cash flow statement and the statement of changes in equity – together with the bookkeeping system and the management report of FMS Wertmanagement for the fiscal year from 1 January to 31 December 2013. The maintenance of the books and records and the preparation of the annual financial statements and the management report in accordance with German commercial law and supplementary provisions of FMS Wertmanagement’s Charter are the responsibility of the Executive Board of FMS Wertmanagement. Our responsibility is to express an opinion on the annual financial statements, together with the bookkeeping system, and the management report based on our audit.
We conducted our audit of the annual financial statements in accordance with Section 317 of the German Commercial Code (Handelsgesetzbuch – HGB) and the German generally accepted standards for the audit of financial statements promulgated by the Institut der Wirtschaftsprüfer (Institute of Public Auditors in Germany – IDW). Those standards require that we plan and perform the audit such that misstatements materially affecting the presentation of the net assets, financial position and results of operations in the annual financial statements in accordance with (German) principles of proper accounting and in the management report are detected with reasonable assurance. Knowledge of the business activities and the economic and legal environment of FMS Wertmanagement and expectations as to possible misstatements are taken into account in the determination of audit procedures. The effectiveness of the accounting-related internal control system and the evidence supporting the disclosures in the books and records, the annual financial statements and the management report are examined primarily on a test basis within the framework of the audit. The audit includes assessing the accounting principles used and significant estimates made by the Executive Board as well as evaluating the overall presentation of the annual financial statements and the management report. We believe that our audit provides a reasonable basis for our opinion.
Our audit has not led to any reservations.
In our opinion based on the findings of our audit, the annual financial statements comply with the legal requirements and supplementary provisions of FMS Wertmanagement’s Charter and give a true and fair view of the net assets, financial position and results of operations of FMS Wertmanagement in accordance with the (German) principles of proper accounting. The management report is consistent with the annual financial statements and on the whole provides a suitable understanding of FMS Wertmanagement’s position and suitably presents the opportunities and risks of future development.
Munich, 10 April 2014
PricewaterhouseCoopers
Aktiengesellschaft
Wirtschaftsprüfungsgesellschaft
| | |
| Heiko Röhrig | | ppa. Axel Menge |
| Wirtschaftsprüfer | | Wirtschaftsprüfer |
| [German Public Auditor] | | [German Public Auditor] |
F-41
ANNEX A
Schedule of Funded Debt Outstanding as of December 31, 2013
FMS-WM bearer bonds as of December 31, 2013 (excluding registered bonds)
| | | | | | | | | | | | | | | | |
Currency / ISIN | | Number of
issues /
coupon type | | Maturity | | Initial amount in
currency of
borrowing | | | Initial amount
equivalent € | | | Amount
outstanding
equivalent in € | |
| | | | | | | | | | (unaudited) | | | | |
| | | | | | | (in thousands) | | | (in thousands) | | | (in thousands) | |
EUR | | 54 | | | | | 69,976,000,000 | | | | 69,976,000,000 | | | | 74,271,000,000 | |
| | | | | | | | | | | | | | | | |
DE000A1E8SA4 | | floating | | October 15, 2015 | | | 5,000,000,000 | | | | 5,000,000,000 | | | | 5,000,000,000 | |
DE000A1E8SJ5 | | floating | | August 15, 2014 | | | 4,000,000,000 | | | | 4,000,000,000 | | | | 4,000,000,000 | |
DE000A1H3DB2 | | floating | | January 20, 2021 | | | 100,000,000 | | | | 100,000,000 | | | | 100,000,000 | |
DE000A1H3DC0 | | floating | | January 20, 2014 | | | 500,000,000 | | | | 500,000,000 | | | | 570,000,000 | |
DE000A1H3DE6 | | floating | | February 16, 2021 | | | 50,000,000 | | | | 50,000,000 | | | | 50,000,000 | |
DE000A1H3DF3 | | floating | | February 15, 2016 | | | 100,000,000 | | | | 100,000,000 | | | | 100,000,000 | |
DE000A1H3DG1 | | floating | | February 18, 2015 | | | 250,000,000 | | | | 250,000,000 | | | | 250,000,000 | |
DE000A1H3DH9 | | floating | | March 15, 2018 | | | 25,000,000 | | | | 25,000,000 | | | | 25,000,000 | |
DE000A1H3DM9 | | floating | | October 15, 2014 | | | 1,500,000,000 | | | | 1,500,000,000 | | | | 1,500,000,000 | |
DE000A1H3DQ0 | | floating | | April 6, 2021 | | | 500,000,000 | | | | 500,000,000 | | | | 500,000,000 | |
DE000A1K0ET3 | | floating | | August 1, 2021 | | | 60,000,000 | | | | 60,000,000 | | | | 60,000,000 | |
DE000A1K0GG5 | | fixed | | August 3, 2018 | | | 1,500,000,000 | | | | 1,500,000,000 | | | | 1,500,000,000 | |
DE000A1K0KM5 | | fixed | | July 14, 2014 | | | 3,000,000,000 | | | | 3,000,000,000 | | | | 3,000,000,000 | |
DE000A1K0M44 | | fixed | | August 24, 2015 | | | 1,500,000,000 | | | | 1,500,000,000 | | | | 1,500,000,000 | |
DE000A1K0SM8 | | fixed | | September 8, 2021 | | | 1,500,000,000 | | | | 1,500,000,000 | | | | 3,000,000,000 | |
DE000A1K0TR5 | | floating | | August 29, 2014 | | | 50,000,000 | | | | 50,000,000 | | | | 100,000,000 | |
DE000A1KQ0U0 | | fixed | | December 15, 2014 | | | 1,000,000,000 | | | | 1,000,000,000 | | | | 1,500,000,000 | |
DE000A1KQ763 | | floating | | January 19, 2014 | | | 5,000,000,000 | | | | 5,000,000,000 | | | | 5,000,000,000 | |
DE000A1KQ789 | | fixed | | January 25, 2017 | | | 200,000,000 | | | | 200,000,000 | | | | 200,000,000 | |
DE000A1KQ7V3 | | floating | | October 24, 2014 | | | 500,000,000 | | | | 500,000,000 | | | | 500,000,000 | |
DE000A1KQ7Z4 | | floating | | November 21, 2014 | | | 5,000,000,000 | | | | 5,000,000,000 | | | | 5,000,000,000 | |
DE000A1KQ8A5 | | floating | | January 27, 2015 | | | 50,000,000 | | | | 50,000,000 | | | | 50,000,000 | |
DE000A1KQ8B3 | | floating | | February 2, 2015 | | | 1,250,000,000 | | | | 1,250,000,000 | | | | 1,500,000,000 | |
DE000A1KQ961 | | fixed | | June 17, 2021 | | | 1,000,000,000 | | | | 1,000,000,000 | | | | 1,000,000,000 | |
DE000A1KQZ44 | | fixed | | May 24, 2016 | | | 6,000,000 | | | | 6,000,000 | | | | 6,000,000 | |
DE000A1KRG61 | | fixed | | May 17, 2021 | | | 10,000,000 | | | | 10,000,000 | | | | 10,000,000 | |
DE000A1KRHP2 | | fixed | | June 3, 2016 | | | 3,000,000,000 | | | | 3,000,000,000 | | | | 3,000,000,000 | |
DE000A1MA9A9 | | fixed | | January 16, 2015 | | | 3,000,000,000 | | | | 3,000,000,000 | | | | 3,000,000,000 | |
DE000A1MBBK6 | | fixed | | January 18, 2017 | | | 100,000,000 | | | | 100,000,000 | | | | 100,000,000 | |
DE000A1MLU18 | | fixed | | February 22, 2017 | | | 3,000,000,000 | | | | 3,000,000,000 | | | | 3,000,000,000 | |
DE000A1MLU59 | | fixed | | May 23, 2018 | | | 250,000,000 | | | | 250,000,000 | | | | 250,000,000 | |
DE000A1MLU67 | | fixed | | March 15, 2016 | | | 1,500,000,000 | | | | 1,500,000,000 | | | | 1,500,000,000 | |
DE000A1MLVC0 | | floating | | April 28, 2014 | | | 6,000,000,000 | | | | 6,000,000,000 | | | | 6,000,000,000 | |
DE000A1MLVD8 | | fixed | | May 9, 2019 | | | 3,000,000,000 | | | | 3,000,000,000 | | | | 3,000,000,000 | |
DE000A1PGP19 | | fixed | | July 18, 2017 | | | 2,500,000,000 | | | | 2,500,000,000 | | | | 3,000,000,000 | |
DE000A1PGP76 | | floating | | October 24, 2019 | | | 100,000,000 | | | | 100,000,000 | | | | 100,000,000 | |
DE000A1PGP84 | | fixed | | September 15, 2021 | | | 10,000,000 | | | | 10,000,000 | | | | 10,000,000 | |
DE000A1PGP92 | | fixed | | August 15, 2022 | | | 10,000,000 | | | | 10,000,000 | | | | 10,000,000 | |
DE000A1PGPX1 | | fixed | | October 1, 2015 | | | 1,000,000,000 | | | | 1,000,000,000 | | | | 1,250,000,000 | |
DE000A1PGQC3 | | floating | | August 16, 2016 | | | 100,000,000 | | | | 100,000,000 | | | | 100,000,000 | |
DE000A1R0YH9 | | floating | | July 21, 2014 | | | 2,750,000,000 | | | | 2,750,000,000 | | | | 2,750,000,000 | |
DE000A1R0YX6 | | floating | | September 15, 2015 | | | 2,000,000,000 | | | | 2,000,000,000 | | | | 2,000,000,000 | |
DE000A1REUB8 | | fixed | | January 15, 2020 | | | 2,500,000,000 | | | | 2,500,000,000 | | | | 2,500,000,000 | |
DE000A1REUK9 | | floating | | November 15, 2022 | | | 20,000,000 | | | | 20,000,000 | | | | 20,000,000 | |
DE000A1REUS2 | | floating | | January 23, 2018 | | | 250,000,000 | | | | 250,000,000 | | | | 250,000,000 | |
DE000A1REUT0 | | fixed | | May 22, 2015 | | | 500,000,000 | | | | 500,000,000 | | | | 1,150,000,000 | |
DE000A1X3FE1 | | floating | | June 15, 2015 | | | 2,000,000,000 | | | | 2,000,000,000 | | | | 2,000,000,000 | |
A-1
| | | | | | | | | | | | | | | | |
Currency / ISIN | | Number of
issues /
coupon type | | Maturity | | Initial amount in
currency of
borrowing | | | Initial amount
equivalent € | | | Amount
outstanding
equivalent in € | |
| | | | | | | | | | (unaudited) | | | | |
| | | | | | | (in thousands) | | | (in thousands) | | | (in thousands) | |
XS0725294218 | | fixed | | December 28, 2018 | | | 25,000,000 | | | | 25,000,000 | | | | 25,000,000 | |
XS0734340093 | | floating | | January 20, 2014 | | | 1,500,000,000 | | | | 1,500,000,000 | | | | 1,500,000,000 | |
XS0843518738 | | floating | | October 18, 2017 | | | 150,000,000 | | | | 150,000,000 | | | | 175,000,000 | |
XS0856697536 | | floating | | November 20, 2018 | | | 50,000,000 | | | | 50,000,000 | | | | 50,000,000 | |
XS0924158990 | | floating | | May 7, 2015 | | | 10,000,000 | | | | 10,000,000 | | | | 10,000,000 | |
XS0963874234 | | fixed | | September 3, 2018 | | | 500,000,000 | | | | 500,000,000 | | | | 1,000,000,000 | |
XS0993452688 | | fixed | | November 14, 2016 | | | 500,000,000 | | | | 500,000,000 | | | | 500,000,000 | |
| | | | | |
USD | | 13 | | | | | 10,977,000,000 | | | | 7,959,538,830 | | | | 9,699,804,220 | |
| | | | | | | | | | | | | | | | |
DE000A1MLU91 | | floating | | April 1, 2014 | | | 300,000,000 | | | | 217,533,174 | | | | 543,832,935 | |
US30254WAA71 | | fixed | | November 21, 2017 | | | 2,000,000,000 | | | | 1,450,221,159 | | | | 1,450,221,159 | |
US30254WAB54 | | fixed | | April 18, 2016 | | | 2,000,000,000 | | | | 1,450,221,159 | | | | 1,450,221,159 | |
US30254WAC38 | | fixed | | October 14, 2016 | | | 1,500,000,000 | | | | 1,087,665,869 | | | | 1,087,665,869 | |
US30254WAD11 | | fixed | | November 20, 2018 | | | 2,000,000,000 | | | | 1,450,221,159 | | | | 1,450,221,159 | |
XS0636310277 | | floating | | June 10, 2014 | | | 100,000,000 | | | | 72,511,058 | | | | 72,511,058 | |
XS0803737088 | | floating | | June 30, 2015 | | | 750,000,000 | | | | 543,832,935 | | | | 1,087,665,869 | |
XS0807718357 | | floating | | July 24, 2017 | | | 7,000,000 | | | | 5,075,774 | | | | 5,075,774 | |
XS0808559404 | | floating | | July 23, 2014 | | | 20,000,000 | | | | 14,502,212 | | | | 14,502,212 | |
XS0819133231 | | floating | | September 1, 2015 | | | 500,000,000 | | | | 362,555,290 | | | | 543,832,935 | |
XS0875634213 | | floating | | January 26, 2015 | | | 750,000,000 | | | | 543,832,935 | | | | 725,110,579 | |
XS0948050231 | | floating | | September 27, 2016 | | | 300,000,000 | | | | 217,533,174 | | | | 725,110,579 | |
XS0957674194 | | floating | | August 6, 2015 | | | 750,000,000 | | | | 543,832,935 | | | | 543,832,935 | |
| | | | | |
GBP | | 9 | | | | | 2,972,000,000 | | | | 3,564,831,474 | | | | 5,004,198,153 | |
| | | | | | | | | | | | | | | | |
DE000A1H3DJ5 | | fixed | | March 1, 2016 | | | 22,000,000 | | | | 26,388,389 | | | | 26,388,389 | |
DE000A1K0DZ2 | | floating | | June 16, 2014 | | | 250,000,000 | | | | 299,868,058 | | | | 659,709,728 | |
DE000A1REUM5 | | floating | | May 15, 2014 | | | 500,000,000 | | | | 599,736,116 | | | | 599,736,116 | |
DE000A1REUN3 | | floating | | November 17, 2014 | | | 600,000,000 | | | | 719,683,339 | | | | 719,683,339 | |
XS0775390189 | | fixed | | December 8, 2014 | | | 300,000,000 | | | | 359,841,670 | | | | 599,736,116 | |
XS0807698815 | | fixed | | December 1, 2015 | | | 500,000,000 | | | | 599,736,116 | | | | 1,079,525,009 | |
XS0811901866 | | floating | | August 3, 2015 | | | 350,000,000 | | | | 419,815,281 | | | | 719,683,339 | |
XS0876116988 | | floating | | July 17, 2014 | | | 200,000,000 | | | | 239,894,446 | | | | 239,894,446 | |
XS0922187678 | | fixed | | December 15, 2017 | | | 250,000,000 | | | | 299,868,058 | | | | 359,841,670 | |
| | | | | |
SEK | | 10 | | | | | 13,580,000,000 | | | | 1,532,887,088 | | | | 1,648,022,937 | |
| | | | | | | | | | | | | | | | |
XS0633543508 | | fixed | | August 12, 2017 | | | 1,000,000,000 | | | | 112,878,283 | | | | 169,317,425 | |
XS0669208448 | | fixed | | August 26, 2014 | | | 500,000,000 | | | | 56,439,142 | | | | 56,439,142 | |
XS0676308405 | | floating | | September 15, 2014 | | | 550,000,000 | | | | 62,083,056 | | | | 62,083,056 | |
XS0683079023 | | floating | | March 27, 2015 | | | 330,000,000 | | | | 37,249,834 | | | | 56,439,142 | |
XS0728930776 | | floating | | July 13, 2014 | | | 500,000,000 | | | | 56,439,142 | | | | 56,439,142 | |
XS0742686685 | | fixed | | February 13, 2014 | | | 3,500,000,000 | | | | 395,073,992 | | | | 395,073,992 | |
XS0743467408 | | floating | | February 8, 2016 | | | 300,000,000 | | | | 33,863,485 | | | | 73,370,884 | |
XS0782368681 | | fixed | | June 1, 2022 | | | 1,400,000,000 | | | | 158,029,597 | | | | 158,029,597 | |
XS0803736510 | | fixed | | March 12, 2019 | | | 3,500,000,000 | | | | 395,073,992 | | | | 395,073,992 | |
XS0804345964 | | floating | | July 18, 2014 | | | 2,000,000,000 | | | | 225,756,567 | | | | 225,756,567 | |
| | | | | |
AUD | | 2 | | | | | 750,000,000 | | | | 486,286,715 | | | | 486,286,715 | |
| | | | | | | | | | | | | | | | |
AU3CB0191476 | | fixed | | March 20, 2017 | | | 500,000,000 | | | | 324,191,143 | | | | 324,191,143 | |
AU3CB0197168 | | fixed | | July 27, 2015 | | | 250,000,000 | | | | 162,095,572 | | | | 162,095,572 | |
| | | | | |
CAD | | 1 | | | | | 500,000,000 | | | | 340,808,398 | | | | 340,808,398 | |
| | | | | | | | | | | | | | | | |
XS0915510712 | | floating | | April 15, 2016 | | | 500,000,000 | | | | 340,808,398 | | | | 340,808,398 | |
| | | | | |
CHF | | 1 | | | | | 200,000,000 | | | | 162,919,518 | | | | 162,919,518 | |
| | | | | | | | | | | | | | | | |
CH0147638743 | | floating | | January 30, 2014 | | | 200,000,000 | | | | 162,919,518 | | | | 162,919,518 | |
| | | | | |
NOK | | 2 | | | | | 750,000,000 | | | | 89,680,737 | | | | 113,595,600 | |
| | | | | | | | | | | | | | | | |
XS0644078486 | | fixed | | July 5, 2021 | | | 500,000,000 | | | | 59,787,158 | | | | 83,702,021 | |
XS0690541296 | | fixed | | October 14, 2016 | | | 250,000,000 | | | | 29,893,579 | | | | 29,893,579 | |
| | | | | |
Sum | | 92 | | | | | n.a. | | | | 84,112,952,758 | | | | 91,726,635,539 | |
| | | | | | | | | | | | | | | | |
A-2
THE FEDERAL REPUBLIC OF GERMANY
GENERAL
Area, Location and Population

The Federal Republic is situated in central Europe and comprises an area of approximately 357,000 square kilometers (about 138,000 square miles). Its total population is estimated to have been approximately 80.8 million at the end of 2013 compared to 80.5 million people at the beginning of 2013. This was a year-on-year population increase for the third year in a row. The increase was again due to Germany’s migration surplus, which more than offset the birth deficit (i.e., the difference between births and deaths). In 2011, approximately 16% of the total population was concentrated in metropolitan areas with more than 500,000 inhabitants; the largest of these areas were (in descending order) Berlin, Hamburg, Munich, Cologne and Frankfurt am Main.
Sources: Statistisches Bundesamt, Statistisches Jahrbuch 2013, Tables 1.1.2, 2.1.9; Statistisches Bundesamt, Increase in Population expected again for 2013, press release of January 8, 2014 (https://www.destatis.de/EN/PressServices/Press/pr/2014/01/PE14_007_12411.html).
G-1
The following table shows selected key demographic figures for the Federal Republic for 2008 to 2012.
POPULATION
| | | | | | | | | | | | | | | | | | | | | | | | | |
| | | 2012 (1) | | 2011 (1) | | 2010 (2) | | 2009 (2) | | 2008 (2) |
| | | (number of persons) |
Total population | | | | 80,523,746 | | | | | 80,327,900 | | | | | 81,751,602 | | | | | 81,802,257 | | | | | 82,002,356 | |
| |
Age distribution | | | | (percent of total population) | |
Under 20 | | | | 18.2 | | | | | 18.4 | | | | | 18.4 | | | | | 18.8 | | | | | 19.0 | |
20-40 | | | | 23.9 | | | | | 23.9 | | | | | 24.2 | | | | | 24.3 | | | | | 24.6 | |
40-60 | | | | 31.0 | | | | | 31.1 | | | | | 31.1 | | | | | 31.0 | | | | | 30.8 | |
60-80 | | | | 21.5 | | | | | 21.3 | | | | | 21.0 | | | | | 20.8 | | | | | 20.6 | |
80 and more | | | | 5.4 | | | | | 5.3 | | | | | 5.3 | | | | | 5.1 | | | | | 5.0 | |
| |
Growth rate | | | | (percent change on the previous year) | |
Total population | | | | 0.2 | | | | | — | | | | | -0.1 | | | | | -0.2 | | | | | -0.3 | |
Under 20 | | | | -0.6 | | | | | — | | | | | -1.7 | | | | | -1.8 | | | | | -1.9 | |
20-40 | | | | 0.4 | | | | | — | | | | | -0.7 | | | | | -1.5 | | | | | -1.8 | |
40-60 | | | | -0.2 | | | | | — | | | | | 0.2 | | | | | 0.6 | | | | | 1.1 | |
60-80 | | | | 1.2 | | | | | — | | | | | 0.9 | | | | | 0.8 | | | | | 0.3 | |
80 and more | | | | 1.3 | | | | | — | | | | | 3.0 | | | | | 2.9 | | | | | 3.4 | |
| (1) | Population based on data from the 2011 Census (preliminary results of April 10, 2014). |
| (2) | Population based on former censuses. |
Sources: Statistisches Bundesamt, Population, Current Population, Population by age groups, Germany, Value (https://www.destatis.de/EN/FactsFigures/SocietyState/Population/CurrentPopulation/Tables_/lrbev01.html?cms_gtp=150344_list%253D1&https=1); Statistisches Bundesamt, Population, Current Population, Population by age groups, Germany, Change on the previous year (https://www.destatis.de/EN/FactsFigures/SocietyState/Population/CurrentPopulation/Tables_/lrbev01.html?cms_gtp=150344_list%253D2&https=1).
With the publication of the first census results for reference date May 9, 2011 (“2011 Census”), on May 31, 2013, a new basis was provided for intercensal population updates. Compared with the number of inhabitants previously applicable on the basis of official intercensal population updates, there were approximately 1.5 million fewer inhabitants in Germany at the 2011 Census reference date than previously assumed. The population data previously provided for 2011 and 2012 were intercensal estimates based on the population census of 1987 (in western Germany) and on an extract from the Central Population Register of the former GDR of October 3, 1990 (in eastern Germany). These data have been revised, taking account of the 2011 Census results and the subsequent recalculation of population data for 2011.
Sources: Statistisches Bundesamt, State & Society, Current Population based on the 2011 Census (https://www.destatis.de/EN/FactsFigures/SocietyState/Population/CurrentPopulation/CurrentCensus.html); Statistisches Bundesamt, 2011 Census: 80.2 million inhabitants lived in Germany on 9 May 2011, press release of May 31, 2013 (https://www.destatis.de/EN/PressServices/Press/pr/2013/05/PE13_188_121.html).
Notwithstanding the small population increase in recent years due to net immigration, the German population is poised for a decline due to the gradual aging of its population. These developments are expected to continue and intensify over the next several decades and may result in a downward pressure on Germany’s growth potential in the long term.
Source: Statistisches Bundesamt, Germany’s Population by 2060 – Results of the 12th coordinated population projection (https://www.destatis.de/EN/Publications/Specialized/Population/GermanyPopulation2060.pdf?__blob=publicationFile).
Government
The Federal Republic is a federated republic whose constitution is codified in the Grundgesetz of 1949. The capital of the Federal Republic is Berlin. The Federal Republic consists of 16 federal states (Länder). The Länder have legislative sovereignty over matters not expressly reserved to the legislative, executive and judicial bodies of the Federal Republic.
The Grundgesetz provides for a Federal President (Bundespräsident), two Houses of Parliament (the Bundestag and the Bundesrat, which consists of representatives of the 16 Länder governments), a Chancellor (Bundeskanzler) and a Federal Constitutional Court (Bundesverfassungsgericht). The Chancellor heads the Federal Government (Bundesregierung), consisting of the Chancellor and the Federal Ministers. The Bundespräsident acts as head of state.
G-2
General elections for the Bundestag are generally held every four years on the basis of an electoral system of proportional representation. The last general election was held on September 22, 2013. It is expected that the next general election will be held in September 2017.
A political party is not entitled to party representation in the Bundestag unless it receives at least 5% of the votes cast or three direct mandates in a general election. The Chancellor is elected by and is responsible to the Bundestag.
Political Parties
The political parties currently represented in the Bundestag are the Christian Democratic Union (CDU) and its Bavarian sister party, the Christian Social Union (CSU), the Social Democratic Party (SPD), the Left-Wing Party (Die Linke, founded in 2007 by the merger of the Left-Wing Party of Democratic Socialism (Linkspartei.PDS) and the party Labor and Social Justice - The Election Alternative (WASG)) and the Greens (Bündnis 90/Die Grünen).
Since 1949, the Federal Republic has been governed by eight Chancellors over 18 electoral periods. The most recent general election, held in September 2013, resulted in a coalition between the Christian Democrats (CDU/CSU) and the Social Democratic Party (SPD), led by Chancellor Dr Angela Merkel (CDU). Dr Merkel has been serving as Chancellor since 2005.
Sources: The Federal Returning Officer, Official final result of the 2013 Bundestag Election, press release of October 9, 2013 (http://www.bundeswahlleiter.de/en/bundestagswahlen/BTW_BUND_13/presse/034w13_Endgueltiges_amtliches_Ergebnis.html); Shaping Germany’s Future. Coalition Agreement between CDU, CSU and SPD (https://www.cdu.de/sites/default/files/media/dokumente/koalitionsvertrag.pdf).
The following table shows the results of the five most recent general elections for the Bundestag.
ELECTION RESULTSTOTHE GERMAN BUNDESTAG
| | | | | | | | | | | | | | | | | | | | | | | | | | | | | | | | | | | | | | | | | | | | | | | | | | |
| | | 2013 Elections | | 2009 Elections | | 2005 Elections | | 2002 Elections | | 1998 Elections |
| | | % of
Votes | | Seats | | % of
Votes | | Seats | | % of
Votes | | Seats | | % of
Votes | | Seats | | % of
Votes | | Seats |
| | | | | | | | | | |
CDU/CSU | | | | 41.5 | | | | | 311 | | | | | 33.8 | | | | | 239 | | | | | 35.2 | | | | | 226 | | | | | 38.5 | | | | | 248 | | | | | 35.1 | | | | | 245 | |
SPD | | | | 25.7 | | | | | 193 | | | | | 23.0 | | | | | 146 | | | | | 34.2 | | | | | 222 | | | | | 38.5 | | | | | 251 | | | | | 40.9 | | | | | 298 | |
Die Linke. (1) | | | | 8.6 | | | | | 64 | | | | | 11.9 | | | | | 76 | | | | | 8.7 | | | | | 54 | | | | | 4.0 | | | | | 2 | | | | | 5.1 | | | | | 36 | |
Bündnis 90/Die Grünen | | | | 8.4 | | | | | 63 | | | | | 10.7 | | | | | 68 | | | | | 8.1 | | | | | 51 | | | | | 8.6 | | | | | 55 | | | | | 6.7 | | | | | 47 | |
FDP | | | | 4.8 | | | | | — | | | | | 14.6 | | | | | 93 | | | | | 9.8 | | | | | 61 | | | | | 7.4 | | | | | 47 | | | | | 6.2 | | | | | 43 | |
Others | | | | 10.9 | | | | | — | | | | | 6.0 | | | | | — | | | | | 3.9 | | | | | — | | | | | 3.0 | | | | | — | | | | | 5.9 | | | | | — | |
| | | | | | | | | | | | | | | | | | | | | | | | | | | | | | | | | | | | | | | | | | | | | | | | | | |
Total | | | | | | | | | 631 | | | | | | | | | | 622 | | | | | | | | | | 614 | | | | | | | | | | 603 | | | | | | | | | | 669 | |
| | | | | | | | | | | | | | | | | | | | | | | | | | | | | | | | | | | | | | | | | | | | | | | | | | |
| (1) | Results for the Party of Democratic Socialism (PDS) for all elections prior to 2005. |
Sources: Statistisches Bundesamt, Statistisches Jahrbuch 2013, Tables 10.1.1 and 10.1.2; Statistisches Bundesamt, Statistisches Jahrbuch 2011, Tables 4.3.1, 4.3.2 and 4.6; The Federal Returning Officer, Official final result of the 2013 Bundestag Election, press release of October 9, 2013 (http://www.bundeswahlleiter.de/en/bundestagswahlen/BTW_BUND_13/presse/034w13_Endgueltiges_amtliches_Ergebnis.html).
International Organizations
In addition to the European Union (“EU”), the Federal Republic is a member of various major multilateral institutions, including the United Nations, the International Monetary Fund (“IMF”), the International Bank for Reconstruction and Development and the International Development Association, the Council of Europe, the Organization for Economic Cooperation and Development and the North Atlantic Treaty Organization. In addition, the Federal Republic is a signatory to the General Agreement on Tariffs and Trade and a member of the World Trade Organization. It is also a shareholder of, among others, the European Investment Bank, the European Bank for Reconstruction and Development, and the European Atomic Energy Community.
The European Union and European Integration
The Federal Republic was a founding member of the European Coal and Steel Community in 1951, which later developed into the European Union. Today, the Federal Republic is one of 28 member states of the EU (the “Member States”). On July 1, 2013, Croatia became part of the EU, joining the EU’s previous members Austria, Belgium, Bulgaria, Cyprus, the Czech Republic, Denmark, Estonia, Finland, France, Germany, Greece, Hungary, Ireland, Italy, Latvia, Lithuania, Luxembourg, Malta, the Netherlands, Poland, Portugal, Romania, the Slovak Republic, Slovenia, Spain, Sweden and the United Kingdom. According to provisional data, the
G-3
aggregate population of the Member States was approximately 505 million as of January 1, 2013. The EU is still in the process of enlargement. Formal membership negotiations have been opened with Turkey, Iceland, Montenegro and Serbia. Former Yugoslav Republic of Macedonia has been granted candidate status. Albania, Bosnia and Herzegovina, and Kosovo are potential candidates.
Sources: Europa.eu, The history of the European Union (http://europa.eu/about-eu/eu-history/index_en.htm); Europa.eu, 2000-2009: Further expansion (http://europa.eu/about-eu/eu-history/2000-2009/index_en.htm); Europa.eu, 2010-today: A decade of opportunities and challenges, 2013 (http://europa.eu/about-eu/eu-history/2010-today/2013/index_en.htm); Statistical Office of the European Communities, Total population (http://epp.eurostat.ec.europa.eu/tgm/table.do?tab=table&language=en&pcode=tps00001&tableSelection=1&footnotes=yes&labeling=labels&plugin=1); Europa.eu, Enlargement, Countries preparing to join, Check current status (http://ec.europa.eu/enlargement/countries/check-current-status/index_en.htm); Europa.eu, Enlargement, Countries preparing to join, Serbia (http://ec.europa.eu/enlargement/countries/detailed-country-information/serbia/index_en.htm).
Economic Integration
From its inception, the EU has had the fundamental objective, in line with its predecessors, of economic integration of its Member States. Culminating a long process, a single market that provides for the free movement of goods and services, persons and capital among the Member States was established as of January 1, 1993. The integration of the Member States’ economies and the completion of a single market are also promoted by a European competition policy, which aims at creating a level playing field for Member States’ companies, thereby promoting economic efficiency, and by a European consumer policy. In addition, various liberalization and harmonization measures are being implemented, for example in the telecommunication and energy sectors. In the financial sector, the single market has been fostered by providing for the free movement of capital and the freedom to perform banking services throughout the EU under the “single passport,” which enables financial institutions to provide financial services throughout the EU based on a single license obtained in one Member State. The EU promotes economic integration with regional aid, which is designed to focus development efforts on certain disadvantaged regions and sections of population of the EU. Another important policy area for the EU has been agriculture and fisheries. Subsidies to this sector make up more than 30% of the EU’s budget.
The regulation laying down the multiannual financial framework (“MFF”) of the EU was formally adopted in December 2013. The MFF determines maximum amounts for commitment appropriations for the period from 2014 until 2020, which cover commitments made to spend funds over one or more years in certain expenditure categories. Additionally, the MFF defines annual maximum amounts for payment appropriations, which cover payments made to honor the legal commitments entered into during the current financial year and/or earlier financial years. The 2014 EU budget, which was adopted by the European Parliament in November 2013, amounts to EUR 142.6 billion in commitment appropriations and EUR 135.5 billion in payment appropriations. The amount of commitment appropriations corresponds to 1.06% of EU gross national income, while the amount of payment appropriations corresponds to 1.00% of EU gross national income.
Sources: Europa.eu, Europe in 12 lessons, What does the EU do? (http://europa.eu/abc/12lessons/lesson_5/index_en.htm); Europe.eu, Europe in 12 lessons, The single market (http://europa.eu/abc/12lessons/lesson_6/index_en.htm); European Commission, Banking (http://ec.europa.eu/internal_market/bank/index_en.htm); European Council, Council adopts the multiannual financial framework 2014-2020, Press Release, December 2, 2013 (http://www.consilium.europa.eu/uedocs/cms_Data/docs/pressdata/en/ecofin/139831.pdf); European Commission, Financial Programming and Budget, Budget in figures, 2014 (http://ec.europa.eu/budget/figures/2014/2014_en.cfm).
Monetary Integration
The Federal Republic is a signatory to and has ratified the Treaty on European Union of February 1992 (also known as the “Maastricht Treaty”). The Maastricht Treaty was the basis for the establishment of the European Economic and Monetary Union (“EMU”). The EMU led, in turn, to the adoption of irrevocable conversion rates between the euro and the national currencies of the initial participating Member States on December 31, 1998 and the introduction of the euro as the single European currency in the “euro area” on January 1, 1999. On January 1, 2002, banknotes and coins denominated in euro were introduced as legal tender to replace the national currencies in the twelve Member States forming the euro area at that time (Austria, Belgium, Finland, France, Germany, Greece, Ireland, Italy, Luxembourg, the Netherlands, Portugal and Spain). Slovenia, Malta, Cyprus, Slovakia and Estonia subsequently joined the euro area. The most recent addition was Latvia, which joined the euro area on January 1, 2014.
The European Central Bank (“ECB”) was established on June 1, 1998, as part of the European System of Central Banks (“ESCB”). According to the Maastricht Treaty, the primary objective of the ESCB is to maintain price stability. Without prejudice to the objective of price stability, the ESCB supports the general economic policies of the EU. See “Monetary and Financial System” for more information on the ECB and ESCB. The Eurosystem, consisting of the ECB and the national central banks of those Member States whose currency is the euro (the “Euro Area Member States”), assumed sole responsibility for the monetary policy in the euro area on January 1, 1999.
Sources: European Union, Consolidated versions of the Treaty on European Union and the Treaty on the Functioning of the European Union (http://eur-lex.europa.eu/legal-content/EN/TXT/HTML/?uri=CELEX:12012M/TXT&from=EN); European Central Bank, Economic and Monetary Union (EMU) (http://www.ecb.int/ecb/history/emu/html/index.en.html); European Central Bank, Latvia joins the euro area, Press release January 1, 2014 (http://www.ecb.europa.eu/press/pr/date/2014/html/pr140101.en.html); European Central Bank, The first ten years (http://www.ecb.int/ecb/10ann/html/index.en.html).
G-4
EU Economic Governance
In light of the challenges posed by the ongoing economic and financial crisis in certain Euro Area Member States, the Member States have taken a series of measures to strengthen economic and budgetary coordination for the EU as a whole and for the euro area in particular. The process is still ongoing. The enhanced and strengthened EU economic governance framework consists of the following main components.
Stability and Growth Pact. To ensure continuous budgetary discipline in the EMU, the Member States established the Stability and Growth Pact (the “SGP”) in 1996. The SGP was enhanced by a package of six legislative acts (commonly known as the “six-pack”), which entered into force in December 2011. Parts of the six-pack reinforce both the preventive and the corrective arm of the SGP. The preventive arm of the SGP guides Member States towards a country-specific, medium-term budgetary objective, which seeks to ensure the sustainability of public finances. To assess progress towards this objective, in addition to the structural budget balance (defined as the cyclically adjusted balance net of one-off and temporary measures), the rules provide for an “expenditure benchmark.” This expenditure benchmark places a cap on the annual growth of public expenditures according to a medium-term rate of gross domestic product (“GDP”) growth. For Member States that have not yet reached their medium-term budgetary objective, the rate of growth of expenditures should be below this reference rate in order to ensure adequate progress. Under the amended SGP, a significant deviation from the medium-term budgetary objective, or from an appropriate adjustment path towards it, can lead to a financial sanction for Euro Area Member States (an interest-bearing deposit of 0.2% of GDP). Such sanctions are proposed by the European Commission and adopted by reverse qualified majority voting in the Economic and Finance Affairs Council (the “Ecofin Council”), a mechanism which implies that a recommendation or a proposal of the European Commission is considered adopted in the Ecofin Council unless a qualified majority of Member States votes against it, thus ensuring more automatic enforcement.
The corrective arm of the SGP consists of the excessive deficit procedure (“EDP”). The EDP is a mechanism established in the EU treaties requiring Member States to keep their general government deficits equal or below 3% of GDP and general government gross debt equal or below (or on a sufficiently downward trend towards) 60% of GDP. Previously, the implementation of the EDP by EU regulations only provided for an EDP to be triggered on the basis of a deficit in excess of 3% of GDP. The six-pack gives effect to the debt criterion, so that an EDP may also be launched on the basis of a debt ratio in excess of 60% of GDP. A Member State may become subject to an EDP even if its deficit is equal or below 3% of GDP if the gap between its debt level and the 60% reference is not reduced on average by 1/20th annually. The EDP provides that the Ecofin Council decides with a qualified majority whether an excessive deficit has been incurred after taking into account all relevant factors that have been agreed upon by Member States as well as the impact of the economic cycle. If it concludes that there is an excessive deficit, the Ecofin Council, based on recommendations by the European Commission, suggests corrective measures aimed at deficit reduction and then reviews the corrective measures taken by the Member State. Under the amended SGP, financial sanctions for Euro Area Member States are imposed at an earlier stage of the EDP. A non-interest bearing deposit of 0.2% of GDP may be requested from a Euro Area Member State that is placed in an EDP on the basis of its deficit or its debt. Failure of a Euro Area Member State to comply with recommendations for corrective action will result in a fine of 0.2% of GDP. As in the preventive arm of the SGP, these new sanctions will be proposed by the European Commission and adopted by reverse qualified majority voting in the Ecofin Council. Finally, if the Euro Area Member State further fails to take effective action, the sanctions already provided for in the EU treaties can be imposed (as a rule, a fine of up to 0.5% of GDP).
In March 2013, the European Parliament and the Council of the European Union (the “Council”) agreed on two further regulations, known as the “two-pack.” These regulations will apply to Euro Area Member States only. The new procedures are designed to complement the SGP and to further improve budgetary coordination in the euro area. The two-pack introduces a common budgetary timeline and rules for Euro Area Member States, starting with the budget planning process for 2014. Euro Area Member States must publish their draft budgets by October 15 for the following year. The European Commission will examine and give an opinion on each draft budget, by November 30 at the latest. If the European Commission detects severe non-compliance with the SGP, it will ask the Euro Area Member State to submit a revised plan. The two-pack also strengthens monitoring and surveillance for Euro Area Member States in EDP and for Euro Area Member States threatened with or experiencing serious difficulties regarding their financial stability.
Sources: European Council, Dublin European Council 13 and 14 December 1996 Presidency Conclusions (http://www.consilium.europa.eu/ueDocs/cms_Data/docs/pressData/en/ec/032a0003.htm); Consolidated versions of the Treaty on European Union and the Treaty on the Functioning of the European Union (http://eur-lex.europa.eu/JOHtml.do?uri=OJ:C:2010:083:SOM:EN:HTML); European Commission, Economic and Financial Affairs, Economic Governance (http://ec.europa.eu/economy_finance/economic_governance/index_en.htm); European Commission, Economic and Financial Affairs, Economic Governance, Stability and Growth Pact (http://ec.europa.eu/economy_finance/economic_governance/sgp/index_en.htm); Six-pack? Two-pack? Fiscal compact? A short guide to the new EU fiscal governance (http://ec.europa.eu/economy_finance/articles/governance/2012-03-14_six_pack_en.htm); EU Economic governance “Six-Pack” enters into force, press release of December 12, 2011 (http://europa.eu/rapid/pressReleasesAction.do?reference=MEMO/11/898); ‘Two-Pack’ completes budgetary surveillance cycle for euro area and further improves economic governance, press release of March 12, 2013 (http://europa.eu/rapid/press-release_MEMO-13-196_en.htm).
G-5
Macroeconomic Imbalance Procedure. The economic and financial crisis in the euro area demonstrated a need for strengthened surveillance of the economic policies of the Member States beyond the fiscal field. Accordingly, in 2011, the macroeconomic imbalance procedure (“MIP”) was established as part of the six-pack legislation described above. The aim of the MIP is to identify potential risks early on, prevent the emergence of harmful imbalances and correct any existing excessive imbalances. The preventive arm of the process relies on an early warning system that uses a scoreboard of indicators and in-depth country reviews. This preventive arm allows the European Commission and the Council to adopt recommendations to the affected Member State at an early stage. In cases when excessive macroeconomic imbalances have already arisen, there is a corrective arm through which an excessive imbalance procedure may be initiated against a Member State by a Council decision with qualified majority. In this case, the Member State concerned will have to submit a corrective action plan which will be monitored by the European Commission on the basis of regular progress reports submitted by such Member State. In addition, a new enforcement regime has been introduced for Euro Area Member States, which, as a measure of last resort, imposes financial sanctions if the Euro Area Member State repeatedly does not comply with its obligations. The Council is to rely on reverse qualified majority voting to take the decisions leading up to sanctions. The financial sanctions may eventually result in a fine of up to 0.1% of GDP. The early warning was triggered for Germany in 2013 due to Germany’s current account surplus, see “The Economy—International Economic Relations—Germany’s Current Account Surplus and the Macroeconomic Imbalance Procedure.”
Sources: European Commission, Economic and Financial Affairs, Economic Governance, Macroeconomic Imbalance Procedure (http://ec.europa.eu/economy_finance/economic_governance/macroeconomic_imbalance_procedure/index_en.htm); EU Economic governance “Six-Pack” enters into force, press release of December 12, 2011 (http://europa.eu/rapid/pressReleasesAction.do?reference=MEMO/11/898).
Treaty on Stability, Coordination and Governance in the EMU. In March 2012, the Heads of State or Government of all Member States, with the exception of the United Kingdom and the Czech Republic, signed the Treaty on Stability, Coordination and Governance in the EMU. On January 1, 2013, this treaty was ratified by twelve Euro Area Member States and entered into force. Its provisions are binding for Euro Area Member States, while the other Member States will only be bound if they adopt the euro, unless they declare their intention to be bound by certain provisions of the treaty at an earlier date. The core set of rules aims at further strengthening fiscal discipline within the euro area and is also known as the “fiscal compact.” The Treaty on Stability, Coordination and Governance in the EMU is not EU law but an entirely new intergovernmental agreement. Therefore, the fiscal compact does not replace the SGP, but is applicable in parallel to the SGP. The fiscal compact requires contracting parties to ensure convergence towards the country-specific medium-term budgetary objectives, as defined in the SGP, with an upper limit of a structural deficit of 0.5% of GDP. In the event of a deviation from this rule, an automatic correction mechanism will be triggered, with escape clauses for exceptional circumstances. These budget rules are to be transposed into national law through provisions of “binding force and permanent character, preferably constitutional” one year after the entry into force of the treaty, i.e., by January 1, 2014 at the latest. If a contracting party does not comply with this obligation, the matter is to be brought before the EU Court of Justice. The court’s judgment would be binding, and, in the case of non-compliance with the judgment, could be followed up with a penalty of up to 0.1% of GDP, payable to the European Stability Mechanism (“ESM”) in the case of Euro Area Member States. Moreover, the contracting parties agreed that from March 1, 2013, financial assistance will only be granted under the ESM if the relevant Member State has ratified the Treaty on Stability, Coordination and Governance in the EMU and transposed the provisions relating to the balanced budget rule into national law within the time frame set in the fiscal compact. For more information, see “—Response to the European Sovereign Debt Crisis—Treaty on the European Stability Mechanism.” Finally, the fiscal compact includes a commitment by Euro Area Member States to adopt the European Commission’s recommendations in the framework of an EDP unless opposed by a qualified majority. In fact, this commitment extends the use of reverse qualified majority voting to all stages of an EDP, even if this is not provided for in EU treaties and regulations.
Sources: Six-pack? Two-pack? Fiscal compact? A short guide to the new EU fiscal governance (http://ec.europa.eu/economy_finance/articles/governance/2012-03-14_six_pack_en.htm); Fiscal compact signed: Strengthened fiscal discipline and convergence in the euro area, press release of March 2, 2012 (http://www.consilium.europa.eu/uedocs/cms_data/docs/pressdata/en/ec/128454.pdf); European Council, “Fiscal compact” entered into force on 1 January 2013, statement of January 1, 2013 (http://www.european-council.europa.eu/home-page/highlights/fiscal-compact-enters-into-force-on-1-january-2013?lang=en).
Response to the European Sovereign Debt Crisis
Temporary Financial Backstop Mechanism. In May 2010, the Council and the Member States decided to set up a temporary stability mechanism to preserve the stability of the euro area by providing temporary financial assistance to Euro Area Member States if needed. One part of the mechanism consisted of a new community instrument (the European Financial Stabilisation Mechanism, or
G-6
“EFSM”) of up to EUR 60 billion. In addition, the Euro Area Member States established the European Financial Stability Facility (“EFSF”). This special purpose vehicle originally had a lending capacity of EUR 440 billion backed by guarantees extended by the Euro Area Member States for the purpose of on-lending to Euro Area Member States in financial difficulties, subject to conditions which were to be negotiated with the European Commission together with the ECB and the IMF and to be approved by the euro area finance ministers. The EFSF became operational in August 2010 and commenced refinancing activities at the beginning of 2011 through EFSF SA, a Luxembourg-registered company owned by the Euro Area Member States.
In October 2011, amendments to the EFSF framework entered into force, increasing the EFSF’s guarantee commitments from EUR 440 billion to EUR 780 billion in order to safeguard the intended effective lending capacity of EUR 440 billion, and increasing its scope of activity by announcing additional measures designed to alleviate the Greek debt crisis and enhance the stability of the euro area as a whole. The EFSF was subsequently authorized to provide loans to Euro Area Member States in financial difficulties, to intervene in the primary and secondary debt markets, to provide credit lines to non-program countries within the framework of an EFSF precautionary program and to finance recapitalizations of financial institutions through loans to governments including in non-program countries.
In November 2011, the economics and finance ministers of the euro area agreed on two models to optimize available resources of the EFSF and adopted corresponding guidelines. Under the first option, the EFSF would have provided partial risk protection to newly issued bonds of a Euro Area Member State. The second option aimed to create one or more co-investment funds, which would have allowed a combination of public and private funding. A co-investment fund would have provided funding for interventions in the primary and secondary debt markets. During the entire time of the EFSF’s lending activity, no co-investment fund was established.
The Federal Republic has committed guarantees of approximately EUR 211 billion to the EFSF in accordance with its share in the paid-up capital of the ECB. Accordingly, the Federal Republic contributes approximately 29% of the guarantees provided by Euro Area Member States, excluding the Euro Area Member States receiving or having received financial support (Ireland, Portugal, Greece and Cyprus). As of the end of March 2014, the EFSF had outstanding bonds and bills of approximately EUR 190.9 billion. The EFSF was created as a temporary institution and therefore as of July 1, 2013 may no longer engage in new financing operations or enter into new loan facility agreements. The EFSF will be dissolved and liquidated when all financial assistance provided to euro area Member States and all funding instruments issued by the EFSF have been repaid in full.
Sources: EFSF FAQ Update as of March 3, 2014 (http://www.efsf.europa.eu/attachments/EFSF FAQ 2014-03-03.pdf); European Commission, Economic and Financial Affairs, Intergovernmental support mechanisms, European Financial Stability Support (EFSF) (http://ec.europa.eu/economy_finance/european_stabilisation_actions/index_en.htm); European Commission, Economic and Financial Affairs, European Financial Stabilisation Mechanism (EFSM) (http://ec.europa.eu/economy_finance/eu_borrower/efsm/index_en.htm); EFSF, Investor Relations, Transactions (http://www.efsf.europa.eu/investor_relations/issues/index.htm).
Treaty on the European Stability Mechanism. In February 2012, the Euro Area Member States signed the revised treaty on the European Stability Mechanism (“ESM”). The ESM treaty entered into force on September 27, 2012, and the ESM was inaugurated on October 8, 2012 following ratification by all 17 Euro Area Member States.
The ESM has been designed as a permanent stability mechanism that assumes the tasks fulfilled by the EFSF and the EFSM and is established as an intergovernmental organization under public international law. Following the accession of Latvia on March 13, 2014, the ESM has an effective lending capacity of EUR 500 billion backed by total subscribed capital of approximately EUR 701.9 billion. Of this amount, approximately EUR 80.2 billion is in the form of paid-in capital provided by the Euro Area Member States and approximately EUR 621.7 billion in the form of callable capital committed by Euro Area Member States. The payment of paid-in shares is to be made in five installments of EUR 16 billion each. Latvia will transfer its share in the paid-in capital in five annual installments of EUR 44.24 million each. The 17 founding members of the ESM completed their payment of paid-in capital on April 30, 2014. The contribution of each Euro Area Member State is based on the paid-in capital for the ECB. On this basis, the Federal Republic’s contribution amounts to approximately 27% of the aggregate contributions to the ESM. The Federal Republic contributes approximately EUR 22 billion of paid-in capital to the ESM.
The ESM’s purpose is to provide financial assistance to Euro Area Member States experiencing or threatened by severe financing problems, if such assistance is deemed essential to safeguard financial stability in the euro area as a whole. The ESM is allowed to use the range of instruments that was put in place for the EFSF. Financial support is subject to strict economic policy conditionality.
Furthermore, parallel to the Treaty on Stability, Coordination and Governance in the EMU, the contracting parties stated in the ESM treaty that as of March 1, 2013, only Euro Area Member States that have ratified the fiscal compact and have implemented the balanced budget rule as specified in the fiscal compact within the agreed timeline (one year after entry into force) are eligible for financial support from the ESM. Financial assistance from the ESM is activated upon a Euro Area Member State’s request. Once such a request is made, active participation of the IMF will be sought. The ESM’s rules provide for case-by-case participation of private sector creditors, consistent with IMF policies. In order to facilitate this process, standardized and identical collective action clauses are included in the terms and conditions of all new euro area government bonds with a maturity of more than one year, as of January 1, 2013. ESM loans enjoy preferred creditor status in a similar fashion to those extended by the IMF, while accepting preferred creditor status of the IMF over the ESM, except in the case of countries which were beneficiaries under a European financial assistance program before the ESM treaty entered into force.
G-7
In principle, decisions under the ESM are taken by mutual agreement. However, the ESM treaty also provides for an emergency voting rule. In the event that the European Commission and the ECB conclude that an urgent decision related to financial assistance is needed because the financial and economic sustainability of the euro area is threatened, the mutual agreement rule is replaced by a qualified majority of 85%. Given its voting rights of approximately 27%, the Federal Republic may veto any decision even under the emergency voting rule.
As of July 1, 2013, the ESM became the sole and permanent mechanism for responding to new requests for financial assistance by Euro Area Member States. As mentioned above, the EFSF is envisaged to remain active only in the financing programs that started before the ESM Treaty was signed (Greece and Portugal; the program for Ireland ended in December 2013).
As of the end of April 2014, the ESM has disbursed approximately EUR 46 billion to Spain and Cyprus.
On March 18, 2014, the German Federal Constitutional Court (Bundesverfassungsgericht) handed down its decision in the main proceedings challenging the ESM treaty and the fiscal compact. The decision affirmed the preliminary ruling the court had handed down in September 2012, which had approved the ratification by the Federal Republic of the ESM treaty and the fiscal compact.
Sources: European Council, Factsheet on the Treaty establishing the European Stability Mechanism, dated February 2, 2012 (http://www.consilium.europa.eu/uedocs/cms_data/docs/pressdata/en/ecofin/127788.pdf); European Council, Treaty establishing the European Stability Mechanism, dated February 2, 2012 (http://www.european-council.europa.eu/media/582311/05-tesm2.en12.pdf); ESM FAQ as of March 13, 2014 (http://www.esm.europa.eu/pdf/FAQ%20ESM%202014-03-13.pdf); Frequently Asked Questions on ESM paid-in capital, dated May 1, 2014 (http://www.esm.europa.eu/pdf/FAQ%20on%20paid-in%20capital.pdf); European Financial Stability Facility, ESM becomes sole mechanism for new financial assistance programmes to euro area Member States, July 1, 2013 (http://www.efsf.europa.eu/mediacentre/news/2013/esm-becomes-sole-mechanism-for-new-financial-assistance-programmes-to-euro-area-member-states.htm); Bundesregierung, European Stability Mechanism, press release of March 18, 2014 (http://www.bundesregierung.de/Content/EN/Artikel/2014/03/2014-03-18-bverfg-esm.html).
Financial Assistance to Euro Area Member States
Greece. After Greece had experienced serious difficulties in accessing the financial markets to obtain new borrowings to cover its substantial financing needs in the first months of 2010, the Euro Area Member States concluded that the stability of the euro area as a whole was threatened and agreed to help Greece meet its financing needs. In May 2010, the Euro Area Member States agreed to provide Greece with stability support (the “Greek Loan Facility”) in the form of pooled bilateral loans of up to EUR 80 billion, parallel to a loan facility provided by the IMF of up to EUR 30 billion. The amounts under the Greek Loan Facility were planned to be disbursed over the period May 2010 through June 2013. The Federal Republic committed to contribute up to approximately EUR 22.3 billion, which was to be extended by KfW on behalf of the Federal Republic. As of December 2011, a total amount of EUR 73 billion had been disbursed under the Greek Loan Facility, of which approximately EUR 53 billion was provided by Euro Area Member States and EUR 20 billion by the IMF.
In July 2011, the Heads of State or Government of the euro area and EU institutions agreed to support a new program for Greece and, together with the IMF and the voluntary contribution of the private sector, fully cover the financing gap. A sufficient majority of private sector creditors accepted the voluntary exchange of Greek debt in early March 2012. Of a total of EUR 205.6 billion in bonds eligible for the exchange offer, approximately 96% were exchanged. Accordingly, in mid-March 2012, the Euro Area Member States formally approved a second adjustment program for Greece. Under the second program, the EFSF and the IMF have committed the undisbursed amounts of the first program plus an additional EUR 130 billion for the years 2012 to 2014. The EFSF has committed an overall amount of EUR 144.6 billion (including the amounts already committed or disbursed for the involvement of private sector creditors and bank recapitalization) for the years 2012 to 2014, while the IMF has committed to contribute EUR 28 billion over the course of a four-year period.
In fall 2012, the outlook for the sustainability of Greek government debt had worsened compared to March 2012 when the second program was concluded, mainly on account of a deteriorated macro-economic situation and delays in program implementation caused by two election rounds. Against this background, in November 2012, the euro area finance ministers and the IMF agreed to extend the fiscal adjustment path by two years and on a package of measures aimed at reducing Greece’s debt to 124% of GDP by 2020. In parallel, Greece carried out a successful public debt buy-back tender process, which is expected to reduce debt by 9 1/2% of GDP by 2020. As of the end of April 2014, total EFSF funding to Greece within the framework of the second program amounted to approximately EUR 139.9 billion.
Sources: European Commission, Economic and Financial Affairs, Financial Assistance in EU Member States, Greece (http://ec.europa.eu/economy_finance/assistance_eu_ms/greek_loan_facility/index_en.htm); Council of the European Union, Statement by the heads of state or government of the euro area and EU institutions, dated July 21, 2011 (http://www.consilium.europa.eu/uedocs/cms_data/docs/pressdata/en/ec/123978.pdf); EFSF, Lending Operations as of December 19, 2013 (http://www.efsf.europa.eu/about/operations/index.htm); European Commission, Statement by the European Commission, ECB and IMF on the review mission to Greece, press release dated March 19, 2014 (http://europa.eu/rapid/press-release_MEMO-14-202_en.htm); EFSF FAQ Update as of December 9, 2013 (http://www.efsf.europa.eu/attachments/EFSF%20FAQ%202013-12-09.pdf).
Ireland. The first Euro Area Member State to receive support by the EFSM and EFSF was Ireland. The financial assistance, which was agreed upon in December 2010 and was provided subject to compliance with the economic adjustment program, consisted of financial support of EUR 85 billion, including EUR 22.5 billion financed through the EFSM, EUR 17.7 billion through the EFSF, EUR 22.5 billion through the IMF and EUR 4.8 billion through bilateral loans from the United Kingdom, Denmark and Sweden. The
G-8
remaining EUR 17.5 billion was financed by the Irish Treasury cash buffer and investments of the Irish National Pension Reserve Fund. In November 2013, the Irish government announced its decision not to request successor financial assistance, and the financial assistance program for Ireland expired as planned in December 2013.
Sources: Council agrees on joint EU-IMF financial assistance package for Ireland, December 7, 2010 (http://ec.europa.eu/economy_finance/articles/eu_economic_situation/2010-12-01-financial-assistance-ireland_en.htm); European Commission, Economic and Financial Affairs, Financial Assistance in EU Member States, Ireland (http://ec.europa.eu/economy_finance/assistance_eu_ms/ireland/index_en.htm); European Financial Stability Facility, EFSF financial assistance for Ireland ends with successful Irish exit, press release of December 8, 2013 (http://www.efsf.europa.eu/mediacentre/news/2013/efsf-financial-assistance-for-ireland-ends-with-successful-irish-exit.htm); Eurogroup, Statement by the Eurogroup on Ireland, press release of November 14, 2013 (http://www.eurozone.europa.eu/newsroom/news/2013/11/statement-by-the-eurogroup-on-ireland/).
Portugal. In early April 2011, the Portuguese Republic officially applied for support under the financial support mechanisms. Euro area, EU and IMF financial support is being provided for the 2011 to mid-2014 period on the basis of an agreement on an economic adjustment program which was negotiated between the Portuguese authorities and officials from the European Commission, the IMF and the ECB in May 2011. The total financial support to be provided amounts to EUR 78 billion, with EFSM, EFSF and IMF each contributing EUR 26 billion. After the conclusion of the twelfth and final review mission in May 2014, the Portuguese government decided to exit its macroeconomic adjustment program without successor arrangement.
Sources: European Commission, Economic and Financial Affairs, Financial Assistance in EU Member States, Portugal (http://ec.europa.eu/economy_finance/assistance_eu_ms/portugal/index_en.htm); Eurogroup, Eurogroup Statement on Portugal, press release of May 5, 2013 (http://www.consilium.europa.eu/uedocs/cms_Data/docs/pressdata/en/ecofin/142482.pdf).
On June 21, 2013, the Ecofin Council extended the average maturities of loans granted to Ireland and Portugal through the EFSM by seven years (i.e., from 12.5 years to 19.5 years), in order to reduce these countries’ refinancing needs following their respective economic adjustment programs. In addition, the decisions authorize the European Commission to extend the maturity of installments and tranches at the request of the respective country and to refinance all or part of its borrowings for such purpose. The corresponding decision for the loans supplied by the EFSF was taken by the board of directors of the EFSF on June 24, 2013.
Sources: European Council, Council extends maturities of EFSM loans to Ireland, Portugal, June 21, 2013 (http://www.consilium.europa.eu/uedocs/cms_Data/docs/pressdata/en/ecofin/137563.pdf); EFSF, EFSF extends loan maturities for Ireland and Portugal, press release dated June 24, 2013 (http://www.efsf.europa.eu/mediacentre/news/2013/efsf-extends-loan-maturities-for-ireland-and-portugal-.htm).
Spain. In June 2012, the Spanish government requested financial assistance from the Euro Area Member States for the recapitalization of certain of its financial institutions. In July 2012, the finance ministers of the Euro Area Member States agreed to grant such financial assistance of up to EUR 100 billion, designed to cover the estimated shortfall in capital requirements along with an additional safety margin. The finance ministers of the Euro Area Member States agreed that the Fund for Orderly Bank Restructuring, acting as agent of the Spanish government, would receive the funds and direct them to the financial institutions concerned. The financial assistance was accompanied by policy conditionality focused on the banking sector. The assistance was initially financed by the EFSF and then transferred to the ESM (without applying seniority status). Loan maturities are up to 15 years with an average of 12.5 years. On December 31, 2013, the financial assistance program expired. The ESM has disbursed a total of EUR 41.3 billion to the Spanish government for the recapitalization of the country’s banking sector. The ESM announced that Spain will not request any follow-up assistance from the ESM.
Sources: European Commission, Economic and Financial Affairs, Financial Assistance in EU Member States, Spain (http://ec.europa.eu/economy_finance/assistance_eu_ms/spain/index_en.htm);ESM, Financial Assistance, Spain (http://www.esm.europa.eu/assistance/spain/); European Stability Mechanism, Spain successfully exits ESM financial assistance programme, press release of December 31, 2013 (http://www.esm.europa.eu/press/releases/spain-successfully-exits-esm-financial-assistance-programme.htm).
Cyprus. The economic adjustment program for Cyprus was formally agreed in May 2013. The financial package will cover up to EUR 10 billion: the ESM will provide up to EUR 9 billion, and the IMF is expected to contribute around EUR 1 billion. The program addresses Cyprus’s financial sector imbalances including an appropriate downsizing of the country’s financial sector, fiscal consolidation, structural reforms and privatization. Prior to the program, the Cypriot authorities agreed to split the Cyprus Popular Bank (also known as “Laiki”) into a good bank and a bad bank and to merge the good bank with the Bank of Cyprus. Laiki’s equity shareholders, bond holders and depositors with deposits of more than EUR 100,000 were required to make a contribution in this process. In addition, deposits with the Bank of Cyprus that exceed EUR 100,000 participated in the capitalization of the bank through the conversion of 47.5% of uninsured deposits (over EUR 100,000) into equity. As of March 2014, ESM and IMF have disbursed a total of EUR 4.85 billion under the program. The third review mission by the European Commission, ECB and IMF in February 2014 concluded that the program remains on track, paving the way for the disbursement of EUR 83 million by the IMF and EUR 150 million by the ESM in April 2014.
Sources: European Commission, Economic and Financial Affairs, Financial Assistance in EU Member States, Cyprus (http://ec.europa.eu/economy_finance/assistance_eu_ms/cyprus/index_en.htm); ESM, Financial Assistance, Cyprus (http://www.esm.europa.eu/assistance/cyprus/index.htm); ESM, FAQ- Financial Assistance for Cyprus, dated September 18, 2013 (http://www.esm.europa.eu/pdf/FAQ%20Cyprus%2018092013.pdf); European Commission, Statement by the European Commission, ECB and IMF on the Third Review Mission to Cyprus, press release of February 11, 2014
(http://europa.eu/rapid/press-release_MEMO-14-104_en.htm); International Monetary Fund, IMF Completes Third Review Under the Extended Fund Facility for Cyprus and Approves €83.3 Million Disbursement, press release dated March 28, 2014 (http://www.imf.org/external/np/sec/pr/2014/pr14143.htm).
G-9
Political Integration
The EU’s three main institutions are the Council (representing the governments of the Member States), the Parliament (elected by and representing the citizens of the Member States) and the European Commission (the executive body of the EU). In order to ensure that the decision-making process within the EU’s institutions continues to work effectively, the European Convention was formed in 2001. Its goal was to draft a European constitution that would set out the powers and responsibilities of the institutions and the decision-making process, thus enabling the EU to cope with its main challenges in the mid-term future, the enlargement of the EU and the increased involvement of EU citizens, by introducing more direct democratic processes and transparency into the governance of the EU. The European constitution was signed by the Heads of State or Government and the foreign ministers in October 2004; it was required to be ratified by all Member States as a precondition to its entry into force. After the failure of referendums on ratification held in France and the Netherlands, the European Council in June 2005 decided to enter a period of reflection on the process of reforming the EU institutions. In June 2007, the European Council decided to convene an Intergovernmental Conference to draft a new EU treaty. The treaty, which was signed by the Heads of State or Government and the foreign ministers in Lisbon in December 2007 (the “Treaty of Lisbon”), largely reflects the institutional reforms embodied in the constitution, while modifying or leaving out certain controversial topics. It entered into force on December 1, 2009.
Sources: Europa.eu, How does the EU work?, Europe in 12 lessons: Lesson 4 (http://europa.eu/abc/12lessons/lesson_4/index_en.htm); Europa.eu, Summaries of legislation, a constitution for Europe (http://europa.eu/scadplus/constitution/introduction_en.htm); European Council, Declaration by the Heads of State or Government of the Member States of the European Union, June 18, 2005 (http://europa.eu/rapid/pressReleasesAction.do?reference=DOC/05/3&format=HTML&aged=0&language=EN&guiLanguage=en); European Council, The Brussels European Council—June 21 and 22, 2007 (http://europa.eu/legislation_summaries/other/constitution_european_council_2007_en.htm); Europa.eu, Treaty of Lisbon: The treaty at a glance (http://europa.eu/lisbon_treaty/glance/index_en.htm); Europa.eu, Treaty of Lisbon (http://europa.eu/lisbon_treaty/index_en.htm).
Statistical Disclosure Standards of the International Monetary Fund
The Federal Republic currently meets the Special Data Dissemination Standard (“SDDS”) of the IMF relating to coverage, periodicity and timeliness of economic data. Although subscription by member countries to the SDDS is voluntary, it carries a commitment requiring members to observe the standard and to provide certain information to the IMF about their practices in disseminating economic and financial data.
G-10
THE ECONOMY
Overview
Since 1945, the Federal Republic’s economic system has developed into a social market economy, combining the free initiative of the individual with progressive social principles. The Grundgesetz guarantees freedom of private enterprise and private property, provided that these basic rights are not exercised against the public good. The state mainly has a regulatory function in the market economy, setting the general framework of conditions within which market processes take place. State intervention in price setting is limited to a very small number of industries.
Key Economic Figures
The German economy is one of the world’s largest economies. In 2013, the GDP of Germany expressed at current prices was EUR 2,737.6 billion, compared to EUR 2,666.4 billion in 2012, which represents an increase of 2.7%. GDP adjusted for price effects rose by 0.4% compared to 2012, and exceeded the 1991 level by 32.5%. 1991 represents the first full year after German reunification on October 3, 1990. The growth in GDP since 1991 has been largely driven by productivity gains, as price-adjusted GDP per employee has risen by 22.6% since 1991. In calculating price-adjusted GDP, the Federal Statistical Office (Statistisches Bundesamt) uses a chain index based on the previous year’s prices. In 2013, GDP per capita at current prices was EUR 33,346, while GDP per employee at current prices was EUR 65,429.
Source: Statistisches Bundesamt, Fachserie 18, Reihe 1.4 - 2013 (März 2014), Tables 2.1.1 and 2.1.4.
As in many advanced economies, the services sector of the Federal Republic has become the largest contributor to GDP (in terms of gross value added). In 2013, services accounted for 69.0% of gross value added, measured at current prices, compared to 62.5% in 1991. The two most important subsectors were “trade, transport, accommodation and food services,” accounting for 14.5% in 2013, compared to 16.3% in 1991, and “public services, education, health,” accounting for 18.4% of gross value added in 2013, compared to 15.9% in 1991. The production sector (excluding construction) generated 25.5% of gross value added compared to 30.2% in 1991. Construction contributed 4.7% to gross value added in 2013, compared to 6.1% in 1991, and agriculture, forestry and fishing accounted for 0.8% of gross value added in 2013, compared to 1.2% in 1991.
Source: Statistisches Bundesamt, Fachserie 18, Reihe 1.4 - 2013 (März 2014), Table 2.2.1.
In 2013, private final consumption expenditure totaled 57.5% of GDP in current prices, gross capital formation amounted to 17.2% and government final consumption expenditure equaled 19.5%, almost unchanged from 2012. Exports and imports of goods and services accounted for 50.8% and 44.3% of GDP at current prices, respectively. The trade balance (according to national accounts) thus showed a surplus equal to 6.3% of GDP in 2013, a slight rise compared to 2012.
Source: Statistisches Bundesamt, Fachserie 18, Reihe 1.4 - 2013 (März 2014), Table 2.3.1.
In 2013, price-adjusted GDP rose by 0.4% compared to 2012. The GDP, adjusted for both price and calendar effects, increased by 0.5% compared to 2012. Net exports had a neutral effect on economic growth in 2013 (growth contribution: 0.0 percentage points). This was due to the increase in exports of 0.8% (2012: 3.2%) almost being matched by a rise in imports of 0.9% (2012: 1.4%), all on a price-adjusted basis. Gross fixed capital formation in machinery and equipment decreased in 2013 by 2.4%, compared to a 4.0% decline in 2012, in price-adjusted terms, while gross fixed capital formation in construction increased by 0.1%. Final consumption expenditure of general government rose by 0.7% in 2013 upon price adjustment, and final consumption expenditure of households rose by 0.9% on a price-adjusted basis compared to 2012.
Source: Statistisches Bundesamt, Fachserie 18, Reihe 1.4 - 2013 (März 2014), Tables 2.1.1, 2.3.2, 2.3.5 and 2.3.10.
The annual average rate of registered unemployment (as computed under the “national definition” of the Federal Employment Agency (Bundesagentur für Arbeit)) increased slightly from 6.8% in 2012 to 6.9% in 2013. However, based on the internationally comparable method of calculation promulgated by the International Labour Organization (“ILO”), which is referred to as the “ILO definition,” the annual average unemployment rate decreased from 5.3% in 2012 to 5.1% in 2013. For an explanation of the differences between the national definition and the ILO definition, see “—Employment and Labor.” Inflation as measured by the percentage increase in the national consumer price index (“CPI”) decreased to 1.5% in 2013, compared to 2.0% in 2012. Excluding energy prices, the index rose by 1.6%. General government gross debt stood at EUR 2,147.0 billion at year-end 2013, compared to EUR 2,161.0 billion at year-end 2012.
Sources: Bundesagentur für Arbeit, Monatsbericht Februar 2014, Table 5.1; Statistisches Bundesamt, Fachserie 18, Reihe 1.4 - 2013 (März 2014), Table 2.1.12; Statistisches Bundesamt, Fachserie 17, Reihe 7 - Februar 2014, Table 1.1 and 1.2; Deutsche Bundesbank, Time series BBK01.BJ9059: General government debt as defined in the Maastricht Treaty - Germany - overall (http://www.bundesbank.de/Navigation/EN/Statistics/Time_series_databases/Macro_economic_time_series/its_details_value_node.html?tsId=BBK01.BJ9059&listId=www_v27_web001_02a).
G-11
The following table shows selected key economic figures for the Federal Republic for each of the years indicated.
KEY ECONOMIC FIGURES
| | | | | | | | | | | | | | | | | | | | | | | | | |
| | | 2013 | | 2012 | | 2011 | | 2010 | | 2009 |
| | | (EUR in billions, unless otherwise indicated) |
GDP - at current prices | | | | 2,737.6 | | | | | 2,666.4 | | | | | 2,609.9 | | | | | 2,495.0 | | | | | 2,374.2 | |
(change from previous year in %) | | | | 2.7 | | | | | 2.2 | | | | | 4.6 | | | | | 5.1 | | | | | -4.0 | |
GDP - price-adjusted, chain-linked index (2005=100),
not adjusted for calendar effects | | | | 111.6 | | | | | 111.1 | | | | | 110.4 | | | | | 106.8 | | | | | 102.7 | |
(change from previous year in %) | | | | 0.4 | | | | | 0.7 | | | | | 3.3 | | | | | 4.0 | | | | | -5.1 | |
GDP - price-adjusted, chain-linked index (2005=100),
adjusted for calendar effects | | | | 111.8 | | | | | 111.2 | | | | | 110.2 | | | | | 106.6 | | | | | 102.6 | |
(change from previous year in %) | | | | 0.5 | | | | | 0.9 | | | | | 3.4 | | | | | 3.8 | | | | | -5.1 | |
Unemployment rate (ILO definition) (in %) (1) | | | | 5.1 | | | | | 5.3 | | | | | 5.7 | | | | | 6.8 | | | | | 7.4 | |
Rate of inflation (year-to-year change in consumer
price index (CPI) in %) | | | | 1.5 | | | | | 2.0 | | | | | 2.1 | | | | | 1.1 | | | | | 0.3 | |
Balance of payments - current account | | | | 206.0 | | | | | 198.6 | | | | | 178.4 | | | | | 159.3 | | | | | 140.7 | |
General government gross debt (2) | | | | 2,147.0 | | | | | 2,161.0 | | | | | 2,087.7 | | | | | 2,059.2 | | | | | 1,770.7 | |
| (1) | Unemployed persons, available and seeking work. |
| (2) | Definition according to Maastricht Treaty. |
Sources: Statistisches Bundesamt, Fachserie 18, Reihe 1.2 - 4. Vierteljahr 2013 (February 2014), Tables 1.1 and 1.10; Statistisches Bundesamt, Verbraucherpreise, Verbraucherpreisindex für Deutschland, Veränderungsraten zum Vorjahr in % (https://www.destatis.de/DE/ZahlenFakten/GesamtwirtschaftUmwelt/Preise/Verbraucherpreisindizes/Tabellen_/VerbraucherpreiseKategorien.html?cms_gtp=145114_list%253D2%2526145110_slot%253D2&https=1); Deutsche Bundesbank, Monatsbericht März 2014, Table XII.2; Deutsche Bundesbank, Time series BBK01.BJ9059: General government debt as defined in the Maastricht Treaty - Germany - overall (http://www.bundesbank.de/Navigation/EN/Statistics/Time_series_databases/Macro_economic_time_series/its_details_value_node.html?tsId=BBK01.BJ9059&listId=www_v27_web001_02a).
Economic Outlook
In its forecast published in April 2014, the Federal Government projected that GDP in Germany will grow by 1.8% in 2014, with private consumption growing by 1.5% (all growth rates are in price-adjusted terms). Exports and imports are expected to increase by 4.1% and 4.7%, respectively, compared to 2013. Gross fixed capital formation is projected to increase by 4.1% in 2014, of which investment in machinery and equipment and in construction is forecast to increase by 4.0% each. Growth is expected to be driven exclusively by domestic demand. The Federal Government expects that employment will increase by approximately 240,000 persons, or 0.6%, in 2014 compared to 2013. The registered unemployment rate (Arbeitslosenquote) is expected to be 6.7% in 2014 on average, compared to 6.9% in 2013.
Source: Bundesministerium für Wirtschaft und Energie, Bundesminister Gabriel: Deutsche Wirtschaft - Aufschwung auf breitem Fundament, press release of April 15, 2014 (http://www.bmwi.de/DE/Presse/pressemitteilungen,did=635304.html).
Economic Policy
General
The Federal Government aims to safeguard and build on the foundations for prosperity, social cohesion and a high quality of life in Germany. It is counting on forward-looking investment, on innovation and research, on efficient infrastructure, on the integration of
G-12
labor and on the continuing internationalization of the German economy. It aims to implement a modern and practical economic policy in order to overcome impediments to productivity.
The German economy remains competitive, and, despite increasing burdens as well as external and internal risks, the Federal Government expects German economic growth to remain robust. Employment and GDP in Germany increased on an annual average basis from 2010 to 2013. In 2013, a record level of employment was reached, with 41.8 million persons employed. For more information on recent economic developments, see “—Key Economic Figures.”
Sources: Bundesministerium für Wirtschaft und Technologie, 2014 Annual Economic Report (Summary in English: https://www.bmwi.de/BMWi/Redaktion/PDF/J-L/jahreswirtschaftsbericht-2014-engl-fassung,property=pdf,bereich=bmwi2012,sprache=de,rwb=true.pdf, German text: http://www.bmwi.de/BMWi/Redaktion/PDF/J-L/jahreswirtschaftsbericht-2014,property=pdf,bereich=bmwi2012,sprache=de,rwb=true.pdf); Statistisches Bundesamt, Fachserie 18, Reihe 1.4 - 2013 (März 2014), Table 2.3.13.
Current Policy Initiatives
Following the formation of a new Federal Government at the end of 2013, the objectives of economic policy have shifted somewhat. The Federal Government will continue the strategy of sound fiscal and budgetary as well as growth enhancing policies. At the same time it will seek to strengthen competitiveness with public investment to be stepped up and conditions for private investment improved, thus broadening the scope for a sustained boost to the performance of the German economy. Current policy initiatives are outlined below in more detail.
The Federal Government has continued the consolidation of public finances, in order to adhere both to the requirements stipulated by the constitutional balanced budget rule (known as the “debt brake” (Schuldenbremse)), as well as to the European frameworks such as the SGP and the fiscal compact. For further details on the budget surveillance procedures, see “General—The European Union and European Integration—EU Economic Governance.” Guided by these budgetary principles, the Federal Government intends to shape revenues and expenditure in such a way that the budget is structurally balanced in 2014 and the federal budget will avoid net new borrowing from 2015 onwards. In this way, the Federal Government is making a major contribution towards the planned reduction in the overall national debt rate to below 70% of GDP by the end of 2017 and to below 60% of GDP within ten years. For further information on the Federal Republic’s fiscal situation and prospects, see “Public Finance—Germany’s General Government Deficit/Surplus and General Government Gross Debt” and “Public Finance—Fiscal Outlook.”
The Federal Government intends to reduce tax avoidance and evasion. To this end, the Federal Government is working actively with its European and international partners on the OECD’s Base Erosion and Profit Shifting (“BEPS”) initiative. If it proves impossible to attain the objectives in the context of the G20/BEPS initiative by 2015, the Federal Government plans to adopt national measures. At the same time, it is supporting the development of a global standard for the automatic exchange of information regarding financial accounts.
Demographic changes are expected to have a significant impact on future German growth potential. Consequently, the Federal Government’s policies are geared toward increasing the labor force participation of women and older people in particular, as well as low-skilled workers and individuals with an immigrant background. To further reduce structural unemployment in Germany, the Federal Government is monitoring existing incentive structures and, if necessary, intends to modify them in order to further improve the functionality of the labor market.
The labor market is currently receptive to new workers and is opening up opportunities for people who were previously unable to participate in this positive development. At the same time, however, the low-wage sector has been expanding significantly since the 1990s. Against this background, the Federal Government aims to adapt the policy environment to ensure secure and good work with fair pay, as well as a strong social partnership between employers and trade unions. A generally binding statutory gross minimum wage of EUR 8.50 per hour will be introduced as of January 1, 2015 and is intended to ensure a level of minimum protection throughout Germany. During the transitional period until December 31, 2016, deviations from collective agreements are only allowed on the basis of the Posted Workers Act and the Temporary Employment Act (due to the wage floor in temporary employment). As of January 1, 2017, the generally binding minimum wage will be applied without any restriction. Exemptions are planned for young people under 18, apprentices, volunteers, internships and the long-term unemployed. Further, the Posted Workers Act will be opened up for all sectors. In future, it will also allow the sectors previously not covered by the Posted Workers Act to apply the tailor-made provisions of the Posted Workers Act and establish minimum working conditions which are applicable to all workers, including those posted abroad.
The Federal Government is also aiming to do more to reflect lifetime performance and many years of contribution to the pension system. First, the Federal Government plans to give employees the opportunity to retire without loss of pension provided they have
G-13
made 45 years of contributions. Second, the child-raising efforts of mothers and fathers whose children were born before 1992 are to be rewarded better in the statutory pension system. Furthermore, the Federal Government aims to appreciably improve the pension entitlements of disabled people unable to do a full day’s work.
In the area of antitrust, the Federal Government intends to evaluate the effects of the new rules of the eighth revision of the Act against Restraints on Competition (8. Novelle des Gesetzes gegen Wettbewerbsbeschränkungen). This revision is aimed at improving conditions of competition, particularly in the areas of merger control, abuse of dominant positions, provisions on fines and procedures governing violations of antitrust rules. Market transparency bodies have been set up at the Federal Network Agency (Bundesnetzagentur) and the Federal Cartel Office (Bundeskartellamt) in order to strengthen competition in the energy and gas wholesale as well as fuel markets. The Federal Government plans to consider further steps to improve the administrative and court procedures for antitrust violations and to strengthen the enforcement of cartel law by authorities and private parties. In order to counter any threats to the diversity of the press which might derive from the increasing digitization of media at an early stage, the Federal Government intends to facilitate operational co-operation in terms of cartel law between publishing companies below the editorial level.
In addition, the Federal Government plans to invest more in infrastructure and intends to improve the digital infrastructure. A total of EUR 5 billion of additional money is to be provided for investment in public transport infrastructure over the next four years, primarily for maintenance purposes. The truck toll is to be developed further to provide additional funding for the maintenance and expansion of the federal road network. Also there are plans to levy an appropriate charge on the owners of cars not registered in Germany. This requires an approach which complies with European law in which domestic car owners are not subjected to greater burdens than is presently the case.
Following the nuclear disaster which affected the Japanese nuclear power plant in Fukushima in March 2011, the Federal Government decided to accelerate the transition to a more sustainable energy set-up (Energiewende). Among other things, this energy concept provides for the shutdown of all nuclear power stations in Germany by 2022 and unites other key energy policy objectives (i.e., energy security, climate protection, economic growth and greater competitiveness) within a single strategy. It sets a long-term target of achieving an 80% reduction in greenhouse gas emissions by 2050, compared to 1990 levels. To this end, the energy concept is intended to increase the production and use of renewable energy sources, making them the primary source of German energy supply.
The new Federal Government is in favor of a sustainable continuous and affordable expansion, coupled with further market and systems integration, of renewable energy. The German cabinet adopted a proposal for a fundamental reform of the Renewable Energy Sources Act, (Erneuerbare-Energien-Gesetz) on April 8, 2014 which is expected to interrupt the existing cost dynamics of the act and thereby limit the rise in electricity costs for electricity consumers. In order to safeguard the international competitiveness of German industry, the Federal Government intends to retain the special compensation arrangement, which is to be reviewed on the basis of objective and transparent criteria and to be developed in conformity with European law, i.e., the final details of this arrangement still have to be worked out.
For information on government measures to stabilize Germany’s financial system, see “Monetary and Financial System—Policy Responses to the Global Economic and Financial Crisis—Policy Responses by the Federal Republic.” For information on government budgets, see “Public Finance.” For information on the response to the European sovereign debt crisis, see “General—The European Union and European Integration—Response to the European Sovereign Debt Crisis” and “General—The European Union and European Integration—EU Economic Governance.”
Sources: Bundesministerium für Wirtschaft und Technologie, 2014 Annual Economic Report (Summary in English: https://www.bmwi.de/BMWi/Redaktion/PDF/J-L/jahreswirtschaftsbericht-2014-engl-fassung,property=pdf,bereich=bmwi2012,sprache=de,rwb=true.pdf, German text: http://www.bmwi.de/BMWi/Redaktion/PDF/J-L/jahreswirtschaftsbericht-2014,property=pdf,bereich=bmwi2012,sprache=de,rwb=true.pdf); Bundesministerium für Wirtschaft und Technologie, 2013 Annual Economic Report (http://www.bmwi.de/English/Redaktion/Pdf/2013-annual-economic-report-competitiveness-_20key-to-growth,property=pdf,bereich=bmwi,sprache=en,rwb=true.pdf); Bundesministerium für Wirtschaft und Technologie, 2012 Annual Economic Report (http://www.bmwi.de/English/Navigation/Service/publications,did=479718.html).
G-14
Gross Domestic Product
The following tables show the structure of the Federal Republic’s GDP at current prices by use and origin for each of the years indicated along with changes over the respective preceding period.
STRUCTUREOF GDP — USE
| | | | | | | | | | | | | | | | | | | | | | | | | | | | | | | | | | | | | | | | | | | | | | | | | | |
| | | 2013 | | 2012 | | 2011 | | 2010 | | 2009 | | | | 2013 | | 2012 | | 2011 | | 2010 |
| | | (EUR in billions) | | | | (change in %) |
Domestic uses | | | | 2,563.9 | | | | | 2,508.5 | | | | | 2,474.3 | | | | | 2,354.8 | | | | | 2,257.5 | | | | | | | 2.2 | | | | | 1.4 | | | | | 5.1 | | | | | 4.3 | |
Final private consumption | | | | 1,572.4 | | | | | 1,533.9 | | | | | 1,498.4 | | | | | 1,435.1 | | | | | 1,392.6 | | | | | | | 2.5 | | | | | 2.4 | | | | | 4.4 | | | | | 3.1 | |
Final government consumption | | | | 533.0 | | | | | 514.4 | | | | | 499.6 | | | | | 487.2 | | | | | 475.3 | | | | | | | 3.6 | | | | | 3.0 | | | | | 2.5 | | | | | 2.5 | |
Gross fixed capital formation | | | | 472.2 | | | | | 470.6 | | | | | 473.2 | | | | | 435.1 | | | | | 408.7 | | | | | | | 0.4 | | | | | -0.6 | | | | | 8.8 | | | | | 6.5 | |
Machinery and equipment | | | | 170.9 | | | | | 175.0 | | | | | 181.2 | | | | | 170.6 | | | | | 154.8 | | | | | | | -2.4 | | | | | -3.4 | | | | | 6.2 | | | | | 10.2 | |
Construction | | | | 271.3 | | | | | 266.1 | | | | | 263.3 | | | | | 237.1 | | | | | 227.0 | | | | | | | 2.0 | | | | | 1.1 | | | | | 11.1 | | | | | 4.5 | |
Other products | | | | 30.0 | | | | | 29.4 | | | | | 28.6 | | | | | 27.4 | | | | | 26.9 | | | | | | | 2.1 | | | | | 2.6 | | | | | 4.5 | | | | | 1.9 | |
Changes in inventories (1) | | | | -13.7 | | | | | -10.3 | | | | | 3.2 | | | | | -2.5 | | | | | -19.0 | | | | | | | — | | | | | — | | | | | — | | | | | — | |
Net exports (1) | | | | 173.7 | | | | | 157.9 | | | | | 135.7 | | | | | 140.2 | | | | | 116.7 | | | | | | | — | | | | | — | | | | | — | | | | | — | |
Exports | | | | 1,385.5 | | | | | 1,381.0 | | | | | 1,321.4 | | | | | 1,188.6 | | | | | 1,008.1 | | | | | | | 0.3 | | | | | 4.5 | | | | | 11.2 | | | | | 17.9 | |
Imports | | | | 1,211.8 | | | | | 1,223.1 | | | | | 1,185.8 | | | | | 1,048.4 | | | | | 891.4 | | | | | | | -0.9 | | | | | 3.1 | | | | | 13.1 | | | | | 17.6 | |
| | | | | | | | | | | | | | | | | | | | | | | | | | | | | | | | | | | | | | | | | | | | | | |
Gross domestic product | | | | 2,737.6 | | | | | 2,666.4 | | | | | 2,609.9 | | | | | 2,495.0 | | | | | 2,374.2 | | | | | | | 2.7 | | | | | 2.2 | | | | | 4.6 | | | | | 5.1 | |
| | | | | | | | | | | | | | | | | | | | | | | | | | | | | | | | | | | | | | | | | | | | | | |
| (1) | Percentage changes are not presented due to the potentially changing signs of these net positions. |
Source: Statistisches Bundesamt, Fachserie 18, Reihe 1.2 - 4. Vierteljahr 2013 (February 2014), Tables 3.1 and 3.9.
G-15
STRUCTUREOF GDP — ORIGIN
| | | | | | | | | | | | | | | | | | | | | | | | | | | | | | | | | | | | | | | | | | | | | | | | | | |
| | | 2013 | | 2012 | | 2011 | | 2010 | | 2009 | | | | 2013 | | 2012 | | 2011 | | 2010 |
| | | (EUR in billions) | | | | (change in %) |
Gross value added of all economic sectors | | | | 2,454.0 | | | | | 2,386.8 | | | | | 2,334.9 | | | | | 2,235.2 | | | | | 2,117.1 | | | | | | | 2.8 | | | | | 2.2 | | | | | 4.5 | | | | | 5.6 | |
Agriculture, forestry and fishing | | | | 19.3 | | | | | 20.0 | | | | | 18.5 | | | | | 17.8 | | | | | 15.9 | | | | | | | -3.6 | | | | | 8.2 | | | | | 3.6 | | | | | 12.1 | |
Production sector (excluding construction) | | | | 625.5 | | | | | 616.9 | | | | | 607.8 | | | | | 573.6 | | | | | 495.3 | | | | | | | 1.4 | | | | | 1.5 | | | | | 6.0 | | | | | 15.8 | |
Construction | | | | 115.8 | | | | | 111.3 | | | | | 109.2 | | | | | 102.1 | | | | | 93.6 | | | | | | | 4.0 | | | | | 2.0 | | | | | 6.9 | | | | | 9.1 | |
Trade, transport, accommodation and food services | | | | 355.6 | | | | | 347.5 | | | | | 339.1 | | | | | 326.3 | | | | | 334.4 | | | | | | | 2.3 | | | | | 2.5 | | | | | 3.9 | | | | | -2.4 | |
Information and communication | | | | 96.5 | | | | | 96.0 | | | | | 94.7 | | | | | 90.2 | | | | | 93.6 | | | | | | | 0.5 | | | | | 1.4 | | | | | 4.9 | | | | | -3.6 | |
Financial and insurance services | | | | 98.6 | | | | | 94.4 | | | | | 101.5 | | | | | 101.8 | | | | | 93.1 | | | | | | | 4.4 | | | | | -6.9 | | | | | -0.3 | | | | | 9.3 | |
Real estate activities | | | | 298.6 | | | | | 289.3 | | | | | 283.2 | | | | | 267.7 | | | | | 263.2 | | | | | | | 3.2 | | | | | 2.2 | | | | | 5.8 | | | | | 1.7 | |
Business services | | | | 281.1 | | | | | 264.5 | | | | | 253.9 | | | | | 243.4 | | | | | 230.8 | | | | | | | 6.3 | | | | | 4.2 | | | | | 4.3 | | | | | 5.4 | |
Public services, education, health | | | | 450.8 | | | | | 438.1 | | | | | 421.9 | | | | | 409.5 | | | | | 396.0 | | | | | | | 2.9 | | | | | 3.8 | | | | | 3.0 | | | | | 3.4 | |
Other services | | | | 112.4 | | | | | 108.7 | | | | | 105.3 | | | | | 102.9 | | | | | 101.0 | | | | | | | 3.3 | | | | | 3.3 | | | | | 2.4 | | | | | 1.8 | |
Taxes on products offset against subsidies on products | | | | 283.6 | | | | | 279.6 | | | | | 275.0 | | | | | 259.8 | | | | | 257.2 | | | | | | | 1.4 | | | | | 1.7 | | | | | 5.8 | | | | | 1.0 | |
| | | | | | | | | | | | | | | | | | | | | | | | | | | | | | | | | | | | | | | | | | | | | | |
Gross domestic product | | | | 2,737.6 | | | | | 2,666.4 | | | | | 2,609.9 | | | | | 2,495.0 | | | | | 2,374.2 | | | | | | | 2.7 | | | | | 2.2 | | | | | 4.6 | | | | | 5.1 | |
| | | | | | | | | | | | | | | | | | | | | | | | | | | | | | | | | | | | | | | | | | | | | | |
Source: Statistisches Bundesamt, Fachserie 18, Reihe 1.2 - 4. Vierteljahr 2013 (February 2014), Tables 1.13 and 2.1.
Sectors of the Economy
Production Sector
Following German reunification in 1990, industry in the eastern Länder (i.e., the former German Democratic Republic), has undergone a restructuring process. Today, the German production sector is characterized by a balanced mix of small, medium and large enterprises and is almost entirely privately owned. Measured by its share in value added, approximately 60% of the production sector is geographically concentrated in the western Länder of North Rhine-Westphalia, Bavaria and Baden-Württemberg. The main segments of the production sector relate to the manufacturing of motor vehicles, machinery and equipment, electrical and optical equipment, basic metals and fabricated metal products, as well as chemicals and chemical products. In 2013, the production sector’s aggregate contribution to gross value added at current prices was 25.5% (excluding construction) and 30.2% (including construction), respectively. Its price-adjusted gross value added (excluding construction) remained unchanged at 0.0% year-on-year in 2013 after declining by 0.4% in 2012.
Sources: Volkswirtschaftliche Gesamtrechnungen der Länder, Reihe 1, Länderergebnisse Band 1 (February 2014), Table 2.3; Statistisches Bundesamt, Fachserie 18, Reihe 1.4 - 2013 (März 2014), Tables 2.2.1 and 2.2.2.
G-16
OUTPUTINTHE PRODUCTION SECTOR (1)
(2010 = 100)
| | | | | | | | | | | | | | | | | | | | |
| | | 2013 | | 2012 | | 2011 | | 2010 |
| | | | |
Production sector, total | | | | 106.3 | | | | | 106.2 | | | | | 106.7 | | | | | 99.5 | |
Industry (2) | | | | 107.8 | | | | | 107.5 | | | | | 108.1 | | | | | 99.4 | |
of which: | | | | | | | | | | | | | | | | | | | | |
Intermediate goods (3) | | | | 104.5 | | | | | 104.6 | | | | | 107.0 | | | | | 99.5 | |
Capital goods (4) | | | | 114.0 | | | | | 113.3 | | | | | 111.9 | | | | | 99.3 | |
Durable goods (5) | | | | 100.2 | | | | | 100.5 | | | | | 104.2 | | | | | 99.4 | |
Nondurable goods (6) | | | | 100.2 | | | | | 99.8 | | | | | 101.3 | | | | | 99.5 | |
Energy (7) | | | | 95.4 | | | | | 97.3 | | | | | 95.6 | | | | | 100.1 | |
Construction (8) | | | | 105.5 | | | | | 105.8 | | | | | 107.0 | | | | | 99.3 | |
| (1) | Adjusted for working-day variations. |
| (2) | Manufacturing sector, unless assigned to the main grouping energy, plus mining and quarrying. |
| (3) | Including mining and quarrying except energy-producing goods. |
| (4) | Including manufacture of motor vehicles and components. |
| (5) | Consumption goods that have a long-term use, such as furniture. |
| (6) | Consumption goods that have a short-term use, such as food. Including printing and service activities related to printing. |
| (7) | Electricity, gas, steam and hot water supply, mining and quarrying of energy-producing materials, and especially manufacture of refined petroleum products. |
| (8) | Comprises the economic classifications “Site preparation” and “Building of complete constructions or parts thereof; civil engineering.” |
Source: Deutsche Bundesbank, Monatsbericht März 2014, Table XI.2.
Services Sector
As in most other industrialized countries, the services sector, which comprises “trade, transport, accommodation and food services,” “information and communication,” “financial and insurance services,” “real estate activities,” “business services,” “public services, education, health” as well as “other services,” has expanded rapidly in recent years and is currently the largest contributor to gross value added. In 2013, the services sector’s aggregate contribution to gross value added at current prices increased slightly to 69.0% (after 68.7% in 2012 and only 62.5% in 1991). Within the services sector, “public services, education, health” represented the largest subsector in terms of contribution to total gross value added at current prices, contributing 18.4% in 2013 and 2012, compared to 15.9% in 1991.
Source: Statistisches Bundesamt, Fachserie 18, Reihe 1.4 - 2013 (March 2014), Table 2.2.1.
Employment and Labor
Despite the slowdown in economic growth in 2012 and 2013, labor market conditions remained robust. In 2013, the average unemployment rate according to the national definition was 6.9%, compared to 6.8% in 2012. Under the ILO definition, the average unemployment rate was 5.1% in 2013 compared to 5.3% in 2012, having declined to the lowest level of unemployment since 1991. The number of persons resident in Germany who were either employed or self-employed in 2013 was 41.8 million, an increase of 0.6% compared to 2012.
Sources: Bundesagentur für Arbeit, Der Arbeits- und Ausbildungsmarkt in Deutschland: Monatsbericht Februar 2014, Table 5.1 (http://statistik.arbeitsagentur.de/Statischer-Content/Arbeitsmarktberichte/Monatsbericht-Arbeits-Ausbildungsmarkt-Deutschland/Monatsberichte/Generische-Publikationen/Monatsbericht-201402.pdf); Statistisches Bundesamt, Fachserie 18, Reihe 1.4 - 2013 (März 2014), Table 2.1.12 (https://www.destatis.de/DE/Publikationen/Thematisch/VolkswirtschaftlicheGesamtrechnungen/Inlandsprodukt/InlandsproduktsberechnungVorlaeufigPDF_2180140.pdf?__blob=publicationFile); Statistisches Bundesamt, Arbeitsmarkt, Werte, Registrierte Arbeitslose, Arbeitslosenquote nach Gebietsstand (https://www.destatis.de/DE/ZahlenFakten/Indikatoren/LangeReihen/Arbeitsmarkt/lrarb001.html).
G-17
The following table presents data with respect to employment and unemployment for each of the years indicated. Persons who are participating in programs such as vocational training, job creation plans or early retirement, which are designed to reduce unemployment are not included in the unemployment rates shown below, as they are not treated as unemployed.
EMPLOYMENTAND UNEMPLOYMENT
| | | | | | | | | | | | | | | | | | | | | | | | | |
| | | 2013 | | 2012 | | 2011 | | 2010 | | 2009 |
Employed (in thousands)–ILO definition | | | | 41,841 | | | | | 41,608 | | | | | 41,152 | | | | | 40,587 | | | | | 40,372 | |
Unemployed (in thousands)–ILO definition (1) | | | | 2,263 | | | | | 2,316 | | | | | 2,502 | | | | | 2,946 | | | | | 3,228 | |
Unemployment rate (in %)–ILO definition | | | | 5.1 | | | | | 5.3 | | | | | 5.7 | | | | | 6.8 | | | | | 7.4 | |
Unemployed (in thousands)–national definition (2) | | | | 2,950 | | | | | 2,897 | | | | | 2,976 | | | | | 3,238 | | | | | 3,415 | |
Unemployment rate (in %)–national definition (3) | | | | 6.9 | | | | | 6.8 | | | | | 7.1 | | | | | 7.7 | | | | | 8.1 | |
| (1) | Unemployed persons, available and seeking work. |
| (2) | Registered unemployed persons, available and seeking work (but including persons working up to 15 hours per week). |
| (3) | As a percentage of the total work force (excluding armed forces). |
Sources: Bundesagentur für Arbeit, Der Arbeits- und Ausbildungsmarkt in Deutschland: Dezember und das Jahr 2013, Table 10.1; Statistisches Bundesamt, Fachserie 18, Reihe 1.2 - 4. Vierteljahr 2013 (February 2014), Table 1.10.
In 2013, gross wages and salaries per employee in Germany increased by 2.2%. Unit labor costs per hour worked rose by 2.0% in 2013 after 2.8% in 2012.
Source: Statistisches Bundesamt, Fachserie 18, Reihe 1.2. - 4. Vierteljahr 2013 (February 2014), Tables 2.17 and 2.20. (https://www.destatis.de/DE/Publikationen/Thematisch/VolkswirtschaftlicheGesamtrechnungen/Inlandsprodukt/InlandsproduktsberechnungVjPDF_2180120.pdf?__blob=publicationFile).
The following table shows changes in the annual wage level per employee and unit labor costs per hour worked for each of the years indicated.
WAGE TRENDSAND LABOR COSTS
| | | | | | | | | | | | | | | | | | | | | | | | | |
| | | 2013 | | 2012 | | 2011 | | 2010 | | 2009 |
Gross wages and salaries per employee in EUR | | | | 31,019 | | | | | 30,349 | | | | | 29,494 | | | | | 28,561 | | | | | 27,927 | |
Change from previous year in % | | | | 2.2 | | | | | 2.9 | | | | | 3.3 | | | | | 2.3 | | | | | -0.0 | |
Unit labor costs per hour worked | | | | | | | | | | | | | | | | | | | | | | | | | |
Index (2005=100) | | | | 109.4 | | | | | 107.3 | | | | | 104.3 | | | | | 103.4 | | | | | 105.0 | |
Change from previous year in % | | | | 2.0 | | | | | 2.8 | | | | | 0.9 | | | | | -1.5 | | | | | 6.2 | |
Source: Statistisches Bundesamt, Fachserie 18, Reihe 1.2 - 4. Vierteljahr 2013 (February 2014), Tables 2.17 and 2.20.
Approximately one-fifth of the German work force consists of members of unions. The German Trade Union Federation (Deutscher Gewerkschaftsbund) serves as an umbrella organization for eight such unions. Each member union typically covers employees of an entire industry, regardless of the precise type of work done by those employees (the “one union, one industry” principle). As a result, employers usually deal with only one negotiating partner on the labor side in each specific industry.
The unions and employers of each specific industry enter into collective labor agreements (Tarifverträge) without government intervention. As a practical matter, the collective labor agreements usually apply to all employees of a given industry, regardless of whether or not a particular employee is a member of a union, so long as the employer is a member of the relevant association of employers, which is often the case. Despite their binding character, collective labor agreements usually contain opt-out clauses (Öffnungsklauseln) allowing for company-specific adjustments to be negotiated between the employer and the works council at the specific company. Moreover, there is a range of additional possibilities to deviate from these agreements. Many employers in the eastern Länder are no longer members of employers’ associations, in which case wages are individually negotiated, which often results in wage levels that are lower than those provided for by the Tarifverträge. In recent years, the number of employees in companies that are subject to labor agreements has declined.
Sources: OECD.Stat, Dataset Trade Union Density (http://stats.oecd.org/Index.aspx?QueryId=20167); Jahresbericht des DGB Bundesvorstandes 2012 (https://www.dgb-bestellservice.de/besys_dgb/pdf/DGB10015.pdf), Gewerkschaften, Bundeszentrale für politische Bildung (http://www.bpb.de/nachschlagen/lexika/handwoerterbuch-politisches-system/40284/gewerkschaften?buchstabe=J); Tarifautonomie, Bundeszentrale für politische Bildung (http://www.bpb.de/nachschlagen/lexika/handwoerterbuch-politisches-system/40387/tarifautonomie?buchstabe=J); Sachverständigenrat zur Begutachtung der gesamtwirtschaftlichen Entwicklung, Jahresgutachten 2010/2011, Rz. 499-507 (http://www.sachverstaendigenrat-wirtschaft.de/fileadmin/dateiablage/download/gutachten/ga10_ges.pdf); Bundesministerium für Wirtschaft und Technologie, Jahreswirtschaftsbericht 2011, Rz. 115; Bundesministerium für Arbeit und Soziales, Mindestlohn-Gesetze (http://www.bmas.de/DE/Themen/Arbeitsrecht/Mindestlohn/mindestlohngesetze.html); Bundesrat, Bundesrat verlangt flächendeckenden Mindestlohn, March 1, 2013 (http://www.vermittlungsausschuss.de/SharedDocs/pm/2013/052-2013.html); Deutschlands Zukunft gestalten, Koalitionsvertrag zwischen CDU, CSU und SPD, p. 48 f. (https://www.cdu.de/sites/default/files/media/dokumente/koalitionsvertrag.pdf).
G-18
Social Security, Social Protection and Social Policy
The comprehensive system of social security and protection in effect in the Federal Republic includes in particular health insurance, long-term care insurance, retirement and disability pensions, participation benefits and benefits for medical rehabilitation, protection against the effects of occupational accidents and diseases by means of the mandatory occupational accident insurance, unemployment benefits, family benefits, benefits and rehabilitation for persons with disabilities, allowances to orphans and to single persons with dependents, and the provision of general public assistance to needy persons. The majority of the German population is covered by mandatory statutory retirement pensions and health insurance. Hospitals and institutions caring for children and handicapped persons are operated by municipalities, churches, charitable institutions, and private providers.
Most of these social services are mainly funded through social security contributions from employers and employees, and a smaller part is funded through direct contributions by the Federal Republic, the Länder, municipalities and other public institutions, depending notably upon whether the respective social service is provided by an insurance-based system funded through contributions or a social-assistance-like program funded through taxes.
The Federal Republic’s statutory retirement insurance system operates on a pay-as-you-go basis, with contributions from current employers and employees funding payments to current retired persons. Generally, all employed and some self-employed and other persons are subject to mandatory insurance in the statutory retirement system. Certain persons, including employed members of particular professions (including some free-lance professions) may apply for exemption, while others, as in the case of civil servants, are automatically exempted from mandatory participation in the statutory retirement pension insurance system. Instead, exempted persons have to contribute to professional or public pension schemes or, in the case of civil servants and similar groups, they will benefit from special pension schemes for civil servants. Further, the Retirement Funds Act (Altersvermögensgesetz) aims to ensure the long-term viability of the statutory retirement pension insurance system by encouraging insurees to also sign up for designated privately funded or funded corporate pension schemes, for which certain bonus payments and tax incentives are provided, with a view to offsetting the expected decline of payments from the statutory retirement pension insurance.
Statutory health insurance coverage must be made available to all persons fulfilling the applicable eligibility criteria. Within the statutory health insurance system, insurees may choose among a large number of statutory health insurance funds that have developed historically. Persons whose gross income exceeds certain thresholds as well as civil servants, self-employed persons and members of certain professions may opt out of the statutory system and choose private health insurance coverage, which, in case of opting-out, is obligatory as well. Contributions to the statutory health insurance system are based solely on the insuree’s income situation and are independent of the insuree’s gender, age and medical risk. By contrast contributions towards private health insurance coverage are mainly calculated based on age, medical risk and the desired level of coverage. Until December 2012, reference was also made to the insuree’s gender. Following a ruling of the European Court of Justice, the principle of equal treatment of men and women in private health insurance applies to new contracts from December 2012 onwards.
In 2013, social security revenue, as shown in the national accounts, amounted to EUR 540.2 billion, and expenditure was EUR 533.6 billion. The social security budget thus incurred a surplus of EUR 6.6 billion in 2013, after a surplus of EUR 18.3 billion in 2012.
Source: Statistisches Bundesamt, Fachserie 18, Reihe 1.4 - 2013 (March 2014), Table 3.4.3.7.
In light of a changing population structure, the Federal Government has already implemented structural reforms of the statutory pension system in order to safeguard the sustainability of the social security system in the long term. To increase the sustainability of the health care system, Germany has implemented several structural reform measures in recent years to strengthen competition among payers and providers in order to improve the efficiency and quality of health care provision. In addition, Germany has implemented reforms of the statutory pension insurance which gradually raise the regular retirement age by two years to the age of 67 between 2012 and 2029. Since 2012, people with an insurance record with at least 45 years of mandatory contributions from employment or care or child-raising periods up to the child’s tenth year can claim a pension from age 65 without reductions. In January 2014, the Federal
G-19
Government proposed to temporarily reduce the retirement age to the age of 63 for this exemption from the age limit increase; the age of 63 will be gradually raised back to 65 years from 2016 to 2029. The legislative proposal is pending approval by both houses of the German Parliament.
Sources: Bundesministerium für Wirtschaft und Technologie, 2012 Annual Economic Report (http://www.bmwi.de/English/Navigation/Service/publications,did=479718.html); Growth. Education. Unity. Coalition Agreement between CDU, CSU and FDP, page 121 (http://www.cdu.de/sites/default/files/media/dokumente/091215-koalitionsvertrag-2009-2013-englisch_0.pdf); Bundesministerium der Gesundheit, Gesundheitsfonds (http://www.bmg.bund.de/Krankenversicherung/finanzierung/gesundheitsfonds.html); Bundesministerium für Arbeit und Soziales, Altersrenten (http://www.bmas.de/DE/Themen/Rente/Gesetzliche-Rentenversicherung/Leistungen/Altersrenten/altersrenten.html); Bundesministerium für Arbeit und Soziales, Fragen und Antworten zur Rente mit 67 (http://www.bmas.de/EN/Our-Topics/Pensions/pensions-from-age-67.html); Bundesministerium für Arbeit und Soziales, press release of January 29, 2014 (http://www.bmas.de/DE/Service/Presse/Pressemitteilungen/rentenpaket-kabinettsbeschluss.html); Bundesministerium für Arbeit und Soziales, Abschlagsfreie Rente ab 63 (http://www.rentenpaket.de/rp/DE/Alle-Fakten/Die-Leistungen/Rente-ab-63/rente-mit-63.html).
International Economic Relations
International economic relations are of major importance to the German economy. In 2013, exports and imports of goods and services amounted to 50.6% and 44.3% of GDP at current prices, respectively. The Federal Republic pursues a liberal foreign trade policy aimed at dismantling tariffs and other barriers to trade.
Source: Statistisches Bundesamt, Fachserie 18, Reihe 1.4 - 2013 (March 2014), Table 2.3.1.
Because the Federal Republic’s economy depends on exports, it is particularly vulnerable to trade barriers, such as protective tariffs. The Federal Government thus supports efforts to reduce trade barriers, such as the current negotiations within the framework of the WTO under the Doha Development Agenda.
Source: Bundesministerium für Wirtschaft und Technologie, Handelspolitik EU / WTO (http://www.bmwi.de/DE/Themen/Aussenwirtschaft/Handelspolitik/wto,did=615530.html).
Balance of Payments
The Federal Republic typically achieves a surplus in the trading of goods. Traditionally, this surplus has been partially offset by deficits in other fields, such as current transfers. In 2013, the current account surplus totaled EUR 206.0 billion, compared to EUR 198.6 billion in 2012.
Source: Deutsche Bundesbank, Monatsbericht März 2014, Table XII.2.
According to data prepared by the Deutsche Bundesbank, applying the annual averages of a broad monthly indicator of Germany’s price competitiveness compared to 56 trading partners based on consumer price indices, Germany’s price competitiveness has been relatively stable since 1999, fluctuating within a range of 10% of the average indicator value in the period from 1999 to 2013. In 2013, price competitiveness deteriorated by 2.3%, mainly due to the appreciation of the euro relative to the U.S. dollar and the British pound. However, the influence of variations in the euro/U.S. dollar and euro/British pound exchange rates should be viewed in light of the fact that the Euro Area Member States account for a major part of German exports (36.8% in 2013).
Since the introduction of the euro, the exchange rate against the U.S. dollar has shown high volatility. After appreciating by approximately 85% against the U.S. dollar between June 2001 and July 2008, the euro depreciated considerably relative to the U.S. dollar by approximately 23% between July 2008 and June 2010, breaking a long-term trend of appreciation. In 2013, the euro appreciated by 3.4% from its 2012 average. In February 2014 the euro had appreciated by 6.3% from its 2012 average.
Sources: Deutsche Bundesbank, Monatsbericht März 2002, Table X.11; Deutsche Bundesbank, Monatsbericht März 2009, Table XI.11; Deutsche Bundesbank, Monatsbericht März 2011, Table XI. 11; Deutsche Bundesbank, Monatsbericht März 2014, Tables XII.3, XII.11 and XII.13.
G-20
The following table shows the Federal Republic’s balance of payments for each of the years indicated.
BALANCEOF PAYMENTS (BALANCES) (1)
| | | | | | | | | | | | | | | | | | | | | | | | | |
| | | 2013 | | 2012 | | 2011 | | 2010 | | 2009 |
| | | (EUR in millions) |
Current account (2) | | | | | | | | | | | | | | | | | | | | | | | | | |
Foreign trade (3) | | | | 197,657 | | | | | 189,841 | | | | | 158,702 | | | | | 154,863 | | | | | 138,697 | |
Supplementary trade items | | | | -28,986 | | | | | -33,187 | | | | | -20,296 | | | | | -12,408 | | | | | -16,917 | |
Services (4) | | | | 2,400 | | | | | 3,289 | | | | | 3,353 | | | | | 337 | | | | | -7,220 | |
Factor income | | | | 76,921 | | | | | 76,376 | | | | | 70,530 | | | | | 54,836 | | | | | 59,355 | |
Current transfers | | | | -42,037 | | | | | -37,749 | | | | | -33,863 | | | | | -38,299 | | | | | -33,191 | |
| | | | | | | | | | | | | | | | | | | | | | | | | |
Total current account | | | | 205,955 | | | | | 198,571 | | | | | 178,427 | | | | | 159,329 | | | | | 140,724 | |
Capital transfers and purchases/sales of intangible non-produced assets | | | | 1,810 | | | | | 16 | | | | | 634 | | | | | -575 | | | | | 28 | |
Capital account | | | | | | | | | | | | | | | | | | | | | | | | | |
Total net German investment abroad (increase/capital exports—negative figure) | | | | -15,765 | | | | | -355,139 | | | | | -245,685 | | | | | -410,443 | | | | | -20,033 | |
Total net foreign investment in Germany (increase/capital imports—positive figure) | | | | -234,834 | | | | | 132,434 | | | | | 70,956 | | | | | 285,491 | | | | | -136,383 | |
| | | | | | | | | | | | | | | | | | | | | | | | | |
Total net capital export (5) | | | | -250,599 | | | | | -222,705 | | | | | -174,729 | | | | | -124,952 | | | | | -156,416 | |
Balance of unclassifiable transactions | | | | 42,833 | | | | | 24,118 | | | | | -4,331 | | | | | -33,802 | | | | | 15,664 | |
| (1) | Figures are subject to considerable uncertainty owing to changes in the method of data collection in foreign trade. |
| (2) | Foreign trade and services are recorded on the basis of exports (f.o.b.)/imports (c.i.f.) (i.e., including the freight and insurance costs of imports). |
| (3) | Special trade according to the official foreign trade statistics. Special trade consists principally of goods that are imported into the Federal Republic for use, consumption, adaptation or processing, as well as goods that are produced, manufactured, adapted or processed in the Federal Republic and are exported. |
| (4) | Excluding the freight and insurance costs included in the c.i.f. import value. |
| (5) | Including change of currency reserves. |
Source: Deutsche Bundesbank, Statistisches Beiheft 3 zum Monatsbericht März 2014, Zahlungsbilanzstatistik, Tables I.1 and I.9.a.
Balance of Trade
The following tables show information relating to foreign trade of the Federal Republic for each of the years indicated.
FOREIGN TRADEOF GOODS
| | | | | | | | | | | | | | | | | | | | | | | | | |
| | | 2013 | | 2012 | | 2011 | | 2010 | | 2009 |
| | | (EUR in millions) |
| | | | | |
Exports of goods (f.o.b.) | | | | 1,093,812 | | | | | 1,095,766 | | | | | 1,061,225 | | | | | 951,959 | | | | | 803,312 | |
Imports of goods (c.i.f.) | | | | 896,155 | | | | | 905,925 | | | | | 902,523 | | | | | 797,097 | | | | | 664,615 | |
| | | | | | | | | | | | | | | | | | | | | | | | | |
Trade surplus | | | | 197,657 | | | | | 189,841 | | | | | 158,702 | | | | | 154,863 | | | | | 138,697 | |
| | | | | | | | | | | | | | | | | | | | | | | | | |
Source: Deutsche Bundesbank, Statistisches Beiheft 3 zum Monatsbericht März 2014, Zahlungsbilanzstatistik, Table I.1.
The Federal Republic’s principal export goods are motor vehicles, machinery of all kinds, and chemical products. The principal import goods are crude petroleum and natural gas, computer, electronic and optical products and motor vehicles. The Federal Republic has relatively few resources of industrial raw materials. As a result, it largely depends on imports to satisfy its demand for raw materials. This dependence on foreign supplies is particularly significant in the case of metals such as copper, tungsten, niobium, rare earth, rock phosphate, lithium carbonate, bauxite, manganese, titanium, and tin. The Federal Republic currently imports about two-thirds of its energy requirements, including virtually all of its oil and a significant portion of its natural gas requirements as well as all enriched uranium needed for nuclear energy.
Sources: Statistisches Bundesamt, Fachserie 7 Reihe 1 - November 2013, P. 58 (https://www.destatis.de/DE/Publikationen/Thematisch/Aussenhandel/Gesamtentwicklung/ZusammenfassendeUebersichtenM2070100131114.pdf?__blob=publicationFile); Bundesanstalt für Geowissenschaften und Rohstoffe, Deutschland – Rohstoffsituation 2012, p. 20; Bundesministerium für Wirtschaft und Technologie, Zahlen und Fakten Energiedaten, Tabelle 3 (http://bmwi.de/DE/Themen/Energie/Energiedaten-und-analysen/Energiedaten/gesamtausgabe,did=476134.html).
G-21
Germany’s current account surplus and the Macroeconomic Imbalance Procedure
Within the framework of the macroeconomic imbalance procedure established in 2011, the European Commission published an Alert Mechanism Report on November 13, 2013, which inter alia noted the current account surplus observed in Germany. Following publication of the report, an in-depth review process was initiated on Germany to scrutinize its external position and analyze internal developments, and to assess whether it is experiencing macroeconomic imbalances. According to the results of this review, Germany is experiencing macroeconomic imbalances, which require monitoring and policy action. In particular, the current account has persistently recorded a very high surplus, which reflects strong competitiveness while a large amount of savings were invested abroad. The Federal Government supports the macroeconomic imbalance procedure. Together with the European partners, the Federal Government aims to reduce economic imbalances while complying with the rules of the reformed Stability and Growth Pact. However, it points out that the competitiveness and the exporting strength of German companies are a pillar of the entire European economy. The measures proposed by the new German government after the September 2013 elections are designed to enhance public and private investment and strengthen the domestic growth drivers, thus contributing to the reduction of imbalances.
Sources: European Commission, Report from the Commission to the European Parliament, the Council, the European Central Bank and the European Economic and Social Committee, Alert Mechanism Report 2014 dated November 13, 2013 (http://ec.europa.eu/europe2020/pdf/2014/amr2014_en.pdf); EUROPEAN ECONOMY, Occasional Papers 174 | March 2014, Macroeconomic Imbalances Germany 2014, p. 3 (http://ec.europa.eu/economy_finance/publications/occasional_paper/2014/pdf/ocp174_en.pdf); Federal Ministry of Economic Affairs and Energy, Press release 2014-3-5 (http://www.bmwi.de/EN/Press/press-releases,did=629018.html).
G-22
COMPOSITIONOF EXPORTEDAND IMPORTED GOODS
| | | | | | | | | | |
| | | 2013 (1) |
| | | Imports | | Exports |
| | | (Percent of total) |
Products of agriculture and hunting | | | | 3.0 | | | | | 0.9 | |
Products of forestry | | | | 0.1 | | | | | 0.0 | |
Fish and products of fishing | | | | 0.1 | | | | | 0.0 | |
Coal and lignite | | | | 0.5 | | | | | 0.0 | |
Crude petroleum and natural gas | | | | 10.5 | | | | | 1.0 | |
Metal ores | | | | 0.8 | | | | | 0.0 | |
Other mining and quarrying products | | | | 0.2 | | | | | 0.1 | |
Food products | | | | 4.4 | | | | | 4.3 | |
Beverages | | | | 0.6 | | | | | 0.4 | |
Tobacco products | | | | 0.1 | | | | | 0.3 | |
Textiles | | | | 1.1 | | | | | 0.9 | |
Wearing apparel | | | | 3.0 | | | | | 1.3 | |
Leather and related products | | | | 1.1 | | | | | 0.5 | |
Wood and of products of wood and cork, except furniture; articles of straw and plaiting materials | | | | 0.6 | | | | | 0.5 | |
Paper and paper products | | | | 1.6 | | | | | 1.7 | |
Coke and refined petroleum products | | | | 3.4 | | | | | 1.4 | |
Chemicals and chemical products | | | | 8.0 | | | | | 9.6 | |
Basic pharmaceutical products and pharmaceutical preparations | | | | 4.2 | | | | | 5.3 | |
Rubber and plastic products | | | | 2.8 | | | | | 3.5 | |
Other non-metallic mineral products | | | | 1.0 | | | | | 1.2 | |
Basic metals | | | | 5.7 | | | | | 4.8 | |
Fabricated metal products, except machinery and equipment | | | | 2.6 | | | | | 3.5 | |
Computer, electronic and optical products | | | | 9.2 | | | | | 7.7 | |
Electrical equipment | | | | 4.9 | | | | | 6.1 | |
Machinery and equipment not elsewhere classified | | | | 7.4 | | | | | 14.9 | |
Motor vehicles, trailers and semi-trailers | | | | 9.0 | | | | | 17.4 | |
Other transport equipment | | | | 4.1 | | | | | 4.5 | |
Furniture | | | | 1.1 | | | | | 0.8 | |
Energy | | | | 0.2 | | | | | 0.3 | |
Other goods | | | | 8.9 | | | | | 7.1 | |
| | | | | | | | | | |
Total | | | | 100.0 | | | | | 100.0 | |
| | | | | | | | | | |
Source: Statistisches Bundesamt, Fachserie 7, Reihe 1 - Dezember 2013 (March 2014), Tables 5.1 and 5.2; calculation of percentages by KfW based on import and export values in EUR thousands, respectively.
G-23
FOREIGN TRADE (SPECIAL TRADE)BY GROUPSOF COUNTRIESAND COUNTRIES (1)
| | | | | | | | | | | | | | | |
| | | 2013 | | 2012 | | 2011 |
| | | (EUR in millions) |
| | | |
Exports to: | | | | | | | | | | | | | | | |
Total | | | | 1,093,812 | | | | | 1,095,766 | | | | | 1,061,225 | |
of which: | | | | | | | | | | | | | | | |
France | | | | 100,337 | | | | | 102,911 | | | | | 101,444 | |
United States | | | | 88,375 | | | | | 86,971 | | | | | 73,776 | |
United Kingdom | | | | 75,692 | | | | | 73,283 | | | | | 65,570 | |
The Netherlands | | | | 71,079 | | | | | 70,381 | | | | | 69,423 | |
China (2) | | | | 67,025 | | | | | 66,746 | | | | | 64,863 | |
Austria | | | | 56,152 | | | | | 56,591 | | | | | 57,671 | |
Italy | | | | 53,302 | | | | | 55,529 | | | | | 62,044 | |
Belgium/Luxembourg | | | | 47,850 | | | | | 49,424 | | | | | 53,161 | |
Switzerland | | | | 47,323 | | | | | 48,933 | | | | | 47,875 | |
Southeast Asia (3) | | | | 46,042 | | | | | 45,651 | | | | | 41,569 | |
Spain | | | | 31,349 | | | | | 31,047 | | | | | 34,811 | |
Japan | | | | 17,125 | | | | | 17,138 | | | | | 15,115 | |
| | | |
Imports from: | | | | | | | | | | | | | | | |
Total | | | | 896,155 | | | | | 905,925 | | | | | 902,523 | |
of which: | | | | | | | | | | | | | | | |
The Netherlands | | | | 89,247 | | | | | 85,738 | | | | | 81,804 | |
China (2) | | | | 73,377 | | | | | 78,529 | | | | | 79,528 | |
France | | | | 64,228 | | | | | 64,035 | | | | | 65,948 | |
United States | | | | 48,526 | | | | | 51,070 | | | | | 48,531 | |
Italy | | | | 47,517 | | | | | 47,957 | | | | | 47,844 | |
United Kingdom | | | | 42,258 | | | | | 42,820 | | | | | 44,741 | |
Belgium/Luxembourg | | | | 41,928 | | | | | 40,528 | | | | | 41,302 | |
Switzerland | | | | 38,199 | | | | | 37,775 | | | | | 36,996 | |
Austria | | | | 36,825 | | | | | 36,419 | | | | | 37,028 | |
Southeast Asia (3) | | | | 36,628 | | | | | 37,428 | | | | | 39,546 | |
Spain | | | | 23,785 | | | | | 23,206 | | | | | 22,491 | |
Japan | | | | 19,497 | | | | | 21,910 | | | | | 23,595 | |
| (1) | Exports (f.o.b.) by country of destination, imports (c.i.f.) by country of origin. Special trade consists mainly of goods that are imported into the Federal Republic for use, consumption, adaptation or processing, as well as goods that are produced, manufactured, adapted or processed in the Federal Republic and subsequently exported. |
| (3) | Includes Brunei Darussalam, Hong Kong, Indonesia, Malaysia, Philippines, Singapore, South Korea, Taiwan and Thailand. |
Source: Deutsche Bundesbank, Monatsbericht März 2014, Table XII.3.
G-24
MONETARY AND FINANCIAL SYSTEM
The European System of Central Banks and the Eurosystem
The ESCB comprises the ECB and the national central banks of the Member States, while the Eurosystem consists of the ECB and the national central banks of the Euro Area Member States.
The Eurosystem is responsible for the single monetary policy for the euro area. Its decision-making bodies are the Governing Council and the Executive Board of the ECB. The national central banks of the Member States that are not part of the Eurosystem are represented in the General Council of the ECB, but have no voting right in the decision-making process, particularly with respect to monetary policy. The ESCB’s primary objective is to maintain price stability. Without prejudice to this objective, the ESCB supports the general economic policies of the EU.
The Deutsche Bundesbank - Germany’s national central bank within the ESCB - has the responsibility of implementing the single monetary policy in Germany and continues to perform various other tasks, including acting as the Federal Government’s fiscal agent and playing an important role in banking and financial market supervision, as further described below under the caption “—Financial System.”
Sources: European Central Bank, Annual Report 2004, pages 162-168 (http://www.ecb.eu/pub/pdf/annrep/ar2004en.pdf); Deutsche Bundesbank, Tasks and organisation (http://www.bundesbank.de/Navigation/EN/Bundesbank/Tasks_and_organisation/Tasks/tasks.html).
Monetary Policy Instruments of the ESCB
To achieve its operational goals, the ESCB conducts open market operations, offers standing facilities and requires credit institutions to maintain minimum reserves in accounts with the ESCB. Open market operations play an important role in the ESCB’s monetary policy for the purposes of steering interest rates and managing the liquidity situation in the market. Available open market operations are reverse transactions, outright transactions, the issuance of debt certificates or foreign exchange swaps, and the collection of fixed-term deposits. Standing facilities are designed to provide or absorb overnight liquidity and the imposition of minimum reserve requirements allows the ESCB to stabilize money market interest rates, create (or enlarge) a structural liquidity shortage and possibly contribute to the control of monetary expansion. The ESCB has employed a variety of policy instruments in response to the global economic and financial crisis and the European sovereign debt crisis. For further information, see “—Policy Responses to the Global Economic and Financial Crisis—Policy Responses at the EU Level.”
Source: European Central Bank, Implementation of Monetary Policy in the Euro Area, September 2006, pages 7-9 (http://www.ecb.int/pub/pdf/other/gendoc2006en.pdf).
Monetary Policy Strategy and Prices
The ECB’s primary goal is to maintain medium-term price stability, which is defined as a year-on-year increase in the harmonized index of consumer prices for the euro area of less than 2%. However, the ECB has clarified that, within this definition, it aims at an inflation rate close to 2%. This goal indicates the commitment to provide an adequate margin to avoid the risk of deflation. The stability-oriented monetary policy strategy of the Eurosystem used by the ECB to achieve this goal is based on two pillars: (1) analysis and assessment of short- to medium-term risks to price stability (economic analysis); and (2) assessment of medium- to long-term monetary developments (monetary analysis).
Sources: European Central Bank, Monthly Bulletin, January 1999, pages 45-50 (http://www.ecb.eu/pub/pdf/mobu/mb199901en.pdf); European Central Bank, The Monetary Policy of the ECB, 2004, page 50ff. (http://www.ecb.int/pub/pdf/other/monetarypolicy2004en.pdf).
G-25
The following table shows price trends in Germany for the periods indicated.
PRICE TRENDS
| | | | | | | | | | | | | | | | | | | | | | | | | |
| | | 2013 | | 2012 | | 2011 | | 2010 | | 2009 |
| | | (change from previous year in %) |
| | | | | |
Harmonized index of consumer prices (HICP) | | | | 1.6 | | | | | 2.1 | | | | | 2.5 | | | | | 1.2 | | | | | 0.2 | |
Consumer price index (CPI) | | | | 1.5 | | | | | 2.0 | | | | | 2.1 | | | | | 1.1 | | | | | 0.3 | |
Index of producer prices of industrial products sold on the domestic market (1) | | | | -0.1 | | | | | 1.6 | | | | | 5.3 | | | | | 1.5 | | | | | -4.2 | |
| (1) | Excluding value-added tax. |
Sources: Statistisches Bundesamt, Verbraucherpreise, Harmonisierter Verbraucherpreisindex, Veränderungsraten zum Vorjahr in % (https://www.destatis.de/DE/ZahlenFakten/GesamtwirtschaftUmwelt/Preise/Verbraucherpreisindizes/Tabellen_/HarmonisierterVerbraucherpreisindex.html?cms_gtp=146602_list%253D2%2526146598_slot%253D2&https=1); Statistisches Bundesamt, Verbraucherpreisindizes, Harmonisierter Verbraucherpreisindex für Deutschland, Veränderungsraten zum Vorjahr in % (https://www.destatis.de/DE/ZahlenFakten/GesamtwirtschaftUmwelt/Preise/Verbraucherpreisindizes/Tabellen_/VerbraucherpreiseKategorien.html?cms_gtp=145114_list%253D2%2526145110_slot%253D2&https=1); Deutsche Bundesbank, Monatsbericht Februar 2014, Table XI.7.
Official Foreign Exchange Reserves
The following table shows the breakdown of the Federal Republic’s official foreign exchange reserves as of the end of the years indicated.
OFFICIAL FOREIGN EXCHANGE RESERVESOFTHE FEDERAL REPUBLIC (1)
| | | | | | | | | | | | | | | | | | | | | | | | | |
| | | As of December 31 |
| | | 2013 | | 2012 | | 2011 | | 2010 | | 2009 |
| | | (EUR in millions) |
Gold | | | | 94,876 | | | | | 137,513 | | | | | 132,874 | | | | | 115,403 | | | | | 83,939 | |
Foreign currency balances | | | | 28,080 | | | | | 28,774 | | | | | 29,433 | | | | | 27,957 | | | | | 25,634 | |
Reserve position in the IMF and special drawing rights | | | | 20,798 | | | | | 22,344 | | | | | 22,296 | | | | | 18,740 | | | | | 15,969 | |
| | | | | | | | | | | | | | | | | | | | | | | | | |
Total | | | | 143,753 | | | | | 188,630 | | | | | 184,603 | | | | | 162,100 | | | | | 125,541 | |
| | | | | | | | | | | | | | | | | | | | | | | | | |
| (1) | External position of the Deutsche Bundesbank in the EMU. Assets and liabilities vis-à-vis all EMU member countries and non-EMU member countries. |
Source: Deutsche Bundesbank, Monatsbericht März 2014, Table XII.9.
The Federal Republic’s foreign reserve assets are managed by the Deutsche Bundesbank. The Euro Area Member States have transferred foreign reserve assets to the ECB in an aggregate amount equivalent to approximately EUR 40.3 billion, consisting of foreign currency reserves and gold. The ECB manages the foreign reserve assets transferred to it. The foreign reserve assets not transferred to the ECB continue to be held and managed by the national central banks of the Euro Area Member States. In order to ensure consistency within the single monetary and foreign exchange policies of the EMU, the ECB monitors and coordinates market transactions conducted with those assets.
Sources: European Central Bank, Annual Report 1998, page 74 (http://www.ecb.int/pub/pdf/annrep/ar1998en.pdf); European Central Bank, Annual Accounts 2013, page 4 (http://www.ecb.europa.eu/pub/pdf/annrep/ar2013annualaccounts_en.pdf).
G-26
External Positions of Banks
The following table shows the external assets and liabilities of the Deutsche Bundesbank and the banks (monetary financial institutions) of the Federal Republic as of the end of each of the years indicated.
EXTERNAL FINANCIAL ASSETSAND LIABILITIESBY SECTOR
| | | | | | | | | | | | | | | | | | | | | | | | | |
| | | 2013 | | 2012 | | 2011 | | 2010 | | 2009 |
| | | (EUR in billions) |
Deutsche Bundesbank | | | | | |
Assets | | | | 721.7 | | | | | 921.0 | | | | | 714.7 | | | | | 524.7 | | | | | 323.3 | |
Liabilities | | | | 57.2 | | | | | 106.5 | | | | | 46.6 | | | | | 14.6 | | | | | 9.1 | |
| | | | | | | | | | | | | | | | | | | | | | | | | |
Net position | | | | 664.5 | | | | | 814.5 | | | | | 668.1 | | | | | 510.1 | | | | | 314.2 | |
of which: within Eurosystem (1) | | | | 523.1 | | | | | 668.6 | | | | | 475.9 | | | | | 337.9 | | | | | 189.9 | |
Banks | | | | | | | | | | | | | | | | | | | | | | | | | |
Loans to foreign banks | | | | 1,019.7 | | | | | 1,046.0 | | | | | 1,117.6 | | | | | 1,154.1 | | | | | 1,277.4 | |
Loans to foreign non-banks | | | | 701.0 | | | | | 729.0 | | | | | 744.4 | | | | | 773.8 | | | | | 815.7 | |
Loans from foreign banks | | | | 515.7 | | | | | 691.1 | | | | | 655.7 | | | | | 741.7 | | | | | 652.6 | |
Loans from foreign non-banks | | | | 257.8 | | | | | 237.6 | | | | | 225.9 | | | | | 227.6 | | | | | 216.3 | |
| (1) | Consists mainly of claims from the interbank payment system for the real-time processing of cross-border transfers throughout the EMU (TARGET2). |
Source: Deutsche Bundesbank, Monatsbericht März 2014, Tables IV.4 and XII.9.
Foreign Exchange Rates and Controls
The euro is a freely convertible currency. Since its introduction in 1999, the euro has become the second most widely used currency internationally. Currency transactions do not require licenses or other permissions. Capital market transactions are not subject to any license or similar requirements. Gold may be imported and exported freely, subject only to the levy of value added tax (“VAT”) on some transactions.
Capital controls introduced in Cyprus in the second half of March 2013 to facilitate the restructuring of its banking sector are a transitory exception to this rule. In exiting capital restrictions, Cyprus is sticking to a roadmap outlined in its economic adjustment program. The first stage of the exit has been completed, but restrictions are still in place.
Sources: Central Bank of Cyprus, The Enforcement of Restrictive Measures on Transactions in case of Emergency Law of 2013, press release of March 28, 2013 (http://www.centralbank.gov.cy/nqcontent.cfm?a_id=12588); European Commission, The Economic Adjustment Programme for Cyrus, Second Review, December 2013, page 21ff (http://ec.europa.eu/economy_finance/publications/occasional_paper/2013/pdf/ocp169_en.pdf).
The following table shows the annual average exchange rates for selected currencies in relation to the euro for the years indicated.
ANNUAL AVERAGE EXCHANGE RATESOFTHE EURO (1)
| | | | | | | | | | | | | | | | | | | | | | | | | |
| | | 2013 | | 2012 | | 2011 | | 2010 | | 2009 |
U.S. dollars per euro | | | | 1.3281 | | | | | 1.2848 | | | | | 1.3920 | | | | | 1.3257 | | | | | 1.3948 | |
Pound sterling per euro | | | | 0.84926 | | | | | 0.81087 | | | | | 0.86788 | | | | | 0.85784 | | | | | 0.89094 | |
Japanese yen per euro | | | | 129.66 | | | | | 102.49 | | | | | 110.96 | | | | | 116.24 | | | | | 130.34 | |
Swiss franc per euro | | | | 1.2311 | | | | | 1.2053 | | | | | 1.2326 | | | | | 1.3803 | | | | | 1.5100 | |
Chinese yuan per euro | | | | 8.1646 | | | | | 8.1052 | | | | | 8.9960 | | | | | 8.9712 | | | | | 9.5277 | |
| (1) | Calculated from daily values. |
Source: Deutsche Bundesbank, Monatsbericht Februar 2014, Table XII.11.
G-27
Financial System
As of January 31, 2014, 1,840 monetary financial institutions in Germany reported an aggregate balance sheet total of EUR 7,685.6 billion to the Deutsche Bundesbank. According to the Deutsche Bundesbank’s classification, these institutions included:
| | • | | 275 commercial banks, with an aggregate balance sheet total of EUR 2,847.3 billion; |
| | • | | 417 savings banks, with an aggregate balance sheet total of EUR 1,101.2 billion; |
| | • | | the ten regional institutions of those savings banks, including Deka-Bank Deutsche Girozentrale (the central asset managing institution of the German savings banks) and nine Landesbanken (German public law financial institutions traditionally focusing on the banking business for and in the Land in which they operate), with an aggregate balance sheet total of EUR 1,100.2 billion; |
| | • | | 20 special-purpose credit institutions, including KfW, KfW IPEX-Bank and promotional banks of the federal states (Landesförderinstitute), with an aggregate balance sheet total of EUR 958.7 billion; |
| | • | | 1,078 credit cooperatives, with an aggregate balance sheet total of EUR 757.7 billion; |
| | • | | the two central institutions of those credit cooperatives, with an aggregate balance sheet total of EUR 275.3 billion; |
| | • | | 17 mortgage banks, with an aggregate balance sheet total of EUR 439.8 billion; |
| | • | | 22 building and loan associations, with an aggregate balance sheet total of EUR 205.5 billion; and |
| | • | | 145 subsidiaries and branches of foreign banks located in the Federal Republic, with an aggregate balance sheet total of EUR 857.1 billion. |
Source: Deutsche Bundesbank, Monatsbericht März 2014, Table IV.2 (http://www.bundesbank.de/Redaktion/DE/Downloads/Veroeffentlichungen/Monatsberichte/2014/2014_03_monatsbericht.html).
The German Banking Act (Kreditwesengesetz, or “KWG”) currently regulates all banks except for the Deutsche Bundesbank and KfW (although it may regulate subsidiaries of KfW). German commercial banking institutions operate as “universal” banks and are not restricted by law or otherwise from offering a complete range of diverse financial services.
The Federal Financial Supervisory Authority (Bundesanstalt für Finanzdienstleistungsaufsicht, or “BaFin”) is responsible for the integrated supervision of financial services. Its primary objective is to ensure the proper functioning, stability and integrity of the German financial system. The BaFin operates exclusively in the public interest. It seeks to ensure the ability of banks, financial services institutions and insurance companies to meet their payment obligations (solvency supervision), and it also enforces standards of professional conduct aimed at preserving investors’ trust in the financial markets (market supervision). In addition, the BaFin has an investor protection role in that it seeks to prevent unauthorized financial business from being carried out. The Deutsche Bundesbank is closely involved in the ongoing supervision of credit institutions by the BaFin and has been assigned a substantial number of the ongoing operational tasks in banking supervision. The BaFin is supervised by the Federal Ministry of Finance. In early 2013, key components of the Act on the Strengthening of German Financial Supervision (Gesetz zur Stärkung der deutschen Finanzaufsicht) entered into force. Among other measures, this Act provides the legal basis for the creation of the Financial Stability Commission, consisting of representatives of the Federal Ministry of Finance, the Deutsche Bundesbank and BaFin. Due to the Deutsche Bundesbank’s macroeconomic and financial market expertise, the act confers upon it the responsibility of contributing towards safeguarding financial stability. The Deutsche Bundesbank is tasked with analyzing all relevant factors in order to identify threats to financial stability. Warnings or recommendations for corrective measures are submitted to the Financial Stability Commission. Resolutions regarding such warnings and recommendations are passed by the members of the Financial Stability Commission at their quarterly meetings. In addition, the Financial Stability Commission is tasked with defining concerted reactions to emerging threats to financial stability by issuing warnings and recommendations and publishing them if appropriate. The recipients of such warnings or recommendations are obliged to report on the implementation of corrective measures. The Financial Stability Commission was formally established at its inaugural meeting on March 18, 2013. As regards cooperation between BaFin and the
G-28
Deutsche Bundesbank, the act requires these two authorities to keep each other informed of any observations, findings and assessments that BaFin and the Deutsche Bundesbank require to perform their functions. In addition, the Deutsche Bundesbank was granted the authority to request information from financial corporations if the information required to perform its functions cannot be obtained from BaFin or other authorities.
Sources: Bundesministerium der Justiz, Gesetz über das Kreditwesen (http://www.gesetze-im-internet.de/kredwg/index.html); Bundesanstalt für Finanzdienstleistungsaufsicht, BaFin, Functions & history (http://www.bafin.de/EN/BaFin/FunctionsHistory/functionshistory_node.html); Deutsche Bundesbank and Bundesanstalt für Finanzdienstleistungsaufsicht, Joint press release of November 4, 2002 (http://www.bundesbank.de/Redaktion/EN/Downloads/Press/Pressenotizen/2002/2002_11_04_banking_supervision.pdf?__blob=publicationFile); Bundesanstalt für Finanzdienstleistungsaufsicht, Aufsichtsrichtlinie—Richtlinie zur Durchführung und Qualitätssicherung der laufenden Überwachung der Kredit- und Finanzdienstleistungsinstitute durch die Deutsche Bundesbank (AufsichtsRL), May 21, 2013 (http://www.bafin.de/SharedDocs/Aufsichtsrecht/DE/Richtlinie/rl_130521_aufsichtsrichtlinie.html?nn=2696382); BaFin, Act on the Strengthening of German Financial Supervision, BaFin Quarterly of January 18, 2013 (http://www.bafin.de/SharedDocs/Downloads/EN/Mitteilungsblatt/Quarterly/bq1204.pdf?__blob=publicationFile); Bundesbank, German macroprudential oversight strengthened, press release of March 18, 2013 (http://www.bundesbank.de/Redaktion/EN/Pressemitteilungen/BBK/2013/2013_03_18_macropudential_oversight.html).
The European system of financial supervisors became operational on January 1, 2011. At the macro-financial level, a European Systemic Risk Board (the “ESRB”) was established, which provides macro-prudential oversight of the financial system. The ESRB’s role is to monitor and assess potential risks to the stability of the financial system. If necessary, it will issue risk warnings and recommendations for remedial action and will monitor their implementation. The ESRB is chaired by the President of the ECB for an initial term of five years.
At the micro-financial level, three supervisory authorities were established:
| | • | | the European Banking Authority, or “EBA;” |
| | • | | the European Insurance and Occupational Pensions Authority; and |
| | • | | the European Securities and Markets Authority.” |
The three European Supervisory Authorities (the “ESAs”) replace the previous three committees of supervisors at the EU level (the Committee of European Securities Regulators, the Committee of European Banking Supervisors and the Committee of European Insurance and Occupational Pensions). The ESAs work in tandem with the supervisory authorities of the Member States. National authorities remain responsible for the day-to-day supervision of individual firms, whereas the ESAs will be responsible for ensuring that a single set of harmonized rules and consistent supervisory practices are applied by supervisory authorities of the Member States. The ESAs have, for example, the power to settle disputes among national financial supervisors by imposing legally binding mediation and to impose temporary bans on risky financial products or activities.
Source: European Commission, Financial Supervision (http://ec.europa.eu/internal_market/finances/committees/index_en.htm).
The European sovereign debt crisis has shown that the European system of financial supervision could be improved. Accordingly, on October 15, 2013, the Council adopted regulations creating a single supervisory mechanism (“SSM”) for the oversight of banks and other credit institutions, thus establishing one of the main elements of Europe’s banking union. The SSM will be composed of the ECB and the supervisory authorities of the Member States. It will cover the euro area as well as non-euro area countries that choose to participate. The ECB will have direct oversight of euro area banks, in a differentiated manner and in close cooperation with national supervisory authorities, and will be responsible for the overall functioning of the SSM. On October 23, 2013, the ECB announced details of a comprehensive assessment of large banks to be conducted in cooperation with national supervisory authorities of Member States participating in the SSM. The assessment, which consists of a risk assessment, an asset quality review and a stress test, will be conducted over a twelve-month period, which started in November 2013, in preparation for the ECB assuming full responsibility for supervision as part of the SSM. The 24 German institutions covered by the assessment (out of more than 120 institutions overall) include some German promotional banks (but not KfW) as well as KfW IPEX-Bank.
Sources Council of the European Union, Council approves single supervisory mechanism for banking, press release of October 15, 2013 (http://www.consilium.europa.eu/uedocs/cms_Data/docs/pressdata/en/ecofin/139012.pdf); European Central Bank, ECB starts comprehensive assessment in advance of supervisory role, press release of October 23, 2013 (http://www.ecb.europa.eu/press/pr/date/2013/html/pr131023.en.html); European Central Bank, Note on Comprehensive Assessment October 2013 (http://www.ecb.europa.eu/pub/pdf/other/notecomprehensiveassessment201310en.pdf?065ff8953213aaf23e385c1119dd541a).
On March 20, 2014, the European Parliament and the Council reached a provisional agreement on the proposed Single Resolution Mechanism (“SRM”), which would complement the SSM. The SRM is set to centralize key competences and resources for managing
G-29
the failure of any bank in the euro area and in other Member States participating in Europe’s banking union. In order to become law, the European Commission’s proposal needs to be adopted jointly by the European Parliament and by the Member States in the Council. The SRM is scheduled to enter into force on January 1, 2015.
Source: European Commission, European Parliament and Council back Commission’s proposal for a Single Resolution Mechanism, press release of March 20, 2014 (http://europa.eu/rapid/press-release_STATEMENT-14-77_en.htm?locale=en).
In response to the global economic and financial crisis, regulatory authorities and central banks launched a comprehensive regulatory reform program. Consultative proposals for a new liquidity and capital framework were published in December 2009 by the Basel Committee on Banking Supervision. In July 2010, the Group of Governors and Heads of Supervision, the oversight body of the Basel Committee on Banking Supervision, reached a broad agreement on the overall design of a capital and liquidity reform package. Further agreement on specific higher minimum capital standards and new liquidity standards was reached by the Group of Governors and Heads of Supervision in September 2010. In December 2010, the Basel Committee on Banking Supervision launched a package of new standards on bank capital adequacy and liquidity to enhance the banking regulatory framework. The capital and liquidity reform package, typically referred to as Basel III, will be phased in between 2013 and 2019. In March 2013, the Council approved a compromise text transposing the Basel III agreement into EU law. The compromise text amends and replaces existing capital requirement directives by two new legislative instruments: a regulation establishing prudential requirements for institutions and a directive governing access to deposit-taking activities. Following the approval by the European Parliament in April 2013, the Council adopted the Capital Requirements Regulation (“CRR”) and the Capital Requirements Directive IV (“CRD IV”) on June 20, 2013. On January 1, 2014, the new rules entered into force.
Sources: Bank for International Settlements, Consultative proposals to strengthen the resilience of the banking sector announced by the Basel Committee, press release of December 17, 2009 (http://www.bis.org/press/p091217.htm); Bank for International Settlements, The Group of Governors and Heads of Supervision reach broad agreement on Basel Committee capital and liquidity reform package, press release of July 26, 2010 (http://www.bis.org/press/p100726.htm); Bank for International Settlements, Basel Committee on Banking Supervision, Group of Governors and Heads of Supervision announces higher global minimum capital standards, press release of September 12, 2010 (http://www.bis.org/press/p100912.pdf); Council of the European Union, Bank capital rules: Council confirms agreement with EP, press release of March 27, 2013 (http://www.consilium.europa.eu/uedocs/cms_data/docs/pressdata/en/ecofin/136581.pdf); Parliament votes reform package to strengthen EU banks, press release of April 16, 2013 (http://www.europarl.europa.eu/news/en/pressroom/content/20130416IPR07333/html/Parliament-votes-reform-package-to-strengthen-EU-banks); European Council, Council adopts new bank capital requirements, June 20, 2013 (http://www.consilium.europa.eu/uedocs/cms_Data/docs/pressdata/en/ecofin/137544.pdf); Official Journal of the European Union, Regulation (EU) No 575/2013 of the European Parliament and of the Council of 26 June 2013 on prudential requirements for credit institutions and investment firms and amending Regulation (EU) No 648/2012, June 27, 2013 (http://eur-lex.europa.eu/LexUriServ/LexUriServ.do?uri=OJ:L:2013:176:0001:0337:EN:PDF); Official Journal of the European Union, Directive 2013/36/EU of the European Parliament and of the Council of 26 June 2013 on access to the activity of credit institutions and the prudential supervision of credit institutions and investment firms, amending Directive 2002/87/EC and repealing Directives 2006/48/EC and 2006/49/EC, June 27, 2013 (http://eur-lex.europa.eu/LexUriServ/LexUriServ.do?uri=OJ:L:2013:176:0338:0436:EN:PDF).
Securities Market
The Federal Republic’s securities market is among Europe’s largest. Trading in listed securities is not legally or otherwise confined to the stock exchanges. It is estimated, however, that most transactions in equity securities are executed through stock exchanges. By contrast, debt securities, although typically listed, are predominantly traded over-the-counter.
Highly developed secondary markets, combined with the distribution capabilities of an extensive network of financial institutions, provide the basis for the Federal Republic’s position in the world’s capital markets. Equity and debt issues are generally underwritten and distributed through banking syndicates, which typically include commercial banks as well as certain regional and specialized institutions. The regulated securities markets in Berlin, Dusseldorf, Frankfurt am Main, Hamburg, Hanover, Munich and Stuttgart, the futures and options exchange Eurex Deutschland and the European Energy Exchange are recognized as regulated markets of the EU according to Article 47 of Directive 2004/39/EC on Markets in Financial Instruments and comply with globally accepted regulatory standards.
Based on total turnover on German securities exchanges, the Frankfurt Stock Exchange, operated by Deutsche Börse AG, is by far the most important stock exchange in the Federal Republic.
In January 2013, the Heads of State or Government of the European Union adopted a decision authorizing eleven Member States to proceed with the introduction of a financial transaction tax (“FTT”) through “enhanced cooperation.” The eleven countries are Austria, Belgium, Estonia, France, Germany, Greece, Italy, Portugal, Slovakia, Slovenia and Spain. In September and October 2012, the eleven Member States wrote to the European Commission requesting a proposal for enhanced cooperation, specifying that the scope and objective of the FTT be based on that of the 2011 proposal.
G-30
In February 2013, the European Commission presented its “Proposal for a Council Directive implementing enhanced cooperation in the area of financial transaction tax.” The proposal involves a harmonized minimum 0.1% tax rate for transactions in all types of financial instruments except derivatives (0.01% rate).
Source: Council of the European Union, Financial transaction tax: Council agrees to enhanced cooperation, press release of January 22, 2013 (http://www.consilium.europa.eu/uedocs/cms_Data/docs/pressdata/en/ecofin/134949.pdf).
Policy Responses to the Global Economic and Financial Crisis
Policy Responses by the Federal Republic
Two wind-up institutions (Abwicklungsanstalten) for troubled German banks were established within the framework set out by the German Financial Market Stabilization Amendment Act (Finanzmarkstabilisierungsfondsgesetz), which was introduced in April 2009. The first wind-up institution, Erste Abwicklungsanstalt, was established in December 2009 to liquidate a portfolio of EUR 77.5 billion assumed from WestLB. It assumed a second portfolio consisting of an asset portfolio worth EUR 72.3 billion and a trading portfolio with a market value of around EUR 52.1 billion following the restructuring of WestLB. As of December 30, 2013, the combined asset portfolios had been reduced to EUR 97.6 billion. The second wind-up institution, FMS Wertmanagement, assumed a portfolio of EUR 175.7 billion from Hypo Real Estate Group in October 2010 to support restructuring efforts. As of December 31, 2013, its portfolio was reduced to EUR 119.1 billion.
Sources: Erste Abwicklungsanstalt, Geschäftsbericht 2009/2010 (https://www.aa1.de/fileadmin/aa1-website/content/downloads/Geschaeftsbericht_2009-2010.pdf); Landtag NRW, Sitzungsprotokoll 15. Sitzung des Haushalts- und Finanzausschuss, from January 31, 2013 (http://www.landtag.nrw.de/portal/WWW/dokumentenarchiv/Dokument/MMA16-151.pdf); Erste Abwicklungsanstalt, Anlagen zur Veröffentlichung des EAA Geschäftsberichts 2013, pages 1-3 (https://www.aa1.de/fileadmin/aa1-website/content/downloads/1_Presse/20140410-PM-Anlage_de.pdf); FMS Wertmanagement, FMS Wertmanagement erzielt 2013 wie im Vorjahr ein positives Ergebnis, press release of April 29, 2014 (http://www.fms-wm.de/de/presse/400-fms-wertmanagement-erzielt-2013-wie-im-vorjahr-ein-positives-ergebnis).
The German Restructuring Act (Restrukturierungsgesetz), enacted in December 2010, established new regulations for the restructuring and liquidation of banks. It provides for the establishment of a restructuring fund (Restrukturierungsfonds) to finance the measures that will be undertaken in restructuring proceedings that come within its ambit. The fund is financed by contributions of credit institutions (Bankenabgabe), thus ensuring that the financial sector participates in the costs of any future financial crisis. Promotional or development banks are not required to contribute to the fund. The restructuring fund is managed by the German Federal Agency for Financial Market Stabilization (Bundesanstalt für Finanzmarktstabilisierung), which is also responsible for collecting the contributions of the credit institutions to the fund and for implementing the measures in restructuring proceedings under the Restructuring Act. Details of the implementation of the Bankenabgabe have been formalized in a restructuring fund regulation (Restrukturierungsfonds-Verordnung). The first payments were made in 2011.
Sources: Bundesministerium der Finanzen, Systemische Risiken im Finanzsektor wirksam begrenzen - Bundesregierung beschließt Restrukturierungsgesetz, press release of August 25, 2010 (http://www.bundesfinanzministerium.de/Content/DE/Pressemitteilungen/Finanzpolitik/2010/08/2010-08-25-PM32.html); Bundesministerium der Finanzen, Wirtschaft und Verwaltung, Was macht die Bundesanstalt für Finanzmarktstabilisierung? Neue Aufgaben der FMSA zur Stabilisierung des Finanzsektors, September 20, 2010 (http://www.bundesfinanzministerium.de/Content/DE/Standardartikel/Themen/Internationales_Finanzmarkt/Finanzmarktpolitik/Bankenabgabe/2010-09-17-FMSA.html); Bundestagsdrucksache 17/3407 (http://dip21.bundestag.de/dip21/btd/17/034/1703407.pdf); Bundesministerium der Finanzen, Bundeskabinett beschließt Restrukturierungsfonds-Verordnung, July 20, 2011 (http://www.bundesfinanzministerium.de/Content/DE/Standardartikel/Themen/Internationales_Finanzmarkt/Finanzmarktpolitik/2011-07-20-restrukturierungsfonds-verordnung.html).
In March 2012, the second Financial Market Stabilization Act (Zweites Finanzmarktstabilisierungsgesetz) entered into force. Under this act, the German Financial Market Stabilization Fund (“SoFFin”) was reactivated for a period ending on December 31, 2012. According to this act, SoFFin could extend guarantees up to a total amount of EUR 400 billion to stabilize German banks, if required. In addition, SoFFin was authorized to incur loans in a total amount of up to EUR 80 billion. This act also extended the previous model, which provided for the granting of guarantees with respect to structured securities that have been transferred to special purpose entities, to securities more generally. With respect to the KWG, this act authorized the BaFin to require financial institutions to comply with more stringent capital requirements.
On January 1, 2013, the third Financial Market Stabilization Act (Drittes Finanzmarktstabilisierungsgesetz) entered into force. It allows the SoFFin, through the end of 2014, to extend new guarantees and incur loans to stabilize German banks in order to bridge the period until a European directive on recovery and resolution of credit institutions will be implemented by the Member States. According to the act, SoFFin and the restructuring fund, which had previously been separate systems, will be more closely integrated. In particular, the financial resources that are funded by a bank levy and accumulate in the restructuring fund will be used to cover possible losses arising from future SoFFin measures when the accounts of SoFFin will be finally closed. In addition, the group of institutions eligible to apply to SoFFin and the group of institutions required to pay the bank levy has been harmonized. As of
G-31
December 31, 2013, the outstanding stabilization measures provided by SoFFin amounted to EUR 17.1 billion in capital injections, while loss compensation payments made to FMS Wertmanagement totaled EUR 9.3 billion.
Sources: Bundesregierung, Für Vertrauen auf dem Finanzmarkt, press release of February 10, 2012 (http://www.bundesregierung.de/ContentArchiv/DE/Archiv17/Artikel/2011/12/2011-12-14-finanzmarktstabilisierung.html); Die Beschlüsse des Bundestages am 26. und 27. Januar, publication of January 27, 2012 (http://www.bundestag.de/dokumente/textarchiv/2012/37536609_kw04_angenommen_abgelehnt/index.html); Bundesministerium der Finanzen, Finanzmarktstabilisierungsfonds SoFFin soll bis zur Einführung europaweiter Bankenrestrukturierungsregeln verlängert werden, October 17, 2012 (http://www.bundesfinanzministerium.de/Content/DE/Pressemitteilungen/Finanzpolitik/2012/10/2012-10-17-PM66.html); Bundestag, Drittes Gesetz zur Umsetzung eines Maßnahmenpakets zur Stabilisierung des Finanzmarktes, Dokumentations- und Informationssystem für parlamentarische Vorgänge (http://dipbt.bundestag.de/extrakt/ba/WP17/483/48345.html); FMSA Bundesanstalt für Finanzmarktstabilisierung, Historischer Überblick über die Maßnahmen des SoFFin (http://www.fmsa.de/export/sites/standard/downloads/20131231_Historischer_Ueberblick_SoFFin.pdf).
On June 7, 2013, the Bundesrat approved the Act on Ringfencing and Recovery and Resolution Planning for Credit Institutions and Financial Groups (Gesetz zur Abschirmung von Risiken und zur Planung der Sanierung und Abwicklung von Kreditinstituten und Finanzgruppen). The act has three main components. First, the act mandates all credit institutions posing a potential systemic risk (as assessed jointly by BaFin and the Deutsche Bundesbank) to compile and annually update a recovery and resolution plan. Second, the act prohibits certain high-risk activities with effect from July 1, 2015, and empowers BaFin, from July 1, 2016 onwards, to prohibit additional high-risk activities of specific institutions. Groups may avoid sanctions by ringfencing and transferring such activities to a separate financial trading institution, either within or outside of the group. This provision of the act applies to large credit institutions (trading portfolio and liquidity reserve either exceed EUR 100 billion, or exceed 20% of total assets and amount to at least EUR 90 billion) which accept deposits and other repayable funds and grant loans for their own account. The prohibition does not apply to hedging activities performed to hedge transactions with clients, to manage interest rates, currencies or liquidity or to buy or sell long-term equity investments. Third, the act establishes risk management duties for senior managers of financial institutions and provides for criminal liability for breaches of those duties.
Sources: Bundesanstalt für Finanzdienstleistungsaufsicht, Crisis management: Act on Ringfencing and Recovery and Resolution Planning for Credit Institutions passed, press release of July 15, 2013 (http://www.bafin.de/SharedDocs/Veroeffentlichungen/EN/Fachartikel/2013/fa_bj_2013_07_trennbankengesetz_en.html).
Policy Responses at the EU Level
In October 2011, in light of continued tensions in the financial markets, the Heads of State or Government of the Euro Area Member States agreed on a set of measures to restore confidence in the financial markets, including, among others, a comprehensive set of measures to raise confidence in the banking sector. The measures include facilitating access to term-funding through a coordinated approach at EU level involving state guarantees and increasing the capital position of banks to 9% of core Tier 1 capital by the end of June 2012. National supervisors must ensure that banks’ recapitalization plans do not lead to excessive deleveraging, in order to safeguard the flow of credit to the real economy, which is essential for growth prospects.
Sources: European Council, Euro Summit Statement, dated October 26, 2011 (http://www.consilium.europa.eu/uedocs/cms_Data/docs/pressdata/en/ec/125644.pdf); European Council, Main results of Euro Summit, dated October 26, 2011 (http://www.consilium.europa.eu/uedocs/cms_Data/docs/pressdata/en/ec/125645.pdf); European Council, Remarks by President Van Rompuy following the meeting of the Euro Summit (http://www.consilium.europa.eu/uedocs/cms_Data/docs/pressdata/en/ec/125646.pdf); Bundesregierung, Euro-Gipfel, für Schuldenschnitt und stärkeren Rettungsschirm, press release dated October 27, 2011 (http://www.bundesregierung.de/ContentArchiv/DE/Archiv17/Artikel/2011/10/2011-10-26-eu-rat-teil%202.html); Bundesregierung, Stabiler Euro geht vor, press release of November 3, 2011 (http://www.bundeskanzlerin.de/ContentArchiv/DE/Archiv17/Artikel/2011/11/2011-11-03-merkel-sakozy-griechenland.html).
On December 8, 2011, the EBA’s Board of Supervisors adopted a recommendation on the creation of temporary capital buffers to restore market confidence, stemming from the so-called “capital exercise.” Banks were required to establish an exceptional and temporary capital buffer against sovereign debt exposures to reflect market prices as of the end of September 2011 and an exceptional and temporary buffer such that the core Tier 1 capital ratio reached a level of 9% by the end of June 2012. The 13 German banks covered by the exercise had an aggregate capital shortfall of EUR 13.1 billion, which they were able to close. On July 22, 2013, the EBA’s Board of Supervisors adopted a recommendation on the preservation of core Tier 1 capital during the transition to the CRD IV/CRR framework. Banks were required to maintain a nominal capital floor of core Tier 1 corresponding to the level reached by June 2012.
Sources: European Banking Authority, The EBA publishes Recommendation and final results of bank recapitalisation plan as part of co-ordinated measures to restore confidence in the banking sector, press release dated December 8, 2011 (http://www.eba.europa.eu/-/the-eba-publishes-recommendation-and-final-results-of-bank-recapitalisation-plan-as-part-of-co-ordinated-measures-to-restore-confidence-in-the-banking); European Banking Authority, 61 Banks’ Capital Position as of 30 June 2012, press release dated October 3, 2012 (http://www.eba.europa.eu/-/eba-publishes-final-report-on-the-recapitalisation-of-european-banks-and-paves-the-way-for-the-transition-to-the-crdiv-framework); European Banking Authority, Recommendation on the preservation of core Tier 1 capital during the transition to Capital Requirements Directive/Capital Requirements Regulation framework, released July 22, 2013 (http://www.eba.europa.eu/documents/10180/15953/EBA-Rec-2013-03_Recommendation_on_Capital_Preservation.pdf/ac5d0cb3-3ee0-4e1f-8948-090c3edd74f4).
G-32
In mid-September 2011, the ECB, in coordination with the U.S. Federal Reserve, the Bank of England, the Bank of Japan and the Swiss National Bank, agreed to conduct U.S. dollar liquidity operations with a maturity of approximately three months. These operations were conducted in addition to ongoing weekly seven-day U.S. dollar liquidity operations which were announced in May 2010. According to a press release of the ECB published in January 2014, the ECB ceased conducting the three-month U.S. dollar liquidity operations in April 2014. The weekly U.S. dollar liquidity operations will continue to be conducted at least until July 31, 2014. In November 2011, the Bank of Canada, the Bank of England, the Bank of Japan, the ECB, the U.S. Federal Reserve and the Swiss National Bank announced coordinated actions to enhance their capacity to provide liquidity support to the global financial system. As a contingency measure, the central banks also established bilateral liquidity swap arrangements so that liquidity can be provided in each jurisdiction in any of their currencies, if required by market conditions. These swap lines will remain in place until further notice.
Sources: European Central Bank, ECB announces additional US dollar liquidity-providing operations over year-end, press release of September 15, 2011 (http://www.ecb.int/press/pr/date/2011/html/pr110915.en.html); European Central Bank, ECB announces US dollar liquidity-providing operations as of 1 February 2014, press release of January 24, 2014 (http://www.ecb.europa.eu/press/pr/date/2014/html/pr140124.en.html); European Central Bank, Coordinated central bank action to address pressures in global money markets, press release of November 30, 2011 (http://www.ecb.int/press/pr/date/2011/html/pr111130.en.html); European Central Bank, ECB extends the existing swap arrangements with other central banks, press release of December 13, 2012 (http://www.ecb.int/press/pr/date/2012/html/pr121213.en.html); European Central Bank, ECB establishes standing swap arrangements with other central banks, press release of October 31, 2013 (http://www.ecb.europa.eu/press/pr/date/2013/html/pr131031.en.html).
Furthermore, in early October 2011, the ECB announced decisions (1) to launch a second covered bond purchase program in an anticipated amount of EUR 40 billion, with purchases beginning in November 2011 and expected to be completed by the end of October 2012 and (2) to conduct two longer-term refinancing operations with maturities of approximately twelve and 13 months in October and December 2011, respectively. The second covered bond purchase program ended on October 31, 2012, with a total of EUR 16.4 billion in covered bond purchases. These bonds will be held to maturity.
Sources: European Central Bank, ECB announces new covered bond purchase programme, press release of October 6, 2011 (http://www.ecb.int/press/pr/date/2011/html/pr111006_3.en.html);European Central Bank, Ending of Covered Bond Purchase Program 2(CBP2), press release of October 31, 2012 (http://www.ecb.int/press/pr/date/2012/html/pr121031_1.en.html).
In December 2011, the ECB decided on additional enhanced credit support measures to improve bank lending and liquidity in the euro area money market, including the following:
| | • | | conducting two longer-term refinancing operations (“LTRO”) with a maturity of 36 months and the option of early repayment after one year; and |
| | • | | increasing collateral availability by (1) reducing the rating threshold for certain asset-backed securities and (2) allowing national central banks, as a temporary solution, to accept as collateral additional performing credit claims (i.e., bank loans) that satisfy specific eligibility criteria. |
In the first LTRO in December 2011, EUR 489.2 billion was settled; and in the second LTRO in March 2012, EUR 529.5 billion was settled. From January 30, 2013 onwards, banks can repay these funds on a voluntary basis. As of April 25, 2014, an amount of EUR 516.3 billion was still outstanding.
Sources: European Central Bank, ECB announces measures to support bank lending and money market activity, press release of December 8, 2011 (http://www.ecb.int/press/pr/date/2011/html/pr111208_1.en.html); European Central Bank, Consolidated Financial Statement of the Eurosystem as at December 23, 2011, press release dated December 28, 2011 (http://www.ecb.eu/press/pr/wfs/2011/html/fs111228.en.html); European Central Bank, Consolidated Financial Statement of the Eurosystem as at March 2, 2012, press release dated March 6, 2012 (http://www.ecb.eu/press/pr/wfs/2012/html/fs120306.en.html); European Central Bank, Consolidated financial statement of the Eurosystem as at 25 April 2014, press release dated April 29, 2014 (http://www.ecb.europa.eu/press/pr/wfs/2014/html/fs140429.en.html).
In August 2012, the ECB announced that it may undertake outright open market operations of a size adequate to address the severe malfunctioning in the price formation process in the bond markets of Euro Area Member States. In this context, the concerns of private investors about seniority would be addressed. In addition, it was announced that the Governing Council may consider undertaking further non-standard monetary policy measures depending on what will be required to repair monetary policy transmission and will design appropriate modalities for these policy measures. In September 2012, the ECB detailed the modalities for undertaking Outright Monetary Transactions (OMTs) in secondary markets for sovereign bonds in the euro area. Within its mandate to maintain price stability over the medium term and in observance of its independence in determining monetary policy, the ECB intends to preserve the singleness of its monetary policy and to ensure the proper transmission of its policy stance to the real economy throughout the euro area. OMTs are aimed at enabling the ECB to address severe distortions in government bond markets. The OMTs replace the ECB’s Securities Markets Programme, which was reactivated in early August 2011 in order to address renewed tensions in some financial markets in the euro area by intervening actively in the euro area public and private debt securities markets. This
G-33
program was first introduced in early May 2010 with a view to ensuring depth and liquidity in certain dysfunctional market segments. The liquidity injected through the Securities Markets Programme will continue to be absorbed as in the past, and the existing securities in the Securities Markets Programme portfolio will be held to maturity. The OMT program was legally challenged by the German Federal Constitutional Court (Bundesverfassungsgericht) and has been referred to the EU Court of Justice for a preliminary ruling.
Sources: Introductory statement to the press conference (with Q&A), Mario Draghi, President of the ECB, Vítor Constâncio, Vice-President of the ECB, August 2, 2012 (http://www.ecb.int/press/pressconf/2012/html/is120802.en.html); Introductory statement to the press conference (with Q&A), Mario Draghi, President of the ECB, Vítor Constâncio, Vice-President of the ECB, September 6, 2012 (http://www.ecb.int/press/pressconf/2012/html/is120906.en.html); European Central Bank, Decisions taken by the Governing Council of the ECB (in addition to decisions setting interest rates), press release of August 4, 2011 (http://www.ecb.int/press/govcdec/otherdec/2011/html/gc110805.en.html); European Central Bank, Statement by the President of the ECB, press release of August 7, 2011 (http://www.ecb.int/press/pr/date/2011/html/pr110807.en.html); European Central Bank, ECB decides on measures to address severe tensions in financial markets, press release of May 10, 2010 (http://www.ecb.int/press/pr/date/2010/html/pr100510.en.html); European Central Bank, Technical features of Outright Monetary Transactions, press release of September 6, 2012 (http://www.ecb.int/press/pr/date/2012/html/pr120906_1.en.html); Bundesverfassungsgericht, Principal Proceedings ESM/ECB: Pronouncement of the Judgment and Referral for a Preliminary Ruling to the Court of Justice of the European Union, press release no. 9/2014 of February, 7 2014 (http://www.bundesverfassungsgericht.de/pressemitteilungen/bvg14-009en.html).
G-34
PUBLIC FINANCE
Receipts and Expenditures
The Federal Government, each of the Länder governments and each of the municipalities (Gemeinden) have separate budgets. The federal budget is the largest single public budget.
The fiscal year of the Federal Republic is the calendar year. The annual federal budget is passed by an act of parliament. On the basis of a proposal prepared by the Ministry of Finance, the Federal Government introduces the federal budget bill to the parliament, generally in the summer of each year. The proposal has to pass through three Bundestag sessions, the budget committee of the Bundestag, and the Bundesrat, which deliberates the proposal twice. The final vote on the proposal is taken by the Bundestag in its third session.
In addition to the federal, Länder and municipal budgets, there are separate budgets for the social security funds and various special funds (Sondervermögen) of the federal administration and the Länder, as well as other off-budgetary entities at all levels of government that are created for specific public purposes. General government, as defined in the national accounts, comprises all these different levels of government activity.
In 2013, total consolidated general government revenue, as presented in the national accounts, amounted to EUR 1,223.4 billion, with tax revenue of EUR 636.4 billion and social contributions of EUR 459.1 billion.
Source: Statistisches Bundesamt, Fachserie 18, Reihe 1.4 - 2013 (March 2014), Table 3.4.3.2.
In 2013, the value added tax and the taxes on income and wealth, as presented in the national accounts, amounted to EUR 195.2 billion and EUR 333.9 billion, respectively These joint taxes are distributed among the Federal Government, the Länder governments and municipal authorities, according to a predetermined formula. In addition to joint taxes, the Federal Government, the Länder governments and the municipal authorities each levied special taxes, for example, on tobacco and beer.
Source: Statistisches Bundesamt, Fachserie 18, Reihe 1.4 - 2013 (March 2014), Table 3.4.3.16.
Consolidated general government expenditure in 2013, as presented in the national accounts, amounted to a total of EUR 1,223.1 billion. The most significant consolidated general government expenditures were monetary social benefits (EUR 440.1 billion), social benefits in kind (EUR 223.9 billion) and employee compensation (EUR 208.4 billion). Other significant consolidated general government expenditures included intermediate consumption (EUR 135.2 billion), interest on public debt (EUR 59.1 billion) and gross capital formation (EUR 42.8 billion).
Source: Statistisches Bundesamt, Fachserie 18, Reihe 1.4 - 2013 (March 2014), Table 3.4.3.2.
G-35
GENERAL GOVERNMENT ACCOUNTS (1)
| | | | | | | | | | | | | | | | | | | | | | | | | |
| | | 2013 | | 2012 | | 2011 | | 2010 | | 2009 |
| | | (EUR in billions) |
Federal Government, Länder governments and municipalities | | | | | | | | | | | | | | | | | | | | | | | | | |
Revenue | | | | 784.9 | | | | | 769.8 | | | | | 747.2 | | | | | 697.7 | | | | | 689.4 | |
of which: Taxes (2) | | | | 636.4 | | | | | 617.7 | | | | | 592.8 | | | | | 549.9 | | | | | 548.1 | |
Expenditure | | | | 791.2 | | | | | 785.8 | | | | | 783.8 | | | | | 806.0 | | | | | 748.7 | |
| | | | | | | | | | | | | | | | | | | | | | | | | |
Balance | | | | -6.4 | | | | | -16.0 | | | | | -36.6 | | | | | -108.4 | | | | | -59.3 | |
Social security funds | | | | | | | | | | | | | | | | | | | | | | | | | |
Revenue | | | | 540.2 | | | | | 539.6 | | | | | 528.8 | | | | | 517.5 | | | | | 492.4 | |
Expenditure | | | | 533.6 | | | | | 521.3 | | | | | 513.6 | | | | | 513.5 | | | | | 506.6 | |
| | | | | | | | | | | | | | | | | | | | | | | | | |
Balance | | | | 6.6 | | | | | 18.3 | | | | | 15.2 | | | | | 4.1 | | | | | -14.3 | |
General government | | | | | | | | | | | | | | | | | | | | | | | | | |
Revenue | | | | 1,223.4 | | | | | 1,193.8 | | | | | 1,157.2 | | | | | 1,089.8 | | | | | 1,072.7 | |
Expenditure | | | | 1,223.1 | | | | | 1,191.5 | | | | | 1,178.7 | | | | | 1,194.1 | | | | | 1,146.3 | |
| | | | | | | | | | | | | | | | | | | | | | | | | |
Balance | | | | 0.3 | | | | | 2.3 | | | | | -21.5 | | | | | -104.3 | | | | | -73.6 | |
| | | | | | | | | | | | | | | | | | | | | | | | | |
| (1) | Definition according to the national accounts. |
| (2) | Excluding capital taxes and taxes of domestic sectors paid to EU. |
Source: Statistisches Bundesamt, Fachserie 18, Reihe 1.4 - 2013 (March 2014), Tables 3.4.3.2, 3.4.3.3 and 3.4.3.7.
FEDERAL GOVERNMENT ACCOUNTS (1)
| | | | | | | | | | | | | | | | | | | | | | | | | |
| | | 2013 | | 2012 | | 2011 | | 2010 | | 2009 |
| | | (EUR in billions) |
Revenue | | | | 358.0 | | | | | 355.1 | | | | | 349.3 | | | | | 322.8 | | | | | 318.3 | |
of which: Taxes (2) | | | | 323.9 | | | | | 316.7 | | | | | 307.4 | | | | | 284.8 | | | | | 282.2 | |
Expenditure | | | | 364.8 | | | | | 369.6 | | | | | 376.2 | | | | | 406.0 | | | | | 356.8 | |
| | | | | | | | | | | | | | | | | | | | | | | | | |
Balance | | | | -6.8 | | | | | -14.5 | | | | | -26.9 | | | | | -83.3 | | | | | -38.5 | |
| | | | | | | | | | | | | | | | | | | | | | | | | |
| (1) | Definition according to the national accounts. |
| (2) | Excluding taxes of domestic sectors paid to EU. |
Source: Statistisches Bundesamt, Fachserie 18, Reihe 1.4 - 2013 (March 2014), Table 3.4.3.4.
G-36
GENERAL GOVERNMENT EXPENDITURE: BREAKDOWNBY FUNCTIONS (1)
| | | | | | | | | | | | | | | | | | | | | | | | | |
| | | 2013 | | 2012 | | 2011 | | 2010 | | 2009 |
| | | (EUR in billions) |
General public services | | | | 167.1 | | | | | 162.8 | | | | | 162.0 | | | | | 156.0 | | | | | 149.8 | |
Defense | | | | 27.5 | | | | | 28.2 | | | | | 27.6 | | | | | 26.2 | | | | | 26.1 | |
Public order and safety | | | | 42.9 | | | | | 41.7 | | | | | 41.1 | | | | | 40.4 | | | | | 39.4 | |
Economic affairs | | | | 88.3 | | | | | 91.3 | | | | | 91.1 | | | | | 118.0 | | | | | 92.4 | |
Environmental protection | | | | 16.4 | | | | | 15.6 | | | | | 16.3 | | | | | 16.0 | | | | | 18.9 | |
Housing and community amenities | | | | 11.8 | | | | | 12.2 | | | | | 13.7 | | | | | 14.9 | | | | | 16.5 | |
Health | | | | 196.1 | | | | | 187.0 | | | | | 182.8 | | | | | 179.1 | | | | | 174.3 | |
Recreation, culture and religion | | | | 22.0 | | | | | 20.8 | | | | | 20.8 | | | | | 20.0 | | | | | 19.7 | |
Education | | | | 120.2 | | | | | 115.6 | | | | | 113.7 | | | | | 110.6 | | | | | 104.4 | |
Social protection | | | | 530.8 | | | | | 516.3 | | | | | 509.5 | | | | | 512.9 | | | | | 504.9 | |
| | | | | | | | | | | | | | | | | | | | | | | | | |
Total expenditure | | | | 1,223.1 | | | | | 1,191.5 | | | | | 1,178.7 | | | | | 1,194.1 | | | | | 1,146.3 | |
| | | | | | | | | | | | | | | | | | | | | | | | | |
| (1) | Definition according to the national accounts. |
Source: Statistisches Bundesamt, Fachserie 18, Reihe 1.4 - 2013 (March 2014), Table 3.4.3.11.
Germany’s General Government Deficit/Surplus and General Government Gross Debt
For purposes of the Member States’ reports to the European Commission under the EDP, the general government or “Maastricht” deficit/surplus refers to the difference between consolidated public sector revenue and consolidated public sector expenditure and is the balancing item “net borrowing/net lending” of general government (central government, state government, local government and social security funds) as defined in the European System of National Accounts 1995, but including streams of interest payments resulting from swap arrangements and forward-rate agreements. In 2013, Germany’s general government surplus amounted to EUR 0.2 billion, or 0.0% of nominal GDP. The German general government gross debt-to-GDP ratio decreased from 81.0% in 2012 to 78.4% in 2013, which is above the EU’s 60% reference value.
Sources: Statistisches Bundesamt, Balanced government budget in 2013 – Maastricht ratio at +0.0%, press release of February 25, 2014 (https://www.destatis.de/EN/PressServices/Press/pr/2014/02/PE14_063_813.html); The European Union, Consolidated versions of the Treaty on European Union and the Treaty on the Functioning of the European Union (http://eur-lex.europa.eu/legal-content/EN/TXT/HTML/?uri=CELEX:12012M/TXT&from=EN); Deutsche Bundesbank, German Maastricht debt level for 2013 down to €2.15 trillion or 78.4% of GDP, press release of April 1, 2014 (http://www.bundesbank.de/Redaktion/EN/Pressemitteilungen/BBK/2014/2014_04_01_german_maastricht_debt_level.html?startpageAreaId=Teaserbereich&startpageId=Startseite-DE&startpageLinkName=2014_04_01_maastricht_schuldenstand 171260).
The following table shows historical information on the Federal Republic’s general government deficit/surplus and debt as a percentage of GDP.
THE FEDERAL REPUBLIC’S FISCAL MAASTRICHT CRITERIA
| | | | | | | | | | | | | | | | | | | | | | | | | |
| | | 2013 (1) | | 2012 | | 2011 | | 2010 | | 2009 |
| | | (% of GDP) |
General government deficit (-) / surplus (+) (2) | | | | 0.0 | | | | | 0.1 | | | | | -0.8 | | | | | -4.2 | | | | | -3.1 | |
General government gross debt | | | | 78.4 | | | | | 81.0 | | | | | 80.0 | | | | | 82.5 | | | | | 74.6 | |
| (1) | Provisional figures, partly estimated. |
| (2) | Definition according to the reporting under the EDP: For purposes of the Member States’ reports to the European Commission under the EDP, “general government deficit/surplus” is the balancing item “net borrowing/net lending” of general government as defined in the national accounts, but including streams of interest payments resulting from swap arrangements and forward-rate agreements. |
Sources: Statistisches Bundesamt, Balanced government budget in 2013 – Maastricht ratio at +0.0%, press release of February 25, 2014 (https://www.destatis.de/EN/PressServices/Press/pr/2014/02/PE14_063_813.html); Deutsche Bundesbank, German Maastricht debt level for 2013 down to €2.15 trillion or 78.4% of GDP, press release of April 1, 2014 (http://www.bundesbank.de/Redaktion/EN/Pressemitteilungen/BBK/2014/2014_04_01_german_maastricht_debt_level.html?startpageAreaId=Teaserbereich&startpageId=Startseite-DE&startpageLinkName=2014_04_01_maastricht_schuldenstand 171260).
G-37
Fiscal Outlook
The April 2014 update of the German stability program forecasts a balanced general government budget in 2014. From 2015 onwards, the general government balance is forecast to be balanced or in surplus. The medium-term objective of a structural deficit not exceeding 0.5% of GDP is expected to be met during the entire forecasting period (2014 to 2018).
According to the April 2014 update of the German stability program, Germany’s general government gross debt-to-GDP ratio is projected to be 76% in 2014 and to decrease further to around 65% by 2018, the end of the forecast horizon. The reference values for the upper limit of the debt ratio according to the 1/20th-rule of the enhanced SGP are expected to be undershot significantly in all years of the forecasting period. However, the debt ratio is expected to continue to be in excess of the EU’s reference value of 60% of nominal GDP until 2018. One reason for the decrease is expected to be the liquidation of parts of the wind-up institutions’ portfolios, which is expected to continue over the coming years. The debt ratio is anticipated to decline in line with the amount by which these agencies’ liabilities are reduced. In addition to the liquidation effect, the consolidation efforts in the federal, Länder and municipal authorities’ budgets are expected to contribute to the decline in the debt-to-GDP ratio during the forecasting period.
Source: Bundesministerium der Finanzen, Deutsches Stabilitätsprogramm Aktualisierung 2014 (http://www.bundesfinanzministerium.de/Content/DE/Standardartikel/Themen/Oeffentliche_Finanzen/Deutsches_Stabilitaetsprogramm/2014-04-08-Stabilitaetsprogramm-Aktualisierung-2014.pdf?__blob=publicationFile&v=1).
GENERAL GOVERNMENT BUDGETARY PROSPECTS (1)
| | | | | | | | | | | | | | | | | | | | | | | | | | | | | | |
| | | 2018 | | 2017 | | 2016 | | 2015 | | 2014 | | 2013 |
| | | (% of GDP) |
Revenue | | | | 44 | | | | | 44 | | | | | 44 | | | | | 44 | | | | | 44 1/2 | | | | | 44.7 | |
Total taxes | | | | 23 1/2 | | | | | 23 1/2 | | | | | 23 1/2 | | | | | 23 1/2 | | | | | 23 1/2 | | | | | 23.2 | |
Social contributions | | | | 17 | | | | | 17 | | | | | 16 1/2 | | | | | 16 1/2 | | | | | 16 1/2 | | | | | 16.8 | |
Property income | | | | 1/2 | | | | | 1/2 | | | | | 1/2 | | | | | 1/2 | | | | | 1 | | | | | 0.8 | |
Other | | | | 3 | | | | | 3 1/2 | | | | | 3 1/2 | | | | | 3 1/2 | | | | | 3 1/2 | | | | | 3.9 | |
Expenditure | | | | 43 1/2 | | | | | 44 | | | | | 44 | | | | | 44 | | | | | 44 1/2 | | | | | 44.7 | |
Compensation of employees and intermediate consumption | | | | 12 | | | | | 12 | | | | | 12 | | | | | 12 1/2 | | | | | 12 1/2 | | | | | 12.5 | |
Social payments | | | | 24 1/2 | | | | | 24 1/2 | | | | | 24 1/2 | | | | | 24 1/2 | | | | | 24 1/2 | | | | | 24.3 | |
Interest expenditure | | | | 2 | | | | | 2 | | | | | 2 | | | | | 2 | | | | | 2 | | | | | 2.2 | |
Subsidies | | | | 1 | | | | | 1 | | | | | 1 | | | | | 1 | | | | | 1 | | | | | 0.9 | |
Gross fixed capital formation | | | | 1 1/2 | | | | | 1 1/2 | | | | | 1 1/2 | | | | | 1 1/2 | | | | | 1 1/2 | | | | | 1.6 | |
Other | | | | 3 | | | | | 3 | | | | | 3 | | | | | 3 | | | | | 3 | | | | | 3.2 | |
| | | | | | | | | | | | | | | | | | | | | | | | | | | | | | |
General government deficit (-) / surplus (+) | | | | 1/2 | | | | | 1/2 | | | | | 0 | | | | | 0 | | | | | 0 | | | | | 0.0 | |
Federal Government | | | | 0 | | | | | 0 | | | | | 0 | | | | | 0 | | | | | 0 | | | | | -0.2 | |
Länder governments | | | | 0 | | | | | 0 | | | | | 0 | | | | | 0 | | | | | -0 | | | | | -0.1 | |
Municipalities | | | | 0 | | | | | 0 | | | | | 0 | | | | | 0 | | | | | 0 | | | | | 0.1 | |
Social security funds | | | | -0 | | | | | -0 | | | | | -0 | | | | | -0 | | | | | -0 | | | | | 0.2 | |
| | | | | | |
General government gross debt | | | | 65 | | | | | 67 1/2 | | | | | 70 | | | | | 72 1/2 | | | | | 76 | | | | | 78.4 | |
| (1) | Definition according to the reporting under the EDP: for purposes of the Member States’ reports to the European Commission under the EDP, “general government deficit/surplus” is the balancing item “net borrowing/net lending” of general government as defined in the national accounts, but including streams of interest payments resulting from swap arrangements and forward-rate agreements. Accordingly, interest included in the figures set forth in the table above reflects these streams. |
Source: Bundesministerium der Finanzen, Deutsches Stabilitätsprogramm Aktualisierung 2014, Tables 13 and 16.
Tax Structure
Income Tax
Significant sources of revenue for the general government are the various types of income taxes. Income taxation for employees and self-employed persons is based on a progressive tax scale ranging from 14% to 45% subject to the amount of taxable income.
G-38
Employees pay taxes on their income from employment in the form of wage taxes. Self-employed persons typically pay estimated taxes during the year before filing their annual income tax return. Income generated by partnerships is not subject to tax at the partnership level, but at the level of the partners. The partners pay tax on this income according to their individual income tax brackets.
Income generated by corporations is subject to corporate income tax (Körperschaftsteuer) at a flat rate of 15%.
Capital income received by domestic taxpayers (all types of income from capital as well as private shareholders’ net gains from sales of shares in corporations) is subject to a final uniform tax rate of 25% (Abgeltungssteuer), taking into consideration an allowance (Sparerfreibetrag) of EUR 801 (EUR 1,602 for married couples).
In addition to the various types of income tax, a solidarity surcharge of 5.5% is imposed on the applicable income tax liability.
Sources: Bundesministerium der Justiz, Einkommensteuergesetz (http://www.gesetze-im-internet.de/estg/index.html); Bundesministerium der Justiz, Section 4, Solidaritätszuschlaggesetz (http://www.gesetze-im-internet.de/solzg_1995/__4.html); Bundesministerium der Justiz, Körperschaftsteuergesetz (http://www.gesetze-im-internet.de/kstg_1977/index.html).
Value Added Tax and Consumption Taxes
Value added tax (“VAT”) serves as a significant source of revenue. VAT is a general consumption tax that is imposed on the value of most goods and services. The standard rate applicable to most goods and services is 19%. Certain items that are classified as basic necessities, such as food (except beverages and all turnovers in restaurants) and books, are subject to a reduced rate of 7%.
In addition to the VAT, there are specific consumption taxes. The most significant specific consumption taxes relate to energy and tobacco.
Sources: Bundesministerium der Justiz, Umsatzsteuergesetz (http://www.gesetze-im-internet.de/ustg_1980/index.html); Bundesministerium der Justiz, Umsatzsteuergesetz, Section 12 (http://www.gesetze-im-internet.de/ustg_1980/__12.html); Bundesministerium der Justiz, Energiesteuergesetz (http://www.gesetze-im-internet.de/energiestg/); Bundesministerium der Justiz, Tabaksteuergesetz (http://www.gesetze-im-internet.de/tabstg_2009/index.html).
Environmental Tax
The environmental tax regime aims to encourage energy conservation and to lower employers’ and employees’ contributions to the public pension system at the same time, thereby allocating the burden of taxes and contributions more equally among labor, capital and natural resources. Key points of the environmental tax regime are an electricity tax imposed on the consumption of electricity and an energy tax on mineral oil and coal. The electricity tax rate is EUR 20.50 per megawatt-hour. The rates of the energy tax are assessed in accordance with certain environmental criteria.
Sources: Bundesministerium der Justiz, Stromsteuergesetz (http://www.gesetze-im-internet.de/stromstg/index.html); Bundesministerium der Justiz, Stromsteuergesetz, Section 3 (http://www.gesetze-im-internet.de/stromstg/__3.html).
Trade Tax
Trade tax (Gewerbesteuer) is levied at the municipal level and is imposed on businesses and their objective earning power. The trade tax rate varies and depends on the municipality that levies the tax. Basis of assessment are the profits of a business enterprise as determined under income tax law or corporation tax law, increased or decreased by certain adjustments. The result is multiplied by the basic federal rate (Gewerbesteuermesszahl) to achieve the base amount for the trade tax (Steuermessbetrag), which is then multiplied by the municipal multiplier (Hebesatz). Beyond a required minimum level of 200%, municipalities have discretion to fix the municipal tax collection rate.
Source: Bundesministerium der Justiz, Gewerbesteuergesetz (http://www.gesetze-im-internet.de/gewstg/index.html).
Recent and Pending Tax Reform Measures
Because of the progressive structure of the income tax system, the Federal Republic benefits from extra tax revenue generated by the effect of “fiscal drag” (kalte Progression). To offset part of this burden, the basic personal allowance of the income tax was raised by EUR 126 to EUR 8,130 with effect from January 1, 2013, and by EUR 224 to EUR 8,354 from January 1, 2014, onwards. The initial income tax rate remains constant at 14%.
Source: Bundesministerium für Wirtschaft und Technologie, Jahreswirtschaftsbericht 2014: Soziale Marktwirtschaft heute – Impulse für Wachstum und Zusammenhalt, p. 60 (http://www.bmwi.de/DE/Mediathek/publikationen,did=624768.html).
G-39
The following table provides an overview of the annual tax revenues of the general government divided by categories for each of the years indicated, as presented in the national accounts.
TAXES (1)
| | | | | | | | | | | | | | | | | | | | | | | | | |
| | | 2013 | | 2012 | | 2011 | | 2010 | | 2009 |
| | | (EUR in billions) |
Current taxes | | | | 636.4 | | | | | 617.7 | | | | | 592.8 | | | | | 549.9 | | | | | 548.1 | |
Taxes on production and imports | | | | 302.5 | | | | | 298.3 | | | | | 293.0 | | | | | 275.8 | | | | | 273.5 | |
of which: Value added tax | | | | 195.2 | | | | | 192.2 | | | | | 188.2 | | | | | 178.6 | | | | | 176.0 | |
Current taxes on income and wealth | | | | 333.9 | | | | | 319.4 | | | | | 299.8 | | | | | 274.1 | | | | | 274.6 | |
of which: Wage tax | | | | 193.7 | | | | | 184.3 | | | | | 174.3 | | | | | 162.5 | | | | | 168.3 | |
Assessed income tax | | | | 41.4 | | | | | 37.0 | | | | | 32.5 | | | | | 32.5 | | | | | 33.8 | |
Non-assessed taxes on earnings | | | | 27.0 | | | | | 29.9 | | | | | 27.6 | | | | | 22.5 | | | | | 24.3 | |
Corporate tax | | | | 21.1 | | | | | 18.6 | | | | | 17.6 | | | | | 13.7 | | | | | 8.8 | |
Capital taxes | | | | 4.6 | | | | | 4.3 | | | | | 4.3 | | | | | 4.4 | | | | | 4.5 | |
| | | | | | | | | | | | | | | | | | | | | | | | | |
Tax revenue of general government | | | | 641.1 | | | | | 622.0 | | | | | 597.1 | | | | | 554.3 | | | | | 552.7 | |
Taxes of domestic sectors to EU | | | | 6.1 | | | | | 6.3 | | | | | 6.3 | | | | | 5.7 | | | | | 5.7 | |
| | | | | | | | | | | | | | | | | | | | | | | | | |
Taxes | | | | 647.2 | | | | | 628.4 | | | | | 603.3 | | | | | 560.0 | | | | | 558.3 | |
| | | | | | | | | | | | | | | | | | | | | | | | | |
| (1) | Definition according to the national accounts. |
Source: Statistisches Bundesamt, Fachserie 18, Reihe 1.4 - 2013 (March 2014), Table 3.4.3.16.
Government Participations
The Federal Republic and its various special funds held direct participations in 111 public and private enterprises as of December 31, 2012.
Source: Bundesministerium der Finanzen, Die Beteiligungen des Bundes - Beteiligungsbericht 2013 (http://www.bundesfinanzministerium.de/Content/DE/Standardartikel/Themen/Bundesvermoegen/Privatisierungs_und_Beteiligungspolitik/Beteiligungen_des_Bundes/ Beteiligungsbericht-Anlage-2013.pdf?__blob=publicationFile&v=1), Chapter A.
The following table shows information on the Federal Republic’s significant direct participations (including those held through special funds) as of December 31, 2012.
PARTICIPATIONSOFTHE FEDERAL REPUBLIC
| | | | | | | | | | |
Enterprises | | Nominal capital of enterprise | | Participation of the Federal
Republic |
| | | (EUR in millions) | | (%) |
Significant majority participations: | | | | | | | | | | |
Deutsche Bahn AG | | | | 2,150 | | | | | 100.0 | |
KfW | | | | 3,750 | | | | | 80.0 | |
Hypo Real Estate Holding AG (1) | | | | 2,673 | | | | | 100.0 | |
| | |
Significant minority participations exceeding 25%: | | | | | | | | | | |
Flughafen München GmbH | | | | 307 | | | | | 26.0 | |
Commerzbank AG (1) | | | | 5,830 | | | | | 25.0 | + 1 share |
| (1) | Participations held by a special fund. |
Source: Bundesministerium der Finanzen, Die Beteiligungen des Bundes - Beteiligungsbericht 2013 (http://www.bundesfinanzministerium.de/Content/DE/Standardartikel/Themen/Bundesvermoegen/Privatisierungs_und_Beteiligungspolitik/Beteiligungen_des_Bundes/ Beteiligungsbericht-Anlage-2013.pdf?__blob=publicationFile&v=1), Chapters B, E and K paragraph II.
Direct Debt of the Federal Government
As of December 31, 2013, the Federal Government’s direct debt totaled EUR 1,113.6 billion, compared to EUR 1,095.5 billion as of December 31, 2012.
Sources: Bundesrepublik Deutschland Finanzagentur GmbH, Schuldenstand, Statistiken zum Schuldenstand 2013, Übersicht über den Stand der Schuld zum 31.12.2013 (http://www.deutsche-finanzagentur.de/fileadmin/Material_Deutsche_Finanzagentur/PDF/Schuldenstand/Schuldenstand_Quartal/2013-12-31.pdf); Bundesrepublik Deutschland Finanzagentur GmbH, Schuldenstand, Statistiken zum Schuldenstand 2012, Übersicht über den Stand der Schuld zum 31.12.2012 (http://www.deutsche-finanzagentur.de/fileadmin/Material_Deutsche_Finanzagentur/PDF/Schuldenstand/Schuldenstand_Quartal/2012-12-31.pdf).
G-40
The Federal Government raises funds primarily through the issuance of bonds and notes. Euro-denominated bonds and notes issued by the Federal Republic are evidenced by book entry and no certificates are issued.
In addition to its own direct debt obligations, the Federal Government had outstanding guarantees in an aggregate amount of EUR 335.6 billion as of December 31, 2012. Of this amount, EUR 124.9 billion was outstanding in the form of export credit insurance, which is handled by Euler Hermes Kreditversichtungs-AG on behalf and for the account of the Federal Government. Furthermore, EUR 22.4 billion was outstanding in the form of a guarantee for a loan to Greece according to the German Financial Stability Act, and EUR 100.1 billion was outstanding in the form of a guarantee for the European Financial Stability Facility.
Source: Bundesministerium der Finanzen, Finanzbericht 2014 (http://www.bundesfinanzministerium.de/Content/DE/Standardartikel/Themen/Oeffentliche_Finanzen/Wirtschafts_und_Finanzdaten/Finanzbericht-2014-anl.pdf?__blob=publicationFile&v=2), Overview 4, page 348.
For more detailed information regarding the Federal Government’s debt and guarantees, see “Tables and Supplementary Information.”
For information on the Federal Government’s liability as of December 31, 2013 for capital subscriptions to various international financial organizations, see the table entitled “Tables and Supplementary Information—III. Liabilities to International Financial Organizations.”
G-41
TABLES AND SUPPLEMENTARY INFORMATION
I. DIRECT DEBTOFTHE FEDERAL GOVERNMENT
SUMMARY
| | | | | |
| | | Principal amount
outstanding as of
December 31, 2013 |
| | | (EUR in millions) |
Federal Bonds (Bundesanleihen) | | | | 679,405 | |
Inflation-linked Securities (inflationsindexierte Bundeswertpapiere) | | | | 54,000 | |
Five-year Federal Notes (Bundesobligationen) | | | | 239,000 | |
Federal Treasury Notes (Bundesschatzanweisungen) | | | | 114,000 | |
Federal Savings Notes (Bundesschatzbriefe) | | | | 4,488 | |
Treasury Discount Paper (Unverzinsliche Schatzanweisungen) | | | | 49,975 | |
Federal Treasury Financing Paper (Finanzierungsschätze) | | | | 29 | |
German Government Day-Bonds (Tagesanleihe des Bundes) | | | | 1,397 | |
Further short term debt (£ 1 year) | | | | 1,298 | |
Borrowers’ note loans (Schuldscheindarlehen) | | | | 12,222 | |
of which: | | | | | |
– From residents | | | | 12,005 | |
– From non-residents | | | | 217 | |
Old debt (1) | | | | 4,430 | |
of which: | | | | | |
Equalization claims | | | | 4,150 | |
Other | | | | 40 | |
Repurchased debt | | | | 46,698 | |
| | | | | |
Total | | | | 1,113,586 | |
| | | | | |
| (1) | Mainly equalization and covering claims of the Deutsche Bundesbank, other banks and insurance companies in connection with the currency reform of 1948. |
Source: Bundesrepublik Deutschland Finanzagentur, Übersicht über den Stand der Schuld der Bundesrepublik Deutschland zum 31. Dezember 2013 (http://www.deutsche-finanzagentur.de/fileadmin/Material_Deutsche_Finanzagentur/PDF/Schuldenstand/Schuldenstand_Quartal/2013-12-31.pdf).
G-42
DEBT TABLES
1. FEDERAL BONDS (1)
| | | | | | | | | | | | | | | | | | | | |
Title | | Interest
rate | | Year of
issue | | Maturity | | Principal amount
outstanding as of
December 31, 2013 |
| | | (% per
annum) | | | | | | (EUR in millions) |
6% Bonds of the Federal Republic of 1986 (II) | | | | 6 | | | | | 1986 | | | | | 2016 | | | | | 3,750 | |
5.625% Bonds of the Federal Republic of 1986 | | | | 5.625 | | | | | 1986 | | | | | 2016 | | | | | 750 | |
6.25% Bonds of the Federal Republic of 1994 | | | | 6.25 | | | | | 1994 | | | | | 2024 | | | | | 10,250 | |
6.5% Bonds of the Federal Republic of 1997 | | | | 6.5 | | | | | 1997 | | | | | 2027 | | | | | 11,250 | |
5.625% Bonds of the Federal Republic of 1998 | | | | 5.625 | | | | | 1998 | | | | | 2028 | | | | | 14,500 | |
4.75% Bonds of the Federal Republic of 1998 (II) | | | | 4.75 | | | | | 1998 | | | | | 2028 | | | | | 11,250 | |
6.25% Bonds of the Federal Republic of 2000 | | | | 6.25 | | | | | 2000 | | | | | 2030 | | | | | 9,250 | |
5.5% Bonds of the Federal Republic of 2000 | | | | 5.5 | | | | | 2000 | | | | | 2031 | | | | | 17,000 | |
4.25% Bonds of the Federal Republic of 2003 | | | | 4.25 | | | | | 2003 | | | | | 2014 | | | | | 24,000 | |
4.75% Bonds of the Federal Republic of 2003 | | | | 4.75 | | | | | 2003 | | | | | 2034 | | | | | 20,000 | |
4.25% Bonds of the Federal Republic of 2004 | | | | 4.25 | | | | | 2004 | | | | | 2014 | | | | | 25,000 | |
3.75% Bonds of the Federal Republic of 2004 | | | | 3.75 | | | | | 2004 | | | | | 2015 | | | | | 23,000 | |
4% Bonds of the Federal Republic of 2005 | | | | 4 | | | | | 2005 | | | | | 2037 | | | | | 23,000 | |
3.25% Bonds of the Federal Republic of 2005 | | | | 3.25 | | | | | 2005 | | | | | 2015 | | | | | 21,000 | |
3.5% Bonds of the Federal Republic of 2005 | | | | 3.5 | | | | | 2005 | | | | | 2016 | | | | | 23,000 | |
4% Bonds of the Federal Republic of 2006 | | | | 4 | | | | | 2006 | | | | | 2016 | | | | | 23,000 | |
3.75% Bonds of the Federal Republic of 2006 | | | | 3.75 | | | | | 2006 | | | | | 2017 | | | | | 20,000 | |
4.25% Bonds of the Federal Republic of 2007 (I) | | | | 4.25 | | | | | 2007 | | | | | 2039 | | | | | 14,000 | |
4.25% Bonds of the Federal Republic of 2007 (II) | | | | 4.25 | | | | | 2007 | | | | | 2017 | | | | | 19,000 | |
4% Bonds of the Federal Republic of 2007 | | | | 4 | | | | | 2007 | | | | | 2018 | | | | | 20,000 | |
4.25% Bonds of the Federal Republic of 2008 | | | | 4.25 | | | | | 2008 | | | | | 2018 | | | | | 21,000 | |
3.75% Bonds of the Federal Republic of 2008 | | | | 3.75 | | | | | 2008 | | | | | 2019 | | | | | 24,000 | |
4.75% Bonds of the Federal Republic of 2008 | | | | 4.75 | | | | | 2008 | | | | | 2040 | | | | | 16,000 | |
3.5% Bonds of the Federal Republic of 2009 | | | | 3.5 | | | | | 2009 | | | | | 2019 | | | | | 24,000 | |
3.25% Bonds of the Federal Republic of 2009 | | | | 3.25 | | | | | 2009 | | | | | 2020 | | | | | 22,000 | |
3.25% Bonds of the Federal Republic of 2010 | | | | 3.25 | | | | | 2010 | | | | | 2042 | | | | | 15,000 | |
3% Bonds of the Federal Republic of 2010 | | | | 3 | | | | | 2010 | | | | | 2020 | | | | | 22,000 | |
2.25% Bonds of the Federal Republic of 2010 | | | | 2.25 | | | | | 2010 | | | | | 2020 | | | | | 16,000 | |
2.5% Bonds of the Federal Republic of 2010 | | | | 2.5 | | | | | 2010 | | | | | 2021 | | | | | 19,000 | |
3.25% Bonds of the Federal Republic of 2011 | | | | 3.25 | | | | | 2011 | | | | | 2021 | | | | | 19,000 | |
2.25% Bonds of the Federal Republic of 2011 | | | | 2.25 | | | | | 2011 | | | | | 2021 | | | | | 16,000 | |
2% Bonds of the Federal Republic of 2011 | | | | 2 | | | | | 2011 | | | | | 2022 | | | | | 20,000 | |
1.75% Bonds of the Federal Republic of 2012 | | | | 1.75 | | | | | 2012 | | | | | 2022 | | | | | 24,000 | |
1.50% Bonds of the Federal Republic of 2012 | | | | 1.50 | | | | | 2012 | | | | | 2022 | | | | | 18,000 | |
2.50% Bonds of the Federal Republic of 2012 | | | | 2.50 | | | | | 2012 | | | | | 2044 | | | | | 16,000 | |
1.5% Bonds of the Federal Republic of 2013 | | | | 1.50 | | | | | 2013 | | | | | 2023 | | | | | 18,000 | |
1.5% Bonds of the Federal Republic of 2013 (II) | | | | 1.50 | | | | | 2013 | | | | | 2023 | | | | | 18,000 | |
2% Bonds of the Federal Republic of 2013 | | | | 2 | | | | | 2013 | | | | | 2023 | | | | | 18,000 | |
1.5% Bonds of the Federal Republic and the Länder of 2013 | | | | 1.50 | | | | | 2013 | | | | | 2020 | | | | | 405 | |
| | | | | | | | | | | | | | | | | | | | |
Total Federal Bonds | | | | | | | | | | | | | | | | | | | 679,405 | |
| | | | | | | | | | | | | | | | | | | | |
| (1) | Federal Bonds (Bundesanleihen) are evidenced by book entry, and no certificates are issued. Maturities are 10 to 30 years. No redemption prior to maturity; including principal strips. |
G-43
2. INFLATION-LINKED SECURITIES (1)
| | | | | | | | | | | | | | | | | | | | |
Title | | Interest
rate | | Year of
issue | | Maturity | | Principal amount
outstanding as of
December 31, 2013 |
| | | (% per
annum) | | | | | | (EUR in millions) |
1.5% Inflation-linked Bonds of the Federal Republic of 2006 | | | | 1.5 | | | | | 2006 | | | | | 2016 | | | | | 15,000 | |
1.75% Inflation-linked Bonds of the Federal Republic of 2009 | | | | 1.75 | | | | | 2009 | | | | | 2020 | | | | | 15,000 | |
0.75% Inflation-linked Notes of the Federal Republic of 2011 | | | | 0.75 | | | | | 2011 | | | | | 2018 | | | | | 11,000 | |
0.10% Inflation-linked Bonds of the Federal Republic of 2012 | | | | 0.10 | | | | | 2012 | | | | | 2023 | | | | | 13,000 | |
| | | | | | | | | | | | | | | | | | | | |
Total Inflation-linked Securities | | | | | | | | | | | | | | | | | | | 54,000 | |
| | | | | | | | | | | | | | | | | | | | |
| (1) | Inflation-linked Securities (Inflationsindexierte Bundeswertpapiere) are evidenced by book entry, and no certificates are issued. Maturities are five to ten years. No redemption prior to maturity. |
3. FIVE-YEAR FEDERAL NOTES (1)
| | | | | | | | | | | | | | | | | | | | |
Title | | Interest
rate | | Year of
issue | | Maturity | | Principal amount
outstanding as of
December 31, 2013 |
| | | (% per annum) | | | | | | (EUR in millions) |
2.25% Bonds of 2009-Series 154 | | | | 2.25 | | | | | 2009 | | | | | 2014 | | | | | 19,000 | |
2.5% Bonds of 2009-Series 155 | | | | 2.5 | | | | | 2009 | | | | | 2014 | | | | | 17,000 | |
2.5% Bonds of 2010-Series 156 | | | | 2.5 | | | | | 2010 | | | | | 2015 | | | | | 17,000 | |
2.25% Bonds of 2010-Series 157 | | | | 2.25 | | | | | 2010 | | | | | 2015 | | | | | 19,000 | |
1.75% Bonds of 2010-Series 158 | | | | 1.75 | | | | | 2010 | | | | | 2015 | | | | | 16,000 | |
2.0% Bonds of 2011-Series 159 | | | | 2.0 | | | | | 2011 | | | | | 2016 | | | | | 16,000 | |
2.75% Bonds of 2011-Series 160 | | | | 2.75 | | | | | 2011 | | | | | 2016 | | | | | 18,000 | |
1.25% Bonds of 2011-Series 161 | | | | 1.25 | | | | | 2011 | | | | | 2016 | | | | | 16,000 | |
0.75% Bonds of 2012-Series 162 | | | | 0.75 | | | | | 2012 | | | | | 2017 | | | | | 16,000 | |
0.50% Bonds of 2012-Series 163 | | | | 0.50 | | | | | 2012 | | | | | 2017 | | | | | 18,000 | |
0.50% Bonds of 2012-Series 164 | | | | 0.50 | | | | | 2012 | | | | | 2017 | | | | | 16,000 | |
0.50% Bonds of 2013-Series 165 | | | | 0.50 | | | | | 2013 | | | | | 2018 | | | | | 17,000 | |
0.25% Bonds of 2013-Series 166 | | | | 0.25 | | | | | 2013 | | | | | 2018 | | | | | 17,000 | |
1.0% Bonds of 2013-Series 167 | | | | 1.0 | | | | | 2013 | | | | | 2018 | | | | | 17,000 | |
| | | | | | | | | | | | | | | | | | | | |
Total Five-Year Federal Notes | | | | | | | | | | | | | | | | | | | 239,000 | |
| | | | | | | | | | | | | | | | | | | | |
| (1) | Five-Year Federal Notes (Bundesobligationen) are evidenced by book entry, and no certificates are issued. Maturities are approximately five years. No redemption prior to maturity. |
G-44
4. FEDERAL TREASURY NOTES (1)
| | | | | | | | | | | | | | | | | | | | |
Title | | Interest
Rate | | Year of
Issue | | Maturity | | Principal Amount
Outstanding as of
December 31, 2013 |
| | | (% per
annum) | | | | | | (EUR in millions) |
0.25% Notes of 2012 | | | | 0.25 | | | | | 2012 | | | | | 2014 | | | | | 15,000 | |
0.00% Notes of 2012 | | | | 0.00 | | | | | 2012 | | | | | 2014 | | | | | 15,000 | |
0.00% Notes of 2012 (II) | | | | 0.00 | | | | | 2012 | | | | | 2014 | | | | | 15,000 | |
0.00% Notes of 2012 (III) | | | | 0.00 | | | | | 2012 | | | | | 2014 | | | | | 14,000 | |
0.25% Notes of 2013 | | | | 0.25 | | | | | 2013 | | | | | 2015 | | | | | 15,000 | |
0.25% Notes of 2013 (II) | | | | 0.25 | | | | | 2013 | | | | | 2015 | | | | | 15,000 | |
0.00% Notes of 2013 | | | | 0.00 | | | | | 2013 | | | | | 2015 | | | | | 15,000 | |
0.00% Notes of 2013 (II) | | | | 0.00 | | | | | 2013 | | | | | 2015 | | | | | 10,000 | |
| | | | | | | | | | | | | | | | | | | | |
Total Federal Treasury Notes | | | | | | | | | | | | | | | | | | | 114,000 | |
| | | | | | | | | | | | | | | | | | | | |
| (1) | Federal Treasury Notes (Bundesschatzanweisungen) are evidenced by book-entry, and no certificates are issued. Maturities are two years. No redemption prior to maturity. |
5. FEDERAL SAVINGS NOTES (1)
| | | | | | | | | | | | | | | | | | | | |
| | | Interest Rate | | Year of Issue | | Maturity | | Principal amount
outstanding as of
December 31, 2013 |
| | | (% per annum) | | | | | | (EUR in millions) |
Federal Savings Notes | | | | 0.0001% to 4.75% | | | | | 2006 to 2012 | | | | | 2014 to 2019 | | | | | 4,488 | |
6. TREASURY DISCOUNT PAPER (2)
| | | | | | | | | | | | | | | | | | | | |
| | | Interest Rate(3) | | Year of Issue | | Maturity | | Principal amount
outstanding as of
December 31, 2013 |
| | | (% per annum) | | | | | | (EUR in millions) |
Treasury Discount Paper | | | | 0.00% to 0.13% | | | | | 2013 | | | | | 2014 | | | | | 49,975 | |
7. FEDERAL TREASURY FINANCING PAPER (4)
| | | | | | | | | | | | | | | | | | | | |
| | | Interest Rate(3) | | Year of Issue | | Maturity | | Principal amount
outstanding as of
December 31, 2013 |
| | | (% per annum) | | | | | | (EUR in millions) |
Federal Treasury Financing Paper | | | | 0.0001% to 1.57% | | | | | 2011 to 2012 | | | | | 2014 | | | | | 29 | |
8. GERMAN GOVERNMENT DAY-BONDS
| | | | | | | | | | | | | | | | | | | | |
| | | Interest Rate | | Year of Issue | | Maturity | | Principal amount
outstanding as of
December 31, 2013 |
| | | (% per annum) | | | | | | (EUR in millions) |
German Government Day-Bonds | | variable,
tied to EONIA | | 2008 to 2012 | | | | unlimited | | | | | 1,397 | |
G-45
9. BORROWERS’NOTELOANS (5)
| | | | | | | | | | | | | | | | | | | | |
| | | Interest Rate | | Year of Issue | | Maturity | | Principal amount
outstanding as of
December 31, 2013 |
| | | (% per annum) | | | | | | (EUR in millions) |
Borrowers’ note loans (Schuldscheindarlehen) | | | | 0.12% to 7.75% | | | | | 1954 to 2013 | | | | | 2014 to 2037 | | | | | 12,222 | |
10. FURTHERSHORT-TERMDEBT (£ 1YEAR)
| | | | | | | | | | | | | | | | | | | | |
| | | Interest Rate | | Year of Issue | | Maturity | | Principal amount
outstanding as of
December 31, 2013 |
| | | (% per annum) | | | | | | (EUR in millions) |
Further short-term debt (£ 1 year) | | | | money market rates | | | | | 2013 | | | | | 2014 | | | | | 1,298 | |
| (1) | Federal Savings Notes (Bundesschatzbriefe) are evidenced by book entry and no certificates are issued. Maturities are six or seven years. The terms of the Federal Savings Notes provide for interest rates that increase during the term of the bonds. In addition, the seven-year Federal Savings Notes provide for payment of compounded interest at maturity or upon redemption prior to maturity. No redemption is permitted prior to maturity. Since January 1, 2013 the Federal Republic of Germany stopped offering new Federal savings notes and Federal Treasury financing papers. |
| (2) | Treasury Discount Papers (Unverzinsliche Schatzanweisungen) are issued at a discount and repaid at par value on the maturity date. No interest payments are made during the term of the paper. The papers are auctioned and intended for institutional investors. Maturities range from six months to twelve months. No redemption is permitted prior to maturity. |
| (3) | Reflects annual interest rate paid to the holder by way of the initial issue discount. No redemption is permitted prior to maturity. |
| (4) | Federal Treasury Financing Papers (Finanzierungsschätze) are issued at a discount and repaid at par value on the maturity date. No interest payments are made during the term of the paper. Federal Treasury Financing Papers are intended to be sold to retail customers. Maturities range from one year to two years. No redemption is permitted prior to maturity. Since January 1, 2013 the Federal Republic of Germany stopped offering new Federal savings notes and Federal Treasury financing papers. |
| (5) | Borrowers’ note loans (Schuldscheindarlehen) are an instrument of the German capital market where the lending entity, generally an institutional investor, receives a certificate evidencing its loan to the borrower and the term of such loans. The certificate generally authorizes at least three assignments. No redemption is permitted prior to maturity. |
11. OTHER LIABILITIES
| | | | | | | | | | | | | | | | | | | | |
Title | | Interest Rate | | Year of
incurrence | | Maturity | | Principal amount
outstanding as of
December 31, 2013 |
| | | (% per annum) | | | | | | (EUR in millions) |
Old debt (1) | | | | 0% to 3% | | | | | Various | | | | | Various | | | | | 4,430 | |
Other debt (2) | | | | Various | | | | | Various | | | | | Various | | | | | 40 | |
| (1) | Includes mainly equalization and covering claims of the Deutsche Bundesbank, other banks and insurance companies in connection with the currency reform of 1948. |
| (2) | Includes liabilities of the Federal Government to repay amounts received from the Investitionshilfeabgabe, a special duty levied on income, the proceeds of which were to be used to promote investments. |
Source: Bundesrepublik Deutschland Finanzagentur, Übersicht über den Stand der Schuld der Bundesrepublik Deutschland zum 31. Dezember 2013 (http://www.deutsche-finanzagentur.de/fileadmin/Material_Deutsche_Finanzagentur/PDF/Schuldenstand/Schuldenstand_Quartal/2013-12-31.pdf).
G-46
II. GUARANTEES BY THE FEDERAL GOVERNMENT
| | | | | | | | | | |
| | | Principal amount outstanding
as of December 31, |
Purpose of Guarantees | | 2012 | | 2011 |
| | | (EUR in millions) |
Export finance loans (including rescheduled loans) | | | | 124,941 | | | | | 116,560 | |
Untied loans; direct foreign investments by German companies; Loans of the European Investment Bank to non-EU borrowers | | | | 41,498 | | | | | 38,543 | |
Loans in connection with EU agricultural policy measures | | | | 0 | | | | | 0 | |
Loans to domestic corporations and for projects in areas of Agriculture, fishing and housing construction | | | | 100,019 | | | | | 100,771 | |
Contributions to international financing institutions | | | | 56,066 | | | | | 55,890 | |
Co-financing of bilateral projects of German financial co-operation | | | | 4,067 | | | | | 3,222 | |
Successor agencies to Treuhandanstalt | | | | 1,009 | | | | | 1,009 | |
Interest compensation guarantees | | | | 8,000 | | | | | 6,000 | |
| | | | | | | | | | |
Total guarantees pursuant to the 2010 German Budget Act | | | | 335,600 | | | | | 321,995 | |
| | | | | | | | | | |
Guarantee for a loan to Greece according to the German Financial Stability Act | | | | 22,400 | | | | | 22,400 | |
| | | | | | | | | | |
Loan guarantees under the Act on Guarantees pertaining to the European Stability Mechanism | | | | 100,100 | | | | | 20,500 | |
Total guarantees | | | | 458,100 | | | | | 364,895 | |
| | | | | | | | | | |
Sources: Bundesministerium der Finanzen, Finanzbericht 2014 (http://www.bundesfinanzministerium.de/Content/DE/Standardartikel/Themen/Oeffentliche_Finanzen/Wirtschafts_und_Finanzdaten/Finanzbericht-2014-anl.pdf?__blob=publicationFile&v=2), Overview 4, page 349; Finanzbericht 2013, Overview 4, page 353.
G-47
III. LIABILITIES TO INTERNATIONAL FINANCIAL ORGANIZATIONS
The Federal Republic is obligated to contribute to the capital subscriptions and, in some cases, to additional financing, according to the requirements of each respective membership. Such contributions are in many cases stated initially in 1944 with one U.S. dollar being an equivalent to 0.888671 grams of gold, and later – with the creation of the Special Drawing Right (“SDR”) – being an equivalent to the SDR at the same value. The SDR was established by an amendment to the Articles of Agreement of the IMF in July 1969. From July 1, 1974 to June 1978 the exchange rate between world currencies and the SDR was determined on the basis of a basket of 18 currencies, including the U.S. dollar, which accounted for approximately one-third of the value of the basket. From July 1978 to December 31, 1980, the exchange rate was determined on the basis of a basket of 15 currencies. From 1981 to 2000, the basket was further reduced to the five key currencies, including the U.S. dollar. The value of the SDR, the possible inclusion of new currencies in the basket, the weight of each of these currencies in the basket, and the financial instruments used in determining the interest rate on the SDR, are reviewed every five years. The adoption of the euro as the common currency for the initial 11 Member States of the European Union called for the last change in the composition of the SDR basket so far. With effect from January 1, 2001, the SDR basket consists of four currencies: U.S. dollar, euro, Japanese yen and pound sterling. The currency weight of the U.S. dollar in the SDR basket initially was 45%, changing on a daily basis as a result of exchange rate fluctuations. On December 28, 2012, SDR 1 equaled EUR 1.165830. SDR 1 equaled USD 1.536920.
SUBSCRIPTIONSOR COMMITMENTSBYTHE FEDERAL REPUBLIC
TO INTERNATIONAL FINANCIAL ORGANIZATIONS
ASOF ENDOF DECEMBER, 2013
| | | | | | | | | | |
Name of organization | | Subscription or
commitment by the
Federal Republic (1) | | Amount paid in |
| | | (USD in millions) |
IMF (2) | | | | 22,386 | | | | | 22,386 | |
International Bank for Reconstruction and Development (IBRD) (3)(4) | | | | 9,946.4 | | | | | 615.7 | |
International Development Association (IDA) (3)(4) | | | | 24,095.71 | | | | | 24,095.61 | |
International Finance Corporation (IFC) (3)(4) | | | | 128.9 | | | | | 128.9 | |
European Investment Bank (EIB) (5) | | | | 54,053.9 | | | | | 4,689 | |
African Development Bank (AfDB) (3) | | | | 4,028.5 | | | | | 179.8 | |
African Development Fund (AfDF) (3) | | | | 3,528.3 | | | | | 3,528.3 | |
Asian Development Bank (AsDB) (3) | | | | 7,071.7 | | | | | 353.7 | |
Asian Development Fund (AsDF) (3) | | | | 2,374.0 | | | | | 2,098.0 | |
Inter-American Development Bank (IDB) (3) | | | | 2,386.6 | | | | | 93.7 | |
Inter-American Investment Corporation (IIC) (3) | | | | 13.3 | | | | | 13.3 | |
Fund for Special Operations (FSO) (3) | | | | 241.3 | | | | | 241.3 | |
International Fund for Agricultural Development (IFAD) (3) | | | | 467.4 | | | | | 413.7 | |
Caribbean Development Bank (CDB) (3) | | | | 106.6 | | | | | 23.5 | |
Special Development Fund of the Caribbean Development Bank (SDF) (3) | | | | 98.6 | | | | | 82.6 | |
European Bank for Reconstruction and Development (EBRD) (3)(5) | | | | 3,526.3 | | | | | 735.1 | |
Council of Europe Development Bank (CEB) (3)(5) | | | | 1,262.9 | | | | | 140.2 | |
| (1) | Subscriptions are in part committed in USD, SDR or EUR. SDR or EUR commitments are converted to USD at year-end exchange rates, except that certain SDR commitments are converted at the fixed conversion rate of SDR 1 = USD 1.53527. |
| (2) | Source: Computation provided by the Ministry of Finance based on data provided by the IMF; the subscription (quota) is fully paid in by the Deutsche Bundesbank. The foreign currency part of the quota (25% of the subscription) and the Deutsche Bundesbank’s further contributions to Fund’s financing are part of the foreign currency reserves of the Deutsche Bundesbank. The government does not provide any guarantees or provisions for risks of IMF loans. |
| (3) | Source: Computation provided by the Ministry of Finance and the Ministry for Economic Cooperation and Development. |
| (4) | Sources: IBRD and IDA: Worldbank Annual Report 2012 (June 30, 2012); IFC: Consolidated Financial Statements 2011 (June 30, 2011). The amount does not differentiate between amount subscribed and paid-in. |
| (5) | Source: Computation provided by the Ministry of Finance based on euro exchange rate of the European Central Bank at year-end 2013 of EUR 1 per USD 1.3791. |
G-48