united states
securities and exchange commission
washington, d.c. 20549
form n-csr
certified shareholder report of registered management
investment companies
Investment Company Act file number 811-22756
Advisors Preferred Trust
(Exact name of registrant as specified in charter)
1445 Research Blvd, Suite 530, Rockville, MD 20850
(Address of principal executive offices) (Zip code)
The Corporation Trust Company
1209 Orange Street Wilmington, DE 19801
(Name and address of agent for service)
Registrant's telephone number, including area code: 631-470-2734
Date of fiscal year end: 9/30
Date of reporting period: 9/30/22
Item 1. Reports to Stockholders.
 | ||
| Spectrum Low Volatility Fund | ||
| Spectrum Active Advantage Fund | ||
| (formerly Spectrum Advisors Preferred Fund) | ||
| Spectrum Unconstrained Fund | ||
| Annual Report | ||
| September 30, 2022 | ||
| Investor Information: 1-866-862-9686 | ||
| This report and the financial statements contained herein are submitted for the general information of shareholders and are not authorized for distribution to prospective investors unless preceded or accompanied by an effective prospectus. Nothing herein contained is to be considered an offer of sale or solicitation of an offer to buy shares of the Spectrum Funds. Such offering is made only by prospectus, which includes details as to offering price and other material information. | ||
| Distributed by Ceros Financial Services, Inc. | ||
| Member FINRA | ||
November 15, 2022
Dear Shareholders:
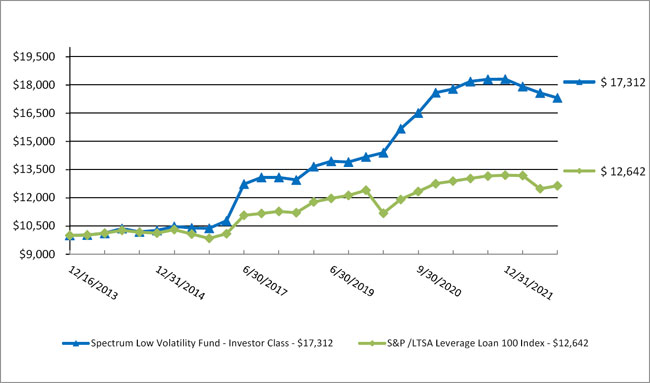
The Spectrum Low Volatility Fund returned minus -5.38% for the period from October 1, 2021 - September 30, 2022; the Fund’s primary benchmark, the S&P/LSTA U.S. Leveraged Loan 100 Total Return Index, was down - 3.92% for the 12 -month period. The Fund’s secondary benchmark, a customized index composed of a 50% weighting of the Barclays U.S. High Yield Very Liquid Total Return Index and a 50% weighting of the S&P Leveraged Loan 100 Total Return Index, declined by -9.44% for the period. The Fund did maintain its objectives for the period and the Sub-advisor believes it is positioned ready to participate when opportunities begin to present themselves.
October was a mild month for fixed income assets as higher Treasury yields continued to pressure this market sector. Within corporate credit, senior loans remained strong in the face of market volatility. High yield bonds were generally weak throughout the month as duration risk was a lingering concern. The Sub-advisor removed higher volatility assets, such as preferred stock, from the portfolio early in the month. Weakness in energy and a rise in Treasury yields ultimately took their toll in November. The Fund’s existing exposure to high yield bonds was quickly sold off or hedged out. Municipal bonds were a bright spot for the month, and the Sub-advisor increased positions. December proved to be seasonally strong. Hedges that were put in place the prior month were cleared and additional positions within high yield were added early on. Two areas of focus that saw the greatest increases were senior loans and preferred stocks, as the focus into the New Year remained on Federal Reserve policy and the rise of interest rates. January and February were challenging months as most assets were broadly lower on uncertainty surrounding inflation, rising rates, and geopolitical concerns. High yield bonds were hit particularly hard, with short interest spiking to levels not seen since March 2020. The Fund entered the year with minimal exposures, rapidly eliminated all exposure, then began to phase in allocations, with a focus on senior loans, and opportunistically adding exposure to high yield.
The March recovery was brief, and quickly faded as April began. Tightening monetary policy continued to be the main driver of deteriorating sentiment. Short-term trades within the portfolio were quickly sold, and hedges put in place to minimize the impact of longer-term holdings. The negative macro headwinds that were prevalent in April continued through May. Coming into the month, the portfolio holdings had all been hedged or sold, leaving net exposure levels around zero as the markets worked to price in higher odds of a recession than previously anticipated. As May came to a close, extremely oversold technical levels and dislocations not seen since 2020 within the credit markets, warranted a few small, opportunistic positions. Markets continued to be strained throughout June. Volatility remained high across all asset classes with mutual funds and ETF’s experiencing their third largest outflows on record. Even senior loan products, which generally perform well in rising rate environments, were not immune. Following the mid-month Federal Reserve meeting, prices appeared to stall and further declines were not seen. Outside of a few small, opportunistic trades, the Fund remained very defensively positioned given the negative macro backdrop.
July opened strongly across asset classes, sustaining an upward bias throughout the month, a first for the year 2022. Allocations were rapidly increased within the fund, particularly focused within high yield and municipal areas. As the month-long rally persisted, additional positions were added judiciously. At the beginning of August, the market continued to build on the previous July’s strength. However, sentiment weakened mid - month on the hawkish Federal Reserve rhetoric and a continued focus on curbing inflation at all costs. While energy was able to provide a modest boost to high yield bonds, light summer volumes helped propel price volatility across assets and exposures were eliminated. The Sub-advisor increased senior loan positions early in the month, along with small allocations to preferred stocks. As the rally fizzled, these positions were hedged, leaving the portfolio mostly holding bank loans to end the month. September began with a short-lived relief rally that ultimately failed, driving credit markets to year-to-date lows as the Federal Reserve delivered another 0.75% rate hike. The rhetoric surrounding the September meeting had many questioning the ability of the Fed to orchestrate a “soft landing”, leading to steep declines across asset classes. Treasury yields surged, with the 2-year T-bill breaking above 4%, a level not seen since the great financial crisis. Hedges within the
1
Fund were scaled back early in the month as prices rebounded sharply. When the markets began to price in higher and longer rate hikes, longer term holdings could no longer be justified, and holdings were liquidated.
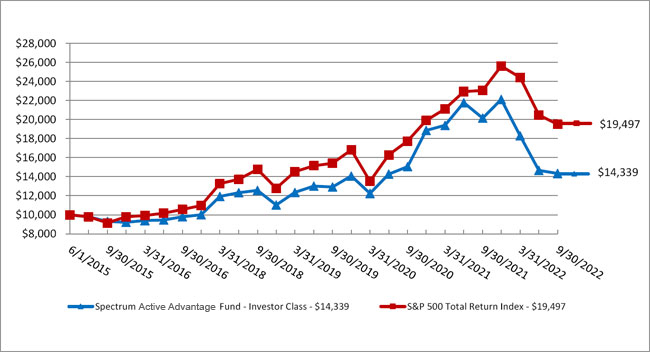
The Spectrum Active Advantage Fund declined by -28.87% for the period. The Fund’s primary benchmark, the S&P 500 Total Return Index, fell -15.47% for the period while the Fund’s secondary benchmark the NYSE Composite Index declined by -14.59% for the period. The NASDAQ Composite Index was down 26.25%. The Fund overall began to negotiate the markets better early in the third quarter of the period. Unfortunately, this was after suffering a loss of -29.00%. Extreme inter-day market swings throughout the period made this challenging. The portfolio team was able adjust exposure with better risk controls. The Fund saw an increase in performance of 1.40% for the second half of the period, and the Sub-advisor believes it is positioned to quickly seize opportunities as they materialize.
The Fund was defensive early in October. As the Sub-advisor detected technical improvement, it rapidly increased exposure in the Fund through individual stocks, index futures, and bond ETFs. Growth stocks, and in particular, technology holdings within the Fund proved well-positioned for the sharp rebound late in December. Major equity indexes lost ground in January. Energy was one of the few exceptions. Rising short-term interest rates were commonly cited as headwinds. Volatility settled down late in the month. Favorable trends going into January had the Fund in a positive stance. The Sub-advisor made tactical adjustments to mitigate risk as momentum changed course, but drawdowns occurred. Equity markets were challenged in February and March as investors continued to grapple with uncertainties of the impending Federal Reserve response to inflation, as well as news on Russia and Ukraine. In April, the NASDAQ suffered its worst month since 2008, and its worst four month start of the year in its history. The S&P 500 posted its weakest first four months since 1939. The month was characterized by numerous large one day reversals and multi-day gains only to give way to pessimism. The Fund adjusted to the sharp momentum shifts but without new favorable trends getting traction, the Fund lost ground. The stock market fell sharply in early May as major equity indexes such as the S&P 500, NASDAQ Composite and Russell 2000 each set 52-week lows. The Fund implemented a few tactical trades, but upside traction was elusive. June began with equities having positive momentum from an oversold rebound. This turned out to be a temporary reprieve within the downtrend as major indexes such as the S&P 500, NASDAQ Composite and Russell 2000 pushed to new lows year-to-date by mid-month. Given the market’s transition to a major downtrend and higher levels of volatility, the Fund shifted to more a more defensive stance and implemented only a few tactical trades in June.
The Federal Reserve raised interest rates by 75 basis points again in late in July, which gave investors confidence to look beyond the threat of persistent high inflation. Volatility began to come down, and momentum improved enough for the Fund to move off its cash stance and into tactical trades. Equities rallied in the first half of August, with sharp gains centered around sectors with deep losses year-to-date through mid-Summer. The rally in many of these stocks and major indexes failed near the declining 200-day moving averages, often used by chartists as a key technical level. Weakness characterized the second half of the month with a temporary show of support in the major indexes such as the S&P 500, NASDAQ and Russell 2000 just prior to Federal Reserve Chairman Powell’s comments. His statements reiterated the Fed’s commitment to fighting inflation at the possible expense of negatively impacting economic growth. After his comments, the negative momentum returned and continued through month’s end. The Fund quickly reduced exposure shortly after mid-month as technical conditions showed signs of deterioration. Brief tactical trades occurred late in the month though the Fund ended August in a fully cash stance. Equities sold off sharply in September as investors feared that the Fed’s commitment to getting inflation under control could push the economy into a recession. Early in the month, equities posted an oversold rally that was able to break above key technical levels. This proved to be a short-lived event before losing momentum and breaking down. The sell-off was broad-based across the major sectors. The Spectrum Fund made small tactical trades as oversold opportunities presented themselves though was mostly positioned defensively during the month.
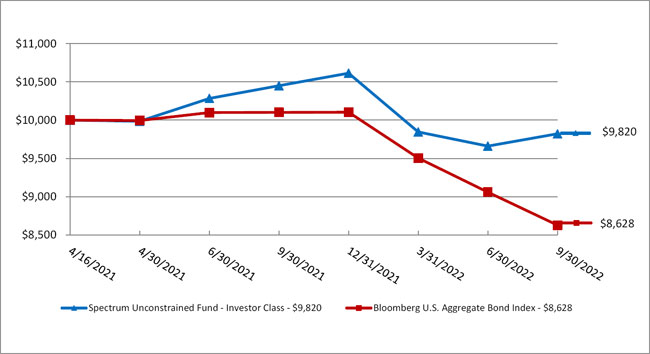
The new Spectrum Unconstrained Fund returned -6.03% for the period from October 1, 2021 – September 30, 2022. The Fund’s primary benchmark, the Bloomberg Aggregate Bond Index was down -14.60% for the same period, and the S&P 500 Total Return Index was down -15.47%. Most of the Fund’s loss is attributed to performance through the beginning of the third quarter period down -7.46%. With additional risk controls to
2
position the Fund with lower exposure, the Fund navigated the remainder of the period with a gain of 1.40%. The Fund trades various ETF bond funds (HYG, BKLN, HYD, EMB, CWB, PFF) while using adjustable exposure of leverage. This was a difficult environment for a leveraged bond fund.
During the period, the Sub-advisor used swaps and futures as substitutes for various underlying reference assets to achieve part of its returns. Thank you for your investment in the Funds. Please visit the website www.thespectrumfunds.com at any time for information regarding the Funds.
| Spectrum Financial, Inc. | Advisors Preferred, LLC |
| Sub-advisor to the Funds | Advisor to the Funds |
3
Spectrum Low Volatility Fund
Portfolio Review (Unaudited)
September 30, 2022
The Fund’s performance figures* for the periods ended September 30, 2022, as compared to its benchmark:
| Annualized | |||
| One Year | Five Year | Since Inception ** | |
| Spectrum Low Volatility Fund - Investor Class | (5.38)% | 5.76% | 6.44% |
| S&P/LSTA Leveraged Loan 100 Index*** | (3.92)% | 2.50% | 2.70% |
| * | The performance data quoted is historical. Past performance is no guarantee of future results. Current performance may be higher or lower than the performance data quoted. The principal value and investment return of an investment will fluctuate so that your shares, when redeemed, may be worth more or less than their original cost. The returns shown do not reflect the deduction of taxes that a shareholder would pay on Fund distributions or on the redemptions of Fund shares. Returns greater than 1 year are annualized. The total gross annual operating expenses as stated in the fee table of the Fund’s prospectus dated February 1, 2022 is 3.02% for the Investor Class. The gross expense ratio shown above does not tie to the financial highlights in the annual report due to acquired funds fees. For performance information current to the most recent month-end, please call 1-866-862-9686. |
| ** | Inception date is December 16, 2013. |
| *** | The S&P/LSTA Leveraged Loan 100 Index is designed to reflect the performance of the largest facilities in the leverage loan market. |
Comparison of the Change in Value of a $10,000 Investment
Since Inception through September 30, 2022
Portfolio Composition as of September 30, 2022 (Unaudited)
| Holdings by Type of Investment: | % of Net Assets * | |||
| Short-term Investments | 98.7 | % | ||
| Other Assets in Excess of Liabilities | 1.3 | % | ||
| 100.0 | % | |||
| * | The portfolio composition detailed above does not include derivative exposure. |
Please refer to the Portfolio of Investments and the Shareholder Letter in this report for a detailed listing of the Fund’s holdings.
4
Spectrum Active Advantage Fund
Portfolio Review (Unaudited)
September 30, 2022
The Fund’s performance figures* for the periods ended September 30, 2022, as compared to its benchmark:
| Annualized | |||
| One Year | Five Years | Since Inception ** | |
| Spectrum Active Advantage Fund - Investor Class | (28.87)% | 5.23% | 5.04% |
| S&P 500 Total Return Index *** | (15.47)% | 9.24% | 9.53% |
| * | The performance data quoted is historical. Past performance is no guarantee of future results. Current performance may be higher or lower than the performance data quoted. The principal value and investment return of an investment will fluctuate so that your shares, when redeemed, may be worth more or less than their original cost. The returns shown do not reflect the deduction of taxes that a shareholder would pay on Fund distributions or on the redemptions of Fund shares. Spectrum Active Advantage Fund’s Investor Class shares are subject to a gross annual operating expense ratio of 1.77%, as per the April 14, 2022 Investor Class prospectus. The gross expense ratio shown above does not tie to the financial highlights in the annual report due to acquired funds fees. For performance information current to the most recent month-end, please call 1-866-862-9686. |
| ** | Inception date is June 1, 2015. |
| *** | The S&P 500 Total Return Index is an unmanaged composite of 500 large capitalization companies and includes the reinvestment of dividends. This index is widely used by professional investors as a performance benchmark for large-cap stocks. Investors cannot invest directly in an index. |
Comparison of the Change in Value of a $10,000 Investment
Since Inception through September 30, 2022
Portfolio Composition as of September 30, 2022 (Unaudited)
| Holdings by Type of Investment: | % of Net Assets * | |||
| U.S. Government & Agencies | 81.6 | % | ||
| Short-term Investments | 17.7 | % | ||
| Other Assets in Excess of Liabilities | 0.7 | % | ||
| 100.0 | % | |||
| * | The portfolio composition detailed above does not include derivative exposure. |
Please refer to the Portfolio of Investments and the Shareholder Letter in this report for a detailed listing of the Fund’s holdings.
5
Spectrum Unconstrained Fund
Portfolio Review (Unaudited)
September 30, 2022
The Fund’s performance figures* for the period ended September 30, 2022, as compared to its benchmark:
| One Year | Since Inception ** | |
| Spectrum Unconstrained Fund - Investor Class | (6.03)% | (1.24)% |
| Bloomberg U.S. Aggregate Bond Index *** | (14.60)% | (9.63)% |
| * | The performance data quoted is historical. Past performance is no guarantee of future results. Current performance may be higher or lower than the performance data quoted. The principal value and investment return of an investment will fluctuate so that your shares, when redeemed, may be worth more or less than their original cost. The returns shown do not reflect the deduction of taxes that a shareholder would pay on Fund distributions or on the redemptions of Fund shares. Spectrum Unconstrained Fund’s Investor Class shares are subject to a gross annual operating expense ratio of 2.71%, as per the February 1, 2022 Investor Class prospectus. The gross expense ratio shown above does not tie to the financial highlights in the annual report due to acquired funds fees. For performance information current to the most recent month-end, please call 1-866-862-9686. |
| ** | Inception date is April 16, 2021. |
| *** | The Bloomberg U.S. Aggregate Bond Index is an unmanaged index comprised of U.S. investment grade, fixed rate bond market securities, including government, government agency, corporate and mortgage-backed securities. Investors cannot invest directly in an index; unlike the Fund’s returns, the index does not reflect any fees or expenses. |
Comparison of the Change in Value of a $10,000 Investment
Since Inception through September 30, 2022
Portfolio Composition as of September 30, 2022 (Unaudited)
| Holdings by Type of Investment: | % of Net Assets * | |||
| Short-term Investments | 90.8 | % | ||
| Other Assets in Excess of Liabilities | 9.2 | % | ||
| 100.0 | % | |||
| * | The portfolio composition detailed above does not include derivative exposure. |
Please refer to the Portfolio of Investments and the Shareholder Letter in this report for a detailed listing of the Fund’s holdings.
6
| SPECTRUM LOW VOLATILITY FUND |
| PORTFOLIO OF INVESTMENTS |
| September 30, 2022 |
| Shares | Fair Value | |||||||
| SHORT-TERM INVESTMENTS — 98.7% | ||||||||
| MONEY MARKET FUND - 98.7% | ||||||||
| 299,772,678 | Fidelity Government Portfolio, Class I, 2.74% (Cost $299,772,678)(a) | $ | 299,772,678 | |||||
| TOTAL INVESTMENTS - 98.7% (Cost $299,772,678) | $ | 299,772,678 | ||||||
| OTHER ASSETS IN EXCESS OF LIABILITIES- 1.3% | 3,858,424 | |||||||
| NET ASSETS - 100.0% | $ | 303,631,102 | ||||||
| (a) | Rate disclosed is the seven-day effective yield as of September 30, 2022. |
TOTAL RETURN SWAPS
| Notional Amount | Unrealized | |||||||||||||||
| at September 30, | Termination | Appreciation | ||||||||||||||
| Number of Shares | Reference Entity* | 2022 | Interest Rate Payable (1) | Date | Counterparty | (Depreciation) | ||||||||||
| Long Position: | ||||||||||||||||
| 19,872,774 | PIMCO Government Money Market Fund | $ | 19,872,774 | USD SOFR plus 165 bp | 9/4/2025 | BRC | $ | — | ||||||||
| Total: | $ | — | ||||||||||||||
BRC - Barclays Capital
SOFR - Secured Overnight Financing Rate
| (1) | Interest rate is based upon predetermined notional amounts, which may be a multiple of the number of shares plus a specified spread. |
| * | Swap contract reset at September 30, 2022. |
See accompanying notes to financial statements.
7
| SPECTRUM ACTIVE ADVANTAGE FUND |
| PORTFOLIO OF INVESTMENTS |
| September 30, 2022 |
| Principal | Coupon Rate | |||||||||||
| Amount ($) | (%) | Maturity | Fair Value | |||||||||
| U.S. GOVERNMENT & AGENCIES — 81.6% | ||||||||||||
| U.S. TREASURY BILLS — 81.6% | ||||||||||||
| 7,051,000 | United States Cash Management Bill(a) | 2.95%(b) | 12/27/22 | $ | 7,001,133 | |||||||
| TOTAL U.S. GOVERNMENT & AGENCIES (Cost $7,001,073) | 7,001,133 | |||||||||||
| Shares | ||||||||||||
| SHORT-TERM INVESTMENTS — 17.7% | ||||||||||||
| MONEY MARKET FUNDS - 17.7% | ||||||||||||
| 758,403 | Fidelity Government Portfolio, Class I, 2.74%(b) | 758,403 | ||||||||||
| 758,403 | First American Government Obligations Fund, Class Z, 2.74%(b) | 758,403 | ||||||||||
| TOTAL MONEY MARKET FUNDS (Cost $1,516,806) | 1,516,806 | |||||||||||
| TOTAL SHORT-TERM INVESTMENTS (Cost $1,516,806) | 1,516,806 | |||||||||||
| TOTAL INVESTMENTS - 99.3% (Cost $8,517,879) | $ | 8,517,939 | ||||||||||
| OTHER ASSETS IN EXCESS OF LIABILITIES- 0.7% | 58,482 | |||||||||||
| NET ASSETS - 100.0% | $ | 8,576,421 | ||||||||||
| (a) | Zero coupon bond. |
| (b) | Rate disclosed is the seven-day effective yield as of September 30, 2022. |
See accompanying notes to financial statements.
8
| SPECTRUM UNCONSTRAINED FUND |
| PORTFOLIO OF INVESTMENTS |
| September 30, 2022 |
| Shares | Fair Value | |||||||
| SHORT-TERM INVESTMENTS — 90.8% | ||||||||
| MONEY MARKET FUNDS - 90.8% | ||||||||
| 3,277,287 | Fidelity Government Portfolio, Class I, 2.74%(a) | $ | 3,277,287 | |||||
| 3,277,288 | First American Government Obligations Fund, Class Z, 2.74%(a) | 3,277,288 | ||||||
| TOTAL MONEY MARKET FUNDS (Cost $6,554,575) | 6,554,575 | |||||||
| TOTAL SHORT-TERM INVESTMENTS (Cost $6,554,575) | 6,554,575 | |||||||
| TOTAL INVESTMENTS - 90.8% (Cost $6,554,575) | $ | 6,554,575 | ||||||
| OTHER ASSETS IN EXCESS OF LIABILITIES- 9.2% | 661,744 | |||||||
| NET ASSETS - 100.0% | $ | 7,216,319 | ||||||
| (a) | Rate disclosed is the seven-day effective yield as of September 30, 2022. |
See accompanying notes to financial statements.
9
| Spectrum Funds |
| Statements of Assets and Liabilities |
| September 30, 2022 |
| Spectrum Low | Spectrum Active | Spectrum | ||||||||||
| Volatility Fund | Advantage Fund | Unconstrained Fund | ||||||||||
| ASSETS | ||||||||||||
| Investment securities: | ||||||||||||
| At cost | $ | 299,772,678 | $ | 8,517,879 | $ | 6,554,575 | ||||||
| At value | $ | 299,772,678 | $ | 8,517,939 | $ | 6,554,575 | ||||||
| Deposit with broker for swaps | 3,361,888 | — | 310,526 | |||||||||
| Receivable for Fund shares sold | 527,959 | — | — | |||||||||
| Receivable for swaps | 481,583 | — | — | |||||||||
| Dividend and interest receivable | 391,877 | 6,537 | 10,642 | |||||||||
| Segregated cash - collateral for swaps | — | — | 370,000 | |||||||||
| Deposit with broker for futures | — | 31,567 | — | |||||||||
| Receivable from administrator | 18,966 | 31,227 | — | |||||||||
| TOTAL ASSETS | 304,554,951 | 8,587,270 | 7,245,743 | |||||||||
| LIABILITIES | ||||||||||||
| Investment advisory fees payable | 538,710 | 10,341 | 15,597 | |||||||||
| Payable for Fund shares redeemed | 335,383 | — | 2,430 | |||||||||
| Payable for swaps | 40,241 | — | 11,397 | |||||||||
| Shareholder servicing fees payable | 9,515 | 508 | — | |||||||||
| TOTAL LIABILITIES | 923,849 | 10,849 | 29,424 | |||||||||
| NET ASSETS | $ | 303,631,102 | $ | 8,576,421 | $ | 7,216,319 | ||||||
| NET ASSET VALUE | ||||||||||||
| Net Assets | $ | 303,631,102 | $ | 8,576,421 | $ | 7,216,319 | ||||||
| Shares of beneficial interest outstanding | 12,931,106 | 521,486 | 399,152 | |||||||||
| Net Asset Value, Offering and Redemption Price Per Share (Net Assets ÷ Shares Outstanding) | $ | 23.48 | $ | 16.45 | $ | 18.08 | ||||||
| NET ASSETS CONSIST OF: | ||||||||||||
| Paid in capital ($0 par value, unlimited shares authorized) | $ | 308,207,745 | $ | 14,464,865 | $ | 8,173,386 | ||||||
| Accumulated deficits | (4,576,643 | ) | (5,888,444 | ) | (957,067 | ) | ||||||
| NET ASSETS | $ | 303,631,102 | $ | 8,576,421 | $ | 7,216,319 | ||||||
See accompanying notes to financial statements.
10
| Spectrum Funds |
| Statements of Operations |
| For the Year Ended September 30, 2022 |
| Spectrum Low | Spectrum Active | Spectrum | ||||||||||
| Volatility Fund | Advantage Fund | Unconstrained Fund | ||||||||||
| INVESTMENT INCOME | ||||||||||||
| Dividends | $ | 3,095,615 | $ | 55,401 | $ | 76,687 | ||||||
| Interest | 929,454 | 13,909 | 39,140 | |||||||||
| TOTAL INVESTMENT INCOME | 4,025,069 | 69,310 | 115,827 | |||||||||
| EXPENSES | ||||||||||||
| Investment advisory fees | 6,934,530 | 222,753 | 197,197 | |||||||||
| Administration expenses (Note 5) | 488,884 | 22,649 | 21,356 | |||||||||
| Shareholder servicing fees | 96,734 | 4,455 | 2,751 | |||||||||
| Miscellaneous expenses | 12,545 | 1,736 | 1,736 | |||||||||
| TOTAL EXPENSES | 7,532,693 | 251,593 | 223,040 | |||||||||
| NET INVESTMENT LOSS | (3,507,624 | ) | (182,283 | ) | (107,213 | ) | ||||||
| REALIZED AND UNREALIZED GAIN (LOSS) ON INVESTMENTS | ||||||||||||
| Investments | 10,096,007 | 178,927 | (75,982 | ) | ||||||||
| Swaps | (10,269,247 | ) | (2,934,386 | ) | (499,335 | ) | ||||||
| Futures | (121,039 | ) | (2,515,080 | ) | — | |||||||
| Short sales | — | 2,056 | — | |||||||||
| Distributions received from underlying investment companies | 1,395,118 | — | 8,211 | |||||||||
| TOTAL NET REALIZED GAIN (LOSS) | 1,100,839 | (5,268,483 | ) | (567,106 | ) | |||||||
| Net change in unrealized appreciation (depreciation) on: | ||||||||||||
| Investments | (14,892,295 | ) | (240,831 | ) | (703 | ) | ||||||
| Swaps | (31,555 | ) | 265,894 | — | ||||||||
| Futures | — | 332,890 | — | |||||||||
| TOTAL NET CHANGE IN UNREALIZED APPRECIATION (DEPRECIATION) | (14,923,850 | ) | 357,953 | (703 | ) | |||||||
| NET REALIZED AND UNREALIZED LOSS ON INVESTMENTS | (13,823,011 | ) | (4,910,530 | ) | (567,809 | ) | ||||||
| NET DECREASE IN NET ASSETS FROM OPERATIONS | $ | (17,330,635 | ) | $ | (5,092,813 | ) | $ | (675,022 | ) | |||
See accompanying notes to financial statements.
11
| Spectrum Low Volatility Fund |
| Statements of Changes in Net Assets |
| For the | For the | |||||||
| Year Ended | Year Ended | |||||||
| September 30, 2022 | September 30, 2021 | |||||||
| INCREASE (DECREASE) IN NET ASSETS | ||||||||
| FROM OPERATIONS | ||||||||
| Net investment income (loss) | $ | (3,507,624 | ) | $ | 1,160,628 | |||
| Net realized gain (loss) from security transactions, swaps, and futures contracts | (294,279 | ) | 21,720,767 | |||||
| Distibutions from underlying investment companies | 1,395,118 | — | ||||||
| Net change in unrealized appreciation (depreciation) of investments, swaps and futures contracts | (14,923,850 | ) | 10,776,592 | |||||
| Net increase (decrease) in net assets resulting from operations | (17,330,635 | ) | 33,657,987 | |||||
| DISTRIBUTIONS TO SHAREHOLDERS | ||||||||
| Total distributions paid | (17,405,618 | ) | (16,564,167 | ) | ||||
| Net (decrease) in net assets from distributions to shareholders | (17,405,618 | ) | (16,564,167 | ) | ||||
| FROM SHARES OF BENEFICIAL INTEREST | ||||||||
| Proceeds from shares sold | 184,185,570 | 281,994,640 | ||||||
| Net asset value of shares issued in reinvestment of distributions | 16,008,015 | 15,110,995 | ||||||
| Payments for shares redeemed | (305,986,400 | ) | (109,431,976 | ) | ||||
| Net increase (decrease) in net assets from shares of beneficial interest | (105,792,815 | ) | 187,673,659 | |||||
| TOTAL INCREASE (DECREASE) IN NET ASSETS | (140,529,068 | ) | 204,767,479 | |||||
| NET ASSETS | ||||||||
| Beginning of Year | 444,160,170 | 239,392,691 | ||||||
| End of Year | $ | 303,631,102 | $ | 444,160,170 | ||||
| SHARE ACTIVITY | ||||||||
| Shares Sold | 7,523,633 | 11,085,376 | ||||||
| Shares Reinvested | 640,621 | 605,559 | ||||||
| Shares Redeemed | (12,316,277 | ) | (4,265,622 | ) | ||||
| Net increase (decrease) in shares of beneficial interest outstanding | (4,152,023 | ) | 7,425,313 | |||||
See accompanying notes to financial statements.
12
| Spectrum Active Advantage Fund |
| Statements of Changes in Net Assets |
| For the | For the | |||||||
| Year Ended | Year Ended | |||||||
| September 30, 2022 | September 30, 2021 | |||||||
| INCREASE (DECREASE) IN NET ASSETS | ||||||||
| FROM OPERATIONS | ||||||||
| Net investment (loss) | $ | (182,283 | ) | $ | (72,665 | ) | ||
| Net realized gain (loss) from security transactions, swaps and futures contracts | (5,268,483 | ) | 5,878,746 | |||||
| Net change in unrealized apprecaition (depreciation) of investments, swaps and futures contracts | 357,953 | (1,009,625 | ) | |||||
| Net increase (decrease) in net assets resulting from operations | (5,092,813 | ) | 4,796,456 | |||||
| DISTRIBUTIONS TO SHAREHOLDERS | ||||||||
| Total distributions paid | (5,205,776 | ) | (2,572,366 | ) | ||||
| Net (decrease) in net assets from distributions to shareholders | (5,205,776 | ) | (2,572,366 | ) | ||||
| FROM SHARES OF BENEFICIAL INTEREST | ||||||||
| Proceeds from shares sold | 4,613,111 | 4,435,031 | ||||||
| Net asset value of shares issued in reinvestment of distributions | 5,099,353 | 2,565,863 | ||||||
| Payments for shares redeemed | (9,138,559 | ) | (4,261,689 | ) | ||||
| Net increase in net assets from shares of beneficial interest | 573,905 | 2,739,205 | ||||||
| TOTAL INCREASE (DECREASE) IN NET ASSETS | (9,724,684 | ) | 4,963,295 | |||||
| NET ASSETS | ||||||||
| Beginning of Year | 18,301,105 | 13,337,810 | ||||||
| End of Year | $ | 8,576,421 | $ | 18,301,105 | ||||
| SHARE ACTIVITY | ||||||||
| Shares Sold | 192,819 | 145,182 | ||||||
| Shares Reinvested | 191,764 | 99,068 | ||||||
| Shares Redeemed | (457,038 | ) | (138,317 | ) | ||||
| Net increase (decrease) in shares of beneficial interest outstanding | (72,455 | ) | 105,933 | |||||
See accompanying notes to financial statements.
13
| Spectrum Unconstrained Fund |
| Statement of Changes in Net Assets |
| For the | For the | |||||||
| Year Ended | Period Ended | |||||||
| September 30, 2022 | September 30, 2021(a) | |||||||
| INCREASE (DECREASE) IN NET ASSETS | ||||||||
| FROM OPERATIONS | ||||||||
| Net investment (loss) | $ | (107,213 | ) | $ | (56,807 | ) | ||
| Net realized gain (loss) from security transactions and swaps contracts | (575,317 | ) | 517,901 | |||||
| Distibutions from underlying investment companies | 8,211 | |||||||
| Net change in unrealized appreciation of investments and swaps contracts | (703 | ) | 703 | |||||
| Net increase (decrease) in net assets resulting from operations | (675,022 | ) | 461,797 | |||||
| DISTRIBUTIONS TO SHAREHOLDERS | ||||||||
| From return of capital | (138,132 | ) | — | |||||
| Total distributions paid | (638,185 | ) | (106,366 | ) | ||||
| Net (decrease) in net assets from distributions to shareholders | (776,317 | ) | (106,366 | ) | ||||
| FROM SHARES OF BENEFICIAL INTEREST | ||||||||
| Proceeds from shares sold | 567,962 | 10,750,257 | ||||||
| Net asset value of shares issued in reinvestment of distributions | 772,708 | 106,366 | ||||||
| Payments for shares redeemed | (3,415,956 | ) | (469,110 | ) | ||||
| Net increase (decrease) in net assets from shares of beneficial interest | (2,075,286 | ) | 10,387,513 | |||||
| TOTAL INCREASE (DECREASE) IN NET ASSETS | (3,526,625 | ) | 10,742,944 | |||||
| NET ASSETS | ||||||||
| Beginning of Year/Period | 10,742,944 | — | ||||||
| End of Year/Period | $ | 7,216,319 | $ | 10,742,944 | ||||
| SHARE ACTIVITY | ||||||||
| Shares Sold | 28,927 | 537,412 | ||||||
| Shares Reinvested | 39,094 | 5,219 | ||||||
| Shares Redeemed | (188,130 | ) | (23,370 | ) | ||||
| Net increase (decrease) in shares of beneficial interest outstanding | (120,109 | ) | 519,261 | |||||
| (a) | The Fund commenced operations on April 16, 2021. |
See accompanying notes to financial statements.
14
| Spectrum Low Volatility Fund |
| Financial Highlights |
Per Share Data and Ratios for a Share of Beneficial Interest Outstanding Throughout Each Year Presented
| For the | For the | For the | For the | For the | ||||||||||||||||
| Year Ended | Year Ended | Year Ended | Year Ended | Year Ended | ||||||||||||||||
| September 30, 2022 | September 30, 2021 | September 30, 2020 | September 30, 2019 | September 30, 2018 | ||||||||||||||||
| Net asset value, beginning of Year | $ | 26.00 | $ | 24.79 | $ | 21.72 | $ | 21.35 | $ | 22.58 | ||||||||||
| Activity from investment operations: | ||||||||||||||||||||
| Net investment income (loss) (1) | (0.27 | ) | 0.08 | 0.03 | 0.02 | 0.02 | ||||||||||||||
| Net realized and unrealized gain (loss) on investments, swaps and futures contracts | (1.06 | ) | 2.53 | 3.89 | 1.04 | 0.21 | ||||||||||||||
| Total from investment operations | (1.33 | ) | 2.61 | 3.92 | 1.06 | 0.23 | ||||||||||||||
| Less distributions from: | ||||||||||||||||||||
| Net investment income | (1.15 | ) | (0.45 | ) | (0.52 | ) | (0.69 | ) | (1.01 | ) | ||||||||||
| Net realized gains | (0.04 | ) | (0.95 | ) | (0.33 | ) | — | (0.45 | ) | |||||||||||
| Total distributions | (1.19 | ) | (1.40 | ) | (0.85 | ) | (0.69 | ) | (1.46 | ) | ||||||||||
| Net asset value, end of year | $ | 23.48 | $ | 26.00 | $ | 24.79 | $ | 21.72 | $ | 21.35 | ||||||||||
| Total return (2) | (5.38 | )% | 10.82 | % | 18.76 | % | 5.12 | % | 1.06 | % | ||||||||||
| Net assets, end of year (000s) | $ | 303,631 | $ | 444,160 | $ | 239,393 | $ | 82,195 | $ | 66,725 | ||||||||||
| Ratio of expenses to average net assets, | 2.34 | % | 2.37 | % | 2.51 | % | 2.53 | % | 2.53 | % | ||||||||||
| Ratio of net investment income (loss) to average net assets (3,4) | (1.09 | )% | 0.30 | % | 0.14 | % | 0.08 | % | 0.10 | % | ||||||||||
| Portfolio Turnover Rate | 321 | % | 131 | % | 389 | % | 675 | % | 438 | % | ||||||||||
| (1) | Per share amounts calculated using the average shares method, which more appropriately presents the per share data for the year. |
| (2) | Assumes reinvestment of all dividends and distributions if any. |
| (3) | The ratios of expenses to average net assets and net investment income (loss) to average net assets do not reflect the expenses of the underlying investment companies in which the Fund invests. |
| (4) | Recognition of net investment income (loss) by the Fund is affected by the timing and declaration of dividends by the underlying investment companies in which the Fund invests. |
See accompanying notes to financial statements.
15
| Spectrum Active Advantage Fund |
| Financial Highlights |
Per Share Data and Ratios for a Share of Beneficial Interest Outstanding Throughout Each Year Presented
| For the | For the | For the | For the | For the | ||||||||||||||||
| Year Ended | Year Ended | Year Ended | Year Ended | Year Ended | ||||||||||||||||
| September 30, 2022 | September 30, 2021 | September 30, 2020 | September 30, 2019 | September 30, 2018 | ||||||||||||||||
| Net asset value, beginning of Year | $ | 30.81 | $ | 27.33 | $ | 23.64 | $ | 23.83 | $ | 21.95 | ||||||||||
| Activity from investment operations: | ||||||||||||||||||||
| Net investment income (loss) (1) | (0.27 | ) | (0.12 | ) | (0.09 | ) | 0.02 | (0.15 | ) | |||||||||||
| Net realized and unrealized gain (loss) on investments, swaps and futures contracts | (5.63 | ) | 8.46 | 3.95 | 0.60 | 2.93 | ||||||||||||||
| Total from investment operations | (5.90 | ) | 8.34 | 3.86 | 0.62 | 2.78 | ||||||||||||||
| Less distributions from: | ||||||||||||||||||||
| Net investment income | (0.14 | ) | (0.25 | ) | (0.17 | ) | (0.18 | ) | (0.29 | ) | ||||||||||
| Net realized gains | (8.32 | ) | (4.61 | ) | — | (0.45 | ) | (0.61 | ) | |||||||||||
| Return of capital | — | — | — | (0.18 | ) | — | ||||||||||||||
| Total distributions | (8.46 | ) | (4.86 | ) | (0.17 | ) | (0.81 | ) | (0.90 | ) | ||||||||||
| Net asset value, end of year | $ | 16.45 | $ | 30.81 | $ | 27.33 | $ | 23.64 | $ | 23.83 | ||||||||||
| Total return (2) | (28.87 | )% | 33.91 | % | 16.46 | % | 2.89 | % | 13.07 | % | ||||||||||
| Net assets, end of year (000s) | $ | 8,576 | $ | 18,301 | $ | 13,338 | $ | 12,682 | $ | 11,427 | ||||||||||
| Ratio of expenses to average net assets (3) | 1.69 | % | 1.77 | % | 1.89 | % | 1.83 | % | 1.81 | % | ||||||||||
| Ratio of net investment income (loss) to average net assets (3,4) | (1.23 | )% | (0.40 | )% | (0.36 | )% | 0.08 | % | (0.65 | )% | ||||||||||
| Portfolio Turnover Rate | 2258 | % | 1294 | % | 831 | % | 360 | % | 269 | % | ||||||||||
| (1) | Per share amounts calculated using the average shares method, which more appropriately presents the per share data for the year. |
| (2) | Assumes reinvestment of all dividends and distributions if any. |
| (3) | The ratios of expenses to average net assets and net investment income (loss) to average net assets do not reflect the expenses of the underlying investment companies in which the Fund invests. |
| (4) | Recognition of net investment income (loss) by the Fund is affected by the timing and declaration of dividends by the underlying investment companies in which the Fund invests. |
See accompanying notes to financial statements.
16
| Spectrum Unconstrained Fund |
| Financial Highlights |
Per Share Data and Ratios for a Share of Beneficial Interest Outstanding Throughout Each Year/Period Presented
| For the | For the | |||||||
| Year Ended | Period Ended | |||||||
| September 30, 2022 | September 30, 2021 (a) | |||||||
| Net asset value, beginning of year/period | $ | 20.69 | $ | 20.00 | ||||
| Activity from investment operations: | ||||||||
| Net investment (loss) (1) | (0.22 | ) | (0.11 | ) | ||||
| Net realized and unrealized gain (loss) on investments and swaps | (0.93 | ) | 1.01 | |||||
| Total from investment operations | (1.15 | ) | 0.90 | |||||
| Less distributions from: | ||||||||
| Net investment income | (1.20 | ) | (0.21 | ) | ||||
| Return of capital | (0.26 | ) | — | |||||
| Total distributions | (1.46 | ) | (0.21 | ) | ||||
| Net asset value, end of year/period | $ | 18.08 | $ | 20.69 | ||||
| Total return (2) | (6.03 | )% | 4.50 | % (5) | ||||
| Net assets, end of year/period (000s) | $ | 7,216 | $ | 10,743 | ||||
| Ratio of expenses to average net assets (3) | 2.43 | % | 2.33 | % (6) | ||||
| Ratio of net investment (loss) to average net assets (3,4) | (1.17 | )% | (1.21 | )% (6) | ||||
| Portfolio Turnover Rate | 395 | % | 75 | % (5) | ||||
| (a) | The Fund commenced operations on April 16, 2021. |
| (1) | Per share amounts calculated using the average shares method, which more appropriately presents the per share data for the period. |
| (2) | Assumes reinvestment of all dividends and distributions if any. |
| (3) | The ratios of expenses to average net assets and net investment income (loss) to average net assets do not reflect the expenses of the underlying investment companies in which the Fund invests. |
| (4) | Recognition of net investment (loss) by the Fund is affected by the timing and declaration of dividends by the underlying investment companies in which the Fund invests. |
| (5) | Not annualized. |
| (6) | Annualized. |
See accompanying notes to financial statements.
17
Spectrum Funds
Notes to Financial Statements
September 31, 2022
| 1. | ORGANIZATION |
The Spectrum Low Volatility Fund (the “Low Volatility Fund”), Spectrum Active Advantage Fund (formerly Spectrum Advisors Preferred Fund (the “Active Advantage Fund”)) and Spectrum Unconstrained Fund (the “Unconstrained Fund”) (collectively, the “Funds”) are each a diversified series of Advisors Preferred Trust (the “Trust”), a statutory trust organized under the laws of the State of Delaware on August 15, 2012 and registered under the Investment Company Act of 1940, as amended (the “1940 Act”), as an open-end management investment company. The Low Volatility Fund’s investment objective is total return with lower downside volatility and risk compared to major stock market indices while the Active Advantage Fund seeks long term capital appreciation. The Unconstrained Fund’s investment objective is total return. Each Fund currently offers one class of shares, Investor Class shares, which is offered at net asset value. The Low Volatility Fund also offers Advisor Class shares, but as of the date of this report none have been issued. The Low Volatility Fund commenced operations on December 16, 2013, the Active Advantage Fund commenced operations on June 1, 2015 and the Unconstrained Fund commenced operations on April 16, 2021. The Trust’s Agreement and Declaration of Trust permits the Trust’s Board of Trustees (“Board”) to authorize and issue an unlimited number of shares of beneficial interest of separate series without par value. The investment adviser to each Fund is Advisors Preferred LLC (the “Adviser”). The investment sub-adviser to each Fund is Spectrum Financial, Inc. (the “Sub-Adviser”).
| 2. | SIGNIFICANT ACCOUNTING POLICIES |
The following is a summary of significant accounting policies followed by the Funds in preparation of their financial statements. These policies are in conformity with accounting principles generally accepted in the United States of America (“GAAP”). The preparation of the financial statements in conformity with GAAP requires management to make estimates and assumptions that affect the reported amounts of assets and liabilities and disclosure of contingent assets and liabilities at the date of the financial statements and the reported amounts of increases and decreases in net assets from operations during the reporting period. Actual results could differ from those estimates. The Funds are each an investment company and accordingly follow the investment company accounting and reporting guidance of the Financial Accounting Standards Board (FASB) Accounting Standard Codification Topic 946 Financial Services – Investment Companies.
Securities Valuation – Securities listed on an exchange are valued at the last reported sale price at the close of the regular trading session of the exchange on the business day the value is being determined, or in the case of securities listed on NASDAQ at the NASDAQ Official Closing Price (“NOCP”). If the NOCP is not available, such securities shall be valued at the last bid on the day of valuation. Financial futures, which are traded on an exchange, are valued at the last quoted sales price determined by the exchange. Investments in open-end investment companies are valued at net asset value. Total return swaps on exchange-listed securities shall be valued at the last quoted sales price or, in the absence of a sale, at the mean between the current bid and ask prices. Exchange listed swaps shall be valued at the last quoted sales price or, in the absence of a sale, at the mean between the current bid and ask prices. Credit default swaps are valued by a pricing agent covering the specific type of swap. Certain credit default swaps (“CDS”) and credit indices are valued independently by Markit; or if no valuation is available from a pricing agent, at the price received from the broker-dealer/counterparty that issued the swap. Investments valued in currencies other than the U.S. dollar are converted to U.S. dollars using exchange rates obtained from pricing services. Short-term debt obligations, excluding U.S. Treasury Bills, having 60 days or less remaining until maturity, at time of purchase, may be valued at amortized cost.
The Funds may hold securities, such as private placements, interests in commodity pools, other non-traded securities or temporarily illiquid securities, for which market quotations are not readily available or are determined to be unreliable. These securities will be valued using the “fair value” procedures approved by the Board. The Board has delegated execution of these procedures to a fair value committee composed of one or more representatives from each of the (i) Trust, (ii) administrator, and (iii) advisor and/or sub-advisor. The committee may also enlist third party consultants such as a valuation specialist at a public accounting firm, valuation consultant or financial officer of a security issuer on an as-needed basis to assist in determining a security-specific fair value. The Board reviews and ratifies the execution of this process and the resultant fair value prices at least quarterly to assure the process produces reliable results.
18
Spectrum Funds
Notes to Financial Statements (Continued)
September 30, 2022
Fair Valuation Process – As noted above, the fair value committee is composed of one or more representatives from each of the (i) Trust, (ii) administrator, and (iii) Adviser and/or Sub-Adviser. The applicable investments are valued collectively via inputs from each of these groups. For example, fair value determinations are required for the following securities: (i) securities for which market quotations are insufficient or not readily available on a particular business day (including securities for which there is a short and temporary lapse in the provision of a price by the regular pricing source), (ii) securities for which, in the judgment of the Adviser or Sub-Adviser, the prices or values available do not represent the fair value of the instrument. Factors which may cause the Adviser or Sub-Adviser to make such a judgment include, but are not limited to, the following: only a bid price or an asked price is available; the spread between bid and asked prices is substantial; the frequency of sales; the thinness of the market; the size of reported trades; and actions of the securities markets, such as the suspension or limitation of trading; (iii) securities determined to be illiquid; (iv) securities with respect to which an event that will affect the value thereof has occurred (a “significant event”) since the closing prices were established on the principal exchange on which they are traded, but prior to a Fund’s calculation of its net asset value. Specifically, interests in commodity pools or managed futures pools are valued on a daily basis by reference to the closing market prices of each futures contract or other asset held by a pool, as adjusted for pool expenses. Restricted or illiquid securities, such as private investments or non-traded securities are valued via inputs from the Adviser or Sub-Adviser based upon the current bid for the security from two or more independent dealers or other parties reasonably familiar with the facts and circumstances of the security (who should take into consideration all relevant factors as may be appropriate under the circumstances). If the Adviser or Sub-Adviser is unable to obtain a current bid from such independent dealers or other independent parties, the fair value committee shall determine the fair value of such security using the following factors: (i) the type of security; (ii) the cost at date of purchase; (iii) the size and nature of a Fund’s holdings; (iv) the discount from market value of unrestricted securities of the same class at the time of purchase and subsequent thereto; (v) information as to any transactions or offers with respect to the security; (vi) the nature and duration of restrictions on disposition of the security and the existence of any registration rights; (vii) how the yield of the security compares to similar securities of companies of similar or equal creditworthiness; (viii) the level of recent trades of similar or comparable securities; (ix) the liquidity characteristics of the security; (x) current market conditions; and (xi) the market value of any securities into which the security is convertible or exchangeable.
Valuation of Investment in Funds – The Funds may invest in open-end or closed-end investment companies (the “Underlying Funds”). The Underlying Funds value securities in their funds for which market quotations are readily available at their market values (generally the last reported sale price) and all other securities and assets at their fair value to the methods established by the board of directors of the Underlying Funds.
Open-end investment companies are valued at their respective net asset values as reported by such investment companies. The shares of many closed-end investment companies, after their initial public offering, frequently trade at a price per share, which is different than the net asset value per share. The difference represents a market premium or market discount of such shares. There can be no assurances that the market discount or market premium on shares of any closed-end investment company purchased by the Funds will not change.
The Funds utilize various methods to measure the fair value of all of their investments on a recurring basis. GAAP establishes a hierarchy that prioritizes inputs to valuation methods. The three levels of input are:
Level 1 – Unadjusted quoted prices in active markets for identical assets and liabilities that the Funds have the ability to access.
Level 2 – Observable inputs other than quoted prices included in Level 1 that are observable for the asset or liability, either directly or indirectly. These inputs may include quoted prices for the identical instrument on an inactive market, prices for similar instruments, interest rates, prepayment speeds, credit risk, yield curves, default rates and similar data.
Level 3 – Unobservable inputs for the asset or liability, to the extent relevant observable inputs are not available, representing the Funds’ own assumptions about the assumptions a market participant would use in valuing the asset or liability, and would be based on the best information available.
The availability of observable inputs can vary from security to security and is affected by a wide variety of factors,
19
Spectrum Funds
Notes to Financial Statements (Continued)
September 30, 2022
including, for example, the type of security, whether the security is new and not yet established in the marketplace, the liquidity of markets, and other characteristics particular to the security. To the extent that valuation is based on models or inputs that are less observable or unobservable in the market, the determination of fair value requires more judgment. Accordingly, the degree of judgment exercised in determining fair value is greatest for instruments categorized in Level 3.
The inputs used to measure fair value may fall into different levels of the fair value hierarchy. In such cases, for disclosure purposes, the level in the fair value hierarchy within which the fair value measurement falls in its entirety, is determined based on the lowest level input that is significant to the fair value measurement in its entirety.
The inputs or methodology used for valuing securities are not necessarily an indication of the risk associated with investing in those securities. The following table summarizes the inputs used as of September 30, 2022 for each Fund’s investments measured at fair value:
| Spectrum Low Volatility Fund | ||||||||||||||||
| Assets * | Level 1 | Level 2 | Level 3 | Total | ||||||||||||
| Short-Term Investments | $ | 299,772,678 | $ | — | $ | — | $ | 299,772,678 | ||||||||
| Total Assets | $ | 299,772,678 | $ | — | $ | — | $ | 299,772,678 | ||||||||
| Spectrum Active Advantage Fund | ||||||||||||||||
| Assets * | Level 1 | Level 2 | Level 3 | Total | ||||||||||||
| U. S. Government & Agencies | $ | — | $ | 7,001,133 | $ | — | $ | 7,001,133 | ||||||||
| Short-Term Investments | 1,516,806 | — | — | 1,516,806 | ||||||||||||
| Total Assets | $ | 1,516,806 | $ | 7,001,133 | $ | — | $ | 8,517,939 | ||||||||
| Spectrum Unconstrained Fund | ||||||||||||||||
| Assets * | Level 1 | Level 2 | Level 3 | Total | ||||||||||||
| Short-term Investments | $ | 6,554,575 | $ | — | $ | — | $ | 6,554,575 | ||||||||
| Total Assets | $ | 6,554,575 | $ | — | $ | — | $ | 6,554,575 | ||||||||
| * | Refer to the Portfolios of Investments for sector classifications. |
The Funds did not hold any Level 3 securities during the current year.
Exchange Traded Funds – The Funds may invest in exchange traded funds (“ETFs”). ETFs are typically a type of fund bought and sold on a securities exchange. An ETF trades like common stock and represents a portfolio of securities that may be designed to track the performance and dividend yield of a particular domestic or foreign market index. The Funds may purchase an ETF to temporarily gain exposure to a portion of the U.S. or a foreign market while awaiting purchase of underlying securities. The risks of owning an ETF generally reflect the risks of owning the underlying securities they are designed to track, although the lack of liquidity on an ETF could result in it being more volatile. Additionally, ETFs have fees and expenses which reduce their value.
Short Sales – A “short sale” is a transaction in which a Fund sells a security it does not own but has borrowed in anticipation that the market price of that security will decline. A Fund is obligated to replace the security borrowed by purchasing it on the open market at a later date. If the price of the security sold short increases between the time of the short sale and the time the Fund replaces the borrowed security, the Fund will incur a loss, potentially unlimited in size. Conversely, if the price declines, the Fund will realize a gain, limited to the price at which the Fund sold the security short.
Futures Contracts – The Funds are subject to interest rate risk, equity risk and forward currency exchange rate risk in the normal course of pursuing their respective investment objectives. The Funds have purchased or sold futures contracts to gain exposure to, or hedge against, changes in the value of equities and interest rates. Initial margin deposits required upon entering into futures contracts are satisfied by the segregation of specific securities or cash as collateral for the account of the broker (the Funds’ agent in acquiring the futures position). During the period the futures contracts are open, changes in the value of the contracts are recognized as unrealized gains or losses by “marking to market” on a daily basis to reflect the market value of the contracts at the end of each day’s trading. Variation margin payments are received or made depending upon whether unrealized gains or losses are incurred. When the contracts are closed, the Funds recognize a realized gain or loss equal to the difference between the proceeds from, or cost of, the closing transaction and the Funds’ basis in the contract. If the Funds
20
Spectrum Funds
Notes to Financial Statements (Continued)
September 30, 2022
were unable to liquidate a futures contract and/or enter into an offsetting closing transaction, the Funds would continue to be subject to market risk with respect to the value of the contracts and continue to be required to maintain the margin deposits on the futures contracts. The Funds segregate cash having a value at least equal to the amount of the current obligation under any open futures contract. Risks may exceed amounts recognized in the Statements of Assets and Liabilities. With futures, there is minimal counterparty credit risk to the Funds since futures are exchange traded and the exchange’s clearinghouse, as counterparty to all exchange traded futures, guarantees the futures against default.
Swap Contracts – Each Fund is subject to equity price, credit risk, and interest rate risk in the normal course of pursuing its investment objective. The Funds have entered into various swap transactions for investment purposes or to manage interest rate, equity, or credit risk. These would typically be two-party contracts entered into primarily to exchange the returns (or differentials in rates of returns) typically earned or realized on particular pre-determined investments or instruments.
Standard equity swap contracts are between two parties that agree to exchange the returns (or differentials in rates of return) earned or realized on particular predetermined investments or instruments. The gross amount to be exchanged is calculated with respect to a “notional amount” (i.e. the return on or increase in value of a particular dollar amount invested in a “basket” of securities representing a particular index or industry sector). Most equity swap agreements entered into by a Fund calculate the obligations of the parties on a “net basis”. Consequently, a Fund’s current obligations under a swap agreement generally will be equal to the net amount to be paid or received under the agreement based on the relative value of the positions held by each party. A Fund’s obligations are accrued daily (offset by any amounts owed to a Fund).
The Funds may enter into swap contracts that provide the opposite return of the particular benchmark or security (“short” the index or security). The operations are similar to that of the swaps disclosed above except that the counterparty pays interest to the Fund on the notional amount outstanding and the dividends on the underlying securities reduce the return of the swap. However, in certain instances, market factors such as the interest rate environment and the demand to borrow the securities underlying the swap agreement can cause a scenario in which a Fund pays the counterparty interest. These amounts are netted with any unrealized appreciation or depreciation to determine the value of the swap. The Funds will typically enter into equity swap agreements in instances where the Adviser or Sub-Adviser believes that it may be more cost effective or practical than buying a security or the securities represented by a particular index.
The Funds may enter into credit default swaps (“CDS”). CDS are typically two-party (bilateral) financial contracts that transfer credit exposure between the two parties. One party to a CDS (referred to as the credit protection “buyer”) receives credit protection or sheds credit risk, whereas the other party to a CDS (referred to as the credit protection “seller”) is selling credit protection or taking on credit risk. The seller typically receives pre-determined periodic payments from the other party. These payments are in consideration for agreeing to make compensating specific payments to the buyer should a negative credit event occur, such as (1) bankruptcy or (2) failure to pay interest or principal on a reference debt instrument, with respect to a specified issuer or one of the reference issuers in a CDS portfolio. In general, CDS may be used by the Funds to obtain credit risk exposure similar to that of a direct investment in high yield bonds. Higher swap spreads generally imply a higher risk of default.
The amounts to be exchanged or “swapped” between parties are calculated with respect to the notional amount. Changes in the value of swap agreements are recognized as unrealized gains or losses in the Statements of Operations by “marking to market” on a daily basis to reflect the value of the swap agreement at the end of each trading day. Payments received or paid at the beginning of the agreement are reflected as such on the Statements of Assets and Liabilities and may be referred to as upfront payments. A liquidation payment received or made at the termination of the swap agreement is recorded as a realized gain or loss on the Statements of Operations. The maximum pay-outs for these contracts are limited to the notional amount of each swap. CDS may involve greater risks than if the Funds had invested in the referenced obligation directly and are subject to general market risk, liquidity risk, counterparty risk and credit risk.
By contrast, certain swap transactions are subject to mandatory central clearing. These swaps are executed
21
Spectrum Funds
Notes to Financial Statements (Continued)
September 30, 2022
through a derivatives clearing member (“DCM”), acting in an agency capacity, and submitted to a central counterparty (“CCP”) (“centrally cleared swaps”), in which case all payments are settled with the CCP through the DCM. Swaps are marked-to-market daily using pricing vendor quotations, counterparty or clearinghouse prices or model prices, and the change in value, if any, is recorded as an unrealized gain or loss. Upon entering into a swap contract, a Fund is required to satisfy an initial margin requirement by delivering cash or securities to the counterparty (or in some cases, segregated in a triparty account on behalf of the counterparty), which can be adjusted by any mark-to-market gains or losses pursuant to bilateral or centrally cleared arrangements. For centrally cleared swaps the daily change in valuation, if any, is recorded as a receivable or payable for variation margin.
The Funds collateralize swap agreements with cash and certain securities as indicated on the Portfolios of Investments and Statements of Assets and Liabilities of the Funds, respectively. Such collateral is held for the benefit of the counterparty in a segregated account at the Custodian to protect the counterparty against non-payment by the Funds. The Funds do not net collateral. In the event of a default by the counterparty, the Funds will seek return of this collateral and may incur certain costs exercising their rights with respect to the collateral. Amounts expected to be owed by the Funds are regularly collateralized either directly with the Funds or in a segregated account at the Custodian.
A Fund bears the risk of loss of the amount expected to be received under a swap agreement in the event of the default or bankruptcy of a swap agreement counterparty to the extent that posted collateral, if any, is insufficient. The Funds will enter into swap agreements only with large, well-capitalized and established financial institutions. The creditworthiness of each of the firms that is counterparty to a swap agreement is monitored by the Adviser. The financial statements of these counterparties may be available by accessing the SEC’s website, at www.sec.gov.
International Swaps and Derivatives Association, Inc. Master Agreements (“ISDA Master Agreements”) govern OTC financial derivative transactions entered into by the Funds and those counterparties. The ISDA Master Agreements maintain provisions for general obligations, representations, agreements, collateral and events of default or termination. Events of termination include conditions that may entitle counterparties to elect to terminate early and cause settlement of all outstanding transactions under the applicable ISDA Master Agreements. Any election to early terminate could be material to the financial statements.
During the normal course of business, the Funds purchase and sell various financial instruments, which may result in market, credit and liquidity risks, the amount of which is not apparent from the financial statements.
Security Transactions and Related Income – Security transactions are accounted for on trade date. Interest income is recognized on an accrual basis. Discounts are accreted and premiums are amortized on securities purchased over the lives of the respective securities using the effective yield method. Dividend income is recorded on the ex-dividend date. Realized gains or losses from sales of securities are determined by comparing the identified cost of the security lot sold with the net sales proceeds. Foreign withholding tax is recorded as incurred or known, in accordance with the Funds’ understanding of the applicable country’s tax rules and rates.
Dividends and Distributions to Shareholders – Dividends from net investment income, if any, are declared and paid quarterly. Distributable net realized capital gains, if any, are declared and distributed annually in December. Dividends from net investment income and distributions from net realized gains are recorded on ex-dividend date and are determined in accordance with federal income tax regulations, which may differ from GAAP. These “book/tax” differences are considered either temporary (i.e., deferred losses, capital loss carryforwards) or permanent in nature. To the extent these differences are permanent in nature, such amounts are reclassified within the composition of net assets based on their federal tax-basis treatment; temporary differences do not require reclassification. These reclassifications have no effect on net assets, results from operations or net asset value per share of the Funds.
Federal Income Tax – It is each Fund’s policy to continue to qualify as a regulated investment company by complying with the provisions of Subchapter M of the Internal Revenue Code that are applicable to regulated investment companies and to distribute substantially all of its taxable income and net realized gains to shareholders. Therefore, no federal income tax provision is required.
22
Spectrum Funds
Notes to Financial Statements (Continued)
September 30, 2022
The Funds recognize the tax benefits of uncertain tax positions only where the position is “more likely than not” to be sustained assuming examination by tax authorities. Management has analyzed each Fund’s tax positions and has concluded that no liability for unrecognized tax benefits should be recorded related to uncertain tax positions expected to be taken on returns filed for the open tax years 2019 – 2021 or expected to be taken in the Funds’ 2022 tax returns. The Funds identify their major tax jurisdictions as U.S. Federal and foreign jurisdictions where the Funds make significant investments; however, the Funds are not aware of any tax positions for which it is reasonably possible that the total amounts of unrecognized tax benefits will change materially in the next twelve months.
The Funds recognize interest and penalties, if any, related to unrecognized tax benefits as income tax expense in the Statements of Operations. During the period, the Funds did not incur any interest or penalties.
Expenses – Expenses of the Trust that are directly identifiable to a specific Fund are charged to that Fund. Expenses which are not readily identifiable to a specific fund are allocated in such a manner as deemed equitable, taking into consideration the nature and type of expense and the relative sizes of the funds in the Trust.
Indemnification – The Trust indemnifies its officers and trustees for certain liabilities that may arise from the performance of their duties to the Trust. Additionally, in the normal course of business, the Funds enter into contracts that contain a variety of representations and warranties and which provide general indemnities. Each Fund’s maximum exposure under these arrangements is unknown, as this would involve future claims that may be made against the Funds that have not yet occurred. However, based on experience, the risk of loss due to these warranties and indemnities appears to be remote.
| 3. | INVESTMENT TRANSACTIONS |
For the year ended September 30, 2022, cost of purchases and proceeds from sales of portfolio securities, other than short-term investments and derivatives amounted to $302,546,106 and $522,893,356 for the Low Volatility Fund, $27,952,185 and $33,322,398 for the Active Advantage Fund and $4,995,577 and $7,055,856 for the Unconstrained Fund.
| 4. | OFFSETTING OF FINANCIAL AND DERIVATIVE ASSETS AND LIABILITIES |
The Funds’ policy is to recognize a gross asset or liability equal to the unrealized gain/(loss) for futures and swap contracts. During the year ended September 30, 2022 the Funds were subject to a master netting arrangement for the swap contracts.
Impact of Derivatives on the Statements of Operations
The following is a summary of the location of derivative investments on the Funds’ Statements of Operations for the year ended September 30, 2022:
| Derivative Investment Type | Location of Gain/Loss on Derivative | |
| Swaps/Futures | Net realized loss from Swaps | |
| Net realized loss from Futures | ||
| Net change in unrealized appreciation (depreciation) on Swaps | ||
| Net change in unrealized appreciation on Futures | ||
23
Spectrum Funds
Notes to Financial Statements (Continued)
September 30, 2022
The following is a summary of the Funds’ realized gain/(loss) on derivative investments recognized in the Statements of Operations categorized by primary risk exposure for the year ended September 30, 2022:
| Spectrum Low Volatility Fund | ||||||||||||||||
| Realized loss on derivatives recognized in the Statements of Operations | ||||||||||||||||
| Total for the Year Ended | ||||||||||||||||
| Derivative Investment Type | Interest Rate Risk | Equity Risk | Credit Risk | September 30, 2022 | ||||||||||||
| Swaps | $ | (5,616,894 | ) | $ | — | $ | (4,652,353 | ) | $ | (10,269,247 | ) | |||||
| Futures | — | (121,039 | ) | — | (121,039 | ) | ||||||||||
| Total | $ | (5,616,894 | ) | $ | (121,039 | ) | $ | (4,652,353 | ) | $ | (10,390,286 | ) | ||||
| Changes in unrealized depreciation on derivatives recognized in the Statements of Operations | ||||||||||||||||
| Total for the Year Ended | ||||||||||||||||
| Derivative Investment Type | Credit Risk | September 30, 2022 | ||||||||||||||
| Swaps | $ | (31,555 | ) | $ | (31,555 | ) | ||||||||||
| Total | $ | (31,555 | ) | $ | (31,555 | ) | ||||||||||
| Spectrum Active Advantage Fund | ||||||||||||||||
| Realized loss on derivatives recognized in the Statements of Operations | ||||||||||||||||
| Total for the Year Ended | ||||||||||||||||
| Derivative Investment Type | Equity Risk | September 30, 2022 | ||||||||||||||
| Swaps | $ | (2,934,386 | ) | $ | (2,934,386 | ) | ||||||||||
| Futures | (2,515,080 | ) | (2,515,080 | ) | ||||||||||||
| Total | $ | (5,449,466 | ) | $ | (5,449,466 | ) | ||||||||||
| Changes in unrealized appreciation/(depreciation) on derivatives recognized in the Statements of Operations | ||||||||||||||||
| Total for the Year Ended | ||||||||||||||||
| Derivative Investment Type | Equity Risk | September 30, 2022 | ||||||||||||||
| Swaps | $ | 265,894 | $ | 265,894 | ||||||||||||
| Futures | 332,890 | 332,890 | ||||||||||||||
| Total | $ | 598,784 | $ | 598,784 | ||||||||||||
| Spectrum Unconstrained Fund | ||||||||||||||||
| Realized loss on derivatives recognized in the Statements of Operations | ||||||||||||||||
| Total for the Year Ended | ||||||||||||||||
| Derivative Investment Type | Credit Risk | September 30, 2022 | ||||||||||||||
| Swaps | $ | (499,335 | ) | $ | (499,335 | ) | ||||||||||
| Total | $ | (499,335 | ) | $ | (499,335 | ) | ||||||||||
The notional value of the derivative instruments outstanding as of September 30, 2022 as disclosed in the Portfolios of Investments and the amounts realized and changes in unrealized gains and losses on derivative instruments during the period as disclosed above and within the Statements of Operations serve as indicators of the volume of derivative activity for the Funds.
Market Risk: Market risk is the risk that changes in interest rates, foreign exchange rates or equity prices will affect the positions held by the Funds. The Funds are exposed to market risk on financial instruments that are valued at market prices as disclosed in the Portfolios of Investments. The prices of derivative instruments, including swaps and futures prices, can be highly volatile. Price movements of derivative contracts in which the Funds’ assets may be invested are influenced by, among other things, interest rates, changing supply and demand relationships, trade, fiscal, monetary and exchange control programs and policies of governments, and national and international political and economic events and policies. The Funds are exposed to market risk on derivative contracts in that the Funds may not be able to readily dispose of its holdings when it chooses and also that the price obtained on disposal is below that at which the investment is included in Funds’ financial statements. All financial instruments are recognized at fair value, and all changes in market conditions directly affect net income. A Fund’s investments in derivative instruments are exposed to market risk and are disclosed in the portfolio of investments.
Unexpected local, regional or global events, such as war; acts of terrorism; financial, political or social disruptions; natural, environmental or man-made disasters; the spread of infectious illnesses or other public health issues; and recessions and depressions could have a significant impact on the Funds and their investments and may impair market liquidity. Such events can cause investor fear, which can adversely affect the economies of nations,
24
Spectrum Funds
Notes to Financial Statements (Continued)
September 30, 2022
regions and the market in general, in ways that cannot necessarily be foreseen. An outbreak of infectious respiratory illness known as COVID-19, which is caused by a novel coronavirus (SARS-CoV-2), was first detected in China in December 2019 and subsequently spread globally. This coronavirus has resulted in, among other things, travel restrictions, closed international borders, enhanced health screenings at ports of entry and elsewhere, disruption of and delays in healthcare service preparation and delivery, prolonged quarantines, significant disruptions to business operations, market closures, cancellations and restrictions, supply chain disruptions, lower consumer demand, and significant volatility and declines in global financial markets, as well as general concern and uncertainty. The impact of COVID-19 has adversely affected, and other infectious illness outbreaks that may arise in the future could adversely affect, the economies of many nations and the entire global economy, individual issuers and capital markets in ways that cannot necessarily be foreseen. Public health crises caused by the COVID-19 outbreak may exacerbate other pre-existing political, social and economic risks in certain countries or globally. The duration of the COVID-19 outbreak and its effects cannot be determined with certainty.
Counterparty Risk: The Funds may invest in derivative instruments (the “Product”) issued for the Funds including by Credit Suisse Securities (Europe) Limited, Credit Suisse Securities (USA) LLC (“Credit Suisse”), Barclays Capital, Inc. (“Barclays”) and Canadian Imperial Bank of Commerce (“CIBC”) (collectively, “Counterparties”). If Counterparties become insolvent, each may not be able to make any payments under the Product and a Fund may lose their capital invested in the Product. A decline in Counterparties’ financial standing is likely to reduce the market value of the Product and therefore the price a Fund may receive for the Product if sold it in the market.
Liquidity Risk: Liquidity risk is the risk that a Fund will encounter difficulty in raising funds to meet commitments. Liquidity risk may result in an inability to sell investments quickly at close to fair value. The Funds’ financial instruments include investments in securities which are not traded on organized public exchanges, and which generally may be illiquid. As a result, the Funds may not be able to quickly liquidate its investments in these instruments at an amount close to its fair value in order to meet its liquidity requirements. The Funds do not anticipate any material losses as a result of liquidity risk.
| 5. | INVESTMENT ADVISORY AGREEMENT AND TRANSACTIONS WITH RELATED PARTIES |
The business activities of the Funds are overseen by the Board, which is responsible for the overall management of the Funds. Advisors Preferred, LLC, serves as investment adviser to the Funds. The Adviser has engaged Spectrum Financial, Inc. to serve as the sub-adviser to the Funds. These expenses are the responsibility of the Adviser.
Pursuant to an advisory agreement with the Funds, the Adviser, under the oversight of the Board, directs the daily operations of the Funds and supervises the performance of administrative and professional services provided by others. As compensation for its services and the related expenses borne by the Adviser, the Funds pay the Adviser computed and accrued daily and paid monthly at an annual rate of 2.15% of the average daily net assets for both Spectrum Low Volatility Fund and Spectrum Unconstrained Fund and 1.50% of the average daily net assets for the Spectrum Active Advantage Fund. The Adviser, not the Fund, pays the Sub-Adviser. Pursuant to the advisory agreement, the Advisor earned $6,934,530, $222,753, and $197,197 for Spectrum Low Volatility Fund, Spectrum Active Advantage Fund and Spectrum Unconstrained Fund, respectively, in advisory fees for the year ended September 30, 2022.
Pursuant to a liquidity program administrator agreement with the Funds, the Adviser, provides a liquidity program administrator who, directs the operations of the Funds’ liquidity risk management program. As compensation for its services and the related expenses borne by the Adviser, the Funds pay the Adviser out of pocket expenses and an annual fee of $9,000 per Fund. The liquidity program administrator agreement became effective June 1, 2021. Pursuant to the liquidity program administrator agreement, the Adviser earned (net of voluntary waivers) $9,000, $0 and $0 for Spectrum Low Volatility Fund, Spectrum Active Advantage Fund and Spectrum Unconstrained Fund, respectively, in fees for the year ended September 30, 2022.
25
Spectrum Funds
Notes to Financial Statements (Continued)
September 30, 2022
Ultimus Fund Solutions, LLC (“UFS”), provides administration, fund accounting, and transfer agent services to the Trust. Pursuant to a separate servicing agreement with UFS, the Funds pay UFS customary fees for providing administration, fund accounting and transfer agency services to the Funds. Under the terms of the Funds’ agreement with UFS, UFS pays for certain operating expenses of the Funds. Certain officers of the Trust are also officers of UFS and are not paid any fees directly by the Funds for serving in such capacities.
In addition, certain affiliates of UFS provide ancillary services to the Funds as follows:
Blu Giant, LLC (“Blu Giant”) Blu Giant, an affiliate of UFS, provides EDGAR conversion and filing services as well as print management services for the Funds on an ad-hoc basis. These expenses are the responsibility of UFS.
The Funds pay Ceros Financial Services Inc. (the “Distributor”) to provide compensation for ongoing servicing related activities or services and/or maintenance of the Investor Class accounts, not otherwise required to be provided by the Adviser. For the years ended September 30, 2022, the Funds paid $96,734, $4,455 and $2,751 for Spectrum Low Volatility Fund, Spectrum Active Advantage Fund and Spectrum Unconstrained Fund, respectively, which was paid out to brokers and dealers.
During the year ended September 30, 2022, Ceros Financial Services, Inc. (“Ceros”), a registered broker/dealer and an affiliate of the Adviser, executed trades on behalf of the Funds. Spectrum Low Volatility Fund, Spectrum Active Advantage Fund and Spectrum Unconstrained Fund paid trade commissions of $80, $5,142, and $175 to Ceros, respectively. Any 12b-1 fees received by Ceros related to a Fund’s investment in another Fund are returned to the respective Fund.
Each Trustee who is not an “interested person” of the Trust or Advisor is compensated at a rate of $50,000 per year plus at least $2,500 per meeting for certain special meetings as well as for reimbursement for any reasonable expenses incurred attending the meetings, paid quarterly. The Advisor pays these fees. The “interested persons” who serve as Trustees of the Trust receive no compensation for their services as Trustees. None of the executive officers receive compensation from the Trust. Interested trustees of the Trust are also officers or employees of the Advisor and its affiliates.
| 6. | AGGREGATE UNREALIZED APPRECIATION AND DEPRECIATION – TAX BASIS |
The identified cost of investments in securities owned by each Fund for federal income tax purposes excluding futures and swaps, and its respective gross unrealized appreciation and depreciation at September 30, 2022, were as follows:
| Net Unrealized | ||||||||||||||||
| Gross Unrealized | Gross Unrealized | Appreciation | ||||||||||||||
| Tax Cost | Appreciation | (Depreciation) | (Depreciation) | |||||||||||||
| Spectrum Low Volatility Fund | $ | 299,772,678 | $ | — | $ | — | $ | — | ||||||||
| Spectrum Active Advantage Fund | 8,517,879 | 60 | — | 60 | ||||||||||||
| Spectrum Unconstrained Fund | 6,554,575 | — | — | — | ||||||||||||
26
Spectrum Funds
Notes to Financial Statements (Continued)
September 30, 2022
| 7. | DISTRIBUTION TO SHAREHOLDERS AND TAX COMPONENTS OF CAPITAL |
| For the year ended September 30, 2022: | ||||||||||||||||||||
| Ordinary | Long-Term | Return | Tax-exempt | |||||||||||||||||
| Portfolio | Income | Capital Gains | of Capital | Income | Total | |||||||||||||||
| Spectrum Low Volatility Fund | $ | 16,479,737 | $ | 925,881 | $ | — | $ | — | $ | 17,405,618 | ||||||||||
| Spectrum Active Advantage Fund | 3,218,095 | 1,987,681 | — | — | 5,205,776 | |||||||||||||||
| Spectrum Unconstrained Fund | 638,185 | — | 138,132 | — | 776,317 | |||||||||||||||
| For the period ended September 30, 2021: | ||||||||||||||||||||
| Ordinary | Long-Term | Return | Tax-exempt | |||||||||||||||||
| Portfolio | Income | Capital Gains | of Capital | Income | Total | |||||||||||||||
| Spectrum Low Volatility Fund | $ | 15,323,448 | $ | — | $ | — | $ | 1,240,719 | $ | 16,564,167 | ||||||||||
| Spectrum Active Advantage Fund | 950,251 | 1,622,115 | — | — | 2,572,366 | |||||||||||||||
| Spectrum Unconstrained Fund | 106,366 | — | — | — | 106,366 | |||||||||||||||
As of September 30, 2022, the components of distributable earnings/(accumulated deficit) on a tax basis were as follows:
| Undistributed | Undistributed | Post October Loss | Capital Loss | Other | Unrealized | Total | ||||||||||||||||||||||
| Ordinary | Long-Term | and | Carry | Book/Tax | Appreciation/ | Distributable Earning/ | ||||||||||||||||||||||
| Portfolio | Income | Capital Gains | Late Year Loss | Forwards | Differences | (Depreciation) | (Accumulated Deficit) | |||||||||||||||||||||
| Spectrum Low Volatility Fund | $ | — | $ | — | $ | (4,576,643 | ) | $ | — | $ | — | $ | — | $ | (4,576,643 | ) | ||||||||||||
| Spectrum Active Advantage Fund | — | — | (5,888,504 | ) | — | — | 60 | (5,888,444 | ) | |||||||||||||||||||
| Spectrum Unconstrained Fund | — | — | (957,067 | ) | — | — | — | (957,067 | ) | |||||||||||||||||||
The difference between book basis and tax basis accumulated net realized gain/(loss) and unrealized appreciation/(depreciation) from investments is primarily attributable to the tax deferral of losses on wash sales.
Late year losses incurred after December 31 within the fiscal year are deemed to arise on the first business day of the following fiscal year for tax purposes. The Funds incurred and elected to defer such late year losses as follows:
| Late Year | ||||
| Portfolio | Losses | |||
| Spectrum Low Volatility Fund | $ | 2,185,779 | ||
| Spectrum Active Advantage Fund | 440,656 | |||
| Spectrum Unconstrained Fund | 140,367 | |||
Capital losses incurred after October 31 within the fiscal year are deemed to arise on the first business day of the following fiscal year for tax purposes. The Funds incurred and elected to defer such capital losses as follows:
| Post October | ||||
| Portfolio | Losses | |||
| Spectrum Low Volatility Fund | $ | 2,390,864 | ||
| Spectrum Active Advantage Fund | 5,447,848 | |||
| Spectrum Unconstrained Fund | 816,700 | |||
At September 30, 2022, the Spectrum Unconstrained Fund utilized $127,711 of capital loss carryforwards.
27
Spectrum Funds
Notes to Financial Statements (Continued)
September 30, 2022
Permanent book and tax differences, primarily attributable to prior year tax return updates, resulted in reclassification for the period ended September 30, 2022, as follows:
| Paid | ||||||||
| In | Accumulated | |||||||
| Portfolio | Capital | Earnings (Losses) | ||||||
| Spectrum Low Volatility Fund | $ | (102,697 | ) | $ | 102,697 | |||
| Spectrum Active Advantage Fund | — | — | ||||||
| Spectrum Unconstrained Fund | — | — | ||||||
| 8. | CONTROL OWNERSHIP |
The beneficial ownership, either directly or indirectly, of more than 25% of the voting securities of a fund creates presumption of control of the fund pursuant to Section 2(a)(9) of the 1940 Act. As of September 30, 2022, National Financial Services LLC held approximately 46% of the Spectrum Low Volatility Fund, National Financial Services LLC held approximately 95% of the Spectrum Active Advantage Fund and National Financial Services LLC held approximately 100% of the Spectrum Unconstrained Fund.
| 9. | UNDERLYING INVESTMENT IN OTHER INVESTMENT COMPANIES |
The Funds currently invests a portion of their assets in United States Cash Management Bill (“Treasury Bill”), Fidelity Government Portfolio (“Fidelity”) and First American Government Obligations Fund (“First American”). The Funds may redeem their investment at any time if the Adviser or Sub-Adviser determines that it is in the best interest of the Funds and their shareholders to do so.
The performance of the Funds will be directly affected by the performance of Fidelity and First American. The financial statements of Fidelity and First American, including the portfolio of investments, can be found at the Securities and Exchange Commission’s website www.sec.gov and should be read in conjunction with the Funds’ financial statements. As of September 30, 2022, the percentage of the Low Volatility Fund’s net assets invested in Fidelity was 98.7%, Active Advantage Fund’s net assets invested in Treasury Bill was 81.6% and Unconstrained Fund’s net assets invested in Fidelity and First American was 45.4% and 45.4%, respectively.
| 10. | RECENT REGULATORY UPDATES |
In October 2020, the Securities and Exchange Commission (the “SEC”) adopted new regulations governing the use of derivatives by registered investment companies (“Rule 18f-4”). Rule 18f-4 imposes limits on the amount of derivatives a Fund can enter into, eliminates the asset segregation framework currently used by funds to comply with Section 18 of the 1940 Act, treats derivatives as senior securities and requires funds whose use of derivatives is more than a limited specified exposure amount to establish and maintain a comprehensive derivatives risk management program and appoint a derivatives risk manager.
| 11. | SUBSEQUENT EVENTS |
Subsequent events after the date of the Statements of Assets and Liabilities have been evaluated through the date the financial statements were issued. Management has determined that no events or transactions occurred requiring adjustment or disclosure in the financial statements.
28

REPORT OF INDEPENDENT REGISTERED PUBLIC ACCOUNTING FIRM
To the Shareholders of Spectrum Low Volatility Fund, Spectrum Active Advantage Fund (formerly Spectrum Advisors Preferred Fund), and Spectrum Unconstrained Fund and Board of Trustees of Advisors Preferred Trust
Opinion on the Financial Statements
We have audited the accompanying statements of assets and liabilities, including the portfolios of investments, of Spectrum Low Volatility Fund, Spectrum Active Advantage Fund (formerly Spectrum Advisors Preferred Fund), and Spectrum Unconstrained Fund, each a series of Advisors Preferred Trust, (the “Funds”) as of September 30, 2022, the related statements of operations and changes in net assets, the related notes, and the financial highlights for each of the periods indicated below (collectively referred to as the “financial statements”). In our opinion, the financial statements present fairly, in all material respects, the financial position of each of the Funds as of September 30, 2022, the results of their operations, the changes in net assets, and the financial highlights for each of the periods indicated below in conformity with accounting principles generally accepted in the United States of America.
| Fund Name | Statements of Operations | Statements of Changes in Net Assets | Financial Highlights |
| Spectrum Low Volatility Fund Spectrum Active Advantage Fund | For the year ended September 30, 2022 | For the years ended September 30, 2022 and 2021 | For the years ended September 30, 2022 2021, 2020, 2019, and 2018 |
| Spectrum Unconstrained Fund | For the year ended September 30, 2022 | For the year ended September 30, 2022 and the period from April 16, 2021 (commencement of operations) through September 30, 2021 | |
Basis for Opinion
These financial statements are the responsibility of the Funds’ management. Our responsibility is to express an opinion on the Funds’ financial statements based on our audits. We are a public accounting firm registered with the Public Company Accounting Oversight Board (United States) (“PCAOB”) and are required to be independent with respect to the Funds in accordance with the U.S. federal securities laws and the applicable rules and regulations of the Securities and Exchange Commission and the PCAOB.
We conducted our audits in accordance with the standards of the PCAOB. Those standards require that we plan and perform the audit to obtain reasonable assurance about whether the financial statements are free of material misstatement whether due to error or fraud.
COHEN & COMPANY, LTD.
800.229.1099 | 866.818.4538 fax | cohencpa.com
Registered with the Public Company Accounting Oversight Board
29
Our audits included performing procedures to assess the risks of material misstatement of the financial statements, whether due to error or fraud, and performing procedures that respond to those risks. Such procedures included examining, on a test basis, evidence regarding the amounts and disclosures in the financial statements. Our procedures included confirmation of securities owned as of September 30, 2022, by correspondence with the custodian and brokers. Our audits also included evaluating the accounting principles used and significant estimates made by management, as well as evaluating the overall presentation of the financial statements. We believe that our audits provide a reasonable basis for our opinion.
We have served as the auditor of one or more investment companies advised by Advisors Preferred, LLC since 2012.

COHEN & COMPANY, LTD.
Chicago, Illinois
November 23, 2022
30
Spectrum Funds
Expense Example (Unaudited)
September 30, 2022
As a shareholder of Spectrum Funds, you incur ongoing costs, including management fees; service fees; and other Fund expenses. This example is intended to help you understand your ongoing costs (in dollars) of investing in the Funds and to compare these costs with the ongoing costs of investing in other mutual funds.
The example is based on an investment of $1,000 invested at the beginning of the period and held for the entire period from April 1, 2022 through September 30, 2022.
Table 1. Actual Expenses
The “Actual Expenses” line in the table below provides information about actual account values and actual expenses. You may use the information below; together with the amount you invested, to estimate the expenses that you paid over the period. Simply divide your account value by $1,000 (for example, an $8,600 account value divided by $1,000 = 8.6), then multiply the result by the number in the table under the heading entitled “Expenses Paid During Period” to estimate the expenses you paid on your account during this period.
Table 2. Hypothetical Example for Comparison Purposes
The “Hypothetical” line in the table below provides information about hypothetical account values and hypothetical expenses based on the Funds’ actual expense ratio and an assumed rate of return of 5% per year before expenses, which is not the Funds’ actual return. The hypothetical account values and expenses may not be used to estimate the actual ending account balances or expenses you paid for the period. You may use this information to compare this 5% hypothetical example with the 5% hypothetical examples that appear in the shareholder reports of other funds.
Please note that the expenses shown in the table are meant to highlight your ongoing costs. Therefore, the table is useful in comparing ongoing costs only, and will not help you determine the relative total costs of owning different funds. In addition, if these transactional costs were included, your costs would have been higher.
| Annualized | Beginning | Ending | Expenses Paid During | |
| Actual | Expense | Account | Account | Period * |
| Expenses | Ratio | 4/1/2022 | 9/30/2022 | 4/1/2022-9/30/22 |
| Spectrum Low Volatility Fund | 2.34% | $1,000.00 | $966.70 | $11.54 |
| Spectrum Active Advantage Fund | 1.70% | $1,000.00 | $783.70 | $7.60 |
| Spectrum Unconstrained Fund | 2.46% | $1,000.00 | $997.20 | $12.32 |
| Annualized | Beginning | Ending | Expenses Paid During | |
| Hypothetical | Expense | Account | Account | Period * |
| (5% return before expenses) | Ratio | 4/1/2022 | 9/30/2022 | 4/1/2022-9/30/22 |
| Spectrum Low Volatility Fund | 2.34% | $1,000.00 | $1,013.34 | $11.81 |
| Spectrum Active Advantage Fund | 1.70% | $1,000.00 | $1,016.55 | $8.59 |
| Spectrum Unconstrained Fund | 2.46% | $1,000.00 | $1,012.73 | $12.41 |
| * | Expenses are equal to the average account value over the period, multiplied by the Fund’s annualized expense ratio, multiplied by the number of days in the period (183) divided by the numbers of days in the fiscal year (365). |
31
Liquidity Risk Management Program (Unaudited)
The Funds have adopted and implemented a written liquidity risk management program as required by Rule 22e-4 (the “Liquidity Rule”) under the Investment Company Act. The program is reasonably designed to assess and manage the Funds’ liquidity risk, taking into consideration, among other factors, the Funds’ investment strategies and the liquidity of portfolio investments during normal and reasonably foreseeable stressed conditions; short and long-term cash flow projections; and cash holdings and access to other funding sources.
During the year ended September 30, 2022, the Trust’s Liquidity Program Administrator (“LPA”) and the Board reviewed the Funds’ investments and they determined that, generally, the Funds held adequate levels of cash and highly liquid investments to meet shareholder redemption activities in accordance with applicable requirements. Accordingly, the Board and the LPA concluded that (i) the Funds’ liquidity risk management program is reasonably designed to prevent violations of the Liquidity Rule and (ii) the Funds’ liquidity risk management program has been effectively implemented.
32
Spectrum Funds
SUPPLEMENTAL INFORMATION (Unaudited)
September 30, 2022
Independent Trustees
The following table provides information regarding each Trustee who is not an “interested person” of the Trust, as defined in the 1940 Act.
| Name, Address 1 and Year of Birth | Position(s) Held with the Trust | Term of Office/Length of Time Served | Principal Occupation(s) During Past 5 Years | Number of Portfolios in Fund Complex Overseen by Trustee 2 | Other Directorships Held by Trustee |
| Charles R. Ranson Born: 1947 | Trustee | Indefinite, since November 2012 | Principal, Ranson & Associates (business consultancy) (since 2003); | 21 | Northern Lights Fund Trust IV (30 series) (since July 2015) |
| Felix Rivera Born: 1963 | Trustee | Indefinite, since November 2012 | Managing Partner, Independent Channel Advisors, LLC (Consultancy Practice), (since January 2011) | 21 | Centerstone Investors Trust (2 series) (March 2016-2021); BlueArc Multi- Strategy Fund (Nov. 2014 to Jan. 2018 |
| David Feldman Born: 1963 | Trustee | Indefinite, Since September 2017 | Independent Consultant (since January 2015); Head of Intermediary Sales, Baron Capital Inc., (February 2010 to December 2014) | 21 | None |
| 1 | Unless otherwise specified, the mailing address of each Trustee is c/o Advisors Preferred Trust, 1445 Research Blvd., Suite 530, Rockville, MD 20850. |
| 2 | The “Fund Complex” consists of the series of the Trust. |
AP 9/30/21 v1
33
Spectrum Funds
SUPPLEMENTAL INFORMATION (Unaudited) (Continued)
September 30, 2022
Interested Trustees and Officers
The following table provides information regarding each Trustee who is an “interested person” of the Trust, as defined in the 1940 Act, and each officer of the Trust.
| Name, Address 1 And Year of Birth | Position(s) Held with the Fund | Term of Office/ Length of Time Served | Principal Occupation(s) During Past Five Years | Number of Portfolios in Fund Complex Overseen by Trustee 2 | Other Directorships Held by Trustee During Last Five Years |
| Catherine Ayers-Rigsby(3) Born: 1948 | Trustee, Chairman, President | Indefinite; since November 2012 | CEO, Advisors Preferred, LLC (since June 2011); President, Ceros Financial Services, Inc., (broker/dealer) (since August 2009); President AtCap Partners, LLC (investment adviser) (since July 2011) | 21 | None |
| Brian S. Humphrey(4) Born: 1972 | Trustee | Indefinite; since November 2012 | Managing Director, Ceros Financial Services, Inc., (since January 2011) | 21 | None |
| Christine Casares Born: 1975 | Treasurer | Indefinite; since May 2019 | Vice President, Tax Administration, Ultimus Fund Solutions, LLC (since February 2016); Assistant Vice President, Tax Administration (February 2012 January 2016) | N/A | N/A |
| Angela Holland Born: 1970 | Chief Compliance Officer | Indefinite; since July 1, 2020 | Chief Compliance Officer, Advisors Preferred, LLC (since March 2022); Chief Compliance Officer, Ceros Financial Services, Inc. (since January 2016); Chief Compliance Officer, AtCap Partners, LLC (investment Advisers) (Since March 2022); Sales Supervisor/AML Compliance Officer, Ceros Financial Services, Inc. (April 2012 – January 2016); Compliance Manager, Advisors Preferred, LLC (April 2012 March 2022)); Compliance Manager, AtCap (April 2012-March 2022) | N/A | N/A |
| Jeff Meacham Born: 1976 | Assistant Treasurer | Indefinite; Since November 2021 | Senior Trader, Ceros Financial Services, Inc. | N/A | N/A |
| Daniel Gibson Born: 1984 | Assistant Treasurer Secretary | Indefinite; Since November 2021 Indefinite; Since October 2022 | Trader/Dealers & Commissions Specialist, Ceros Financial Services, Inc. | N/A | N/A |
| 1 | Unless otherwise specified, the address of each Trustee and officer is Advisors Preferred Trust, 1445 Research Blvd., Suite 530, Rockville, MD 20850. |
| 2 | The “Fund Complex” consists of the series of the Trust. |
| 3 | Ms. Ayers-Rigsby is an interested person Trustee because she is an officer of the Trust, an officer of the Trust’s investment adviser, and an officer of the Trust’s principal underwriter. |
| 4 | Mr. Humphrey is an interested person Trustee because he is an officer of the Trust’s principal underwriter. |
The Funds’ Statement of Additional Information includes additional information about the Trustees and is available free of charge by calling toll- free 1-866-862-9686.
AP 9/30/21 v1
34
Approval of Renewal of the Investment Advisory and Sub-Advisory Agreements for the Spectrum Low Volatility Fund, Spectrum Active Advantage Fund, and Spectrum Unconstrained Fund
At a video conference meeting held on May 11, 2022 (the “Meeting”), held in accordance with relief granted by the U.S. Securities and Exchange Commission (the “SEC”) to ease certain governance obligations required under the Investment Company Act of 1940, as amended (the “1940 Act”) in light of travel concerns related to the COVID-19 pandemic (the “SEC Relief Order”) the Board of Trustees (the “Board”), of Advisors Preferred Trust (the “Trust”), including a majority of Trustees who are not “interested persons” (the “Independent Trustees”), as such term is defined under Section 2(a)(19) of the 1940 Act, considered the renewal of the investment advisory agreement (the “Advisory Agreement’) between Advisors Preferred, LLC (the “Adviser”) and the Trust, on behalf of Spectrum Low Volatility Fund, Spectrum Active Advantage Fund, and Spectrum Unconstrained Fund (together the “Spectrum Funds”); and the renewal of each sub-advisory agreement (the “Sub-Advisory Agreement”) between the Adviser and Spectrum Financial, Inc. (“Spectrum Financial”) (the “Sub-Adviser”).
In connection with the Board’s consideration and approval of the renewal of the Advisory Agreements and Sub-Advisory Agreements (together the “Advisory Agreements”), the Adviser and Sub-Adviser provided the Board in advance of the Meeting with written materials, which included information regarding: (a) a description of the investment management personnel of the Adviser and Sub-Adviser; (b) the Adviser’s and Sub-Adviser’s operations and the Adviser’s financial condition; (c) the Adviser’s proposed brokerage practices (including any soft dollar arrangements); (d) the level of the advisory fees to be charged compared with the fees charged to comparable mutual funds or accounts; (e) the Spectrum Funds’ anticipated level of profitability from the Adviser’s and Sub-Adviser’s fund-related operations; (f) the Adviser’s and Sub-Adviser’s compliance policies and procedures; and (g) information regarding the performance of each Spectrum Fund as compared to their respective benchmarks and Morningstar categories. The Board’s review of materials and deliberations are presented contemporaneously given the overlapping considerations, paralleled issues and conclusions drawn by the Board. The Board members relied upon the advice of independent legal counsel and their own business judgment in determining the material factors to be considered in evaluating the Advisory Agreements
Moreover, each Trustee may have afforded different weight to the various factors in reaching conclusions with respect to the Agreements. The Board reviewed the quality of work and abilities of the Adviser and its relationship with Spectrum Financial and the performance of each Spectrum Fund. In light of each Spectrum Fund’s performance and the compliance/review relationship with Spectrum Financial, the Board concluded that the Adviser had sufficient quality and depth of personnel, resources, investment methods and compliance policies and procedures essential to performing its duties to the Spectrum Funds. The Board conducted some of their deliberations on a joint basis for the Adviser and Spectrum Financial given the close working relationship of the Adviser and Sub-Adviser.
The Board’s review of materials and deliberations are presented contemporaneously given the overlapping considerations, paralleled issues and conclusions drawn by the Board.
Nature, Extent and Quality of Services.
With respect to the nature, extent and quality of services provided, the Board reviewed the Adviser’s Form ADV, and the Sub-Adviser’s Form ADV, a description of the manner in which investment decisions, including asset allocation, sector selection, trade execution and compliance, will be made for each Spectrum Fund by the Sub-Adviser, a description of the services provided by the Adviser
35
and those services provided by the Sub-Adviser and those executed by the Adviser. The Board reviewed the experience of professional personnel from both the Adviser and Sub-Adviser performing services for each Spectrum Fund, including the team of individuals that primarily monitor and execute the investment and administration process, and the portfolio managers. Counsel reported there were no changes in management within the Advisor and no changes within the Sub-Adviser. Further reviewed by the Board was a certification from each of the Adviser and the Sub-Adviser certifying that each has adopted a Code of Ethics containing provisions reasonably necessary to prevent Access Persons, as that term is defined in Rule 17j-1 under the 1940 Act, from engaging in conduct prohibited by Rule 17j-1(b) and that each the of the Adviser and the Sub-Adviser have adopted procedures reasonably necessary to prevent Access Persons from violating such Code of Ethics.
The Board also reviewed the balance sheet of the Adviser as of December 31, 2021, and found the financial resources greatly improved over previous years. Management noted the Adviser has access to additional capital if the need should arise. There was discussion with respect to legal fees and how they were reflected on the income statement and balance sheet, and the Board noted the net income for the Adviser was improved from prior years.
With respect to Spectrum Financial, the Board reviewed an income statement and balance sheet as of December 31, 2021, reflecting assets available to the Sub-Adviser to continue sub-advising the Spectrum Funds. The Board concluded that the Adviser and Sub-Adviser have adequate financial resources to continue to service the Spectrum Funds.
The Board also discussed the Adviser’s compliance program with the CCO of the Trust. The Board noted that the Adviser continues to have in place procedures which are currently working to prevent violations of applicable securities laws. The CCO confirmed that she has the support and resources to ensure the compliance procedures of the Trust are updated in accordance with current SEC rules. The Board concluded that the Adviser has qualified professionals, resources, and compliance policies essential to performing its duties under the Advisory Agreements.
Regarding the compliance programs of Spectrum Financial, the CCO noted that she works with the CCO of the Sub-Adviser. The Board confirmed with the CCO that she had reviewed the policies and procedures manual of Spectrum Financial, including their latest revisions and business continuity plans.
Performance. The Board considered that the Adviser delegates day-to-day investment decisions to the Sub-Adviser and, therefore, would not directly control the performance of the Spectrum Funds. The Board considered the Adviser’s other responsibilities under the Advisory Agreement, including with respect to trade oversight, reviewing daily positions and balance reports for the Spectrum Funds, obtaining derivative agreements and reporting to the Board, and concluded that the Adviser appears to be adequately monitoring the Sub-Adviser’s adherence to the respective Spectrum Fund’s investment objectives and appears to be carrying out its functions appropriately.
With respect to the performance results from the Sub-Adviser’s daily management and investment strategies, the Board considered the updated performance of each of the Spectrum Funds compared to their primary benchmark and Morningstar category for various periods provided by the Adviser. The Trustees also reviewed the Sub-Adviser’s strategy and each Spectrum Fund’s performance for various periods with explanations for over/under performance.
Spectrum Low Volatility Fund
The Board considered the Fund’s performance as compared to various benchmark indices and the Fund’s Morningstar category, Nontraditional Bond. The Board reviewed one-three-and five-
36
year periods and since inception through March 31, 2022. They noted the Fund outperformed the Morningstar Nontraditional Bond category for the three- and five-year period. The Board recognized the Fund seeks risk adjusted returns, and therefore lagged the S&P 500 Total Return Index for all periods presented, with no expectation to be highly correlated to the returns of an equity index. Specifically, the Board noted that with respect to major stock market indices, such as the S&P 500 Total Return Index, that the Fund’s investment objective was total return with lower downside volatility and risk compared to major stock market indices. The Board concluded that performance was satisfactory, and that with Adviser oversight, Spectrum Financial was expected to continue to obtain an acceptable level of investment returns for shareholders over the long term.
Spectrum Active Advantage Fund (fka Spectrum Advisers Preferred Fund)
The Board recognized the Fund’s short-term performance has lagged, as it trailed both the Morningstar Tactical Allocation and the S&P 500 Index for the one-year period ended March 31, 2022. However, the Board acknowledged its strong longer-term performance, as it continues to outperform the Morningstar Tactical category for both the three- and five-year periods. The Board noted that because its investment objective has a long-term element, and the Fund does not employ an index-tracking strategy, and the principal strategy included non-equity instruments, it is not expected to outperform the S&P 500 Index in all environments. The Board observed that the Morningstar Macro Trading category was a newer category under Morningstar, and in certain ways might be better suited to the Fund’s investment strategy. The Board concluded that the performance and strategy implemented by Spectrum Financial was satisfactory, and that with Adviser oversight, the Fund is expected to continue to obtain an acceptable level of investment returns for shareholders over the long term.
Spectrum Unconstrained Fund (April 16, 2021 commencement)
The Board considered the Fund’s performance as compared to an S&P 500 Index benchmark and the Fund’s Morningstar category, Nontraditional Bond for the one, three and six-month periods, and since inception periods since April 16, 2021 (commencement of operations) through March 31, 2022. Discussion followed with respect to the Fund’s lagging performance compared to the S&P 500 Index for each period. The Board observed that the Morningstar category comparison was unavailable. The Board noted the Fund posted negative returns for each period. The Board concluded the Fund’s short performance history insufficient and agreed it was too early to determine how the Fund will perform in the long term. The Board agreed to assess the Fund’s performance at a later date, but concluded it was acceptable.
Fees and Expenses. As to the costs of the services to be provided to each Spectrum Fund by the Adviser and Sub-Adviser, respectively, the Board reviewed and discussed the advisory fee and total operating expenses of each Spectrum Fund compared to its peer group and Morningstar category as presented in the Meeting Materials.
For each Spectrum Fund, the Board reviewed and considered the split of the Advisory fee between the Adviser and the sub-adviser (the sub-adviser being paid by the Adviser, not the Fund), and determined it was acceptable and reasonable for the services to be provided to the Fund.
37
Spectrum Low Volatility Fund
The Board noted that advisory fee of 2.15% for Low Volatility was above the above range for the Morningstar Nontraditional Bond, Tactical Allocation and Macro Trading Categories. The Board also compared the advisory fee to Equity Long/Short and Systematic Trend Morningstar categories and found it well below the maximum advisory fees in each category. The Board note that the Fund does not easily fit within a single category because of its wide-ranging strategy. The Trustees discussed the net expenses of 3.02% for Investor Class shares and found it was slightly above the maximum net expense for the Morningstar Nontraditional Bond, Tactical Allocation, and Macro Trading Morningstar same class categories. With respect to the Equity Long Short and Systematic Trend Institutional categories, the Fund’s net expense were found by the Board to be below the maximum net expense. With regards to Advisor Class shares, the Board noted the net expense ratio of 3.27% was well below the maximum net fees for Nontraditional Bond A Class, Tactical Allocation, Marco Trading, Equity Long Short and Systematic Trend Morningstar A Class categories. The Board concluded that the advisory fee and net expenses for Low Volatility are reasonable.
Spectrum Active Advantage Fund (fka Spectrum Advisors Preferred Fund)
The Board noted that advisory fee of 1.50% for Active Advantage was above the above range for the Morningstar Tactical Allocation category, and within range for the Morningstar Macro Trading and the newer Morningstar Category, Systematic Trend. The Trustees note that the Fund does not easily fit within a single category because of its specific strategy. The Board discussed that the net expenses of 1.77% for Investor Class shares and found it was within range for the Tactical Allocation and Macro Trading, and Systematic Trend Morningstar Institutional Class categories. The Board concluded that the advisory fee and net expenses for Active Advantage are reasonable.
Spectrum Unconstrained Fund
The Board noted that advisory fee of 2.15% for Unconstrained Fund was above range for the Nontraditional Bond, Tactical Allocation and Marco Trading Morningstar categories. The Board found the advisory fee within range and below the maximum advisory fee for the Morningstar Equity Long Short and the newer Morningstar Category, Systematic Trend. The Trustees noted that the Fund does not easily fit within a single category because of its wide ranging strategy. The Trustees discussed that the net expenses of 2.71% for Investor Class shares and found it was above range for the Morningstar Nontraditional Bond Institutional Class category. However, the Board discussed that the net expenses were within range, and below the maximum in the Traditional Allocation, Macro Trading, Equity Long Short, and Systematic Trend Morningstar Institutional Class categories. The Board concluded that the advisory fee and net expenses for Unconstrained are reasonable.
Profitability of Adviser. The Board reviewed the levels of profits to the Adviser for the most recent fiscal years from each Spectrum Fund with respect to advisory fees and from the total relationship with each Spectrum Fund. They considered whether profits from each Spectrum Fund were reasonable in light of services provided, including the assets levels and payments to the Sub-Adviser, and any breakpoints in fee split fees applicable to the Spectrum Funds. The Board, in consultation with counsel noted that current court rulings with respect to profitability suggest up to or even over a 50% profit margin for any adviser or sub-adviser could be acceptable and not considered excessive.
38
Spectrum Funds: Low Volatility, Active Advantage (fka Advisers Preferred) and Unconstrained
In discussion and review of the profitability statement from the Adviser with respect to the Spectrum Funds, the Board considered the split between the Adviser and Sub-Adviser. The Board noted that the Adviser was modestly (8%) profitable from Low Volatility and from Active Advantage (7%) and was operating at a loss with respect to Unconstrained. The Trustees discussed the commission earned on Fund portfolio transactions by the Adviser’s affiliate as part of the total relationship. The Board concluded that the Adviser had realized relatively low or no profits (as an adviser and from the totality of its relationship) from its services to the Funds and therefore, excessive profits are not of concern at this time.
Profitability Sub-Adviser: The Board reviewed the levels of profits to the Sub-Adviser for the most recent fiscal year from each Spectrum Fund with respect to sub-advisory fees and from the total relationship with each Fund. With regards to all Spectrum Funds, the Board noted that the Sub-Adviser usually charges higher fees from separately managed accounts with similar investment strategies, if any. The Board, in consultation with counsel noted that current court rulings with respect to profitability suggest up to or even over a 50% profit margin for any adviser or sub-adviser could be acceptable and not considered excessive.
Spectrum Funds: Low Volatility, Spectrum Active Advantage (fka Advisers Preferred) and Unconstrained.
The Board reviewed the profitability reports submitted by Spectrum Financial, and noted sub-advisory fees of 1.80%, 1.15%, and 1.80% of average net assets, respectively from Low Volatility Active Advantage and Unconstrained. The Board discussed that Spectrum Financial made a 40% profit from Low Volatility for the fiscal year ended September 31, 2021, while it operated Active Advantage at a loss for the same period. With respect to Unconstrained, the Trustees reviewed and saw that for the period April 26, 2021 through September 30, 2021, Spectrum Financial operated the Fund at a loss including when viewed from a totality of relationship basis. The Board concluded that Spectrum Financial’s profits from Low Volatility were reasonable for services provided. The Board discussed a joint revenue sharing agreement in place between the Advisor and Spectrum Financial allowing for payments to individuals for raising assets for the Funds. Ms. Ayers-Rigsby noted the agreement, has been updated to the accommodate the current market conditions for distributing the Funds’ shares. She also noted the agreement includes Hundredfold Select. The Board concluded that excess profits for the Sub-Adviser with respect to each of Low Volatility, Active Advantage and Unconstrained is currently of no concern, and they would monitor profits from each Fund as assets continue to grow.
Economies of Scale. As to the extent to which the Spectrum Funds will realize economies of scale, the Adviser reported an estimate of $500 million per Fund to be the minimum asset level required to reach such economies of scale. The Board discussed the Adviser’s expectations for the growth of each Fund and concluded that any material economies of scale were not a concern at present assets levels. The Board also confirmed that economies of scale is not a concern for approval of any sub-advisory agreements.
Conclusion. Counsel assisted the Board throughout the Advisory Agreements and Sub-Advisory Agreements review process. The Board members relied upon the advice of independent counsel, and their own business judgment in determining the material factors to be considered in evaluating each of the Advisory Agreement where appropriate; as well as each Sub-Advisory Agreement In considering the approval Board noted that each Trustee may have afforded different weight to the various factors in reaching his conclusions with respect to the Advisory Agreements and Sub-Advisory Agreements.
39
PRIVACY NOTICE
Rev. May 2014
| FACTS | WHAT DOES ADVISORS PREFERRED TRUST DO WITH YOUR PERSONAL INFORMATION? | |||
| Why? | Financial companies choose how they share your personal information. Federal law gives consumers the right to limit some but not all sharing. Federal law also requires us to tell you how we collect, share, and protect your personal information. Please read this notice carefully to understand what we do. | |||
| What? | The types of personal information we collect and share depend on the product or service you have with us. This information can include: | |||
| ■ | Social Security number | ■ | Purchase History | |
| ■ | Assets | ■ | Account Balances | |
| ■ | Retirement Assets | ■ | Account Transactions | |
| ■ | Transaction History | ■ | Wire Transfer Instructions | |
| ■ | Checking Account Information | |||
| When you are no longer our customer, we continue to share your information as described in this notice. | ||||
| How? | All financial companies need to share customers’ personal information to run their everyday business. In the section below, we list the reasons financial companies can share their customers’ personal information; the reasons Advisors Preferred Trust chooses to share; and whether you can limit this sharing. | |||
| Reasons we can share your personal information | Does Advisors Preferred Trust share? | Can you limit this sharing? |
For our everyday business purposes – such as to process your transactions, maintain your account(s), respond to court orders and legal investigations, or report to credit bureaus | Yes | No |
For our marketing purposes – to offer our products and services to you | No | We don’t share |
| For joint marketing with other financial companies | No | We don’t share |
For our affiliates’ everyday business purposes – information about your transactions and experiences | No | We don’t share |
For our affiliates’ everyday business purposes – information about your creditworthiness | No | We don’t share |
| For nonaffiliates to market to you | No | We don’t share |
| Questions? | Call 1-866-862-9686 |
40
| Who we are | |||||
Who is providing this notice?
| Advisors Preferred Trust | ||||
| What we do | |||||
| How does Advisors Preferred Trust protect my personal information? | To protect your personal information from unauthorized access and use, we use security measures that comply with federal law. These measures include computer safeguards and secured files and buildings.
Our service providers are held accountable for adhering to strict policies and procedures to prevent any misuse of your nonpublic personal information. | ||||
| How does Advisors Preferred Trust collect my personal information? | We collect your personal information, for example, when you
■ Open an account
■ Provide account information
■ Give us your contact information
■ Make deposits or withdrawals from your account
■ Make a wire transfer
■ Tell us where to send the money
■ Tells us who receives the money
■ Show your government-issued ID
■ Show your driver’s license
We also collect your personal information from other companies. | ||||
| Why can’t I limit all sharing? | Federal law gives you the right to limit only ■ Sharing for affiliates’ everyday business purposes – information about your creditworthiness ■ Affiliates from using your information to market to you
■ Sharing for nonaffiliates to market to you
State laws and individual companies may give you additional rights to limit sharing. | ||||
| Definitions | |||||
| Affiliates | Companies related by common ownership or control. They can be financial and nonfinancial companies.
■ Advisors Preferred Trust does not share with our affiliates. | ||||
| Nonaffiliates | Companies not related by common ownership or control. They can be financial and nonfinancial companies. ■ Advisors Preferred Trust does not share with nonaffiliates so they can market to you. | ||||
| Joint marketing | A formal agreement between nonaffiliated financial companies that together market financial products or services to you.
■ Advisors Preferred Trust doesn’t jointly market. | ||||
41
PROXY VOTING POLICY
Information regarding how the Funds voted proxies relating to portfolio securities for the most recent twelve month period ended June 30 as well as a description of the policies and procedures that the Fund use to determine how to vote proxies will be available without charge, upon request, by calling 1-866-862-9686 or by referring to the Securities and Exchange Commission’s (“SEC”) website at http://www.sec.gov.
PORTFOLIO HOLDINGS
The Fund files its complete schedule of portfolio holdings with the SEC for the first and third quarters of each fiscal year as an exhibit to its reports on Form N-PORT, within sixty days after the end of the period. Form N-PORT reports are available on the SEC’s website at http://www.sec.gov. The information on Form N-PORT is available without charge, upon request, by calling 1-866-862-9686.
| INVESTMENT ADVISOR |
| Advisors Preferred LLC |
| 1445 Research Blvd., Suite 530 |
| Rockville, Maryland 20850 |
| INVESTMENT SUB-ADVISOR |
| Spectrum Financial, Inc. |
| 272 Bendix Road Suite 600 |
| Virginia Beach, VA 23452 |
| ADMINISTRATOR |
| Ultimus Fund Solutions, LLC |
| 225 Pictoria Drive, Suite 450 |
| Cincinnati, Ohio 45246 |
SPECTRUM-AR22
(b) Not applicable.
Item 2. Code of Ethics.
(a) As of the end of the period covered by this report, the registrant has adopted a code of ethics that applies to the registrant's principal Principal Executive Officer, principal Principal Financial Officer, principal accounting officer or controller, or persons performing similar functions, regardless of whether these individuals are employed by the registrant or a third party.
(b) For purposes of this item, “code of ethics” means written standards that are reasonably designed to deter wrongdoing and to promote:
| (1) | Honest and ethical conduct, including the ethical handling of actual or apparent conflicts of interest between personal and professional relationships; |
| (2) | Full, fair, accurate, timely, and understandable disclosure in reports and documents that a registrant files with, or submits to, the Commission and in other public communications made by the registrant; |
(3) Compliance with applicable governmental laws, rules, and regulations;
| (4) | The prompt internal reporting of violations of the code to an appropriate person or persons identified in the code; and |
(5) Accountability for adherence to the code.
(c) Amendments: During the period covered by the report, there have not been any amendments to the provisions of the code of ethics.
(d) Waivers: During the period covered by the report, the registrant has not granted any express or implicit waivers from the provisions of the code of ethics.
(e) The Code of Ethics is not posted on Registrant’ website.
(f) A copy of the Code of Ethics is attached as an exhibit.
Item 3. Audit Committee Financial Expert.
| (a) | The Registrant’s board of trustees has determined that Felix Rivera is an audit committee financial expert, as defined in Item 3 of Form N-CSR. Mr. Rivera is independent for purposes of this Item 3. |
Item 4. Principal Accountant Fees and Services.
| (a) | Audit Fees |
2022 - $42,000
2021 - $39,000
| (b) | Audit-Related Fees |
2022 - $0
2021 - $0
| (c) | Tax Fees |
2022 - $9,000
2021 - $9,000
Preparation of Federal & State income tax returns, assistance with calculation of required income, capital gain and excise distributions and preparation of Federal excise tax returns.
| (d) | All Other Fees |
2022 – $4,500
2021 - None
| (e) | (1) Audit Committee’s Pre-Approval Policies |
The registrant’s Audit Committee is required to pre-approve all audit services and, when appropriate, any non-audit services (including audit-related, tax and all other services) to the registrant. The registrant’s Audit Committee also is required to pre-approve, when appropriate, any non-audit services (including audit-related, tax and all other services) to its adviser, or any entity controlling, controlled by or under common control with the adviser that provides ongoing services to the registrant, to the extent that the services may be determined to have an impact on the operations or financial reporting of the registrant. Services are reviewed on an engagement by engagement basis by the Audit Committee.
| (2) | Percentages of Services Approved by the Audit Committee |
2022 2021
Audit-Related Fees: 100% 100%
Tax Fees: 100% 100%
All Other Fees: 100% 100%
| (f) | During the audit of registrant's financial statements for the most recent fiscal year, less than 50 percent of the hours expended on the principal accountant's engagement were attributed to work performed by persons other than the principal accountant's full-time, permanent employees. |
| (g) | The aggregate non-audit fees billed by the registrant's accountant for services rendered to the registrant, and rendered to the registrant's investment adviser (not including any sub-adviser whose role is primarily portfolio management and is subcontracted with or overseen by another investment adviser), and any entity controlling, controlled by, or under common control with the adviser that provides ongoing services to the registrant: |
2022 - $9,000
2021 - $9,000
(h) The registrant's audit committee has considered whether the provision of non-audit services to the registrant's investment adviser (not including any sub-adviser whose role is primarily portfolio management and is subcontracted with or overseen by another investment adviser), and any entity controlling, controlled by, or under common control with the investment adviser that provides ongoing services to the registrant, that were not pre-approved pursuant to paragraph (c)(7)(ii) of Rule 2-01 of Regulation S-X, is compatible with maintaining the principal accountant's independence.
(i) Not applicable.
(j) Not applicable.
Item 5. Audit Committee of Listed Companies. Not applicable to open-end investment companies.
Item 6. Schedule of Investments. Schedule of investments in securities of unaffiliated issuers is included under Item 1.
Item 7. Disclosure of Proxy Voting Policies and Procedures for Closed-End Funds. Not applicable to open-end investment companies.
Item 8. Portfolio Managers of Closed-End Management Investment Companies. Not applicable to open-end investment companies.
Item 9. Purchases of Equity Securities by Closed-End Funds. Not applicable to open-end investment companies.
Item 10. Submission of Matters to a Vote of Security Holders. Vote of security holders is included under item 1.
Item 11. Controls and Procedures.
(a) Based on an evaluation of the Registrant’s disclosure controls and procedures as of a date within 90 days of filing date of this Form N-CSR, the principal Principal Executive Officer and principal Principal Financial Officer of the Registrant have concluded that the disclosure controls and procedures of the Registrant are reasonably designed to ensure that the information required in filings on Form N-CSR is recorded, processed, summarized, and reported by the filing date, including that information required to be disclosed is accumulated and communicated to the Registrant’s management, including the Registrant’s principal Principal Executive Officer and principal Principal Financial Officer, as appropriate to allow timely decisions regarding required disclosure.
(b) There were no significant changes in the Registrant’s internal control over financial reporting that occurred during the period covered by this report that have materially affected, or are reasonably likely to materially affect, the Registrant’s internal control over financial reporting.
Item 12. Disclosure of Securities Lending Activities for Closed-End Management Investment Companies. Not applicable.
Item 13. Exhibits.
(a)(1) Code of Ethics filed herewith.
(a)(3) Not applicable for open-end investment companies.
SIGNATURES
Pursuant to the requirements of the Securities Exchange Act of 1934 and the Investment Company Act of 1940, the registrant has duly caused this report to be signed on its behalf by the undersigned, thereunto duly authorized.
(Registrant) Advisors Preferred Trust
By (Signature and Title)
/s/ Catherine Ayer-Rigsby
Catherine Ayer-Rigsby, Principal Executive Officer
Date 12/5/22
Pursuant to the requirements of the Securities Exchange Act of 1934 and the Investment Company Act of 1940, this report has been signed below by the following persons on behalf of the registrant and in the capacities and on the dates indicated.
By (Signature and Title)
/s/ Catherine Ayer-Rigsby
Catherine Ayers-Rigsby, Principal Executive Officer
Date 12/5/22
By (Signature and Title)
/s/Christine Casares
Christine Casares, Principal Financial Officer
Date 12/5/22