united states
securities and exchange commission
washington, d.c. 20549
form n-csr
certified shareholder report of registered management
investment companies
Investment Company Act file number 811-22756
Advisors Preferred Trust
(Exact name of registrant as specified in charter)
1445 Research Blvd, Suite 530, Rockville, MD 20850
(Address of principal executive offices) (Zip code)
The Corporation Trust Company
1209 Orange Street Wilmington, DE 19801
(Name and address of agent for service)
Registrant's telephone number, including area code: 631-470-2734
Date of fiscal year end: 6/30
Date of reporting period: 6/30/23

Annual Report
June 30, 2023
| Quantified Managed Income Fund | Quantified Market Leaders Fund |
| Investor Class Shares QBDSX | Investor Class Shares QMLFX |
| Advisor Class Shares QBDAX | Advisor Class Shares QMLAX |
| Quantified Alternative Investment Fund | Quantified STF Fund |
| Investor Class Shares QALTX | Investor Class Shares QSTFX |
| Advisor Class Shares QALAX | Advisor Class Shares QSTAX |
| Quantified Pattern Recognition Fund | Quantified Tactical Fixed Income Fund |
| Investor Class Share QSPMX | Investor Class Shares QFITX |
| Quantified Evolution Plus Fund | Quantified Common Ground Fund |
| Investor Class Shares QEVOX | Investor Class Shares QCGDX |
| Quantified Tactical Sectors Fund | Quantified Rising Dividend Tactical Fund |
| Investor Class Shares QTSSX | Investor Class Shares QRDTX |
| Quantified Government Income Tactical Fund | |
| Investor Class Shares QGITX | |
1-855-64-QUANT (1-855-647-8268)
www.advisorspreferred.com
Distributed by Ceros Financial Services, Inc.
August 28, 2023
Dear Shareholders:
This annual report for the Quantified Funds discusses the period from July 1, 2022 to June 30, 2023. The Quantified Funds are sub-advised by Flexible Plan Investments, Ltd., and actively managed using dynamic asset allocation. The Funds offer a three-dimensional approach to diversification that aims to increase the odds that more of our investors’ portfolios are correctly positioned to weather market storms.
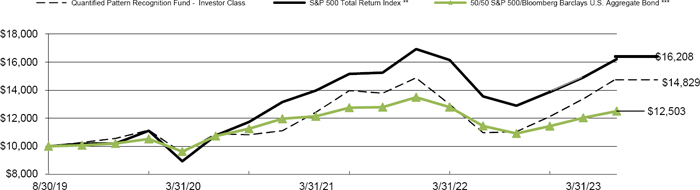
The Quantified Pattern Recognition Fund returned 35.28% for the year. For the same period, the S&P 500 Total Return Index gained 19.59%, and a blended benchmark of 50% of the S&P 500 Total Return Index and 50% of the Bloomberg U.S. Aggregate Bond Index rose 9.18%. The Fund seeks out daily patterns in the stock market that have been found to be determinative of probable future price direction. The Fund was intermittently exposed to the market during the third quarter of 2022. It was more active during the fourth quarter of 2022 and the first quarter of 2023 than it had been in years. It frequently maxed out leverage at 2X for short periods, while also often shorting. The Fund captured market patterns in the second quarter of 2023, resulting in very short-term mean-reversion trading following the previous quarter’s long bias. As a result, the Fund maintained a balanced split between long and short positions, with frequent trading. This activity helped the Fund identify current market patterns and outperform its benchmarks. The Fund uses futures to achieve leverage.
The Quantified Market Leaders Fund returned 10.86% for the Investor class shares for the period and - 10.25% for the Advisor class shares. For the same period the Fund’s benchmark, the Morningstar Aggressive Target Risk Index, gained 14.24% and the Fund’s former benchmark, the FT Wilshire 5000 Full Cap Total Return Index, rose 19.14%. On August 26, 2022, the Fund was at its maximum equity exposure of 156%. By August 31, it had dropped to just 22%. The Fund started the fourth quarter of 2022 in risk-off mode with a market exposure of 9%, its lowest possible level. In mid-October, equity markets began to rebound. The Fund reacted to the emerging uptrend by raising its equity exposure and, by the start of December, the Fund was back to its maximum exposure of 156%. As the market came under pressure, the Fund lowered its market exposure to 28%. It continued to shift between defensive and offensive postures during the first quarter of 2023. During these three quarters, whipsaw trades caused the Fund to underperform. However, the Fund moved from 100% market exposure to its maximum of 156% at the start of the second quarter and it closed out the period at a new high for 2023. The Fund uses swaps to achieve leverage.
The Quantified STF Fund returned 14.84% for the year for the Investor class shares and 14.12% for the Advisor class shares. For the same period, the NASDAQ 100 Total Return Index gained 33.13%. The Fund follows easily identifiable up and down trends in the market based solely on the price action of the NASDAQ 100. The Fund uses futures to achieve leverage and inverse positions. On the first day of the third quarter, the Fund had -1.0X exposure. As a dynamically managed, tactical fund, QSTFX was very responsive during the quarter: On July 6, exposure changed to 0X. On July 12, it decreased back to -1.0X. On July 19, exposure changed to 0X. On July 21, it rose to 1.0X, and on August 29 it fell back to 0X. On September 6, exposure changed to -1.0X, and on September 9 it again rose to 0X. On September 12, exposure increased to 1.0X, and on September 13 changed to 0X. On September 16, exposure decreased again to -1.0X. On November 10, exposure changed to 0X. On November 30, it rose to 1.0X. On December 15, exposure decreased to 0X. On December 23, it changed once again to -1.0X where it remained through year-end. The Fund was highly responsive during the first quarter of 2023, adjusting its exposure multiple times before moving to 2X long on March 23rd where it remained throughout the second quarter of 2023.
1
The Quantified Tactical Sectors Fund returned 14.58% for the year, while the S&P 500 Total Return Index gained 19.59%. Both stocks and bonds fell in the third quarter. On August 26, the Fund was at its maximum equity exposure. By August 31, it had dropped to just 22%. The Fund started the fourth quarter in a risk-off mode with no market exposure. In mid-October, equity markets began to rebound. The Fund reacted to the emerging uptrend by raising its equity exposure. By the start of December, the Fund was back to its maximum exposure of 156%. When the market came under pressure, the Fund reacted by lowering market exposure to 25%. It switched between defensive and offensive postures multiple times during the first quarter of 2023, before it returned to a 56% leveraged stance on April 3rd.
The Quantified Common Ground Fund returned 1.39% for the year, while the S&P Composite 1500 Total Return Index gained 19.24%. The Fund invests in securities of issuers that can be considered compliant with both ESG (Environmental, Social and Governance) and BRI (Biblically Responsible Investing) standards. The Fund favored Utilities for the third quarter of 2022 and Consumer Staples in July and September which detracted from performance. In November and December, the Fund tilted toward the Energy and Materials sectors. About half of the sector positions were a net negative to the Fund in the fourth quarter. In the first quarter of 2023, the Fund continued to focus on the Energy, Industrials and Materials sectors; however, half of the sectors positions negatively impacted the Fund. In the 2nd quarter of 2023, the Fund favored the Financial and Materials sectors, which were generally positive. Despite this positive performance, investment in sectors that underperformed the market led to the Fund underperforming its benchmark for the quarter.
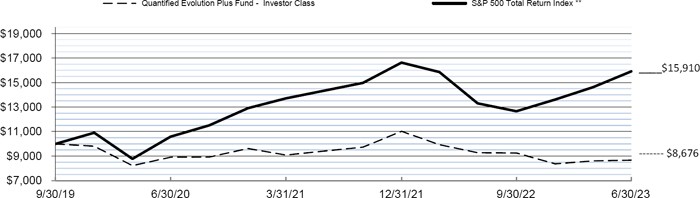
The Quantified Evolution Plus Fund returned -6.46% for the period, while the S&P 500 Total Return Index gained 19.59% for the twelve months. The Fund began the third quarter invested in the U.S. dollar, gold, and intermediate Treasurys. By the end of the quarter, it had transitioned to a portfolio largely dominated by the U.S. dollar and commodities futures. During the fourth quarter, the Fund was largely allocated to the U.S. dollar which fell after a significant run-up causing the Fund to underperform. The Fund added international equity exposure during the first quarter of 2023. It started the second quarter of the year with an overweight position in cash and small-capitalization stocks. In May, the Fund shifted its weight towards emerging markets and international equities. By the end of the period, the Fund had moved to overweight emerging markets and international equities, including a significant portion of the S&P 500, essentially eliminating its earlier cash exposure.
The Quantified Rising Dividend Tactical Fund returned -7.28% for the year, while the S&P 500 Total Return Index was up 19.59%. The Fund began employing leverage during the third quarter, which it achieves by using swaps. Its move to 140% invested brought brief gains. But those gains were lost as the market moved lower. The Fund started the fourth quarter in a risk-off mode with a market exposure of 40%, its lowest possible level. By the start of December, the Fund was back to its maximum exposure of 146%, anticipating a continuation of the new market rally. However, the market came under pressure, and by late December, the S&P 500 had given up half of its fourth-quarter gains. After starting the first quarter of 2023 fully invested, the Fund moved to a defensive position in mid-March and reentered the market in the second quarter during which it was able to recover some of its losses from the previous period, but it ended the year in a loss.
The Quantified Alternative Investment Fund returned -1.71% for the Investor class shares and -2.24% for the Advisor class shares for the year. For the same period, the S&P 500 Total Return Index gained 19.59%. The Fund manages a ranked portfolio of alternative investments consisting of both asset classes and alternative strategies which historically have not been correlated to the broad markets. In the rotational portion of the Fund, Traditional Energy was the biggest contributor to the Fund’s performance during the third quarter of 2022, while Commodities was the biggest detractor. The Fund’s futures hedging exposure negatively affected performance for the quarter. The Fund’s dividend-paying stock sleeve was the best-
2
performing component for the fourth quarter, remaining mostly market neutral to reduce volatility. The Fund’s high-yield-bond trading sleeve outperformed the benchmark while the actively traded long-term government-bond futures overlay was negative and underperformed the Fund’s benchmark for the fourth quarter. The Fund’s rotational portion saw Technology with the highest return for the first quarter and second quarters of 2023. The cash position amounted to approximately 12% at the end of the period.
The Quantified Managed Income Fund returned -3.53% for the Investor class for the year and -4.02% for the Advisor class shares. For the same period, the Bloomberg U.S. Aggregate Bond Index decreased by - 0.94%. The Quantified Managed Income Fund selects income investments from a universe of bond, equity, REIT and MLP investments to create an optimized risk adjusted return portfolio. The Fund’s rotational ETF sleeve was up for the third quarter of 2022 and the first half of 2023 although it was down for the fourth quarter of 2022. The Fund’s dividend-paying stock sleeve was the best-performing component for the fourth quarter. It remained mostly market neutral to minimize volatility in the first half of 2023. The Fund’s high-yield-bond trading sleeve underperformed the benchmark in the third quarter, although it outperformed the benchmark throughout the remainder of the period. The actively traded long-term government-bond futures overlay was negative for the fourth quarter of 2022, and positive for the first two quarters of 2023.
The Quantified Government Income Tactical Fund returned -14.59% for the period, while the Bloomberg U.S. Aggregate Bond Index lost -0.94%. The Fund had a long bias for long-term Treasurys for the third quarter and during the first two months of the fourth quarter. Short exposure to Treasurys at critical times, as well as the breakdown of what had been a remarkably consistent pattern-based trade, caused the Fund to underperform its benchmark for the fourth quarter. An algorithm change in late December aimed at making the Fund more interest-rate agnostic negatively impacted the portfolio during the first quarter of 2023. These changes, however, had a positive impact on the Fund’s performance during the second quarter of 2023. The Fund alternated between nearly 100% long and 50% short exposures as market patterns emerged.
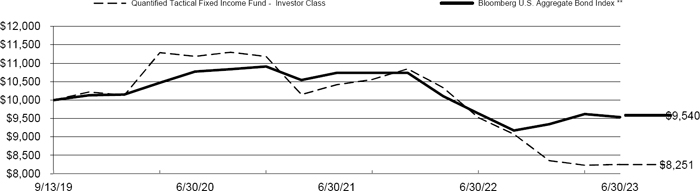
The Quantified Tactical Fixed Income Fund returned -13.36% for the period, while the Bloomberg U.S. Aggregate Bond Index lost -0.94%. The Fund’s strategy is to combine numerous computerized strategies to create a multi-strategy, dynamically risk managed methodology for trading government and high yield bond market indexes represented in the ETF and futures markets. Swaps and futures are utilized to achieve leveraged and inverse positions. The Fund had a long bias for long-term Treasurys for the third quarter of 2022, though short positions were achieved in the earlier portions of each month using futures. Apart from a small amount of exposure to high yields in mid-August and mid-September, the Fund had no exposure to the asset class. The Fund’s long bias for long-term Treasurys continued for the first two months of the fourth quarter. An algorithm change in late December aimed at making the Fund more interest-rate agnostic negatively impacted the portfolio during the first quarter of 2023, causing losses. However, this change benefited its performance in the second quarter of 2023. The Fund alternated between nearly 100% long and 50% short exposures as market patterns emerged.
Thank you for your confidence in the Quantified Funds. For further information about the Funds, please visit our website at https://www.flexibleplan.com/our-solutions/quantified-funds.
Very truly yours,
| Jerry Wagner | Catherine Ayers-Rigsby |
| Flexible Plan Investments, Ltd. | Advisors Preferred, LLC |
| Sub-adviser | Adviser |
3
| Quantified Managed Income Fund |
| Portfolio Review (Unaudited) |
| June 30, 2023 |
The Fund’s performance figures* for the periods ended June 30, 2023, as compared to its benchmark:
| Annualized | |||||
| Since Inception | Since Inception | ||||
| One Year | Three Year | Five Year | March 18, 2016 | August 9, 2013 | |
| Quantified Managed Income Fund - Investor Class | (3.53)% | (2.12)% | (1.01)% | N/A | 0.14% |
| Quantified Managed Income Fund - Advisor Class | (4.02)% | (2.72)% | (1.63)% | (0.46)% | N/A |
| Bloomberg U.S. Aggregate Bond Index ** | (0.94)% | (3.96)% | 0.77% | 0.81% | 1.50% |
Comparison of Change in Value of a $10,000 Investment.
Since Inception through June 30, 2023 +
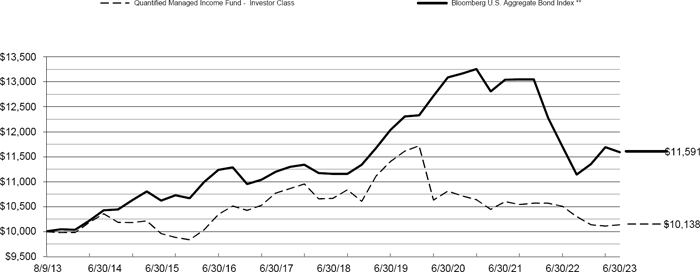
| + | Inception date is August 9, 2013 |
| * | The Performance data quoted is historical. Past performance is no guarantee of future results. Current performance may be higher or lower than the performance data quoted. The principal value and investment return of an investment will fluctuate so that your shares, when redeemed, may be worth more or less than their original cost. The returns shown do not reflect the deduction of taxes that a shareholder would pay on Fund distributions or on the redemptions of Fund shares. The Fund’s total annual fund operating expense ratio, as provided in the Fund’s prospectus dated November 1, 2022, was 1.55% for Investor Class and 2.15% for Advisor Class shares. For performance information current to the most recent month-end, please call 1-855-647-8268. Investors should consider the investment objectives, risks, and charges and expenses of the Fund carefully before investing. The Fund’s prospectus and summary prospectus contain these as well as other information about the Fund and should be read carefully before investing. A prospectus or summary prospectus may be obtained by calling 1-855-647-8268. |
| ** | The Bloomberg U.S. Aggregate Bond Index is an unmanaged index comprised of U.S. investment grade, fixed rate bond market securities, including government, government agency, corporate and mortgage-backed securities. Investors cannot invest directly in an index; unlike the Fund’s returns, the index does not reflect any fees or expenses. |
| Portfolio holdings by types of investments as of June 30, 2023 are as follows: | ||||
| Holdings by Type of Investment ^: | % of Net Assets | |||
| Common Stocks | 10.5 | % | ||
| Exchange-Traded Funds: | ||||
| Fixed Income Funds | 37.0 | % | ||
| Equity Fund | 3.3 | % | ||
| Money Market Funds | 41.5 | % | ||
| Collateral For Securities Loaned | 13.4 | % | ||
| Liabilities in Excess of Other Assets | (5.7 | )% | ||
| 100.0 | % | |||
| ^ | The Holdings by Type of Investment detail does not include derivative exposure. |
Please refer to the Schedule of Investments in this annual report for a detailed listing of the Fund’s holdings.
4
| QUANTIFIED MANAGED INCOME FUND |
| SCHEDULE OF INVESTMENTS |
| June 30, 2023 |
| Shares | Fair Value | |||||||
| COMMON STOCKS — 10.5% | ||||||||
| AEROSPACE & DEFENSE – 0.7% | ||||||||
| 980 | Lockheed Martin Corporation | $ | 451,172 | |||||
| 1,102 | Northrop Grumman Corporation | 502,292 | ||||||
| 953,464 | ||||||||
| BEVERAGES - 0.7% | ||||||||
| 8,147 | Coca-Cola Company | 490,612 | ||||||
| 2,681 | PepsiCo, Inc. | 496,575 | ||||||
| 987,187 | ||||||||
| BIOTECH & PHARMA - 1.4% | ||||||||
| 3,660 | AbbVie, Inc. | 493,112 | ||||||
| 2,194 | Amgen, Inc. | 487,112 | ||||||
| 963 | Eli Lilly and Company | 451,628 | ||||||
| 13,044 | Pfizer, Inc. | 478,454 | ||||||
| 1,910,306 | ||||||||
| CHEMICALS - 0.3% | ||||||||
| 1,103 | NewMarket Corporation | 443,538 | ||||||
| CONSUMER SERVICES - 0.3% | ||||||||
| 6,907 | Service Corp International(c) | 446,123 | ||||||
| ELECTRICAL EQUIPMENT - 0.3% | ||||||||
| 942 | Roper Technologies, Inc. | 452,914 | ||||||
| FOOD - 1.1% | ||||||||
| 6,150 | General Mills, Inc. (c) | 471,705 | ||||||
| 1,938 | Hershey Company(c) | 483,919 | ||||||
| 4,330 | Lamb Weston Holdings, Inc. | 497,733 | ||||||
| 1,453,357 | ||||||||
| HEALTH CARE FACILITIES & SERVICES - 0.4% | ||||||||
| 912 | Chemed Corporation(c) | 494,003 | ||||||
| HOUSEHOLD PRODUCTS - 1.1% | ||||||||
| 6,472 | Colgate-Palmolive Company | 498,603 | ||||||
| 3,256 | Kimberly-Clark Corporation(c) | 449,523 | ||||||
See accompanying notes to financial statements.
5
| QUANTIFIED MANAGED INCOME FUND |
| SCHEDULE OF INVESTMENTS (Continued) |
| June 30, 2023 |
| Shares | Fair Value | |||||||
| COMMON STOCKS — 10.5% (Continued) | ||||||||
| HOUSEHOLD PRODUCTS - 1.1% (Continued) | ||||||||
| 2,994 | Procter & Gamble Company | $ | 454,310 | |||||
| 1,402,436 | ||||||||
| LEISURE FACILITIES & SERVICES - 0.3% | ||||||||
| 2,700 | Darden Restaurants, Inc. (c) | 451,116 | ||||||
| MEDICAL EQUIPMENT & DEVICES - 0.4% | ||||||||
| 6,137 | Hologic, Inc.(a) | 496,913 | ||||||
| RETAIL - CONSUMER STAPLES - 1.1% | ||||||||
| 7,185 | BJ’s Wholesale Club Holdings, Inc.(a) | 452,727 | ||||||
| 842 | Costco Wholesale Corporation | 453,316 | ||||||
| 2,909 | Dollar General Corporation | 493,890 | ||||||
| 1,399,933 | ||||||||
| RETAIL - DISCRETIONARY – 0.7% | ||||||||
| 5,344 | TJX Companies, Inc. | 453,118 | ||||||
| 959 | Ulta Beauty, Inc.(a) | 451,301 | ||||||
| 904,419 | ||||||||
| TECHNOLOGY HARDWARE - 0.4% | ||||||||
| 8,731 | Cisco Systems, Inc. | 451,742 | ||||||
| TECHNOLOGY SERVICES - 0.7% | ||||||||
| 1,154 | Mastercard, Inc., Class A | 453,868 | ||||||
| 1,907 | Visa, Inc., Class A(c) | 452,874 | ||||||
| 906,742 | ||||||||
| TELECOMMUNICATIONS - 0.3% | ||||||||
| 12,095 | Verizon Communications, Inc. | 449,813 | ||||||
| WHOLESALE - CONSUMER STAPLES - 0.3% | ||||||||
| 6,122 | Sysco Corporation | 454,252 | ||||||
| TOTAL COMMON STOCKS (Cost $14,085,407) | 14,058,258 | |||||||
See accompanying notes to financial statements.
6
| QUANTIFIED MANAGED INCOME FUND |
| SCHEDULE OF INVESTMENTS (Continued) |
| June 30, 2023 |
| Shares | Fair Value | |||||||
| EXCHANGE-TRADED FUNDS — 40.3% | ||||||||
| EQUITY - 3.3% | ||||||||
| 68,257 | WisdomTree US LargeCap Dividend Fund | $ | 4,341,145 | |||||
| FIXED INCOME - 37.0% | ||||||||
| 111,289 | Invesco Emerging Markets Sovereign Debt ETF(c) | 2,169,023 | ||||||
| 434,654 | Invesco Senior Loan ETF(c) | 9,145,120 | ||||||
| 179,403 | iShares Floating Rate Bond ETF | 9,117,260 | ||||||
| 415,446 | ProShares Short 20+ Year Treasury | 9,011,024 | ||||||
| 131,402 | SPDR Bloomberg Convertible Securities ETF(c) | 9,191,570 | ||||||
| 93,087 | SPDR Nuveen Bloomberg Municipal Bond ETF(c) | 4,296,896 | ||||||
| 139,873 | VanEck Vectors Intermediate Muni ETF(c) | 6,443,949 | ||||||
| 49,374,842 | ||||||||
| TOTAL EXCHANGE-TRADED FUNDS (Cost $53,328,952) | 53,715,987 | |||||||
| SHORT-TERM INVESTMENTS — 41.5% | ||||||||
| MONEY MARKET FUNDS - 41.5% | ||||||||
| 27,705,631 | Fidelity Government Portfolio, Class I, 4.98%(b) | 27,705,631 | ||||||
| 27,705,631 | First American Government Obligations Fund, Class Z, 4.97%(b) | 27,705,631 | ||||||
| TOTAL MONEY MARKET FUNDS (Cost $55,411,262) | 55,411,262 | |||||||
| TOTAL SHORT-TERM INVESTMENTS (Cost $55,411,262) | 55,411,262 | |||||||
| Units | ||||||||
| COLLATERAL FOR SECURITIES LOANED — 13.4% | ||||||||
| 17,870,186 | Mount Vernon Liquid Assets Portfolio, LLC, 5.28%(b),(d),(e) | 17,870,186 | ||||||
| TOTAL COLLATERAL FOR SECURITIES LOANED (Cost $17,870,186) | ||||||||
| TOTAL INVESTMENTS – 105.7% (Cost $140,695,807) | $ | 141,055,693 | ||||||
| LIABILITIES IN EXCESS OF OTHER ASSETS - (5.7)% | (7,610,213 | ) | ||||||
| NET ASSETS - 100.0% | $ | 133,445,480 | ||||||
See accompanying notes to financial statements.
7
| QUANTIFIED MANAGED INCOME FUND |
| SCHEDULE OF INVESTMENTS (Continued) |
| June 30, 2023 |
| OPEN FUTURES CONTRACTS | ||||||||||||||
| Number of Contracts | Open Short Futures Contracts | Expiration | Notional Amount | Unrealized Appreciation (Depreciation) | ||||||||||
| 33 | CME E-Mini Standard & Poor’s 500 Index Futures | 09/15/2023 | 7,405,613 | $ | (165,475 | ) | ||||||||
| 147 | Ultra U.S. Treasury Bond Futures | 09/20/2023 | 20,024,163 | 25,828 | ||||||||||
| TOTAL FUTURES CONTRACTS | (139,647 | ) | ||||||||||||
| ETF | - Exchange-Traded Fund |
| SPDR | - Standard & Poor’s Depositary Receipt |
| (a) | Non-income producing security. |
| (b) | Rate disclosed is the seven-day effective yield as of June 30, 2023. |
| (c) | All or portion of the security is a loan. Total loaned securities had a value of $17,526,884 at June 30, 2023. |
| (d) | Security purchased with cash proceeds of securities lending collateral. |
| (e) | Investment is valued using net asset value per share as a practical expedient. |
See accompanying notes to financial statements.
8
| Quantified Market Leaders Fund |
| Portfolio Review (Unaudited) |
| June 30, 2023 |
The Fund’s performance figures* for the periods ended June 30, 2023, as compared to its benchmarks:
| Annualized | |||||
| Since Inception | Since Inception | ||||
| One Year | Three Year | Five Year | March 18, 2016 | August 9, 2013 | |
| Quantified Market Leaders Fund - Investor Class | 10.86% | 8.38% | 7.01% | N/A | 7.51% |
| Quantified Market Leaders Fund - Advisor Class | 10.25% | 7.79% | 6.42% | 9.34% | N/A |
| Morningstar Aggressive Target Risk Index ** | 14.24% | 10.36% | 7.18% | 9.32% | 8.04% |
| FT Wilshire 5000 Full Cap Index-TR *** | 19.14% | 13.38% | 11.05% | 12.66% | 11.55% |
Comparison of Change in Value of a $10,000 Investment.
Since Inception through June 30, 2023 +
| + | Inception date is August 9, 2013 |
| * | The performance data quoted is historical. Past performance is no guarantee of future results. Current performance may be higher or lower than the performance data quoted. The principal value and investment return of an investment will fluctuate so that your shares, when redeemed, may be worth more or less than their original cost. The returns shown do not reflect the deduction of taxes that a shareholder would pay on Fund distributions or on the redemptions of Fund shares. The Fund’s total annual fund operating expense ratio, as provided in the Fund’s prospectus dated November 1, 2022, was 1.50% for Investor Class and 2.10% for Advisor Class shares. For performance information current to the most recent month-end, please call 1-855-647-8268. Investors should consider the investment objectives, risks, and charges and expenses of the Fund carefully before investing. The Fund’s prospectus and summary prospectus contain these as well as other information about the Fund and should be read carefully before investing. A prospectus or summary prospectus may be obtained by calling 1-855-647-8268. |
| ** | The Morningstar Aggressive Target Risk Index is an index designed to meet the benchmarking needs of target risk investors by offering an objective yardstick for performance comparison. The index invests in 95% global equity exposure and 5% global bond exposure. Investors cannot invest directly in an index. Fund management has selected this index as the new primary index because it believes it aligns better with the Fund’s asset composition. |
The Quantified Market Leaders Fund is not sponsored, endorsed, sold or promoted by Morningstar, Inc. or any of its affiliates (all such entities, collectively, “Morningstar Entities”). The Morningstar Entities make no representation or warranty, express or implied, to the owners of the Quantified Market Leaders Fund or any member of the public regarding the advisability of investing in equities and bonds generally or in the the Quantified Market Leaders Fund in particular or the ability of The Morningstar Aggressive Target Risk Index to track general equities and bonds market performance.
| *** | The FT Wilshire 5000 Full Cap-TR Index seeks to capture 100% of the investible U.S. market. Investors may not invest in an index directly; unlike the Fund’s returns, the index does not reflect any fees or expenses. |
| Portfolio holdings by types of investments as of June 30, 2023 are as follows: | ||||
| Holdings by Type of Investment: ^ | % of Net Assets | |||
| Exchange-Traded Funds: | ||||
| Equity Funds | 76.4 | % | ||
| Money Market Funds | 20.8 | % | ||
| Collateral for Securities Loaned | 5.1 | % | ||
| Liabilities in Excess of Other Assets | (2.3 | )% | ||
| 100.0 | % | |||
| ^ | The Holdings by Type of Investment detail does not include derivative exposure. |
Please refer to the Schedule of Investments in this annual report for a detailed listing of the Fund’s holdings.
9
QUANTIFIED MARKET LEADERS FUND
SCHEDULE OF INVESTMENTS
June 30, 2023
| Shares | Fair Value | |||||||
| EXCHANGE-TRADED FUNDS — 76.4% | ||||||||
| EQUITY - 76.4% | ||||||||
| 194,315 | Consumer Discretionary Select Sector SPDR Fund | $ | 32,996,630 | |||||
| 181,171 | iShares MSCI EAFE ETF(a) | 13,134,898 | ||||||
| 74,178 | SPDR S&P 500 ETF Trust | 32,881,624 | ||||||
| 190,499 | Technology Select Sector SPDR Fund(a) | 33,120,156 | ||||||
| 57,646 | Vanguard Information Technology ETF | 25,488,755 | ||||||
| 137,622,063 | ||||||||
| TOTAL EXCHANGE-TRADED FUNDS (Cost $129,275,663) | 137,622,063 | |||||||
| SHORT-TERM INVESTMENTS — 20.8% | ||||||||
| MONEY MARKET FUNDS - 20.8% | ||||||||
| 18,758,823 | Fidelity Government Portfolio, Class I, 4.98%(b) | 18,758,823 | ||||||
| 18,758,824 | First American Government Obligations Fund, Class Z, 4.97%(b) | 18,758,824 | ||||||
| TOTAL MONEY MARKET FUNDS (Cost $37,517,647) | 37,517,647 | |||||||
| TOTAL SHORT-TERM INVESTMENTS (Cost $37,517,647) | 37,517,647 | |||||||
| Units | ||||||||
| COLLATERAL FOR SECURITIES LOANED — 5.1% | ||||||||
| 9,223,617 | Mount Vernon Liquid Assets Portfolio, LLC, 5.28-%(b),(c),(d) | 9,223,617 | ||||||
| TOTAL COLLATERAL FOR SECURITIES LOANED (Cost $9,223,617) | ||||||||
| TOTAL INVESTMENTS – 102.3% (Cost $176,016,927) | $ | 184,363,327 | ||||||
| LIABILITIES IN EXCESS OF OTHER ASSETS – (2.3)% | (4,231,014 | ) | ||||||
| NET ASSETS - 100.0% | $ | 180,132,313 | ||||||
| EAFE | - Europe, Australasia and Far East |
| ETF | - Exchange-Traded Fund |
| MSCI | - Morgan Stanley Capital International |
| SPDR | - Standard & Poor’s Depositary Receipt |
| (a) | All or portion of the security is a loan. Total loaned securities had a value of $9,169,810 at June 30, 2023. |
| (b) | Rate disclosed is the seven-day effective yield as of June 30, 2023. |
| (c) | Security purchased with cash proceeds of securities lending collateral. |
| (d) | Investment is valued using net asset value per share as a practical expedient. |
See accompanying notes to financial statements.
10
| QUANTIFIED MARKET LEADERS FUND |
| SCHEDULE OF INVESTMENTS (Continued) |
| June 30, 2023 |
| TOTAL RETURN SWAPS | ||||||||||||||||||
| Number of Shares | Reference Entity | Notional Amount at June 30, 2023 | Interest Rate Payable (1) | Termination Date | Counterparty | Unrealized Appreciation | ||||||||||||
| Long Position: | ||||||||||||||||||
| 190,420 | iShares Russell 1000 Growth ETF | $ | 52,399,776 | USD SOFR plus 35 bp | 7/25/2024 | BRC | $ | 1,045,080 | ||||||||||
| 109,600 | iShares Russell 2000 Growth ETF | 26,595,536 | USD SOFR plus 35 bp | 7/25/2024 | BRC | 895,628 | ||||||||||||
| 74,530 | iShares Russell Mid-Cap Growth ETF | 7,201,834 | USD SOFR plus 35 bp | 5/2/2024 | BRC | 335,469 | ||||||||||||
| 213,410 | iShares Russell Mid-Cap Growth ETF | 20,621,808 | USD SOFR plus 35 bp | 6/21/2024 | BRC | 1,376,314 | ||||||||||||
| 37,380 | iShares Russell Mid-Cap Growth ETF | 3,612,029 | USD SOFR plus 35 bp | 7/2/2024 | BRC | 208,851 | ||||||||||||
| 87,660 | iShares Russell Mid-Cap Growth ETF | 8,470,586 | USD SOFR plus 35 bp | 7/25/2024 | BRC | 292,111 | ||||||||||||
| 10,860 | Vanguard Information Technology Index Fund ETF | 4,801,858 | USD SOFR plus 35 bp | 6/10/2024 | BRC | 563,500 | ||||||||||||
| 6,260 | Vanguard Information Technology Index Fund ETF | 2,767,922 | USD SOFR plus 35 bp | 7/2/2024 | BRC | 124,044 | ||||||||||||
| Total: | $ | 4,840,997 | ||||||||||||||||
BRC - Barclays Capital
SOFR - Secured Overnight Financing Rate
| (1) | Interest rate is based upon predetermined notional amounts, which may be a multiple of the number of shares plus a specified spread. |
See accompanying notes to financial statements.
11
| Quantified Alternative Investment Fund |
| Portfolio Review (Unaudited) |
| June 30, 2023 |
The Fund’s performance figures* for the periods ended June 30, 2023, as compared to its benchmark:
| Annualized | |||||
| Since Inception | Since Inception | ||||
| One Year | Three Year | Five Year | March 18, 2016 | August 9, 2013 | |
| Quantified Alternative Investment Fund - Investor Class | (1.71)% | 6.86% | 2.43% | N/A | 2.43% |
| Quantified Alternative Investment Fund - Advisor Class | (2.24)% | 6.30% | 1.88% | 2.38% | N/A |
| S&P 500 Total Return Index ** | 19.59% | 14.60% | 12.31% | 13.29% | 12.40% |
Comparison of Change in Value of a $10,000 Investment.
Since Inception through June 30, 2023 +
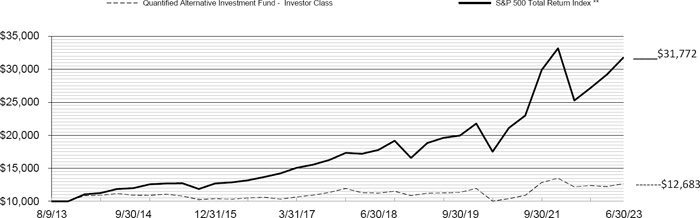
| + | Inception date is August 9, 2013 |
| * | The performance data quoted is historical. Past performance is no guarantee of future results. Current performance may be higher or lower than the performance data quoted. The principal value and investment return of an investment will fluctuate so that your shares, when redeemed, may be worth more or less than their original cost. The returns shown do not reflect the deduction of taxes that a shareholder would pay on Fund distributions or on the redemptions of Fund shares. The Fund’s total annual fund operating expense ratio, as provided in the Fund’s prospectus dated November 1, 2022, was 1.94% for Investor Class and 2.55% for Advisor Class shares. For performance information current to the most recent month-end, please call 1-855-647-8268. Investors should consider the investment objectives, risks, and charges and expenses of the Fund carefully before investing. The Fund’s prospectus and summary prospectus contain these as well as other information about the Fund and should be read carefully before investing. A prospectus or summary prospectus may be obtained by calling 1-855-647-8268. |
| ** | The S&P 500 Total Return Index is an unmanaged composite of 500 large capitalization companies and includes the reinvestment of dividends. This Index is widely used by professional investors as a performance benchmark for Large-Cap stocks. Investors may not invest in an index directly; unlike the Fund’s returns, the index does not reflect any fees or expenses. |
| Portfolio holdings by types of investments as of June 30, 2023 are as follows: | ||||
| Holdings by Type of Investment: ^ | % of Net Assets | |||
| Exchange-Traded Funds: | ||||
| Equity Funds | 55.8 | % | ||
| Fixed Income Funds | 1.2 | % | ||
| Open-End Mutual Funds: | ||||
| Alternative Funds | 29.7 | % | ||
| Mixed Allocation Funds | 0.6 | % | ||
| Money Market Funds | 11.5 | % | ||
| Collateral for Securities Loaned | 4.7 | % | ||
| Liabilities in Excess of Other Assets | (3.5 | )% | ||
| 100.0 | % | |||
| ^ | The Holdings by Type of Investment detail does not include derivative exposure. |
Please refer to the Schedule of Investments in this annual report for a detailed listing of the Fund’s holdings.
12
| QUANTIFIED ALTERNATIVE INVESTMENT FUND |
| SCHEDULE OF INVESTMENTS |
| June 30, 2023 |
| Shares | Fair Value | |||||||
| EXCHANGE-TRADED FUNDS — 57.0% | ||||||||
| EQUITY - 55.8% | ||||||||
| 3,636 | ARK Autonomous Technology & Robotics ETF | $ | 204,925 | |||||
| 10,996 | ARK Space Exploration & Innovation ETF(a) | 167,139 | ||||||
| 2,256 | Fidelity MSCI Consumer Discretionary Index ETF | 165,410 | ||||||
| 3,730 | Fidelity MSCI Industrials Index ETF | 212,125 | ||||||
| 800 | First Trust Cloud Computing ETF | 60,752 | ||||||
| 1,178 | First Trust Consumer Discretionary AlphaDEX Fund | 65,037 | ||||||
| 522 | First Trust Industrials/Producer Durables AlphaDEX | 31,367 | ||||||
| 2,207 | Franklin LibertyQ US Mid Cap Equity ETF | 99,094 | ||||||
| 8,236 | Global X Artificial Intelligence & Technology ETF(c) | 230,279 | ||||||
| 2,029 | Global X FinTech ETF | 44,780 | ||||||
| 377 | Invesco DWA Industrials Momentum ETF | 39,672 | ||||||
| 487 | Invesco Dynamic Building & Construction ETF | 26,482 | ||||||
| 2,156 | Invesco Dynamic Leisure and Entertainment ETF | 90,164 | ||||||
| 3,093 | Invesco RAFI Strategic US ETF | 125,359 | ||||||
| 2,187 | Invesco S&P 500 Downside Hedge ETF | 72,849 | ||||||
| 877 | Invesco S&P 500 Equal Weight Industrials ETF | 179,347 | ||||||
| 961 | Invesco S&P 500 Equal Weight Technology ETF | 282,620 | ||||||
| 438 | Invesco S&P 500 GARP ETF | 39,762 | ||||||
| 1,250 | Invesco S&P 500 Quality ETF | 63,063 | ||||||
| 1,741 | iShares Global Consumer Discretionary ETF | 272,832 | ||||||
| 1,109 | iShares MSCI Chile ETF | 32,361 | ||||||
| 7,558 | iShares MSCI India ETF(a) | 330,285 | ||||||
| 2,149 | iShares MSCI Mexico ETF (c) | 133,625 | ||||||
| 793 | iShares MSCI South Korea ETF | 50,260 | ||||||
| 923 | iShares MSCI Taiwan ETF(c) | 43,399 | ||||||
| 2,487 | Siren DIVCON Leaders Dividend | 140,281 | ||||||
| 717 | SPDR FactSet Innovative Technology ETF | 94,674 | ||||||
| 327 | SPDR S&P Homebuilders ETF | 26,258 | ||||||
| 836 | Vanguard Industrials ETF | 171,823 | ||||||
| 4,942 | WisdomTree International Hedged Quality Dividend | 198,520 | ||||||
| 3,694,544 | ||||||||
| FIXED INCOME - 1.2% | ||||||||
| 510 | iShares Convertible Bond ETF | 38,944 | ||||||
See accompanying notes to financial statements.
13
| QUANTIFIED ALTERNATIVE INVESTMENT FUND |
| SCHEDULE OF INVESTMENTS (Continued) |
| June 30, 2023 |
| Shares | Fair Value | |||||||
| EXCHANGE-TRADED FUNDS — 57.0% (Continued) | ||||||||
| FIXED INCOME - 1.2% (Continued) | ||||||||
| 564 | SPDR Bloomberg Convertible Securities ETF | $ | 39,452 | |||||
| 78,396 | ||||||||
| TOTAL EXCHANGE-TRADED FUNDS (Cost $3,677,825) | 3,772,940 | |||||||
| OPEN-END MUTUAL FUNDS — 30.3% | ||||||||
| ALTERNATIVE - 29.7% | ||||||||
| 3,745 | AlphaCentric Premium Opportunity Fund, Class I(a) | 96,499 | ||||||
| 39,796 | AQR Alternative Risk Premia Fund, Class I(a) | 393,183 | ||||||
| 21,293 | AQR Equity Market Neutral Fund, Class I | 194,831 | ||||||
| 18,667 | AQR Macro Opportunities Fund, Class I | 197,684 | ||||||
| 22,241 | AQR Managed Futures Strategy Fund, Class I | 197,055 | ||||||
| 22,521 | Boston Partners Global Long/Short Fund, Investor Class | 329,257 | ||||||
| 20,339 | Campbell Systematic Macro Fund, Class I | 196,881 | ||||||
| 35,435 | Destinations Multi Strategy Alternatives Fund, Class I | 360,021 | ||||||
| 1,965,412 | ||||||||
| MIXED ALLOCATION - 0.6% | ||||||||
| 3,011 | Glenmede Secured Options Portfolio(a) | 39,595 | ||||||
| TOTAL OPEN-END MUTUAL FUNDS (Cost $1,974,117) | 2,005,007 | |||||||
| SHORT-TERM INVESTMENTS — 11.5% | ||||||||
| MONEY MARKET FUNDS - 11.5% | ||||||||
| 378,887 | Fidelity Government Portfolio, Class I, 4.98%(b) | 378,887 | ||||||
| 378,888 | First American Government Obligations Fund, Class Z, 4.97%(b) | 378,888 | ||||||
| TOTAL MONEY MARKET FUNDS (Cost $757,775) | 757,775 | |||||||
| TOTAL SHORT-TERM INVESTMENTS (Cost $757,775) | 757,775 | |||||||
See accompanying notes to financial statements.
14
| QUANTIFIED ALTERNATIVE INVESTMENT FUND |
| SCHEDULE OF INVESTMENTS (Continued) |
| June 30, 2023 |
| Units | Fair Value | |||||||
| COLLATERAL FOR SECURITIES LOANED — 4.7% | ||||||||
| 311,924 | Mount Vernon Liquid Assets Portfolio, LLC, 5.28%(b),(d),(e) | 311,924 | ||||||
| TOTAL COLLATERAL FOR SECURITIES LOANED (Cost $311,924) | ||||||||
| TOTAL INVESTMENTS – 103.5% (Cost $6,721,641) | $ | 6,847,646 | ||||||
| LIABILITIES IN EXCESS OF OTHER ASSETS – (3.5)% | (230,077 | ) | ||||||
| NET ASSETS - 100.0% | $ | 6,617,569 | ||||||
| OPEN FUTURES CONTRACTS | ||||||||||||||
| Number of Contracts | Open Long Futures Contracts | Expiration | Notional Amount | Unrealized Appreciation | ||||||||||
| 2 | CME E-Mini NASDAQ 100 Index Futures | 09/15/2023 | $ | 613,480 | $ | 14,084 | ||||||||
| TOTAL FUTURES CONTRACTS | ||||||||||||||
| OPEN FUTURES CONTRACTS | ||||||||||||||
| Number of Contracts | Open Short Futures Contracts | Expiration | Notional Amount | Unrealized Appreciation | ||||||||||
| 5 | Ultra U.S. Treasury Bond Futures | 09/20/2023 | $ | 681,094 | $ | 781 | ||||||||
| TOTAL FUTURES CONTRACTS | ||||||||||||||
| ETF | - Exchange-Traded Fund |
| MSCI | - Morgan Stanley Capital International |
| SPDR | - Standard & Poor’s Depositary Receipt |
| (a) | Non-income producing security. |
| (b) | Rate disclosed is the seven-day effective yield as of June 30, 2023. |
| (c) | All or a portion of the security is on loan. Total loaned securities had a value of $307,663 at June 30, 2023. |
| (d) | Security purchased with cash proceeds of securities lending collateral. |
| (e) | Investment is valued using net asset value per share as a practical expedient. |
See accompanying notes to financial statements.
15
| Quantified STF Fund |
| Portfolio Review (Unaudited) |
| June 30, 2023 |
The Fund’s performance figures* for the periods ended June 30, 2023, as compared to its benchmark:
| Annualized | ||||
| Since Inception | ||||
| One Year | Three Year | Five Year | November 13, 2015 | |
| Quantified STF Fund - Investor Class | 14.84% | 12.56% | 14.78% | 14.30% |
| Quantified STF Fund - Advisor Class | 14.12% | 11.85% | 14.08% | 13.66% |
| Nasdaq 100 Total Return Index ** | 33.13% | 15.23% | 17.66% | 18.44% |
Comparison of Change in Value of a $10,000 Investment.
Since Inception through June 30, 2023 +
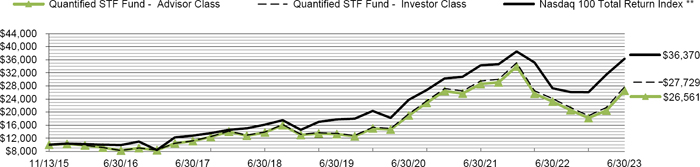
| + | Inception date is November 13, 2015 |
| * | The performance data quoted is historical. Past performance is no guarantee of future results. Current performance may be higher or lower than the performance data quoted. The principal value and investment return of an investment will fluctuate so that your shares, when redeemed, may be worth more or less than their original cost. The returns shown do not reflect the deduction of taxes that a shareholder would pay on Fund distributions or on the redemptions of Fund shares. The Fund’s total annual fund operating expense ratio, as provided in the Fund’s prospectus dated November 1, 2022, was 1.64% for Investor Class and 2.24% for Advisor Class shares. For performance information current to the most recent month-end, please call 1-855-647-8268. Investors should consider the investment objectives, risks, and charges and expenses of the Fund carefully before investing. The Fund’s prospectus and summary prospectus contain these as well as other information about the Fund and should be read carefully before investing. A prospectus or summary prospectus may be obtained by calling 1-855-647-8268. |
| ** | The Nasdaq 100 Total Return Index includes 100 of the largest domestic and international non-financial companies listed on the NASDAQ Stock Market based on market capitalization. The index reflects companies across major industry groups including computer hardware and software, telecommunications, retail/wholesale trade and biotechnology. Index composition is reviewed on an annual basis in December. Investors may not invest in an index directly; unlike the Fund’s returns, the index does not reflect any fees or expenses. |
| Portfolio holdings by types of investments as of June 30, 2023 are as follows: | ||||
| Holdings by Type of Investment: ^ | % of Net Assets | |||
| Certificate of Deposit: | 6.9 | % | ||
| Corporate Bonds | 11.5 | % | ||
| Exchange-Traded Fund: | ||||
| Equity Fund | 0.0 | %* | ||
| U.S. Government & Agencies | 1.9 | % | ||
| Money Market Funds | 52.0 | % | ||
| Collateral For Securities Loaned | 0.5 | % | ||
| Other Assets in Excess of Liabilities | 27.2 | % | ||
| 100.0 | % | |||
| ^ | The Holdings by Type of Investment detail does not include derivative exposure. |
| * | Percentage rounds to less than 0.1% |
Please refer to the Schedule of Investments in this annual report for a detailed listing of the Fund’s holdings.
16
| QUANTIFIED STF FUND |
| SCHEDULE OF INVESTMENTS |
| June 30, 2023 |
| Shares | Fair Value | |||||||
| EXCHANGE-TRADED FUND — 0.0%(a) | ||||||||
| EQUITY - 0.0%(a) | ||||||||
| 50 | Invesco QQQ Trust Series 1 | $ | 18,471 | |||||
| TOTAL EXCHANGE-TRADED FUND (Cost $18,185) | 18,471 | |||||||
| Principal | Coupon Rate | |||||||||||
| Amount ($) | (%) | Maturity | ||||||||||
| CORPORATE BONDS — 11.5% | ||||||||||||
| AUTOMOTIVE — 0.4% | ||||||||||||
| 1,000,000 | Toyota Motor Credit Corporation | 0.5000 | 06/18/24 | 953,148 | ||||||||
| BANKING — 1.4% | ||||||||||||
| 1,000,000 | Canadian Imperial Bank of Commerce | 3.1000 | 04/02/24 | 977,695 | ||||||||
| 1,000,000 | Mitsubishi UFJ Financial Group, Inc. | 3.4070 | 03/07/24 | 984,136 | ||||||||
| 1,000,000 | PNC Financial Services Group, Inc. | 3.9000 | 04/29/24 | 982,068 | ||||||||
| 2,943,899 | ||||||||||||
| DIVERSIFIED INDUSTRIALS — 0.5% | ||||||||||||
| 1,000,000 | General Electric Company | 3.4500 | 05/15/24 | 976,367 | ||||||||
| ELECTRIC UTILITIES — 0.9% | ||||||||||||
| 1,000,000 | Enel Generacion Chile S.A. | 4.2500 | 04/15/24 | 980,299 | ||||||||
| 1,000,000 | WEC Energy Group, Inc. | 0.8000 | 03/15/24 | 965,167 | ||||||||
| 1,945,466 | ||||||||||||
| GAS & WATER UTILITIES — 0.5% | ||||||||||||
| 1,000,000 | Thomson Reuters Corporation | 3.8500 | 09/29/24 | 970,187 | ||||||||
| INSTITUTIONAL FINANCIAL SERVICES — 1.4% | ||||||||||||
| 1,000,000 | Bank of New York Mellon Corporation | 0.5000 | 04/26/24 | 959,093 | ||||||||
| 1,000,000 | Brookfield Finance, Inc. | 4.0000 | 04/01/24 | 986,284 | ||||||||
| 1,000,000 | Goldman Sachs Group, Inc. | 0.8000 | 03/25/24 | 963,597 | ||||||||
| 2,908,974 | ||||||||||||
| MACHINERY — 0.5% | ||||||||||||
| 1,000,000 | Parker-Hannifin Corporation | 2.7000 | 06/14/24 | 971,444 | ||||||||
See accompanying notes to financial statements.
17
| QUANTIFIED STF FUND |
| SCHEDULE OF INVESTMENTS (Continued) |
| June 30, 2023 |
| Principal | Coupon Rate | |||||||||||
| Amount ($) | (%) | Maturity | Fair Value | |||||||||
| CORPORATE BONDS — 11.5% (Continued) | ||||||||||||
| MEDICAL EQUIPMENT & DEVICES — 0.5% | ||||||||||||
| 1,000,000 | Becton Dickinson and Company | 3.3630 | 06/06/24 | $ | 978,739 | |||||||
| OIL & GAS SERVICES & EQUIPMENT — 0.5% | ||||||||||||
| 1,000,000 | Schlumberger Holdings Corporation(b) | 3.7500 | 05/01/24 | 984,205 | ||||||||
| REAL ESTATE INVESTMENT TRUSTS — 0.5% | ||||||||||||
| 1,000,000 | Welltower, Inc. | 3.6250 | 03/15/24 | 983,489 | ||||||||
| RETAIL - CONSUMER STAPLES — 0.4% | ||||||||||||
| 1,000,000 | 7-Eleven, Inc.(b) | 0.8000 | 02/10/24 | 969,388 | ||||||||
| SPECIALTY FINANCE — 1.4% | ||||||||||||
| 1,000,000 | Capital One Financial Corp | 3.9000 | 01/29/24 | 987,830 | ||||||||
| 2,000,000 | Federal National Mortgage Association | 5.2500 | 02/17/26 | 1,979,676 | ||||||||
| 2,967,506 | ||||||||||||
| TECHNOLOGY HARDWARE — 0.9% | ||||||||||||
| 1,000,000 | Apple, Inc. | 3.0000 | 02/09/24 | 986,201 | ||||||||
| 1,000,000 | Hewlett Packard Enterprise Company (d) | 1.4500 | 04/01/24 | 968,156 | ||||||||
| 1,954,357 | ||||||||||||
| TECHNOLOGY SERVICES — 0.5% | ||||||||||||
| 1,000,000 | International Business Machines Corporation | 3.0000 | 05/15/24 | 977,579 | ||||||||
| TELECOMMUNICATIONS — 0.4% | ||||||||||||
| 1,000,000 | Verizon Communications, Inc. | 0.7500 | 03/22/24 | 965,328 | ||||||||
| TRANSPORTATION & LOGISTICS — 0.8% | ||||||||||||
| 1,000,000 | Ryder System, Inc. | 3.6500 | 03/18/24 | 983,557 | ||||||||
| 1,000,000 | Union Pacific Corporation | 3.6460 | 02/15/24 | 988,174 | ||||||||
| 1,971,731 | ||||||||||||
| TOTAL CORPORATE BONDS (Cost $25,307,742) | 24,421,807 | |||||||||||
See accompanying notes to financial statements.
18
| QUANTIFIED STF FUND |
| SCHEDULE OF INVESTMENTS (Continued) |
| June 30, 2023 |
| Principal | Coupon Rate | |||||||||||
| Amount ($) | (%) | Maturity | Fair Value | |||||||||
| U.S. GOVERNMENT & AGENCIES — 1.9% | ||||||||||||
| GOVERNMENT OWNED, NO GUARANTEE — 1.0% | ||||||||||||
| 2,000,000 | Federal Home Loan Mortgage Corporation | 5.6250 | 03/13/26 | $ | 1,987,600 | |||||||
| GOVERNMENT SPONSORED — 0.9% | ||||||||||||
| 2,000,000 | Federal Home Loan Banks | 5.3000 | 08/15/25 | 1,983,736 | ||||||||
| TOTAL U.S. GOVERNMENT & AGENCIES (Cost $4,000,000) | 3,971,336 | |||||||||||
| CERTIFICATE OF DEPOSIT — 6.9% | ||||||||||||
| AUTOMOTIVE - 0.5% | ||||||||||||
| 1,000,000 | BMW Bank of North America | 0.5500 | 07/30/24 | 948,990 | ||||||||
| BANKING - 6.4% | ||||||||||||
| 1,000,000 | Bellco Credit Union | 5.1500 | 02/24/25 | 995,638 | ||||||||
| 1,000,000 | Burke & Herbert Bank & Trust Company | 4.6000 | 02/06/26 | 978,541 | ||||||||
| 1,000,000 | Charles Schwab Bank SSB | 4.7500 | 02/02/24 | 996,150 | ||||||||
| 1,000,000 | Goldman Sachs Bank USA | 0.5500 | 07/29/24 | 949,116 | ||||||||
| 1,000,000 | Greenstate Credit Union | 0.5000 | 07/19/24 | 949,320 | ||||||||
| 1,000,000 | Local Government Federal Credit Union | 4.9000 | 02/12/24 | 997,510 | ||||||||
| 1,000,000 | Sallie Mae Bank | 0.5500 | 07/22/24 | 948,966 | ||||||||
| 1,000,000 | State Bank of India | 0.6000 | 08/30/24 | 945,300 | ||||||||
| 1,000,000 | Synchrony Bank | 0.6500 | 09/17/24 | 944,042 | ||||||||
| 1,000,000 | Texas Exchange Bank SSB | 0.5000 | 07/09/24 | 950,605 | ||||||||
| 1,000,000 | Toyota Financial Savings Bank | 0.5500 | 08/05/24 | 948,238 | ||||||||
| 1,000,000 | UBS Bank USA | 0.5500 | 08/12/24 | 946,920 | ||||||||
| 1,000,000 | Valley Strong Credit Union | 5.1000 | 02/10/25 | 994,990 | ||||||||
| 1,000,000 | Wells Fargo Bank NA | 4.7500 | 02/06/24 | 996,084 | ||||||||
| 13,541,420 | ||||||||||||
| TOTAL CERTIFICATE OF DEPOSIT (Cost $14,998,863) | 14,490,410 | |||||||||||
See accompanying notes to financial statements.
19
| QUANTIFIED STF FUND |
| SCHEDULE OF INVESTMENTS (Continued) |
| June 30, 2023 |
| Shares | Fair Value | |||||||
| SHORT-TERM INVESTMENTS — 52.0% | ||||||||
| MONEY MARKET FUNDS – 52.0% | ||||||||
| 54,896,763 | Fidelity Government Portfolio, Class I, 4.98%(c),(f) | $ | 54,896,763 | |||||
| 54,896,764 | First American Government Obligations Fund, Class Z, 4.97%(c),(f) | 54,896,764 | ||||||
| TOTAL MONEY MARKET FUNDS (Cost $109,793,527) | 109,793,527 | |||||||
| TOTAL SHORT-TERM INVESTMENTS (Cost $109,793,527) | 109,793,527 | |||||||
| Units | ||||||||
| COLLATERAL FOR SECURITIES LOANED — 0.5% | ||||||||
| 1,000,000 | Mount Vernon Liquid Assets Portfolio, LLC, 5.28%(c),(e),(g) | 1,000,000 | ||||||
| TOTAL COLLATERAL FOR SECURITIES LOANED (Cost $1,000,000) | ||||||||
| TOTAL INVESTMENTS – 72.8% (Cost $155,118,317) | $ | 153,695,551 | ||||||
| OTHER ASSETS IN EXCESS OF LIABILITIES- 27.2% | 57,311,061 | |||||||
| NET ASSETS - 100.0% | $ | 211,006,612 | ||||||
| OPEN FUTURES CONTRACTS | ||||||||||||||
| Number of Contracts | Open Long Futures Contracts | Expiration | Notional Amount | Unrealized Appreciation | ||||||||||
| 1,377 | CME E-Mini NASDAQ 100 Index Futures | 09/15/2023 | $ | 422,380,980 | $ | 8,939,388 | ||||||||
| TOTAL FUTURES CONTRACTS | ||||||||||||||
| (a) | Percentage rounds to less than 0.1%. |
| (b) | Security exempt from registration under Rule 144A or Section 4(2) of the Securities Act of 1933. The security may be resold in transactions exempt from registration, normally to qualified institutional buyers. As of June 30, 2023 the total market value of 144A securities is $1,953,593 or 0.9% of net assets. |
| (c) | Rate disclosed is the seven-day effective yield as of June 30, 2023. |
| (d) | All or a portion of the security is on loan. Total loaned securities had a value of $968,156 at June 30, 2023. |
| (e) | Security purchased with cash proceeds of securities lending collateral. |
| (f) | See note 10 |
| (g) | Investment is valued using net asset value per share as a practical expedient. |
See accompanying notes to financial statements.
20
| Quantified Pattern Recognition Fund |
| Portfolio Review (Unaudited) |
| June 30, 2023 |
The Fund’s performance figures* for the period ended June 30, 2023, as compared to its benchmark:
| Since Inception | |||
| One Year | Three Year | August 30, 2019 | |
| Quantified Pattern Recognition Fund - Investor Class | 35.28% | 10.84% | 10.82% |
| S&P 500 Total Return Index ** | 19.59% | 14.60% | 13.42% |
| 50/50 S&P 500/Bloomberg Barclays U.S. Aggregate Bond *** | 9.18% | 5.23% | 6.00% |
Comparison of Change in Value of a $10,000 Investment.
Since Inception through June 30, 2023 +
| + | Inception date is August 30, 2019 |
| * | The performance data quoted is historical. Past performance is no guarantee of future results. Current performance may be higher or lower than the performance data quoted. The principal value and investment return of an investment will fluctuate so that your shares, when redeemed, may be worth more or less than their original cost. The returns shown do not reflect the deduction of taxes that a shareholder would pay on Fund distributions or on the redemptions of Fund shares. The Fund’s total annual fund operating expense ratio, as provided in the Fund’s prospectus dated November 1, 2022, was 1.68% for Investor Class shares. For performance information current to the most recent month-end, please call 1-855-647-8268. Investors should consider the investment objectives, risks, and charges and expenses of the Fund carefully before investing. The Fund’s prospectus and summary prospectus contain these as well as other information about the Fund and should be read carefully before investing. A prospectus or summary prospectus may be obtained by calling 1-855-647-8268. |
| ** | The S&P 500 Total Return Index is an unmanaged composite of 500 large capitalization companies and includes the reinvestment of dividends. This Index is widely used by professional investors as a performance benchmark for Large-Cap stocks. Investors may not invest in an index directly; unlike the Fund’s returns, the index does not reflect any fees or expenses. |
| *** | The S&P 500 is a market capitalization-weighted index of 500 widely held common stocks. The Bloomberg Barclays U.S. Aggregate Bond Index is an unmanaged market index representative of the U.S. taxable fixed income securities. Investors cannot invest directly in an index. |
| Portfolio holdings by types of investments as of June 30, 2023 are as follows: | ||||
| Holdings by Type of Investment ^: | % of Net Assets | |||
| Certificate of Deposit: | 8.1 | % | ||
| Corporate Bond | 1.6 | % | ||
| Exchange-Traded Funds: | ||||
| Equity Fund | 0.1 | % | ||
| U.S. Government & Agencies | 3.2 | % | ||
| Money Market Funds | 79.8 | % | ||
| Other Assets In Excess of Liabilities | 7.2 | % | ||
| 100.0 | % | |||
| ^ | The Holdings by type of Investment detail does not include derivative exposure. |
Please refer to the Schedule of Investments in this annual report for a detailed listing of the Fund’s holdings.
21
| QUANTIFIED PATTERN RECOGNITION FUND |
| SCHEDULE OF INVESTMENTS |
| June 30, 2023 |
| Shares | Fair Value | |||||||
| EXCHANGE-TRADED FUNDS — 0.1% | ||||||||
| EQUITY - 0.1% | ||||||||
| 100 | SPDR S&P 500 ETF Trust | $ | 44,328 | |||||
| TOTAL EXCHANGE-TRADED FUNDS (Cost $43,572) | 44,328 | |||||||
| Principal | Coupon Rate | |||||||||||
| Amount ($) | (%) | Maturity | ||||||||||
| CORPORATE BOND — 1.6% | ||||||||||||
| SPECIALTY FINANCE — 1.6% | ||||||||||||
| 1,000,000 | Federal National Mortgage Association | 5.2500 | 02/17/26 | 989,838 | ||||||||
| TOTAL CORPORATE BOND (Cost $1,000,000) | 989,838 | |||||||||||
| U.S. GOVERNMENT & AGENCIES — 3.2% | ||||||||||||
| GOVERNMENT OWNED, NO GUARANTEE — 1.6% | ||||||||||||
| 1,000,000 | Federal Home Loan Mortgage Corporation | 5.3000 | 02/17/26 | 990,438 | ||||||||
| GOVERNMENT SPONSORED — 1.6% | ||||||||||||
| 1,000,000 | Federal Home Loan Banks | 5.6250 | 03/09/26 | 993,816 | ||||||||
| TOTAL U.S. GOVERNMENT & AGENCIES (Cost $2,000,000) | 1,984,254 | |||||||||||
| CERTIFICATE OF DEPOSIT — 8.1% | ||||||||||||
| BANKING - 8.1% | ||||||||||||
| 1,000,000 | Charles Schwab Bank SSB | 4.7500 | 02/02/24 | 996,150 | ||||||||
| 1,000,000 | Connexus Credit Union | 5.5000 | 06/28/24 | 1,000,337 | ||||||||
| 1,000,000 | Local Government Federal Credit Union | 4.9000 | 02/12/24 | 997,510 | ||||||||
| 1,000,000 | Valley Strong Credit Union | 5.1000 | 02/10/25 | 994,990 | ||||||||
| 1,000,000 | Wells Fargo Bank NA | 4.7500 | 02/06/24 | 996,084 | ||||||||
| 4,985,071 | ||||||||||||
| TOTAL CERTIFICATE OF DEPOSIT (Cost $5,000,000) | 4,985,071 | |||||||||||
See accompanying notes to financial statements.
22
| QUANTIFIED PATTERN RECOGNITION FUND |
| SCHEDULE OF INVESTMENTS (Continued) |
| June 30, 2023 |
| Shares | Fair Value | |||||||
| SHORT-TERM INVESTMENTS — 79.8% | ||||||||
| MONEY MARKET FUNDS – 79.8% | ||||||||
| 24,494,645 | Fidelity Government Portfolio, Class I, 4.98%(a)(b) | $ | 24,494,645 | |||||
| 24,494,646 | First American Government Obligations Fund, Class Z, 4.97%(a)(b) | 24,494,646 | ||||||
| TOTAL MONEY MARKET FUNDS (Cost $48,989,291) | 48,989,291 | |||||||
| TOTAL SHORT-TERM INVESTMENTS (Cost $48,989,291) | 48,989,291 | |||||||
| TOTAL INVESTMENTS – 92.8% (Cost $57,032,863) | $ | 56,992,782 | ||||||
| OTHER ASSETS IN EXCESS OF LIABILITIES- 7.2% | 4,408,202 | |||||||
| NET ASSETS - 100.0% | $ | 61,400,984 | ||||||
| OPEN FUTURES CONTRACTS | ||||||||||||||
| Number of Contracts | Open Short Futures Contracts | Expiration | Notional Amount | Unrealized Depreciation | ||||||||||
| 382 | CME E-Mini Standard & Poor’s 500 Index Futures | 09/15/2023 | $ | 85,725,575 | $ | (505,027 | ) | |||||||
| TOTAL FUTURES CONTRACTS | ||||||||||||||
| ETF | - Exchange-Traded Fund |
| SPDR | - Standard & Poor’s Depositary Receipt |
| (a) | Rate disclosed is the seven-day effective yield as of June 30, 2023. |
| (b) | See note 10. |
See accompanying notes to financial statements.
23
| Quantified Tactical Fixed Income Fund |
| Portfolio Review (Unaudited) |
| June 30, 2023 |
The Fund’s performance figures* for the periods ended June 30, 2023, as compared to its benchmark:
| Since Inception | |||
| One Year | Three Year | September 13, 2019 | |
| Quantified Tactical Fixed Income Fund - Investor Class | (13.36)% | (9.64)% | (4.94)% |
| Bloomberg U.S. Aggregate Bond Index ** | (0.94)% | (3.96)% | (1.23)% |
Comparison of Change in Value of a $10,000 Investment.
Since Inception through June 30, 2023 +
| + | Inception date is September 13, 2019. |
| * | The performance data quoted is historical. Past performance is no guarantee of future results. Current performance may be higher or lower than the performance data quoted. The principal value and investment return of an investment will fluctuate so that your shares, when redeemed, may be worth more or less than their original cost. The returns shown do not reflect the deduction of taxes that a shareholder would pay on Fund distributions or on the redemptions of Fund shares. The Fund’s total annual fund operating expense ratio, as provided in the Fund’s prospectus dated November 1, 2022, was 1.67% for Investor Class shares. For performance information current to the most recent month-end, please call 1-855-647-8268. Investors should consider the investment objectives, risks, and charges and expenses of the Fund carefully before investing. The Fund’s prospectus and summary prospectus contain these as well as other information about the Fund and should be read carefully before investing. A prospectus or summary prospectus may be obtained by calling 1-855-647-8268. |
| ** | The Bloomberg U.S. Aggregate Bond Index is an unmanaged index comprised of U.S. investment grade, fixed rate bond market securities, including government, government agency, corporate and mortgage-backed securities. Investors cannot invest directly in an index; unlike the Fund’s returns, the index does not reflect any fees or expenses. |
| Portfolio holdings by types of investments as of June 30, 2023 are as follows: | ||||
| Holdings by Type of Investment: ^ | % of Net Assets | |||
| Certificate of Deposit | 11.9 | % | ||
| Corporate Bonds | 20.7 | % | ||
| Exchange-Traded Fund: | ||||
| Fixed Income | 0.0 | %* | ||
| U.S. Government & Agencies | 3.6 | % | ||
| Money Market Funds | 37.0 | % | ||
| Collateral For Securities Loaned | 0.8 | % | ||
| Other Assets in Excess of Liabilities | 26.0 | % | ||
| 100.0 | % | |||
| ^ | The Holdings by Type of Investment detail does not include derivative exposure. |
| * | Percentage rounds to less than 0.1%. |
Please refer to the Schedule of Investments in this annual report for a detailed listing of the Fund’s holdings.
24
| QUANTIFIED TACTICAL FIXED INCOME FUND |
| SCHEDULE OF INVESTMENTS |
| June 30, 2023 |
| Shares | Fair Value | |||||||
| EXCHANGE-TRADED FUND — 0.0%(a) | ||||||||
| FIXED INCOME - 0.0%(a) | ||||||||
| 300 | iShares 20+ Year Treasury Bond ETF | $ | 30,882 | |||||
| TOTAL EXCHANGE-TRADED FUND (Cost $30,985) | 30,882 | |||||||
| Principal | Coupon Rate | |||||||||||
| Amount ($) | (%) | Maturity | ||||||||||
| CORPORATE BONDS — 20.7% | ||||||||||||
| AUTOMOTIVE — 0.8% | ||||||||||||
| 1,000,000 | Toyota Motor Credit Corporation | 0.5000 | 06/18/24 | 953,148 | ||||||||
| BANKING — 1.7% | ||||||||||||
| 1,000,000 | Mitsubishi UFJ Financial Group, Inc. | 3.4070 | 03/07/24 | 984,135 | ||||||||
| 1,000,000 | PNC Financial Services Group, Inc. | 3.9000 | 04/29/24 | 982,068 | ||||||||
| 1,966,203 | ||||||||||||
| DIVERSIFIED INDUSTRIALS — 0.9% | ||||||||||||
| 1,000,000 | General Electric Company | 3.4500 | 05/15/24 | 976,367 | ||||||||
| ELECTRIC UTILITIES — 1.7% | ||||||||||||
| 1,000,000 | Enel Generacion Chile S.A. | 4.2500 | 04/15/24 | 980,299 | ||||||||
| 1,000,000 | WEC Energy Group, Inc. | 0.8000 | 03/15/24 | 965,167 | ||||||||
| 1,945,466 | ||||||||||||
| ENTERTAINMENT CONTENT — 0.9% | ||||||||||||
| 1,000,000 | Walt Disney Company | 7.7500 | 01/20/24 | 1,011,106 | ||||||||
| GAS & WATER UTILITIES — 0.8% | ||||||||||||
| 1,000,000 | Thomson Reuters Corporation | 3.8500 | 09/29/24 | 970,187 | ||||||||
| INSTITUTIONAL FINANCIAL SERVICES — 0.8% | ||||||||||||
| 1,000,000 | Bank of New York Mellon Corporation | 0.5000 | 04/26/24 | 959,093 | ||||||||
| MACHINERY — 0.9% | ||||||||||||
| 1,000,000 | Parker-Hannifin Corporation | 2.7000 | 06/14/24 | 971,444 | ||||||||
See accompanying notes to financial statements.
25
| QUANTIFIED TACTICAL FIXED INCOME FUND |
| SCHEDULE OF INVESTMENTS (Continued) |
| June 30, 2023 |
| Principal | Coupon Rate | |||||||||||
| Amount ($) | (%) | Maturity | Fair Value | |||||||||
| CORPORATE BONDS — 20.7% (Continued) | ||||||||||||
| MEDICAL EQUIPMENT & DEVICES — 0.9% | ||||||||||||
| 1,000,000 | Becton Dickinson and Company | 3.3630 | 06/06/24 | $ | 978,739 | |||||||
| OIL & GAS SERVICES & EQUIPMENT — 0.9% | ||||||||||||
| 1,000,000 | Schlumberger Holdings Corporate(e) | 3.7500 | 05/01/24 | 984,205 | ||||||||
| REAL ESTATE INVESTMENT TRUSTS — 1.7% | ||||||||||||
| 1,000,000 | Ventas Realty, L.P. | 3.5000 | 04/15/24 | 977,854 | ||||||||
| 1,000,000 | Welltower, Inc. | 3.6250 | 03/15/24 | 983,489 | ||||||||
| 1,961,343 | ||||||||||||
| RETAIL - CONSUMER STAPLES — 0.9% | ||||||||||||
| 1,000,000 | 7-Eleven, Inc.(e) | 0.8000 | 02/10/24 | 969,388 | ||||||||
| SPECIALTY FINANCE — 2.6% | ||||||||||||
| 1,000,000 | Capital One Financial Corp | 3.9000 | 01/29/24 | 987,830 | ||||||||
| 2,000,000 | Federal National Mortgage Association | 5.2500 | 02/17/26 | 1,979,677 | ||||||||
| 2,967,507 | ||||||||||||
| TECHNOLOGY HARDWARE — 1.7% | ||||||||||||
| 1,000,000 | Apple, Inc. | 3.0000 | 02/09/24 | 986,202 | ||||||||
| 1,000,000 | Hewlett Packard Enterprise Company | 1.4500 | 04/01/24 | 968,156 | ||||||||
| 1,954,358 | ||||||||||||
| TECHNOLOGY SERVICES — 0.9% | ||||||||||||
| 1,000,000 | International Business Machines Corporation(c) | 3.0000 | 05/15/24 | 977,579 | ||||||||
| TELECOMMUNICATIONS — 0.9% | ||||||||||||
| 1,000,000 | Verizon Communications, Inc. | 0.7500 | 03/22/24 | 965,328 | ||||||||
| TRANSPORTATION & LOGISTICS — 1.7% | ||||||||||||
| 1,000,000 | Ryder System, Inc. | 3.6500 | 03/18/24 | 983,557 | ||||||||
| 1,000,000 | Union Pacific Corporation | 3.6460 | 02/15/24 | 988,173 | ||||||||
| 1,971,730 | ||||||||||||
| TOTAL CORPORATE BONDS (Cost $24,331,671) | 23,483,191 | |||||||||||
See accompanying notes to financial statements.
26
| QUANTIFIED TACTICAL FIXED INCOME FUND |
| SCHEDULE OF INVESTMENTS (Continued) |
| June 30, 2023 |
| Principal | Coupon Rate | |||||||||||
| Amount ($) | (%) | Maturity | Fair Value | |||||||||
| U.S. GOVERNMENT & AGENCIES — 3.6% | ||||||||||||
| GOVERNMENT OWNED, NO GUARANTEE — 1.8% | ||||||||||||
| 2,000,000 | Federal Home Loan Mortgage Corporation | 5.6250 | 03/13/26 | $ | 1,987,600 | |||||||
| GOVERNMENT SPONSORED — 1.8% | ||||||||||||
| 2,000,000 | Federal Home Loan Banks | 5.3000 | 08/15/25 | 1,983,736 | ||||||||
| TOTAL U.S. GOVERNMENT & AGENCIES (Cost $4,000,000) | 3,971,336 | |||||||||||
| CERTIFICATE OF DEPOSIT — 11.9% | ||||||||||||
| AUTOMOTIVE - 0.8% | ||||||||||||
| 1,000,000 | BMW Bank of North America | 0.5500 | 07/30/24 | 948,990 | ||||||||
| BANKING - 11.1% | ||||||||||||
| 1,000,000 | Bellco Credit Union | 5.1500 | 02/24/25 | 995,638 | ||||||||
| 1,000,000 | Charles Schwab Bank SSB | 4.7500 | 02/02/24 | 996,149 | ||||||||
| 1,000,000 | Goldman Sachs Bank USA | 0.5500 | 07/29/24 | 949,116 | ||||||||
| 1,000,000 | Greenstate Credit Union | 0.5000 | 07/19/24 | 949,320 | ||||||||
| 1,000,000 | Local Government Federal Credit Union | 4.9000 | 02/12/24 | 997,509 | ||||||||
| 1,000,000 | Sallie Mae Bank | 0.5500 | 07/22/24 | 948,967 | ||||||||
| 1,000,000 | State Bank of India | 0.6000 | 08/30/24 | 945,300 | ||||||||
| 1,000,000 | Synchrony Bank | 0.6500 | 09/17/24 | 944,042 | ||||||||
| 1,000,000 | Texas Exchange Bank SSB | 0.5000 | 07/09/24 | 950,605 | ||||||||
| 1,000,000 | Toyota Financial Savings Bank | 0.5500 | 08/05/24 | 948,238 | ||||||||
| 1,000,000 | UBS Bank USA | 0.5500 | 08/12/24 | 946,920 | ||||||||
| 1,000,000 | Valley Strong Credit Union | 5.1000 | 02/10/25 | 994,990 | ||||||||
| 1,000,000 | Wells Fargo Bank NA | 4.7500 | 02/06/24 | 996,084 | ||||||||
| 12,562,878 | ||||||||||||
| TOTAL CERTIFICATE OF DEPOSIT (Cost $13,998,864) | 13,511,868 | |||||||||||
See accompanying notes to financial statements.
27
| QUANTIFIED TACTICAL FIXED INCOME FUND |
| SCHEDULE OF INVESTMENTS (Continued) |
| June 30, 2023 |
| Shares | Fair Value | |||||||
| SHORT-TERM INVESTMENTS — 37.0% | ||||||||
| MONEY MARKET FUNDS - 37.0% | ||||||||
| 20,956,664 | Fidelity Government Portfolio, Class I, 4.98%(b) | $ | 20,956,664 | |||||
| 20,956,663 | First American Government Obligations Fund, Class Z, 4.97%(b) | 20,956,663 | ||||||
| TOTAL MONEY MARKET FUNDS (Cost $41,913,327) | 41,913,327 | |||||||
| TOTAL SHORT-TERM INVESTMENTS (Cost $41,913,327) | 41,913,327 | |||||||
| Units | ||||||||
| COLLATERAL FOR SECURITIES LOANED — 0.8% | ||||||||
| 930,320 | Mount Vernon Liquid Assets Portfolio, LLC, 5.28%(b),(d),(f) | 930,320 | ||||||
| TOTAL COLLATERAL FOR SECURITIES LOANED (Cost $930,320) | ||||||||
| TOTAL INVESTMENTS – 74.0% (Cost $85,205,167) | $ | 83,840,924 | ||||||
| OTHER ASSETS IN EXCESS OF LIABILITIES- 26.0% | 29,474,545 | |||||||
| NET ASSETS - 100.0% | $ | 113,315,469 | ||||||
| OPEN FUTURES CONTRACTS | ||||||||||||||
| Number of Contracts | Open Short Futures Contracts | Expiration | Notional Amount | Unrealized Appreciation | ||||||||||
| 457 | Ultra U.S. Treasury Bond Futures | 09/20/2023 | $ | 62,251,992 | $ | 65,281 | ||||||||
| TOTAL FUTURES CONTRACTS | ||||||||||||||
| ETF | - Exchange-Traded Fund |
| LP | - Limited Partnership |
| S/A | - Société Anonyme |
| (a) | Percentage rounds to less than 0.1%. |
| (b) | Rate disclosed is the seven-day effective yield as of June 30, 2023. |
| (c) | All or a portion of the security is on loan. Total loaned securities had a value of $910,520 at June 30, 2023. |
| (d) | Security purchased with cash proceeds of securities lending collateral. |
| (e) | Security exempt from registration under Rule 144A or Section 4(2) of the Securities Act of 1933. The security may be resold in transactions exempt from registration, normally to qualified institutional buyers. As of June 30, 2023 the total market value of 144A securities is $1,953,593 or 1.7% of net assets. |
| (f) | Investment is valued using net asset value per share as a practical expedient. |
See accompanying notes to financial statements.
28
| Quantified Evolution Plus Fund |
| Portfolio Review (Unaudited) |
| June 30, 2023 |
The Fund’s performance figures* for the periods ended June 30, 2023, as compared to its benchmark:
| Since Inception | |||
| One Year | Three Year | September 30, 2019 | |
| Quantified Evolution Plus Fund - Investor Class | (6.46)% | (0.90)% | (3.72)% |
| S&P 500 Total Return Index ** | 19.59% | 14.60% | 13.18% |
Comparison of Change in Value of a $10,000 Investment.
Since Inception through June 30, 2023 +
| + | Inception date is September 30, 2019. |
| * | The performance data quoted is historical. Past performance is no guarantee of future results. Current performance may be higher or lower than the performance data quoted. The principal value and investment return of an investment will fluctuate so that your shares, when redeemed, may be worth more or less than their original cost. The returns shown do not reflect the deduction of taxes that a shareholder would pay on Fund distributions or on the redemptions of Fund shares. The Fund’s total annual fund operating expense ratio, as provided in the Fund’s prospectus dated November 1, 2022, was 1.69% for Investor Class shares. For performance information current to the most recent month-end, please call 1-855-647-8268. Investors should consider the investment objectives, risks, and charges and expenses of the Fund carefully before investing. The Fund’s prospectus and summary prospectus contain these as well as other information about the Fund and should be read carefully before investing. A prospectus or summary prospectus may be obtained by calling 1-855-647-8268. |
| ** | The S&P 500 Total Return Index is an unmanaged composite of 500 large capitalization companies and includes the reinvestment of dividends. This index is widely used by professional investors as a performance benchmark for large-cap stocks. Investors may not invest in an index directly; unlike the Fund’s returns, the index does not reflect any fees or expenses. |
| Portfolio holdings by types of investments as of June 30, 2023 are as follows: | ||||
| Holdings by Type of Investment: ^ | % of Net Assets | |||
| Certificate of Deposit | 8.1 | % | ||
| Corporate Bond | 2.0 | % | ||
| Exchange-Traded Fund: | ||||
| Equity | 0.4 | % | ||
| U.S. Government & Agencies | 4.0 | % | ||
| Money Market Funds | 59.4 | % | ||
| Other Assets in Excess of Liabilities | 26.1 | % | ||
| 100.0 | % | |||
| ^ | The Holdings by Type of Investment detail does not include derivative exposure. |
Please refer to the Consolidated Schedule of Investments in this annual report for a detailed listing of the Fund’s holdings.
29
| QUANTIFIED EVOLUTION PLUS FUND |
| CONSOLIDATED SCHEDULE OF INVESTMENTS |
| June 30, 2023 |
| Shares | Fair Value | |||||||
| EXCHANGE-TRADED FUND — 0.4% | ||||||||
| EQUITY - 0.4% | ||||||||
| 450 | SPDR S&P 500 ETF Trust(a) | $ | 199,476 | |||||
| TOTAL EXCHANGE-TRADED FUND (Cost $196,469) | 199,476 | |||||||
| Principal | Coupon Rate | |||||||||||
| Amount ($) | (%) | Maturity | ||||||||||
| CORPORATE BOND — 2.0% | ||||||||||||
| SPECIALTY FINANCE — 2.0% | ||||||||||||
| 1,000,000 | Federal National Mortgage Association | 5.2500 | 02/17/26 | 989,838 | ||||||||
| TOTAL CORPORATE BOND (Cost $1,000,000) | 989,838 | |||||||||||
| U.S. GOVERNMENT & AGENCIES — 4.0% | ||||||||||||
| GOVERNMENT OWNED, NO GUARANTEE — 2.0% | ||||||||||||
| 1,000,000 | Federal Home Loan Mortgage Corporation | 5.3000 | 02/17/26 | 990,438 | ||||||||
| GOVERNMENT SPONSORED — 2.0% | ||||||||||||
| 1,000,000 | Federal Home Loan Banks | 5.6250 | 03/09/26 | 993,816 | ||||||||
| TOTAL U.S. GOVERNMENT & AGENCIES (Cost $2,000,000) | 1,984,254 | |||||||||||
| CERTIFICATE OF DEPOSIT — 8.1% | ||||||||||||
| BANKING - 8.1% | ||||||||||||
| 1,000,000 | Charles Schwab Bank SSB | 4.7500 | 02/02/24 | 996,150 | ||||||||
| 1,000,000 | Local Government Federal Credit Union | 4.9000 | 02/12/24 | 997,510 | ||||||||
| 1,000,000 | Valley Strong Credit Union | 5.1000 | 02/10/25 | 994,990 | ||||||||
| 1,000,000 | Wells Fargo Bank NA | 4.7500 | 02/06/24 | 996,084 | ||||||||
| 3,984,734 | ||||||||||||
| TOTAL CERTIFICATE OF DEPOSIT (Cost $4,000,000) | 3,984,734 | |||||||||||
See accompanying notes to financial statements.
30
| QUANTIFIED EVOLUTION PLUS FUND |
| CONSOLIDATED SCHEDULE OF INVESTMENTS (Continued) |
| June 30, 2023 |
| Shares | Fair Value | |||||||
| SHORT-TERM INVESTMENTS — 59.4% | ||||||||
| MONEY MARKET FUNDS – 59.4% | ||||||||
| 11,930,443 | Fidelity Government Portfolio, Class I, 4.98%(b) | $ | 11,930,443 | |||||
| 11,930,442 | First American Government Obligations Fund, Class Z, 4.97%(b) | 11,930,442 | ||||||
| 5,409,317 | First American Government Obligations Fund Class X, 5.01%(b), (c) | 5,409,317 | ||||||
| TOTAL MONEY MARKET FUNDS (Cost $29,270,202) | 29,270,202 | |||||||
| TOTAL SHORT-TERM INVESTMENTS (Cost $29,270,202) | 29,270,202 | |||||||
| TOTAL INVESTMENTS – 73.9% (Cost $36,466,671) | $ | 36,428,504 | ||||||
| OTHER ASSETS IN EXCESS OF LIABILITIES- 26.1% | 12,865,353 | |||||||
| NET ASSETS - 100.0% | $ | 49,293,857 | ||||||
| OPEN FUTURES CONTRACTS | ||||||||||||||
| Number of Contracts | Open Long Futures Contracts | Expiration | Notional Amount | Unrealized Appreciation | ||||||||||
| 87 | CME E-Mini Standard & Poor’s 500 Index Futures | 09/15/2023 | $ | 19,523,888 | $ | 250,313 | ||||||||
| TOTAL FUTURES CONTRACTS | ||||||||||||||
| ETF | - Exchange-Traded Fund |
| SPDR | - Standard & Poor’s Depositary Receipt |
| (a) | Non-income producing security. |
| (b) | Rate disclosed is the seven-day effective yield as of June 30, 2023. |
| (c) | All or a portion of this investment is a holding of the QEPF Fund Limited. |
See accompanying notes to financial statements.
31
| QUANTIFIED EVOLUTION PLUS FUND |
| CONSOLIDATED SCHEDULE OF INVESTMENTS (Continued) |
| June 30, 2023 |
| TOTAL RETURN SWAPS | ||||||||||||||||||
| Notional Amount at | Termination | Unrealized Appreciation | ||||||||||||||||
| Number of Shares | Reference Entity | June 30, 2023 | Interest Rate Payable (1) | Date | Counterparty | (Depreciation) | ||||||||||||
| Long Position: | ||||||||||||||||||
| 1,136,800 | iShares MSCI Emerging Markets ETF | $ | 44,971,808 | USD SOFR plus 35 bp | 7/18/2024 | BRC | $ | (652,757 | ) | |||||||||
| 4,700 | iShares MSCI Emerging Markets ETF | 185,932 | USD SOFR plus 35 bp | 7/19/2024 | BRC | (1,939 | ) | |||||||||||
| 3,900 | iShares MSCI Emerging Markets ETF | 154,284 | USD SOFR plus 35 bp | 7/25/2024 | BRC | (228 | ) | |||||||||||
| 3,000 | iShares MSCI Emerging Markets ETF | 118,680 | USD SOFR plus 35 bp | 7/29/2024 | BRC | 237 | ||||||||||||
| 24,400 | iShares MSCI Emerging Markets ETF | 965,264 | USD SOFR plus 35 bp | 8/1/2024 | BRC | 635 | ||||||||||||
| 27,600 | Vanguard European Stock Index Fund ETF | 1,702,920 | USD SOFR plus 35 bp | 5/30/2024 | BRC | (29,909 | ) | |||||||||||
| 93,300 | Vanguard European Stock Index Fund ETF | 5,756,610 | USD SOFR plus 35 bp | 6/13/2024 | BRC | (45,412 | ) | |||||||||||
| 800 | Vanguard European Stock Index Fund ETF | 49,360 | USD SOFR plus 35 bp | 6/14/2024 | BRC | 93 | ||||||||||||
| 1,400 | Vanguard European Stock Index Fund ETF | 86,380 | USD SOFR plus 35 bp | 6/21/2024 | BRC | 894 | ||||||||||||
| 2,100 | Vanguard European Stock Index Fund ETF | 129,570 | USD SOFR plus 35 bp | 6/24/2024 | BRC | 3,437 | ||||||||||||
| 1,000 | Vanguard European Stock Index Fund ETF | 61,700 | USD SOFR plus 35 bp | 6/27/2024 | BRC | 1,858 | ||||||||||||
| 1,100 | Vanguard European Stock Index Fund ETF | 67,870 | USD SOFR plus 35 bp | 6/28/2024 | BRC | 2,835 | ||||||||||||
| 400 | Vanguard European Stock Index Fund ETF | 24,680 | USD SOFR plus 35 bp | 6/7/2024 | BRC | (328 | ) | |||||||||||
| 16,000 | Vanguard European Stock Index Fund ETF | 987,200 | USD SOFR plus 35 bp | 7/11/2024 | BRC | 14,128 | ||||||||||||
| 292,600 | Vanguard European Stock Index Fund ETF | 18,053,420 | USD SOFR plus 35 bp | 7/18/2024 | BRC | 69,816 | ||||||||||||
| 400 | Vanguard European Stock Index Fund ETF | 24,680 | USD SOFR plus 35 bp | 7/19/2024 | BRC | 115 | ||||||||||||
| 61,400 | Vanguard European Stock Index Fund ETF | 3,788,380 | USD SOFR plus 35 bp | 7/2/2024 | BRC | 98,896 | ||||||||||||
| 2,700 | Vanguard European Stock Index Fund ETF | 166,590 | USD SOFR plus 35 bp | 7/25/2024 | BRC | 3,072 | ||||||||||||
| 5,400 | Vanguard European Stock Index Fund ETF | 333,180 | USD SOFR plus 35 bp | 7/3/2024 | BRC | 5,823 | ||||||||||||
| 600 | Vanguard European Stock Index Fund ETF | 37,020 | USD SOFR plus 35 bp | 7/5/2024 | BRC | 773 | ||||||||||||
| 5,800 | Vanguard European Stock Index Fund ETF | 357,860 | USD SOFR plus 35 bp | 8/1/2024 | BRC | 613 | ||||||||||||
| Total: | $ | (527,348 | ) | |||||||||||||||
BRC - Barclays Capital
SOFR - Secured Overnight Financing Rate
| (1) | Interest rate is based upon predetermined notional amounts, which may be a multiple of the number of shares plus a specified spread. |
See accompanying notes to financial statements.
32
| Quantified Common Ground Fund |
| Portfolio Review (Unaudited) |
| June 30, 2023 |
The Fund’s performance figures* for the periods ended June 30, 2023, as compared to its benchmark:
| Since Inception | |||
| One Year | Three Year | December 27, 2019 | |
| Quantified Common Ground Fund - Investor Class | 1.39% | 14.44% | 10.16% |
| S&P Composite 1500 Total Return Index ** | 19.24% | 14.67% | 11.02% |
Comparison of Change in Value of a $10,000 Investment.
Since Inception through June 30, 2023 +
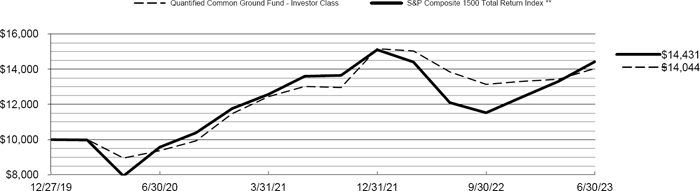
| + | Inception date is December 27, 2019. |
| * | The performance data quoted is historical. Past performance is no guarantee of future results. Current performance may be higher or lower than the performance data quoted. The principal value and investment return of an investment will fluctuate so that your shares, when redeemed, may be worth more or less than their original cost. The returns shown do not reflect the deduction of taxes that a shareholder would pay on Fund distributions or on the redemptions of Fund shares. The Fund’s total annual fund operating expense ratio, as provided in the Fund’s prospectus dated November 1, 2022, was 1.71% for Investor Class shares. For performance information current to the most recent month-end, please call 1-855-647-8268. Investors should consider the investment objectives, risks, and charges and expenses of the Fund carefully before investing. The Fund’s prospectus and summary prospectus contain these as well as other information about the Fund and should be read carefully before investing. A prospectus or summary prospectus may be obtained by calling 1-855-647-8268. |
| ** | The S&P Composite 1500® Total Return Index combines three leading indices, the S&P 500® Total Return Index, the S&P MidCap 400®, and the S&P SmallCap 600®, to cover approximately 90% of U.S. market capitalization. It is designed for investors seeking to replicate the performance of the U.S. equity market or benchmark against a representative universe of tradable stocks. Investors cannot invest directly in an index; unlike the Fund’s returns, the index does not reflect any fees or expenses. |
| Portfolio holdings by types of investments as of June 30, 2023 are as follows: | ||||
| Holdings by Type of Investment ^: | % of Net Assets | |||
| Common Stocks | 91.9 | % | ||
| Money Market Funds | 9.7 | % | ||
| Collateral For Securities Loaned | 30.1 | % | ||
| Liabilities in Excess of Other Assets | (31.7 | )% | ||
| 100.0 | % | |||
| ^ | The Holdings by type of Investment detail does not include derivative exposure. |
Please refer to the Schedule of Investments in this annual report for a detailed listing of the Fund’s holdings.
33
| QUANTIFIED COMMON GROUND FUND |
| SCHEDULE OF INVESTMENTS |
| June 30, 2023 |
| Shares | Fair Value | |||||||
| COMMON STOCKS — 91.9% | ||||||||
| AEROSPACE & DEFENSE - 1.5% | ||||||||
| 7,012 | General Dynamics Corporation | $ | 1,508,632 | |||||
| APPAREL & TEXTILE PRODUCTS - 4.8% | ||||||||
| 9,158 | Deckers Outdoor Corporation(a) | 4,832,310 | ||||||
| ASSET MANAGEMENT - 1.0% | ||||||||
| 20,771 | ODP Corporation(a) | 972,498 | ||||||
| BANKING - 3.6% | ||||||||
| 67,960 | Bancorp, Inc.(a) | 2,218,894 | ||||||
| 33,756 | Bank of Hawaii Corporation(c) | 1,391,760 | ||||||
| 3,610,654 | ||||||||
| BIOTECH & PHARMA - 5.9% | ||||||||
| 16,986 | Vertex Pharmaceuticals, Inc.(a) | 5,977,543 | ||||||
| CHEMICALS - 3.5% | ||||||||
| 5,209 | Albemarle Corporation | 1,162,076 | ||||||
| 67,854 | Mosaic Company | 2,374,890 | ||||||
| 3,536,966 | ||||||||
| CONSTRUCTION MATERIALS - 1.1% | ||||||||
| 4,711 | Vulcan Materials Company(c) | 1,062,048 | ||||||
| CONSUMER SERVICES - 1.6% | ||||||||
| 131,102 | Perdoceo Education Corporation(a) | 1,608,622 | ||||||
| CONTAINERS & PACKAGING - 3.1% | ||||||||
| 45,216 | Greif, Inc., Class A | 3,114,930 | ||||||
| FOOD - 9.6% | ||||||||
| 43,125 | Ingredion, Inc. (c) | 4,569,094 | ||||||
| 59,103 | McCormick & Company, Inc. (c) | 5,155,554 | ||||||
| 9,724,648 | ||||||||
| HEALTH CARE FACILITIES & SERVICES - 12.5% | ||||||||
| 27,192 | Cardinal Health, Inc. | 2,571,547 | ||||||
See accompanying notes to financial statements.
34
| QUANTIFIED COMMON GROUND FUND |
| SCHEDULE OF INVESTMENTS (Continued) |
| June 30, 2023 |
| Shares | Fair Value | |||||||
| COMMON STOCKS — 91.9% (Continued) | ||||||||
| HEALTH CARE FACILITIES & SERVICES - 12.5% (Continued) | ||||||||
| 34,081 | DaVita, Inc.(a) | $ | 3,424,119 | |||||
| 2,478 | Humana, Inc. | 1,107,988 | ||||||
| 158,407 | Pediatrix Medical Group, Inc.(a) | 2,250,963 | ||||||
| 40,594 | Tenet Healthcare Corporation(a) | 3,303,540 | ||||||
| 12,658,157 | ||||||||
| HOME CONSTRUCTION - 4.1% | ||||||||
| 17,623 | KB Home(c) | 911,285 | ||||||
| 56,513 | Masco Corporation | 3,242,716 | ||||||
| 4,154,001 | ||||||||
| INDUSTRIAL INTERMEDIATE PROD - 0.7% | ||||||||
| 4,424 | Chart Industries, Inc.(a) (c) | 706,911 | ||||||
| INDUSTRIAL SUPPORT SERVICES - 4.5% | ||||||||
| 47,634 | MSC Industrial Direct Company, Inc., Class A | 4,538,567 | ||||||
| INSTITUTIONAL FINANCIAL SERVICES - 0.9% | ||||||||
| 8,124 | Intercontinental Exchange, Inc. | 918,662 | ||||||
| INSURANCE – 12.0% | ||||||||
| 53,345 | Aflac, Inc.(c) | 3,723,481 | ||||||
| 87,634 | Selective Insurance Group, Inc. (c) | 8,408,483 | ||||||
| 12,131,964 | ||||||||
| INTERNET MEDIA & SERVICES - 0.5% | ||||||||
| 1,667 | Meta Platforms, Inc., Class A(a) | 478,396 | ||||||
| METALS & MINING - 0.6% | ||||||||
| 39,932 | Cleveland-Cliffs, Inc.(a) (c) | 669,260 | ||||||
| OIL & GAS PRODUCERS - 0.8% | ||||||||
| 6,735 | Marathon Petroleum Corporation | 785,301 | ||||||
| OIL & GAS SERVICES & EQUIPMENT - 2.6% | ||||||||
| 112,071 | Core Laboratories, Inc. (c) | 2,605,651 | ||||||
See accompanying notes to financial statements.
35
| QUANTIFIED COMMON GROUND FUND |
| SCHEDULE OF INVESTMENTS (Continued) |
| June 30, 2023 |
| Shares | Fair Value | |||||||
| COMMON STOCKS — 91.9% (Continued) | ||||||||
| RETAIL - DISCRETIONARY - 3.0% | ||||||||
| 22,376 | Academy Sports & Outdoors, Inc. (c) | $ | 1,209,423 | |||||
| 107,769 | Chico’s FAS, Inc.(a) | 576,564 | ||||||
| 44,824 | La-Z-Boy, Inc. (c) | 1,283,759 | ||||||
| 3,069,746 | ||||||||
| SOFTWARE - 4.6% | ||||||||
| 70,002 | Donnelley Financial Solutions, Inc.(a) | 3,187,190 | ||||||
| 6,262 | PTC, Inc.(a) | 891,083 | ||||||
| 967 | ServiceNow, Inc.(a) | 543,425 | ||||||
| 4,621,698 | ||||||||
| SPECIALTY FINANCE - 7.6% | ||||||||
| 329,823 | MGIC Investment Corporation | 5,207,906 | ||||||
| 77,329 | PROG Holdings, Inc.(a) (c) | 2,483,807 | ||||||
| 7,691,713 | ||||||||
| STEEL - 1.4% | ||||||||
| 13,618 | Commercial Metals Company | 717,124 | ||||||
| 4,259 | Nucor Corporation(c) | 698,391 | ||||||
| 1,415,515 | ||||||||
| TECHNOLOGY HARDWARE - 0.4% | ||||||||
| 2,642 | Arista Networks, Inc.(a) | 428,163 | ||||||
| TOTAL COMMON STOCKS (Cost $88,272,112) | 92,822,556 | |||||||
| SHORT-TERM INVESTMENTS — 9.7% | ||||||||
| MONEY MARKET FUNDS - 9.7% | ||||||||
| 4,884,650 | Fidelity Government Portfolio, Class I, 4.98%(b) | 4,884,650 | ||||||
| 4,884,651 | First American Government Obligations Fund, Class Z, 4.97%(b) | 4,884,651 | ||||||
| TOTAL MONEY MARKET FUNDS (Cost $9,769,301) | 9,769,301 | |||||||
| TOTAL SHORT-TERM INVESTMENTS (Cost $9,769,301) | 9,769,301 | |||||||
See accompanying notes to financial statements.
36
| QUANTIFIED COMMON GROUND FUND |
| SCHEDULE OF INVESTMENTS (Continued) |
| June 30, 2023 |
| Units | Fair Value | |||||||
| COLLATERAL FOR SECURITIES LOANED — 30.1% | ||||||||
| 30,381,715 | Mount Vernon Liquid Assets Portfolio, LLC, 5.28%(b),(d),(e) | 30,381,715 | ||||||
| TOTAL COLLATERAL FOR SECURITIES LOANED (Cost $30,381,715) | ||||||||
| TOTAL INVESTMENTS – 131.7% (Cost $128,423,128) | $ | 132,973,572 | ||||||
| LIABILITIES IN EXCESS OF OTHER ASSETS - (31.7)% | (31,981,832 | ) | ||||||
| NET ASSETS - 100.0% | $ | 100,991,740 | ||||||
| (a) | Non-income producing security. |
| (b) | Rate disclosed is the seven-day effective yield as of June 30, 2023. |
| (c) | All or a portion of the security is on loan. Total loaned securities had a value of $29,568,797 at June 30, 2023. |
| (d) | Security purchased with cash proceeds of securities lending collateral. |
| (e) | Investment is valued using net asset value per share as a practical expedient. |
See accompanying notes to financial statements.
37
| Quantified Tactical Sectors Fund |
| Portfolio Review (Unaudited) |
| June 30, 2023 |
The Fund’s performance figures* for the periods ended June 30, 2023, as compared to its benchmark:
| Since Inception | ||
| One Year | March 4, 2021 | |
| Quantified Tactical Sectors Fund - Investor Class | 14.58% | (14.70)% |
| S&P 500 Total Return Index ** | 19.59% | 9.11% |
Comparison of Change in Value of a $10,000 Investment.
Since Inception through June 30, 2023 +
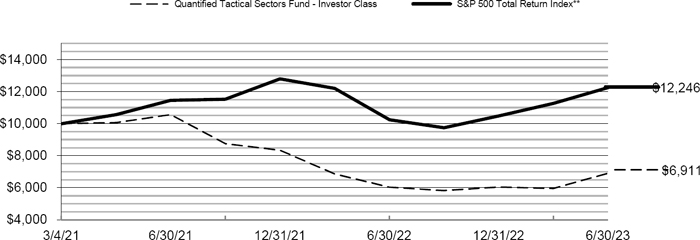
| + | Inception date is March 4, 2021. |
| * | The performance data quoted is historical. Past performance is no guarantee of future results. Current performance may be higher or lower than the performance data quoted. The principal value and investment return of an investment will fluctuate so that your shares, when redeemed, may be worth more or less than their original cost. The returns shown do not reflect the deduction of taxes that a shareholder would pay on Fund distributions or on the redemptions of Fund shares. The Fund’s total annual fund operating expense ratio, as provided in the Fund’s prospectus dated November 1, 2022 was 1.75% for Investor Class shares. For performance information current to the most recent month-end, please call 1-855-647-8268. Investors should consider the investment objectives, risks, and charges and expenses of the Fund carefully before investing. The Fund’s prospectus and summary prospectus contain these as well as other information about the Fund and should be read carefully before investing. A prospectus or summary prospectus may be obtained by calling 1-855-647-8268. |
| ** | The S&P 500 Total Return Index is an unmanaged composite of 500 large capitalization companies and includes the reinvestment of dividends. This index is widely used by professional investors as a performance benchmark for large-cap stocks. Investors may not invest in an index directly; unlike the Fund’s returns, the index does not reflect any fees or expenses. |
| Portfolio holdings by types of investments as of June 30, 2023 are as follows: | ||||
| Holdings by Type of Investment ^: | % of Net Assets | |||
| Exchange-Traded Fund | ||||
| Equity | 80.9 | % | ||
| Money Market Funds | 20.7 | % | ||
| Collateral For Securities Loaned | 27.8 | % | ||
| Liabilities in Excess of Other Assets | (29.4 | )% | ||
| 100.0 | % | |||
| ^ | The Holdings by type of Investment detail does not include derivative exposure. |
Please refer to the Schedule of Investments in this annual report for a detailed listing of the Fund’s holdings.
38
| QUANTIFIED TACTICAL SECTORS FUND |
| SCHEDULE OF INVESTMENTS |
| June 30, 2023 |
| Shares | Fair Value | |||||||
| EXCHANGE-TRADED FUNDS — 80.9% | ||||||||
| EQUITY - 80.9% | ||||||||
| 83,705 | Consumer Discretionary Select Sector SPDR Fund(a) | $ | 14,213,946 | |||||
| 31,441 | SPDR S&P 500 ETF Trust(a) | 13,937,166 | ||||||
| 81,871 | Technology Select Sector SPDR Fund(a) | 14,234,092 | ||||||
| 32,173 | Vanguard Information Technology ETF(a) | 14,225,614 | ||||||
| 56,610,818 | ||||||||
| TOTAL EXCHANGE-TRADED FUNDS (Cost $48,817,661) | 56,610,818 | |||||||
| SHORT-TERM INVESTMENTS — 20.7% | ||||||||
| MONEY MARKET FUNDS - 20.7% | ||||||||
| 7,231,636 | Fidelity Government Portfolio, Class I, 4.98%(b)(d) | 7,231,636 | ||||||
| 7,231,635 | First American Government Obligations Fund, Class Z, 4.97%(b) | 7,231,635 | ||||||
| TOTAL MONEY MARKET FUNDS (Cost $14,463,271) | 14,463,271 | |||||||
| TOTAL SHORT-TERM INVESTMENTS (Cost $14,463,271) | 14,463,271 | |||||||
| Units | ||||||||
| COLLATERAL FOR SECURITIES LOANED — 27.8% | ||||||||
| 19,442,337 | Mount Vernon Liquid Assets Portfolio, LLC, 5.28%(b),(c),(d),(e) | 19,442,337 | ||||||
| TOTAL COLLATERAL FOR SECURITIES LOANED (Cost $19,442,337) | ||||||||
| TOTAL INVESTMENTS – 129.4% (Cost $82,723,269) | $ | 90,516,426 | ||||||
| LIABILITIES IN EXCESS OF OTHER ASSETS - (29.4)% | (20,564,812 | ) | ||||||
| NET ASSETS - 100.0% | $ | 69,951,614 | ||||||
| ETF | - Exchange-Traded Fund |
| SPDR | - Standard & Poor’s Depositary Receipt |
| (a) | All or a portion of the security is on loan. Total loaned securities had a value of $19,342,235 at June 30, 2023. |
| (b) | Rate disclosed is the seven-day effective yield as of June 30, 2023. |
| (c) | Security purchased with cash proceeds of securities lending collateral. |
| (d) | A portion of the investment is held as collateral for open swap contracts. |
| (e) | Investment is valued using net asset value per share as a practical expedient. |
See accompanying notes to financial statements.
39
| QUANTIFIED TACTICAL SECTORS FUND |
| SCHEDULE OF INVESTMENTS (Continued) |
| June 30, 2023 |
| TOTAL RETURN SWAPS | ||||||||||||||||||
| Number of Shares | Reference Entity | Notional Amount at June 30, 2023 | Interest Rate Payable (1) | Termination Date | Counterparty | Unrealized Appreciation | ||||||||||||
| Long Position: | ||||||||||||||||||
| 69,720 | Consumer Discretionary Select Sector SPDR Fund | 11,839,153 | USD SOFR plus 35 bp | 6/21/2024 | BRC | $ | 1,360,100 | |||||||||||
| 5,800 | Consumer Discretionary Select Sector SPDR Fund | 984,898 | USD SOFR plus 35 bp | 8/1/2024 | BRC | 14,734 | ||||||||||||
| 24,470 | SPDR S&P 500 ETF Trust | 10,847,062 | USD SOFR plus 35 bp | 6/17/2024 | BRC | 676,801 | ||||||||||||
| 720 | SPDR S&P 500 ETF Trust | 319,162 | USD SOFR plus 35 bp | 6/7/2024 | BRC | 14,696 | ||||||||||||
| 3,690 | SPDR S&P 500 ETF Trust | 1,635,703 | USD SOFR plus 35 bp | 8/1/2024 | BRC | 22,219 | ||||||||||||
| 70,610 | Technology Select Sector SPDR Fund | 12,276,255 | USD SOFR plus 35 bp | 5/2/2024 | BRC | 1,529,472 | ||||||||||||
| 27,620 | Vanguard Information Technology Index Fund ETF | 12,212,459 | USD SOFR plus 35 bp | 5/2/2024 | BRC | 1,470,104 | ||||||||||||
| Total: | $ | 5,088,126 | ||||||||||||||||
BRC - Barclays Capital
SOFR - Secured Overnight Financing Rate
| (1) | Interest rate is based upon predetermined notional amounts, which may be a multiple of the number of shares plus a specified spread. |
See accompanying notes to financial statements.
40
| Quantified Rising Dividend Tactical Fund |
| Portfolio Review (Unaudited) |
| June 30, 2023 |
The Fund’s performance figures* for the periods ended June 30, 2023, as compared to its benchmark:
| Since Inception | ||
| One Year | April 14, 2021 | |
| Quantified Rising Dividend Tactical Fund - Investor Class | (7.28)% | (9.63)% |
| S&P 500 Total Return Index ** | 19.59% | 5.13% |
Comparison of Change in Value of a $10,000 Investment.
Since Inception through June 30, 2023 +
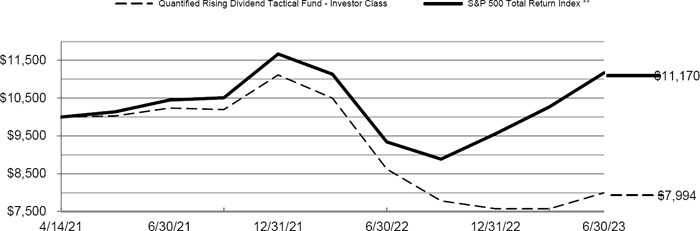
| + | Inception date is April 14, 2021. |
| * | The performance data quoted is historical. Past performance is no guarantee of future results. Current performance may be higher or lower than the performance data quoted. The principal value and investment return of an investment will fluctuate so that your shares, when redeemed, may be worth more or less than their original cost. The returns shown do not reflect the deduction of taxes that a shareholder would pay on Fund distributions or on the redemptions of Fund shares. The Fund’s total annual fund operating expense ratio, as provided in the Fund’s prospectus dated November 1, 2022 was 1.76% for Investor Class shares. For performance information current to the most recent month-end, please call 1-855-647-8268. Investors should consider the investment objectives, risks, and charges and expenses of the Fund carefully before investing. The Fund’s prospectus and summary prospectus contain these as well as other information about the Fund and should be read carefully before investing. A prospectus or summary prospectus may be obtained by calling 1-855-647-8268. |
| ** | The S&P 500 Total Return Index is an unmanaged composite of 500 large capitalization companies and includes the reinvestment of dividends. This index is widely used by professional investors as a performance benchmark for large-cap stocks. Investors may not invest in an index directly; unlike the Fund’s returns, the index does not reflect any fees or expenses. |
| Portfolio holdings by types of investments as of June 30, 2023 are as follows: | ||||
| Holdings by Type of Investment ^: | % of Net Assets | |||
| Exchange-Traded Funds | ||||
| Equity | 86.6 | % | ||
| Money Market Funds | 11.9 | % | ||
| Other Assets in Excess of Liabilities | 1.5 | % | ||
| 100.0 | % | |||
| ^ | The Holdings by type of Investment detail does not include derivative exposure. |
Please refer to the Schedule of Investments in this annual report for a detailed listing of the Fund’s holdings.
41
| QUANTIFIED RISING DIVIDEND TACTICAL FUND |
| SCHEDULE OF INVESTMENTS |
| June 30, 2023 |
| Shares | Fair Value | |||||||
| EXCHANGE-TRADED FUNDS — 86.6% | ||||||||
| EQUITY - 86.6% | ||||||||
| 10,986 | Invesco QQQ Trust Series 1 | $ | 4,058,448 | |||||
| 36,542 | Invesco S&P 500 Equal Weight ETF | 5,468,145 | ||||||
| 87,385 | Invesco S&P 500 Low Volatility ETF | 5,488,652 | ||||||
| 39,719 | Vanguard Dividend Appreciation ETF | 6,451,557 | ||||||
| 65,385 | Vanguard International Dividend Appreciation ETF | 4,909,760 | ||||||
| 26,376,562 | ||||||||
| TOTAL EXCHANGE-TRADED FUNDS (Cost $25,226,887) | 26,376,562 | |||||||
| SHORT-TERM INVESTMENTS — 11.9% | ||||||||
| MONEY MARKET FUNDS - 11.9% | ||||||||
| 1,808,484 | Fidelity Government Portfolio, Class I, 4.98%(a) | 1,808,484 | ||||||
| 1,808,484 | First American Government Obligations Fund, Class Z, 4.97%(a) | 1,808,484 | ||||||
| TOTAL MONEY MARKET FUNDS (Cost $3,616,968) | 3,616,968 | |||||||
| TOTAL SHORT-TERM INVESTMENTS (Cost $3,616,968) | 3,616,968 | |||||||
| TOTAL INVESTMENTS - 98.5% (Cost $28,843,855) | $ | 29,993,530 | ||||||
| OTHER ASSETS IN EXCESS OF LIABILITIES- 1.5% | 452,833 | |||||||
| NET ASSETS - 100.0% | $ | 30,446,363 | ||||||
ETF - Exchange-Traded Fund
| (a) | Rate disclosed is the seven-day effective yield as of June 30, 2023. |
| TOTAL RETURN SWAPS | ||||||||||||||||||
| Number of Shares | Reference Entity | Notional Amount at June 30, 2023 | Interest Rate Payable (1) | Termination Date | Counterparty | Unrealized Appreciation (Depreciation) | ||||||||||||
| Long Position: | ||||||||||||||||||
| 1,690 | Invesco QQQ Trust Series 1 | $ | 624,320 | USD SOFR plus 35 bp | 5/2/2024 | BRC | $ | 78,387 | ||||||||||
| 85,390 | Invesco S&P 500 Eql Wght ETF | 12,777,760 | USD SOFR plus 35 bp | 5/2/2024 | BRC | 313,561 | ||||||||||||
| 12,220 | Invesco S&P 500 Low Volatility ETF | 767,538 | USD SOFR plus 35 bp | 5/2/2024 | BRC | (4,421 | ) | |||||||||||
| 6,100 | Vanguard Dividend Appreciation Index Fund ETF | 990,823 | USD SOFR plus 35 bp | 5/2/2024 | BRC | 37,418 | ||||||||||||
| 10,070 | Vanguard Intlernational Dividend Appreciation Index Fund ETF 756,156 | USD SOFR plus 35 bp | 5/2/2024 | BRC | 7,413 | |||||||||||||
| Total: | $ | 432,358 | ||||||||||||||||
BRC - Barclays Capital
SOFR - Secured Overnight Financing Rate
| (1) | Interest rate is based upon predetermined notional amounts, which may be a multiple of the number of shares plus a specified spread. |
See accompanying notes to financial statements.
42
| Quantified Government Income Tactical Fund |
| Portfolio Review (Unaudited) |
| June 30, 2023 |
The Fund’s performance figures* for the periods ended June 30, 2023, as compared to its benchmark:
| Since Inception | ||
| One Year | April 15, 2021 | |
| Quantified Government Income Tactical Fund - Investor Class | (14.59)% | (8.68)% |
| Bloomberg U.S. Aggregate Bond Index ** | (0.94)% | (4.88)% |
Comparison of Change in Value of a $10,000 Investment.
Since Inception through June 30, 2023 +
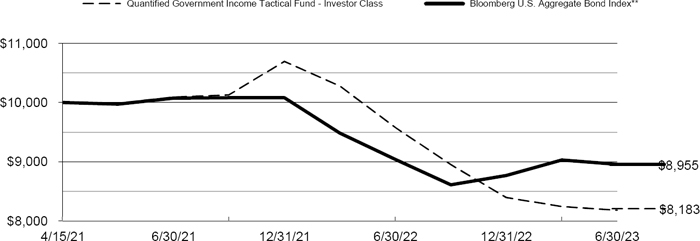
| + | Inception date is April 15, 2021. |
| * | The performance data quoted is historical. Past performance is no guarantee of future results. Current performance may be higher or lower than the performance data quoted. The principal value and investment return of an investment will fluctuate so that your shares, when redeemed, may be worth more or less than their original cost. The returns shown do not reflect the deduction of taxes that a shareholder would pay on Fund distributions or on the redemptions of Fund shares. The Fund’s total annual fund operating expense ratio, as provided in the Fund’s prospectus dated November 1, 2022 was 1.71% for Investor Class shares. For performance information current to the most recent month-end, please call 1-855-647-8268. Investors should consider the investment objectives, risks, and charges and expenses of the Fund carefully before investing. The Fund’s prospectus and summary prospectus contain these as well as other information about the Fund and should be read carefully before investing. A prospectus or summary prospectus may be obtained by calling 1-855-647-8268. |
| ** | The Bloomberg U.S. Aggregate Bond Index is an unmanaged index comprised of U.S. investment grade, fixed rate bond market securities, including government, government agency, corporate and mortgage-backed securities. Investors cannot invest directly in an index; unlike the Fund’s returns, the index does not reflect any fees or expenses. |
| Portfolio holdings by types of investments as of June 30, 2023 are as follows: | ||||
| Holdings by Type of Investment ^: | % of Net Assets | |||
| Certificate of Deposit | 9.2 | % | ||
| Corporate Bond | 2.3 | % | ||
| Exchange-Traded Fund | ||||
| Fixed Income | 0.3 | % | ||
| U.S. Government & Agencies | 4.6 | % | ||
| Money Market Funds | 78.2 | % | ||
| Other Assets in Excess of Liabilities | 5.4 | % | ||
| 100.0 | % | |||
| ^ | The Holdings by type of Investment detail does not include derivative exposure. |
Please refer to the Schedule of Investments in this annual report for a detailed listing of the Fund’s holdings.
43
| QUANTIFIED GOVERNMENT INCOME TACTICAL FUND |
| SCHEDULE OF INVESTMENTS |
| June 30, 2023 |
| Shares | Fair Value | |||||||||||
| EXCHANGE-TRADED FUND — 0.3% | ||||||||||||
| FIXED INCOME - 0.3% | ||||||||||||
| 1,200 | iShares 20+ Year Treasury Bond ETF | $ | 123,528 | |||||||||
| TOTAL EXCHANGE-TRADED FUND (Cost $123,698) | 123,528 | |||||||||||
| Principal | Coupon Rate | |||||||||||
| Amount ($) | (%) | Maturity | ||||||||||
| CORPORATE BOND — 2.3% | ||||||||||||
| SPECIALTY FINANCE — 2.3% | ||||||||||||
| 1,000,000 | Federal National Mortgage Association | 5.2500 | 02/17/26 | 989,838 | ||||||||
| TOTAL CORPORATE BOND (Cost $1,000,000) | 989,838 | |||||||||||
| U.S. GOVERNMENT & AGENCIES — 4.6% | ||||||||||||
| GOVERNMENT OWNED, NO GUARANTEE — 2.3% | ||||||||||||
| 1,000,000 | Federal Home Loan Mortgage Corporation | 5.3000 | 02/17/26 | 990,438 | ||||||||
| GOVERNMENT SPONSORED — 2.3% | ||||||||||||
| 1,000,000 | Federal Home Loan Banks | 5.6250 | 03/09/26 | 993,816 | ||||||||
| TOTAL U.S. GOVERNMENT & AGENCIES (Cost $2,000,000) | 1,984,254 | |||||||||||
| CERTIFICATE OF DEPOSIT — 9.2% | ||||||||||||
| BANKING - 9.2% | ||||||||||||
| 1,000,000 | Charles Schwab Bank SSB | 4.7500 | 02/02/24 | 996,150 | ||||||||
| 1,000,000 | Local Government Federal Credit Union | 4.9000 | 02/12/24 | 997,510 | ||||||||
| 1,000,000 | Valley Strong Credit Union | 5.1000 | 02/10/25 | 994,990 | ||||||||
| 1,000,000 | Wells Fargo Bank NA | 4.7500 | 02/06/24 | 996,084 | ||||||||
| 3,984,734 | ||||||||||||
| TOTAL CERTIFICATE OF DEPOSIT (Cost $4,000,000) | 3,984,734 | |||||||||||
See accompanying notes to financial statements.
44
| QUANTIFIED GOVERNMENT INCOME TACTICAL FUND |
| SCHEDULE OF INVESTMENTS (Continued) |
| June 30, 2023 |
| Shares | Fair Value | |||||||
| SHORT-TERM INVESTMENTS — 78.2% | ||||||||
| MONEY MARKET FUNDS - 78.2% | ||||||||
| 16,883,843 | Fidelity Government Portfolio, Class I, 4.98%(a)(b) | $ | 16,883,843 | |||||
| 16,883,843 | First American Government Obligations Fund, Class Z, 4.97%(a)(b) | 16,883,843 | ||||||
| TOTAL MONEY MARKET FUNDS (Cost $33,767,686) | 33,767,686 | |||||||
| TOTAL SHORT-TERM INVESTMENTS (Cost $33,767,686) | 33,767,686 | |||||||
| TOTAL INVESTMENTS - 94.6% (Cost $40,891,384) | $ | 40,850,040 | ||||||
| OTHER ASSETS IN EXCESS OF LIABILITIES- 5.4% | 2,345,396 | |||||||
| NET ASSETS - 100.0% | $ | 43,195,436 | ||||||
| OPEN FUTURES CONTRACTS | ||||||||||||||
| Number of Contracts | Open Short Futures Contracts | Expiration | Notional Amount | Unrealized Appreciation | ||||||||||
| 175 | Ultra U.S. Treasury Bond Futures | 09/20/2023 | $ | 23,838,290 | $ | 23,363 | ||||||||
| TOTAL FUTURES CONTRACTS | ||||||||||||||
ETF - Exchange-Traded Fund
| (a) | Rate disclosed is the seven-day effective yield as of June 30, 2023. |
| (b) | See note 10. |
See accompanying notes to financial statements.
45
| STATEMENTS OF ASSETS AND LIABILITIES |
| June 30, 2023 |
| Quantified | Quantified | Quantified | Quantified | |||||||||||||
| Managed | Market Leaders | Alternative | STF | |||||||||||||
| Income Fund | Fund | Investment Fund | Fund | |||||||||||||
| Assets: | ||||||||||||||||
| Investment securities: | ||||||||||||||||
| At cost | $ | 140,695,807 | $ | 176,016,927 | $ | 6,721,641 | $ | 155,118,317 | ||||||||
| At value (a) | $ | 141,055,693 | $ | 184,363,327 | $ | 6,847,646 | $ | 153,695,551 | ||||||||
| Cash | — | — | — | 25,776,222 | ||||||||||||
| Deposits with brokers for futures | 2,062,629 | — | 76,945 | 23,172,094 | ||||||||||||
| Receivable: | ||||||||||||||||
| Securities sold | 11,331,841 | — | — | 55,477 | ||||||||||||
| Dividends and Interest | 264,690 | 313,946 | 2,673 | 714,629 | ||||||||||||
| Unrealized appreciation on futures | 25,828 | — | 14,865 | 8,939,388 | ||||||||||||
| Fund shares sold | 697,458 | 125,813 | 199 | 45,568 | ||||||||||||
| Unrealized appreciation on swaps | — | 4,840,997 | — | — | ||||||||||||
| Prepaid expenses and other assets | 24,924 | 9,106 | 8,109 | 51,772 | ||||||||||||
| Total Assets | 155,463,063 | 189,653,189 | 6,950,437 | 212,450,701 | ||||||||||||
| Liabilities: | ||||||||||||||||
| Payables: | ||||||||||||||||
| Collateral on securities loaned | 17,870,186 | 9,223,617 | 311,924 | 1,000,000 | ||||||||||||
| Securities purchased | 3,545,116 | — | — | — | ||||||||||||
| Fund shares redeemed | 248,691 | 53,061 | 145 | 105,676 | ||||||||||||
| Unrealized depreciation on futures | 165,475 | — | — | — | ||||||||||||
| Investment advisory fees | 81,881 | 118,939 | 4,050 | 161,719 | ||||||||||||
| Payable to related parties | 55,284 | 61,749 | 13,963 | 111,898 | ||||||||||||
| Distribution (12b-1) fees | 29,484 | 39,742 | 1,393 | 40,566 | ||||||||||||
| Shareholder service fees - Investor Class | 17,679 | 23,768 | 801 | 24,230 | ||||||||||||
| Interest payable | 3,787 | — | — | — | ||||||||||||
| Due to custodian | — | — | 592 | — | ||||||||||||
| Total Liabilities | 22,017,583 | 9,520,876 | 332,868 | 1,444,089 | ||||||||||||
| Net Assets | $ | 133,445,480 | $ | 180,132,313 | $ | 6,617,569 | $ | 211,006,612 | ||||||||
| Net Assets Consist of: | ||||||||||||||||
| Capital Stock | $ | 152,305,356 | $ | 252,525,056 | $ | 9,080,152 | $ | 243,362,531 | ||||||||
| Accumulated losses | (18,859,876 | ) | (72,392,743 | ) | (2,462,583 | ) | (32,355,919 | ) | ||||||||
| Net Assets | $ | 133,445,480 | $ | 180,132,313 | $ | 6,617,569 | $ | 211,006,612 | ||||||||
| Net Asset Value Per Share | ||||||||||||||||
| Investor Class Shares: | ||||||||||||||||
| Net Assets | $ | 133,422,232 | $ | 179,967,448 | $ | 6,546,468 | $ | 210,777,504 | ||||||||
| Shares of beneficial interest outstanding (no par value; unlimited shares authorized) | 16,067,704 | 17,800,666 | 713,829 | 15,933,271 | ||||||||||||
| Net asset value, (Net Assets ÷ Shares Outstanding), offering and redemption price per share | $ | 8.30 | $ | 10.11 | $ | 9.17 | $ | 13.23 | ||||||||
| Advisor Class Shares: | ||||||||||||||||
| Net Assets | $ | 23,248 | $ | 164,865 | $ | 71,101 | $ | 229,108 | ||||||||
| Shares of beneficial interest outstanding (no par value; unlimited shares authorized) | 2,785 | 16,660 | 7,870 | 18,285 | ||||||||||||
| Net asset value, (Net Assets ÷ Shares Outstanding), offering and redemption price per share | $ | 8.35 | $ | 9.90 | $ | 9.03 | $ | 12.53 | ||||||||
| (a) | Includes loaned securities with a value of $17,526,884, $9,169,810, $307,663 and $986,156, respectively. |
See accompanying notes to financial statements.
46
| STATEMENTS OF ASSETS AND LIABILITIES (Continued) |
| June 30, 2023 |
| Quantified | Quantified | Quantified Evolution | Quantified | |||||||||||||
| Pattern | Tactical Fixed | Plus Fund | Common | |||||||||||||
| Recognition Fund | Income Fund | (Consolidated) | Ground Fund | |||||||||||||
| Assets: | ||||||||||||||||
| Investment securities: | ||||||||||||||||
| At cost | $ | 57,032,863 | $ | 85,205,167 | $ | 36,466,671 | $ | 128,423,128 | ||||||||
| At value (a) | $ | 56,992,782 | $ | 83,840,924 | $ | 36,428,504 | $ | 132,973,572 | ||||||||
| Cash | 2,065,950 | 25,241,015 | 11,990,248 | — | ||||||||||||
| Deposits with brokers | 2,555,659 | 4,709,695 | 1,065,656 | — | ||||||||||||
| Receivable: | ||||||||||||||||
| Unrealized appreciation on futures | — | 65,281 | 250,313 | — | ||||||||||||
| Dividends and Interest | 345,681 | 517,307 | 257,783 | 101,018 | ||||||||||||
| Fund shares sold | 11,479 | 42,981 | 56,603 | 676,792 | ||||||||||||
| Unrealized appreciation on swaps | — | — | 203,225 | — | ||||||||||||
| Securities sold | 154,458 | 30,880 | — | — | ||||||||||||
| Prepaid expenses and other assets | 17,898 | 19,001 | 4,638 | 7,955 | ||||||||||||
| Total Assets | 62,143,907 | 114,467,084 | 50,256,970 | 133,759,337 | ||||||||||||
| Liabilities: | ||||||||||||||||
| Payables: | ||||||||||||||||
| Unrealized depreciation on futures | 505,027 | — | — | — | ||||||||||||
| Fund shares redeemed | 122,444 | 55,005 | 35,120 | 97,025 | ||||||||||||
| Investment advisory fees | 61,080 | 77,271 | 41,309 | 74,578 | ||||||||||||
| Payable to related parties | 29,940 | 58,110 | 30,059 | 31,274 | ||||||||||||
| Distribution (12b-1) fees | 15,270 | 19,318 | 10,327 | 18,644 | ||||||||||||
| Shareholder service fees - Investor Class | 9,162 | 11,591 | 6,196 | 11,187 | ||||||||||||
| Due to custodian | — | — | — | 41,748 | ||||||||||||
| Securities purchased | — | — | 109,529 | 2,109,758 | ||||||||||||
| Collateral on securities loaned | — | 930,320 | — | 30,381,715 | ||||||||||||
| Unrealized depreciation on swaps | — | — | 730,573 | — | ||||||||||||
| Interest payable | — | — | — | 1,668 | ||||||||||||
| Total Liabilities | 742,923 | 1,151,615 | 963,113 | 32,767,597 | ||||||||||||
| Net Assets | $ | 61,400,984 | $ | 113,315,469 | $ | 49,293,857 | $ | 100,991,740 | ||||||||
| Net Assets Consist of: | ||||||||||||||||
| Capital Stock | $ | 73,199,166 | $ | 158,437,861 | $ | 59,314,576 | $ | 119,988,230 | ||||||||
| Accumulated losses | (11,798,182 | ) | (45,122,392 | ) | (10,020,719 | ) | (18,996,490 | ) | ||||||||
| Net Assets | $ | 61,400,984 | $ | 113,315,469 | $ | 49,293,857 | $ | 100,991,740 | ||||||||
| Net Asset Value Per Share | ||||||||||||||||
| Investor Class Shares: | ||||||||||||||||
| Net Assets | $ | 61,400,984 | $ | 113,315,469 | $ | 49,293,857 | $ | 100,991,740 | ||||||||
| Shares of beneficial interest outstanding (no par value; unlimited shares authorized) | 5,465,123 | 14,331,076 | 6,614,228 | 7,707,422 | ||||||||||||
| Net asset value, (Net Assets ÷ Shares Outstanding), offering and redemption price per share | $ | 11.24 | $ | 7.91 | $ | 7.45 | $ | 13.10 | ||||||||
| (a) | Includes loaned securities with a value of $0, $910,520, $0 and $29,568,797, respectively. |
See accompanying notes to consolidated financial statements.
47
| STATEMENTS OF ASSETS AND LIABILITIES (Continued) |
| June 30, 2023 |
| Quantified | Quantified | Quantified | ||||||||||
| Tactical | Rising Dividend | Government Income | ||||||||||
| Sectors Fund | Tactical Fund | Tactical Fund | ||||||||||
| Assets: | ||||||||||||
| Investment securities: | ||||||||||||
| At cost | $ | 82,723,269 | $ | 28,843,855 | $ | 40,891,384 | ||||||
| At value (a) | $ | 90,516,426 | $ | 29,993,530 | $ | 40,850,040 | ||||||
| Deposits with brokers | — | — | 2,178,073 | |||||||||
| Receivable: | ||||||||||||
| Dividends and Interest | 104,118 | 48,560 | 197,641 | |||||||||
| Fund shares sold | 64,318 | — | 24,180 | |||||||||
| Unrealized appreciation on futures | — | — | 23,363 | |||||||||
| Unrealized appreciation on swaps | 5,088,126 | 436,779 | — | |||||||||
| Prepaid expenses and other assets | 13,115 | 16,762 | 15,303 | |||||||||
| Total Assets | 95,786,103 | 30,495,631 | 43,288,600 | |||||||||
| Liabilities: | ||||||||||||
| Payables: | ||||||||||||
| Collateral on securities loaned | 19,442,337 | — | — | |||||||||
| Securities purchased | 5,785,539 | — | 40,939 | |||||||||
| Collateral for swap contract | 500,000 | — | — | |||||||||
| Investment advisory fees | 50,634 | 24,024 | 27,370 | |||||||||
| Payable to related parties | 26,927 | 6,903 | 8,011 | |||||||||
| Distribution (12b-1) fees | 12,659 | 6,006 | 6,842 | |||||||||
| Fund shares redeemed | 8,798 | 4,310 | 5,895 | |||||||||
| Shareholder service fees - Investor Class | 7,595 | 3,604 | 4,107 | |||||||||
| Unrealized depreciation on swaps | — | 4,421 | — | |||||||||
| Total Liabilities | 25,834,489 | 49,268 | 93,164 | |||||||||
| Net Assets | $ | 69,951,614 | $ | 30,446,363 | $ | 43,195,436 | ||||||
| Net Assets Consist of: | ||||||||||||
| Capital Stock | $ | 113,413,865 | $ | 39,851,300 | $ | 55,163,149 | ||||||
| Accumulated losses | (43,462,251 | ) | (9,404,937 | ) | (11,967,713 | ) | ||||||
| Net Assets | $ | 69,951,614 | $ | 30,446,363 | $ | 43,195,436 | ||||||
| Net Asset Value Per Share | ||||||||||||
| Investor Class Shares: | ||||||||||||
| Net Assets | $ | 69,951,614 | $ | 30,446,363 | $ | 43,195,436 | ||||||
| Shares of beneficial interest outstanding (no par value; unlimited shares authorized) | 10,462,462 | 3,928,663 | 5,345,678 | |||||||||
| Net asset value, (Net Assets ÷ Shares Outstanding), offering and redemption price per share | $ | 6.69 | $ | 7.75 | $ | 8.08 | ||||||
| (a) | Includes loaned securities with a value of $19,342,235, $0, and $0, respectively. |
See accompanying notes to financial statements.
48
| STATEMENTS OF OPERATIONS |
| For the Year Ended June 30, 2023 |
| Quantified | Quantified | Quantified | Quantified | |||||||||||||
| Managed | Market Leaders | Alternative | STF | |||||||||||||
| Income Fund | Fund | Investment Fund | Fund | |||||||||||||
| Investment Income | ||||||||||||||||
| Dividends | $ | 2,813,284 | $ | 2,289,546 | $ | 337,104 | $ | 12,345 | ||||||||
| Interest | 3,280,949 | 2,483,704 | 93,224 | 3,126,348 | ||||||||||||
| Securities lending, net | 423,044 | 86,860 | 22,790 | 1,695 | ||||||||||||
| Total Investment Income | 6,517,277 | 4,860,110 | 453,118 | 3,140,388 | ||||||||||||
| Expenses | ||||||||||||||||
| Investment advisory fees | 1,220,002 | 1,691,254 | 87,611 | 1,355,001 | ||||||||||||
| Administration fees | 279,428 | 382,401 | 27,733 | 234,189 | ||||||||||||
| Distribution (12b-1) fees | ||||||||||||||||
| Investor Class | 406,615 | 563,387 | 29,035 | 338,173 | ||||||||||||
| Advisor Class | 210 | 1,458 | 674 | 2,310 | ||||||||||||
| Shareholder services fees - Investor Class | 243,969 | 338,032 | 17,421 | 202,904 | ||||||||||||
| Miscellaneous expenses | 9,000 | 9,000 | 9,000 | 9,000 | ||||||||||||
| Interest expense on line of credit | 1,672 | — | 10,519 | — | ||||||||||||
| Custody overdraft fees | — | — | 1,542 | — | ||||||||||||
| Total Operating Expenses | 2,160,896 | 2,985,532 | 183,535 | 2,141,577 | ||||||||||||
| Less: Expenses waived by the Advisor | — | — | (9,000 | ) | — | |||||||||||
| Net Expenses | 2,160,896 | 2,985,532 | 174,535 | 2,141,577 | ||||||||||||
| Net Operating Expenses | 2,160,896 | 2,985,532 | 174,535 | 2,141,577 | ||||||||||||
| Net Investment Income | 4,356,381 | 1,874,578 | 278,583 | 998,811 | ||||||||||||
| Realized and Unrealized Gain (Loss) on Investments, Futures and Swaps | ||||||||||||||||
| Net realized gain (loss) from: | ||||||||||||||||
| Investments | (5,038,432 | ) | 4,509,635 | (1,172,009 | ) | (318,433 | ) | |||||||||
| Futures | (6,696,854 | ) | — | (244,480 | ) | 15,163,494 | ||||||||||
| Swaps | — | (3,585,927 | ) | — | — | |||||||||||
| Capital gain distributions from underlying investment companies | — | — | 29,371 | — | ||||||||||||
| (11,735,286 | ) | 923,708 | (1,387,118 | ) | 14,845,061 | |||||||||||
| Net change in unrealized appreciation (depreciation) on: | ||||||||||||||||
| Investments | 613,873 | 11,537,946 | 342,585 | 596,581 | ||||||||||||
| Futures | 314,077 | — | 27,308 | 7,232,759 | ||||||||||||
| Swaps | — | 4,840,997 | — | — | ||||||||||||
| 927,950 | 16,378,943 | 369,893 | 7,829,340 | |||||||||||||
| Net Realized and Unrealized Gain (Loss) on Investments, Futures and Swaps | (10,807,336 | ) | 17,302,651 | (1,017,225 | ) | 22,674,401 | ||||||||||
| Net Increase (Decrease) in Net Assets Resulting From Operations | $ | (6,450,955 | ) | $ | 19,177,229 | $ | (738,642 | ) | $ | 23,673,212 | ||||||
See accompanying notes to financial statements.
49
| STATEMENTS OF OPERATIONS (Continued) |
| For the Year Ended June 30, 2023 |
| Quantified | Quantified | Quantified Evolution | Quantified | |||||||||||||
| Pattern | Tactical Fixed | Plus Fund | Common | |||||||||||||
| Recognition Fund | Income Fund | (Consolidated) | Ground Fund | |||||||||||||
| Investment Income | ||||||||||||||||
| Dividends | $ | 2,543 | $ | 9,664 | $ | 8,693 | $ | 1,357,222 | ||||||||
| Interest | 1,170,157 | 2,676,551 | 2,351,397 | 413,550 | ||||||||||||
| Securities lending, net | 1,276 | 4,263 | 1,611 | 17,442 | ||||||||||||
| Total Investment Income | 1,173,976 | 2,690,478 | 2,361,701 | 1,788,214 | ||||||||||||
| Expenses | ||||||||||||||||
| Investment advisory fees | 311,955 | 1,170,796 | 749,712 | 826,238 | ||||||||||||
| Distribution (12b-1) fees - Investor Class | 77,989 | 292,699 | 187,428 | 206,559 | ||||||||||||
| Administration fees | 59,703 | 202,741 | 132,280 | 138,938 | ||||||||||||
| Shareholder services fees - Investor Class | 46,793 | 175,619 | 112,457 | 123,936 | ||||||||||||
| Custody overdraft fees | — | — | 99,901 | |||||||||||||
| Interest expense on line of credit | — | — | — | 61,760 | ||||||||||||
| Miscellaneous expenses | 9,000 | 9,000 | 9,000 | 9,000 | ||||||||||||
| Total Operating Expenses | 505,440 | 1,850,855 | 1,190,877 | 1,466,332 | ||||||||||||
| Less: Expenses waived by the Advisor | (9,000 | ) | — | — | — | |||||||||||
| Net Expenses | 496,440 | 1,850,855 | 1,190,877 | 1,466,332 | ||||||||||||
| Net Operating Expenses | 496,440 | 1,850,855 | 1,190,877 | 1,466,332 | ||||||||||||
| Net Investment Income | 677,536 | 839,623 | 1,170,824 | 321,882 | ||||||||||||
| Realized and Unrealized Gain (Loss) on Investments, Futures and Swaps | ||||||||||||||||
| Net realized gain (loss) from: | ||||||||||||||||
| Investments | 11,361 | (194,655 | ) | (95,954 | ) | (12,073,142 | ) | |||||||||
| Futures | 6,942,595 | (17,382,421 | ) | (2,668,593 | ) | — | ||||||||||
| Swaps | — | (1,707,023 | ) | (286,628 | ) | — | ||||||||||
| 6,953,956 | (19,284,099 | ) | (3,051,175 | ) | (12,073,142 | ) | ||||||||||
| Net change in unrealized appreciation (depreciation) on: | ||||||||||||||||
| Investments | (26,019 | ) | 472,894 | 35,602 | 7,111,681 | |||||||||||
| Futures | (187,589 | ) | (520,205 | ) | (361,790 | ) | — | |||||||||
| Swaps | — | — | (527,348 | ) | — | |||||||||||
| (213,608 | ) | (47,311 | ) | (853,536 | ) | 7,111,681 | ||||||||||
| Net Realized and Unrealized Gain (Loss) on Investments, Futures and Swaps | 6,740,348 | (19,331,410 | ) | (3,904,711 | ) | (4,961,461 | ) | |||||||||
| Net Increase (Decrease) in Net Assets Resulting From Operations | $ | 7,417,884 | $ | (18,491,787 | ) | $ | (2,733,887 | ) | $ | (4,639,579 | ) | |||||
See accompanying notes to consolidated financial statements.
50
| STATEMENTS OF OPERATIONS (Continued) |
| For the Year Ended June 30, 2023 |
| Quantified | Quantified | Quantified | ||||||||||
| Tactical | Rising Dividend | Government Income | ||||||||||
| Sectors Fund | Tactical Fund | Tactical Fund | ||||||||||
| Investment Income | ||||||||||||
| Dividends | $ | 993,458 | $ | 391,019 | $ | 8,417 | ||||||
| Interest | 1,175,966 | 269,502 | 1,241,212 | |||||||||
| Securities lending, net | 49,472 | — | — | |||||||||
| Total Investment Income | 2,218,896 | 660,521 | 1,249,629 | |||||||||
| Expenses | ||||||||||||
| Investment advisory fees | 1,046,164 | 311,192 | 406,060 | |||||||||
| Distribution (12b-1) fees - Investor Class | 261,541 | 77,798 | 101,515 | |||||||||
| Administration fees | 183,823 | 62,251 | 77,504 | |||||||||
| Shareholder services fees - Investor Class | 156,925 | 46,679 | 60,909 | |||||||||
| Custody overdraft fees | — | 4,887 | — | |||||||||
| Miscellaneous expenses | 9,000 | 9,000 | 9,000 | |||||||||
| Total Operating Expenses | 1,657,453 | 511,807 | 654,988 | |||||||||
| Less: Expenses waived by the Advisor | — | (9,000 | ) | (9,000 | ) | |||||||
| Net Expenses | 1,657,453 | 502,807 | 645,988 | |||||||||
| Net Operating Expenses | 1,657,453 | 502,807 | 645,988 | |||||||||
| Net Investment Income | 561,443 | 157,714 | 603,641 | |||||||||
| Realized and Unrealized Gain (Loss) on Investments, Futures and Swaps | ||||||||||||
| Net realized loss from: | ||||||||||||
| Investments | (540,700 | ) | (2,400,518 | ) | (45,136 | ) | ||||||
| Futures | — | — | (7,208,223 | ) | ||||||||
| Swaps | (7,736,777 | ) | (2,425,592 | ) | — | |||||||
| (8,277,477 | ) | (4,826,110 | ) | (7,253,359 | ) | |||||||
| Net change in unrealized appreciation (depreciation) on: | ||||||||||||
| Investments | 8,484,191 | 2,071,034 | (2,239 | ) | ||||||||
| Futures | — | — | (209,223 | ) | ||||||||
| Swaps | 5,088,126 | 432,358 | — | |||||||||
| 13,572,317 | 2,503,392 | (211,462 | ) | |||||||||
| Net Realized and Unrealized Gain (Loss) on Investments, Futures and Swaps | 5,294,840 | (2,322,718 | ) | (7,464,821 | ) | |||||||
| Net Increase (Decrease) in Net Assets Resulting From Operations | $ | 5,856,283 | $ | (2,165,004 | ) | $ | (6,861,180 | ) | ||||
See accompanying notes to financial statements.
51
| STATEMENTS OF CHANGES IN NET ASSETS |
| Quantified Managed Income Fund | ||||||||
| Year Ended | Year Ended | |||||||
| June 30, 2023 | June 30, 2022 | |||||||
| INCREASE (DECREASE) IN NET ASSETS FROM: | ||||||||
| Operations | ||||||||
| Net investment income | $ | 4,356,381 | $ | 1,204,742 | ||||
| Net realized loss from investments and futures | (11,735,286 | ) | (1,224,451 | ) | ||||
| Net change in unrealized appreciation (depreciation) on investments and futures | 927,950 | (1,835,652 | ) | |||||
| Net Decrease in Net Assets Resulting From Operations | (6,450,955 | ) | (1,855,361 | ) | ||||
| Distributions to Shareholders from: | ||||||||
| Investor Class | (951,437 | ) | (983,577 | ) | ||||
| Total Distributions to Shareholders | (951,437 | ) | (983,577 | ) | ||||
| Shares of Beneficial Interest: | ||||||||
| Proceeds from shares sold | ||||||||
| Investor Class | 697,460,323 | 836,454,520 | ||||||
| Advisor Class | 6,885 | 496 | ||||||
| Net asset value of shares issued in reinvestment of distributions | ||||||||
| Investor Class | 950,867 | 983,336 | ||||||
| Payments for shares redeemed | ||||||||
| Investor Class | (765,786,001 | ) | (750,843,259 | ) | ||||
| Advisor Class | (45 | ) | (9,931 | ) | ||||
| Total Increase (Decrease) in Net Assets From Shares of Beneficial Interest | (67,367,971 | ) | 86,585,162 | |||||
| Total Increase (Decrease) in Net Assets | (74,770,363 | ) | 83,746,224 | |||||
| Net Assets: | ||||||||
| Beginning of Year | 208,215,843 | 124,469,619 | ||||||
| End of Year | $ | 133,445,480 | $ | 208,215,843 | ||||
| Share Activity | ||||||||
| Investor Class: | ||||||||
| Shares Sold | 82,938,445 | 95,972,082 | ||||||
| Shares issued in reinvestments of Distributions | 114,150 | 113,027 | ||||||
| Shares Redeemed | (91,066,805 | ) | (86,165,513 | ) | ||||
| Net Increase (Decrease) in Shares of Beneficial Interest Outstanding | (8,014,210 | ) | 9,919,596 | |||||
| Advisor Class: | ||||||||
| Shares Sold | 807 | 57 | ||||||
| Shares Redeemed | (5 | ) | (1,136 | ) | ||||
| Net Increase (Decrease) in Shares of Beneficial Interest Outstanding | 802 | (1,079 | ) | |||||
See accompanying notes to financial statements.
52
| STATEMENTS OF CHANGES IN NET ASSETS |
| Quantified Market Leaders Fund | Quantified Alternative Investment Fund | |||||||||||||||
| Year Ended | Year Ended | Year Ended | Year Ended | |||||||||||||
| June 30, 2023 | June 30, 2022 | June 30, 2023 | June 30, 2022 | |||||||||||||
| INCREASE (DECREASE) IN NET ASSETS FROM: | ||||||||||||||||
| Operations | ||||||||||||||||
| Net investment income (loss) | $ | 1,874,578 | $ | (265,545 | ) | $ | 278,583 | $ | 267,362 | |||||||
| Net realized gain (loss) from investments, futures and Swaps | 923,708 | (87,902,709 | ) | (1,387,118 | ) | (540,485 | ) | |||||||||
| Net change in unrealized appreciation (depreciation) on investments, futures and swaps | 16,378,943 | (14,877,155 | ) | 369,893 | (284,041 | ) | ||||||||||
| Net Increase (Decrease) in Net Assets Resulting From Operations | 19,177,229 | (103,045,409 | ) | (738,642 | ) | (557,164 | ) | |||||||||
| Distributions to Shareholders from: | ||||||||||||||||
| Investor Class | — | (64,830,712 | ) | (230,177 | ) | (1,531,424 | ) | |||||||||
| Advisor Class | — | (35,129 | ) | (588 | ) | (9,541 | ) | |||||||||
| Total Distributions to Shareholders | — | (64,865,841 | ) | (230,765 | ) | (1,540,965 | ) | |||||||||
| Shares of Beneficial Interest: | ||||||||||||||||
| Proceeds from shares sold | ||||||||||||||||
| Investor Class | 390,657,527 | 497,822,075 | 61,204,277 | 118,465,890 | ||||||||||||
| Advisor Class | 7,115 | 27,350 | 4,778 | 4,302 | ||||||||||||
| Net asset value of shares issued in reinvestment of distributions | ||||||||||||||||
| Investor Class | — | 64,760,056 | 230,145 | 1,531,160 | ||||||||||||
| Advisor Class | — | 35,129 | 588 | 9,541 | ||||||||||||
| Payments for shares redeemed | ||||||||||||||||
| Investor Class | (464,048,828 | ) | (521,345,505 | ) | (64,378,963 | ) | (116,078,574 | ) | ||||||||
| Advisor Class | (8,198 | ) | (9,263 | ) | (1,849 | ) | (14,664 | ) | ||||||||
| Total Increase (Decrease) in Net Assets From Shares of Beneficial Interest | (73,392,384 | ) | 41,289,842 | (2,941,024 | ) | 3,917,655 | ||||||||||
| Total Increase (Decrease) in Net Assets | (54,215,155 | ) | (126,621,408 | ) | (3,910,431 | ) | 1,819,526 | |||||||||
| Net Assets: | ||||||||||||||||
| Beginning of Year | 234,347,468 | 360,968,876 | 10,528,000 | 8,708,474 | ||||||||||||
| End of Year | $ | 180,132,313 | $ | 234,347,468 | $ | 6,617,569 | $ | 10,528,000 | ||||||||
| Share Activity | ||||||||||||||||
| Investor Class: | ||||||||||||||||
| Shares Sold | 42,620,139 | 39,795,641 | 6,533,386 | 11,515,869 | ||||||||||||
| Shares issued in reinvestments of Distributions | — | 5,437,452 | 25,543 | 154,195 | ||||||||||||
| Shares Redeemed | (50,490,563 | ) | (41,834,283 | ) | (6,947,036 | ) | (11,358,409 | ) | ||||||||
| Net Increase (Decrease) in Shares of Beneficial Interest Outstanding | (7,870,424 | ) | 3,398,810 | (388,107 | ) | 311,655 | ||||||||||
| Advisor Class: | ||||||||||||||||
| Shares Sold | 768 | 2,529 | 544 | 400 | ||||||||||||
| Shares issued in reinvestments of Distributions | — | 2,987 | 66 | 977 | ||||||||||||
| Shares Redeemed | (911 | ) | (604 | ) | (205 | ) | (1,516 | ) | ||||||||
| Net Increase (Decrease) in Shares of Beneficial Interest Outstanding | (143 | ) | 4,912 | 405 | (139 | ) | ||||||||||
See accompanying notes to financial statements.
53
| STATEMENTS OF CHANGES IN NET ASSETS |
| Quantified STF Fund | Quantified Pattern Recognition Fund | |||||||||||||||
| Year Ended | Year Ended | Year Ended | Year Ended | |||||||||||||
| June 30, 2023 | June 30, 2022 | June 30, 2023 | June 30, 2022 | |||||||||||||
| INCREASE (DECREASE) IN NET ASSETS FROM: | ||||||||||||||||
| Operations: | ||||||||||||||||
| Net investment income (loss) | $ | 998,811 | $ | (2,287,475 | ) | $ | 677,536 | $ | (452,099 | ) | ||||||
| Net realized gain (loss) from investments and futures | 14,845,061 | (20,101,087 | ) | 6,953,956 | (15,624,002 | ) | ||||||||||
| Net change in unrealized appreciation (depreciation) on investments and futures | 7,829,340 | (12,121,652 | ) | (213,608 | ) | (469,187 | ) | |||||||||
| Net Increase (Decrease) in Net Assets Resulting From Operations | 23,673,212 | (34,510,214 | ) | 7,417,884 | (16,545,288 | ) | ||||||||||
| Distributions to Shareholders from: | ||||||||||||||||
| Investor Class | — | (41,993,017 | ) | (33,274 | ) | (6,138,643 | ) | |||||||||
| Advisor Class | — | (209,090 | ) | — | — | |||||||||||
| Total Distributions to Shareholders | — | (42,202,107 | ) | (33,274 | ) | (6,138,643 | ) | |||||||||
| Shares of Beneficial Interest: | ||||||||||||||||
| Proceeds from shares sold: | ||||||||||||||||
| Investor Class | 363,192,731 | 385,548,653 | 85,543,684 | 224,056,062 | ||||||||||||
| Advisor Class | 18,721 | 2,187,112 | — | — | ||||||||||||
| Net asset value of shares issued in reinvestment of distributions: | ||||||||||||||||
| Investor Class | — | 41,490,496 | 33,184 | 6,125,596 | ||||||||||||
| Advisor Class | — | 209,090 | — | — | ||||||||||||
| Payments for shares redeemed | ||||||||||||||||
| Investor Class | (316,626,062 | ) | (388,034,300 | ) | (49,850,794 | ) | (260,160,379 | ) | ||||||||
| Advisor Class | (112,867 | ) | (2,363,944 | ) | — | — | ||||||||||
| Total Increase (Decrease) in Net Assets From Shares of Beneficial Interest | 46,472,523 | 39,037,107 | 35,726,074 | (29,978,721 | ) | |||||||||||
| Total Increase (Decrease) in Net Assets | 70,145,735 | (37,675,214 | ) | 43,110,684 | (52,662,652 | ) | ||||||||||
| Net Assets: | ||||||||||||||||
| Beginning of Year | 140,860,877 | 178,536,091 | 18,290,300 | 70,952,952 | ||||||||||||
| End of Year | $ | 211,006,612 | $ | 140,860,877 | $ | 61,400,984 | $ | 18,290,300 | ||||||||
| Share Activity | ||||||||||||||||
| Investor Class: | ||||||||||||||||
| Shares Sold | 35,371,821 | 24,262,178 | 7,856,690 | 20,286,971 | ||||||||||||
| Shares issued in reinvestments of Distributions | — | 2,430,609 | 3,635 | 538,278 | ||||||||||||
| Shares Redeemed | (31,634,677 | ) | (24,892,144 | ) | (4,593,153 | ) | (23,913,913 | ) | ||||||||
| Net Increase (Decrease) in Shares of Beneficial Interest Outstanding | 3,737,144 | 1,800,643 | 3,267,172 | (3,088,664 | ) | |||||||||||
| Share Activity | ||||||||||||||||
| Advisor Class: | ||||||||||||||||
| Shares Sold | 2,094 | 116,046 | — | — | ||||||||||||
| Shares issued in reinvestments of Distributions | — | 12,812 | — | — | ||||||||||||
| Shares Redeemed | (11,280 | ) | (135,591 | ) | — | — | ||||||||||
| Net Decrease in Shares of Beneficial Interest Outstanding | (9,186 | ) | (6,733 | ) | — | — | ||||||||||
See accompanying notes to financial statements.
54
| STATEMENTS OF CHANGES IN NET ASSETS |
| Quantified Tactical Fixed Income Fund | Quantified Evolution Plus Fund (Consolidated) | |||||||||||||||
| Year Ended | Year Ended | Year Ended | Year Ended | |||||||||||||
| June 30, 2023 | June 30, 2022 | June 30, 2023 | June 30, 2022 | |||||||||||||
| INCREASE (DECREASE) IN NET ASSETS FROM: | ||||||||||||||||
| Operations: | ||||||||||||||||
| Net investment income (loss) | $ | 839,623 | $ | (2,074,354 | ) | $ | 1,170,824 | $ | (890,707 | ) | ||||||
| Net realized loss from investments, futures and swaps | (19,284,099 | ) | (11,945,496 | ) | (3,051,175 | ) | (5,770,368 | ) | ||||||||
| Net change in unrealized appreciation (depreciation) on investments, futures and swaps | (47,311 | ) | (1,502,258 | ) | (853,536 | ) | 1,912,879 | |||||||||
| Net Decrease in Net Assets Resulting From Operations | (18,491,787 | ) | (15,522,108 | ) | (2,733,887 | ) | (4,748,196 | ) | ||||||||
| Distributions to Shareholders from: | ||||||||||||||||
| Investor Class | — | — | (37,720 | ) | (7,395,650 | ) | ||||||||||
| Total Distributions to Shareholders | — | — | (37,720 | ) | (7,395,650 | ) | ||||||||||
| Shares of Beneficial Interest: | ||||||||||||||||
| Proceeds from shares sold: | ||||||||||||||||
| Investor Class | 258,294,218 | 361,514,669 | 310,516,288 | 317,693,703 | ||||||||||||
| Net asset value of shares issued in reinvestment of distributions: | ||||||||||||||||
| Investor Class | — | — | 37,714 | 7,392,054 | ||||||||||||
| Payments for shares redeemed | ||||||||||||||||
| Investor Class | (279,349,778 | ) | (365,725,323 | ) | (400,431,534 | ) | (229,743,028 | ) | ||||||||
| Total Increase (Decrease) in Net Assets From Shares of Beneficial Interest | (21,055,560 | ) | (4,210,654 | ) | (89,877,532 | ) | 95,342,729 | |||||||||
| Total Increase (Decrease) in Net Assets | (39,547,347 | ) | (19,732,762 | ) | (92,649,139 | ) | 83,198,883 | |||||||||
| Net Assets: | ||||||||||||||||
| Beginning of Year | 152,862,816 | 172,595,578 | 141,942,996 | 58,744,113 | ||||||||||||
| End of Year | $ | 113,315,469 | $ | 152,862,816 | $ | 49,293,857 | $ | 141,942,996 | ||||||||
| Share Activity | ||||||||||||||||
| Investor Class: | ||||||||||||||||
| Shares Sold | 30,663,856 | 36,052,323 | 40,621,949 | 35,429,624 | ||||||||||||
| Shares issued in reinvestments of Distributions | — | — | 5,202 | 779,752 | ||||||||||||
| Shares Redeemed | (33,078,446 | ) | (36,587,381 | ) | (51,821,391 | ) | (24,352,039 | ) | ||||||||
| Net Increase (Decrease) in Shares of Beneficial Interest Outstanding | (2,414,590 | ) | (535,058 | ) | (11,194,240 | ) | 11,857,337 | |||||||||
See accompanying notes to consolidated financial statements.
55
| STATEMENTS OF CHANGES IN NET ASSETS |
| Quantified Common Ground Fund | Quantified Tactical Sectors Fund | |||||||||||||||
| Year Ended | Year Ended | Year Ended | Year Ended | |||||||||||||
| June 30, 2023 | June 30, 2022 | June 30, 2023 | June 30, 2022 | |||||||||||||
| INCREASE (DECREASE) IN NET ASSETS FROM: | ||||||||||||||||
| Operations: | ||||||||||||||||
| Net investment income (loss) | $ | 321,882 | $ | 267,604 | $ | 561,443 | $ | (550,019 | ) | |||||||
| Net realized loss from investments, futures and swaps | (12,073,142 | ) | (3,781,505 | ) | (8,277,477 | ) | (48,108,545 | ) | ||||||||
| Net change in unrealized appreciation (Depreciation) on investments, futures and swaps | 7,111,681 | (3,239,069 | ) | 13,572,317 | (785,566 | ) | ||||||||||
| Net Increase (Decrease) in Net Assets Resulting From Operations | (4,639,579 | ) | (6,752,970 | ) | 5,856,283 | (49,444,130 | ) | |||||||||
| Distributions to Shareholders from: | ||||||||||||||||
| Investor Class | — | (7,158,565 | ) | (310,692 | ) | (2,251,739 | ) | |||||||||
| Total Distributions to Shareholders | — | (7,158,565 | ) | (310,692 | ) | (2,251,739 | ) | |||||||||
| Shares of Beneficial Interest: | ||||||||||||||||
| Proceeds from shares sold: | ||||||||||||||||
| Investor Class | 708,861,991 | 1,004,571,852 | 200,338,347 | 274,066,663 | ||||||||||||
| Net asset value of shares issued in reinvestment of distributions: | ||||||||||||||||
| Investor Class | — | 7,127,372 | 310,392 | 2,251,680 | ||||||||||||
| Payments for shares redeemed | ||||||||||||||||
| Investor Class | (646,750,226 | ) | (1,006,249,311 | ) | (211,473,006 | ) | (203,643,453 | ) | ||||||||
| Total Increase (Decrease) in Net Assets From Shares of Beneficial Interest | 62,111,765 | 5,449,913 | (10,824,267 | ) | 72,674,890 | |||||||||||
| Total Increase (Decrease) in Net Assets | 57,472,186 | (8,461,622 | ) | (5,278,676 | ) | 20,979,021 | ||||||||||
| Net Assets: | ||||||||||||||||
| Beginning of Year | 43,519,554 | 51,981,176 | 75,230,290 | 54,251,269 | ||||||||||||
| End of Year | $ | 100,991,740 | $ | 43,519,554 | $ | 69,951,614 | $ | 75,230,290 | ||||||||
| Share Activity | ||||||||||||||||
| Investor Class: | ||||||||||||||||
| Shares Sold | 54,995,527 | 72,462,133 | 34,023,504 | 35,977,491 | ||||||||||||
| Shares issued in reinvestments of Distributions | — | 504,414 | 53,149 | 277,301 | ||||||||||||
| Shares Redeemed | (50,657,633 | ) | (73,656,140 | ) | (36,468,200 | ) | (28,539,040 | ) | ||||||||
| Net Increase (Decrease) in Shares of Beneficial Interest Outstanding | 4,337,894 | (689,593 | ) | (2,391,547 | ) | 7,715,752 | ||||||||||
See accompanying notes to financial statements.
56
| STATEMENTS OF CHANGES IN NET ASSETS |
| Quantified Rising Dividend Tactical Fund | Quantified Government Income Tactical Fund | |||||||||||||||
| Year Ended | Year Ended | Year Ended | Year Ended | |||||||||||||
| June 30, 2023 | June 30, 2022 | June 30, 2023 | June 30, 2022 | |||||||||||||
| INCREASE (DECREASE) IN NET ASSETS FROM: | ||||||||||||||||
| Operations: | ||||||||||||||||
| Net investment income (loss) | $ | 157,714 | $ | 32,574 | $ | 603,641 | $ | (384,160 | ) | |||||||
| Net realized loss from investments, futures and swaps | (4,826,110 | ) | (4,686,535 | ) | (7,253,359 | ) | (4,274,214 | ) | ||||||||
| Net change in unrealized appreciation (depreciation) on investments, futures and swaps | 2,503,392 | (1,398,417 | ) | (211,462 | ) | 197,792 | ||||||||||
| Net Decrease in Net Assets Resulting From Operations | (2,165,004 | ) | (6,052,378 | ) | (6,861,180 | ) | (4,460,582 | ) | ||||||||
| Distributions to Shareholders from: | ||||||||||||||||
| Investor Class | (668,445 | ) | (163,258 | ) | — | (728,746 | ) | |||||||||
| Total Distributions to Shareholders | (668,445 | ) | (163,258 | ) | — | (728,746 | ) | |||||||||
| Shares of Beneficial Interest: | ||||||||||||||||
| Proceeds from shares sold: | ||||||||||||||||
| Investor Class | 76,377,941 | 61,741,858 | 224,902,030 | 289,593,640 | ||||||||||||
| Net asset value of shares issued in reinvestment of distributions: | ||||||||||||||||
| Investor Class | 667,048 | 163,258 | — | 728,722 | ||||||||||||
| Payments for shares redeemed | ||||||||||||||||
| Investor Class | (71,182,686 | ) | (49,850,308 | ) | (241,033,264 | ) | (225,892,338 | ) | ||||||||
| Total Increase (Decrease) in Net Assets From Shares of Beneficial Interest | 5,862,303 | 12,054,808 | (16,131,234 | ) | 64,430,024 | |||||||||||
| Total Increase (Decrease) in Net Assets | 3,028,854 | 5,839,172 | (22,992,414 | ) | 59,240,696 | |||||||||||
| Net Assets: | ||||||||||||||||
| Beginning of Year | 27,417,509 | 21,578,337 | 66,187,850 | 6,947,154 | ||||||||||||
| End of Year | $ | 30,446,363 | $ | 27,417,509 | $ | 43,195,436 | $ | 66,187,850 | ||||||||
| Share Activity | ||||||||||||||||
| Investor Class: | ||||||||||||||||
| Shares Sold | 9,805,190 | 5,960,173 | 25,806,082 | 28,662,125 | ||||||||||||
| Shares issued in reinvestments of Distributions | 90,631 | 14,748 | — | 68,878 | ||||||||||||
| Shares Redeemed | (9,161,470 | ) | (4,888,392 | ) | (27,458,754 | ) | (22,421,175 | ) | ||||||||
| Net Increase (Decrease) in Shares of Beneficial Interest Outstanding | 734,351 | 1,086,529 | (1,652,672 | ) | 6,309,828 | |||||||||||
See accompanying notes to financial statements.
57
| STATEMENT OF CASH FLOWS |
| For the Year Ended June 30, 2023 |
| Quantified | ||||
| Alternative | ||||
| Investment Fund | ||||
| Cash Flows from Operating Activities | ||||
| Net decrease in net assets resulting from operations | $ | (738,642 | ) | |
| Adjustments to reconcile net decrease in net assets resulting from operations to net cash provided by (used in) operating activities: | ||||
| Purchases of investments | (80,682,268 | ) | ||
| Proceeds from sales of investments | 80,068,605 | |||
| Net sales of short term investments | 4,227,761 | |||
| Capital gain distributions received | 17,054 | |||
| Net realized loss on investments | 1,387,118 | |||
| Net change in unrealized appreciation (depreciation) on investments | (369,893 | ) | ||
| (Increase)/Decrease in assets: | ||||
| Receivable for securities sold | 1,091,616 | |||
| Dividends and interest | 3,848 | |||
| Prepaid expenses and other assets | 10,833 | |||
| Increase/(Decrease) in liabilities: | ||||
| Investment advisory fees | (11,725 | ) | ||
| Payable to related parties | 10,847 | |||
| Distribution (12b-1) fees payable | (3,235 | ) | ||
| Shareholder service fee - Investor class | (7,006 | ) | ||
| Net cash provided by operating activities | 5,004,913 | |||
| Cash Flows from Financing Activities | ||||
| Proceeds from shares issued | 61,215,781 | |||
| Payments for shares redeemed | (66,593,438 | ) | ||
| Proceeds from line of credit | 7,705,000 | |||
| Repayment of borrowings | (7,705,000 | ) | ||
| Distributions paid (net of reinvestments) | (32 | ) | ||
| Net cash used in financing activities | (5,377,689 | ) | ||
| Net decrease in cash | (372,776 | ) | ||
| Cash and Restricted Cash at beginning of year | 449,721 | |||
| Cash and Restricted Cash at end of year | $ | 76,945 | ||
| Cash | — | |||
| Restricted Cash | ||||
| Deposits with brokers for futures | 76,945 | |||
| Total Cash and Restricted Cash | $ | 76,945 | ||
| Supplemental Disclosure of Cash Flow Information | ||||
| Non-cash financing activities not included herein consists of reinvestment of dividends | $ | 230,733 | ||
| Cash paid for custody overdraft | $ | 1,542 | ||
| Cash paid for interest on line of credit | $ | 10,519 | ||
See accompanying notes to financial statements.
58
| FINANCIAL HIGHLIGHTS |
| Quantified Managed Income Fund |
The table sets forth financial data for one share of beneficial interest outstanding throughout each year.
| Investor Class | Advisor Class | |||||||||||||||||||||||||||||||||||||||
| Year Ended June 30, | Year Ended June 30, | |||||||||||||||||||||||||||||||||||||||
| 2023 | 2022 | 2021 | 2020 | 2019 | 2023 | 2022 | 2021 | 2020 | 2019 | |||||||||||||||||||||||||||||||
| Net asset value, beginning of year | $ | 8.65 | $ | 8.79 | $ | 9.04 | $ | 9.75 | $ | 9.31 | $ | 8.70 | $ | 8.83 | $ | 9.07 | $ | 9.70 | $ | 9.28 | ||||||||||||||||||||
| Activity from investment operations: | ||||||||||||||||||||||||||||||||||||||||
| Net investment income (loss) (1) | 0.23 | 0.08 | 0.06 | 0.15 | 0.35 | 0.19 | 0.04 | (0.02 | ) | 0.09 | 0.30 | |||||||||||||||||||||||||||||
| Net realized and unrealized gain (loss) on investments, futures and distributions from underlying investment companies | (0.54 | ) | (0.16 | ) | (0.23 | ) | (0.64 | ) | 0.28 | (0.54 | ) | (0.17 | ) | (0.22 | ) | (0.64 | ) | 0.26 | ||||||||||||||||||||||
| Total from investment operations | (0.31 | ) | (0.08 | ) | (0.17 | ) | (0.49 | ) | 0.63 | (0.35 | ) | (0.13 | ) | (0.24 | ) | (0.55 | ) | 0.56 | ||||||||||||||||||||||
| Distributions to Shareholders: | ||||||||||||||||||||||||||||||||||||||||
| Net investment income | (0.04 | ) | (0.06 | ) | (0.08 | ) | (0.16 | ) | (0.19 | ) | — | — | — | (0.02 | ) | (0.14 | ) | |||||||||||||||||||||||
| Net realized gains | — | — | — | (0.06 | ) | — | — | — | — | (0.06 | ) | — | ||||||||||||||||||||||||||||
| Total distributions | (0.04 | ) | (0.06 | ) | (0.08 | ) | (0.22 | ) | (0.19 | ) | — | — | — | (0.08 | ) | (0.14 | ) | |||||||||||||||||||||||
| Net asset value, end of year | $ | 8.30 | $ | 8.65 | $ | 8.79 | $ | 9.04 | $ | 9.75 | $ | 8.35 | $ | 8.70 | $ | 8.83 | $ | 9.07 | $ | 9.70 | ||||||||||||||||||||
| Total return (2) | (3.53 | )% | (0.90 | )% | (1.92 | )% | (5.19 | )% | 6.89 | % | (4.02 | )% | (1.47 | )% | (2.65 | )% | (5.76 | )% | 6.16 | % | ||||||||||||||||||||
| Net assets, end of year (in 000s) | $ | 133,422 | $ | 208,199 | $ | 124,443 | $ | 72,543 | $ | 59,435 | $ | 23 | $ | 17 | $ | 27 | $ | 523 | $ | 570 | ||||||||||||||||||||
| Ratios/Supplemental Data: | ||||||||||||||||||||||||||||||||||||||||
| Ratio of expenses to average net assets (3) | 1.33 | % | 1.31 | % | 1.41 | % | 1.43 | % | 1.42 | % | 1.93 | % | 1.91 | % | 2.02 | % | 2.03 | % | 2.02 | % | ||||||||||||||||||||
| Ratio of net investment income (loss) to average net assets (3,4) | 2.68 | % | 0.88 | % | 0.70 | % | 1.59 | % | 3.72 | % | 2.21 | % | 0.44 | % | (0.25 | )% | 0.96 | % | 3.24 | % | ||||||||||||||||||||
| Portfolio turnover rate | 802 | % | 820 | % | 619 | % | 794 | % | 640 | % | 802 | % | 820 | % | 619 | % | 794 | % | 640 | % | ||||||||||||||||||||
| (1) | Per share amounts calculated using the average shares method, which more appropriately presents the per share data for the year. |
| (2) | Total return shown assumes the reinvestment of all distributions. |
| (3) | The ratios of expenses to average net assets and net investment income (loss) to average net assets do not reflect the expenses of the underlying investment companies in which the Fund invests. |
| (4) | Recognition of net investment income (loss) by the Fund is affected by the timing and declaration of dividends by the underlying investment companies in which the Fund invests. |
See accompanying notes to financial statements.
59
| FINANCIAL HIGHLIGHTS |
| Quantified Market Leaders Fund |
The table sets forth financial data for one share of beneficial interest outstanding throughout each year.
| Investor Class | Advisor Class | |||||||||||||||||||||||||||||||||||||||
| Year Ended June 30, | Year Ended June 30, | |||||||||||||||||||||||||||||||||||||||
| 2023 | 2022 | 2021 | 2020 | 2019 | 2023 | 2022 | 2021 | 2020 | 2019 | |||||||||||||||||||||||||||||||
| Net asset value, beginning of year | $ | 9.12 | $ | 16.20 | $ | 11.02 | $ | 9.38 | $ | 11.57 | $ | 8.98 | $ | 15.92 | $ | 10.87 | $ | 9.30 | $ | 11.41 | ||||||||||||||||||||
| Activity from investment operations: | ||||||||||||||||||||||||||||||||||||||||
| Net investment income (loss) (1) | 0.08 | (0.01 | ) | (0.01 | ) | 0.00 | (2) | 0.08 | 0.02 | (0.08 | ) | (0.19 | ) | (0.06 | ) | (0.01 | ) | |||||||||||||||||||||||
| Net realized and unrealized gain (loss) on investments, futures, swaps and underlying investment companies | 0.91 | (3.88 | ) | 6.46 | 1.64 | (0.96 | ) | 0.90 | (3.83 | ) | 6.48 | 1.63 | (0.91 | ) | ||||||||||||||||||||||||||
| Total from investment operations | 0.99 | (3.89 | ) | 6.45 | 1.64 | (0.88 | ) | 0.92 | (3.91 | ) | 6.29 | 1.57 | (0.92 | ) | ||||||||||||||||||||||||||
| Distributions to Shareholders: | ||||||||||||||||||||||||||||||||||||||||
| Net investment income | — | (0.19 | ) | (0.03 | ) | — | (0.12 | ) | — | (0.03 | ) | — | — | — | ||||||||||||||||||||||||||
| Net realized gains | — | (3.00 | ) | (1.24 | ) | — | (1.19 | ) | — | (3.00 | ) | (1.24 | ) | — | (1.19 | ) | ||||||||||||||||||||||||
| Total distributions | — | (3.19 | ) | (1.27 | ) | — | (1.31 | ) | — | (3.03 | ) | (1.24 | ) | — | (1.19 | ) | ||||||||||||||||||||||||
| Net asset value, end of year | $ | 10.11 | $ | 9.12 | $ | 16.20 | $ | 11.02 | $ | 9.38 | $ | 9.90 | $ | 8.98 | $ | 15.92 | $ | 10.87 | $ | 9.30 | ||||||||||||||||||||
| Total return (3) | 10.86 | % | (28.64 | )% | 60.94 | % | 17.48 | % | (6.18 | )% | 10.25 | % | (29.09 | )% | 60.23 | % | 16.88 | % | (6.77 | )% | ||||||||||||||||||||
| Net assets, end of year (in 000s) | $ | 179,967 | $ | 234,197 | $ | 360,780 | $ | 139,415 | $ | 157,573 | $ | 165 | $ | 151 | $ | 189 | $ | 649 | $ | 455 | ||||||||||||||||||||
| Ratios/Supplemental Data: | ||||||||||||||||||||||||||||||||||||||||
| Ratio of expenses to average net assets (4) | 1.32 | % | 1.30 | % | 1.40 | % | 1.42 | % | 1.42 | % | 1.93 | % | 1.90 | % | 2.00 | % | 2.03 | % | 2.02 | % | ||||||||||||||||||||
| Ratio of net investment income (loss) to average net assets (4,5) | 0.83 | % | (0.08 | )% | (0.07 | )% | (0.05 | )% | 0.81 | % | 0.23 | % | (0.67 | )% | (1.48 | )% | (0.65 | )% | (0.12 | )% | ||||||||||||||||||||
| Portfolio turnover rate | 1592 | % | 1058 | % | 568 | % | 727 | % | 797 | % | 1592 | % | 1058 | % | 568 | % | 727 | % | 797 | % | ||||||||||||||||||||
| (1) | Per share amounts calculated using the average shares method, which more appropriately presents the per share data for the year. |
| (2) | Represents less than $0.01 per share. |
| (3) | Total returns shown assumes the reinvestment of all distributions. |
| (4) | The ratios of expenses to average net assets and net investment income (loss) to average net assets do not reflect the expenses of the underlying investment companies in which the Fund invests. |
| (5) | Recognition of net investment income (loss) by the Fund is affected by the timing and declaration of dividends by the underlying investment companies in which the Fund invests. |
See accompanying notes to financial statements.
60
| FINANCIAL HIGHLIGHTS |
| Quantified Alternative Investment Fund |
The table sets forth financial data for one share of beneficial interest outstanding throughout each year.
| Investor Class | Advisor Class | |||||||||||||||||||||||||||||||||||||||
| Year Ended June 30, | Year Ended June 30, | |||||||||||||||||||||||||||||||||||||||
| 2023 | 2022 | 2021 | 2020 | 2019 | 2023 | 2022 | 2021 | 2020 | 2019 | |||||||||||||||||||||||||||||||
| Net asset value, beginning of year | $ | 9.49 | $ | 10.92 | $ | 8.62 | $ | 9.48 | $ | 9.46 | $ | 9.32 | $ | 10.72 | $ | 8.51 | $ | 9.35 | $ | 9.39 | ||||||||||||||||||||
| Activity from investment operations: | ||||||||||||||||||||||||||||||||||||||||
| Net investment income (loss) (1) | 0.22 | 0.18 | (0.04 | ) | 0.07 | 0.07 | 0.15 | 0.16 | (0.05 | ) | (0.05 | ) | 0.01 | |||||||||||||||||||||||||||
| Net realized and unrealized gain (loss) on investments, futures and underlying investment companies | (0.39 | ) | (0.34 | ) | 2.34 | (0.79 | ) | (0.04 | ) | (0.36 | ) | (0.37 | ) | 2.26 | (0.71 | ) | (0.05 | ) | ||||||||||||||||||||||
| Total from investment operations | (0.17 | ) | (0.16 | ) | 2.30 | (0.72 | ) | 0.03 | (0.21 | ) | (0.21 | ) | 2.21 | (0.76 | ) | (0.04 | ) | |||||||||||||||||||||||
| Distributions to Shareholders: | ||||||||||||||||||||||||||||||||||||||||
| Net investment income | (0.15 | ) | (0.16 | ) | — | (0.14 | ) | (0.01 | ) | (0.08 | ) | (0.08 | ) | — | (0.08 | ) | — | |||||||||||||||||||||||
| Net realized gains | — | (1.11 | ) | — | — | — | — | (1.11 | ) | — | — | — | ||||||||||||||||||||||||||||
| Total distributions | (0.15 | ) | (1.27 | ) | — | (0.14 | ) | (0.01 | ) | (0.08 | ) | (1.19 | ) | — | (0.08 | ) | — | |||||||||||||||||||||||
| Net asset value, end of year | $ | 9.17 | $ | 9.49 | $ | 10.92 | $ | 8.62 | $ | 9.48 | $ | 9.03 | $ | 9.32 | $ | 10.72 | $ | 8.51 | $ | 9.35 | ||||||||||||||||||||
| Total return (2) | (1.71 | )% | (1.99 | )% | 26.68 | % | (7.76 | )% | 0.28 | % | (2.24 | )% | (2.45 | )% | 25.97 | % | (8.26 | )% | (0.43 | )% | ||||||||||||||||||||
| Net assets, end of year (in 000s) | $ | 6,546 | $ | 10,458 | $ | 8,627 | $ | 7,533 | $ | 8,682 | $ | 71 | $ | 70 | $ | 82 | $ | 62 | $ | 15 | ||||||||||||||||||||
| Ratios/Supplemental Data: | ||||||||||||||||||||||||||||||||||||||||
| Ratio of gross expenses to average net assets (3) | 1.57 | % | 1.33 | % | 1.56 | % | 1.46 | % | 1.42 | % | 2.19 | % | 1.94 | % | 2.24 | % | 2.14 | % | 2.02 | % | ||||||||||||||||||||
| Ratio of net expenses to average net assets (3) | 1.49 | % | 1.33 | % | 1.56 | % | 1.46 | % | 1.42 | % | 2.11 | % | 1.94 | % | 2.24 | % | 2.14 | % | 2.02 | % | ||||||||||||||||||||
| Ratio of net investment income (loss) to average net assets (3,4) | 2.39 | % | 1.77 | % | (0.43 | )% | 0.74 | % | 0.71 | % | 1.68 | % | 1.58 | % | (0.49 | )% | (0.57 | )% | 0.09 | % | ||||||||||||||||||||
| Portfolio turnover rate | 971 | % | 1321 | % | 1031 | % | 570 | % | 595 | % | 971 | % | 1321 | % | 1031 | % | 570 | % | 595 | % | ||||||||||||||||||||
| (1) | Per share amounts calculated using the average shares method, which more appropriately presents the per share data for the year. |
| (2) | Total returns shown assumes the reinvestment of all distributions. |
| (3) | The ratios of expenses to average net assets and net investment income (loss) to average net assets do not reflect the expenses of the underlying investment companies in which the Fund invests. |
| (4) | Recognition of net investment income (loss) by the Fund is affected by the timing and declaration of dividends by the underlying investment companies in which the Fund invests. |
See accompanying notes to financial statements.
61
| FINANCIAL HIGHLIGHTS |
| Quantified STF Fund |
The table sets forth financial data for one share of beneficial interest outstanding throughout each year.
| Investor Class | Advisor Class | |||||||||||||||||||||||||||||||||||||||
| Year Ended June 30, | Year Ended June 30, | |||||||||||||||||||||||||||||||||||||||
| 2023 | 2022 | 2021 | 2020 | 2019 | 2023 | 2022 | 2021 | 2020 | 2019 | |||||||||||||||||||||||||||||||
| Net asset value, beginning of year | $ | 11.52 | $ | 17.12 | $ | 13.64 | $ | 9.51 | $ | 10.05 | $ | 10.98 | $ | 16.55 | $ | 13.34 | $ | 9.31 | $ | 9.88 | ||||||||||||||||||||
| Activity from investment operations: | ||||||||||||||||||||||||||||||||||||||||
| Net investment income (loss) (1) | 0.08 | (0.19 | ) | (0.19 | ) | 0.01 | 0.04 | 0.01 | (0.28 | ) | (0.28 | ) | (0.07 | ) | (0.02 | ) | ||||||||||||||||||||||||
| Net realized and unrealized gain (loss) on investments, futures and underlying investment companies | 1.63 | (1.74 | ) | 6.95 | 4.18 | (0.34 | ) | 1.54 | (1.62 | ) | 6.77 | 4.10 | (0.33 | ) | ||||||||||||||||||||||||||
| Total from investment operations | 1.71 | (1.93 | ) | 6.76 | 4.19 | (0.30 | ) | 1.55 | (1.90 | ) | 6.49 | 4.03 | (0.35 | ) | ||||||||||||||||||||||||||
| Distributions to Shareholders: | ||||||||||||||||||||||||||||||||||||||||
| Net investment income | — | — | 0.00 | (2) | (0.06 | ) | (0.02 | ) | — | — | — | — | — | |||||||||||||||||||||||||||
| Net realized gains | — | (3.67 | ) | (3.28 | ) | — | (0.22 | ) | — | (3.67 | ) | (3.28 | ) | — | (0.22 | ) | ||||||||||||||||||||||||
| Total distributions | — | (3.67 | ) | (3.28 | ) | (0.06 | ) | (0.24 | ) | — | (3.67 | ) | (3.28 | ) | — | (0.22 | ) | |||||||||||||||||||||||
| Net asset value, end of year | $ | 13.23 | $ | 11.52 | $ | 17.12 | $ | 13.64 | $ | 9.51 | $ | 12.53 | $ | 10.98 | $ | 16.55 | $ | 13.34 | $ | 9.31 | ||||||||||||||||||||
| Total return (3) | 14.84 | % | (18.23 | )% (6) | 51.86 | % | 44.17 | % | (3.12 | )% | 14.12 | % (6) | (18.72 | )% | 50.87 | % | 43.29 | % | (3.65 | )% | ||||||||||||||||||||
| Net assets, end of year (in 000s) | $ | 210,778 | $ | 140,559 | $ | 177,970 | $ | 70,861 | $ | 70,238 | $ | 229 | $ | 302 | $ | 566 | $ | 456 | $ | 121 | ||||||||||||||||||||
| Ratios/Supplemental Data: | ||||||||||||||||||||||||||||||||||||||||
| Ratio of expenses to average net assets (4) | 1.58 | % | 1.55 | % | 1.66 | % | 1.68 | % | 1.67 | % | 2.18 | % | 2.15 | % | 2.27 | % | 2.28 | % | 2.27 | % | ||||||||||||||||||||
| Ratio of net investment income (loss) to average net assets (4,5) | 0.74 | % | (1.18 | )% | (1.16 | )% | 0.05 | % | 0.42 | % | 0.10 | % | (1.79 | )% | (1.74 | )% | (0.65 | )% | (0.20 | )% | ||||||||||||||||||||
| Portfolio turnover rate | 102 | % | 168 | % | 238 | % | 91 | % | 41 | % | 102 | % | 168 | % | 238 | % | 91 | % | 41 | % | ||||||||||||||||||||
| (1) | Per share amounts calculated using the average shares method, which more appropriately presents the per share data for the year. |
| (2) | Represents less than $0.01 per share. |
| (3) | Total returns shown assumes the reinvestment of all distributions. |
| (4) | The ratios of expenses to average net assets and net investment income (loss) to average net assets do not reflect the expenses of the underlying investment companies in which the Fund invests. |
| (5) | Recognition of net investment income (loss) by the Fund is affected by the timing and declaration of dividends by the underlying investment companies in which the Fund invests. |
| (6) | Includes adjustments in accordance with accounting principles generally accepted in the United States and consequently the net asset value for financial reporting purposes and the returns based upon those net asset values may differ from the net asset values and returns for shareholder transactions. |
See accompanying notes to financial statements.
62
| FINANCIAL HIGHLIGHTS |
| Quantified Pattern Recognition Fund |
The table sets forth financial data for one share of beneficial interest outstanding throughout the year or period.
| Investor Class | ||||||||||||||||
| Period Ended | ||||||||||||||||
| Year Ended June 30, | June 30, | |||||||||||||||
| 2023 | 2022 | 2021 | 2020 (1) | |||||||||||||
| Net asset value, beginning of year or period | $ | 8.32 | $ | 13.42 | $ | 10.49 | $ | 10.00 | ||||||||
| Activity from investment operations: | ||||||||||||||||
| Net investment income (loss) (2) | 0.21 | (0.13 | ) | (0.13 | ) | (0.00 | ) (6) | |||||||||
| Net realized and unrealized gain (loss) on investments and futures | 2.72 | (1.94 | ) | 3.08 | 0.90 | |||||||||||
| Total from investment operations | 2.93 | (2.07 | ) | 2.95 | 0.90 | |||||||||||
| Distributions to Shareholders: | ||||||||||||||||
| Net investment income | (0.01 | ) | — | — | (0.02 | ) | ||||||||||
| Net realized gains | — | (3.03 | ) | (0.02 | ) | (0.39 | ) | |||||||||
| Total distributions | (0.01 | ) | (3.03 | ) | (0.02 | ) | (0.41 | ) | ||||||||
| Net asset value, end of year or period | $ | 11.24 | $ | 8.32 | $ | 13.42 | $ | 10.49 | ||||||||
| Total return (3) | 35.28 | % | (21.49 | )% | 28.21 | % | 8.90 | % (7) | ||||||||
| Net assets, end of year or period (in 000s) | $ | 61,401 | $ | 18,290 | $ | 70,953 | $ | 20,138 | ||||||||
| Ratios/Supplemental Data: | ||||||||||||||||
| Ratio of gross expenses to average net assets (4) | 1.62 | % | 1.55 | % | 1.67 | % | 1.69 | % (8) | ||||||||
| Ratio of net expenses to average net assets (4) | 1.59 | % | 1.55 | % | 1.67 | % | 1.69 | % (8) | ||||||||
| Ratio of net investment income (loss) to average net assets(4,5) | 2.17 | % | (1.17 | )% | (1.12 | )% | (0.01 | )% (8) | ||||||||
| Portfolio turnover rate | 314 | % | 495 | % | 226 | % | 244 | % (7) | ||||||||
| (1) | The Fund commenced operations on August 30, 2019. |
| (2) | Per share amounts calculated using the average shares method, which more appropriately presents the per share data for the year or period. |
| (3) | Total returns shown assumes the reinvestment of all distributions. |
| (4) | The ratios of expenses to average net assets and net investment income (loss) to average net assets do not reflect the expenses of the underlying investment companies in which the Fund invests. |
| (5) | Recognition of net investment income (loss) by the Fund is affected by the timing and declaration of dividends by the underlying investment companies in which the Fund invests. |
| (6) | Represents less than $0.01 per share. |
| (7) | Not Annualized. |
| (8) | Annualized. |
See accompanying notes to financial statements.
63
| FINANCIAL HIGHLIGHTS |
| Quantified Tactical Fixed Income Fund |
The table sets forth financial data for one share of beneficial interest outstanding throughout the year or period.
| Investor Class | ||||||||||||||||
| Period Ended | ||||||||||||||||
| Year Ended June 30, | June 30, | |||||||||||||||
| 2023 | 2022 | 2021 | 2020 (1) | |||||||||||||
| Net asset value, beginning of year or period | $ | 9.13 | $ | 9.99 | $ | 10.95 | $ | 10.00 | ||||||||
| Activity from investment operations: | ||||||||||||||||
| Net investment income (loss) (2) | 0.06 | (0.12 | ) | (0.14 | ) | (0.02 | ) | |||||||||
| Net realized and unrealized gain (loss) on investments, futures and swaps | (1.28 | ) | (0.74 | ) | (0.59 | ) | 1.18 | |||||||||
| Total from investment operations | (1.22 | ) | (0.86 | ) | (0.73 | ) | 1.16 | |||||||||
| Distributions to Shareholders: | ||||||||||||||||
| Net investment income | — | — | — | (0.03 | ) | |||||||||||
| Net realized gains | — | — | (0.23 | ) | (0.18 | ) | ||||||||||
| Return of capital | — | — | (0.00 | ) (8) | — | |||||||||||
| Total distributions | — | — | (0.23 | ) | (0.21 | ) | ||||||||||
| Net asset value, end of year or period | $ | 7.91 | $ | 9.13 | $ | 9.99 | $ | 10.95 | ||||||||
| Total return(3) | (13.36 | )% | (8.61 | )% | (6.83 | )% | 11.84 | % (4) | ||||||||
| Net assets, end of year or period (in 000s) | $ | 113,315 | $ | 152,863 | $ | 172,596 | $ | 86,168 | ||||||||
| Ratios/Supplemental Data: | ||||||||||||||||
| Ratio of expenses to average net assets(6) | 1.58 | % | 1.56 | % | 1.66 | % | 1.67 | % (5) | ||||||||
| Ratio of net investment income (loss) to average net assets (6,7) | 0.72 | % | (1.20 | )% | (1.31 | )% | (0.23 | )% (5) | ||||||||
| Portfolio turnover rate | 85 | % | 121 | % | 121 | % | 177 | % (4) | ||||||||
| (1) | The Fund commenced operations on September 13, 2019. |
| (2) | Per share amounts calculated using the average shares method, which more appropriately presents the per share data for the year or period. |
| (3) | Total returns shown assumes the reinvestment of all distributions. |
| (4) | Not Annualized. |
| (5) | Annualized. |
| (6) | The ratios of expenses to average net assets and net investment income (loss) to average net assets do not reflect the expenses of the underlying investment companies in which the |
| (7) | Recognition of net investment income (loss) by the Fund is affected by the timing and declaration of dividends by the underlying investment companies in which the Fund invests. |
| (8) | Represents less than $0.01 per share. |
See accompanying notes to financial statements.
64
| CONSOLIDATED FINANCIAL HIGHLIGHTS |
| Quantified Evolution Plus Fund |
The table sets forth financial data for one share of beneficial interest outstanding throughout the year or period.
| Investor Class | ||||||||||||||||
| Period Ended | ||||||||||||||||
| Year Ended June 30, | June 30, | |||||||||||||||
| 2023 | 2022 | 2021 | 2020 (1) | |||||||||||||
| Net asset value, beginning of year or period | $ | 7.97 | $ | 9.87 | $ | 8.90 | $ | 10.00 | ||||||||
| Activity from investment operations: | ||||||||||||||||
| Net investment income (loss) (2) | 0.12 | (0.12 | ) | (0.13 | ) | (0.04 | ) | |||||||||
| Net realized and unrealized gain (loss) on investments, futures and swaps | (0.63 | ) | (0.50 | ) | 1.32 | (1.05 | ) | |||||||||
| Total from investment operations | (0.51 | ) | (0.62 | ) | 1.19 | (1.09 | ) | |||||||||
| Distributions to Shareholders: | ||||||||||||||||
| Net investment income | (0.01 | ) | — | (0.22 | ) | (0.01 | ) | |||||||||
| Net realized gains | — | (1.28 | ) | — | (0.00 | ) (8) | ||||||||||
| Total distributions | (0.01 | ) | (1.28 | ) | (0.22 | ) | (0.01 | ) | ||||||||
| Net asset value, end of year or period | $ | 7.45 | $ | 7.97 | $ | 9.87 | $ | 8.90 | ||||||||
| Total return (3) | (6.46 | )% | (8.32 | )% | 13.50 | % | (10.87 | )% (4) | ||||||||
| Net assets, end of year or period (in 000s) | $ | 49,294 | $ | 141,943 | $ | 58,744 | $ | 25,442 | ||||||||
| Ratios/Supplemental Data: | ||||||||||||||||
| Ratio of expenses to average net assets (6) | 1.59 | % | 1.56 | % | 1.66 | % | 1.68 | % (5) | ||||||||
| Ratio of net investment income (loss) to average net assets (6,7) | 1.56 | % | (1.26 | )% | (1.37 | )% | (0.53 | )% (5) | ||||||||
| Portfolio turnover rate | 635 | % | 514 | % | 594 | % | 437 | % (4) | ||||||||
| (1) | The Fund commenced operations on September 30, 2019. |
| (2) | Per share amounts calculated using the average shares method, which more appropriately presents the per share data for the year or period. |
| (3) | Total returns shown assumes the reinvestment of all distributions. |
| (4) | Not Annualized. |
| (5) | Annualized. |
| (6) | The ratios of expenses to average net assets and net investment income (loss) to average net assets do not reflect the expenses of the underlying investment companies in which the Fund invests. |
| (7) | Recognition of net investment income (loss) by the Fund is affected by the timing and declaration of dividends by the underlying investment companies in which the Fund invests. |
| (8) | Represents less than $0.01 per share. |
See accompanying notes to financial statements.
65
| FINANCIAL HIGHLIGHTS |
| Quantified Common Ground Fund |
The table sets forth financial data for one share of beneficial interest outstanding throughout the year or period.
| Investor Class | ||||||||||||||||
| Period Ended | ||||||||||||||||
| Year Ended June 30, | June 30, | |||||||||||||||
| 2023 | 2022 | 2021 | 2020 (1) | |||||||||||||
| Net asset value, beginning of year or period | $ | 12.92 | $ | 12.81 | $ | 9.37 | $ | 10.00 | ||||||||
| Activity from investment operations: | ||||||||||||||||
| Net investment income (loss) (2) | 0.05 | 0.04 | (0.10 | ) | (0.01 | ) | ||||||||||
| Net realized and unrealized gain (loss) on investments | 0.13 | (9) | 0.84 | 3.73 | (0.62 | ) | ||||||||||
| Total from investment operations | 0.18 | 0.88 | 3.63 | (0.63 | ) | |||||||||||
| Distributions to Shareholders: | ||||||||||||||||
| Net realized gains | — | (0.77 | ) | (0.19 | ) | — | ||||||||||
| Total distributions | — | (0.77 | ) | (0.19 | ) | — | ||||||||||
| Net asset value, end of year or period | $ | 13.10 | $ | 12.92 | $ | 12.81 | $ | 9.37 | ||||||||
| Total return (3) | 1.39 | % | 6.35 | % (6) | 38.99 | % | (6.30 | )% (4) | ||||||||
| Net assets, end of year or period (in 000s) | $ | 100,992 | $ | 43,520 | $ | 51,981 | $ | 19,972 | ||||||||
| Ratios/Supplemental Data: | ||||||||||||||||
| Ratio of expenses to average net assets(7) | 1.77 | % | 1.68 | % | 1.78 | % | 1.74 | % (5) | ||||||||
| Ratio of net investment income (loss) to average net assets (7,8) | 0.39 | % | 0.31 | % | (0.86 | )% | (0.12 | )% (5) | ||||||||
| Portfolio turnover rate | 1063 | % | 1382 | % | 1001 | % | 484 | % (4) | ||||||||
| (1) | The Fund commenced operations on December 27, 2019. |
| (2) | Per share amounts calculated using the average shares method, which more appropriately presents the per share data for the year or period. |
| (3) | Total returns shown assumes the reinvestment of all distributions. |
| (4) | Not Annualized. |
| (5) | Annualized. |
| (6) | Includes adjustments in accordance with accounting principles generally accepted in the United States and consequently the net asset value for financial reporting purposes and the returns based upon those net asset values may differ from the net asset values and returns for shareholder transactions. |
| (7) | The ratios of expenses to average net assets and net investment income (loss) to average net assets do not reflect the expenses of the underlying investment companies in which the Fund invests. |
| (8) | Recognition of net investment income (loss) by the Fund is affected by the timing and declaration of dividends by the underlying investment companies in which the Fund invests. |
| (9) | Net realized and unrealized gain on investments per share are balancing amounts necessary to reconcile the change in net asset value per share for the period, and may not reconcile with aggregate gains (losses) in the Statements of Operations due to the share transactions for the period. |
See accompanying notes to financial statements.
66
| FINANCIAL HIGHLIGHTS |
| Quantified Tactical Sectors Fund |
The table sets forth financial data for one share of beneficial interest outstanding throughout the year or period.
| Investor Class | ||||||||||||
| Period Ended | ||||||||||||
| Year Ended June 30, | June 30, | |||||||||||
| 2023 | 2022 | 2021 (1) | ||||||||||
| Net asset value, beginning of year or period | $ | 5.85 | $ | 10.56 | $ | 10.00 | ||||||
| Activity from investment operations: | ||||||||||||
| Net investment income (loss) (2) | 0.03 | (0.05 | ) | (0.02 | ) | |||||||
| Net realized and unrealized gain (loss) on investments | 0.82 | (4.41 | ) | 0.58 | ||||||||
| Total from investment operations | 0.85 | (4.46 | ) | 0.56 | ||||||||
| Distributions to Shareholders: | ||||||||||||
| Net investment income | (0.01 | ) | — | — | ||||||||
| Net realized gains | — | (0.25 | ) | — | ||||||||
| Total distributions | (0.01 | ) | (0.25 | ) | — | |||||||
| Net asset value, end of year or period | $ | 6.69 | $ | 5.85 | $ | 10.56 | ||||||
| Total return (3) | 14.58 | % | (42.89 | )% | 5.60 | % (4) | ||||||
| Net assets, end of year or period (in 000s) | $ | 69,952 | $ | 75,230 | $ | 54,251 | ||||||
| Ratios/Supplemental Data: | ||||||||||||
| Ratio of expenses to average net assets(6) | 1.58 | % | 1.56 | % | 1.62 | % (5) | ||||||
| Ratio of net investment income (loss) to average net assets (6,7) | 0.54 | % | (0.70 | )% | (0.66 | )% (5) | ||||||
| Portfolio turnover rate | 1223 | % | 1392 | % | 205 | % (4) | ||||||
| (1) | The Fund commenced operations on March 4, 2021. |
| (2) | Per share amounts calculated using the average shares method, which more appropriately presents the per share data for the year or period. |
| (3) | Total returns shown assumes the reinvestment of all distributions. |
| (4) | Not Annualized. |
| (5) | Annualized. |
| (6) | The ratios of expenses to average net assets and net investment income (loss) to average net assets do not reflect the expenses of the underlying investment companies in which the Fund invests. |
| (7) | Recognition of net investment income (loss) by the Fund is affected by the timing and declaration of dividends by the underlying investment companies in which the Fund invests. |
See accompanying notes to financial statements.
67
| FINANCIAL HIGHLIGHTS |
| Quantified Rising Dividend Tactical Fund |
The table sets forth financial data for one share of beneficial interest outstanding throughout the year or period.
| Investor Class | ||||||||||||
| Year Ended June 30, | Period Ended June 30, | |||||||||||
| 2023 | 2022 | 2021(1) | ||||||||||
| Net asset value, beginning of year or period | $ | 8.58 | $ | 10.24 | $ | 10.00 | ||||||
| Activity from investment operations: | ||||||||||||
| Net investment income (2) | 0.04 | 0.01 | 0.00 | (6) | ||||||||
| Net realized and unrealized gain (loss) on investments, futures and underlying investment companies | (0.67 | ) | (1.62 | ) | 0.24 | |||||||
| Total from investment operations | (0.63 | ) | (1.61 | ) | 0.24 | |||||||
| Distributions to Shareholders: | ||||||||||||
| Net investment income | — | (0.05 | ) | — | ||||||||
| Net realized gains | (0.20 | ) | — | — | ||||||||
| Total distributions | (0.20 | ) | (0.05 | ) | — | |||||||
| Net asset value, end of year or period | $ | 7.75 | $ | 8.58 | $ | 10.24 | ||||||
| Total return (3) | (7.28 | )% | (15.80 | )% | 2.40 | % (4) | ||||||
| Net assets, end of year or period (in 000s) | $ | 30,446 | $ | 27,418 | $ | 21,578 | ||||||
| Ratios/Supplemental Data: | ||||||||||||
| Ratio of gross expenses to average net assets (7) | 1.65 | % | 1.59 | % | 1.58 | % (5) | ||||||
| Ratio of net expenses to average net assets (7) | 1.62 | % | 1.59 | % | 1.58 | % (5) | ||||||
| Ratio of net investment income to average net assets (7,8) | 0.51 | % | 0.11 | % | 0.11 | % (5) | ||||||
| Portfolio turnover rate | 469 | % | 288 | % | 0 | % (4) | ||||||
| (1) | The Fund commenced operations on April 14, 2021. |
| (2) | Per share amounts calculated using the average shares method, which more appropriately presents the per share data for the year or period. |
| (3) | Total returns shown assumes the reinvestment of all distributions. |
| (4) | Not Annualized. |
| (5) | Annualized. |
| (6) | Represents less than $0.01 per share. |
| (7) | The ratios of expenses to average net assets and net investment income to average net assets do not reflect the expenses of the underlying investment companies in which the Fund invests. |
| (8) | Recognition of net investment income by the Fund is affected by the timing and declaration of dividends by the underlying investment companies in which the Fund invests. |
See accompanying notes to financial statements.
68
| FINANCIAL HIGHLIGHTS |
| Quantified Government Income Tactical Fund |
The table sets forth financial data for one share of beneficial interest outstanding throughout the year or period.
| Investor Class | ||||||||||||
| Year Ended June 30, | Period Ended June 30, | |||||||||||
| 2023 | 2022 | 2021(1) | ||||||||||
| Net asset value, beginning of year or period | $ | 9.46 | $ | 10.09 | $ | 10.00 | ||||||
| Activity from investment operations: | ||||||||||||
| Net investment income (loss)(2) | 0.13 | (0.12 | ) | (0.03 | ) | |||||||
| Net realized and unrealized gain (loss) on investments, futures and underlying investment companies | (1.51 | ) | (0.37 | ) | 0.12 | |||||||
| Total from investment operations | (1.38 | ) | (0.49 | ) | 0.09 | |||||||
| Distributions to Shareholders: | ||||||||||||
| Net realized gains | — | (0.14 | ) | — | ||||||||
| Total distributions | — | (0.14 | ) | — | ||||||||
| Net asset value, end of year or period | $ | 8.08 | $ | 9.46 | $ | 10.09 | ||||||
| Total return(3) | (14.59 | )% | (5.05 | )% | 0.90 | % (4) | ||||||
| Net assets, end of year or period (in 000s) | $ | 43,195 | $ | 66,188 | $ | 6,947 | ||||||
| Ratios/Supplemental Data: | ||||||||||||
| Ratio of gross expenses to average net assets (6) | 1.61 | % | 1.56 | % | 1.63 | % (5) | ||||||
| Ratio of net expenses to average net assets(6) | 1.59 | % | 1.56 | % | 1.63 | % (5) | ||||||
| Ratio of net investment income (loss) to average net assets (6,7) | 1.49 | % | (1.15 | )% | (1.28 | )% (5) | ||||||
| Portfolio turnover rate | 593 | % | 766 | % | 98 | % (4) | ||||||
| (1) | The Fund commenced operations on April 15, 2021. |
| (2) | Per share amounts calculated using the average shares method, which more appropriately presents the per share data for the year or period. |
| (3) | Total returns shown assumes the reinvestment of all distributions. |
| (4) | Not Annualized. |
| (5) | Annualized. |
| (6) | The ratios of expenses to average net assets and net investment income (loss) to average net assets do not reflect the expenses of the underlying investment companies in which the Fund invests. |
| (7) | Recognition of net investment income (loss) by the Fund is affected by the timing and declaration of dividends by the underlying investment companies in which the Fund invests. |
See accompanying notes to financial statements.
69
| The Quantified Funds |
| NOTES TO CONSOLIDATED FINANCIAL STATEMENTS |
| June 30, 2023 |
| 1. | ORGANIZATION |
Quantified Managed Income Fund, Quantified Market Leaders Fund, Quantified Alternative Investment Fund, Quantified STF Fund, Quantified Pattern Recognition Fund, Quantified Tactical Fixed Income Fund, Quantified Evolution Plus Fund, Quantified Common Ground Fund, Quantified Tactical Sectors Fund, Quantified Rising Dividend Tactical Fund and Quantified Government Income Tactical Fund (each a “Fund” and collectively the “Funds”) are each a diversified series (except Quantified Common Ground and Quantified Tactical Sectors Funds, which are non-diversified series), of Advisors Preferred Trust (the “Trust”), a statutory trust organized under the laws of the State of Delaware on August 15, 2012 and registered under the Investment Company Act of 1940, as amended (the “1940 Act”), as an open-end management investment company. Quantified Managed Income Fund, Quantified Market Leaders Fund, Quantified Alternative Investment Fund and Quantified STF Fund currently offer two classes of shares, Investor and Advisor classes of shares each of which are offered at Net Asset Value per share (“NAV”). Quantified Pattern Recognition Fund, Quantified Tactical Fixed Income Fund, Quantified Evolution Plus Fund, Quantified Common Ground Fund, Quantified Tactical Sectors Fund, Quantified Rising Dividend Tactical Fund and Quantified Government Income Tactical Fund currently offer Investor Class shares, which are offered at NAV.
The Funds’ commencement dates and their investment objectives are as follows:
| Fund | Investor Class | Advisor Class | Investment Objective |
| Quantified Managed Income Fund | August 9, 2013 | March 18, 2016 | seeks high total return from fixed income investments on an annual basis consistent with a moderate tolerance for risk |
| Quantified Market Leaders Fund | August 9, 2013 | March 18, 2016 | seeks high appreciation on an annual basis consistent with a high tolerance for risk |
| Quantified Alternative Investment Fund | August 9, 2013 | March 18, 2016 | seeks high total return from alternative investment vehicles on an annual basis consistent with a high tolerance for risk |
| Quantified STF Fund | November 13, 2015 | November 13, 2015 | seeks high appreciation on an annual basis consistent with a high tolerance for risk. |
| Quantified Pattern Recognition Fund | August 30, 2019 | N/A | seeks capital appreciation |
| Quantified Tactical Fixed Income Fund | September 13, 2019 | N/A | seeks total return |
| Quantified Evolution Plus Fund | September 30, 2019 | N/A | seeks capital appreciation |
| Quantified Common Ground Fund | December 27, 2019 | N/A | seeks total return |
| Quantified Tactical Sectors Fund | March 4, 2021 | N/A | seeks high appreciation on an annual basis consistent with a high tolerance for risk |
| Quantified Rising Dividend Tactical Fund | April 14, 2021 | N/A | seeks total return consistent with a moderate tolerance for risk |
| Quantified Government Income Tactical Fund | April 15, 2021 | N/A | seeks high total return consistent with a moderate tolerance for risk |
| 2. | SIGNIFICANT ACCOUNTING POLICIES |
The following is a summary of significant accounting policies followed by each Fund in preparation of their financial statements. The policies are in conformity with U.S. generally accepted accounting principles (“GAAP”). The preparation of the financial statements in conformity with GAAP requires management to make estimates and assumptions that affect the reported amounts of assets and liabilities and disclosure of contingent assets and liabilities at the date of the financial statements and the reported amounts of increases and decreases in net assets from operations during the reporting period. Actual results could differ from those estimates. Each Fund is an investment company and accordingly follows the investment company accounting and reporting guidance of the Financial Accounting Standards Board (“FASB”) Accounting Standard Codification Topic 946 Financial Services – Investment Companies including FASB Accounting Standard Update (“ASU”) 2013-08. Each Fund’s income, expenses (other than class-specific distribution and service fees) and realized and unrealized gains and losses are allocated proportionately each day based upon the relative net assets of each class.
Securities Valuation – Securities listed on an exchange are valued at the last reported sale price at the close of the regular trading session of the primary exchange on the business day the value is being determined, or in the case of securities listed on NASDAQ at the NASDAQ Official Closing Price. In the absence of a sale, such securities shall be valued at the mean between the current bid and ask prices on the day of valuation. Futures are valued at the final settled price or, in the absence of a settled price, at
70
| The Quantified Funds |
| NOTES TO CONSOLIDATED FINANCIAL STATEMENTS (Continued) |
| June 30, 2023 |
the last sale price on the day of valuation. Investments in open-end investment companies are valued at net asset value. Debt securities (other than short-term obligations) are valued each day by an independent pricing service approved by the Board of Trustees (the “Board”) based on methods which include consideration of: yields or prices of securities of comparable quality, coupon, maturity and type, indications as to values from dealers, and general market conditions or market quotations from a major market maker in the securities. Short-term debt obligations with remaining maturities in excess of sixty days are valued at current market prices by an independent pricing service approved by the Trust’s Board of Trustees. The independent pricing service does not distinguish between smaller-sized bond positions known as “odd lots” and larger institutional-sized bond positions known as “round lots”. The Funds may fair value a particular bond if the advisor does not believe that the round lot value provided by the independent pricing service reflects fair value of the Funds’ holding. Total return swaps on exchange-listed securities shall be valued at the last quoted sales price or, in the absence of a sale, at the mean between the current bid and ask prices. Exchange listed swaps shall be valued at the last quoted sales price or, in the absence of a sale, at the mean between the current bid and ask prices. Investments valued in currencies other than the U.S. dollar are converted to U.S. dollars using exchange rates obtained from pricing services. Short-term debt obligations having sixty days or less remaining until maturity, at time of purchase, may be valued at amortized cost which approximates fair value.
Each Fund may hold securities, such as private investments, interests in commodity pools, other non-traded securities or temporarily illiquid securities, for which market quotations are not readily available or are determined to be unreliable. These securities will be valued at their fair value as determined using the “fair value” procedures approved by the Board. The Board has delegated execution of these procedures to a fair value committee composed of one or more representatives from each of the (i) Trust, (ii) administrator, and (iii) advisor and/or sub-advisor. The committee may also enlist third party consultants such as a valuation specialist at a public accounting firm, valuation consultant or financial officer of a security issuer on an as-needed basis to assist in determining a security specific fair value. The Board reviews and ratifies the execution of this process and the resultant fair value prices at least quarterly to assure the process produces reliable results.
Fair Valuation Process – As noted above, the fair value committee is composed of one or more representatives from each of the (i) Trust, (ii) administrator, and (iii) advisor and/or sub-advisor. The applicable investments are valued collectively via inputs from each of these groups. For example, fair value determinations are required for the following securities: (i) securities for which market quotations are insufficient or not readily available on a particular business day (including securities for which there is a short and temporary lapse in the provision of a price by the regular pricing source) and (ii) securities for which, in the judgment of the advisor, the prices or values available do not represent the fair value of the instrument. Factors which may cause the advisor and/or sub-advisor to make such a judgment include, but are not limited to, the following: only a bid price or an asked price is available; the spread between bid and asked prices is substantial; the frequency of sales; the thinness of the market; the size of reported trades; and actions of the securities markets, such as the suspension or limitation of trading; (iii) securities determined to be illiquid; (iv) securities with respect to which an event that will affect the value thereof has occurred (a “significant event”) since the closing prices were established on the principal exchange on which they are traded, but prior to each Fund’s calculation of its net asset value. Specifically, interests in commodity pools or managed futures pools are valued on a daily basis by reference to the closing market prices of each futures contract or other asset held by a pool, as adjusted for pool expenses. Restricted or illiquid securities, such as private investments or non-traded securities are valued via inputs from the advisor based upon the current bid for the security from two or more independent dealers or other parties reasonably familiar with the facts and circumstances of the security (who should take into consideration all relevant factors as may be appropriate under the circumstances). If the advisor and/or sub-advisor is unable to obtain a current bid from such independent dealers or other independent parties, the fair value committee shall determine the fair value of such security using the following factors: (i) the type of security; (ii) the cost at date of purchase; (iii) the size and nature of the Funds’ holdings; (iv) the discount from market value of unrestricted securities of the same class at the time of purchase and subsequent thereto; (v) information as to any transactions or offers with respect to the security; (vi) the nature and duration of restrictions on disposition of the security and the existence of any registration rights; (vii) how the yield of the security compares to similar securities of companies of similar or equal creditworthiness;
71
| The Quantified Funds |
| NOTES TO CONSOLIDATED FINANCIAL STATEMENTS (Continued) |
| June 30, 2023 |
(viii) the level of recent trades of similar or comparable securities; (ix) the liquidity characteristics of the security; (x) current market conditions; and (xi) the market value of any securities into which the security is convertible or exchangeable.
Valuation of Fund of Funds – Each Fund invests in portfolios of exchange traded funds and open-end funds or closed-end investment companies (the “Underlying Funds”). The Underlying Funds value securities in their portfolios for which market quotations are readily available at their market values (generally the last reported sale price) and all other securities and assets at their fair value based upon the methods established by the board of directors of the Underlying Funds.
Open-end mutual funds are valued at their respective net asset values as reported by such investment companies. The shares of many Underlying Funds frequently trade at a price per share, which is different than the net asset value per share. The difference represents a market premium or market discount of such shares. There can be no assurances that the market discount or market premium on shares of any Underlying Funds purchased by the Funds will not change.
Units of Mount Vernon Liquid Assets Portfolio, LLC are not traded on or exchange and are valued at the investment company’s NAV per unit without further adjustment, as a practical expedient of fair value.
The Funds utilize various methods to measure the fair value of all of their investments on a recurring basis. GAAP establishes a hierarchy that prioritizes inputs to valuation methods. The three levels of input are:
Level 1 – Unadjusted quoted prices in active markets for identical assets and liabilities that the Funds have the ability to access.
Level 2 – Observable inputs other than quoted prices included in Level 1 that are observable for the asset or liability, either directly or indirectly. These inputs may include quoted prices for the identical instrument on an inactive market, prices for similar instruments, interest rates, prepayment speeds, credit risk, yield curves, default rates and similar data.
Level 3 – Unobservable inputs for the asset or liability, to the extent relevant observable inputs are not available, representing the Funds’ own assumptions about the assumptions a market participant would use in valuing the asset or liability, and would be based on the best information available.
The availability of observable inputs can vary from security to security and is affected by a wide variety of factors, including, for example, the type of security, whether the security is new and not yet established in the marketplace, the liquidity of markets, and other characteristics particular to the security. To the extent that valuation is based on models or inputs that are less observable or unobservable in the market, the determination of fair value requires more judgment. Accordingly, the degree of judgment exercised in determining fair value is greatest for instruments categorized in Level 3.
The inputs used to measure fair value may fall into different levels of the fair value hierarchy. In such cases, for disclosure purposes, the level in the fair value hierarchy within which the fair value measurement falls in its entirety, is determined based on the lowest level input that is significant to the fair value measurement in its entirety.
72
| The Quantified Funds |
| NOTES TO CONSOLIDATED FINANCIAL STATEMENTS (Continued) |
| June 30, 2023 |
The inputs or methodology used for valuing securities are not necessarily an indication of the risk associated with investing in those securities. The following tables summarize the inputs used as of June 30, 2023 for each Fund’s assets and liabilities measured at fair value:
| Quantified Managed Income Fund | ||||||||||||||||
| Assets | Level 1 | Level 2 | Level 3 | Total | ||||||||||||
| Investments | ||||||||||||||||
| Common Stocks * | $ | 14,058,258 | $ | — | $ | — | $ | 14,058,258 | ||||||||
| Exchange-Traded Funds | 53,715,987 | — | — | 53,715,987 | ||||||||||||
| Short-Term Investments | 55,411,262 | — | — | 55,411,262 | ||||||||||||
| Collateral For Securities Loaned | — | — | — | 17,870,186 | ** | |||||||||||
| Total Investments | $ | 123,185,507 | $ | — | $ | — | $ | 141,055,693 | ||||||||
| Derivatives | ||||||||||||||||
| Futures Contracts | $ | 25,828 | $ | — | $ | — | $ | 25,828 | ||||||||
| Total Assets | $ | 123,211,335 | $ | — | $ | — | $ | 141,081,521 | ||||||||
| Liabilities | ||||||||||||||||
| Derivatives | ||||||||||||||||
| Futures Contracts | $ | (165,475 | ) | $ | — | $ | — | $ | (165,475 | ) | ||||||
| Total Liabilities | $ | (165,475 | ) | $ | — | $ | — | $ | (165,475 | ) | ||||||
| Quantified Market Leaders Fund | ||||||||||||||||
| Assets | Level 1 | Level 2 | Level 3 | Total | ||||||||||||
| Investments | ||||||||||||||||
| Exchange-Traded Funds | $ | 137,622,063 | $ | — | $ | — | $ | 137,622,063 | ||||||||
| Short-Term Investments | 37,517,647 | — | — | 37,517,647 | ||||||||||||
| Collateral For Securities Loaned | — | — | — | 9,223,617 | ** | |||||||||||
| Total Investments | $ | 175,139,710 | $ | — | $ | — | $ | 184,363,327 | ||||||||
| Derivatives | ||||||||||||||||
| Total Return Swaps | $ | — | $ | 4,840,997 | $ | — | $ | 4,840,997 | ||||||||
| Total Assets | $ | 175,139,710 | $ | 4,840,997 | $ | — | $ | 189,204,324 | ||||||||
| Quantified Alternative Investment Fund | ||||||||||||||||
| Assets | Level 1 | Level 2 | Level 3 | Total | ||||||||||||
| Investments | ||||||||||||||||
| Exchange-Traded Funds | $ | 3,772,940 | $ | — | $ | — | $ | 3,772,940 | ||||||||
| Open-End Mutual Funds | 2,005,007 | — | — | 2,005,007 | ||||||||||||
| Short-Term Investments | 757,775 | — | — | 757,775 | ||||||||||||
| Collateral For Securities Loaned | — | — | — | 311,924 | ** | |||||||||||
| Total Investments | $ | 6,535,722 | $ | — | $ | — | $ | 6,847,646 | ||||||||
| Derivatives | ||||||||||||||||
| Futures Contracts | $ | 14,865 | $ | — | $ | — | $ | 14,865 | ||||||||
| Total Assets | $ | 6,550,587 | $ | — | $ | — | $ | 6,862,511 | ||||||||
| Quantified STF Fund | ||||||||||||||||
| Assets | Level 1 | Level 2 | Level 3 | Total | ||||||||||||
| Investments | ||||||||||||||||
| Exchange-Traded Funds | $ | 18,471 | $ | — | $ | — | $ | 18,471 | ||||||||
| Corporate Bonds * | — | 24,421,807 | — | 24,421,807 | ||||||||||||
| U.S. Government & Agencies | — | 3,971,336 | — | 3,971,336 | ||||||||||||
| Certificate of Deposit * | — | 14,490,410 | — | 14,490,410 | ||||||||||||
| Short-Term Investments | 109,793,527 | — | — | 109,793,527 | ||||||||||||
| Collateral For Securities Loaned | — | — | — | 1,000,000 | ** | |||||||||||
| Total Investments | $ | 109,811,998 | $ | 42,883,553 | $ | — | $ | 153,695,551 | ||||||||
| Derivatives | ||||||||||||||||
| Futures Contracts | $ | 8,939,388 | $ | — | $ | — | $ | 8,939,388 | ||||||||
| Total Assets | $ | 118,751,386 | $ | 42,883,553 | $ | — | $ | 162,634,939 | ||||||||
73
| The Quantified Funds |
| NOTES TO CONSOLIDATED FINANCIAL STATEMENTS (Continued) |
| June 30, 2023 |
| Quantified Pattern Recognition Fund | ||||||||||||||||
| Assets | Level 1 | Level 2 | Level 3 | Total | ||||||||||||
| Investments | ||||||||||||||||
| Exchange-Traded Funds | $ | 44,328 | $ | — | $ | — | $ | 44,328 | ||||||||
| Corporate Bond * | — | 989,838 | — | 989,838 | ||||||||||||
| U.S. Government & Agencies | — | 1,984,254 | — | 1,984,254 | ||||||||||||
| Certificate of Deposit * | — | 4,985,071 | — | 4,985,071 | ||||||||||||
| Short-Term Investments | 48,989,291 | — | — | 48,989,291 | ||||||||||||
| Total Investments | $ | 49,033,619 | $ | 7,959,163 | $ | — | $ | 56,992,782 | ||||||||
| Liabilities | ||||||||||||||||
| Derivatives | ||||||||||||||||
| Futures Contracts | $ | (505,027 | ) | $ | — | $ | — | $ | (505,027 | ) | ||||||
| Total Liabilities | $ | (505,027 | ) | $ | — | $ | — | $ | (505,027 | ) | ||||||
| Quantified Tactical Fixed Income Fund | ||||||||||||||||
| Assets | Level 1 | Level 2 | Level 3 | Total | ||||||||||||
| Investments | ||||||||||||||||
| Exchange-Traded Fund | $ | 30,882 | $ | — | $ | — | $ | 30,882 | ||||||||
| Corporate Bonds* | — | 23,483,191 | — | 23,483,191 | ||||||||||||
| U.S. Government & Agencies | — | 3,971,336 | — | 3,971,336 | ||||||||||||
| Certificate of Deposit * | — | 13,511,868 | — | 13,511,868 | ||||||||||||
| Short-Term Investments | 41,913,327 | — | — | 41,913,327 | ||||||||||||
| Collateral For Securities Loaned | — | — | — | 930,320 | ** | |||||||||||
| Total Investments | $ | 41,944,209 | $ | 40,966,395 | $ | — | $ | 83,840,924 | ||||||||
| Derivatives | ||||||||||||||||
| Futures Contracts | $ | 65,281 | $ | — | $ | — | $ | 65,281 | ||||||||
| Total Assets | $ | 42,009,490 | $ | 40,966,395 | $ | — | $ | 83,906,205 | ||||||||
| Quantified Evolution Plus Fund | ||||||||||||||||
| Assets | Level 1 | Level 2 | Level 3 | Total | ||||||||||||
| Investments | ||||||||||||||||
| Exchange-Traded Fund | $ | 199,476 | $ | — | $ | — | $ | 199,476 | ||||||||
| Corporate Bond * | — | 989,838 | — | 989,838 | ||||||||||||
| U.S.Government & Agencies | — | 1,984,254 | — | 1,984,254 | ||||||||||||
| Certificate of Deposit * | — | 3,984,734 | — | 3,984,734 | ||||||||||||
| Short-Term Investments | 29,270,202 | — | — | 29,270,202 | ||||||||||||
| Total Investments | $ | 29,469,678 | $ | 6,958,826 | $ | — | $ | 36,428,504 | ||||||||
| Derivatives | ||||||||||||||||
| Futures Contracts | $ | 250,313 | $ | — | $ | — | $ | 250,313 | ||||||||
| Total Return Swaps | — | 203,225 | — | 203,225 | ||||||||||||
| Total Assets | $ | 29,719,991 | $ | 7,162,051 | $ | — | $ | 36,882,042 | ||||||||
| Liabilities | ||||||||||||||||
| Derivatives | ||||||||||||||||
| Total Return Swaps | $ | — | $ | (730,573 | ) | $ | — | $ | (730,573 | ) | ||||||
| Total Liabilities | $ | — | $ | (730,573 | ) | $ | — | $ | (730,573 | ) | ||||||
74
| The Quantified Funds |
| NOTES TO CONSOLIDATED FINANCIAL STATEMENTS (Continued) |
| June 30, 2023 |
| Quantified Common Ground Fund | ||||||||||||||||
| Assets | Level 1 | Level 2 | Level 3 | Total | ||||||||||||
| Investments | ||||||||||||||||
| Common Stocks * | $ | 92,822,556 | $ | — | $ | — | $ | 92,822,556 | ||||||||
| Short-Term Investments | 9,769,301 | — | — | 9,769,301 | ||||||||||||
| Collateral For Securities Loaned | — | — | — | 30,381,715 | ** | |||||||||||
| Total Investments | $ | 102,591,857 | $ | — | $ | — | $ | 132,973,572 | ||||||||
| Quantified Tactical Sectors Fund | ||||||||||||||||
| Assets | Level 1 | Level 2 | Level 3 | Total | ||||||||||||
| Investments | ||||||||||||||||
| Exchange-Traded Funds | $ | 56,610,818 | $ | — | $ | — | $ | 56,610,818 | ||||||||
| Short-Term Investments | 14,463,271 | — | — | 14,463,271 | ||||||||||||
| Collateral For Securities Loaned | — | — | — | 19,442,337 | ** | |||||||||||
| Total Investments | $ | 71,074,089 | $ | — | $ | — | $ | 90,516,426 | ||||||||
| Derivatives | ||||||||||||||||
| Total Return Swaps | $ | — | $ | 5,088,126 | $ | — | $ | 5,088,126 | ||||||||
| Total Assets | $ | 71,074,089 | $ | 5,088,126 | $ | — | $ | 95,604,552 | ||||||||
| Quantified Rising Dividend Tactical Fund | ||||||||||||||||
| Assets | Level 1 | Level 2 | Level 3 | Total | ||||||||||||
| Investments | ||||||||||||||||
| Exchange-Traded Funds | $ | 26,376,562 | $ | — | $ | — | $ | 26,376,562 | ||||||||
| Short-Term Investments | 3,616,968 | — | — | 3,616,968 | ||||||||||||
| Total Investments | $ | 29,993,530 | $ | — | $ | — | $ | 29,993,530 | ||||||||
| Derivatives | ||||||||||||||||
| Total Return Swaps | $ | — | $ | 436,779 | $ | — | $ | 436,779 | ||||||||
| Total Assets | $ | 29,993,530 | $ | 436,779 | $ | — | $ | 30,430,309 | ||||||||
| Liabilities | ||||||||||||||||
| Derivatives | ||||||||||||||||
| Total Return Swaps | $ | — | $ | (4,421 | ) | $ | — | $ | (4,421 | ) | ||||||
| Total Liabilities | $ | — | $ | (4,421 | ) | $ | — | $ | (4,421 | ) | ||||||
| Quantified Government Income Tactical Fund | ||||||||||||||||
| Assets | Level 1 | Level 2 | Level 3 | Total | ||||||||||||
| Investments | ||||||||||||||||
| Exchange-Traded Fund | 123,528 | $ | — | $ | — | $ | 123,528 | |||||||||
| Corporate Bond * | — | 989,838 | — | 989,838 | ||||||||||||
| U.S. Government & Agencies | — | 1,984,254 | — | 1,984,254 | ||||||||||||
| Certificates of Deposit * | — | 3,984,734 | — | 3,984,734 | ||||||||||||
| Short-Term Investments | 33,767,686 | — | — | 33,767,686 | ||||||||||||
| Total Investments | $ | 33,891,214 | $ | 6,958,826 | $ | — | $ | 40,850,040 | ||||||||
| Derivatives | ||||||||||||||||
| Futures Contracts | $ | 23,363 | $ | — | $ | — | $ | 23,363 | ||||||||
| Total Assets | $ | 33,914,577 | $ | 6,958,826 | $ | — | $ | 40,873,403 | ||||||||
| * | Refer to each of the Schedule of Investments for industry classifications. |
| ** | Investment valued using the NAV per share practical expedient. In accordance with Topic 820, the investment is excluded from the fair value. |
The Funds did not hold any Level 3 securities during the year ended June 30, 2023.
75
| The Quantified Funds |
| NOTES TO CONSOLIDATED FINANCIAL STATEMENTS (Continued) |
| June 30, 2023 |
Consolidation of Subsidiaries – The consolidated financial statements of the Quantified Evolution Plus Fund include the accounts of QEPF Fund Limited (“QEPF Ltd.”), a wholly-owned subsidiary. All inter-company accounts and transactions have been eliminated in consolidation. The Fund may invest up to 25% of its total assets in QEPF Ltd., which acts as an investment vehicle in order to affect certain investments consistent with the Fund’s investment objectives and policies. The subsidiary commenced operations on December 30, 2019 and is an exempted Cayman Islands company with limited liability.
A summary of the Fund’s investment in QEPF Ltd. is as follows:
| Inception Date | QEPF Ltd. Net Assets at | % Of Net Assets at | |
| of QEPF Ltd. | June 30, 2023 | June 30, 2023 | |
| QEPF Ltd. | 12/30/19 | $5,430,706 | 11.0% |
Exchange Traded Funds (“ETFs”), Mutual Funds and Exchange Traded Notes (“ETNs”) Risk – ETFs, mutual funds and ETNs are subject to investment advisory or management and other expenses, which will be indirectly paid by the Funds. Each is subject to specific risks, depending on investment strategy. Also, each may be subject to leverage risk, which will magnify losses. ETNs are subject to default risks.
Each Fund invests in ETFs. ETFs are typically a type of index fund bought and sold on a securities exchange. An ETF trades like common stock and typically represents a fixed portfolio of securities designed to track the performance and dividend yield of a particular domestic or foreign market index. Each Fund may purchase an ETF to temporarily gain exposure to a portion of the U.S. or a foreign market. The risks of owning an ETF generally reflect the risks of owning the underlying securities they are designed to track, although the lack of liquidity on an ETF could result in it being more volatile. Additionally, ETFs have fees and expenses that reduce their value.
Cash Accounts – At times, the Funds may invest cash in a short-term deposit sweep vehicle program. Such deposits are in amounts at any such depositary institution not in excess of the Federal Deposit Insurance Corporation (“FDIC”) or National Credit Union Share Insurance Fund standard maximum deposit insurance amount such that funds are insured across the various banks or credit unions at which such funds are deposited. StoneCastle Cash Management, LLC (“StoneCastle”) provides ministerial deposit placement assistance to the Funds with respect to the short-term deposit sweep vehicle program. These deposits are not custodied by StoneCastle. These amounts are included as Cash on the Statements of Assets and Liabilities to the extent they are held by the Funds as of June 30, 2023.
Foreign Currency Translations – All assets and liabilities denominated in foreign currencies are translated into U.S. dollars based on the rate of exchange of such currencies against U.S. dollars on the date of valuation. Purchases and sales of securities and income and expenses are translated at the rate of exchange quoted on the respective date that such transactions are recorded. The Funds do not isolate the portion of the results of operations resulting from changes in foreign exchange rates on investments from the fluctuations arising from changes in market prices of securities held. These amounts are included with Net realized and unrealized gain/(loss) on Investments in the Statements of Operations. Each Fund’s investments in foreign securities are subject to foreign currency fluctuations, higher volatility than U.S. securities, varying degrees of regulation and limited liquidity. Greater political, economic, credit and information risks are also associated with foreign securities.
Swap Contracts – Each Fund is subject to equity price risk, interest rate risk, credit risk and counterparty risk in the normal course of pursuing its investment objective. Each Fund may enter into various swap transactions for investment purposes or to manage interest rate, equity, or credit risk. These would be two-party contracts entered into primarily to exchange the returns (or differentials in rates of returns) earned or realized on particular pre-determined investments or instruments.
Standard equity swap contracts are between two parties that agree to exchange the returns (or differentials in rates of return) earned or realized on particular predetermined investments or instruments. The gross amount to be exchanged is calculated with respect to a “notional amount” (i.e. the return on or
76
| The Quantified Funds |
| NOTES TO CONSOLIDATED FINANCIAL STATEMENTS (Continued) |
| June 30, 2023 |
increase in value of a particular dollar amount invested in a security or “basket” of securities representing a particular index or industry sector on underlying fund). Most equity swap agreements entered into by a Fund calculate the obligations of the parties on a “net basis”. Consequently, a Fund’s current obligations under a swap agreement generally will be equal to the net amount to be paid or received under the agreement based on the relative value of the positions held by each party. Each Fund’s obligations are accrued daily (offset by any amounts owed to the Fund).
Each Fund may enter into swap contracts that provide the opposite return of the particular benchmark or security (“short” the index or security). The operations are similar to that of the swaps disclosed above except that the counterparty pays interest to the Fund on the notional amount outstanding and the dividends on the underlying securities reduce the return of the swap. However, in certain instances, market factors such as the interest rate environment and the demand to borrow the securities underlying the swap agreement can cause a scenario in which the Fund pays the counterparty interest. These amounts are netted with any unrealized appreciation or depreciation to determine the value of the swap. The Funds will typically enter into equity swap agreements in instances where the advisor believes that it may be more cost effective or practical than buying a security or the securities represented by a particular index.
Each Fund may enter into credit default swaps (“CDS”). CDS are typically two-party (bilateral) financial contracts that transfer credit exposure between the two parties. One party to a CDS (referred to as the credit protection “buyer”) receives credit protection or sheds credit risk, whereas the other party to a CDS (referred to as the credit protection “seller”) is selling credit protection or taking on credit risk. The seller typically receives pre-determined periodic payments from the other party. These payments are in consideration for agreeing to make compensating specific payments to the buyer should a negative credit event occur, such as (1) bankruptcy or (2) failure to pay interest or principal on a reference debt instrument, with respect to a specified issuer or one of the reference issuers in a CDS portfolio. In general, CDS may be used by a Fund to obtain credit risk exposure similar to that of a direct investment in high yield bonds.
The amounts to be exchanged or “swapped” between parties are calculated with respect to the notional amount. Changes in the value of swap agreements are recognized as unrealized gains or losses in the Statements of Operations by “marking to market” on a daily basis to reflect the value of the swap agreement at the end of each trading day. Payments received or paid at the beginning of the agreement are reflected as such on the Statements of Assets and Liabilities and may be referred to as upfront payments. A liquidation payment received or made at the termination of the swap agreement is recorded as a realized gain or loss on the Statements of Operations. The maximum pay-outs for these contracts are limited to the notional amount of each swap. CDS may involve greater risks than if a Fund had invested in the referenced obligation directly and are subject to general market risk, liquidity risk, counterparty risk and credit risk.
Each Fund may enter into Interest Rate Swaps. Interest rate swaps involve the exchange of commitments to pay and receive interest based on a notional principal amount. Each Fund may elect to pay a fixed rate and receive a floating rate, or receive a fixed rate and pay a floating rate on a notional principal amount.
Each Fund may enter into Total Return Swaps (“TRS”). Total Return Swaps are typically two-party (bilateral) financial contracts which one party makes payments based on a set rate, either fixed or variable, while the other party makes payments based on the return of an underlying asset, which includes both the income it generates and any capital gains. In total return swaps, the underlying asset, referred to as the reference asset, is usually an equity, equity index, loans, or bonds. This is owned by the party receiving the set rate payment. The TRS allows one party to derive the economic benefit of owning an asset without putting that asset on its balance sheet, and allows the other party, which does retain that asset on its balance sheet, to buy protection against loss in its value.
Each Fund collateralizes swap agreements with cash and certain securities as indicated on the Schedule of Investments of the Fund and Statements of Assets and Liabilities, respectively. Such collateral is held for the benefit of the counterparty in a segregated account at the Custodian to protect the counterparty
77
| The Quantified Funds |
| NOTES TO CONSOLIDATED FINANCIAL STATEMENTS (Continued) |
| June 30, 2023 |
against non-payment by the Fund. Each Fund does not net collateral. In addition, the parties have mutually agreed to settle significant unrealized appreciation / depreciation on the swap contracts as they occur, resulting in an advance or prepayment on such swaps. Such amounts, if any, would be offset against the applicable contract upon final settlement. In the event of a default by the counterparty, a Fund will seek return of this collateral and may incur certain costs exercising its rights with respect to the collateral. Amounts expected to be owed to a Fund may be collateralized either directly with the Fund or in a segregated account at the custodian.
Each Fund bears the risk of loss of the amount expected to be received under a swap agreement in the event of the default or bankruptcy of a swap agreement counterparty to the extent that posted collateral is insufficient. Each Fund will enter into swap agreements only with large, well-capitalized and established financial institutions. The creditworthiness of each of the firms that is counterparty to a swap agreement is monitored by the Advisor. The financial statements of these counterparties may be available by accessing the SEC’s website, at www.sec.gov.
International Swaps and Derivatives Association, Inc. Master Agreements (“ISDA Master Agreements”) govern OTC financial derivative transactions entered into by the Funds and their counterparties. The ISDA Master Agreements maintain provisions for general obligations, representations, agreements, collateral and events of default or termination. Events of termination include conditions that may entitle counterparties to elect to terminate early and cause settlement of all outstanding transactions under the applicable ISDA Master Agreements. Any election to early terminate could be material to the financial statements. For the year ended June 30, 2023, Quantified Market Leaders Fund, Quantified Tactical Fixed Income Fund, Quantified Evolution Plus Fund, Quantified Tactical Sectors Fund and Quantified Rising Dividend Tactical Fund entered into total return swaps and are subject to applicable master netting arrangements.
Futures Contracts – Each Fund may be subject to the change in value of equity and interest rate risk in the normal course of pursuing its investment objective. Each Fund may purchase or sell futures contracts to gain exposure to, or hedge against, changes in the value of equities and interest rates. Initial margin deposits required upon entering into futures contracts are satisfied by the segregation of specific securities or cash as collateral for the account of the broker (each Fund’s agent in acquiring the futures position). During the period the futures contracts are open, changes in the value of the contracts are recognized as unrealized gains or losses by “marking to market” on a daily basis to reflect the market value of the contracts at the end of each day’s trading. When the contracts are closed, each Fund recognizes a realized gain or loss equal to the difference between the proceeds from, or cost of, the closing transaction and each Fund’s basis in the contract. If the Funds are unable to liquidate a futures contract and/or enter into an offsetting closing transaction, each Fund would continue to be subject to market risk with respect to the value of the contracts and continue to be required to maintain the margin deposits on the futures contracts. Each Fund segregates cash having a value at least equal to the amount of the current obligation under any open futures contract. Risks may exceed amounts recorded in the Statements of Assets and Liabilities. With futures, there is minimal counterparty credit risk to each Fund since futures are exchange traded and the exchange’s clearinghouse, as counterparty to all exchange traded futures, guarantees the futures against default.
During the normal course of business, each Fund purchases and sells various financial instruments, which may result in risks, the amount of which is not apparent from the financial statements.
Security Transactions and Related Income – Security transactions are accounted for on trade date. Interest income is recognized on an accrual basis. Discounts are accreted and premiums are amortized on securities purchased over the lives of the respective securities using the effective interest method. Dividend income is recorded on the ex-dividend date. Realized gains or losses from sales of securities are determined by comparing the identified cost of the security lot sold with the net sales proceeds. Foreign withholding tax is recorded as incurred or known, in accordance with the Funds’ understanding of the applicable country’s tax rules and rates.
78
| The Quantified Funds |
| NOTES TO CONSOLIDATED FINANCIAL STATEMENTS (Continued) |
| June 30, 2023 |
Dividends and Distributions to Shareholders – Dividends from net investment income, if any, are declared and paid annually. Distributable net realized capital gains, if any, are declared and distributed annually in December. Dividends from net investment income and distributions from net realized gains are recorded on ex-dividend date and are determined in accordance with federal income tax regulations, which may differ from GAAP. These “book/tax” differences are considered either temporary (i.e., deferred losses, capital loss carry forwards) or permanent in nature. To the extent these differences are permanent in nature, such amounts are reclassified within the composition of net assets based on their federal tax-basis treatment; temporary differences do not require reclassification. These reclassifications have no effect on net assets, results from operations or net asset value per share of the Funds.
Federal Income Tax – It is each Fund’s policy to continue to qualify as a regulated investment company by complying with the provisions of the Internal Revenue Code that are applicable to regulated investment companies and to distribute substantially all of its taxable income and net realized gains to shareholders. Therefore, no federal income tax provision is required.
The Funds recognize the tax benefits of uncertain tax positions only where the position is “more likely than not” to be sustained assuming examination by tax authorities. Management has analyzed each Fund’s tax positions, and has concluded that no liability for unrecognized tax benefits should be recorded related to uncertain tax positions taken on returns filed for the open tax years (June 30, 2020 – June 30, 2022) or expected to be taken in the Funds’ June 30, 2023 tax returns. The Funds identify their major tax jurisdictions as U.S. Federal, and foreign jurisdictions where each Fund makes significant investments; however the Funds are not aware of any tax positions for which it is reasonably possible that the total amounts of unrecognized tax benefits will change materially in the next twelve months.
For tax purposes, QEPF Ltd. is an exempted Cayman Islands investment company. QEPF has received an undertaking from the Government of the Cayman Islands exempting it from all local income, profits, and capital gains taxes. No such taxes are levied in the Cayman Islands at the present time. For U.S. income tax purposes, QEPF is a controlled foreign corporation (“CFC”) and as such is not subject to U.S. income tax. However, as a wholly-owned CFC, the net income and capital gain of the CFC, to the extent of its earnings and profits, will be included each year in Quantified Evolution Plus Fund’s investment company taxable income.
Expenses – Expenses of the Trust that are directly identifiable to a specific fund are charged to that fund. Expenses that are not readily identifiable to a specific fund are allocated in such a manner as deemed equitable, taking into consideration the nature and type of expense and the relative sizes of the funds in the Trust.
Indemnification – The Trust indemnifies its officers and Trustees for certain liabilities that may arise from the performance of their duties to the Trust. Additionally, in the normal course of business, each Fund enters into contracts that contain a variety of representations and warranties and which provide general indemnities. Each Fund’s maximum exposure under these arrangements is unknown, as this would involve future claims that may be made against the Funds that have not yet occurred. However, based on experience, the risk of loss due to these warranties and indemnities appears to be remote.
79
| The Quantified Funds |
| NOTES TO CONSOLIDATED FINANCIAL STATEMENTS (Continued) |
| June 30, 2023 |
| 3. | INVESTMENT TRANSACTIONS |
The cost of purchases and proceeds from sale of securities, other than short-term investments, swaps and futures contracts, for the year ended June 30, 2023 for the Funds were as follows:
| Fund | Purchases | Sales | ||||||
| Quantified Managed Income Fund | $ | 538,821,769 | $ | 485,490,960 | ||||
| Quantified Market Leaders Fund | 2,315,432,536 | 2,291,202,125 | ||||||
| Quantified Alternative Investment Fund | 80,682,268 | 80,068,605 | ||||||
| Quantified STF Fund | 40,000,965 | 61,556,117 | ||||||
| Quantified Pattern Recognition Fund | 17,745,481 | 12,533,385 | ||||||
| Quantified Tactical Fixed Income Fund | 31,173,359 | 43,122,116 | ||||||
| Quantified Evolution Plus Fund | 30,437,915 | 44,311,181 | ||||||
| Quantified Common Ground Fund | 837,270,329 | 772,043,122 | ||||||
| Quantified Tactical Sectors Fund | 781,685,248 | 771,276,696 | ||||||
| Quantified Rising Dividend Tactical Fund | 110,552,955 | 110,137,345 | ||||||
| Quantified Government Income Tactical Fund | 23,888,658 | 33,495,946 | ||||||
| 4. | IMPACT OF DERIVATIVES ON THE STATEMENTS OF ASSETS AND LIABILITIES AND STATEMENTS OF OPERATIONS |
The following is a summary of the location of derivative investments on the Funds’ Statements of Assets and Liabilities as of June 30, 2023:
| Derivative Investment Type | Location on the Statements of Assets and Liabilities |
| Futures | Unrealized appreciation (depreciation) on futures |
| Swaps | Unrealized appreciation (depreciation) on swaps |
| Asset derivatives | |||||||
| Quantified Managed Income Fund | Futures - Interest Rate Contracts | $ | 25,828 | ||||
| Quantified Market Leaders Fund | Swaps - Equity Contracts | 4,840,997 | |||||
| Quantified Alternative Investment Fund | Futures - Equity Contracts | 14,084 | |||||
| Futures - Interest Rate Contracts | 781 | ||||||
| Quantified STF Fund | Futures - Equity Contracts | 8,939,388 | |||||
| Quantified Tactical Fixed Income Fund | Futures - Interest Rate Contracts | 65,281 | |||||
| Quantified Evolution Plus Fund | Futures - Equity Contracts | 250,313 | |||||
| Swaps - Equity Contracts | 203,225 | ||||||
| Quantified Tactical Sector Fund | Swaps - Equity Contracts | 5,088,126 | |||||
| Quantified Rising Dividend Tactical Fund | Swaps - Equity Contracts | 436,779 | |||||
| Quantified Government Income Tactical Fund | Futures - Interest Rate Contracts | 23,363 | |||||
| Liability derivatives | |||||||
| Quantified Managed Income Fund | Futures - Equity Contracts | $ | (165,475 | ) | |||
| Quantified Pattern Recognition Fund | Futures - Equity Contracts | (505,027 | ) | ||||
| Quantified Evolution Plus Fund | Swaps - Equity Contracts | (730,573 | ) | ||||
| Quantified Rising Dividend Tactical Fund | Swaps - Equity Contracts | (4,421 | ) | ||||
80
| The Quantified Funds |
| NOTES TO CONSOLIDATED FINANCIAL STATEMENTS (Continued) |
| June 30, 2023 |
Transactions in derivative instruments during the year ended June 30, 2023, were as follows:
| Statements of Operations location | Equity/Interest Rate/Credit/Commodity/ Currency Contracts | ||||||
| Quantified Managed Income Fund | Net Realized gain (loss) from: (1) | ||||||
| Interest Rate Risk | Futures | $ | (5,408,981 | ) | |||
| Equity Risk | Futures | (1,287,873 | ) | ||||
| (6,696,854 | ) | ||||||
| Net Change in unrealized appreciation (depreciation) on: (2) | |||||||
| Interest Rate Risk | Futures | $ | 379,167 | ||||
| Equity Risk | Futures | (65,090 | ) | ||||
| 314,077 | |||||||
| Quantified Market Leaders Fund | Net Realized gain (loss) from: (1) | ||||||
| Equity Risk | Swaps | $ | (3,585,927 | ) | |||
| Net Change in unrealized appreciation (depreciation) on: (2) | |||||||
| Equity Risk | Swaps | $ | 4,840,997 | ||||
| Quantified Alternative Investment Fund | Net Realized gain (loss) from: (1) | ||||||
| Equity Risk | Futures | $ | 75,104 | ||||
| Interest Rate Risk | Futures | (319,584 | ) | ||||
| (244,480 | ) | ||||||
| Net Change in unrealized appreciation (depreciation) on: (2) | |||||||
| Equity Risk | Futures | $ | 10,494 | ||||
| Interest Rate Risk | Futures | 16,814 | |||||
| 27,308 | |||||||
| Quantified STF Fund | Net Realized gain (loss) from: (1) | ||||||
| Equity Risk | Futures | $ | 15,163,494 | ||||
| Net Change in unrealized appreciation (depreciation) on: (2) | |||||||
| Equity Risk | Futures | $ | 7,232,759 | ||||
| Quantified Pattern Recognition Fund | Net Realized gain (loss) from: (1) | ||||||
| Equity Risk | Futures | $ | 6,942,595 | ||||
| Net Change in unrealized appreciation (depreciation) on: (2) | |||||||
| Equity Risk | Futures | $ | (187,589 | ) | |||
| Quantified Tactical Fixed Income Fund | Net Realized gain (loss) from: (1) | ||||||
| Interest Rate Risk | Futures | $ | (17,382,421 | ) | |||
| Credit Risk | Swaps | (1,707,023 | ) | ||||
| Net Change in unrealized appreciation (depreciation) on: (2) | |||||||
| Interest Rate Risk | Futures | $ | (520,205 | ) | |||
| Quantified Evolution Plus Fund (Consolidated) | Net Realized gain (loss) from: (1) | ||||||
| Commodity Risk | Futures | $ | 1,759,713 | ||||
| Currency Risk | Futures | (1,312,867 | ) | ||||
| Equity Risk | Futures | (2,103,153 | ) | ||||
| Interest Rate Risk | Futures | (1,012,286 | ) | ||||
| (2,668,593 | ) | ||||||
| Commodity Risk | Swaps | (286,628 | ) | ||||
| Quantified Evolution Plus Fund | Net Change in unrealized appreciation (depreciation) on: (2) | ||||||
| Commodity Risk | Futures | $ | 174,191 | ||||
| Equity Risk | Futures | (534,559 | ) | ||||
| Interest Rate Risk | Futures | (1,422 | ) | ||||
| (361,790 | ) | ||||||
| Equity Risk | Swaps | (527,348 | ) | ||||
| Quantified Tactical Sectors Fund | Net Realized gain (loss) from: (1) | ||||||
| Equity Risk | Swaps | $ | (7,736,777 | ) | |||
| Net Change in unrealized appreciation (depreciation) on: (2) | |||||||
| Equity Risk | Swaps | $ | 5,088,126 | ||||
| Quantified Rising Dividend Tactical Fund | Net Realized gain (loss) from: (1) | ||||||
| Equity Risk | Swaps | $ | (2,425,592 | ) | |||
| Net Change in unrealized appreciation (depreciation) on: (2) | |||||||
| Equity Risk | Swaps | $ | 432,358 | ||||
| Quantified Government Income Tactical Fund | Net Realized gain (loss) from: (1) | ||||||
| Interest Rate Risk | Futures | $ | (7,208,223 | ) | |||
| Net Change in unrealized appreciation (depreciation) on: (2) | |||||||
| Interest Rate Risk | Futures | $ | (209,223 | ) | |||
| (1) | Statement of Operations location: Net realized gain (loss) from futures, Net realized gain (loss) from swaps. |
| (2) | Statement of Operations location: Net change in unrealized appreciation (depreciation) on futures, Net change in unrealized appreciation (depreciation) on swaps. |
81
| The Quantified Funds |
| NOTES TO CONSOLIDATED FINANCIAL STATEMENTS (Continued) |
| June 30, 2023 |
The derivative instruments outstanding as of June 30, 2023 as disclosed in the Schedules of Investments and the amounts of realized and changes in unrealized gains and losses on derivative instruments during the period as disclosed in the Statements of Operations serve as indicators of the volume of derivative activity for each Fund.
Associated Risk
Market Risk: Market risk is the risk that changes in interest rates, foreign exchange rates or equity prices will affect the positions held by each Fund. The Funds are exposed to market risk on financial instruments that are valued at market prices as disclosed in the Schedules of Investments. The prices of derivative instruments, including swaps and futures prices, can be highly volatile. Price movements of derivative contracts in which each Fund’s assets may be invested are influenced by, among other things, interest rates, changing supply and demand relationships, trade, fiscal, monetary and exchange control programs and policies of governments, and national and international political and economic events and policies. Each Fund may be exposed to market risk on derivative contracts in that each Fund may not be able to readily dispose of its holdings when it chooses and also that the price obtained on disposal is below that at which the investment is included in the Funds’ financial statements. All financial instruments are recognized at fair value, and all changes in market conditions directly affect net income. The Funds’ investments in derivative instruments are exposed to market risk and are disclosed in the schedules of investments.
Unexpected local, regional or global events, such as war; acts of terrorism; financial, political or social disruptions; natural, environmental or man-made disasters; the spread of infectious illnesses or other public health issues; and recessions and depressions could have a significant impact on the Funds and their investments and may impair market liquidity. Such events can cause investor fear, which can adversely affect the economies of nations, regions and the market in general, in ways that cannot necessarily be foreseen. An outbreak of infectious respiratory illness known as COVID-19, which is caused by a novel coronavirus (SARS-CoV-2), was first detected in China in December 2019 and subsequently spread globally. This coronavirus has resulted in, among other things, travel restrictions, closed international borders, enhanced health screenings at ports of entry and elsewhere, disruption of and delays in healthcare service preparation and delivery, prolonged quarantines, significant disruptions to business operations, market closures, cancellations and restrictions, supply chain disruptions, lower consumer demand, and significant volatility and declines in global financial markets, as well as general concern and uncertainty. The impact of COVID-19 has adversely affected, and other infectious illness outbreaks that may arise in the future could adversely affect, the economies of many nations and the entire global economy, individual issuers and capital markets in ways that cannot necessarily be foreseen. Public health crises caused by the COVID-19 outbreak may exacerbate other pre-existing political, social and economic risks in certain countries or globally. The duration of the COVID-19 outbreak and its effects cannot be determined with certainty.
Counterparty Risk: Each Fund may invest in swap contracts (the “Product”) with Credit Suisse, Barclays or CIBC as the counterparty. If Credit Suisse, Barclays or CIBC becomes insolvent, Credit Suisse, Barclays or CIBC may not be able to make any payments under the Product and investors may lose their capital invested in the Product. A decline in Credit Suisse’s, Barclays’s or CIBC’s standing is likely to reduce the market value of the Product and therefore the price an investor may receive for the Product if they sell it in the market.
Liquidity Risk: Liquidity risk is the risk that a Fund will encounter difficulty in raising funds to meet commitments. Liquidity risk may result in an inability to sell investments quickly at close to fair value. Each Fund’s financial instruments may include investments in securities which are not traded on organized public exchanges and which generally may be illiquid. As a result, a Fund may not be able to quickly liquidate its investments in these instruments at an amount close to its fair value in order to meet its liquidity requirements. The Funds’ do not anticipate any material losses as a result of liquidity risk.
82
| The Quantified Funds |
| NOTES TO CONSOLIDATED FINANCIAL STATEMENTS (Continued) |
| June 30, 2023 |
| 5. | OFFSETTING OF FINANCIAL ASSETS AND DERIVATIVE ASSETS |
Each Fund’s policy is to recognize a gross asset or liability equal to the unrealized gain (loss) on futures contracts and swap contracts. The following table shows additional information regarding the offsetting of assets and liabilities as of June 30, 2023.
Quantified Managed Income Fund:
| Gross Amounts Not Offset in the | ||||||||||||||||||||||||
| Assets: | Statements of Assets & Liabilities | |||||||||||||||||||||||
| Gross Amounts | Gross Amounts | Net Amounts of | ||||||||||||||||||||||
| Presented in the | Offset in the | Assets Presented in | Financial | |||||||||||||||||||||
| Statements of Assets | Statements of Assets | the Statements of | Instruments | Cash Collateral | ||||||||||||||||||||
| Description | & Liabilities | & Liabilities | Assets & Liabilities | Pledged (2) | Received | Net Amount | ||||||||||||||||||
| Unrealized Appreciation on Futures | $ | 25,828 | $ | — | $ | 25,828 | $ | (25,828 | ) | $ | — | $ | — | |||||||||||
| Total | $ | 25,828 | $ | — | $ | 25,828 | $ | (25,828 | ) | $ | — | $ | — | |||||||||||
| Gross Amounts Not Offset in the | ||||||||||||||||||||||||
| Liabilities: | Statement of Assets & Liabilities | |||||||||||||||||||||||
| Gross Amounts | Net Amounts of | |||||||||||||||||||||||
| Gross Amounts of | Offset in the | Liabilities Presented | Financial | |||||||||||||||||||||
| Recognized | Statement of Assets | in the Statement of | Instruments | Cash Collateral | ||||||||||||||||||||
| Description | Liabilities | & Liabilities | Assets & Liabilities | Pledged (2) | Pledged(1) | Net Amount | ||||||||||||||||||
| Unrealized Depreciation on Futures | $ | 165,475 | $ | — | $ | 165,475 | $ | 25,828 | $ | 139,647 | $ | — | ||||||||||||
| Total | $ | 165,475 | $ | — | $ | 165,475 | $ | 25,828 | $ | 139,647 | $ | — | ||||||||||||
| Quantified Market Leaders Fund: | ||||||||||||||||||||||||
| Gross Amounts Not Offset in the | ||||||||||||||||||||||||
| Assets: | Statements of Assets & Liabilities | |||||||||||||||||||||||
| Gross Amounts | Gross Amounts | Net Amounts of Assets | ||||||||||||||||||||||
| Presented in the | Offset in the | Presented in the | Financial | |||||||||||||||||||||
| Statements of Assets | Statements of Assets | Statements of Assets & | Instruments | Cash Collateral | ||||||||||||||||||||
| Description | & Liabilities | & Liabilities | Liabilities | Pledged (2) | Received | Net Amount | ||||||||||||||||||
| Swaps | $ | 4,840,997 | $ | — | $ | 4,840,997 | $ | — | $ | — | $ | 4,840,997 | ||||||||||||
| Total | $ | 4,840,997 | $ | — | $ | 4,840,997 | $ | — | $ | — | $ | 4,840,997 | ||||||||||||
| Quantified Alternative Investment Fund: | ||||||||||||||||||||||||
| Gross Amounts Not Offset in the Statements | ||||||||||||||||||||||||
| Assets: | of Assets & Liabilities | |||||||||||||||||||||||
| Gross Amounts | Gross Amounts | Net Amounts of | ||||||||||||||||||||||
| Presented in the | Offset in the | Assets Presented in | Financial | |||||||||||||||||||||
| Statements of | Statement of Assets | the Statement of | Instruments | Cash Collateral | ||||||||||||||||||||
| Description | Assets & Liabilities | & Liabilities | Assets & Liabilities | Pledged(2) | Received | Net Amount | ||||||||||||||||||
| Unrealized Appreciation on Futures | $ | 14,865 | $ | — | $ | 14,865 | $ | — | $ | — | $ | 14,865 | ||||||||||||
| Total | $ | 14,865 | $ | — | $ | 14,865 | $ | — | $ | — | $ | 14,865 | ||||||||||||
83
| The Quantified Funds |
| NOTES TO CONSOLIDATED FINANCIAL STATEMENTS (Continued) |
| June 30, 2023 |
Quantified STF Fund:
| Gross Amounts Not Offset in the | ||||||||||||||||||||||||
| Assets: | Statements of Assets & Liabilities | |||||||||||||||||||||||
| Gross Amounts | ||||||||||||||||||||||||
| Presented in the | Gross Amounts | Net Amounts of | ||||||||||||||||||||||
| Statements of | Offset in the | Assets Presented | Financial | |||||||||||||||||||||
| Assets & | Statement of Assets | in the Statement of | Instruments | Cash Collateral | ||||||||||||||||||||
| Description | Liabilities | & Liabilities | Assets & Liabilities | Pledged (2) | Received | Net Amount | ||||||||||||||||||
| Unrealized Appreciation on Futures | $ | 8,939,388 | $ | — | $ | 8,939,388 | $ | — | $ | — | $ | 8,939,388 | ||||||||||||
| Total | $ | 8,939,388 | $ | — | $ | 8,939,388 | $ | — | $ | — | $ | 8,939,388 | ||||||||||||
| Quantified Pattern Recognition Fund: | ||||||||||||||||||||||||
| Gross Amounts Not Offset in the Statement of | ||||||||||||||||||||||||
| Liabilities: | Assets & Liabilities | |||||||||||||||||||||||
| Net Amounts of | ||||||||||||||||||||||||
| Gross Amounts of | Gross Amounts Offset | Liabilities Presented | ||||||||||||||||||||||
| Recognized | in the Statement of | in the Statement of | Financial Instruments | Cash Collateral | ||||||||||||||||||||
| Description | Liabilities | Assets & Liabilities | Assets & Liabilities | Pledged(2) | Pledged(1) | Net Amount | ||||||||||||||||||
| Unrealized Depreciation on Futures | $ | (505,027 | ) | $ | — | $ | (505,027 | ) | $ | — | $ | 505,027 | $ | — | ||||||||||
| Total | $ | (505,027 | ) | $ | — | $ | (505,027 | ) | $ | — | $ | 505,027 | $ | — | ||||||||||
| Quantified Tactical Fixed Income Fund: | ||||||||||||||||||||||||
| Gross Amounts Not Offset in the Statements | ||||||||||||||||||||||||
| Assets: | of Assets & Liabilities | |||||||||||||||||||||||
| Gross Amounts | Gross Amounts | Net Amounts of | ||||||||||||||||||||||
| Presented in the | Offset in the | Assets Presented in | Financial | |||||||||||||||||||||
| Statements of | Statement of | the Statement of | Instruments | |||||||||||||||||||||
| Description | Assets & Liabilities | Assets & Liabilities | Assets & Liabilities | Pledged (2) | Cash Collateral Received | Net Amount | ||||||||||||||||||
| Unrealized Appreciation on Futures | $ | 65,281 | $ | — | $ | 65,281 | $ | — | $ | — | $ | 65,281 | ||||||||||||
| Total | $ | 65,281 | $ | — | $ | 65,281 | $ | — | $ | — | $ | 65,281 | ||||||||||||
| Quantified Evolution Plus Fund: | ||||||||||||||||||||||||
| Gross Amounts Not Offset in the | ||||||||||||||||||||||||
| Assets: | Statements of Assets & Liabilities | |||||||||||||||||||||||
| Gross Amounts | Gross Amounts | Net Amounts of Assets | ||||||||||||||||||||||
| Presented in the | Offset in the | Presented in the | Financial | |||||||||||||||||||||
| Statements of Assets | Statements of Assets | Statements of Assets & | Instruments | Cash Collateral | ||||||||||||||||||||
| Description | & Liabilities | & Liabilities | Liabilities | Pledged (2) | Received | Net Amount | ||||||||||||||||||
| Unrealized Appreciation on Futures | $ | 250,313 | $ | — | $ | 250,313 | $ | — | $ | — | $ | 250,313 | ||||||||||||
| Swaps | 203,225 | — | 203,225 | (203,225 | ) | — | — | |||||||||||||||||
| Total | $ | 453,538 | $ | — | $ | 453,538 | $ | (203,225 | ) | $ | — | $ | 250,313 | |||||||||||
| Gross Amounts Not Offset in the | ||||||||||||||||||||||||
| Liabilities: | Statement of Assets & Liabilities | |||||||||||||||||||||||
| Gross Amounts | Net Amounts of | |||||||||||||||||||||||
| Offset in the | Liabilities Presented in | Financial | ||||||||||||||||||||||
| Gross Amounts of | Statement of Assets | the Statement of | Instruments | Cash Collateral | ||||||||||||||||||||
| Description | Recognized Liabilities | & Liabilities | Assets & Liabilities | Pledged (2) | Pledged (1) | Net Amount | ||||||||||||||||||
| Swaps | $ | (730,573 | )- | $ | (730,573 | ) | $ | 203,225 | $ | 527,348 | — | |||||||||||||
| Total | $ | (730,573 | ) | $ | — | $ | (730,573 | ) | $ | 203,225 | $ | 527,348 | $ | — | ||||||||||
84
| The Quantified Funds |
| NOTES TO CONSOLIDATED FINANCIAL STATEMENTS (Continued) |
| June 30, 2023 |
| Quantified Tactical Sectors Fund: | ||||||||||||||||||||||||
| Gross Amounts Not Offset in the | ||||||||||||||||||||||||
| Assets: | Statements of Assets & Liabilities | |||||||||||||||||||||||
| Gross Amounts | Gross Amounts | Net Amounts of | ||||||||||||||||||||||
| Presented in the | Offset in the | Assets Presented | Financial | |||||||||||||||||||||
| Statements of | Statement of | in the Statement of | Instruments | Cash Collateral | ||||||||||||||||||||
| Description | Assets & Liabilities | Assets & Liabilities | Assets & Liabilities | Pledged (2) | Received | Net Amount | ||||||||||||||||||
| Swaps | $ | 5,088,126 | $ | — | $ | 5,088,126 | $ | — | $ | — | $ | 5,088,126 | ||||||||||||
| Total | $ | 5,088,126 | $ | — | $ | 5,088,126 | $ | — | $ | — | $ | 5,088,126 | ||||||||||||
| Quantified Rising Dividend Tactical Fund: | ||||||||||||||||||||||||
| Gross Amounts Not Offset in the Statements | ||||||||||||||||||||||||
| Assets: | of Assets & Liabilities | |||||||||||||||||||||||
| Gross Amounts | Gross Amounts | Net Amounts of | ||||||||||||||||||||||
| Presented in the | Offset in the | Assets Presented in | Financial | |||||||||||||||||||||
| Statements of | Statement of | the Statement of | Instruments | |||||||||||||||||||||
| Description | Assets & Liabilities | Assets & Liabilities | Assets & Liabilities | Pledged (2) | Cash Collateral Received | Net Amount | ||||||||||||||||||
| Swaps | $ | 436,779 | $ | — | $ | 436,779 | $ | (4,421 | ) | $ | — | $ | 432,358 | |||||||||||
| Total | $ | 436,779 | $ | — | $ | 436,779 | $ | (4,421 | ) | $ | — | $ | 432,358 | |||||||||||
| Gross Amounts Not Offset in the Statement of | ||||||||||||||||||||||||
| Liabilities: | Assets & Liabilities | |||||||||||||||||||||||
| Gross Amounts | Net Amounts of | |||||||||||||||||||||||
| Gross Amounts of | Offset in the | Liabilities Presented in | Financial | |||||||||||||||||||||
| Recognized | Statement of | the Statement of | Instruments | |||||||||||||||||||||
| Description | Liabilities | Assets & Liabilities | Assets & Liabilities | Pledged (2) | Collateral Pledged(1) | Net Amount | ||||||||||||||||||
| Swaps Contracts | $ | (4,421 | ) | $ | — | $ | (4,421 | ) | $ | 4,421 | $ | — | $ | — | ||||||||||
| Total | $ | (4,421 | ) | $ | — | $ | (4,421 | ) | $ | 4,421 | $ | — | $ | — | ||||||||||
| Quantified Government Income Tactical Fund: | ||||||||||||||||||||||||
| Gross Amounts Not Offset in the | ||||||||||||||||||||||||
| Assets: | Statements of Assets & Liabilities | |||||||||||||||||||||||
| Gross Amounts | Gross Amounts | Net Amounts of | ||||||||||||||||||||||
| Presented in the | Offset in the | Assets Presented in | Financial | |||||||||||||||||||||
| Statements of | Statements of Assets | the Statements of | Instruments | Cash Collateral | ||||||||||||||||||||
| Description | Assets & Liabilities | & Liabilities | Assets & Liabilities | Pledged(2) | Received | Net Amount | ||||||||||||||||||
| Unrealized Appreciation on Futures | $ | 23,363 | $ | — | $ | 23,363 | $ | — | $ | — | $ | 23,363 | ||||||||||||
| Total | $ | 23,363 | $ | — | $ | 23,363 | $ | — | $ | — | $ | 23,363 | ||||||||||||
| (1) | The amount is limited to the derivative liability balance and accordingly does not include excess collateral pledged. |
| (2) | The amount does not include excess collateral pledged by the counterparty. Detailed collateral amounts are presented in the Statements of Assets and Liabilities. |
| 6. | INVESTMENT ADVISORY AGREEMENT AND TRANSACTIONS WITH RELATED PARTIES |
The business activities of each Fund are overseen by the Board, which is responsible for the overall management of the Funds. Advisors Preferred LLC (“Advisor”), serves as investment advisor to the Funds. The Advisor has engaged Flexible Plan Investments, Ltd. (the “Sub-Advisor”) to serve as the sub-advisor to the Funds.
Pursuant to an advisory agreement with the Funds, the Advisor, under the oversight of the Board, directs the daily operations of each Fund and supervises the performance of administrative and professional services provided by others. As compensation for its services and the related expenses borne by the
85
| The Quantified Funds |
| NOTES TO CONSOLIDATED FINANCIAL STATEMENTS (Continued) |
| June 30, 2023 |
Advisor, each Fund pays advisory fees accrued daily and paid monthly, based on each Fund’s average daily net assets at an annual rate of 1.00%, except for Quantified Alternative Investment Fund, Quantified Managed Income Fund and Quantified Market Leaders Fund which pay 0.75%. For the year ended June 30, 2023, each Fund accrued the following advisory fees:
| Quantified Managed Income Fund | $ | 1,220,002 | ||
| Quantified Market Leaders Fund | 1,691,254 | |||
| Quantified Alternative Investment Fund | 87,611 | |||
| Quantified STF Fund | 1,355,001 | |||
| Quantified Pattern Recognition Fund | 311,955 | |||
| Quantified Tactical Fixed Income Fund | 1,170,796 | |||
| Quantified Evolution Plus Fund | 749,712 | |||
| Quantified Common Ground Fund | 826,238 | |||
| Quantified Tactical Sectors Fund | 1,046,164 | |||
| Quantified Rising Dividend Tactical Fund | 311,192 | |||
| Quantified Government Income Tactical Fund | 406,060 |
Pursuant to a liquidity program administrator agreement with the Funds, the Adviser, provides a liquidity program administrator who, directs the operations of the Funds’ liquidity risk management program. As compensation for its services and the related expenses borne by the Adviser, the Funds pay the Adviser out of pocket expenses and an annual fee of $9,000 per Fund. The liquidity program administrator agreement became effective June 1, 2021. Pursuant to the liquidity program administrator agreement, the Adviser earned (net of voluntary waivers) the following fees in the Statements of Operation (miscellaneous expenses) for the year ended June 30, 2023:
| Fund | Fees | Waived | ||||||
| Quantified Managed Income Fund | $ | 9,000 | $ | — | ||||
| Quantified Market Leaders Fund | 9,000 | — | ||||||
| Quantified Alternative Investment Fund | 9,000 | (9,000 | ) | |||||
| Quantified STF Fund | 9,000 | — | ||||||
| Quantified Pattern Recognition Fund | 9,000 | (9,000 | ) | |||||
| Quantified Tactical Fixed Income Fund | 9,000 | — | ||||||
| Quantified Evolution Plus Fund | 9,000 | — | ||||||
| Quantified Common Ground Fund | 9,000 | — | ||||||
| Quantified Tactical Sectors Fund | 9,000 | — | ||||||
| Quantified Rising Dividend Tactical Fund | 9,000 | (9,000 | ) | |||||
| Quantified Government Income Tactical Fund | 9,000 | (9,000 | ) | |||||
Ultimus Fund Solutions, LLC (“UFS”), UFS, provides administration, fund accounting, and transfer agent services to the Trust. Pursuant to the servicing agreement with UFS, each Fund pays UFS customary fees for providing administration, fund accounting and transfer agency services to the Funds. Under the terms of the Funds’ agreement with UFS, UFS pays for certain operating expenses of the Funds. Certain officers of the Trust are also officers of UFS, and are not paid any fees directly by the Funds for serving in such capacities.
In addition, certain affiliates of UFS provide services to each Fund as follows:
Blu Giant, LLC (“Blu Giant”), an affiliate of UFS, provides EDGAR conversion and filing services as well as print management services for each Fund on an ad-hoc basis. These expenses are the responsibility of UFS.
86
| The Quantified Funds |
| NOTES TO CONSOLIDATED FINANCIAL STATEMENTS (Continued) |
| June 30, 2023 |
The Trust has adopted Distribution Plans and Agreements pursuant to Rule 12b-1 under the 1940 Act for the Funds’ Investor Class and Advisor Class shares (each a “Plan” and together, the “Plans”) pursuant to which the Funds pay fees to the Ceros Financial Services, Inc. (“Ceros” or “Distributor”) for providing distribution and/or shareholder services to the Funds. Under the Plans, Investor Class shares of a Funds may pay an account maintenance fee for account maintenance services and/or distribution fee at an annual rate of up to 0.25% of the Funds’ average net assets attributable to Investor Class shares as compensation for the Distributor providing account maintenance and distribution services to shareholders; and up to 1.00% for Advisor Class shares of a Fund’s average daily net assets attributable to the Advisor Class shares. The 12b-1 Plan is a compensation plan, which means that compensation is provided regardless of 12b-1 expenses incurred.
For the year ended June 30, 2023, pursuant to the Rule 12b-1 Plan, each Fund accrued:
| Investor Class | Advisor Class | Total | ||||||||||
| Quantified Managed Income Fund | $ | 406,615 | $ | 210 | $ | 406,825 | ||||||
| Quantified Market Leaders Fund | 563,387 | 1,458 | 564,845 | |||||||||
| Quantified Alternative Investment Fund | 29,035 | 674 | 29,709 | |||||||||
| Quantified STF Fund | 338,173 | 2,310 | 340,483 | |||||||||
| Quantified Pattern Recognition Fund | 77,989 | — | 77,989 | |||||||||
| Quantified Tactical Fixed Income Fund | 292,699 | — | 292,699 | |||||||||
| Quantified Evolution Plus Fund | 187,428 | — | 187,428 | |||||||||
| Quantified Common Ground Fund | 206,559 | — | 206,559 | |||||||||
| Quantified Tactical Sectors Fund | 261,541 | — | 261,541 | |||||||||
| Quantified Rising Dividend Tactical Fund | 77,798 | — | 77,798 | |||||||||
| Quantified Government Income Tactical Fund | 101,515 | — | 101,515 | |||||||||
The Board has adopted a Shareholder Servicing Plan (the “Servicing Plan”) with respect to the Investor Class of each Fund. The Servicing Plan provides that a monthly service fee is calculated by each Fund at an annual rate of up to 0.15% (currently set at 0.15%), of its average daily net assets of the Investor Class and is paid to Ceros to provide compensation for ongoing shareholder servicing activities or service and/or maintenance of accounts, not otherwise required to be provided by the Advisor. Ceros is an affiliate of the Advisor.
For the year ended June 30, 2023, pursuant to the Shareholder Services Agreement, each Fund paid:
| Quantified Managed Income Fund | $ | 243,969 | ||
| Quantified Market Leaders Fund | 338,032 | |||
| Quantified Alternative Investment Fund | 17,421 | |||
| Quantified STF Fund | 202,904 | |||
| Quantified Pattern Recognition Fund | 46,793 | |||
| Quantified Tactical Fixed Income Fund | 175,619 | |||
| Quantified Evolution Plus Fund | 112,457 | |||
| Quantified Common Ground Fund | 123,936 | |||
| Quantified Tactical Sectors Fund | 156,925 | |||
| Quantified Rising Dividend Tactical Fund | 46,679 | |||
| Quantified Government Income Tactical Fund | 60,909 |
During the year ended June 30, 2023, Ceros, a registered broker/dealer, executed trades on behalf of Quantified Managed Income Fund, Quantified Market Leaders Fund, Quantified Alternative Investment
87
| The Quantified Funds |
| NOTES TO CONSOLIDATED FINANCIAL STATEMENTS (Continued) |
| June 30, 2023 |
Fund, Quantified STF Fund, Quantified Pattern Recognition Fund, Quantified Tactical Fixed Income Fund, Quantified Evolution Plus Fund, Quantified Common Ground Fund, Quantified Tactical Sectors Fund, Quantified Rising Dividend Tactical Fund and Quantified Government Income Tactical Fund and received $208,585, $315,078, $20,973, $11,923, $1,285, $8,895, $10,197, $289,763, $105,972, $16,151 and $6,751 in trade commissions, respectively.
Each Trustee who is not an “interested person” of the Trust or Advisor is compensated at a rate of $72,000 per year plus $2,500 minimum per meeting for certain special meetings, which varies based on the matters submitted, as well as for reimbursement for any reasonable expenses incurred attending the meetings, paid quarterly. The “interested persons” who serve as Trustees of the Trust receive no compensation for their services as Trustees. None of the executive officers receive compensation from the Trust. Interested trustees of the Trust are also officers or employees of the Advisor and its affiliates.
| 7. | AGGREGATE UNREALIZED APPRECIATION AND DEPRECIATION – TAX BASIS |
The identified cost of investments in securities owned by each Fund for federal income tax purposes excluding futures and swaps, and its respective gross unrealized appreciation and depreciation at June 30, 2023, were as follows:
| Gross | Gross | Net Unrealized | ||||||||||||||
| Tax | Unrealized | Unrealized | Appreciation/ | |||||||||||||
| Cost | Appreciation | Depreciation | (Depreciation) | |||||||||||||
| Quantified Managed Income Fund | $ | 142,201,842 | $ | 1,091,447 | $ | (2,237,596 | ) | $ | (1,146,149 | ) | ||||||
| Quantified Market Leaders Fund | 176,016,927 | 134,817,748 | (126,471,348 | ) | 8,346,400 | |||||||||||
| Quantified Alternative Investment Fund | 6,757,560 | 129,300 | (39,214 | ) | 90,086 | |||||||||||
| Quantified STF Fund | 155,129,085 | 8,939,675 | (10,373,209 | ) | (1,433,534 | ) | ||||||||||
| Quantified Pattern Recognition Fund | 57,035,944 | 506,120 | (549,282 | ) | (43,162 | ) | ||||||||||
| Quantified Tactical Fixed Income Fund | 85,270,840 | — | (1,429,916 | ) | (1,429,916 | ) | ||||||||||
| Quantified Evolution Plus Fund | 36,468,084 | 81,201,738 | (81,241,318 | ) | (39,580 | ) | ||||||||||
| Quantified Common Ground Fund | 130,709,703 | 4,966,449 | (2,702,580 | ) | 2,263,869 | |||||||||||
| Quantified Tactical Sectors Fund | 82,723,271 | 57,907,848 | (50,114,693 | ) | 7,793,155 | |||||||||||
| Quantified Rising Dividend Tactical Fund | 30,218,628 | 17,066,272 | (17,291,370 | ) | (225,098 | ) | ||||||||||
| Quantified Government Income Tactical Fund | 40,923,069 | — | (73,029 | ) | (73,029 | ) | ||||||||||
| 8. | DISTRIBUTIONS TO SHAREHOLDERS AND TAX COMPONENTS OF CAPITAL |
The tax character of distributions paid for the years ended June 30, 2023 and June 30, 2022 was as follows:
| For the period ended June 30, 2023: | ||||||||||||
| Ordinary | Long-Term | |||||||||||
| Portfolio | Income | Capital Gains | Total | |||||||||
| Quantified Managed Income Fund | $ | 951,437 | $ | — | $ | 951,437 | ||||||
| Quantified Market Leaders Fund | — | — | — | |||||||||
| Quantified Alternative Investment Fund | 230,765 | — | 230,765 | |||||||||
| Quantified STF Fund | — | — | — | |||||||||
| Quantified Pattern Recognition Fund | 33,274 | — | 33,274 | |||||||||
| Quantified Tactical Fixed Income Fund | — | — | — | |||||||||
| Quantified Evolution Plus Fund | 37,720 | — | 37,720 | |||||||||
| Quantified Common Ground Fund | — | — | — | |||||||||
| Quantified Tactical Sectors Fund | 310,692 | — | 310,692 | |||||||||
| Quantified Rising Dividend Tactical Fund | 668,445 | — | 668,445 | |||||||||
| Quantified Government Income Tactical Fund | — | — | — | |||||||||
88
| The Quantified Funds |
| NOTES TO CONSOLIDATED FINANCIAL STATEMENTS (Continued) |
| June 30, 2023 |
| For the period ended June 30, 2022: | ||||||||||||
| Ordinary | Long-Term | |||||||||||
| Portfolio | Income | Capital Gains | Total | |||||||||
| Quantified Managed Income Fund | $ | 983,577 | $ | — | $ | 983,577 | ||||||
| Quantified Market Leaders Fund | 64,865,841 | — | 64,865,841 | |||||||||
| Quantified Alternative Investment Fund | 1,367,116 | 173,849 | 1,540,965 | |||||||||
| Quantified STF Fund | 21,941,283 | 20,260,824 | 42,202,107 | |||||||||
| Quantified Pattern Recognition Fund | 4,417,288 | 1,721,355 | 6,138,643 | |||||||||
| Quantified Tactical Fixed Income Fund | — | — | — | |||||||||
| Quantified Evolution Plus Fund | 2,958,074 | 4,437,576 | 7,395,650 | |||||||||
| Quantified Common Ground Fund | 7,158,565 | — | 7,158,565 | |||||||||
| Quantified Tactical Sectors Fund | 2,251,739 | — | 2,251,739 | |||||||||
| Quantified Rising Dividend Tactical Fund | 163,258 | — | 163,258 | |||||||||
| Quantified Government Income Tactical Fund | 226,553 | 502,193 | 728,746 | |||||||||
As of June 30, 2023, the components of accumulated earnings/(deficit) on a tax basis were as follows:
| Undistributed | Undistributed | Post October Loss | Capital Loss | Other | Unrealized | Total | ||||||||||||||||||||||
| Ordinary | Long-Term | and | Carry | Book/Tax | Appreciation/ | Accumulated | ||||||||||||||||||||||
| Income | Capital Gains | Late Year Loss | Forwards | Differences | (Depreciation) | Earnings/(Deficits) | ||||||||||||||||||||||
| Quantified Managed Income Fund | $ | 2,958,938 | $ | — | $ | (7,612,049 | ) | $ | (13,060,616 | ) | $ | — | $ | (1,146,149 | ) | $ | (18,859,876 | ) | ||||||||||
| Quantified Market Leaders Fund | 4,603,212 | — | — | (85,342,355 | ) | — | 8,346,400 | (72,392,743 | ) | |||||||||||||||||||
| Quantified Alternative Investment Fund | 48,143 | — | (798,197 | ) | (1,802,615 | ) | — | 90,086 | (2,462,583 | ) | ||||||||||||||||||
| Quantified STF Fund | 169,505 | — | — | (31,091,890 | ) | — | (1,433,534 | ) | (32,355,919 | ) | ||||||||||||||||||
| Quantified Pattern Recognition Fund | 403,254 | — | — | (12,158,274 | ) | — | (43,162 | ) | (11,798,182 | ) | ||||||||||||||||||
| Quantified Tactical Fixed Income Fund | 45,234 | — | (8,560,955 | ) | (35,176,755 | ) | — | (1,429,916 | ) | (45,122,392 | ) | |||||||||||||||||
| Quantified Evolution Plus Fund | 2,198,119 | — | (5,612,969 | ) | (6,566,289 | ) | — | (39,580 | ) | (10,020,719 | ) | |||||||||||||||||
| Quantified Common Ground Fund | 306,174 | — | (8,421,766 | ) | (13,144,767 | ) | — | 2,263,869 | (18,996,490 | ) | ||||||||||||||||||
| Quantified Tactical Sectors Fund | 4,253,725 | — | (5,870,542 | ) | (49,638,589 | ) | — | 7,793,155 | (43,462,251 | ) | ||||||||||||||||||
| Quantified Rising Dividend Tactical Fund | 283,836 | — | (2,959,439 | ) | (6,504,236 | ) | — | (225,098 | ) | (9,404,937 | ) | |||||||||||||||||
| Quantified Government Income Tactical Fund | 352,685 | — | (2,099,515 | ) | (10,147,854 | ) | — | (73,029 | ) | (11,967,713 | ) | |||||||||||||||||
The difference between book basis and tax basis unrealized appreciation (depreciation), undistributed net investment income (loss) and accumulated net realized gains (losses) from investments is primarily attributable to the tax deferral of losses on wash sales, the mark-to-market on open Section 1256, and tax adjustments related to the Quantified Evolution Plus Fund’s wholly owned subsidiary.
Late year losses incurred after December 31 within the fiscal year are deemed to arise on the first business day of the following fiscal year for tax purposes. The Funds did not incur any late year losses.
Capital losses incurred after October 31 within the fiscal year are deemed to arise on the first business day of the following fiscal year for tax purposes. The Funds incurred and elected to defer such capital losses as follows:
| Post October | ||||
| Losses | ||||
| Quantified Managed Income Fund | $ | 7,612,049 | ||
| Quantified Market Leaders Fund | — | |||
| Quantified Alternative Investment Fund | 798,197 | |||
| Quantified STF Fund | — | |||
| Quantified Pattern Recognition Fund | — | |||
| Quantified Tactical Fixed Income Fund | 8,560,955 | |||
| Quantified Evolution Plus Fund | 5,612,969 | |||
| Quantified Common Ground Fund | 8,421,766 | |||
| Quantified Tactical Sectors Fund | 5,870,542 | |||
| Quantified Rising Dividend Tactical Fund | 2,959,439 | |||
| Quantified Government Income Tactical Fund | 2,099,515 | |||
89
| The Quantified Funds |
| NOTES TO CONSOLIDATED FINANCIAL STATEMENTS (Continued) |
| June 30, 2023 |
At June 30, 2023, the Funds below had capital loss carry forwards for federal income tax purposes available to offset future capital gains as follows:
| Short-Term | Long-Term | Total | ||||||||||
| Quantified Managed Income Fund | $ | 11,359,288 | $ | 1,701,328 | $ | 13,060,616 | ||||||
| Quantified Market Leaders Fund | 83,816,622 | 1,525,733 | 85,342,355 | |||||||||
| Quantified Alternative Investment Fund | 1,802,615 | — | 1,802,615 | |||||||||
| Quantified STF Fund | 12,473,847 | 18,618,043 | 31,091,890 | |||||||||
| Quantified Pattern Recognition Fund | 4,807,207 | 7,351,067 | 12,158,274 | |||||||||
| Quantified Tactical Fixed Income Fund | 15,658,716 | 19,518,039 | 35,176,755 | |||||||||
| Quantified Evolution Plus Fund | 5,065,215 | 1,501,074 | 6,566,289 | |||||||||
| Quantified Common Ground Fund | 13,002,697 | 142,070 | 13,144,767 | |||||||||
| Quantified Tactical Sectors Fund | 49,638,589 | — | 49,638,589 | |||||||||
| Quantified Rising Dividend Tactical Fund | 5,030,406 | 1,473,830 | 6,504,236 | |||||||||
| Quantified Government Income Tactical Fund | 4,174,623 | 5,973,231 | 10,147,854 | |||||||||
Permanent book and tax differences, primarily attributable to adjustments related to the Quantified Evolution Plus Fund’s wholly owned subsidiary, resulted in reclassification for the period ended June 30, 2023 as follows:
| Paid | ||||||||
| In | Accumulated | |||||||
| Capital | Earnings (Losses) | |||||||
| Quantified Evolution Plus Fund | $ | (174,180 | ) | $ | 174,180 | |||
| 9. | CONTROL OWNERSHIP |
The beneficial ownership, either directly or indirectly, of more than 25% of the voting securities of a fund creates presumption of control of the fund pursuant to Section 2(a)(9) of the 1940 Act. As of June 30, 2023, Axos Clearing LLC held 84.30% of the Quantified Managed Income Fund, 81.07% of the Quantified Market Leaders Fund, 71.93% of the Quantified Alternative Investment Fund, 72.80% of the Quantified STF Fund, 70.25% of the Quantified Pattern Recognition Fund, 85.05% of the Quantified Tactical Fixed Income Fund, 81.79% of the Quantified Evolution Plus Fund, 71.88% of the Quantified Common Ground Fund, 67.80% of the Quantified Tactical Sectors Fund, 96.22% of the Quantified Rising Dividend Tactical Fund and 80.98% of the Quantified Government Income Tactical Fund.
| 10. | UNDERLYING INVESTMENT IN OTHER INVESTMENT COMPANIES |
The following Funds currently invest greater than 25% of their assets in the corresponding investments. The Funds may redeem these investments at any time if the Advisor or Subadvisor determines that it is in the best interest of the Funds and their shareholders to do so. The performance of the Fund will be directly affected by the performance of the investments. The financial statements of the investments, including their schedule of investments, can be found at the Securities and Exchange Commission’s website www.sec.gov and should be read in conjunction with the Funds’ financial statements.
90
| The Quantified Funds |
| NOTES TO CONSOLIDATED FINANCIAL STATEMENTS (Continued) |
| June 30, 2023 |
| Percentage of Net | ||||
| Fund | Investment | Assets | ||
| Quantified STF Fund | Fidelity Government Portfolio Class I | 26.0% | ||
| First American Government Obligations Fund Class Z | 26.0% | |||
| Quantified Pattern Recognition Fund | Fidelity Government Portfolio Class I | 39.9% | ||
| First American Government Obligations Fund Class Z | 39.9% | |||
| Quantified Common Ground Fund | Mount Vernon Liquid Assets Portfolio, LLC | 30.1% | ||
| Quantified Tactical Sectors Fund | Mount Vernon Liquid Assets Portfolio, LLC | 27.8% | ||
| Quantified Government Income Tactical Fund | Fidelity Government Portfolio Class I | 39.1% | ||
| First American Government Obligations Fund Class Z | 39.1% |
| 11. | SECURITIES LENDING |
The Funds have entered into a securities lending arrangement (the “Agreement”) with U.S. Bank (the “Lending Agent”). Under the terms of the Agreement, the Funds are authorized to loan securities to the Lending Agent. In exchange, at the time of the loan, the Funds receive cash and “non-cash” or “securities” collateral in the amount of at least 105% of the value of any loaned securities that are foreign securities or 102% of the value of any other loaned securities marked-to-market daily. Loans shall be marked to market daily and the margin restored in the event collateralization is below 100% of the value of securities loaned. The value of securities loaned is disclosed in a footnote on the Statements of Assets and Liabilities and on the Schedules of Investments. Securities lending income is disclosed in the Funds’ Statements of Operations. Although risk is mitigated by the collateral, the Funds could experience a delay in recovering their securities and possible loss of income or value if the Lending Agent fails to return the securities on loan. The Funds’ cash collateral received in securities lending transactions is invested in the Mount Vernon Liquid Assets Portfolio, LLC, a privately offered liquidity fund, as presented below. The investment objective is to seek to maximize current income to the extent consistent with the preservation of capital and liquidity and maintain a stable NAV of $1.00 per unit.
As of June 30, 2023, the following Funds loaned securities which were collateralized by cash. The value of securities on loan and the value of the related collateral were as follows:
| Overnight and Continuous | ||||||||
| Fund | Value of Securities Loaned | Value of Collateral* | ||||||
| Quantified Managed Income Fund | $ | 17,526,884 | $ | 17,526,884 | ||||
| Quantified Market Leaders Fund | 9,169,810 | 9,169,810 | ||||||
| Quantified Alternative Investment Fund | 307,663 | 307,663 | ||||||
| Quantified STF Fund | 968,156 | 968,156 | ||||||
| Quantified Tactical Fixed Income Fund | 910,520 | 910,520 | ||||||
| Quantified Common Ground Fund | 29,568,797 | 29,568,797 | ||||||
| Quantified Tactical Sectors Fund | 19,342,235 | 19,342,235 | ||||||
| * | The above Funds received cash collateral, which was subsequently invested in the Mount Vernon Liquid Assets Portfolio, LLC as reported in the Schedules of Investments. Limited to the value of securities loaned, excess collateral not shown. See excess amount of collateral on the Statement of Assets and Liabilities. |
| 12. | LINE OF CREDIT |
The Quantified Alternative Investment Fund, Quantified Common Ground Fund, and the Quantified Managed Income Fund (“Borrowing Funds”) have each entered into a line of credit agreement with U.S. Bank N.A. for investment purposes subject to the limitations of the 1940 Act for borrowings. The maximum amount a Borrowing Fund is allowed to borrow under its agreement is lesser of $15,000,000, 20% of the gross market value of the Borrowing Fund or 33 1/3% of the gross market value (as determined solely by the Bank using consistently applied valuation methods disclosed to the Borrower) of
91
| The Quantified Funds |
| NOTES TO CONSOLIDATED FINANCIAL STATEMENTS (Continued) |
| June 30, 2023 |
the unencumbered assets of the Borrowing Fund. Borrowings under each agreement bear interest at the Prime Rate, per annum, on the principal balance outstanding. The maturity date of the line of credit is November 2, 2023. During the year ended June 30, 2023, the Borrowing Funds accessed the line of credit as follows:
| Average Amount | Outstanding | |||||||||||||
| Borrowings | Interest | Average | Borrowings | |||||||||||
| Outstanding | Expense | Interest Rate | 6/30/2023 | |||||||||||
| Quantified Alternative Investment Fund | $ | 2,861,500 | $ | 10,519 | 6.93% | $ | — | |||||||
| Quantified Common Ground Fund | 8,646,622 | 61,760 | 6.60% | — | ||||||||||
| Quantified Managed Income Fund | — | — | — | — | ||||||||||
| 13. | SUBSEQUENT EVENTS |
Subsequent events after the date of the Statements of Assets and Liabilities have been evaluated through the date the financial statements were issued. Management has determined that no events or transactions occurred requiring adjustment or disclosure in the financial statements.
92

REPORT OF INDEPENDENT REGISTERED PUBLIC ACCOUNTING FIRM
To the Shareholders of Quantified Funds and Board of Trustees of Advisors Preferred Trust
Opinion on the Financial Statements
We have audited the accompanying statements of assets and liabilities, including the schedules of investments, of Quantified Funds comprising the funds listed below (the “Funds”) as of June 30, 2023, the related statements of operations and cash flows, the statements of changes in net assets, the related notes, and the financial highlights for each of the periods indicated below (collectively referred to as the “financial statements”). In our opinion, the financial statements present fairly, in all material respects, the financial position of each of the Funds as of June 30, 2023, the results of their operations and their cash flows, the changes in net assets, and the financial highlights for each of the periods indicated below in conformity with accounting principles generally accepted in the United States of America.
| Fund Name | Statements of Operations | Statements of Cash Flows | Statements of Changes in Net Assets | Financial Highlights |
| Quantified Managed Income Fund, Quantified Market Leaders Fund, Quantified Alternative Investment Fund, and Quantified STF Fund | For the year ended June 30, 2023 | For the year ended June 30, 2023 for Quantified Alternative Investment Fund | For the years ended June 30, 2023 and 2022 | For the years ended June 30, 2023, 2022, 2021, 2020, and 2019 |
| Quantified Pattern Recognition Fund | For the year ended June 30, 2023 | N/A | For the years ended June 30, 2023 and 2022 | For the years ended June 30, 2023, 2022, and 2021, and the period from August 30, 2019 (commencement of operations) through June 30, 2020 |
| Quantified Tactical Fixed Income Fund | For the year ended June 30, 2023 | N/A | For the years ended June 30, 2023 and 2022 | For the years ended June 30, 2023, 2022, and 2021, and the period from September 13, 2019 (commencement of operations) through June 30, 2020 |
| Quantified Evolution Plus Fund* | For the year ended June 30, 2023 | N/A | For the years ended June 30, 2023 and 2022 | For the years ended June 30, 2023, 2022, and 2021, and the period from September 30, 2019 (commencement of operations) through June 30, 2020 |
COHEN & COMPANY, LTD.
800.229.1099 | 866.818.4538 fax | cohencpa.com
Registered with the Public Company Accounting Oversight Board
93
| Quantified Common Ground Fund | For the year ended June 30, 2023 | N/A | For the years ended June 30, 2023 and 2022 | For the years ended June 30, 2023, 2022, and 2021, and the period from December 27, 2019 (commencement of operations) through June 30, 2020 |
| Quantified Tactical Sectors Fund | For the year ended June 30, 2023 | N/A | For the years ended June 30, 2023 and 2022 | For the years ended June 30, 2023 and 2022, and the period from March 4, 2021 (commencement of operations) through June 30, 2021 |
| Quantified Rising Dividend Tactical Fund | For the year ended June 30, 2023 | N/A | For the years ended June 30, 2023 and 2022 | For the years ended June 30, 2023 and 2022, and the period from April 14, 2021 (commencement of operations) through June 30, 2021 |
| Quantified Government Income Tactical Fund | For the year ended June 30, 2023 | N/A | For the years ended June 30, 2023 and 2022 | For the years ended June 30, 2023 and 2022, and the period from April 15, 2021 (commencement of operations) through June 30, 2021 |
| * | The financial statements referred to throughout are Consolidated Financial Statements. |
Basis for Opinion
These financial statements are the responsibility of the Funds’ management. Our responsibility is to express an opinion on the Funds’ financial statements based on our audits. We are a public accounting firm registered with the Public Company Accounting Oversight Board (United States) (“PCAOB”) and are required to be independent with respect to the Funds in accordance with the U.S. federal securities laws and the applicable rules and regulations of the Securities and Exchange Commission and the PCAOB.
We conducted our audits in accordance with the standards of the PCAOB. Those standards require that we plan and perform the audit to obtain reasonable assurance about whether the financial statements are free of material misstatement whether due to error or fraud.
94
Our audits included performing procedures to assess the risks of material misstatement of the financial statements, whether due to error or fraud, and performing procedures that respond to those risks. Such procedures included examining, on a test basis, evidence regarding the amounts and disclosures in the financial statements. Our procedures included confirmation of securities owned as of June 30, 2023, by correspondence with the custodian and brokers. Our audits also included evaluating the accounting principles used and significant estimates made by management, as well as evaluating the overall presentation of the financial statements. We believe that our audits provide a reasonable basis for our opinion.
We have served as the Funds’ auditor since 2012.
COHEN & COMPANY, LTD.
Philadelphia, Pennsylvania
August 29, 2023
95
| QUANTIFIED FUNDS |
| EXPENSE EXAMPLES (Unaudited) |
| June 30, 2023 |
Example
As a shareholder of a Fund you will pay ongoing expenses, such as advisory fees, distribution and service fees (12b-1), and other fund expenses. The following examples are intended to help you understand the ongoing cost (in dollars) of investing in a Fund and to compare these costs with the ongoing costs of investing in other mutual funds. Please note, the expenses shown in the tables are meant to highlight ongoing costs only and do not reflect any transactional costs, such as sales charges (loads), or contingent deferred sales charges on redemptions which may be assessed by mutual funds. This Example is based on an investment of $1,000 invested at the beginning of the period and held for the entire period as indicated below.
Actual Expenses
The columns under the heading entitled “Actual” help you estimate the actual expenses you paid over the period. The “Actual Ending Account Value” shown is derived from the Fund’s actual return, and the “Actual Expenses Paid During Period” shows the dollar amount that would have been paid by an investor who started with $1,000 in the Fund. To estimate the expenses you paid on your account during this period, simply divide your account value by $1,000 (for example, an $8,600 account value divided by $1,000 = 8.6), then multiply the result by the number in the column under the heading entitled “Actual Expenses Paid During Period”.
Hypothetical Examples for Comparison Purposes
The columns under the heading entitled “Hypothetical” provide information about hypothetical account value and hypothetical expenses based on the Fund’s actual expense ratio and an assumed rate of return of 5% per year before expenses, which is not the Fund’s actual return. The hypothetical account values and expenses may not be used to estimate the actual ending account balance or expenses you paid for the period. You may use this information to compare the ongoing costs of investing in the Fund and other funds. To do so, compare this 5% hypothetical example with the 5% hypothetical examples that appear in the shareholder reports of other funds.
Please note that the expenses shown in the table on the next page are meant to highlight your ongoing costs only and do not reflect any transactional costs which may be applicable to your account. Therefore, the last column of the table (Hypothetical Expenses Paid During Period) is useful in comparing ongoing costs only, and will not help you determine the relative total costs of owning different funds. In addition, if these transactional costs were included, your costs would have been higher.
| Hypothetical | ||||||||||||||
| Actual | (5% return before expenses) | |||||||||||||
| Fund’s | Ending | |||||||||||||
| Annualized | Beginning | Ending | Expenses | Account | Expenses | |||||||||
| Expense | Account Value | Account Value | Paid During | Value | Paid During | |||||||||
| Ratio | 1/1/23 | 6/30/23 | Period* | 6/30/23 | Period* | |||||||||
| Quantified Managed Income Fund | ||||||||||||||
| Investor Class | 1.34% | $1,000.00 | $1,000.00 | $6.64 | $1,018.15 | $6.71 | ||||||||
| Advisor Class | 1.93% | $1,000.00 | $997.60 | $9.56 | $1,015.22 | $9.64 | ||||||||
| Quantified Market Leaders Fund | ||||||||||||||
| Investor Class | 1.33% | $1,000.00 | $1,114.70 | $6.97 | $1,018.20 | $6.66 | ||||||||
| Advisor Class | 1.93% | $1,000.00 | $1,112.40 | $10.11 | $1,015.22 | $9.64 | ||||||||
| Quantified Alternative Investment Fund | ||||||||||||||
| Investor Class | 1.49% | $1,000.00 | $1.023.40 | $7.48 | $1,017.41 | $7.45 | ||||||||
| Advisor Class | 2.11% | $1,000.00 | $1.020.30 | $10.57 | $1,014.33 | $10.54 | ||||||||
| Quantified STF Fund | ||||||||||||||
| Investor Class | 1.59% | $1,000.00 | $1,466.70 | $9.72 | $1,016.91 | $7.95 | ||||||||
| Advisor Class | 2.18% | $1,000.00 | $1,462.10 | $13.31 | $1,013.98 | $10.89 | ||||||||
| Quantified Pattern Recognition Fund | ||||||||||||||
| Investor Class | 1.59% | $1,000.00 | $1,223.10 | $8.76 | $1,016.91 | $7.95 | ||||||||
| Quantified Tactical Fixed Income Fund | ||||||||||||||
| Investor Class | 1.59% | $1,000.00 | $987.50 | $7.84 | $1,016.91 | $7.95 | ||||||||
| Quantified Evolution Plus Fund | ||||||||||||||
| Investor Class | 1.60% | $1,000.00 | $1,036.20 | $8.08 | $1,016.86 | $8.00 | ||||||||
| Quantified Common Ground Fund | ||||||||||||||
| Investor Class | 1.73% | $1,000.00 | $1,054.80 | $8.81 | $1,016.22 | $8.65 | ||||||||
| Quantified Tactical Sectors Fund | ||||||||||||||
| Investor Class | 1.59% | $1,000.00 | $1,143.60 | $8.45 | $1,016.91 | $7.95 | ||||||||
| Quantified Rising Dividend Tactical Fund | ||||||||||||||
| Investor Class | 1.63% | $1,000.00 | $1,055.90 | $8.31 | $1,016.71 | $8.15 | ||||||||
| Quantified Government Income Tactical Fund | ||||||||||||||
| Investor Class | 1.61% | $1,000.00 | $974.70 | $7.88 | $1,016.81 | $8.05 | ||||||||
| * | Expenses are equal to the average account value over the period, multiplied by each Fund’s annualized expense ratio, multiplied by the number of days in the period (181) divided by the number of days in the fiscal year (365). |
96
| QUANTIFIED FUNDS |
| SUPPLEMENTAL INFORMATION (Unaudited) (Continued) |
| June 30, 2023 |
LIQUIDITY RISK MANAGEMENT PROGRAM
The Funds have adopted and implemented a written liquidity risk management program as required by Rule 22e-4 (the “Liquidity Rule”) under the Investment Company Act. The program is reasonably designed to assess and manage the Funds’ liquidity risk, taking into consideration, among other factors, each Fund’s investment strategies and the liquidity of portfolio investments during normal and reasonably foreseeable stressed conditions; short and long-term cash flow projections; and cash holdings and access to other funding sources.
During the six months ended June 30, 2023, the Trust’s Liquidity Program Administrator (“LPA”) and the Board reviewed the then-active Funds’ investments and they determined that, generally, the Funds held adequate levels of cash and highly liquid investments to meet shareholder redemption activities in accordance with applicable requirements. Accordingly, the Board and the LPA concluded that (i) the Funds’ liquidity risk management program is reasonably designed to prevent violations of the Liquidity Rule and (ii) the Funds’ liquidity risk management program has been effectively implemented.
97
| The Quantified Funds |
| SUPPLEMENTAL INFORMATION (Unaudited) |
| June 30, 2023 |
Approval of the Renewal of the Investment Advisory and Sub-Advisory Agreements for Quantified Managed Income Fund, Quantified Market Leaders Fund; Quantified Alternative Investment Fund, Quantified STF Fund, Quantified Tactical Fixed Income Fund, Quantified Evolution Plus Fund, Quantified Common Ground Fund, Quantified Pattern Recognition Fund, Quantified Tactical Sectors Fund, Quantified Rising Dividend Tactical Fund and Quantified Government Income Tactical Fund (all together the “Quantified Funds”)
At an in-person Board meeting held on May 23, 2023 (the “Meeting”), the Board of Trustees (the “Board”) of Advisors Preferred Trust (the “Trust”), including a majority of Trustees who are not “interested persons” (the “Independent Trustees”), as such term is defined under Section 2(a)(19) of the 1940 Act, considered the renewal of the investment advisory agreement (the “Advisory Agreement”) between Advisors Preferred, LLC (the “Adviser”) and the Trust, on behalf of Quantified Managed Income Fund, Quantified Market Leaders Fund, Quantified Alternative Investment Fund (and its subsidiary) (“Alternative Investment” and “QAIF Fund Limited”), respectively; Quantified STF Fund, Quantified Tactical Fixed Income Fund, Quantified Evolution Plus Plan and its subsidiary, (“Evolution Plus” and “QEPF Limited”), Quantified Common Ground Fund, Quantified Pattern Recognition Fund, Quantified Tactical Sectors Fund, Quantified Rising Dividend Tactical Fund, and Quantified Government Income Tactical Fund. and the renewal of each sub-advisory agreement (the “Sub-Advisory Agreements”) between the Adviser and Flexible Plan Investments, Ltd. (the “Sub-Adviser” or “Flexible Plan”). The Directors of the QAIF Fund Limited and QEPF Fund Limited, each a wholly owned foreign subsidiary of Alternative and Evolution Plus respective, approved an investment advisory agreement between QAIF Fund Limited and QEPF Fund Limited and the Adviser (the “Subsidiary Advisory Agreement”) as well as the sub-advisory agreements (the “Subsidiary Sub-Advisory Agreements”) between the Adviser and Flexible Plan with respect to the QAIF Fund Limited and QEPF Fund Limited. The Fund level agreements and subsidiary agreements are referred to collectively for convenience and references to a Fund include the subsidiary as the context indicates. The Trustees’ and Directors’ deliberations are presented as collective deliberations as they were conducted concurrently and refences to the Board also include the Directors.
In connection with the Board’s consideration, deliberation and approval of the renewal of the Advisory Agreements and Sub-Advisory Agreements, (together the “Advisory Agreements”) the Adviser and Sub-Adviser provided the Board in advance of the Meeting with written materials, which included information regarding: (a) a description of the investment management personnel of the Adviser and Sub-Adviser; (b) the Adviser’s and Sub-Adviser’s operations and the Adviser’s financial condition; (c) the Adviser’s proposed brokerage practices (including any soft dollar arrangements); (d) the level of the advisory fees proposed to be charged compared with the fees charged to comparable mutual funds or accounts; (e) each Quantified Fund’s anticipated level of profitability to the Adviser and Sub-Adviser from related operations; (f) the Adviser’s and Sub-Adviser’s compliance policies and procedures; and (g) information regarding the performance of each Quantified Fund as compared to their respective benchmarks and Morningstar categories. The Trustees reviewed the quality of work and abilities of the Adviser and its relationship with the Sub-Adviser and the performance of the Quantified Funds. The Trustees conducted some of their deliberations on a joint Adviser and Sub-Adviser basis given the close working relationship of the Adviser and Sub-Adviser. The Board’s review of the materials and deliberations are presented contemporaneously given the overlapping considerations, paralleled issues and conclusions drawn by the Board. The Board conducted some of its deliberations on a joint basis for the Adviser and Flexible Plan given the close working relationship of the Adviser and Sub-Adviser and conducted their deliberations on a consolidated basis for each Quantified Fund and any subsidiary, as applicable.
98
| The Quantified Funds |
| SUPPLEMENTAL INFORMATION (Unaudited)(Continued) |
| June 30, 2023 |
Nature, Extent and Quality of Services: With respect to the nature, extent and quality of services provided, the Board reviewed the Adviser’s Form ADV, and the Sub-Adviser’s Form ADV, a description of the manner in which investment decisions, including asset allocation, sector selection, trade execution and compliance, will be made for each Quantified Fund by the Sub-Adviser, a description of the services provided by the Adviser and those services provided by the Sub-Adviser and those executed by the Adviser. The Board reviewed the experience of professional personnel from both the Adviser and the Sub-Adviser performing services for each Quantified Fund, including the team of individuals that primarily monitor and execute the investment and administration process, and the respective portfolio managers. Further the Board reviewed a certification from each of the Adviser and the Sub-Adviser certifying that each has adopted a Code of Ethics containing provisions reasonably necessary to prevent Access Persons, as that term is defined in Rule 17j-1 under the 1940 Act, from engaging in conduct prohibited by Rule 17j-1(b) and noted that each of the Adviser and Sub-Adviser have adopted procedures reasonably necessary to prevent Access Persons from violating such Code of Ethics.
Advisors Preferred:
The Board reviewed the balance sheet of the Adviser as of March 31, 2023, and considered the change in net income for the month of March as compared to January through March 2023 period. The Board also reviewed the audited financials of the Adviser as of December 31, 2022. The Adviser reported $1.7 billion in total assets under management in active mutual funds and Ms. Ayers-Rigsby noted the commitment from Advisors Preferred to grow the mutual fund business.
The Board discussed the Adviser’s compliance program with the CCO of the Trust. The Board considered that the CCO of the Trust also serves as CCO of the Adviser and were confident in her abilities with respect to both positions. The Trustees were comfortable that if a conflict of interest were to arise, counsel would be called upon for a solution. The Board noted that the Adviser continues to have in place procedures which are currently working to prevent violations of applicable securities laws. The CCO confirmed that she has the support and resources to ensure the compliance procedures of the Trust are updated in accordance with current SEC rules. The Board considered that the cybersecurity risk of the Adviser is managed by Sikich LLP with no data breached reported. The Board discussed the overall technology of the Adviser with the CCO. The Adviser confirmed adequate Professional Liability Insurance is in place, including $2 million for the Independent Directors. Legal counsel noted the Board had previously reviewed the business continuity plan for Advisors Preferred Trust. The Board concluded that the Adviser has qualified professionals, resources, and compliance policies essential to performing its duties under the Advisory Agreements.
Flexible Plan: The Board reviewed the balance sheet and income state of the Sub-Adviser as of December 31, 2022 and confirmed there were no changes in its financial condition since then. The Board noted there were no liabilities other than current trade accounts payable. The Board recalled the presentation by the sub-adviser and earlier discussions concerning reverse fee splits, and the financial stability of Flexible Plan. The Board noted that over 60% of the assets managed by the Sub-Adviser are directed into purchases of the Gold Portfolio, Gold Fund and Quantified Funds. The Board saw that the Sub-Adviser remains dedicated to growing the Quantified Funds as investment vehicles under the various strategies for their clients, and determined Flexible Plan is financially equipped to continue to serve the Quantified Funds as sub-adviser.
The Board confirmed with the CCO that she works well with the CCO of the Sub-Adviser, and she had reviewed the policies and procedures manual of Flexible Plan, including their latest revisions and business
99
| The Quantified Funds |
| SUPPLEMENTAL INFORMATION (Unaudited)(Continued) |
| June 30, 2023 |
continuity plans. The Board confirmed that cybersecurity risk management is the responsibility of the Chief Information Office/Chief Insurance Security Officer of Flexible Plan and that there were no reported breaches. They also noted that the Sub-Adviser Directors & Officers Liability insurance.
The Board determined that Flexible Plan has a compliance program in place that is reasonably designed to prevents violation of the applicable federal securities laws. The Board noted they are familiar with the portfolio managers of Flexible Plan and their qualifications in managing the respective Quantified Fund.
Performance. The Board considered that the Adviser delegates day-to-day investment decisions to the Sub-Adviser and, therefore, does not directly control the performance of the Quantified Funds. The Board considered the Adviser’s other responsibilities under the Advisory Agreements, including with respect to trade oversight, reviewing daily positions and balance reports for the Quantified Funds, obtaining derivative agreements for the Quantified Funds and reporting to the Board. The Trustees concluded that the Adviser appears to be properly and reasonably monitoring the Sub-Adviser’s adherence to each Quantified Fund’s investment objectives and appears to be carrying out its functions appropriately.
With respect to the performance, the Board reviewed the Sub-Adviser’s daily management and investment strategies and considered the updated performance of each Quantified Fund through March 31, 2023, compared to their primary benchmark and Morningstar category for various periods provided by the Adviser. The Board recalled the earlier presentations by Flexible Plan, with respect to strategy and each Quantified Fund’s performance for various periods with explanations for over/under performance.
Quantified Managed Income Fund: With respect to Managed Income, (as measured by Investor Class shares) the Board noted the Fund outperformed the Morningstar Allocation 15%-30% Equity category for the one-year period ended March 31, 2023, but lagged for longer periods. With respect to the Bloomberg Aggregate Bond Index benchmark the Fund outperformed for the one-year and three-year periods ended March 31, 2023 while lagging for longer range periods. The Board reviewed the Fund’s positive return for the five- year and since-inception periods. The Board reflected on the Fund’s total return seeking strategy and observed that the Fund does not follow an index-tracking strategy and, therefore, swings in performance are expected. The Board recalled the Sub-Adviser’s earlier discussion on the strategy, and how Flexible Plan uses the Fund as a diversifying investment without purely focusing on the specific performance of the Fund. The Board concluded that Fund performance was acceptable in light of the previous factors and noted it expects the Fund will continue to grow as part of the Sub-Adviser’s rebalancing of clients’ accounts.
Quantified Market Leaders Fund: The Board acknowledged the Fund’s change in benchmark, away from the Wilshire 5000 Index and to the Morningstar Aggressive Target Risk. The Board noted that Market Leaders (as measured by Investor Class shares) underperformed the Morningstar Aggressive Target Risk category for the periods reviewed. However, the Fund outperformed the Morningstar Tactical Allocation category for the three- and five-year periods, while lagging for the one-year period. The Board noted that recent performance was somewhat concerning. However, the Board recalled the changes to sector allocation that the sub-adviser had earlier described, and how the strategy changes for certain Quantified Funds will add value. They acknowledged the nature of the Fund’s strategy had led to periods of underperformance. The Board noted that the Sub-Adviser’s refinements are designed to improve performance and that this was a mitigating factor. The Board concluded that in spite of recent lags, and because of the Fund’s novel nature and strategy, performance was acceptable.
Quantified Alternative Investment Fund (and subsidiary): For Alternative Investment, the Board noted the Fund (as measured by Investor Class shares) underperformed the S&P 500 Index for the one-, three-, five-
100
| The Quantified Funds |
| SUPPLEMENTAL INFORMATION (Unaudited)(Continued) |
| June 30, 2023 |
year and since inceptions periods ended March 31, 2023. The Sub-Adviser had reported the losses were spread across many holdings, not a single position. The Board discussed how the Fund’s strategy can lead to investment in ultra-long futures, thus making it difficult to benchmark. The Trustees further noted the Fund outperformed the Morningstar Macro Trading category for the three-year period but lagged for others. The Board acknowledged that the S&P 500 Index does not directly correspond to the Fund’s investment strategy and noted that the Marco Trading category better follows the alternative investment strategy of the Fund. The Board concluded the Fund’s performance was nonetheless acceptable.
Quantified STF Fund: The Board acknowledged the Fund (as measured by Investor Class shares) lagged its benchmark, Nasdaq 100 Index, and the Morningstar Tactical Allocation category for the one- three-, and five-year periods ended March 31, 2023. The Board noted that the Fund’s strategy includes a risk management element, and that the magnitude and frequency of bear market rallies result in a whipsaw effect to the Fund, the main cause of its underperformance. It was acknowledged by the Board that the signals utilized in the STF Strategy are not always correct in identifying and amplifying trending markets with such high volatility. The Board discussed how the Morningstar Tactical Sector is not a perfect index for comparison, yet somewhat informative. The Board concluded performance was acceptable when viewed from a long-term perspective, in spite of underperformance.
Quantified Tactical Fixed Income Fund: Tactical Fixed Income (as measured by Investor Class shares) lagged both its benchmark, Bloomberg Aggregate Bond Index, and the Morningstar Nontraditional Bond category for the one- and three-year periods ended March 31, 2023. The Board acknowledged the tough 2022 market for fixed income securities. The Board concluded that a longer time period is warranted to genuinely assess the Fund’s performance, but concluded performance is considered acceptable.
Quantified Evolution Plus Fund (and Subsidiary): The Board reviewed the Fund’s performance (as measured by Investor Class shares) for the one-, three and five-year periods ended March 31, 2023, and noted the Fund lagged the S&P 500 Index, and the Morningstar Tactical Allocation category. The Trustees discussed the Fund’s overweight in the U.S. dollar causing the Fund’s underperformance during the 2022 market. The Board realized the wide-ranging and novel nature of the Fund’s capital appreciation seeking strategy and observed that the Fund does not follow an index-tracking strategy and, therefore, swings in performance are to be expected. The Board concluded with adjustments to the Fund’s allocation, and the addition of commodities investments, the Fund’s performance may improve. The Board concluded performance is considered acceptable.
Quantified Common Ground Fund: For the one-year and three-year periods ended March 31, 2023, the Common Ground Fund (as measured by Investor Class shares) underperformed its benchmarks, the S&P 1500 Index, and the Morningstar Mid-Cap Blend category. The Board noted that since inception the Fund was slightly ahead of the S&P 1500 Index. The Board noted the drawdowns for the Fund were lower than those for the S&P 1500 Index, and the Fund performed as expected, reducing market exposure during the 2022 market downturn. The Board determined it will take a long-term perspective on performance and deemed performance acceptable. The Board agreed to continue to monitor performance.
Quantified Pattern Recognition Fund: For the one-year period ended March 31, 2023, the Board noted the Fund (as measured by Investor Class shares) outperformed its benchmark S&P 500 Index, and the Morningstar Allocation 70% to 85% Equity category. With respect to the three year period ended March 31, 2023, the Fund underperformed both its benchmark and Morningstar category. The Board discussed and took into consideration the Sub-Adviser’s ongoing refinement of the Fund’s strategy in an attempt to “buy the dip” and short-term up moves to capture returns during various market cycles. The Board
101
| The Quantified Funds |
| SUPPLEMENTAL INFORMATION (Unaudited)(Continued) |
| June 30, 2023 |
determined a longer time period of performance is helpful to genuinely assess the Fund’s performance and agreed to monitor the Fund’s performance, and concluded performance was nonetheless acceptable.
Quantified Tactical Sectors Fund: The Board reviewed the Fund’s performance (as measured by Investor Class shares) for the one-year period ended March 31, 2023, and found the Fund trailed both the S&P 500 Index and the Morningstar Large Blend category. They noted the Fund managed a small gain in the fourth quarter 2022. The Sub-Adviser had earlier reported that it was making adjustments to the industry sectors to broaden the universe of investments and adding an S&P 500 Index ETF (the SPY) as a backup sector, which research had shown would add value. The Board determined it would see how the Fund will perform in the longer term and agreed to reassess the Fund’s performance at a later date, but concluded performance was acceptable.
Quantified Government Income Tactical Fund: The Board reviewed the Fund’s performance (as measured by Investor Class shares) for the one-year and since inception periods and found it had underperformed the Bloomberg Aggregate Bond Index and the Morningstar Intermediate Core Bond category for the one-year period. The Board noted a longer term Morningstar Intermediate Core Bond category comparison was unavailable, due in part to the short time period. The Sub-Adviser had discussed plans to adjust the section signals and to be more sensitive to changes in interest rates to enhance optimization of the strategy. The Board decided to see how the Fund will perform in the longer term. The Board agreed to reassess the Fund’s performance at a later date, and concluded it was acceptable.
Quantified Rising Dividend Tactical Fund: The Board reviewed the Fund’s performance (as measured by Investor Class shares) for the one year period ended March 31, 2023 and found it had lagged both the S&P 500 Index and the Morningstar Large Blend Category. The Sub-Adviser had discussed the ability to add 40% to the portfolio in an equally weighted S&P 500 Index fund, and belief that the high volatility years are losing years, but it is confident that they are usually followed by lengthy periods of low volatility and rising prices. The Trustees also noted the Fund is not an index fund. The Board determined to watch how the Fund will perform in the longer term and to reassess the Fund’s performance at a later date, but concluded it was acceptable.
Fees and Expenses: As to the costs of the services provided to the Quantified Funds by the Adviser and Sub-Adviser, respectively, the Board reviewed and discussed the advisory fee and total operating expenses of each Quantified Fund compared to its peer group and Morningstar category as presented in the Meeting Materials. The Board acknowledged that the Adviser pays the sub-adviser directly consistent with agreements and any breakpoints in effect.
Quantified Managed Income Fund: The Board noted the advisory fee of 0.75% for Managed Income was within range of the Morningstar Allocation 15%-30% Equity Category, and above average and well below the maximum management fee. The Trustees discussed the net expenses of 1.55% for Investor Class shares and found it was slightly above average of the net expenses for the Morningstar Allocation 15%-30% Equity A Class category. With regards to Adviser Class shares, the Trustees noted the net expense ratio of 2.15% was within range and well below the maximum net expenses for the Morningstar Allocation 15%-30% Equity C Class category range of expenses.
Quantified Market Leaders Fund: The Board noted the advisory fee of 0.75% for Market Leaders was below average for the Morningstar Tactical Allocation Category, and well below the average and the maximum management fee. The Trustees discussed the net expenses of 1.50% for Investor Class shares and found it was below average for the net expenses for the Morningstar Tactical Allocation A Class
102
| The Quantified Funds |
| SUPPLEMENTAL INFORMATION (Unaudited)(Continued) |
| June 30, 2023 |
category. With regards to Adviser Class shares, the Trustees noted the net expense ratio of 2.10% was below the average of the net expense ratio for the Morningstar Tactical Allocation C Class Category.
Quantified Alternative Investment Fund (and subsidiary): The Board noted the advisory fee of 0.75% for Alternative Investment was below the average for the Morningstar Macro Trading Category. The Trustees discussed the net expenses of 1.94% for Investor Class shares and found it above the average and within range for net expenses for the Morningstar Macro Trading A Class category. With regards to Adviser Class shares, the Board noted the net expense ratio of 2.55% was within range and well below the maximum net expense ratio for the Macro Trading C Class category.
Quantified STF Fund: The Board noted the advisory fee of 1.00% for STF was within range and well below the maximum for the Morningstar Tactical Allocation Category. The Trustees discussed the net expenses of 1.64% for Investor Class shares and found it slightly below the average and well below the maximum net expense for the Morningstar Tactical Allocation A Class category. With regards to Adviser Class shares, the Board noted the net expense ratio of 2.24% was slightly below the average and well below the maximum net expense ratio for the Morningstar Tactical Allocation C Class category.
Quantified Tactical Fixed Income Fund: The Board noted the advisory fee of 1.00% for Tactical Fixed was within range and well below the maximum management fee for the Morningstar Nontraditional Bond Category. The Board discussed the net expenses of 1.67% for Investor Class shares and found it within range of net expenses for the Morningstar Nontraditional Bond A Class category. With regards to Adviser Class shares, the Board noted the net expense ratio of 2.27% was above the average and well below the maximum net expense ratio for the Morningstar Nontraditional Bond C Class category.
Quantified Evolution Plus Fund (and subsidiary): The Board noted the advisory fee of 1.00% for Evolution Plus was within range of the Morningstar Tactical Allocation Category. The Trustees discussed the net expenses of 1.69% for Investor Class shares and found it at the average net expense for the Morningstar Tactical Allocation A Class category. With regards to Adviser Class shares, the Board noted the net expense ratio of 2.29% was at the average net expense ratio for the Morningstar Tactical Allocation Class C Class category.
Quantified Common Ground Fund: The Board noted the advisory fee of 1.00% for Common Ground was within range of the management fee for the Morningstar Mid-Cap Blend Category. The Trustees discussed the net expenses of 1.71% for Investor Class shares and found them below the maximum and within range of the net expense for the Mid Cap Blend A Class category. With regards to Adviser Class shares, the Board noted the net expense ratio of 2.31% was within range of net expense ratio for the Morningstar Mid Cap Blend C Class category and below the maximum net expenses.
Quantified Pattern Recognition Fund: The Board noted the advisory fee of 1.00% for Pattern Recognition was within range for the Morningstar Allocation 75%-80% Equity category and below the maximum management fee. The Trustees discussed the net expenses of 1.68% for Investor Class shares and found it within the range of the Morningstar Allocation 75%-80% Equity A Class category. With regards to Adviser Class shares, the Board noted the net expense ratio of 2.28% was within the range of the Allocation 75%-80% Equity Morningstar C Class category and below maximum net expenses.
Quantified Tactical Sectors Fund: The Board noted the advisory fee of 1.00% for the Fund was within range of the Morningstar Large Blend Category and well below the maximum management fee. The Trustees discussed the net expenses of 1.75% for Investor Class shares and found it within range of the net expense ratios, and well below the maximum net expenses for the Large Blend A Class. With regards
103
| The Quantified Funds |
| SUPPLEMENTAL INFORMATION (Unaudited)(Continued) |
| June 30, 2023 |
to Adviser Class shares, the Board noted the net expense ratio of 2.35% was within range of the net expense ratio, and well below the maximum net expenses for the Morningstar Large Blend C Class category.
Quantified Government Income Tactical Fund: The Board noted the advisory fee of 1.00% for the Fund was at the upper end of the range of the Morningstar Intermediate Core Bond Category. The Trustees discussed the net expenses of 1.71% for Investor Class shares and found it was above range of the net expense ratios for the Intermediate Core Bond A Class category. With regards to Adviser Class shares, The Board noted the net expense ratio of 2.31% was above range of the net expense ratio for the Morningstar Intermediate Core Bond C Class category. The Board also considered the wider mandate of the Fund and noted that when compared to the ranges for the Nontraditional Bond category, the respective class expenses would be within range. The Board noted the narrow strategy of the Morningstar Intermediate Core Bond C Class category constituents.
Quantified Rising Dividend Tactical Fund: The Board noted the advisory fee of 1.00% for the Fund was within range of the Morningstar Large Blend Category and below the maximum management fee. The Trustees discussed the net expenses of 1.76% for Investor Class shares and found it within range of the net expense ratios for the Large Blend A Class. With regards to Adviser Class shares, the Board noted the net expense ratio of 2.36% was within range of the net expense ratio for the Morningstar Large Blend C Class category.
Profitability of Adviser. The Board reviewed the levels of profits to the Adviser for the fiscal year ended December 31, 2022 from each Quantified Fund with respect to advisory fees and from the total relationship with each Quantified Fund. They considered whether profits from each Quantified Fund were reasonable in light of services provided, including the assets levels and payments to the respective sub-adviser, and any breakpoints in fee structures for the Quantified Funds. The. Board referred to the reverse breakpoint split fees applicable to the Quantified Funds. The Board, in consultation with counsel noted that current court rulings with respect to profitability suggest up to or even over a 50% profit margin for any adviser or sub-adviser could be acceptable and not considered excessive.
Quantified Managed Income, Market Leaders, Alternative Investment STF, Common Ground, Evolution Plus, Tactical Fixed Fund, Tactical Sectors, Rising Dividend, and Government Income Funds:
With respect to the Quantified Funds identified above, the Board noted that after fees paid to the Sub-Adviser, the Adviser operated these Funds at a loss when taking into account the totality of the relationship with the Funds. The Board considered the split between the Sub-Adviser to be reasonable for services provided. The Board discussed the reverse breakpoint split in advisory fees, and the Adviser’s ability to continue to operate the Funds at a loss. Ms. Ayers-Rigsby stated Flexible PIan has a strong sales team to assist with marketing. She also noted that with the addition of Global Fund, the adviser’s profits should increase (or losses diminish). The Board concluded that based on the assets levels and services provided the profit levels for the Adviser are not a concern at this time.
Quantified, Pattern Recognition: In discussing the Adviser’s profits with respect to the Pattern Recognition the Board acknowledged the Adviser was operating the Fund at a slight profit. The Board concluded that any excess profit to the Adviser was currently not a concern, and they would continue to monitor the Adviser’s profitability as assets of the Fund grow.
104
| The Quantified Funds |
| SUPPLEMENTAL INFORMATION (Unaudited)(Continued) |
| June 30, 2023 |
Profitability of Sub-Adviser: The Board reviewed the levels of profits to Flexible Plan for the year ended December 31, 2022 with respect to each Quantified Fund. They noted the situation for each Quantified Fund with respect to sub-advisory fees and from the total relationship with each Quantified Fund.
Quantified Managed Income Fund: With respect to the Sub-Adviser’s profitability review, the Board noted Flexible Plan operated the Fund at a loss when reviewing sub-advisory fees. However, when reviewing the total relationship with the Fund, the Sub-Adviser operated at a slight profit of 7%. The Board concluded that based on the assets levels and services provided, the Sub-Adviser having excess profits is not of current concern.
Quantified Market Leaders Fund: With respect to the Sub-Adviser’s profitability review, the Board noted Flexible Plan operated the Fund at a loss when reviewing sub-advisory fees. However, when reviewing the total relationship with the Fund, and other fees earned, the Sub-Adviser made a slight profit of 7%. The Board concluded that based on the assets levels and services provided, the Sub-Adviser having excess profits is not of current concern.
Quantified Alternative Investment Fund: With respect to the Sub-Adviser’s profitability review, the Board noted Flexible Plan operated the Fund at a loss when reviewing sub-advisory fees. However, the Board found that from the total relationship with the Fund, the Sub-Adviser made a slight profit of 5%. The Board concluded that based on the assets levels and services provided, the Sub-Adviser having excess profits is not of current concern.
STF Fund: The Board reviewed the profitability of Flexible Plan with respect to the Fund and noted the Sub-Adviser made a modest profit of 21% from managing the Fund. The Board found that that the Sub-Adviser’s profit increased to 30% when including other income earned from their relationship with the Fund. The Board concluded that based on the asset levels and services provided, the Sub-Adviser having excess profits from the Fund is not of current concern.
Quantified Common Ground, Evolution Plus, Pattern Recognition, Tactical Fixed Income, Tactical Sectors, Rising Dividend, and Government Income Funds:
In discussing the Sub-Adviser’s profits with respect to the above-mentioned Quantified Funds, the Board acknowledged Flexible Plan was managing each Fund at a modest profit, (20% to 21%) from the sub-advisory fees. When taking into account other fees earned, the Board acknowledged the Sub-Adviser’s profits increased to 30%, 31%, 30%, 31%, 31%, 32% and 31%, respectively, for Common Ground, Evolution Plus, Pattern Recognition, Tactical Fixed, Tactical Sectors, Rising Dividend, and Government Income. The Board determined that these profits for the services provided to each Fund by the Sub-Adviser were below the threshold of concern.
With the fees based on average assets of combined Quantified Funds, taking into account the reverse breakpoint fee schedule, the Board acknowledged it unlikely that the Sub-Adviser will, with respect to sub-advisory fees, or when taking into account the totality of the relationship, experience excess profits from its relationship with the any of the Flex Funds. The Board stated they will monitor profit levels from each Quantified Fund as Flexible Plan continues to build assets of the Quantified Funds.
Economies of Scale. As to the extent to which each Quantified Fund will realize economies of scale, the Adviser reported an estimate of $500 million to be the minimum asset level required to reach such economies of scale and that each Quantified Fund may not achieve economies of scale as it may face capacity issues under certain investment strategies. The Board discussed the Adviser’s expectations for
105
| The Quantified Funds |
| SUPPLEMENTAL INFORMATION (Unaudited)(Continued) |
| June 30, 2023 |
the growth in net assets of each Quantified Fund and concluded that any material economies of scale were not a concern at present assets levels. The Trustees noted economies of scale is an advisory agreement concern and is not a consideration for approval of any sub-advisory agreements. The Board agreed to revisit economies of scale as assets of the Quantified Funds continue to grow.
Conclusion. Legal counsel assisted the Board throughout the Advisory Agreements review process. The Board members relied upon the advice of counsel, and their own business judgment, in determining the material factors to be considered in evaluating each. In considering the approval, the Board noted that each Trustee may have afforded different weight to the various factors in reaching his conclusions with respect to the Advisory Agreements, Subsidiary Advisory Agreements; and the Sub-Advisory Agreements and Subsidiary Subadvisory Agreements.
Accordingly, having requested and received such information from the Adviser and Sub-Adviser as the Board believed to be reasonably necessary to evaluate the terms of each of the Advisory Agreements as appropriate; the Board, including a majority of the Independent Trustees, determined that, with respect to each of the Advisory Agreements, separately that (a) the terms of the Advisory Agreement and Sub-Advisory Agreement are reasonable; (b) the advisory fee for each Quantified Fund was not unreasonable; and (c) each Advisory Agreement, Subsidiary Advisory Agreement, Sub-Advisory Agreement and Subsidiary Subadvisory Agreement is in the best interests of the respective Quantified Fund and its shareholders.
106
| Quantified Funds |
| SUPPLEMENTAL INFORMATION (Unaudited) |
| June 30, 2023 |
The following table provides information regarding each Trustee who is not an “interested person” of the Trust, as defined in the 1940 Act.
| Name, Address 1 and Year of Birth | Position(s) Held with the Trust | Term of Office/Length of Time Served | Principal Occupation(s) During Past Five Years | Number of Portfolios in Fund Complex Overseen by Trustee 2 | Other Directorships Held by Trustee |
| Charles R. Ranson Born: 1947 | Trustee | Indefinite, since November 2012 | Principal, Ranson & Associates (business consultancy) (since 2003); | 22 | Northern Lights Fund Trust IV (31 series) (since July 2015) |
| Felix Rivera Born: 1963 | Trustee | Indefinite, since November 2012 | Managing Partner, Independent Channel Advisors, LLC (Consultancy Practice), (since January 2011) | 22 | Centerstone Investors Trust (since 2016). Alpha Alternative Assets Fund |
| David Feldman Born: 1963 | Trustee | Indefinite, Since September 2017 | Independent Consultant (since January 2015); | 22 | None |
| 1 | Unless otherwise specified, the mailing address of each Trustee is c/o Advisors Preferred Trust, 1445 Research Blvd., Suite 530, Rockville, MD 20850. |
| 2 | The “Fund Complex” consists of the series of the Trust. |
107
| Quantified Funds |
| SUPPLEMENTAL INFORMATION (Unaudited) (Continued) |
| June 30, 2023 |
The following table provides information regarding each Trustee who is an “interested person” of the Trust, as defined in the 1940 Act, and each officer of the Trust.
| Name, Address 1 And Year of Birth | Position(s) Held with the Fund | Term of Office/ Length of Time Served | Principal Occupation(s) During Past Five Years | Number of Portfolios in Fund Complex Overseen by Trustee 2 | Other Directorships Held by Trustee During Last Five Years |
| Catherine Ayers-Rigsby(3) Born: 1948 | Trustee, Chairman, President | Indefinite; since November 2012 | CEO, Advisors Preferred, LLC (since June 2011); President, Ceros Financial Services, Inc., (broker/dealer) (since August 2009); President AtCap Partners, LLC (investment adviser) (since July 2011) | 22 | None |
| Brian S. Humphrey(4) Born: 1972 | Trustee | Indefinite; since November 2012 | Managing Director, Ceros Financial Services, Inc., (since January 2011) | 22 | None |
| Christine Casares Born: 1975 | Treasurer | One Year; since May 2019 | Vice President, Tax Administration, Ultimus Fund Solutions, LLC (since January) | N/A | N/A |
| Angela Holland Born 1970 | Chief Compliance Officer | One Year; since July 1, 2020 | Chief Compliance Officer, Advisors Preferred, LLC (since March 2022); Chief Compliance Officer, Ceros Financial Services, Inc. (since January 2016); Chief Compliance Officer, AtCap Partners, LLC (investment adviser) (Since March 2022); Chief Compliance Office Innovational X Advisors, Inc. (investment adviser) (Since July 2022); Compliance Manager, Advisors Preferred, LLC (April 2012 March 2022); Compliance Manager, AtCap (investment adviser) (April 2012-March 2022) | N/A | N/A |
| Jimmy Chao Born: 1971 | Assistant Treasurer | One Year; Since November 2017 | Assistant Vice President, Fund Administration Ultimus (since April 2012) | N/A | N/A |
| Jeff Meacham Born: 1976 | Assistant Treasurer | One Year; Since November 2021 | Senior Trader, Ceros Financial Services, Inc. | N/A | N/A |
| Daniel Gibson Born: 1984 | Assistant Treasurer Secretary | One Year; Since November 2021 One Year; Since October 2022 | Trader/Dealers & Commissions Specialist, Ceros Financial Services, Inc. | N/A | N/A |
| Teresa M. Ritchie Born: 1959 | Assistant Secretary | One Year; since August 2022 | Legal Administration, Ultimus Fund Solutions, LLC (since May 2012) | N/A | N/A |
| 1 | Unless otherwise specified, the address of each Trustee and officer is Advisors Preferred Trust, 1445 Research Blvd., Suite 530, Rockville, MD 20850. The address of C. Casares, J. Chao, and T. Ritchie is Ultimus Fund Solutions, LLC, 80 Arkay Drive, Suite 110, Hauppauge, NY 11788 |
| 2 | The “Fund Complex” consists of the series of the Trust. |
| 3 | Ms. Ayers-Rigsby is an interested person Trustee because she is an officer of the Trust, an officer of the Trust’s investment adviser, and an officer of the Trust’s principal underwriter. |
| 4 | Mr. Humphrey is an interested person Trustee because he is an officer of the Trust’s principal underwriter. |
The Funds’ Statement of Additional Information includes additional information about the Trustees and is available free of charge by calling toll- free 1-855-647-8268.
108
PRIVACY NOTICE
Rev. May 2014
| FACTS | WHAT DOES ADVISORS PREFERRED TRUST DO WITH YOUR PERSONAL INFORMATION? | |
| Why? | Financial companies choose how they share your personal information. Federal law gives consumers the right to limit some but not all sharing. Federal law also requires us to tell you how we collect, share, and protect your personal information. Please read this notice carefully to understand what we do. | |
| What? | The types of personal information we collect and share depend on the product or service you have with us. This information can include: | |
| ■ Social Security number | ■ Purchase History | |
| ■ Assets | ■ Account Balances | |
| ■ Retirement Assets | ■ Account Transactions | |
| ■ Transaction History | ■ Wire Transfer Instructions | |
| ■ Checking Account Information | ||
| When you are no longer our customer, we continue to share your information as described in this notice. | ||
| How? | All financial companies need to share customers’ personal information to run their everyday business. In the section below, we list the reasons financial companies can share their customers’ personal information; the reasons Advisors Preferred Trust chooses to share; and whether you can limit this sharing. | |
| Does Advisors | ||
| Preferred Trust | Can you limit this | |
| Reasons we can share your personal information | share? | sharing? |
| For our everyday business purposes – such as to process your transactions, maintain your account(s), respond to court orders and legal investigations, or report to credit bureaus | Yes | No |
| For our marketing purposes – to offer our products and services to you | No | We don’t share |
| For joint marketing with other financial companies | No | We don’t share |
| For our affiliates’ everyday business purposes – information about your transactions and experiences | No | We don’t share |
| For our affiliates’ everyday business purposes – information about your creditworthiness | No | We don’t share |
| For nonaffiliates to market to you | No | We don’t share |
| Questions? | Call 1-866-862-9686 |
109
| Who we are | |
| Who is providing this notice? | Advisors Preferred Trust |
| What we do | |
| How does Advisors Preferred Trust protect my personal information? | To protect your personal information from unauthorized access and use, we use security measures that comply with federal law. These measures include computer safeguards and secured files and buildings.
Our service providers are held accountable for adhering to strict policies and procedures to prevent any misuse of your nonpublic personal information. |
| How does Advisors Preferred Trust collect my personal information? | We collect your personal information, for example, when you
■ Open an account
■ Provide account information
■ Give us your contact information
■ Make deposits or withdrawals from your account
■ Make a wire transfer
■ Tell us where to send the money
■ Tells us who receives the money
■ Show your government-issued ID
■ Show your driver’s license
We also collect your personal information from other companies. |
| Why can’t I limit all sharing? | Federal law gives you the right to limit only
■ Sharing for affiliates’ everyday business purposes – information about your creditworthiness
■ Affiliates from using your information to market to you
■ Sharing for nonaffiliates to market to you
State laws and individual companies may give you additional rights to limit sharing. |
| Definitions | |
| Affiliates | Companies related by common ownership or control. They can be financial and nonfinancial companies.
■ Advisors Preferred Trust does not share with our affiliates. |
| Nonaffiliates | Companies not related by common ownership or control. They can be financial and nonfinancial companies.
■ Advisors Preferred Trust does not share with nonaffiliates so they can market to you. |
| Joint marketing | A formal agreement between nonaffiliated financial companies that together market financial products or services to you.
■ Advisors Preferred Trust doesn’t jointly market. |
110
PROXY VOTING POLICY
Information regarding how the Funds voted proxies relating to portfolio securities for the most recent twelve month period ended June 30 as well as a description of the policies and procedures that the Funds use to determine how to vote proxies is available without charge, upon request, by calling 1-855-647-8268 or by referring to the Securities and Exchange Commission’s (“SEC”) website at http://www.sec.gov.
PORTFOLIO HOLDINGS
The Funds file their complete schedule of portfolio holdings with the SEC for the first and third quarters of each fiscal year as an exhibit to its reports on Form N-PORT, within sixty days after the end of the period. Form N-PORT reports are available on the SEC’s website at http://www.sec.gov. The information on Form N-PORT is available without charge, upon request, by calling 1-855-647-8268.
| INVESTMENT ADVISOR |
| Advisors Preferred LLC |
| 1445 Research Blvd., Suite 530 |
| Rockville, MD 20850 |
| SUB-ADVISOR |
| Flexible Plan Investments, Ltd. |
| 3883 Telegraph Road, Suite 100 |
| Bloomfield Hills, MI 48302 |
| ADMINISTRATOR |
| Ultimus Fund Solutions, LLC |
| 225 Pictoria Drive, Suite 450 |
| Cincinnati, OH 45246 |
| QUANT-AR23 |
Item 1. Reports to Stockholders.
(b) Not applicable.
Item 2. Code of Ethics.
(a) As of the end of the period covered by this report, the registrant has adopted a code of ethics that applies to the registrant's principal executive officer, principal financial officer, principal accounting officer or controller, or persons performing similar functions, regardless of whether these individuals are employed by the registrant or a third party.
(b) For purposes of this item, “code of ethics” means written standards that are reasonably designed to deter wrongdoing and to promote:
| (1) | Honest and ethical conduct, including the ethical handling of actual or apparent conflicts of interest between personal and professional relationships; |
| (2) | Full, fair, accurate, timely, and understandable disclosure in reports and documents that a registrant files with, or submits to, the Commission and in other public communications made by the registrant; |
(3) Compliance with applicable governmental laws, rules, and regulations;
| (4) | The prompt internal reporting of violations of the code to an appropriate person or persons identified in the code; and |
(5) Accountability for adherence to the code.
(c) Amendments: During the period covered by the report, there have not been any amendments to the provisions of the code of ethics.
(d) Waivers: During the period covered by the report, the registrant has not granted any express or implicit waivers from the provisions of the code of ethics.
(e) The Code of Ethics is not posted on Registrant’ website.
(f) A copy of the Code of Ethics is attached as an exhibit.
Item 3. Audit Committee Financial Expert.
| (a) | The Registrant’s board of trustees has determined that Felix Rivera is the audit committee financial expert, as defined in Item 3 of Form N-CSR. Mr. Rivera is independent for purposes of this Item 3. |
Item 4. Principal Accountant Fees and Services.
| (a) | Audit Fees |
2023 - $140,250
2022 - $134,750
| (b) | Audit-Related Fees |
2023 - None
2022 - None
| (c) | Tax Fees |
2023 - $27,500
2022 - $27,500
Preparation of Federal & State income tax returns, assistance with calculation of required income, capital gain and excise distributions and preparation of Federal excise tax returns.
| (d) | All Other Fees |
2023 - None
2022 - None
| (e) | (1) Audit Committee’s Pre-Approval Policies |
The registrant’s Audit Committee is required to pre-approve all audit services and, when appropriate, any non-audit services (including audit-related, tax and all other services) to the registrant. The registrant’s Audit Committee also is required to pre-approve, when appropriate, any non-audit services (including audit-related, tax and all other services) to its adviser, or any entity controlling, controlled by or under common control with the adviser that provides ongoing services to the registrant, to the extent that the services may be determined to have an impact on the operations or financial reporting of the registrant. Services are reviewed on an engagement by engagement basis by the Audit Committee.
| (2) | Percentages of Services Approved by the Audit Committee |
2023 2022
Audit-Related Fees: 100% 100%
Tax Fees: 100% 100%
All Other Fees: 100% 100%
| (f) | During the audit of registrant's financial statements for the most recent fiscal year, less than 50 percent of the hours expended on the principal accountant's engagement were attributed to work performed by persons other than the principal accountant's full-time, permanent employees. |
| (g) | The aggregate non-audit fees billed by the registrant's accountant for services rendered to the registrant, and rendered to the registrant's investment adviser (not including any sub-adviser whose role is primarily portfolio management and is subcontracted with or overseen by another investment adviser), and any entity controlling, controlled by, or under common control with the adviser that provides ongoing services to the registrant: |
2023 - $27,500
2022 - $27,500
(h) The registrant's audit committee has considered whether the provision of non-audit services to the registrant's investment adviser (not including any sub-adviser whose role is primarily portfolio management and is subcontracted with or overseen by another investment adviser), and any entity controlling, controlled by, or under common control with the investment adviser that provides ongoing services to the registrant, that were not pre-approved pursuant to paragraph (c)(7)(ii) of Rule 2-01 of Regulation S-X, is compatible with maintaining the principal accountant's independence.
(i) Not applicable.
(j) Not applicable.
Item 5. Audit Committee of Listed Companies. Not applicable to open-end investment companies.
Item 6. Schedule of Investments. Schedule of investments in securities of unaffiliated issuers is included under Item 1.
Item 7. Disclosure of Proxy Voting Policies and Procedures for Closed-End Funds. Not applicable to open-end investment companies.
Item 8. Portfolio Managers of Closed-End Management Investment Companies. Not applicable to open-end investment companies.
Item 9. Purchases of Equity Securities by Closed-End Funds. Not applicable to open-end investment companies.
Item 10. Submission of Matters to a Vote of Security Holders. Vote of security holders is included under item 1.
Item 11. Controls and Procedures.
(a) Based on an evaluation of the Registrant’s disclosure controls and procedures as of a date within 90 days of filing date of this Form N-CSR, the principal executive officer and principal financial officer of the Registrant have concluded that the disclosure controls and procedures of the Registrant are reasonably designed to ensure that the information required in filings on Form N-CSR is recorded, processed, summarized, and reported by the filing date, including that information required to be disclosed is accumulated and communicated to the Registrant’s management, including the Registrant’s principal executive officer and principal financial officer, as appropriate to allow timely decisions regarding required disclosure.
(b) There were no significant changes in the Registrant’s internal control over financial reporting that occurred during the period covered by this report that have materially affected, or are reasonably likely to materially affect, the Registrant’s internal control over financial reporting.
Item 12. Disclosure of Securities Lending Activities for Closed-End Management Investment Companies.
Not applicable.
Item 13. Exhibits.
(a)(1) Code of Ethics filed herewith.
(a)(3) Not applicable for open-end investment companies.
SIGNATURES
Pursuant to the requirements of the Securities Exchange Act of 1934 and the Investment Company Act of 1940, the registrant has duly caused this report to be signed on its behalf by the undersigned, thereunto duly authorized.
(Registrant) Advisors Preferred Trust
By (Signature and Title)
/s/ Catherine Ayers-Rigsby
Catherine Ayer-Rigsby, President/Principal Executive Officer
Date 9/5/23
Pursuant to the requirements of the Securities Exchange Act of 1934 and the Investment Company Act of 1940, this report has been signed below by the following persons on behalf of the registrant and in the capacities and on the dates indicated.
By (Signature and Title)
/s/Catherine Ayers-Rigsby
Catherine Ayers-Rigsby, President/Principal Executive Officer
Date ___9/5/23
By (Signature and Title)
/s/ Christine Casares
Christine Casares, Treasurer/Principal Financial Officer
Date 9/5/23