Exhibit 99.4
Dex Media East, Inc.
2014 Ad Sales Growth
Compared to 2013
|
| December 31, 2014 |
| December 31, 2014 |
|
|
| QTD |
| YTD |
|
Print Ad Sales |
| -19 | % | -19 | % |
Digital Ad Sales |
| 11 | % | 12 | % |
Total Ad Sales |
| -8 | % | -11 | % |
Dex Media East, Inc.
Directly Attributable Contribution Margin
For the Three and Twelve Months Ended December 31, 2014
($ millions)
Q4 2014 |
|
| Margin % |
| Digital |
| Margin % |
| |||
Revenue - Amortized |
| $ | 41 |
|
|
| $ | 19 |
|
|
|
Less: Directly Attributable Costs |
| $ | 7 |
|
|
| $ | 8 |
|
|
|
Directly Attributable Contribution Margin |
| $ | 34 |
| 82.9 | % | $ | 11 |
| 57.9 | % |
YTD December 2014 |
|
| Margin % |
| Digital |
| Margin % |
| |||
Revenue - Amortized |
| $ | 175 |
|
|
| $ | 77 |
|
|
|
Less: Directly Attributable Costs |
| $ | 30 |
|
|
| $ | 32 |
|
|
|
Directly Attributable Contribution Margin |
| $ | 145 |
| 82.9 | % | $ | 45 |
| 58.4 | % |
Dex Media West, Inc.
2014 Ad Sales Growth
Compared to 2013
|
| December 31, 2014 |
| December 31, 2014 |
|
|
| QTD |
| YTD |
|
Print Ad Sales |
| -23 | % | -20 | % |
Digital Ad Sales |
| 8 | % | 7 | % |
Total Ad Sales |
| -16 | % | -13 | % |
Dex Media West, Inc.
Directly Attributable Contribution Margin
For the Three and Twelve Months Ended December 31, 2014
($ millions)
Q4 2014 |
|
| Margin % |
| Digital |
| Margin % |
| |||
Revenue - Amortized |
| $ | 45 |
|
|
| $ | 20 |
|
|
|
Less: Directly Attributable Costs |
| $ | 9 |
|
|
| $ | 8 |
|
|
|
Directly Attributable Contribution Margin |
| $ | 36 |
| 80.0 | % | $ | 12 |
| 60.0 | % |
YTD December 2014 |
|
| Margin % |
| Digital |
| Margin % |
| |||
Revenue - Amortized |
| $ | 192 |
|
|
| $ | 85 |
|
|
|
Less: Directly Attributable Costs |
| $ | 34 |
|
|
| $ | 37 |
|
|
|
Directly Attributable Contribution Margin |
| $ | 158 |
| 82.3 | % | $ | 48 |
| 56.5 | % |
R.H. Donnelley Inc.
2014 Ad Sales Growth
Compared to 2013
|
| December 31, 2014 |
| December 31, 2014 |
|
|
| QTD |
| YTD |
|
Print Ad Sales |
| -23 | % | -21 | % |
Digital Ad Sales |
| 6 | % | 9 | % |
Total Ad Sales |
| -15 | % | -12 | % |
R.H. Donnelley Inc.
Directly Attributable Contribution Margin
For the Three and Twelve Months Ended December 31, 2014
($ millions)
Q4 2014 |
|
| Margin % |
| Digital |
| Margin % |
| |||
Revenue - Amortized |
| $ | 60 |
|
|
| $ | 32 |
|
|
|
Less: Directly Attributable Costs |
| $ | 11 |
|
|
| $ | 12 |
|
|
|
Directly Attributable Contribution Margin |
| $ | 49 |
| 81.7 | % | $ | 20 |
| 62.5 | % |
YTD December 2014 |
|
| Margin % |
| Digital |
| Margin % |
| |||
Revenue - Amortized |
| $ | 259 |
|
|
| $ | 130 |
|
|
|
Less: Directly Attributable Costs |
| $ | 49 |
|
|
| $ | 53 |
|
|
|
Directly Attributable Contribution Margin |
| $ | 211 |
| 81.5 | % | $ | 77 |
| 59.2 | % |
Dex Media East, Inc.
2015 Ad Sales Growth
Compared to 2014
|
| March 31, 2015 |
|
|
| QTR |
|
Print Ad Sales |
| -30 | % |
Digital Ad Sales |
| -22 | % |
Total Ad Sales |
| -28 | % |
Dex Media East, Inc.
Directly Attributable Contribution Margin
For the Quarter Ended March 31, 2015
($ millions)
Q1 2015 |
|
| Margin % |
| Digital |
| Margin % |
| |||
Revenue - Amortized |
| $ | 38 |
|
|
| $ | 19 |
|
|
|
Less: Directly Attributable Costs |
| $ | 7 |
|
|
| $ | 10 |
|
|
|
Directly Attributable Contribution Margin |
| $ | 31 |
| 81.6 | % | $ | 9 |
| 47.4 | % |
Dex Media West, Inc.
2015 Ad Sales Growth
Compared to 2014
|
| March 31, 2015 |
|
|
| QTR |
|
Print Ad Sales |
| -23 | % |
Digital Ad Sales |
| -26 | % |
Total Ad Sales |
| -24 | % |
Dex Media West, Inc.
Directly Attributable Contribution Margin
For the Quarter Ended March 31, 2015
($ millions)
Q1 2015 |
|
| Margin % |
| Digital |
| Margin % |
| |||
Revenue - Amortized |
| $ | 41 |
|
|
| $ | 20 |
|
|
|
Less: Directly Attributable Costs |
| $ | 7 |
|
|
| $ | 10 |
|
|
|
Directly Attributable Contribution Margin |
| $ | 34 |
| 82.9 | % | $ | 10 |
| 50.0 | % |
R.H. Donnelley Inc.
2015 Ad Sales Growth
Compared to 2014
|
| March 31, 2015 |
|
Print Ad Sales |
| -24 | % |
Digital Ad Sales |
| -23 | % |
Total Ad Sales |
| -24 | % |
R.H. Donnelley Inc.
Directly Attributable Contribution Margin
For the Quarter Ended March 31, 2015
($ millions)
Q1 2015 |
|
| Margin % |
| Digital |
| Margin % |
| |||
Revenue - Amortized |
| $ | 55 |
|
|
| $ | 31 |
|
|
|
Less: Directly Attributable Costs |
| $ | 9 |
|
|
| $ | 14 |
|
|
|
Directly Attributable Contribution Margin |
| $ | 46 |
| 83.6 | % | $ | 17 |
| 54.8 | % |
SuperMedia, Inc.
2015 Ad Sales Growth
Compared to 2014
|
| March 31, 2015 |
|
|
| QTR |
|
Print Ad Sales |
| -26 | % |
Digital Ad Sales |
| -35 | % |
Total Ad Sales |
| -29 | % |
SuperMedia, Inc.
Directly Attributable Contribution Margin
For the Quarter Ended March 31, 2015
($ millions)
Q1 2015 |
|
| Margin % |
| Digital |
| Margin % |
| |||
Revenue - Amortized |
| $ | 139 |
|
|
| $ | 62 |
|
|
|
Less: Directly Attributable Costs |
| $ | 26 |
|
|
| $ | 34 |
|
|
|
Directly Attributable Contribution Margin |
| $ | 113 |
| 81.2 | % | $ | 28 |
| 45.2 | % |
Dex Media East, Inc.
2015 Ad Sales Growth
Compared to 2014
|
| June 30, 2015 |
| June 30, 2015 |
|
|
| QTD |
| YTD |
|
Print Ad Sales |
| -18 | % | -25 | % |
Digital Ad Sales |
| -10 | % | -15 | % |
Total Ad Sales |
| -15 | % | -22 | % |
Dex Media East, Inc.
Directly Attributable Contribution Margin
For the Three and Six Months Ended June 30, 2015
($ millions)
Q2 2015 |
|
| Margin % |
| Digital |
| Margin % |
| |||
Revenue - Amortized |
| $ | 36 |
|
|
| $ | 18 |
|
|
|
Less: Directly Attributable Costs |
| $ | 6 |
|
|
| $ | 9 |
|
|
|
Directly Attributable Contribution Margin |
| $ | 30 |
| 83.3 | % | $ | 9 |
| 50.0 | % |
YTD June 2015 |
|
| Margin % |
| Digital |
| Margin % |
| |||
Revenue - Amortized |
| $ | 74 |
|
|
| $ | 37 |
|
|
|
Less: Directly Attributable Costs |
| $ | 13 |
|
|
| $ | 19 |
|
|
|
Directly Attributable Contribution Margin |
| $ | 61 |
| 82.4 | % | $ | 18 |
| 48.6 | % |
Dex Media West, Inc.
2015 Ad Sales Growth
Compared to 2014
|
| June 30, 2015 |
| June 30, 2015 |
|
|
| QTD |
| YTD |
|
Print Ad Sales |
| -16 | % | -21 | % |
Digital Ad Sales |
| -24 | % | -25 | % |
Total Ad Sales |
| -21 | % | -23 | % |
Dex Media West, Inc.
Directly Attributable Contribution Margin
For the Three and Six Months Ended June 30, 2015
($ millions)
Q2 2015 |
|
| Margin % |
| Digital |
| Margin % |
| |||
Revenue - Amortized |
| $ | 39 |
|
|
| $ | 20 |
|
|
|
Less: Directly Attributable Costs |
| $ | 7 |
|
|
| $ | 9 |
|
|
|
Directly Attributable Contribution Margin |
| $ | 32 |
| 82.1 | % | $ | 11 |
| 55.0 | % |
YTD June 2015 |
|
| Margin % |
| Digital |
| Margin % |
| |||
Revenue - Amortized |
| $ | 80 |
|
|
| $ | 40 |
|
|
|
Less: Directly Attributable Costs |
| $ | 14 |
|
|
| $ | 19 |
|
|
|
Directly Attributable Contribution Margin |
| $ | 66 |
| 82.5 | % | $ | 21 |
| 52.5 | % |
R.H. Donnelley Inc.
2015 Ad Sales Growth
Compared to 2014
|
| June 30, 2015 |
| June 30, 2015 |
|
|
| QTD |
| YTD |
|
Print Ad Sales |
| -22 | % | -23 | % |
Digital Ad Sales |
| -16 | % | -19 | % |
Total Ad Sales |
| -20 | % | -21 | % |
R.H. Donnelley Inc.
Directly Attributable Contribution Margin
For the Three and Six Months Ended June 30, 2015
($ millions)
Q2 2015 |
|
| Margin % |
| Digital |
| Margin % |
| |||
Revenue - Amortized |
| $ | 52 |
|
|
| $ | 32 |
|
|
|
Less: Directly Attributable Costs |
| $ | 8 |
|
|
| $ | 14 |
|
|
|
Directly Attributable Contribution Margin |
| $ | 44 |
| 84.6 | % | $ | 18 |
| 56.3 | % |
YTD June 2015 |
|
| Margin % |
| Digital |
| Margin % |
| |||
Revenue - Amortized |
| $ | 108 |
|
|
| $ | 62 |
|
|
|
Less: Directly Attributable Costs |
| $ | 18 |
|
|
| $ | 27 |
|
|
|
Directly Attributable Contribution Margin |
| $ | 90 |
| 83.3 | % | $ | 35 |
| 56.5 | % |
Dex Media
GAAP Operating Costs Detail
June 2015 YTD
(in millions)
|
| SuperMedia Inc. |
|
|
|
|
| R.H. Donnelley, |
|
|
| Consolidated |
|
|
| and Subsidiaries |
| Dex East, Inc. |
| Dex West, Inc. |
| Inc. |
| Dex Media Inc. |
| Dex Media |
|
|
|
|
|
|
|
|
|
|
|
|
|
|
|
Direct Operating Costs: |
|
|
|
|
|
|
|
|
|
|
|
|
|
Sales Commissions |
| 29 |
| 8 |
| 9 |
| 12 |
| — |
| 58 |
|
Print and Distribution |
| 35 |
| 10 |
| 11 |
| 13 |
| — |
| 69 |
|
Sales Employee Related Costs |
| 24 |
| 7 |
| 6 |
| 11 |
| — |
| 48 |
|
Depreciation and Amortization |
| 67 |
| 43 |
| 52 |
| 37 |
| — |
| 199 |
|
Stewardship |
| — |
| — |
| — |
| — |
| 5 |
| 5 |
|
Other (a) |
| 24 |
| 6 |
| 7 |
| 6 |
| — |
| 43 |
|
Total Direct Operating Costs: |
| 179 |
| 74 |
| 85 |
| 79 |
| 5 |
| 422 |
|
|
|
|
|
|
|
|
|
|
|
|
|
|
|
Shared Costs |
| 152 |
| 42 |
| 45 |
| 64 |
| — |
| 303 |
|
|
|
|
|
|
|
|
|
|
|
|
|
|
|
Total Operating Costs |
| 331 |
| 116 |
| 130 |
| 143 |
| 5 |
| 725 |
|
|
|
|
|
|
|
|
|
|
|
|
|
|
|
Interest Expense, Net |
| 101 |
| 10 |
| 14 |
| 29 |
| 18 |
| 172 |
|
(a) occupancy expense, bad debt, bank fees and sales employee expense reimbursements
Dex Media
GAAP Operating Costs Detail
2014
(in millions)
|
| SuperMedia Inc. |
|
|
|
|
| R.H. Donnelley, |
|
|
| Consolidated |
|
|
| and Subsidiaries |
| Dex East, Inc. |
| Dex West, Inc. |
| Inc. |
| Dex Media Inc. |
| Dex Media |
|
|
|
|
|
|
|
|
|
|
|
|
|
|
|
Direct Operating Costs: |
|
|
|
|
|
|
|
|
|
|
|
|
|
Sales Commissions |
| 69 |
| 17 |
| 19 |
| 26 |
| — |
| 131 |
|
Print and Distribution |
| 83 |
| 24 |
| 26 |
| 38 |
| — |
| 171 |
|
Sales Employee Related Costs |
| 27 |
| 14 |
| 18 |
| 28 |
| — |
| 87 |
|
Depreciation and Amortization |
| 218 |
| 125 |
| 154 |
| 110 |
| — |
| 607 |
|
Stewardship |
| — |
| — |
| — |
| — |
| 24 |
| 24 |
|
Other (a) |
| 50 |
| 11 |
| 14 |
| 20 |
| — |
| 95 |
|
Total Direct Operating Costs: |
| 447 |
| 191 |
| 231 |
| 222 |
| 24 |
| 1,115 |
|
|
|
|
|
|
|
|
|
|
|
|
|
|
|
Shared Costs |
| 356 |
| 93 |
| 106 |
| 149 |
| — |
| 704 |
|
|
|
|
|
|
|
|
|
|
|
|
|
|
|
Total Operating Costs |
| 803 |
| 284 |
| 337 |
| 371 |
| 24 |
| 1,819 |
|
|
|
|
|
|
|
|
|
|
|
|
|
|
|
Interest Expense, Net |
| 207 |
| 23 |
| 29 |
| 63 |
| 34 |
| 356 |
|
(a) occupancy expense, bad debt, bank fees and sales employee expense reimbursements
R.H. Donnelley Inc.
Financial Covenant Calculations
December 31, 2014
($ Millions)
|
| 1Q14 |
| 2Q14 |
| 3Q14 |
| 4Q14 |
|
| Total |
| |||||
Consolidated EBITDA |
|
|
|
|
|
|
|
|
|
|
|
| |||||
Consolidated Net Income |
| $ | 5.7 |
| $ | (11.6 | ) | $ | (0.8 | ) | $ | (69.8 | ) |
| $ | (76.6 | ) |
(a) Additions (without duplication) |
|
|
|
|
|
|
|
|
|
| — |
| |||||
(i) Consolidated interest expense |
| 16.2 |
| 16.1 |
| 16.1 |
| 15.1 |
|
| 63.5 |
| |||||
(ii) Consolidated income tax expense |
| (15.8 | ) | 4.1 |
| (5.3 | ) | 52.1 |
|
| 35.0 |
| |||||
(iii) Depreciation and amortization |
| 29.4 |
| 29.2 |
| 29.1 |
| 29.0 |
|
| 116.7 |
| |||||
(iv) Extraordinary charges or non-cash charges |
| 0.1 |
| 0.1 |
| 0.1 |
| 8.4 |
|
| 8.8 |
| |||||
(v) Non-recurring charges: |
|
|
|
|
|
|
|
|
|
| — |
| |||||
(A) Severance costs associated with restructuring (2015-2016 only) not to exceed $3.5M per year |
| — |
| — |
| — |
| — |
|
| — |
| |||||
(B) Investment and commercial banking fees and expenses |
| — |
| — |
| — |
| — |
|
| — |
| |||||
(C) Cash premiums, penalties or other payments payable in connection with the early extinguishment or repurchase of debt |
| — |
| — |
| — |
| — |
|
| — |
| |||||
(vi) Specified Charges through 12/31/13 up to $14.7M total |
| — |
| — |
| — |
| — |
|
| — |
| |||||
(b) Subtractions (without duplication) |
|
|
|
|
|
|
|
|
|
| — |
| |||||
(i) Consolidated interest income |
| — |
| — |
| — |
| — |
|
| — |
| |||||
(ii) Extraordinary gains and non-cash gains |
| — |
| — |
| (3.3 | ) | — |
|
| (3.3 | ) | |||||
Other Adjustments |
|
|
|
|
|
|
|
|
|
| — |
| |||||
Fresh start accounting adjustment |
| — |
| — |
| — |
| — |
|
| — |
| |||||
Consolidated EBITDA |
| $ | 35.6 |
| $ | 37.9 |
| $ | 36.0 |
| $ | 34.7 |
|
| $ | 144.3 |
|
|
|
|
|
|
|
|
|
|
|
|
|
| |||||
|
| 1Q14 |
| 2Q14 |
| 3Q14 |
| 4Q14 |
|
| Total |
| |||||
Consolidated Cash Interest Expense |
|
|
|
|
|
|
|
|
|
|
|
| |||||
(a) Sum of (i) and (ii): |
|
|
|
|
|
|
|
|
|
|
|
| |||||
(i) Total cash interest expense |
|
|
|
|
|
|
|
|
|
|
|
| |||||
(A) Interest expense per GAAP |
| $ | 16.2 |
| $ | 16.1 |
| $ | 16.1 |
| $ | 15.1 |
|
| $ | 63.5 |
|
Less: |
|
|
|
|
|
|
|
|
|
| — |
| |||||
(B) Amortization of deferred financing |
| (0.3 | ) | (0.3 | ) | (0.3 | ) | (0.3 | ) |
| (1.3 | ) | |||||
(C) Swap/cap MTM adjustments |
| — |
| — |
| — |
| — |
|
| — |
| |||||
(D) Debt FMV adjustment |
| — |
| — |
| — |
| — |
|
| — |
| |||||
Total Cash interest expense |
| $ | 15.8 |
| $ | 15.8 |
| $ | 15.8 |
| $ | 14.8 |
|
| $ | 62.2 |
|
(ii) Dividends/Distributions per Section 6.08(a)(iv) |
| 3.0 |
| — |
| 3.2 |
| — |
|
| 6.2 |
| |||||
Less: |
|
|
|
|
|
|
|
|
|
|
|
| |||||
(b) Total cash interest income |
| — |
| — |
| — |
| — |
|
| — |
| |||||
Consolidated Cash Interest Expense |
| $ | 18.9 |
| $ | 15.8 |
| $ | 18.9 |
| $ | 14.8 |
|
| $ | 68.4 |
|
DEBT
|
| 4Q14 |
| |
Term loan outstanding |
| $ | 611.8 |
|
Cash (up to $25MM) |
| $ | (23.1 | ) |
Total Senior Secured Debt |
| $ | 588.7 |
|
Interest Coverage |
| ||||
|
|
|
|
|
|
Actual |
| Minimum |
| Result |
|
2.11 x |
| 1.10 x |
| Pass |
|
Total Leverage |
| ||||
|
| ||||
Actual |
| Maximum |
| Result |
|
4.08 x |
| 5.3500 x |
| Pass |
|
R.H. Donnelley Inc.
Financial Covenant Calculations
March 31, 2015
($ Millions)
|
| 2Q14 |
| 3Q14 |
| 4Q14 |
| 1Q15 |
|
| Total |
| |||||
Consolidated EBITDA |
|
|
|
|
|
|
|
|
|
|
|
| |||||
Consolidated Net Income |
| $ | (11.6 | ) | $ | (0.8 | ) | $ | (69.8 | ) | $ | 8.4 |
|
| $ | (73.8 | ) |
(a) Additions (without duplication) |
|
|
|
|
|
|
|
|
|
| — |
| |||||
(i) Consolidated interest expense |
| 16.1 |
| 16.1 |
| 15.1 |
| 15.0 |
|
| 62.4 |
| |||||
(ii) Consolidated income tax expense |
| 4.1 |
| (5.3 | ) | 52.1 |
| (9.8 | ) |
| 41.1 |
| |||||
(iii) Depreciation and amortization |
| 29.2 |
| 29.1 |
| 29.0 |
| 20.1 |
|
| 107.4 |
| |||||
(iv) Extraordinary charges or non-cash charges |
| 0.1 |
| 0.1 |
| 8.4 |
| (3.2 | ) |
| 5.5 |
| |||||
(v) Non-recurring charges: |
| — |
| — |
| — |
| — |
|
| — |
| |||||
(A) Severance costs associated with restructuring (2015-2016 only) not to exceed $3.5M per year |
| — |
| — |
| — |
| — |
|
| — |
| |||||
(B) Investment and commercial banking fees and expenses |
| — |
| — |
| — |
| — |
|
| — |
| |||||
(C) Cash premiums, penalties or other payments payable in connection with the early extinguishment or repurchase of debt |
| — |
| — |
| — |
| — |
|
| — |
| |||||
(vi) Specified Charges through 12/31/13 up to $14.7M total |
| — |
| — |
| — |
| — |
|
| — |
| |||||
(b) Subtractions (without duplication) |
| — |
| — |
| — |
| — |
|
| — |
| |||||
(i) Consolidated interest income |
| — |
| — |
| — |
| — |
|
| — |
| |||||
(ii) Extraordinary gains and non-cash gains |
| — |
| (3.3 | ) | — |
| — |
|
| (3.3 | ) | |||||
Other Adjustments |
| — |
| — |
| — |
| — |
|
| — |
| |||||
Fresh start accounting adjustment |
| — |
| — |
| — |
| — |
|
| — |
| |||||
Consolidated EBITDA |
| $ | 37.9 |
| $ | 36.0 |
| $ | 34.7 |
| $ | 30.7 |
|
| $ | 139.3 |
|
|
|
|
|
|
|
|
|
|
|
|
|
| |||||
|
| 2Q14 |
| 3Q14 |
| 4Q14 |
| 1Q15 |
|
| Total |
| |||||
|
|
|
|
|
|
|
|
|
|
|
|
| |||||
Consolidated Cash Interest Expense |
|
|
|
|
|
|
|
|
|
|
|
| |||||
(a) Sum of (i) and (ii): |
|
|
|
|
|
|
|
|
|
|
|
| |||||
(i) Total cash interest expense |
|
|
|
|
|
|
|
|
|
|
|
| |||||
(A) Interest expense per GAAP |
| $ | 16.1 |
| $ | 16.1 |
| $ | 15.1 |
| $ | 15.0 |
|
| $ | 62.4 |
|
Less: |
|
|
|
|
|
|
|
|
|
|
|
| |||||
(B) Amortization of deferred financing |
| (0.3 | ) | (0.3 | ) | (0.3 | ) | (0.3 | ) |
| (1.3 | ) | |||||
(C) Swap/cap MTM adjustments |
|
|
|
|
|
|
|
|
|
| — |
| |||||
(D) Debt FMV adjustment |
| — |
| — |
| — |
| — |
|
| — |
| |||||
Total Cash interest expense |
| $ | 15.8 |
| $ | 15.8 |
| $ | 14.8 |
| $ | 14.7 |
|
| $ | 61.1 |
|
(ii) Dividends/Distributions per Section 6.08(a)(iv) |
| — |
| 3.2 |
| — |
| — |
|
| 3.2 |
| |||||
Less: |
|
|
|
|
|
|
|
|
|
|
|
| |||||
(b) Total cash interest income |
| — |
| — |
| — |
| — |
|
| — |
| |||||
Consolidated Cash Interest Expense |
| $ | 15.8 |
| $ | 18.9 |
| $ | 14.8 |
| $ | 14.7 |
|
| $ | 64.3 |
|
DEBT
|
| 1Q2015 |
| |
Term loan outstanding |
| $ | 604.9 |
|
Cash (up to $25MM) |
| $ | (24.2 | ) |
Total Senior Secured Debt |
| $ | 580.7 |
|
Interest Coverage |
| ||||
|
|
|
|
|
|
Actual |
| Minimum |
| Result |
|
2.17 x |
| 1.10 x |
| Pass |
|
Total Leverage |
| ||||
|
| ||||
Actual |
| Maximum |
| Result |
|
4.1684 x |
| 5.3125 x |
| Pass |
|
Dex Media, Inc.
Severance Packages
Employee Level / |
|
|
|
|
|
|
|
|
Severance Package |
| Effective Date |
| Payout Timeline |
| Payout terms |
| Payout Restrictions |
Executive Vice President (“EVP”) and above |
| 7/6/14 |
| Lump sum payment |
| 78 weeks of pay plus 1.5 times target bonus |
| N/A |
Non-Bargained employees below EVP |
| 11/17/14 |
| Lump sum payment |
| (2 times full years of service + prorated year of service) times weekly compensation |
| Minimum: 6 to 26 times weekly compensation (1) |
CWA Union employees Dex East |
| 7/1/14 |
| Lump sum payment |
| (2 times full years of service times weekly compensation w/incentive included) + prorated payment (3) |
| Minimum: 4 times weekly compensation |
CWA Union employees Dex West |
| 9/15/12 - 3/18/16 |
| Lump sum payment |
| Voluntary (4): $1k for each year of employment Involuntary (5): $2k for each year of employment |
| Voluntary (4) Involuntary (5) |
IBEW Union employees Dex West |
| 6/12/15 - 5/11/18 |
| Lump sum payment |
| Voluntary (4): $1k for each year of employment
|
| Voluntary (4) Involuntary (5) |
Notes:
(1) 6 times weekly compensation is for employees below Director/Division Managers; 26 times weekly compensation is for Directors, AVPs, VPs, Divisional Managers, and Regional VPs
(2) 26 times weekly compensation is for employees below Director/Division Managers; 52 times weekly compensation is for Directors, AVPs, VPs, Divisional Managers, and Regional VPs
(3) If partial year of service is greater than 6 months = 2 times weekly compensation; if partial year is less than 6 months = 1 times weekly compensation
(4) Regular employees who are declared surplus by Company due to lack of work and accept voluntary separation
(5) Regular employees who are declared surplus by Company due to lack of work and who are involuntary separated

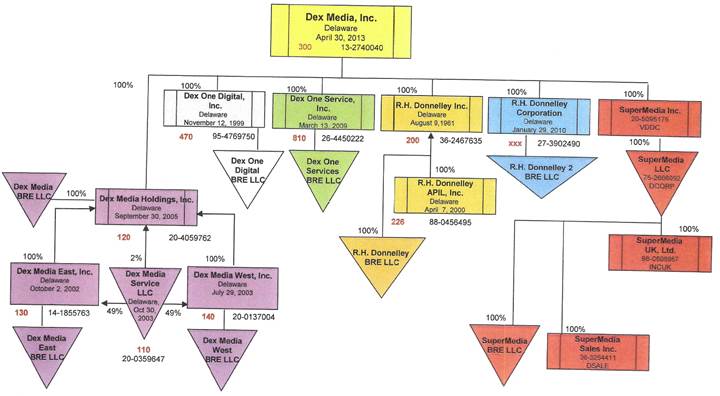
Entity Information
· Dex Media Inc., Parent of Dex Media, holding company
· Dex Media Holdings, Inc., holding company for Dex Media East, Inc., Dex Media West, Inc. and Dex Media Services LLC
· Dex Media Services LLC, pension services for Dex Media East Inc. and Dex Media West Inc.
· Dex Media East, Inc., operating entity, yellow pages print and digital advertising
· Dex Media West, Inc., operating entity, yellow pages print and digital advertising
· Dex One Digital, Inc., national digital advertising services
· Dex One Services, Inc., management company for Dex Media Inc.
· R.H. Donnelley, Inc., operating entity, yellow pages print and digital advertising
· R.H. Donnelley APIL, Inc., management company for R.H. Donnelley, Inc.
· R.H. Donnelley Corporation, inactive entity
· SuperMedia Inc., holding company for SuperMedia entities
· SuperMedia LLC, operating entity, yellow pages print and digital advertising
· SuperMedia UK, Ltd., disregarded entity providing digital advertising services
· SuperMedia Sales, Inc., employment services support entity
· All “BRE LLC’s” (bankruptcy remote entity) are disregarded entities designed to protect related owner entity’s intellectual property
Items on Balance Sheets of Legal Entities
Dex Media, Inc — Cash, Senior subordinated notes, Investment in subs, Accounts payable and other accrued liabilities (Stewardship obligations) Intercompany payable, Taxes, Equity
Dex Media Holdings Inc- Investment in subs (DME, DMW, DM Services LLC-2%), Equity
Dex Media Services LLC — Intercompany payable, Pension liability, Equity
Dex Media East, Inc — Cash, Customer A/R, Deferred directory costs, Intercompany receivable, Fixed assets/Capitalized software, Intangible assets, Accounts payable and other accrued liabilities, Accrued interest, Deferred revenue, Senior secured credit facilities, Taxes, Investment in Sub (DM Services LLC-49%), Equity
Dex Media West, Inc — Cash, Customer A/R, Deferred directory costs, Intercompany receivable, Fixed assets/Capitalized software, Intangible assets, Accounts payable and other accrued liabilities, Accrued interest, Deferred revenue, Senior secured credit facilities, Taxes, Investment in Sub (DM Services LLC-49%), Equity
Dex One Digital, Inc — Cash, A/R, Intercompany payable, Deferred revenue, Taxes, Equity
Dex One Services, Inc- Cash, Prepaid expenses/Other current assets, Intercompany receivable, Fixed assets/Capitalized software, Accounts payable and other accrued liabilities, Employee benefits (no pension), Taxes, Equity
R.H.Donnelley, Inc- Cash, Customer A/R, Deferred directory costs, Fixed assets/Capitalized software, Intangible assets, Investment in Subs (R.H. Donnelley, APIL, Inc), Accounts payable and other accrued liabilities, Accrued interest, Deferred revenue, Intercompany payable, Senior secured credit facilities, Pension liability, Taxes, Equity
R.H.Donnelley, APIL, Inc- Intercompany receivable, Taxes, Equity
R.H.Donnelley Corporation-Inactive
SuperMedia Inc- Goodwill, Pension asset, Investment in subs (SuperMedia LLC), Intercompany interest payable (SuperMedia LLC), Intercompany note payable (SuperMedia LLC), Intercompany payable, Senior secured credit facilities, Pension liability, Taxes, Equity
SuperMedia LLC-Cash, Customer A/R, Deferred directory costs, Intercompany interest receivable (SuperMedia Inc), Intercompany note receivable (SuperMedia Inc), Prepaid expenses and other, Fixed assets/Capitalized software, Intangible assets, Investment in Subs (SuperMedia Sales, Inc), Accounts payable and other accrued liabilities, Accrued interest, Deferred revenue, Intercompany payable (SuperMedia Sales), Intercompany payable, Senior secured credit facilities, Other employee benefits (LTD, Supplemental Employee Retirement Liability), Taxes, Equity
SuperMedia UK, Ltd- Immaterial assets/liabilities
SuperMedia Sales, Inc- Fixed assets, Intercompany note receivable (SuperMedia LLC), Intercompany payable, Accounts payable and other accrued liabilities, Taxes, Equity
All BRE LLC’s do not have any assets/liabilities on their books.
Note:
Accounts payable and accrued expenses can include:
Accounts payable
Accrued salaries and wages, including accrued severance
Accrued taxes
Accrued expenses
Customer refunds, advance payments and other
Dex Media
GAAP Operating Costs Detail
June 2015 YTD
(in millions)
|
| SuperMedia Inc. |
|
|
|
|
| R.H. Donnelley, |
|
|
| Consolidated |
|
|
| and Subsidiaries |
| Dex East, Inc. |
| Dex West, Inc. |
| Inc. |
| Dex Media Inc. |
| Dex Media |
|
|
|
|
|
|
|
|
|
|
|
|
|
|
|
Direct Operating Costs: |
|
|
|
|
|
|
|
|
|
|
|
|
|
Sales Commissions |
| 29 |
| 8 |
| 9 |
| 12 |
| — |
| 58 |
|
Print and Distribution |
| 35 |
| 10 |
| 11 |
| 13 |
| — |
| 69 |
|
Sales Employee Related Costs |
| 24 |
| 7 |
| 6 |
| 11 |
| — |
| 48 |
|
Depreciation and Amortization |
| 67 |
| 43 |
| 52 |
| 37 |
| — |
| 199 |
|
Stewardship |
| — |
| — |
| — |
| — |
| 5 |
| 5 |
|
Other (a) |
| 24 |
| 6 |
| 7 |
| 6 |
| — |
| 43 |
|
Total Direct Operating Costs: |
| 179 |
| 74 |
| 85 |
| 79 |
| 5 |
| 422 |
|
|
|
|
|
|
|
|
|
|
|
|
|
|
|
Shared Costs |
| 152 |
| 42 |
| 45 |
| 64 |
| — |
| 303 |
|
|
|
|
|
|
|
|
|
|
|
|
|
|
|
Total Operating Costs |
| 331 |
| 116 |
| 130 |
| 143 |
| 5 |
| 725 |
|
|
|
|
|
|
|
|
|
|
|
|
|
|
|
Interest Expense, Net |
| 101 |
| 10 |
| 14 |
| 29 |
| 18 |
| 172 |
|
(a) occupancy expense, bad debt, bank fees and sales employee expense reimbursements
Dex Media
GAAP Operating Costs Detail
2014
(in millions)
|
| SuperMedia Inc. |
|
|
|
|
| R.H. Donnelley, |
|
|
| Consolidated |
|
|
| and Subsidiaries |
| Dex East, Inc. |
| Dex West, Inc. |
| Inc. |
| Dex Media Inc. |
| Dex Media |
|
|
|
|
|
|
|
|
|
|
|
|
|
|
|
Direct Operating Costs: |
|
|
|
|
|
|
|
|
|
|
|
|
|
Sales Commissions |
| 69 |
| 17 |
| 19 |
| 26 |
| — |
| 131 |
|
Print and Distribution |
| 83 |
| 24 |
| 26 |
| 38 |
| — |
| 171 |
|
Sales Employee Related Costs |
| 27 |
| 14 |
| 18 |
| 28 |
| — |
| 87 |
|
Depreciation and Amortization |
| 218 |
| 125 |
| 154 |
| 110 |
| — |
| 607 |
|
Stewardship |
| — |
| — |
| — |
| — |
| 24 |
| 24 |
|
Other(a) |
| 50 |
| 11 |
| 14 |
| 20 |
| — |
| 95 |
|
Total Direct Operating Costs: |
| 447 |
| 191 |
| 231 |
| 222 |
| 24 |
| 1,115 |
|
|
|
|
|
|
|
|
|
|
|
|
|
|
|
Shared Costs |
| 356 |
| 93 |
| 106 |
| 149 |
| — |
| 704 |
|
|
|
|
|
|
|
|
|
|
|
|
|
|
|
Total Operating Costs |
| 803 |
| 284 |
| 337 |
| 371 |
| 24 |
| 1,819 |
|
|
|
|
|
|
|
|
|
|
|
|
|
|
|
Interest Expense, Net |
| 207 |
| 23 |
| 29 |
| 63 |
| 34 |
| 356 |
|
(a) occupancy expense, bad debt, bank fees and sales employee expense reimbursements
Dex Media
Intercompany Detail
Excluding Tax Sharing Agreement
As of June 30, 2015
|
|
|
|
|
| Dex Media Holdings |
| Shared Services Funding |
|
|
|
|
| Stewardship Costs |
| Parent Bond Interest |
| Group Activity |
| Activity |
| Intercompany Balance |
|
|
|
|
|
|
|
|
|
|
|
|
|
Dex Media Inc. |
| (44,607,108.00 | ) | (25,587,436.00 | ) | — |
| — |
| (70,194,544.00 | ) |
R.H. Donnelly, Inc. |
| 9,050,438.00 |
| 9,467,345.00 |
| — |
| (3,700,813.00 | ) | 14,816,970.00 |
|
Dex Media Holdings Inc. |
| — |
| — |
| (11,767.00 | ) | — |
| (11,767.00 | ) |
Dex Media East, Inc. |
| 6,212,811.50 |
| 6,908,605.00 |
| 3,981,414.50 |
| (4,266,805.00 | ) | 12,836,026.00 |
|
Dex Media West, Inc. |
| 6,566,116.50 |
| 9,211,486.00 |
| 3,832,790.50 |
| (2,689,157.00 | ) | 16,921,236.00 |
|
Dex Media Service LLC |
| — |
| — |
| (7,802,438.00 | ) | — |
| (7,802,438 00 | ) |
Dex One Digital, Inc. |
| — |
| — |
| — |
| (661,142.00 | ) | (661,142.00 | ) |
SuperMedia Inc and Subsidiaries |
| 22,777,742.00 |
| — |
| — |
| (17,001,683.00 | ) | 5,776,059.00 |
|
Eliminations/Other |
| — |
| — |
| — |
| — |
| — |
|
|
|
|
|
|
|
|
|
|
|
|
|
Dex One Service, Inc. |
| — |
| — |
| — |
| 28,319,600.00 |
| 28,319,600.00 |
|
|
|
|
|
|
|
|
|
|
|
|
|
|
| — |
| — |
| — |
| — |
| — |
|
Notes:
Stewardship, parent bond interest and pension activity will continue to increase as there is no mechanism to settle these intercompanies Shared funding activity will go up and down as various liabilities are accrued and paid throughout the year
Dex Media Inc. & Subsidiaries - Intercompany (I/C) Balance Summary
June 30, 2015
Excludes Tax Sharing Agreement
|
| I/C Activity to be Settled with Cash |
| I/C Activity to be Settled with Non-Cash Distribution |
|
|
| ||||||||||||||||||||
|
|
|
|
|
|
|
|
|
|
|
|
|
| Q4 2014 |
|
|
|
|
|
|
|
|
| Q2 2015 |
|
|
|
|
| Q4 2014 |
|
|
|
|
|
|
|
|
| Q2 2015 |
| Ending Balance |
|
|
|
|
|
|
|
|
| Ending Balance |
| Q2 2015 |
|
|
| Ending Balance |
| Net |
| Net |
| Net |
| Net |
| Ending Balance |
| to be Settled with |
| Net |
| Net |
| Net |
| Net |
| to be Settled with |
| Ending Balance |
|
|
| to be Settled with |
| I/C Activity |
| I/C Activity |
| I/C Activity |
| I/C Activity |
| to be Settled with |
| Non-Cash |
| I/C Activity |
| I/C Activity |
| I/C Activity |
| I/C Activity |
| Non-Cash |
| Cash & |
|
Due From (Due To) Dex One Service, Inc. |
| Cash |
| Q1 |
| Q2 |
| Q3 |
| Q4 |
| Cash |
| Distribution |
| Q1 |
| Q2 |
| Q3 |
| Q4 |
| Distribution |
| Non-Cash |
|
Dex Media Inc. |
| — |
| — |
|
|
|
|
|
|
| — |
| (49,553,632 | ) | (16,686,275 | ) | (3,954,637 | ) |
|
|
|
| (70,194,544 | ) | (70,194,544 | ) |
R.H. Donnelly, Inc. |
| (4,166,476 | ) | 4,886,093 |
| (4,420,431 | ) |
|
|
|
| (3,700,813 | ) | 13,080,495 |
| 5,341,372 |
| 95,916 |
|
|
|
|
| 18,517,783 |
| 14,816,969 |
|
Dex Media Holdings Inc. (120)\ |
| — |
|
|
| — |
|
|
|
|
| — |
| (11,686 | ) | (80 | ) |
|
|
|
|
|
| (11,767 | ) | (11,767 | ) |
Dex Media East, Inc. |
| (19,259,396 | ) | 2,308,654 |
| 12,683,937 |
|
|
|
|
| (4,266,805 | ) | 12,865,929 |
| 3,848,990 |
| 387,913 |
|
|
|
|
| 17,102,831 |
| 12,836,026 |
|
Dex Media West, Inc. |
| 2,170,477 |
| 1,827,129 |
| (6,686,763 | ) |
|
|
|
| (2,689,157 | ) | 14,275,279 |
| 4,022,141 |
| 1,312,973 |
|
|
|
|
| 19,610,393 |
| 16,921,235 |
|
Dex Media Service LLC |
| — |
|
|
| — |
|
|
|
|
| — |
| (7,989,524 | ) | (494,950 | ) | 682,036 |
|
|
|
|
| (7,802,438 | ) | (7,802,438 | ) |
Dex One Digital, Inc. |
| (951,385 | ) | (351,668 | ) | 641,910 |
|
|
|
|
| (661,142 | ) | — |
| — |
| — |
|
|
|
|
| — |
| (661,142 | ) |
SuperMedia Inc and Subsidiaries |
| (33,160,804 | ) | 4,443,726 |
| 11,715,395 |
|
|
|
|
| (17,001,683 | ) | 17,333,139 |
| 3,968,804 |
| 1,475,800 |
|
|
|
|
| 22,777,743 |
| 5,776,060 |
|
Eliminations/Other |
| 1 |
|
|
|
|
|
|
|
|
| 1 |
| — |
| — |
| — |
| — |
| — |
| — |
| 1 |
|
Total |
| (55,367,583 | ) | 13,113,934 |
| 13,934,049 |
| — |
| — |
| (28,319,600 | ) | 0 |
| 0 |
| 0 |
| — |
| — |
| 1 |
| (28,319,599 | ) |
|
|
|
|
|
|
|
|
|
|
|
|
|
|
|
|
|
|
|
|
|
|
|
|
|
|
|
|
Dex One Service, Inc. - Due From (Due to) |
| 55,367,583 |
| (13,113,934 | ) | (13,934,049 | ) | — |
| — |
| 28,319,600 |
| — |
| (0 | ) | (0 | ) | — |
| — |
| (1 | ) | 28,319,599 |
|
Dex Media Inc. Consolidated |
| — |
| — |
| — |
| — |
| — |
| — |
| — |
| — |
| — |
| — |
| — |
| — |
| — |
|
Notes:
Net Intercompany Activity to be Settled in Cash: Disbursements from the Dex One Service funding account are settled with the appropriate entities when the payment clears. This activity reflects expense accruals that will be paid in a subsequent period plus disbursements from the Dex One Service funding account that have not yet been settled with the operating companies minus cash settlements from a prior period.
Net Intercompany Activity to be Settled with Non-Cash Distribution: This activity represents certain expenses that are settled through a non-cash dividend or equity adjustment in accordance with the Shared Services Agreement.
Dex Media Inc. & Subsidiaries - Intercompany Tax Sharing Agreement Balance Summary
June 30, 2015
|
| I/C Tax Sharing Agreement Activity |
| ||||||
|
|
|
|
|
|
|
| Q2 2015 |
|
|
|
|
|
|
| Net |
| Ending Tax |
|
|
| Q4 2014 |
| Net |
| I/C TSA |
| Sharing |
|
|
| Ending |
| I/C TSA Activity |
| Activity |
| Agreement |
|
Due From (Due To) Dex One Service, Inc. |
| Balance |
| Q1 |
| Q2 |
| Balance |
|
Dex Media Inc. |
| — |
| (19,860 | ) | — |
| (19,860 | ) |
R.H. Donnelly, Inc. |
| (3,158,193 | ) | 6,316,059 |
| (4,226,013 | ) | (1,068,147 | ) |
Dex Media Holdings Inc. (120) |
| 155,691 |
| 11,353 |
| (144,415 | ) | 22,629 |
|
Dex Media East, Inc. |
| 6,342,020 |
| (2,675,895 | ) | (2,722,367 | ) | 943,759 |
|
Dex Media West, Inc. |
| 7,532,398 |
| (4,188,506 | ) | (2,722,419 | ) | 621,473 |
|
Dex Media Service LLC |
| (6,791,504 | ) | (248,544 | ) | 7,040,049 |
| 1 |
|
Dex One Digital, Inc. |
| (11,712 | ) | 803 |
| 11,258 |
| 349 |
|
SuperMedia Inc. and Subsidiaries |
| (3,828,019 | ) | (6,366,625 | ) | 9,935,120 |
| (259,524 | ) |
Eliminations/Other |
| (1 | ) | 1 |
| 1 |
| 1 |
|
Total |
| 240,679 |
| (7,171,213 | ) | 7,171,213 |
| 240,679 |
|
|
|
|
|
|
|
|
|
|
|
Dex One Service, Inc. - Due From (Due to) |
| (240,679 | ) | 7,171,213 |
| (7,171,213 | ) | (240,679 | ) |
Dex Media Inc. Consolidated |
| — |
| — |
| — |
| — |
|
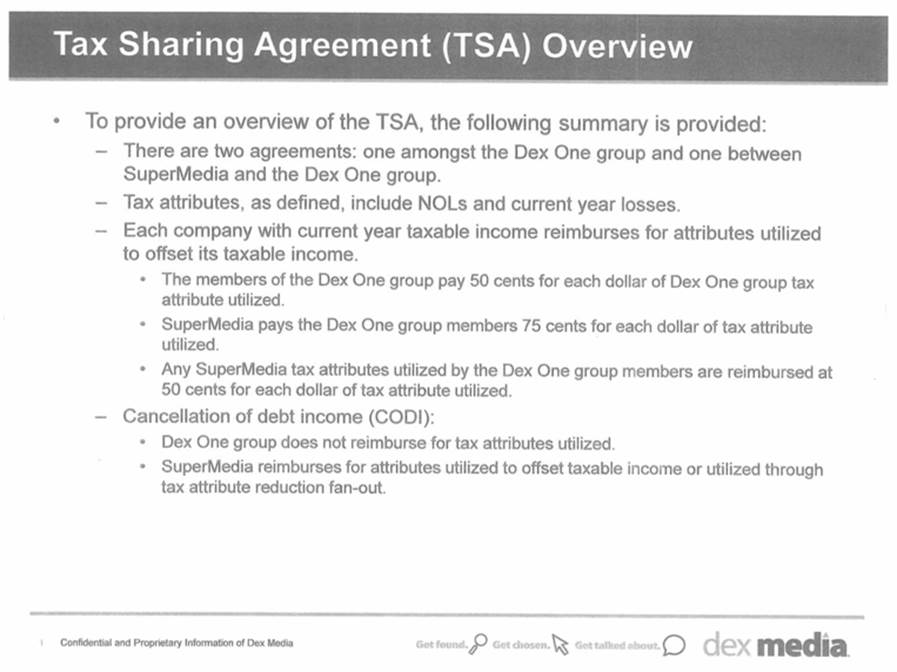
Confidential Christopher Petrocelli Sep 08, 2015 16:02 Tax Sharing Agreement (TSA) Overview • To provide an overview of the TSA, the following summary is provided: • There are two agreements: one amongst the Dex One group and one between SuperMedia and the Dex One group. • Tax attributes, as defined, include NOLs and current year losses. • Each company with current year taxable income reimburses for attributes utilized to offset its taxable income. • The members of the Dex One group pay 50 cents for each dollar of Dex One group tax attribute utilized. • SuperMedia pays the Dex One group members 75 cents for each dollar of tax attribute utilized. • Any SuperMedia tax attributes utilized by the Dex One group members are reimbursed at 50 cents for each dollar of tax attribute utilized. • Cancellation of debt income (CODI): • Dex One group does not reimburse for tax attributes utilized. • SuperMedia reimburses for attributes utilized to offset taxable income or utilized through tax attribute reduction fan-out. 1 Confidential and Proprietary Information of Dex Media Get found. Get chosen. Get talked about. dex media. Confidential Christopher Petrocelli Sep 08, 2015 16:02
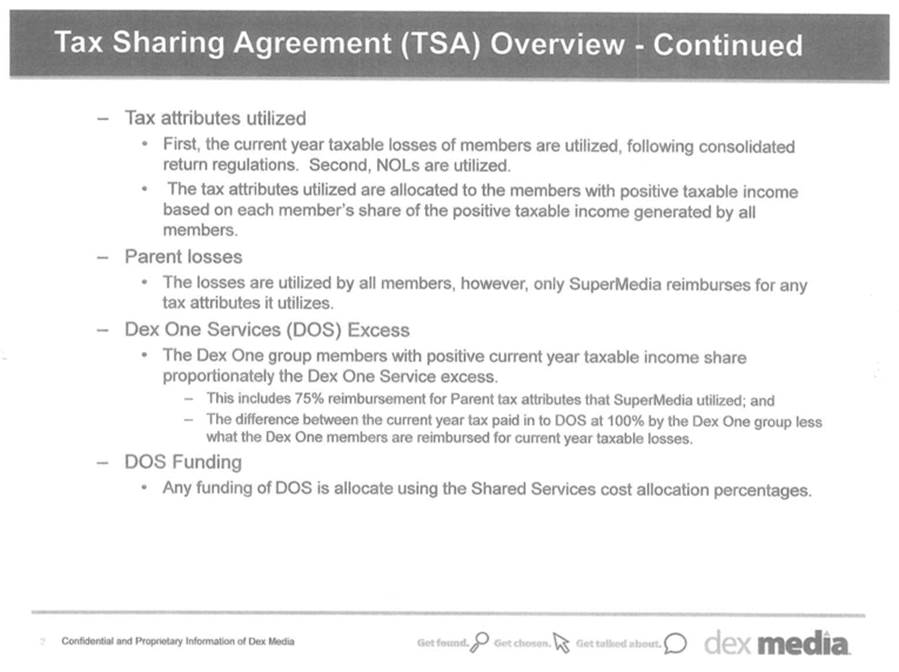
Confidential Christopher Petrocelli Sep 08, 2015 16:02 Tax Sharing Agreement (TSA) Overview - Continued • Tax attributes utilized • First, the current year taxable losses of members are utilized, following consolidated return regulations. Second, NOLs are utilized. • The tax attributes utilized are allocated to the members with positive taxable income based on each member’s share of the positive taxable income generated by all members. • Parent losses • The losses are utilized by all members, however, only SuperMedia reimburses for any tax attributes it utilizes. • Dex One Services (DOS) Excess • The Dex One group members with positive current year taxable income share proportionately the Dex One Service excess. • This includes 75% reimbursement for Parent tax attributes that SuperMedia utilized; and • The difference between the current year tax paid in to DOS at 100% by the Dex One group less what the Dex One members are reimbursed for current year taxable losses. • DOS Funding • Any funding of DOS is allocate using the Shared Services cost allocation percentages. 2 Confidential and Proprietary Information of Dex Media Get found. Get chosen. Get talked about. dex media. Confidential Christopher Petrocelli Sep 08, 2015 16:02
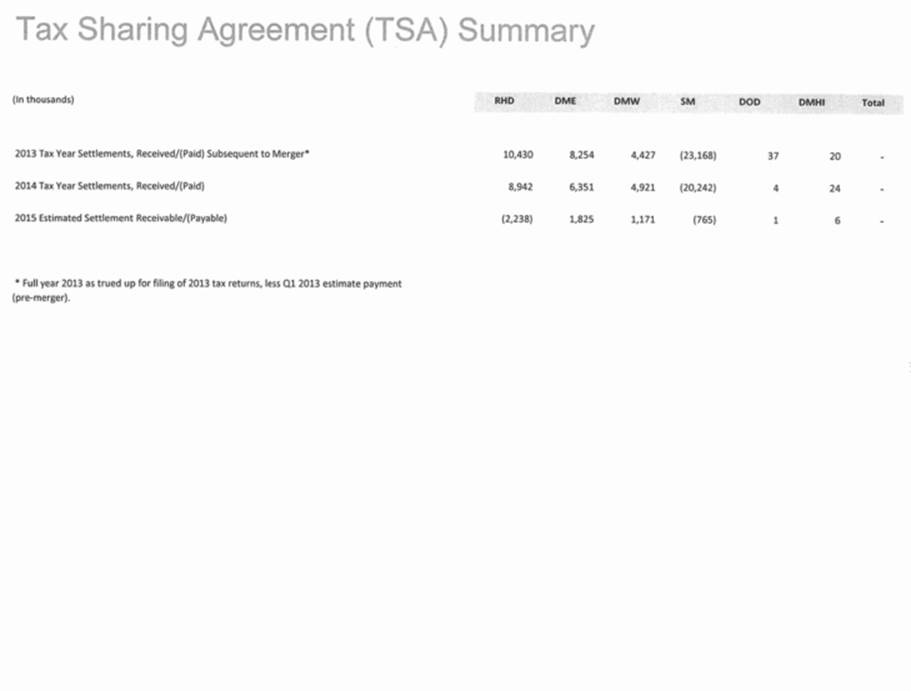
Confidential Christopher Petrocelli Sep 08, 2015 16:02 Tax Sharing Agreement (TSA) Summary (In thousands) RHD DME DMW SM DOD DMHI Total 2013 Tax Year Settlements, Received/(Paid) Subsequent to Merger* 10,430 8,254 4,427 (23,168) 37 20 - 2014 Tax Year Settlements, Received/(Paid) 8,942 6,351 4,921 (20,242) 4 24 - 2015 Estimated Settlement Receivable/(Payable) (2,238) 1,825 1,171 (765) 1 6 - * Full year 2013 as trued up for filing of 2013 tax returns, less Q1 2013 estimate payment (pre-merger). Confidential Christopher Petrocelli Sep 08, 2015 16:02
Federal NOLs
Dex Media, Inc.
Federal Net Operating Loss - Pre-tax
Balance as of 12/31/2014
(in millions)
Estimated Federal Net Operating Loss Balance |
| $ | 732 |
|
Note 1: All Federal NOLs are at the R.H. Donnelley Inc. silo.
Note2 : Estimate based on 2014 provision and will be trued up based on completion of the 2014 Federal Dex Media Inc. Income Tax Return.
Dex Media
Unitary State NOL Carryforwards (Post Apportionment, Pre-Tax)
Estimated as of 12/31/14
By Silo |
| Arizona |
| California |
| Colorado |
| District of |
| Idaho |
| Illinois |
| Iowa |
| Kansas |
| Kentucky |
| Maine |
| Massachusetts |
| Michigan |
| Minnesota |
| Montana |
| Nebraska |
| New Hampshire |
| New Mexico |
| New York |
| North Dakota |
| Oregon |
| Texas |
| Utah |
| Vermont |
| West Virginia |
| Wisconsin |
|
|
|
|
|
|
|
|
|
|
|
|
|
|
|
|
|
|
|
|
|
|
|
|
|
|
|
|
|
|
|
|
|
|
|
|
|
|
|
|
|
|
|
|
|
|
|
|
|
|
|
|
|
R.H. Donnelley, Inc. |
| 682,368 |
| 3,016,572 |
| 144,893,493 |
| 59 |
| 1,121,304 |
| 229,622,460 |
| 6,306,469 |
| 41,654,771 |
| 0 |
| 93,233 |
| 0 |
| 0 |
| 7,238,639 |
| 0 |
| 691,077 |
| 0 |
| 83,102 |
| 79,170,311 |
| 32,813 |
| 71,340 |
| 0 |
| 2,289,119 |
| 0 |
| 111,004 |
| 24,606 |
|
Dex Media East, Inc. |
| 3,179,791 |
| 3,973,984 |
| 18,548,238 |
| 332 |
| 2,330,353 |
| 0 |
| 56,546,060 |
| 2,512,559 |
| 0 |
| 140,217 |
| 0 |
| 0 |
| 166,771,749 |
| 5,215,082 |
| 1,211,240 |
| 0 |
| 460,060 |
| 0 |
| 839,392 |
| 122,685 |
| 0 |
| 4,892,362 |
| 0 |
| 633,900 |
| 1,032,705 |
|
Dex Media West, Inc. |
| 15,192,684 |
| 4,908,273 |
| 17,874,770 |
| 583 |
| 7,641,798 |
| 0 |
| 1 |
| 3,066,881 |
| 0 |
| 44,330 |
| 0 |
| 0 |
| 11,063,808 |
| 226,401 |
| 1,112,951 |
| 0 |
| 39,569 |
| 0 |
| 20,395 |
| 829,222 |
| 0 |
| 61,553,082 |
| 0 |
| 1,115,234 |
| 22,985 |
|
SuperMedia, Inc. |
| 0 |
| 0 |
| 0 |
| 167,820 |
| 0 |
| 0 |
| 0 |
| 0 |
| 0 |
| 0 |
| 0 |
| 0 |
| 0 |
| 0 |
| 0 |
| 0 |
| 0 |
| 0 |
| 0 |
| 0 |
| 0 |
| 0 |
| 0 |
| 58,839 |
| 309,502 |
|
Parent and Other |
| 1,293,427 |
| 71,832,688 |
| 40,471,374 |
| 106 |
| 920,559 |
| 0 |
| 314,424 |
| 9,468,177 |
| 0 |
| 157,246 |
| 0 |
| 0 |
| 2,362,252 |
| 0 |
| 312,209 |
| 0 |
| 142,820 |
| 0 |
| 53,154 |
| 117,360 |
| 0 |
| 2,397,832 |
| 0 |
| 196,480 |
| 39,863 |
|
|
|
|
|
|
|
|
|
|
|
|
|
|
|
|
|
|
|
|
|
|
|
|
|
|
|
|
|
|
|
|
|
|
|
|
|
|
|
|
|
|
|
|
|
|
|
|
|
|
|
|
|
Total |
| 20,348,270 |
| 83,731,517 |
| 221,787,874 |
| 168,900 |
| 12,014,014 |
| 229,622,460 |
| 63,166,955 |
| 56,702,388 |
| 0 |
| 435,026 |
| 0 |
| 0 |
| 187,436,448 |
| 5,441,483 |
| 3,327,478 |
| 0 |
| 725,551 |
| 79,170,311 |
| 945,753 |
| 1,140,607 |
| 0 |
| 71,132,394 |
| 0 |
| 2,115,457 |
| 1,429,661 |
|
Note 1: Unitary state net operating losses per silo are based on a Tax Sharing Agreement (TSA) view.
Note 2: States that track net operating loss on a pre-apportionment basis are presented with the applicable net operating loss at a post-apportionment amount as of December 31, 2014.
Dex Media
Separate Company State NOL Carryforwards (Post Apportionment, Pre-Tax)
Estimated as of 12/31/14
By Silo |
| Alabama |
| Connecticut |
| Delaware |
| Florida |
| Georgia |
| Indiana |
| Louisiana |
| Maryland |
| Missouri |
| Mississippi |
| North Carolina |
| New Jersey |
| Ohio |
| Oklahoma |
| Pennsylvania |
| Rhode Island |
| South Carolina |
| Tennessee |
| Virginia |
|
|
|
|
|
|
|
|
|
|
|
|
|
|
|
|
|
|
|
|
|
|
|
|
|
|
|
|
|
|
|
|
|
|
|
|
|
|
|
|
|
R.H. Donnelley, Inc. |
| — |
| — |
| — |
| 8,159,876 |
| — |
| 5,499,761 |
| — |
| — |
| 401 |
| — |
| 603,150,439 |
| 23,884,822 |
| — |
| — |
| 23,736,823 |
| — |
| 1,134,713 |
| 22,814,092 |
| 10,995,200 |
|
Dex Media East, Inc. |
| — |
| — |
| — |
| 167,201 |
| — |
| — |
| — |
| — |
| — |
| — |
| 544,652 |
| — |
| — |
| — |
| — |
| — |
| — |
| — |
| — |
|
Dex Media West, Inc. |
| — |
| — |
| — |
| — |
| — |
| — |
| — |
| — |
| — |
| — |
| 101,230 |
| — |
| — |
| — |
| — |
| — |
| — |
| — |
| — |
|
SuperMedia, Inc. |
| 40,500 |
| 2,218 |
| 129,621 |
| 3,674,042 |
| 27,970 |
| 16,469 |
| — |
| 1,169,633 |
| 12,339 |
| — |
| — |
| 1,059,871 |
| — |
| — |
| 2,101,779 |
| — |
| 60,334 |
| 166,785 |
| 1,514,900 |
|
Parent and Other |
| — |
| 499,696 |
| — |
| 81,817 |
| — |
| — |
| — |
| — |
| — |
| — |
| 27,154,882 |
| 0 |
| — |
| — |
| 63,664 |
| — |
| — |
| — |
| — |
|
|
|
|
|
|
|
|
|
|
|
|
|
|
|
|
|
|
|
|
|
|
|
|
|
|
|
|
|
|
|
|
|
|
|
|
|
|
|
|
|
Total |
| 40,500 |
| 501,914 |
| 129,621 |
| 12,082,937 |
| 27,970 |
| 5,516,230 |
| — |
| 1,169,633 |
| 12,740 |
| — |
| 630,951,203 |
| 24,944,693 |
| — |
| — |
| 25,902,266 |
| — |
| 1,195,047 |
| 22,980,877 |
| 12,510,101 |
|
Note 1: States that track net operating loss on a pre-apportionment basis are presented with the applicable net operating loss at a post-apportionment amount as of December 31, 2014.
Summary of Illustrative Analysis of Dex Media, Inc.’s Tax Attributes in the Context of Various Restructuring Scenarios(1)
EXHIBIT 1 - PRE/POST TRANSACTION INTANGIBLE ASSET BASIS REDUCTIONS
|
|
|
| Pre-Transaction |
|
|
| Post-Transaction |
| |||
($ in millions) |
| Silo |
| Asset Basis (2) |
| Inc. / (Dec.) |
| Asset Basis (2) |
| |||
2.00x Scenario (1) |
| SuperMedia |
| $ | 135 |
| $ | (135 | ) | $ | 0 |
|
| RHDI |
| 59 |
| (12 | ) | 47 |
| ||||
| Dex East |
| 152 |
| (100 | ) | 52 |
| ||||
| Dex West |
| 193 |
| (143 | ) | 50 |
| ||||
2.25x Scenario (1) |
| SuperMedia |
| $ | 135 |
| $ | (135 | ) | $ | 0 |
|
| RHDI |
| 59 |
| (9 | ) | 50 |
| ||||
| Dex East |
| 152 |
| (81 | ) | 71 |
| ||||
| Dex West |
| 193 |
| (119 | ) | 74 |
| ||||
2.50x Scenario (1) |
| SuperMedia |
| $ | 135 |
| $ | (135 | ) | $ | 0 |
|
| RHDI |
| 59 |
| (7 | ) | 52 |
| ||||
| Dex East |
| 152 |
| (62 | ) | 90 |
| ||||
| Dex West |
| 193 |
| (97 | ) | 96 |
| ||||
2.75x Scenario (1) |
| SuperMedia |
| $ | 135 |
| $ | (107 | ) | $ | 28 |
|
| RHDI |
| 59 |
| (4 | ) | 55 |
| ||||
| Dex East |
| 152 |
| (40 | ) | 112 |
| ||||
| Dex West |
| 193 |
| (69 | ) | 124 |
| ||||
3.00x Scenario (1) |
| SuperMedia |
| $ | 135 |
| $ | (56 | ) | $ | 79 |
|
| RHDI |
| 59 |
| (1 | ) | 58 |
| ||||
| Dex East |
| 152 |
| (19 | ) | 133 |
| ||||
| Dex West |
| 193 |
| (42 | ) | 151 |
| ||||
Notes: |
| (1): Multiples based on 2015E EBITDA of $525mm |
|
| (2): Only inclusive of asset basis subject to a potential CODI reduction |
(1) The valuation multiples disclosed herein were utilized solely for the basis of understanding potential tax consequences of a restructuring of Dex Media, Inc. These multiples are not intended to provide any stakeholder a valuation of Dex Media, Inc., as a potential valuation is subject to many factors not contemplated in this illustrative analysis. These valuation multiples are not explicitly or implicitly endorsed by the Management of Dex Media, Inc. or its financial, accounting, and legal advisors.
EXHIBIT 2 - PRE/POST TRANSACTION DMI STOCK BASIS REDUCTIONS
|
|
|
| Pre-Transaction |
|
|
| Post-Transaction |
| |||
($ in millions) |
| Silo |
| DMI Stock Basis (2) |
| Inc. / (Dec.) |
| DMI Stock Basis (2) |
| |||
2.00x Scenario (1) |
| SuperMedia |
| $ | (128 | ) | $ | 0 |
| $ | (128 | ) |
| RHDI |
| 222 |
| (61 | ) | 161 |
| ||||
| Dex East |
| 313 |
| (49 | ) | 264 |
| ||||
| Dex West |
| 607 |
| (95 | ) | 512 |
| ||||
2.25x Scenario (1) |
| SuperMedia |
| $ | (65 | ) | $ | 0 |
| $ | (65 | ) |
| RHDI |
| 250 |
| (63 | ) | 187 |
| ||||
| Dex East |
| 333 |
| (49 | ) | 284 |
| ||||
| Dex West |
| 629 |
| (94 | ) | 535 |
| ||||
2.50x Scenario (1) |
| SuperMedia |
| $ | (3 | ) | $ | 0 |
| $ | (3 | ) |
| RHDI |
| 277 |
| (65 | ) | 212 |
| ||||
| Dex East |
| 352 |
| (50 | ) | 302 |
| ||||
| Dex West |
| 650 |
| (93 | ) | 557 |
| ||||
2.75x Scenario (1) |
| SuperMedia |
| $ | 59 |
| $ | 0 |
| $ | 59 |
|
| RHDI |
| 305 |
| (63 | ) | 242 |
| ||||
| Dex East |
| 372 |
| (48 | ) | 324 |
| ||||
| Dex West |
| 672 |
| (86 | ) | 586 |
| ||||
3.00x Scenario (1) |
| SuperMedia |
| $ | 121 |
| $ | 0 |
| $ | 121 |
|
| RHDI |
| 334 |
| (61 | ) | 273 |
| ||||
| Dex East |
| 390 |
| (45 | ) | 345 |
| ||||
| Dex West |
| 693 |
| (81 | ) | 612 |
| ||||
Notes: |
| (1): Multiples based on 2015E EBITDA of $525mm |
|
| (2): The assets described in this schedule are in addition to those featured in Exhibit 1 |
EXHIBIT 3 — ADDITIONAL MISCELLANEOUS PRE/POST TRANSACTION BASIS REDUCTIONS
($ in millions) |
| Metric |
| Pre-Transaction (2) |
| Inc. / (Dec.) |
| Post-Transaction (2) |
| |||
2.00x Scenario (1) |
| DMI Basis in Depreciable Prop. |
| $ | 22 |
| $ | (6 | ) | $ | 16 |
|
| SPMD Basis in Accounts Rec. |
| 80 |
| (19 | ) | 61 |
| ||||
| RHDI Stock Basis in APIL |
| 543 |
| (108 | ) | 435 |
| ||||
2.25x Scenario (1) |
| DMI Basis in Depreciable Prop. |
| $ | 22 |
| $ | (5 | ) | $ | 17 |
|
| SPMD Basis in Accounts Rec. |
| 80 |
| (19 | ) | 61 |
| ||||
| RHDI Stock Basis in APIL |
| 543 |
| (85 | ) | 458 |
| ||||
2.50x Scenario (1) |
| DMI Basis in Depreciable Prop. |
| $ | 22 |
| $ | (5 | ) | $ | 17 |
|
| SPMD Basis in Accounts Rec. |
| 80 |
| (19 | ) | 61 |
| ||||
| RHDI Stock Basis in APIL |
| 543 |
| (62 | ) | 481 |
| ||||
2.75x Scenario (1) |
| DMI Basis in Depreciable Prop. |
| $ | 22 |
| $ | (4 | ) | $ | 18 |
|
| SPMD Basis in Accounts Rec. |
| 80 |
| — |
| 80 |
| ||||
| RHDI Stock Basis in APIL |
| 543 |
| (35 | ) | 508 |
| ||||
3.00x Scenario (1) |
| DMI Basis in Depreciable Prop. |
| $ | 22 |
| $ | (4 | ) | $ | 18 |
|
| SPMD Basis in Accounts Rec. |
| 80 |
| — |
| 80 |
| ||||
| RHDI Stock Basis in APIL |
| 543 |
| (9 | ) | 534 |
| ||||
Notes: |
| (1): Multiples based on 2015E EBITDA of $525mm |
|
| (2): The assets described in this schedule are in addition to those featured in Exhibit 1 |
EXHIBIT 4 — INTANGIBLE ASSET AMORTIZATION PERIOD (DEX EAST & DEX WEST)
($ in millions) |
| Silo |
| Asset Amortization Period |
|
2.00x Scenario (1) |
| Dex East |
| 2 years |
|
| Dex West |
| 3 years |
| |
2.25x Scenario (1) |
| Dex East |
| 2 years |
|
| Dex West |
| 3 years |
| |
2.50x Scenario (1) |
| Dex East |
| 2 years |
|
| Dex West |
| 3 years |
| |
2.75x Scenario (1) |
| Dex East |
| 2 years |
|
| Dex West |
| 3 years |
| |
3.00x Scenario (1) |
| Dex East |
| 2 years |
|
| Dex West |
| 3 years |
|
Notes: |
| (1): Multiples based on 2015E EBITDA of $525mm |
EXHIBIT 5 — RBIG & 382 LIMITATION DETAIL
($ in millions) |
| Silo |
| One-time RBIG (2) |
| Annual RBIG (3) |
| 382 Limitation Yr 1 |
| 382 Limitation Rem. Yrs |
| ||||
2.00x Scenario (1) |
| SuperMedia |
| $ | 198 |
| $ | 19 |
| $ | — |
| $ | — |
|
| RHDI |
| 60 |
| 8 |
| — |
| — |
| |||||
| Dex East |
| 30 |
| — |
| — |
| — |
| |||||
| Dex West |
| 45 |
| — |
| — |
| — |
| |||||
| Consolidated |
| NA |
| NA |
| 368 |
| 35 |
| |||||
2.25x Scenario (1) |
| SuperMedia |
| $ | 198 |
| $ | 23 |
| $ | — |
| $ | — |
|
| RHDI |
| 60 |
| 10 |
| — |
| — |
| |||||
| Dex East |
| 30 |
| — |
| — |
| — |
| |||||
| Dex West |
| 45 |
| — |
| — |
| — |
| |||||
| Consolidated |
| NA |
| NA |
| 378 |
| 45 |
| |||||
2.50x Scenario (1) |
| SuperMedia |
| $ | 198 |
| $ | 27 |
| $ | — |
| $ | — |
|
| RHDI |
| 60 |
| 12 |
| — |
| — |
| |||||
| Dex East |
| 30 |
| — |
| — |
| — |
| |||||
| Dex West |
| 45 |
| — |
| — |
| — |
| |||||
| Consolidated |
| NA |
| NA |
| 388 |
| 54 |
| |||||
2.75x Scenario (1) |
| SuperMedia |
| $ | 198 |
| $ | 31 |
| $ | — |
| $ | — |
|
| RHDI |
| 60 |
| 14 |
| — |
| — |
| |||||
| Dex East |
| 30 |
| — |
| — |
| — |
| |||||
| Dex West |
| 45 |
| — |
| — |
| — |
| |||||
| Consolidated |
| NA |
| NA |
| 397 |
| 64 |
| |||||
3.00x Scenario (1) |
| SuperMedia |
| $ | 198 |
| $ | 36 |
| $ | — |
| $ | — |
|
| RHDI |
| 60 |
| 16 |
| — |
| — |
| |||||
| Dex East |
| 30 |
| — |
| — |
| — |
| |||||
| Dex West |
| 45 |
| — |
| — |
| — |
| |||||
| Consolidated |
| NA |
| NA |
| 407 |
| 74 |
| |||||
Notes: |
| (1): Multiples based on 2015E EBITDA of $525mm |
|
| (2): Occurs in the first year following emergence |
|
| (3): Occurs in each of the first five years following emergence |
EXHIBIT 6 — AMT NOL DETAIL
($ in millions) |
| 3.0x Valuation |
| 2.75x Valuation |
| 2.5x Valuation |
| 2.25x Valuation |
| 2.0x Valuation |
| |||||
Incremental Depreciation Expense - AMTI |
|
|
|
|
|
|
|
|
|
|
| |||||
2016 |
| $ | 14.2 |
| $ | 12.2 |
| $ | 11.0 |
| $ | 10.8 |
| $ | 10.6 |
|
2017 |
| 16.7 |
| 15.6 |
| 14.8 |
| 14.7 |
| 14.5 |
| |||||
2018 |
| 18.1 |
| 17.4 |
| 16.9 |
| 16.8 |
| 16.7 |
| |||||
2019 |
| 19.5 |
| 19.0 |
| 18.7 |
| 18.6 |
| 18.5 |
| |||||
2020 |
| 20.3 |
| 20.0 |
| 19.8 |
| 19.7 |
| 19.7 |
| |||||
Incremental Intangible Amortization Expense - AMTI |
|
|
|
|
|
|
|
|
|
|
| |||||
2016 |
| $ | 115.0 |
| $ | 96.5 |
| $ | 77.5 |
| $ | 62.3 |
| $ | 46.3 |
|
2017 |
| 105.9 |
| 88.6 |
| 71.0 |
| 56.9 |
| 42.0 |
| |||||
2018 |
| 35.2 |
| 28.2 |
| 21.2 |
| 16.0 |
| 10.5 |
| |||||
2019 |
| 1.1 |
| 0.4 |
| — |
| — |
| — |
| |||||
2020 |
| 1.1 |
| 0.4 |
| — |
| — |
| — |
| |||||
Reduction to Deferred Directory Costs and A/R - AMTI |
|
|
|
|
|
|
|
|
|
|
| |||||
2016 |
| $ | (14.7 | ) | $ | (20.9 | ) | $ | (46.6 | ) | $ | (51.9 | ) | $ | (57.5 | ) |
2017 |
| — |
| — |
| — |
| — |
| — |
| |||||
2018 |
| — |
| — |
| — |
| — |
| — |
| |||||
2019 |
| — |
| — |
| — |
| — |
| — |
| |||||
2020 |
| — |
| — |
| — |
| — |
| — |
| |||||
Incremental Depreciation Expense - Taxable Income |
|
|
|
|
|
|
|
|
|
|
| |||||
2016 |
| $ | 14.1 |
| $ | 12.2 |
| $ | 10.9 |
| $ | 10.7 |
| $ | 10.5 |
|
2017 |
| 16.6 |
| 15.5 |
| 14.8 |
| 14.6 |
| 14.4 |
| |||||
2018 |
| 18.1 |
| 17.4 |
| 16.9 |
| 16.8 |
| 16.7 |
| |||||
2019 |
| 19.5 |
| 19.0 |
| 18.7 |
| 18.6 |
| 18.5 |
| |||||
2020 |
| 20.3 |
| 20.0 |
| 19.8 |
| 19.7 |
| 19.7 |
| |||||
Incremental Intangible Amortization Expense - Taxable Income |
|
|
|
|
|
|
|
|
|
|
| |||||
2016 |
| $ | 102.1 |
| $ | 84.4 |
| $ | 66.2 |
| $ | 51.8 |
| $ | 36.7 |
|
2017 |
| 95.0 |
| 78.4 |
| 61.5 |
| 48.1 |
| 33.9 |
| |||||
2018 |
| 35.7 |
| 28.7 |
| 21.9 |
| 16.8 |
| 11.5 |
| |||||
2019 |
| 1.1 |
| 0.4 |
| — |
| — |
| — |
| |||||
2020 |
| 1.1 |
| 0.4 |
| — |
| — |
| — |
| |||||
Reduction to Deferred Directory Costs and A/R - Taxable Income |
|
|
|
|
|
|
|
|
|
|
| |||||
2016 |
| $ | (6.4 | ) | $ | (12.6 | ) | $ | (38.4 | ) | $ | (43.7 | ) | $ | (49.2 | ) |
2017 |
| — |
| — |
| — |
| — |
| — |
| |||||
2018 |
| — |
| — |
| — |
| — |
| — |
| |||||
2019 |
| — |
| — |
| — |
| — |
| — |
| |||||
2020 |
| — |
| — |
| — |
| — |
| — |
| |||||
|
|
|
|
|
|
|
|
|
|
|
| |||||
Starting RHDI NOL Balance |
| $ | 534.2 |
| $ | 508.3 |
| $ | 478.4 |
| $ | 393.3 |
| $ | 307.0 |
|
Starting AMT NOL Balance |
| 294.5 |
| 267.7 |
| 237.3 |
| 152.3 |
| 65.7 |
| |||||
Notes: |
| (1): Multiples based on 2015E EBITDA of $525mm |
Appendix
Q4 2014 Selected Financial Data
Dex Media East, Inc.
Reconciliation of Non-GAAP Measures Directly Attributable Contribution Margin
For the Three and Twelve Months Ended December 31, 2014
($ millions)
Q4 2014 |
|
| Margin |
| Digital |
| Margin |
| Total |
| ||||
Revenue - Amortized |
| $ | 41 |
|
|
| $ | 19 |
|
|
| $ | 60 |
|
Less: Directly Attributable Costs |
| $ | 7 |
|
|
| $ | 8 |
|
|
| $ | 15 |
|
Directly Attributable Contribution Margin |
| $ | 34 |
| 82.9 | % | $ | 11 |
| 57.9 | % | $ | 45 |
|
Reconciliation to GAAP |
|
|
| |
|
|
|
| |
Directly Attributable Contribution Margin |
| $ | 45 |
|
|
|
|
| |
Other Costs Not Included Above in Directly Attributable Costs |
| 25 |
| |
Depreciation and amortization |
| 32 |
| |
Total costs not included above |
| $ | 57 |
|
|
|
|
| |
GAAP Operating income (loss) |
| $ | (12 | ) |
|
|
|
| |
Operating income (loss) margin |
| -20.0 | % | |
YTD December 2014 |
|
| Margin |
| Digital |
| Margin |
| Total |
| ||||
Revenue - Amortized |
| $ | 175 |
|
|
| $ | 77 |
|
|
| $ | 252 |
|
Less: Directly Attributable Costs |
| $ | 30 |
|
|
| $ | 32 |
|
|
| $ | 62 |
|
Directly Attributable Contribution Margin |
| $ | 145 |
| 82.9 | % | $ | 45 |
| 58.4 | % | $ | 190 |
|
Reconciliation to GAAP |
|
|
| |
|
|
|
| |
Directly Attributable Contribution Margin |
| $ | 190 |
|
|
|
|
| |
Other Costs Not Included Above in Directly Attributable Costs |
| 92 |
| |
Depreciation and amortization |
| 130 |
| |
Total costs not included above |
| $ | 222 |
|
|
|
|
| |
GAAP Operating income (loss) |
| $ | (32 | ) |
|
|
|
| |
Operating income (loss) margin |
| -12.7 | % | |
Q4 2014 Selected Financial Data
Dex Media West, Inc.
Reconciliation of Non-GAAP Measures Directly Attributable Contribution Margin
For the Three and Twelve Months Ended December 31, 2014
($ millions)
Q4 2014 |
|
| Margin |
| Digital |
| Margin |
| Total |
| ||||
Revenue - Amortized |
| $ | 45 |
|
|
| $ | 20 |
|
|
| $ | 65 |
|
Less: Directly Attributable Costs |
| $ | 9 |
|
|
| $ | 8 |
|
|
| $ | 17 |
|
Directly Attributable Contribution Margin |
| $ | 36 |
| 80.0 | % | $ | 12 |
| 60.0 | % | $ | 48 |
|
Reconciliation to GAAP |
|
|
| |
|
|
|
| |
Directly Attributable Contribution Margin |
| $ | 48 |
|
|
|
|
| |
Other Costs Not Included Above in Directly Attributable Costs |
| 30 |
| |
Depreciation and amortization |
| 40 |
| |
Total costs not included above |
| $ | 70 |
|
|
|
|
| |
GAAP Operating income (loss) |
| $ | (22 | ) |
|
|
|
| |
Operating income (loss) margin |
| -33.8 | % | |
YTD December 2014 |
|
| Margin |
| Digital |
| Margin |
| Total |
| ||||
Revenue - Amortized |
| $ | 192 |
|
|
| $ | 85 |
|
|
| $ | 277 |
|
Less: Directly Attributable Costs |
| $ | 34 |
|
|
| $ | 37 |
|
|
| $ | 71 |
|
Directly Attributable Contribution Margin |
| $ | 158 |
| 82.3 | % | $ | 48 |
| 56.5 | % | $ | 206 |
|
Reconciliation to GAAP |
|
|
| |
|
|
|
| |
Directly Attributable Contribution Margin |
| $ | 206 |
|
|
|
|
| |
Other Costs Not Included Above in Directly Attributable Costs |
| 106 |
| |
Depreciation and amortization |
| 160 |
| |
Total costs not included above |
| $ | 266 |
|
|
|
|
| |
GAAP Operating income (loss) |
| $ | (60 | ) |
|
|
|
| |
Operating income (loss) margin |
| -21.7 | % | |
Q4 2014 Selected Financial Data
R.H. Donnelley Inc.
Reconciliation of Non-GAAP Measures Directly Attributable Contribution Margin
For the Three and Twelve Months Ended December 31, 2014
($ millions)
Q4 2014 |
|
| Margin |
| Digital |
| Margin |
| Total |
| ||||
Revenue - Amortized |
| $ | 60 |
|
|
| $ | 32 |
|
|
| $ | 92 |
|
Less: Directly Attributable Costs |
| $ | 11 |
|
|
| $ | 12 |
|
|
| $ | 23 |
|
Directly Attributable Contribution Margin |
| $ | 49 |
| 81.7 | % | $ | 20 |
| 62.5 | % | $ | 69 |
|
Reconciliation to GAAP |
|
|
| |
|
|
|
| |
Directly Attributable Contribution Margin |
| $ | 69 |
|
|
|
|
| |
Other Costs Not Included Above in Directly Attributable Costs |
| 43 |
| |
Depreciation and amortization |
| 29 |
| |
Total costs not included above |
| $ | 72 |
|
|
|
|
| |
GAAP Operating income (loss) |
| $ | (3 | ) |
|
|
|
| |
Operating income (loss) margin |
| -3.3 | % | |
YTD December 2014 |
|
| Margin |
| Digital |
| Margin |
| Total |
| ||||
Revenue - Amortized |
| $ | 259 |
|
|
| $ | 130 |
|
|
| $ | 389 |
|
Less: Directly Attributable Costs |
| $ | 49 |
|
|
| $ | 53 |
|
|
| $ | 102 |
|
Directly Attributable Contribution Margin |
| $ | 211 |
| 81.5 | % | $ | 77 |
| 59.2 | % | $ | 288 |
|
Reconciliation to GAAP |
|
|
| |
|
|
|
| |
Directly Attributable Contribution Margin |
| $ | 288 |
|
|
|
|
| |
Other Costs Not Included Above in Directly Attributable Costs |
| 153 |
| |
Depreciation and amortization |
| 117 |
| |
Total costs not included above |
| $ | 270 |
|
|
|
|
| |
GAAP Operating income (loss) |
| $ | 18 |
|
|
|
|
| |
Operating income (loss) margin |
| 4.6 | % | |
Q1 2015 Selected Financial Data
Dex Media East, Inc. |
|
Reconciliation of Non-GAAP Measures Directly Attributable Contribution Margin |
|
For the Quarter Ended March 31, 2015 |
|
($ millions) |
|
Q1 2015 |
|
| Margin |
| Digital |
| Margin |
| Total |
| ||||
Revenue - Amortized |
| $ | 38 |
|
|
| $ | 19 |
|
|
| $ | 57 |
|
Less: Directly Attributable Costs |
| $ | 7 |
|
|
| $ | 10 |
|
|
| $ | 17 |
|
Directly Attributable Contribution Margin |
| $ | 31 |
| 81.6 | % | $ | 9 |
| 47.4 | % | $ | 40 |
|
Reconciliation to GAAP |
|
|
| |
|
|
|
| |
Directly Attributable Contribution Margin |
| $ | 40 |
|
|
|
|
| |
Other Costs Not Included Above in Directly Attributable Costs |
| 21 |
| |
Depreciation and amortization |
| 22 |
| |
Total costs not included above |
| $ | 43 |
|
|
|
|
| |
GAAP Operating income (loss) |
| $ | (3 | ) |
|
|
|
| |
Operating income (loss) margin |
| -5.3 | % | |
Q1 2015 Selected Financial Data
Dex Media West, Inc. |
|
Reconciliation of Non-GAAP Measures Directly Attributable Contribution Margin |
|
For the Quarter Ended March 31, 2015 |
|
($ millions) |
|
Q1 2015 |
|
| Margin |
| Digital |
| Margin |
| Total |
| ||||
Revenue - Amortized |
| $ | 41 |
|
|
| $ | 20 |
|
|
| $ | 61 |
|
Less: Directly Attributable Costs |
| $ | 7 |
|
|
| $ | 10 |
|
|
| $ | 17 |
|
Directly Attributable Contribution Margin |
| $ | 34 |
| 82.9 | % | $ | 10 |
| 50.0 | % | $ | 44 |
|
Reconciliation to GAAP |
|
|
| |
|
|
|
| |
Directly Attributable Contribution Margin |
| $ | 44 |
|
|
|
|
| |
Other Costs Not Included Above in Directly Attributable Costs |
| 23 |
| |
Depreciation and amortization |
| 28 |
| |
Total costs not included above |
| $ | 51 |
|
|
|
|
| |
GAAP Operating income (loss) |
| $ | (7 | ) |
|
|
|
| |
Operating income (loss) margin |
| -11.5 | % | |
Q1 2015 Selected Financial Data
R.H. Donnelley Inc.
Reconciliation of Non-GAAP Measures Directly Attributable Contribution Margin
For the Quarter Ended March 31, 2015
($ millions)
Q1 2015 |
|
| Margin |
| Digital |
| Margin |
| Total |
| ||||
Revenue - Amortized |
| $ | 55 |
|
|
| $ | 31 |
|
|
| $ | 86 |
|
Less: Directly Attributable Costs |
| $ | 9 |
|
|
| $ | 14 |
|
|
| $ | 23 |
|
Directly Attributable Contribution Margin |
| $ | 46 |
| 83.6 | % | $ | 17 |
| 54.8 | % | $ | 63 |
|
Reconciliation to GAAP |
|
|
| |
|
|
|
| |
Directly Attributable Contribution Margin |
| $ | 63 |
|
|
|
|
| |
Other Costs Not Included Above in Directly Attributable Costs |
| 30 |
| |
Depreciation and amortization |
| 20 |
| |
Total costs not included above |
| $ | 50 |
|
|
|
|
| |
GAAP Operating income (loss) |
| $ | 13 |
|
|
|
|
| |
Operating income (loss) margin |
| 15.1 | % | |
Q1 2015 Selected Financial Data
SuperMedia, Inc.
Reconciliation of Non-GAAP Measures Directly Attributable Contribution Margin
For the Quarter Ended March 31, 2015
($ millions)
Q1 2015 |
|
| Margin |
| Digital |
| Margin |
| Total |
| ||||
Revenue - Amortized |
| $ | 139 |
|
|
| $ | 62 |
|
|
| $ | 201 |
|
Less: Directly Attributable Costs |
| $ | 26 |
|
|
| $ | 34 |
|
|
| $ | 60 |
|
Directly Attributable Contribution Margin |
| $ | 113 |
| 81.2 | % | $ | 28 |
| 45.2 | % | $ | 141 |
|
Reconciliation to GAAP |
|
|
| |
Revenue per Contribution Margin |
| $ | 201 |
|
Revenue not included in above |
| 1 |
| |
GAAP Revenue |
| $ | 202 |
|
|
|
|
| |
Directly Attributable Contribution Margin |
| $ | 142 |
|
|
|
|
| |
Other Costs Not Included Above in Directly Attributable Costs |
| 78 |
| |
Depreciation and amortization |
| 36 |
| |
Total costs not included above |
| $ | 114 |
|
|
|
|
| |
GAAP Operating income (loss) |
| $ | 28 |
|
|
|
|
| |
Operating income (loss) margin |
| 13.9 | % | |
Q2 2015 Selected Financial Data
Dex Media East, Inc.
Reconciliation of Non-GAAP Measures Directly Attributable Contribution Margin
For the Three and Six Months Ended June 30, 2015
($ millions)
Q2 2015 |
|
| Margin |
| Digital |
| Margin |
| Total |
| ||||
Revenue - Amortized |
| $ | 36 |
|
|
| $ | 18 |
|
|
| $ | 54 |
|
Less: Directly Attributable Costs |
| $ | 6 |
|
|
| $ | 9 |
|
|
| $ | 15 |
|
Directly Attributable Contribution Margin |
| $ | 30 |
| 83.3 | % | $ | 9 |
| 50.0 | % | $ | 39 |
|
Reconciliation to GAAP |
|
|
| |
|
|
|
| |
Directly Attributable Contribution Margin |
| $ | 39 |
|
|
|
|
| |
Other Costs Not Included Above in Directly Attributable Costs |
| 19 |
| |
Depreciation and amortization |
| 22 |
| |
Total costs not included above |
| $ | 41 |
|
|
|
|
| |
GAAP Operating income (loss) |
| $ | (2 | ) |
|
|
|
| |
Operating income (loss) margin |
| -3.7 | % | |
YTD June 2015 |
|
| Margin |
| Digital |
| Margin |
| Total |
| ||||
Revenue - Amortized |
| $ | 74 |
|
|
| $ | 37 |
|
|
| $ | 111 |
|
Less: Directly Attributable Costs |
| $ | 13 |
|
|
| $ | 19 |
|
|
| $ | 32 |
|
Directly Attributable Contribution Margin |
| $ | 61 |
| 82.4 | % | $ | 18 |
| 48.6 | % | $ | 79 |
|
Reconciliation to GAAP |
|
|
| |
|
|
|
| |
Directly Attributable Contribution Margin |
| $ | 79 |
|
|
|
|
| |
Other Costs Not Included Above in Directly Attributable Costs |
| 40 |
| |
Depreciation and amortization |
| 44 |
| |
Total costs not included above |
| $ | 84 |
|
|
|
|
| |
GAAP Operating income (loss) |
| $ | (5 | ) |
|
|
|
| |
Operating income (loss) margin |
| -4.5 | % | |
Q2 2015 Selected Financial Data
Dex Media West, Inc.
Reconciliation of Non-GAAP Measures Directly Attributable Contribution Margin
For the Three and Six Months Ended June 30, 2015
($ millions)
Q2 2015 |
|
| Margin |
| Digital |
| Margin |
| Total |
| ||||
Revenue - Amortized |
| $ | 39 |
|
|
| $ | 20 |
|
|
| $ | 59 |
|
Less: Directly Attributable Costs |
| $ | 7 |
|
|
| $ | 9 |
|
|
| $ | 16 |
|
Directly Attributable Contribution Margin |
| $ | 32 |
| 82.1 | % | $ | 11 |
| 55.0 | % | $ | 43 |
|
Reconciliation to GAAP |
|
|
| |
|
|
|
| |
Directly Attributable Contribution Margin |
| $ | 43 |
|
|
|
|
| |
Other Costs Not Included Above in Directly Attributable Costs |
| 21 |
| |
Depreciation and amortization |
| 25 |
| |
Total costs not included above |
| $ | 46 |
|
|
|
|
| |
GAAP Operating income (loss) |
| $ | (3 | ) |
|
|
|
| |
Operating income (loss) margin |
| -5.1 | % | |
YTD June 2015 |
|
| Margin |
| Digital |
| Margin |
| Total |
| ||||
Revenue - Amortized |
| $ | 80 |
|
|
| $ | 40 |
|
|
| $ | 120 |
|
Less: Directly Attributable Costs |
| $ | 14 |
|
|
| $ | 19 |
|
|
| $ | 33 |
|
Directly Attributable Contribution Margin |
| $ | 66 |
| 82.5 | % | $ | 21 |
| 52.5 | % | $ | 87 |
|
Reconciliation to GAAP |
|
|
| |
|
|
|
| |
Directly Attributable Contribution Margin |
| $ | 87 |
|
|
|
|
| |
Other Costs Not Included Above in Directly Attributable Costs |
| 44 |
| |
Depreciation and amortization |
| 53 |
| |
Total costs not included above |
| $ | 97 |
|
|
|
|
| |
GAAP Operating income (loss) |
| $ | (10 | ) |
|
|
|
| |
Operating income (loss) margin |
| -8.3 | % | |
Q2 2015 Selected Financial Data
R.H. Donnelley Inc.
Reconciliation of Non-GAAP Measures Directly Attributable Contribution Margin
For the Three and Six Months Ended June 30, 2015
($ millions)
Q2 2015 |
|
| Margin |
| Digital |
| Margin |
| Total |
| ||||
Revenue - Amortized |
| $ | 52 |
|
|
| $ | 32 |
|
|
| $ | 84 |
|
Less: Directly Attributable Costs |
| $ | 8 |
|
|
| $ | 14 |
|
|
| $ | 22 |
|
Directly Attributable Contribution Margin |
| $ | 44 |
| 84.6 | % | $ | 18 |
| 56.3 | % | $ | 62 |
|
Reconciliation to GAAP |
|
|
| |
|
|
|
| |
Directly Attributable Contribution Margin |
| $ | 62 |
|
|
|
|
| |
Other Costs Not Included Above in Directly Attributable Costs |
| 29 |
| |
Depreciation and amortization |
| 19 |
| |
Total costs not included above |
| $ | 48 |
|
|
|
|
| |
GAAP Operating income (loss) |
| $ | 14 |
|
|
|
|
| |
Operating income (loss) margin |
| 16.7 | % | |
YTD June 2015 |
|
| Margin |
| Digital |
| Margin |
| Total |
| ||||
Revenue - Amortized |
| $ | 108 |
|
|
| $ | 62 |
|
|
| $ | 170 |
|
Less: Directly Attributable Costs |
| $ | 18 |
|
|
| $ | 27 |
|
|
| $ | 45 |
|
Directly Attributable Contribution Margin |
| $ | 90 |
| 83.3 | % | $ | 35 |
| 56.5 | % | $ | 125 |
|
Reconciliation to GAAP |
|
|
| |
|
|
|
| |
Directly Attributable Contribution Margin |
| $ | 125 |
|
|
|
|
| |
Other Costs Not Included Above in Directly Attributable Costs |
| 59 |
| |
Depreciation and amortization |
| 39 |
| |
Total costs not included above |
| $ | 98 |
|
|
|
|
| |
GAAP Operating income (loss) |
| $ | 27 |
|
|
|
|
| |
Operating income (loss) margin |
| 15.9 | % | |
R.H. Donnelley Inc.
Reconciliation of Non-GAAP Measures for
Financial Covenant Calculations
December 31, 2014
($ Millions)
|
| 1Q14 |
| 2Q14 |
| 3Q14 |
| 4Q14 |
| Total |
| |||||
Consolidated EBITDA from Financial Covenant Calculations |
| $ | 35.6 |
| $ | 37.9 |
| $ | 36.0 |
| $ | 34.7 |
| $ | 144.3 |
|
Reconciliation to GAAP Operating Income |
|
|
|
|
|
|
|
|
|
|
| |||||
Subtract Depreciation and Amortization |
| (29.4 | ) | (29.2 | ) | (29.1 | ) | (29.0 | ) | (116.7 | ) | |||||
Subtract Extraordinary charges or non-cash charges |
| (0.1 | ) | (0.1 | ) | (0.1 | ) | (8.4 | ) | (8.8 | ) | |||||
Operating Income GAAP |
| $ | 6.1 |
| $ | 8.5 |
| $ | 6.7 |
| $ | (2.6 | ) | $ | 18.7 |
|
R.H. Donnelley Inc.
Reconciliation of Non-GAAP Measures for
Financial Covenant Calculations
March 31, 2015
($ Millions)
|
| 2Q14 |
| 3Q14 |
| 4Q14 |
| 1Q15 |
| Total |
| |||||
Consolidated EBITDA from Financial Covenant Calculations |
| $ | 37.9 |
| $ | 36.0 |
| $ | 34.7 |
| $ | 30.7 |
| $ | 139.3 |
|
Reconciliation to GAAP Operating Income |
|
|
|
|
|
|
|
|
|
|
| |||||
Subtract Depreciation and Amortization |
| (29.2 | ) | (29.1 | ) | (29.0 | ) | (20.1 | ) | (107.4 | ) | |||||
Subtract Customer Late Fees in Interest |
| — |
| — |
| — |
| (0.3 | ) | (0.3 | ) | |||||
Subtract Extraordinary charges or non-cash charges |
| (0.1 | ) | (0.1 | ) | (8.4 | ) | 3.2 |
| (5.5 | ) | |||||
Operating Income GAAP |
| $ | 8.5 |
| $ | 6.7 |
| $ | (2.6 | ) | $ | 13.4 |
| $ | 26.1 |
|