FOIA Confidential Treatment Requested by Thryv Holdings, Inc. Pursuant to 17 CFR 200.83
Total revenues decreased by $363.0 million, or 20.3%, for the year ended December 31, 2019 compared to the year ended December 31, 2018. The decrease in total revenues was driven by a decrease in Marketing Services of $367.6 million, partially offset by an increase in SaaS revenue of $4.5 million.
Marketing Services Revenue
Marketing Services revenue decreased by $367.6 million, or 22.1%, for the year ended December 31, 2019 compared to the year ended December 31, 2018.
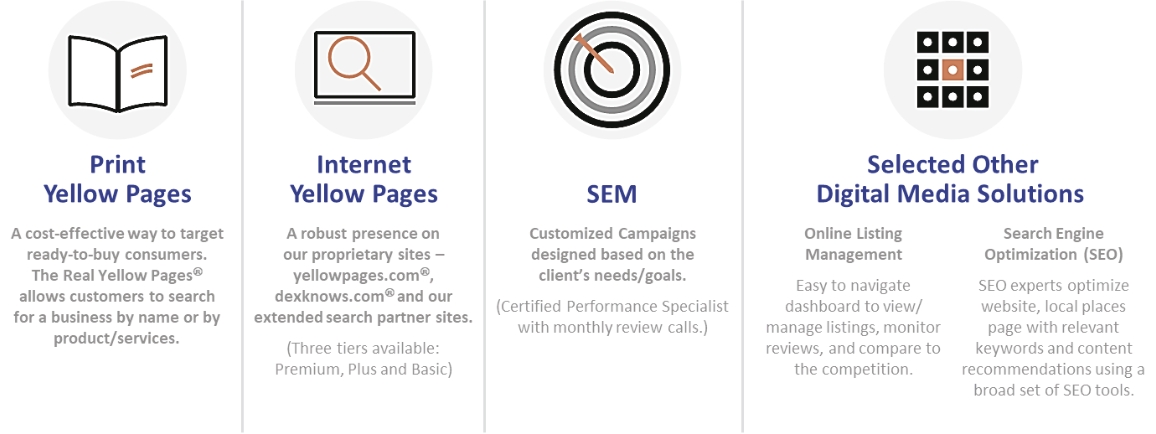
Print revenue decreased by $194.4 million, or 24.3%, for the year ended December 31, 2019 compared to the year ended December 31, 2018. The decrease is due to the decline in the overall industry demand for print services.
Digital services revenue decreased by $173.1 million, or 20.1%, for the year ended December 31, 2019 compared to the year ended December 31, 2018. IYP and SEM revenues declined by $136.2 million, or 19.2%, driven by a decline in the Company’s client base due to significant competition in the consumer search and display space, particularly from large, well-capitalized businesses such as Google, Yelp and Facebook. Other digital media solutions revenue decreased by $37.0 million, or 24.2%, as we shifted from selling these services on a standalone basis to only offering them as add-ons to our Thryv platform for new clients.
SaaS Revenue
SaaS revenue increased by $4.5 million, or 3.6%, for the year ended December 31, 2019 compared to the year ended December 31, 2018. The increase in SaaS revenue was largely driven by the April 2018 launch of Thryv Leads.
Cost of Services (Exclusive of Depreciation and Amortization)
Cost of services (exclusive of depreciation and amortization) decreased by $170.9 million, or 26.4%, for the year ended December 31, 2019 compared to the year ended December 31, 2018. The decrease in Cost of services was primarily driven by declining revenue and strategic cost savings initiatives. Cost of services (exclusive of depreciation and amortization) as a percentage of revenue decreased to 33.5% for the year ended December 31, 2019 from 36.3% for the year ended December 31, 2018. This decline largely resulted from the Company’s continued efforts to reduce costs in order to maintain profitability and the completion of the YP restructuring and integration efforts in 2019. Specifically, we reduced printing, distribution and digital and fulfillment support costs by $117.0 million. Additionally, we reduced employee related costs by $22.2 million.
Operating Expenses
Sales and Marketing
Sales and marketing expense decreased by $116.5 million, or 24.8%, for the year ended December 31, 2019 compared to the year ended December 31, 2018. The decrease in Sales and marketing expense was primarily due to declining revenues and strategic cost savings initiatives. Sales and marketing expense as a percentage of revenue decreased to 24.8% for the year ended December 31, 2019 from 26.3% for the year ended December 31, 2018. Specifically, the decline in sales and marketing expense was due to lower employee related costs of $53.5 million, lower advertising, sales promotion and other brand management costs of $31.5 million, and lower sales commissions of $21.0 million.
General and Administrative
General and administrative expense decreased by $58.6 million, or 24.6%, for the year ended December 31, 2019 compared to the year ended December 31, 2018.
Restructuring and other integration costs of $46.0 million for the year ended December 31, 2019 decreased by $41.3 million, or 47.3%, as compared to $87.3 million for the year ended December 31, 2018. In the year ended December 31, 2019, the Company continued its efforts to eliminate redundancies in the workforce, information technology, and facilities as part of its YP restructuring and integration efforts. As of December 31,