Free signup for more
- Track your favorite companies
- Receive email alerts for new filings
- Personalized dashboard of news and more
- Access all data and search results
Filing tables
Filing exhibits
THRY similar filings
- 9 Jun 22 Submission of Matters to a Vote of Security Holders
- 4 May 22 Thryv Grows SaaS Revenue 29% Year-Over-Year for First Quarter 2022
- 14 Apr 22 Changes in Registrant's Certifying Accountant
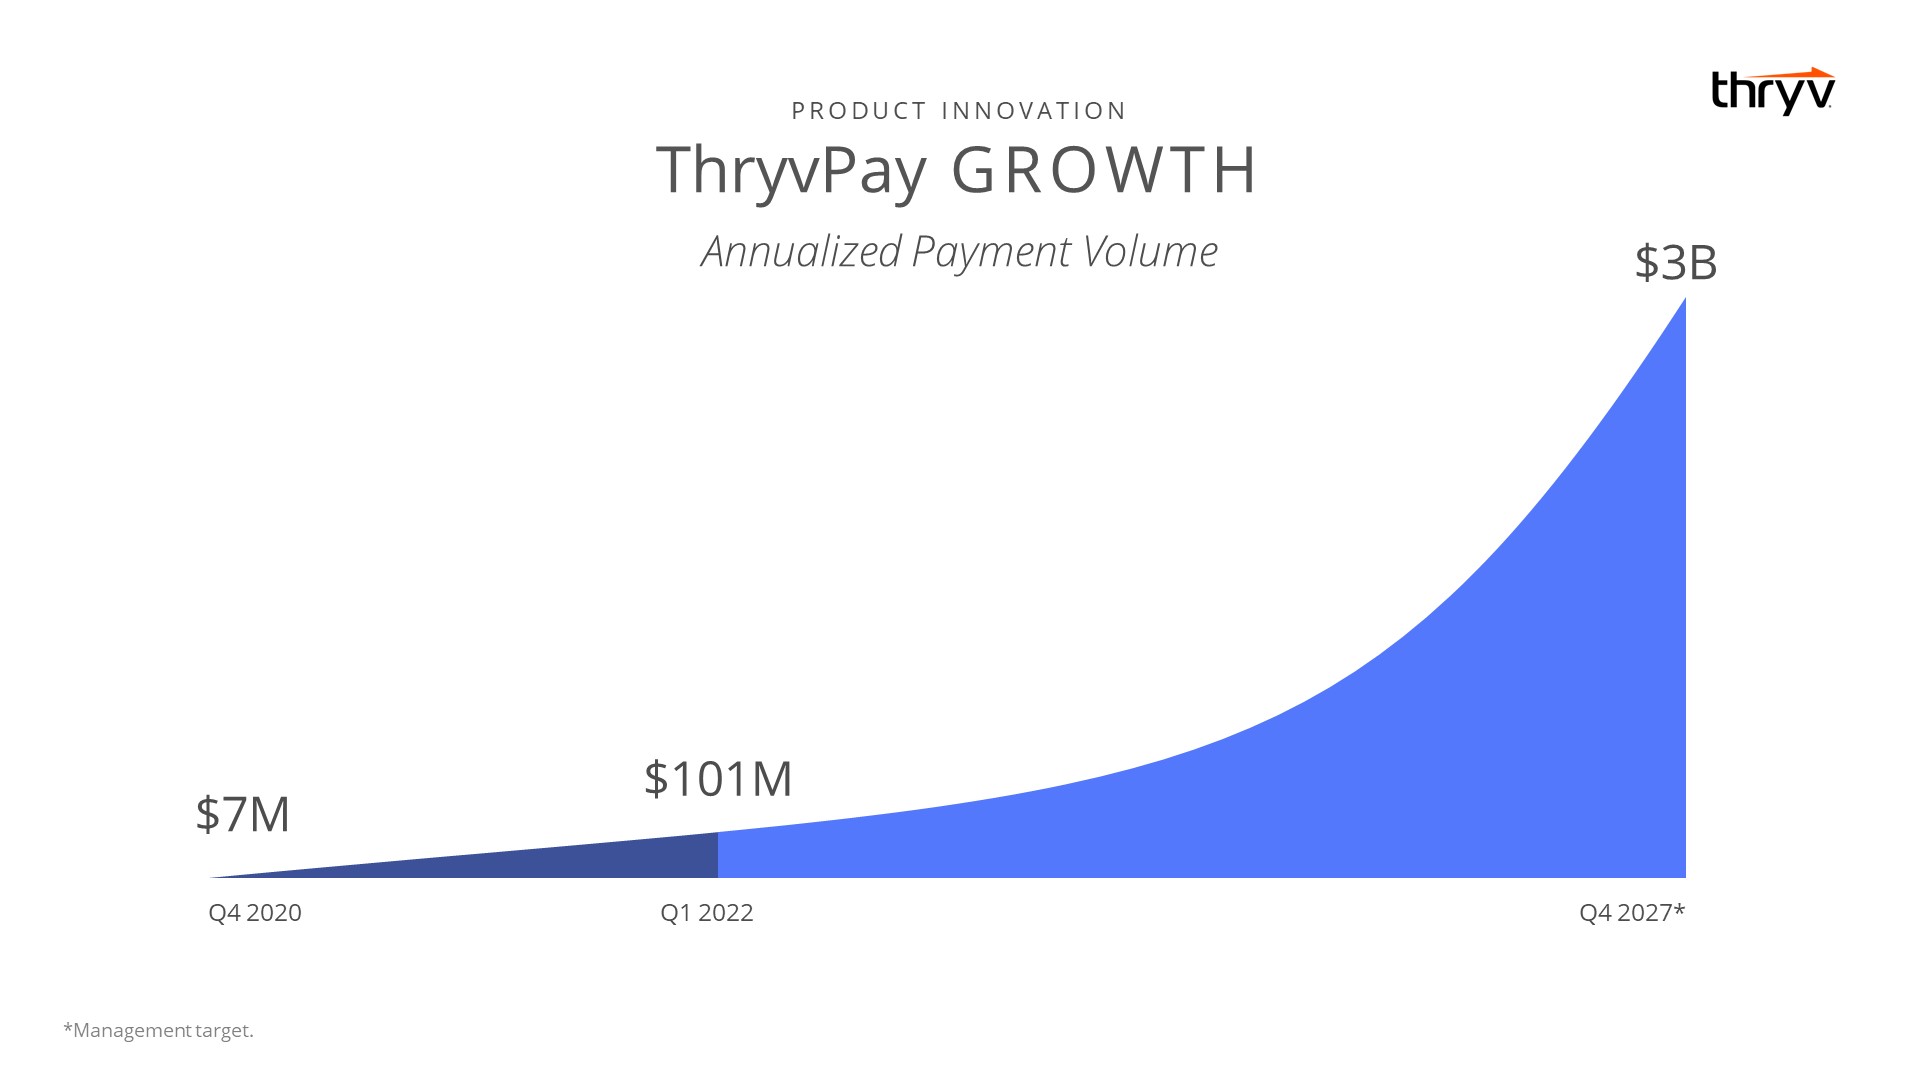
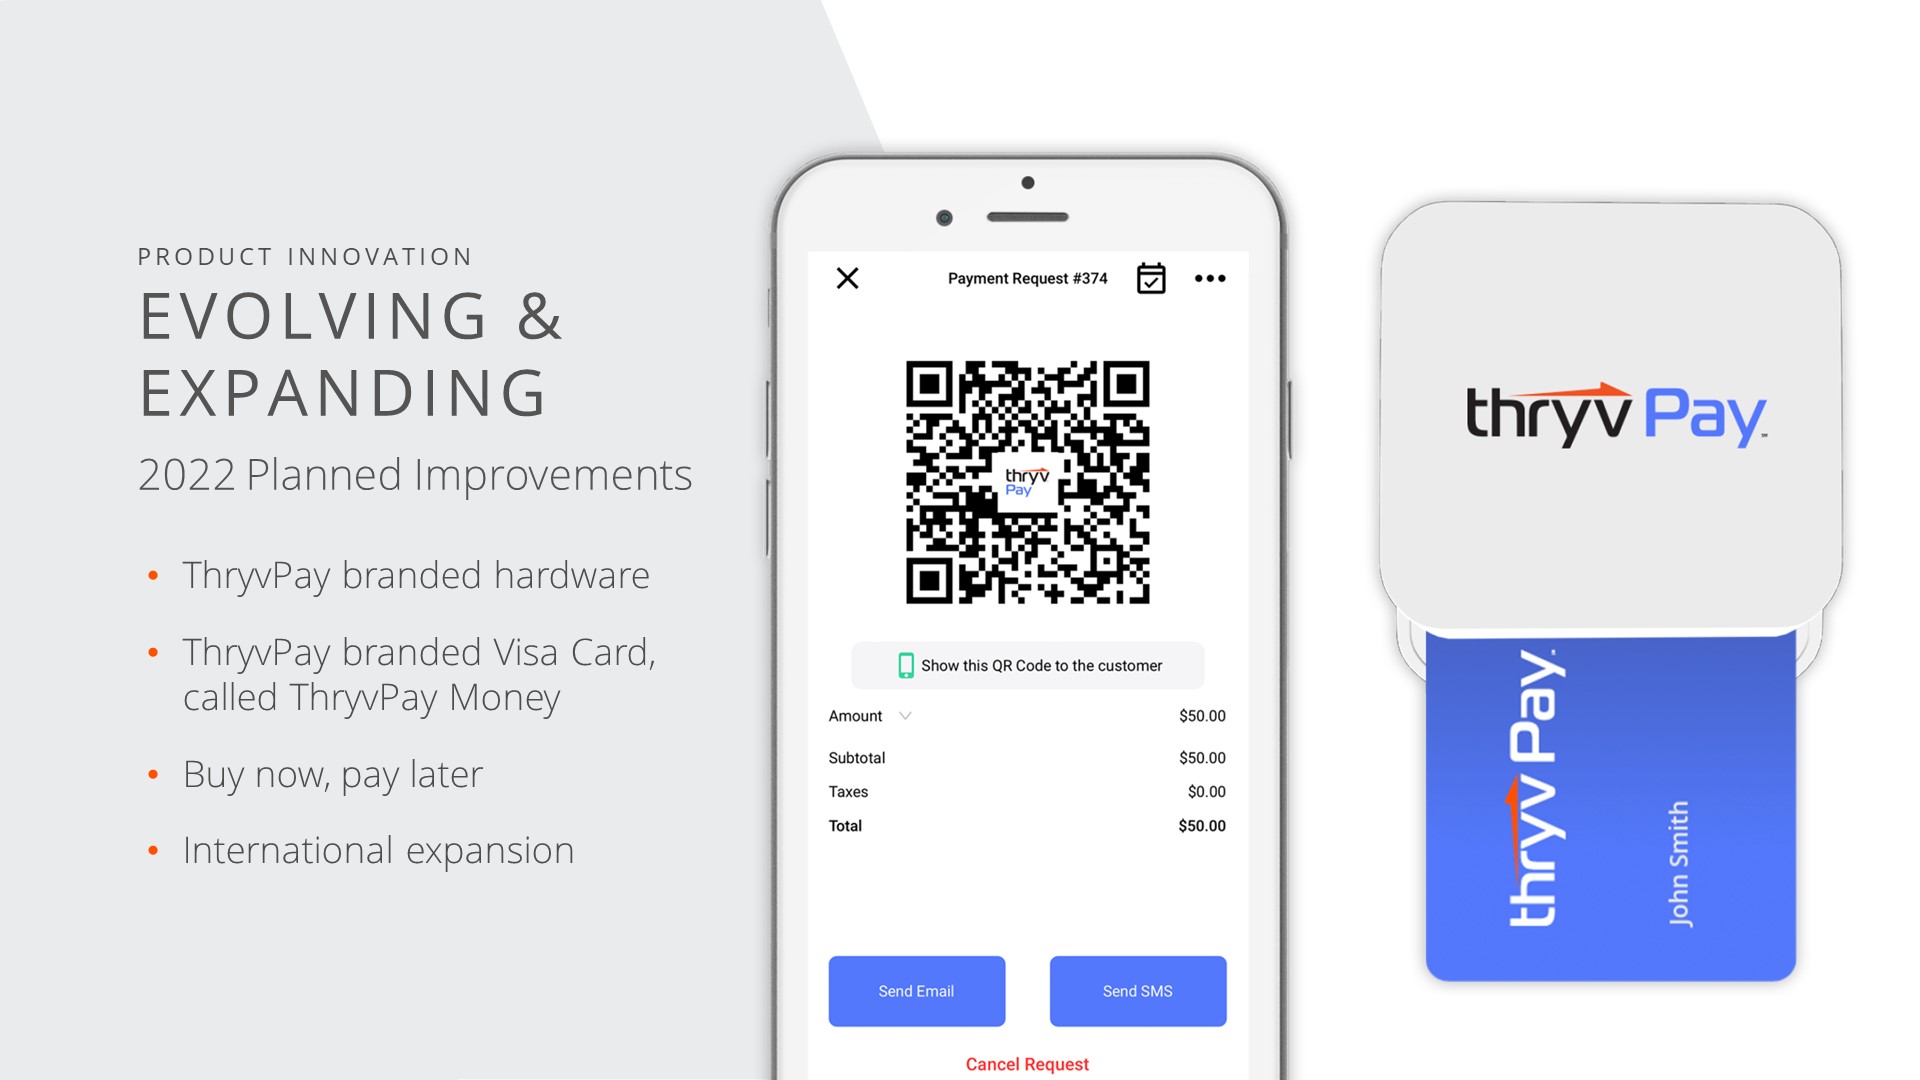
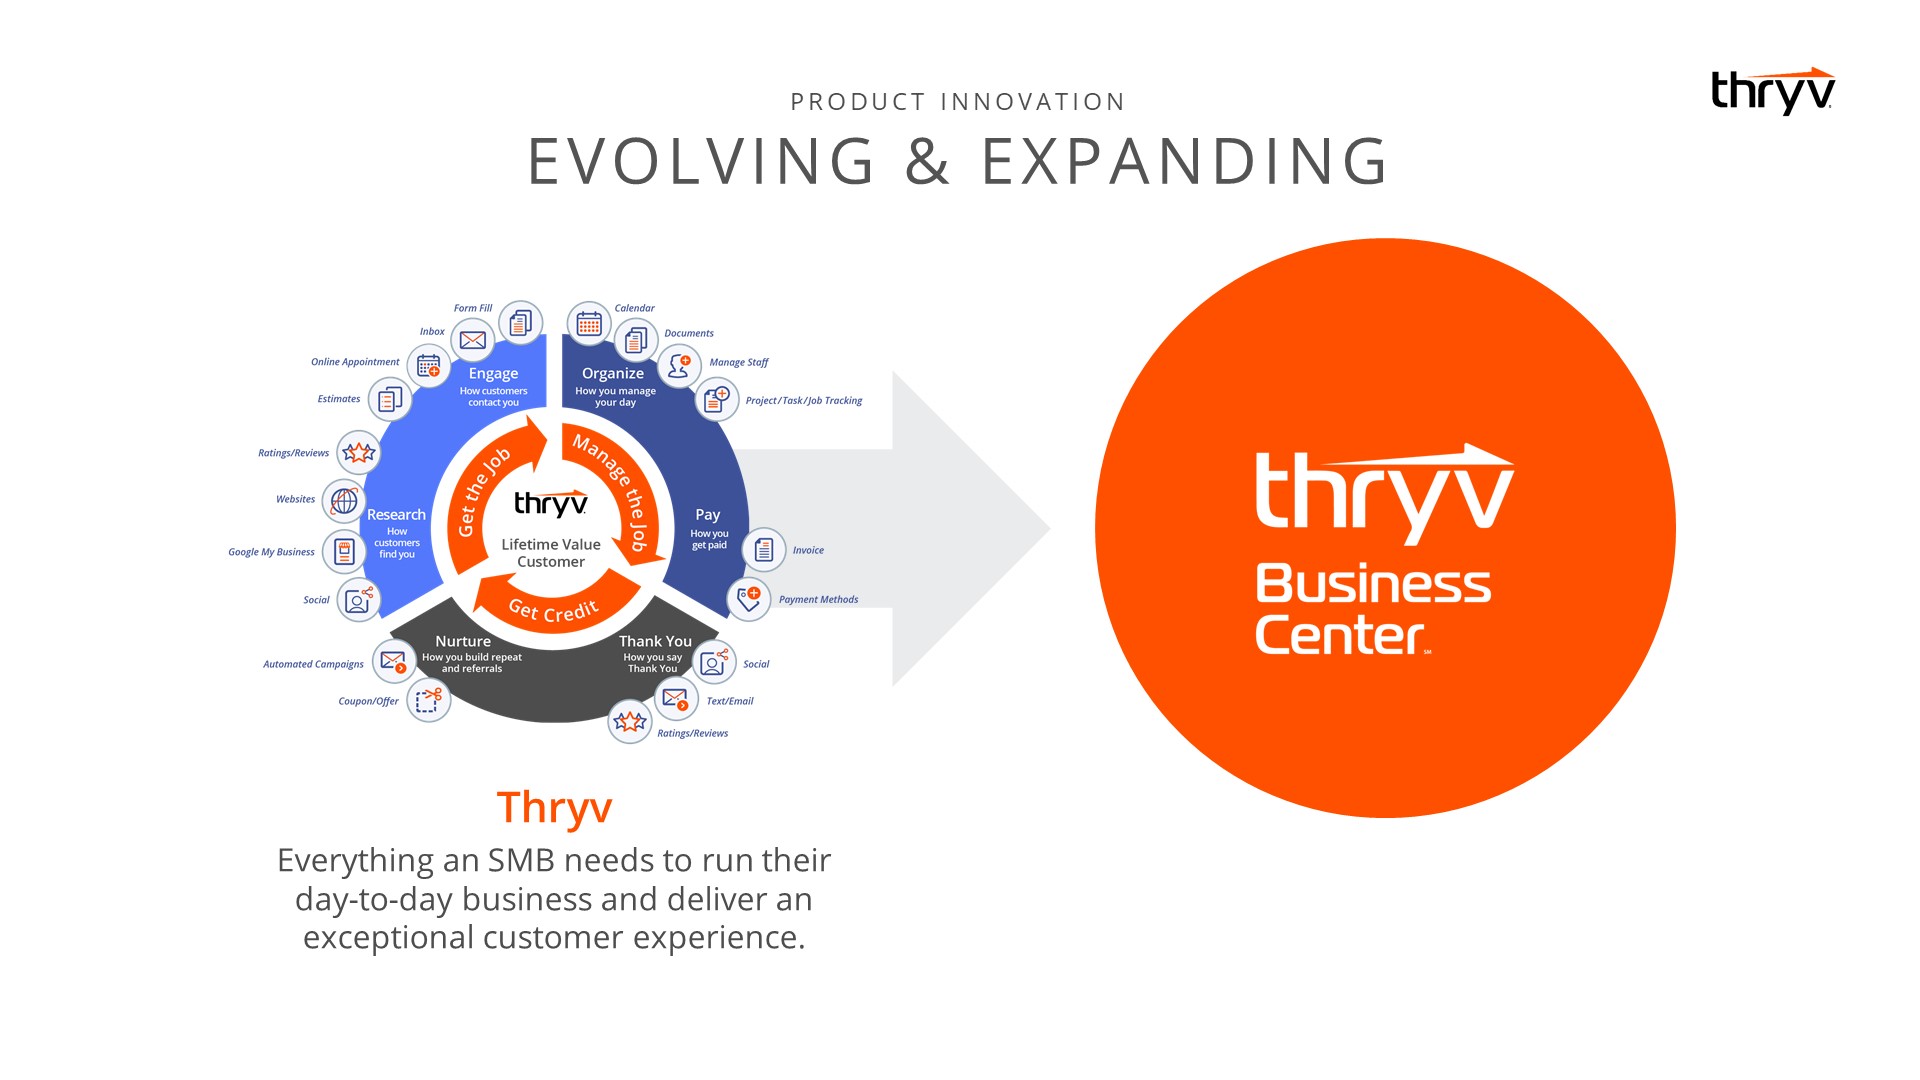
- 5 Apr 22 Thryv Hosts Investor Day, Announces SaaS Revenue Target
- 10 Mar 22 Thryv Reports Strong Fourth Quarter and Fiscal Year 2021 Results, Exceeding All Guidance Targets
- 6 Dec 21 Thryv CEO Joe Walsh Appointed Company’s New Chairman of the Board
- 12 Nov 21 Thryv Grows SaaS Revenue 41% Year-Over-Year for Third Quarter 2021
Filing view
External links