
Exhibit 99.2 1st QUARTER 2023 INVESTOR PRESENTATION
2

3
4

5
6

7
8
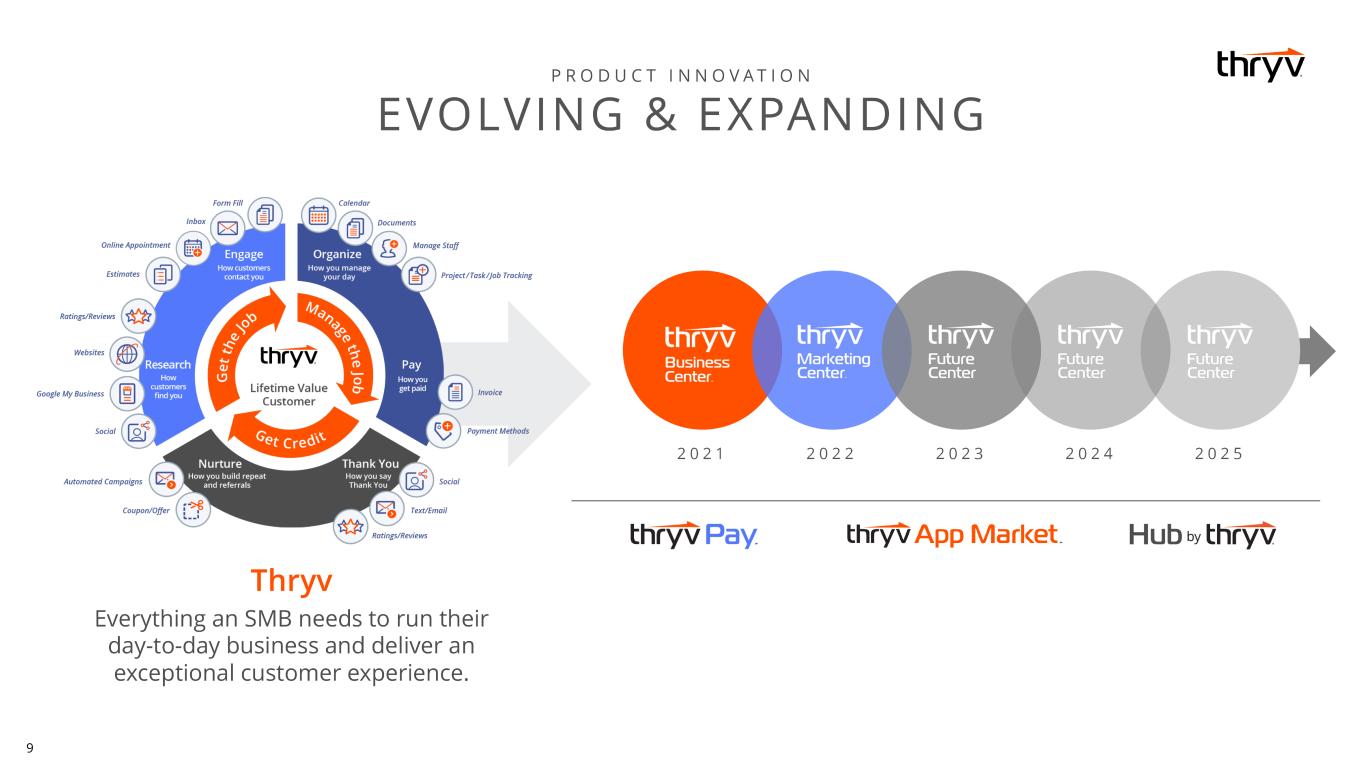
9
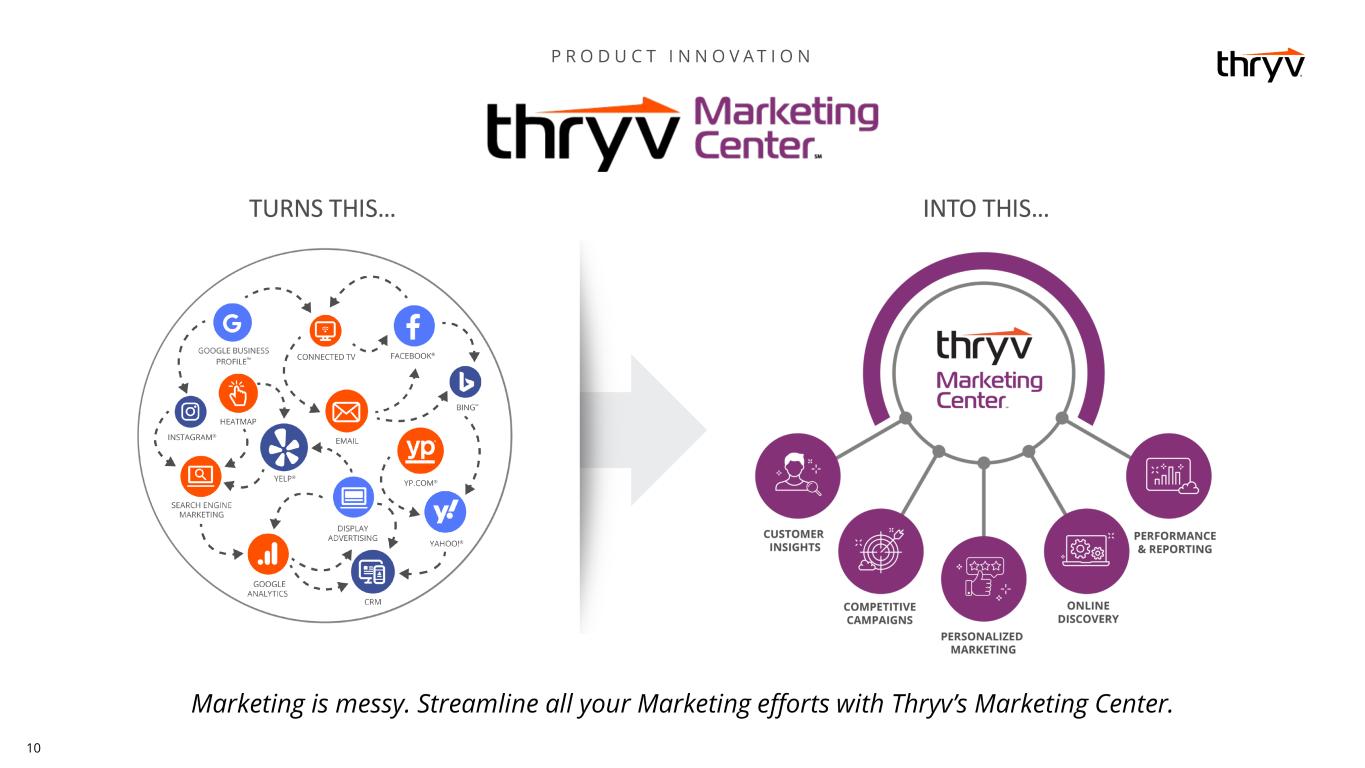
10

11

12

13

14
15 Q1 2023
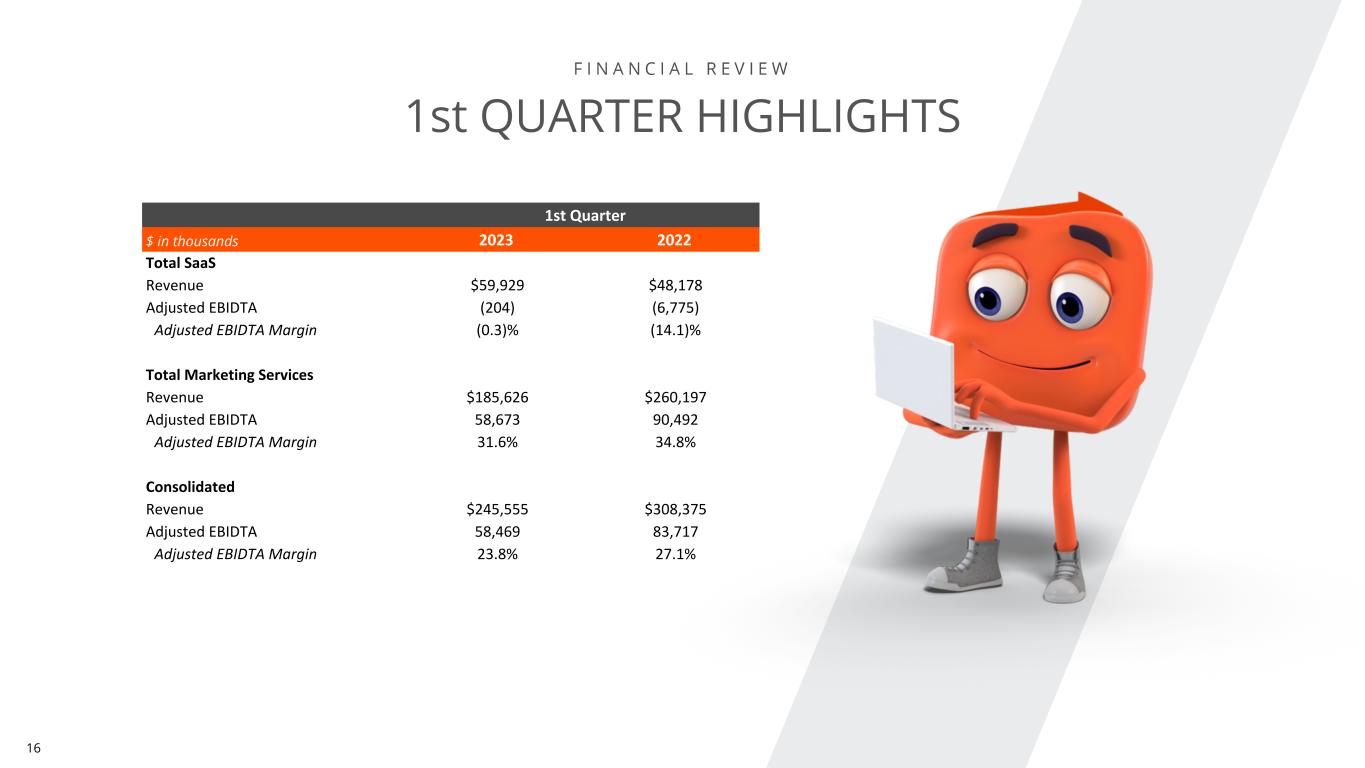
16 1st QUARTER HIGHLIGHTS 1st Quarter $ in thousands 2023 2022 Total SaaS Revenue $59,929 $48,178 Adjusted EBIDTA (204) (6,775) Adjusted EBIDTA Margin (0.3)% (14.1)% Total Marketing Services Revenue $185,626 $260,197 Adjusted EBIDTA 58,673 90,492 Adjusted EBIDTA Margin 31.6% 34.8% Consolidated Revenue $245,555 $308,375 Adjusted EBIDTA 58,469 83,717 Adjusted EBIDTA Margin 23.8% 27.1%
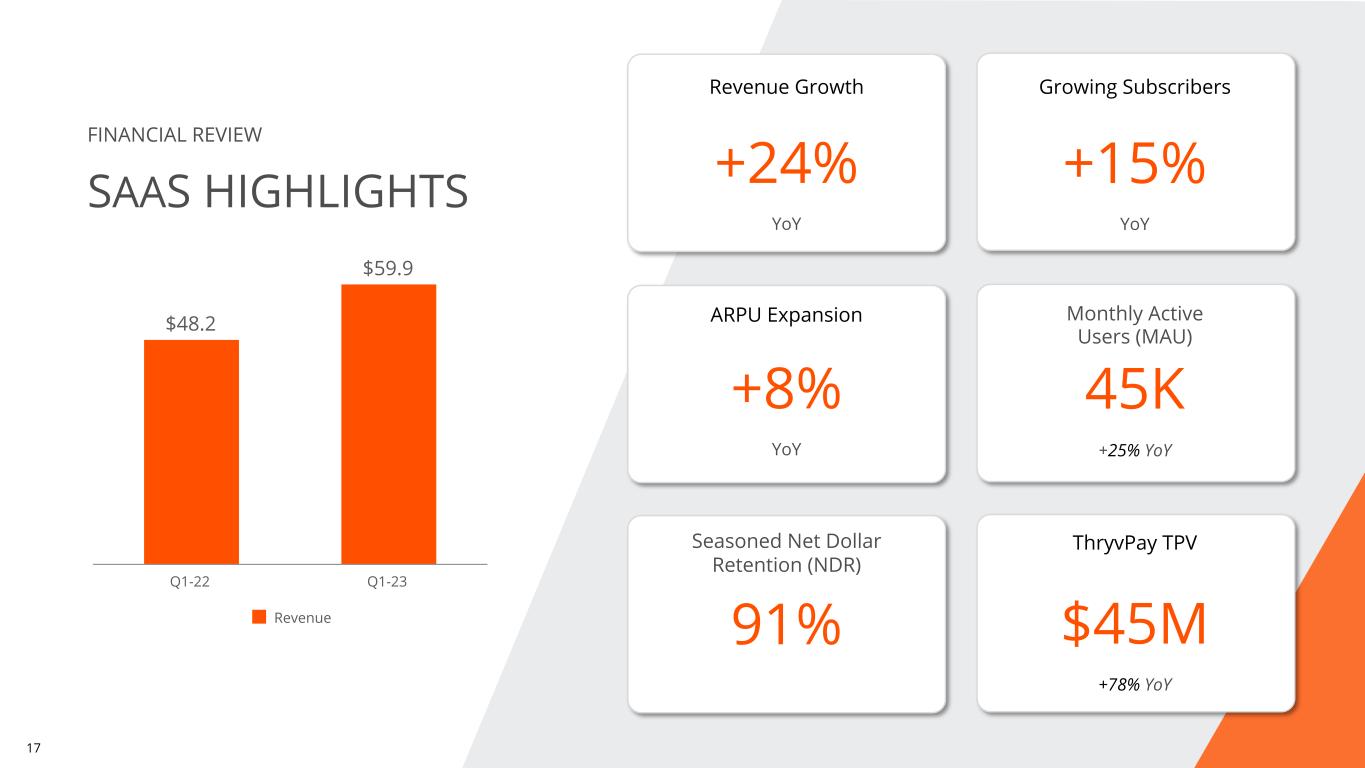
17 FINANCIAL REVIEW SAAS HIGHLIGHTS $48.2 $59.9 Revenue Q1-22 Q1-23 +24% YoY +15% YoY +8% YoY $45M +78% YoY Revenue Growth Growing Subscribers ARPU Expansion ThryvPay TPVSeasoned Net Dollar Retention (NDR) 45K 91% Monthly Active Users (MAU) +25% YoY
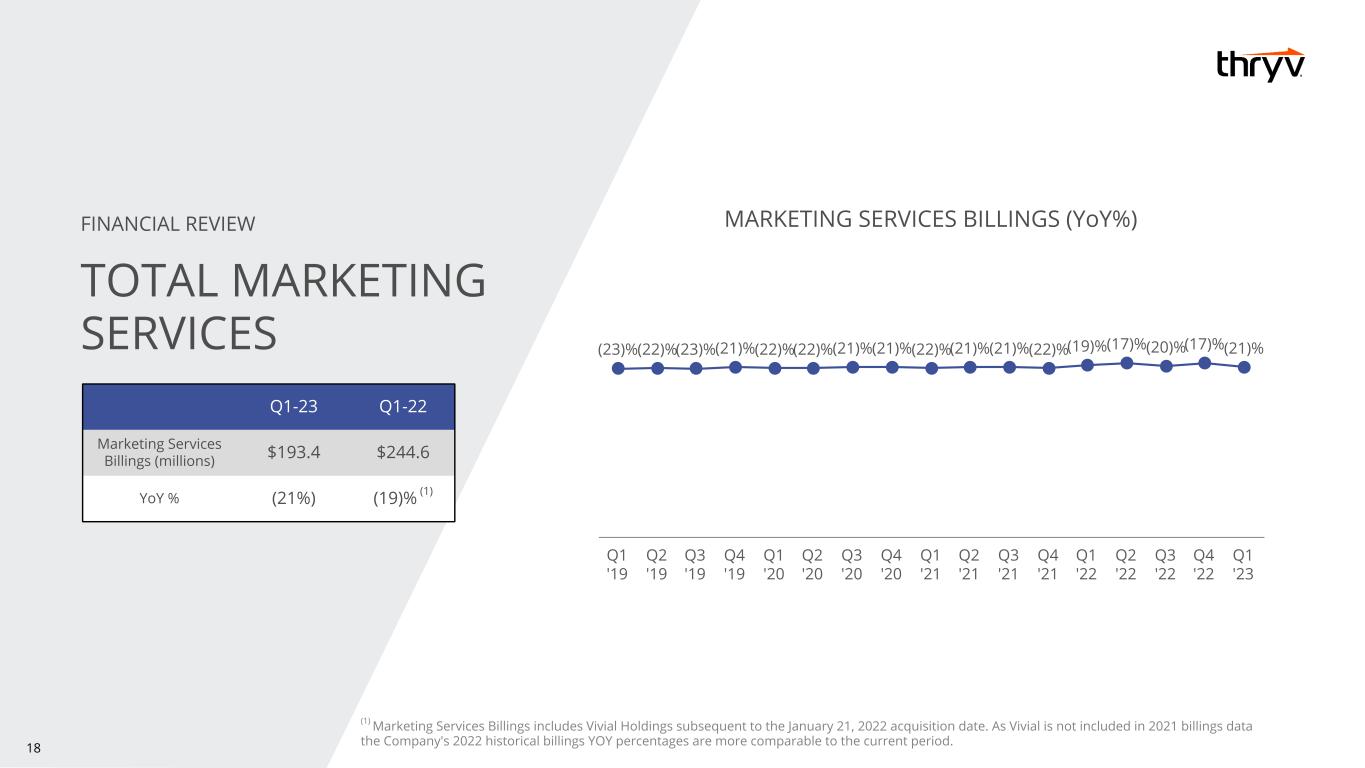
18 (1) Marketing Services Billings includes Vivial Holdings subsequent to the January 21, 2022 acquisition date. As Vivial is not included in 2021 billings data the Company's 2022 historical billings YOY percentages are more comparable to the current period. Q1-23 Q1-22 Marketing Services Billings (millions) $193.4 $244.6 YoY % (21%) (19)% (1) FINANCIAL REVIEW TOTAL MARKETING SERVICES MARKETING SERVICES BILLINGS (YoY%) (23)%(22)%(23)%(21)%(22)%(22)%(21)%(21)%(22)%(21)%(21)%(22)%(19)%(17)%(20)%(17)%(21)% Q1 '19 Q2 '19 Q3 '19 Q4 '19 Q1 '20 Q2 '20 Q3 '20 Q4 '20 Q1 '21 Q2 '21 Q3 '21 Q4 '21 Q1 '22 Q2 '22 Q3 '22 Q4 '22 Q1 '23
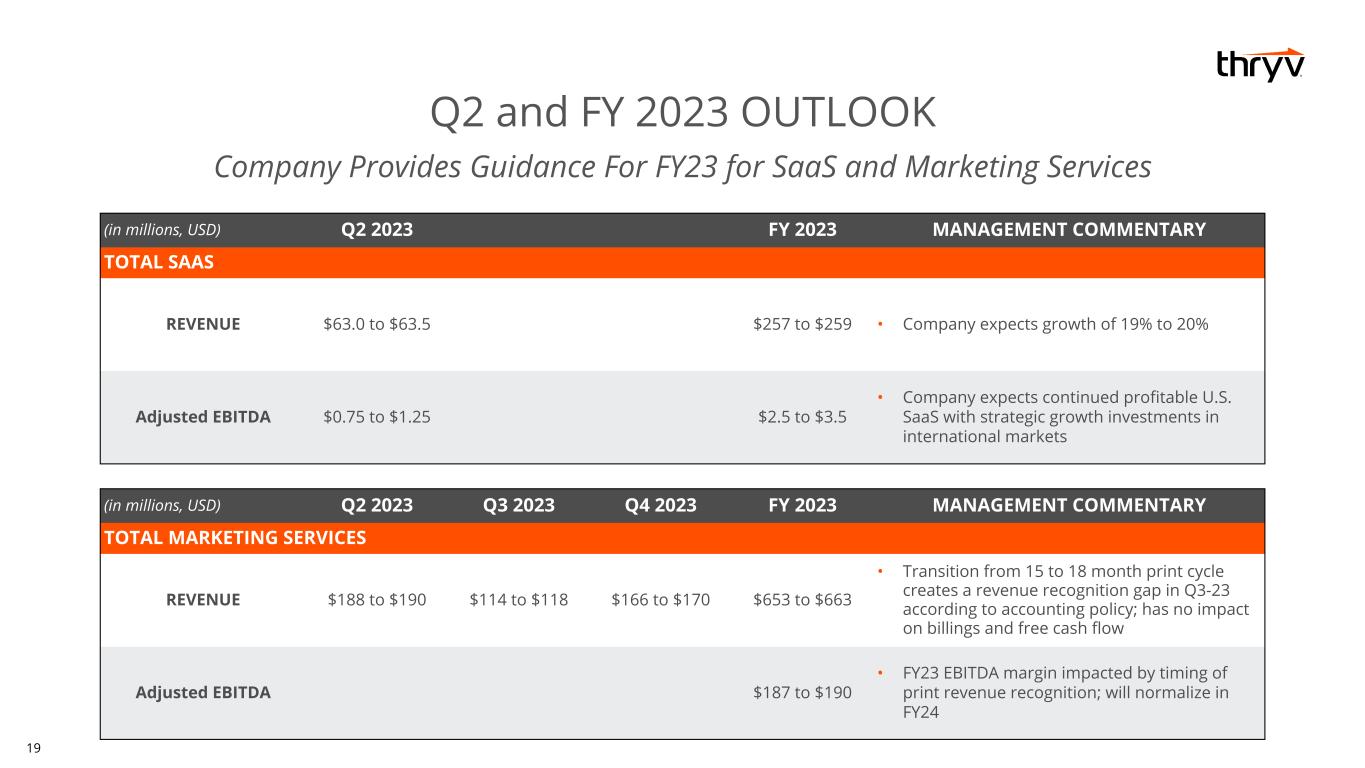
19 Q2 and FY 2023 OUTLOOK Company Provides Guidance For FY23 for SaaS and Marketing Services (in millions, USD) Q2 2023 Q3 2023 Q4 2023 FY 2023 MANAGEMENT COMMENTARY TOTAL MARKETING SERVICES REVENUE $188 to $190 $114 to $118 $166 to $170 $653 to $663 • Transition from 15 to 18 month print cycle creates a revenue recognition gap in Q3-23 according to accounting policy; has no impact on billings and free cash flow Adjusted EBITDA $187 to $190 • FY23 EBITDA margin impacted by timing of print revenue recognition; will normalize in FY24 (in millions, USD) Q2 2023 FY 2023 MANAGEMENT COMMENTARY TOTAL SAAS REVENUE $63.0 to $63.5 $257 to $259 • Company expects growth of 19% to 20% Adjusted EBITDA $0.75 to $1.25 $2.5 to $3.5 • Company expects continued profitable U.S. SaaS with strategic growth investments in international markets

20
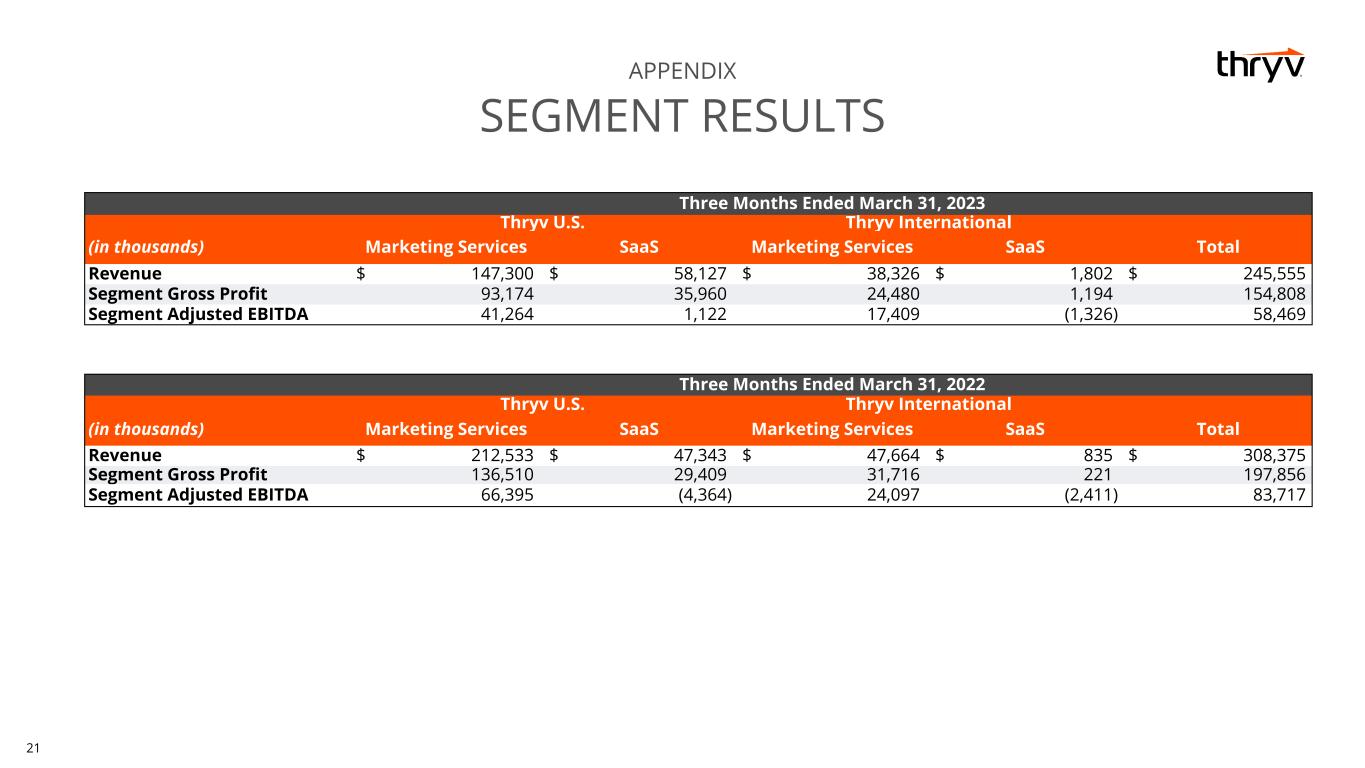
21 APPENDIX SEGMENT RESULTS Three Months Ended March 31, 2022 Thryv U.S. Thryv International (in thousands) Marketing Services SaaS Marketing Services SaaS Total Revenue $ 212,533 $ 47,343 $ 47,664 $ 835 $ 308,375 Segment Gross Profit 136,510 29,409 31,716 221 197,856 Segment Adjusted EBITDA 66,395 (4,364) 24,097 (2,411) 83,717 Three Months Ended March 31, 2023 Thryv U.S. Thryv International (in thousands) Marketing Services SaaS Marketing Services SaaS Total Revenue $ 147,300 $ 58,127 $ 38,326 $ 1,802 $ 245,555 Segment Gross Profit 93,174 35,960 24,480 1,194 154,808 Segment Adjusted EBITDA 41,264 1,122 17,409 (1,326) 58,469

22 $ IN THOUSANDS Q1-22 Q2-22 Q3-22 Q4-22 FY22 Q1-23 Net Income (Loss) $ 33,511 $ 58,002 $ 13,280 $ (50,445) $ 54,348 $ 9,314 Income tax expense 9,621 22,200 6,241 6,565 44,627 4,496 Interest expense 14,867 14,652 14,570 16,318 60,407 16,488 Depreciation and amortization expense 21,969 20,592 23,393 22,438 88,392 15,431 Restructuring and integration expenses 5,827 4,822 3,790 3,365 17,804 5,340 Transaction costs 1,720 1,616 1,461 1,322 6,119 373 Stock-based compensation expense 1,928 3,810 4,402 4,488 14,628 5,393 Other components of net periodic pension (benefit) cost (70) (9,153) 3,928 (39,317) (44,612) 121 Gain on remeasurement of indemnification asset (400) (487) (585) (676) (2,148) (756) Impairment charges — 222 — 102,000 102,222 — Other (5,256) (276) (5,048) 2,135 (8,445) 2,269 Adjusted EBITDA $ 83,717 $ 116,000 $ 65,432 $ 68,193 $ 333,342 $ 58,469 APPENDIX NON-GAAP FINANCIAL RECONCILIATION *Figures may not foot due to rounding.
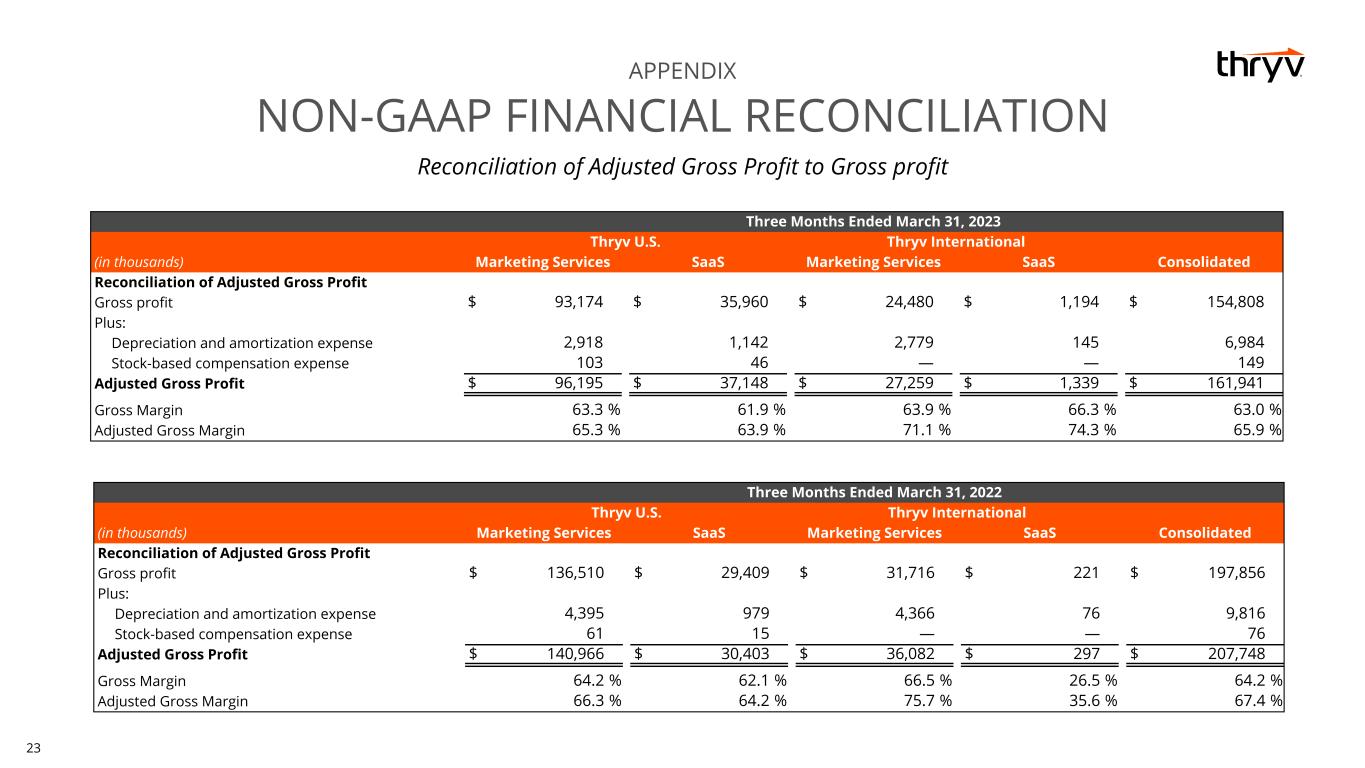
23 Reconciliation of Adjusted Gross Profit to Gross profit APPENDIX NON-GAAP FINANCIAL RECONCILIATION Three Months Ended March 31, 2023 Thryv U.S. Thryv International (in thousands) Marketing Services SaaS Marketing Services SaaS Consolidated Reconciliation of Adjusted Gross Profit Gross profit $ 93,174 $ 35,960 $ 24,480 $ 1,194 $ 154,808 Plus: Depreciation and amortization expense 2,918 1,142 2,779 145 6,984 Stock-based compensation expense 103 46 — — 149 Adjusted Gross Profit $ 96,195 $ 37,148 $ 27,259 $ 1,339 $ 161,941 Gross Margin 63.3 % 61.9 % 63.9 % 66.3 % 63.0 % Adjusted Gross Margin 65.3 % 63.9 % 71.1 % 74.3 % 65.9 % Three Months Ended March 31, 2022 Thryv U.S. Thryv International (in thousands) Marketing Services SaaS Marketing Services SaaS Consolidated Reconciliation of Adjusted Gross Profit Gross profit $ 136,510 $ 29,409 $ 31,716 $ 221 $ 197,856 Plus: Depreciation and amortization expense 4,395 979 4,366 76 9,816 Stock-based compensation expense 61 15 — — 76 Adjusted Gross Profit $ 140,966 $ 30,403 $ 36,082 $ 297 $ 207,748 Gross Margin 64.2 % 62.1 % 66.5 % 26.5 % 64.2 % Adjusted Gross Margin 66.3 % 64.2 % 75.7 % 35.6 % 67.4 %
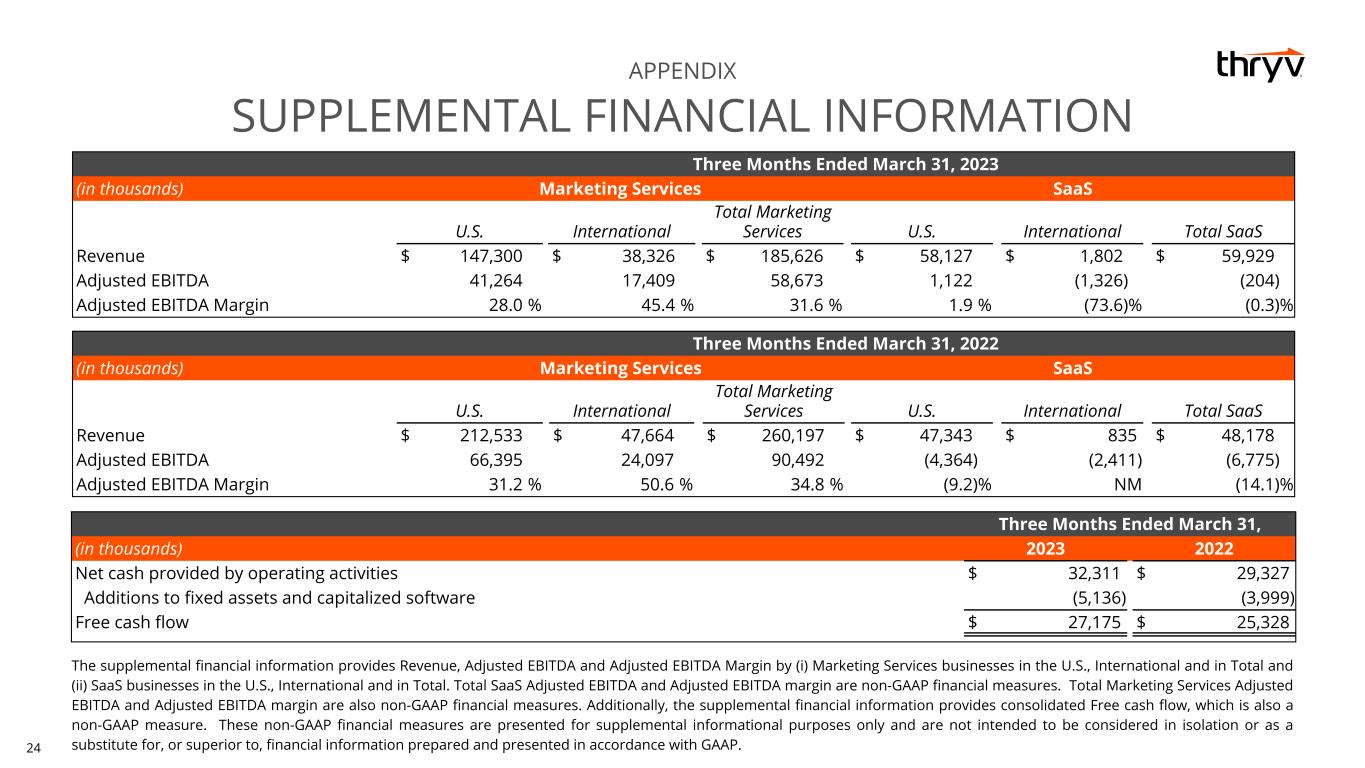
24 APPENDIX SUPPLEMENTAL FINANCIAL INFORMATION The supplemental financial information provides Revenue, Adjusted EBITDA and Adjusted EBITDA Margin by (i) Marketing Services businesses in the U.S., International and in Total and (ii) SaaS businesses in the U.S., International and in Total. Total SaaS Adjusted EBITDA and Adjusted EBITDA margin are non-GAAP financial measures. Total Marketing Services Adjusted EBITDA and Adjusted EBITDA margin are also non-GAAP financial measures. Additionally, the supplemental financial information provides consolidated Free cash flow, which is also a non-GAAP measure. These non-GAAP financial measures are presented for supplemental informational purposes only and are not intended to be considered in isolation or as a substitute for, or superior to, financial information prepared and presented in accordance with GAAP. Three Months Ended March 31, 2023 (in thousands) Marketing Services SaaS U.S. International Total Marketing Services U.S. International Total SaaS Revenue $ 147,300 $ 38,326 $ 185,626 $ 58,127 $ 1,802 $ 59,929 Adjusted EBITDA 41,264 17,409 58,673 1,122 (1,326) (204) Adjusted EBITDA Margin 28.0 % 45.4 % 31.6 % 1.9 % (73.6) % (0.3) % Three Months Ended March 31, 2022 (in thousands) Marketing Services SaaS U.S. International Total Marketing Services U.S. International Total SaaS Revenue $ 212,533 $ 47,664 $ 260,197 $ 47,343 $ 835 $ 48,178 Adjusted EBITDA 66,395 24,097 90,492 (4,364) (2,411) (6,775) Adjusted EBITDA Margin 31.2 % 50.6 % 34.8 % (9.2) % NM (14.1) % Three Months Ended March 31, (in thousands) 2023 2022 Net cash provided by operating activities $ 32,311 $ 29,327 Additions to fixed assets and capitalized software (5,136) (3,999) Free cash flow $ 27,175 $ 25,328
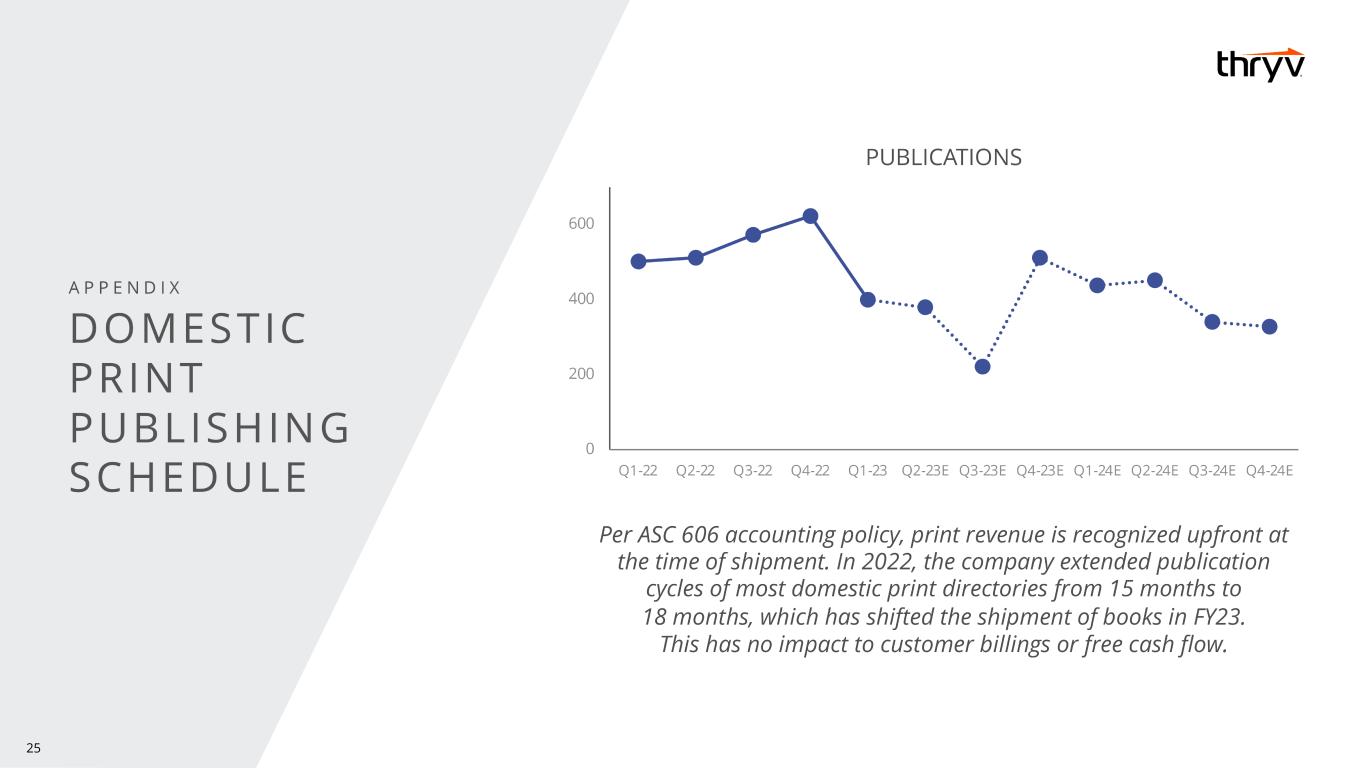
25
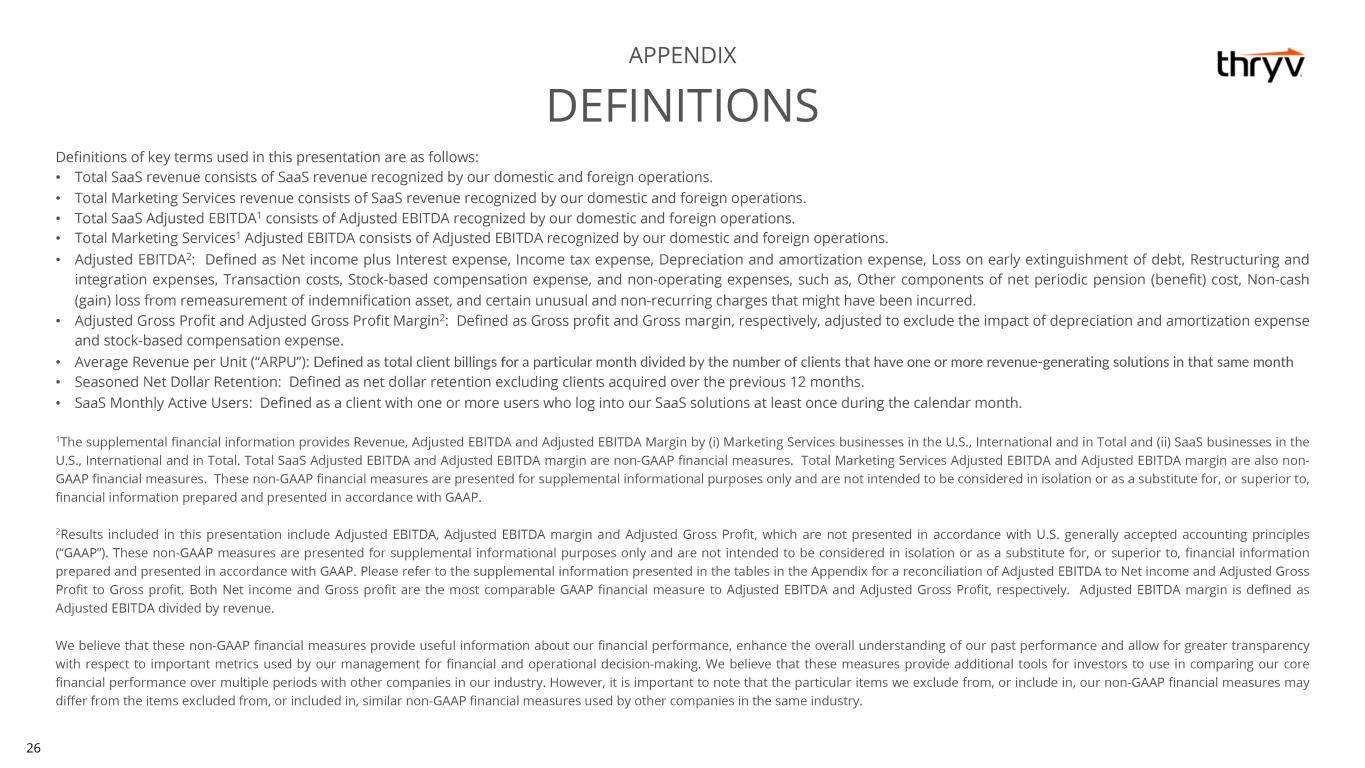
26


