
Exhibit 99.2 2nd QUARTER 2023 INVESTOR PRESENTATION
2
3

4
5
6
7

8
9
10

11
12
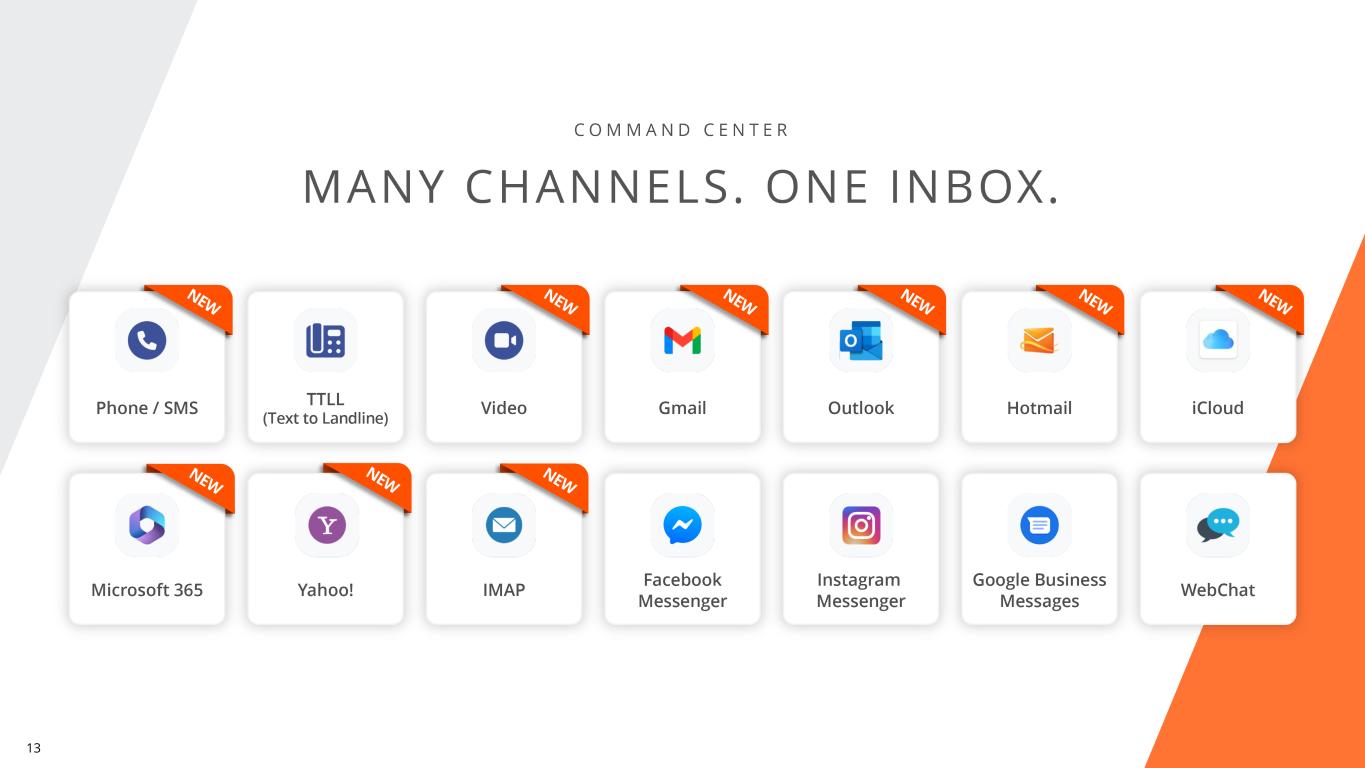
13
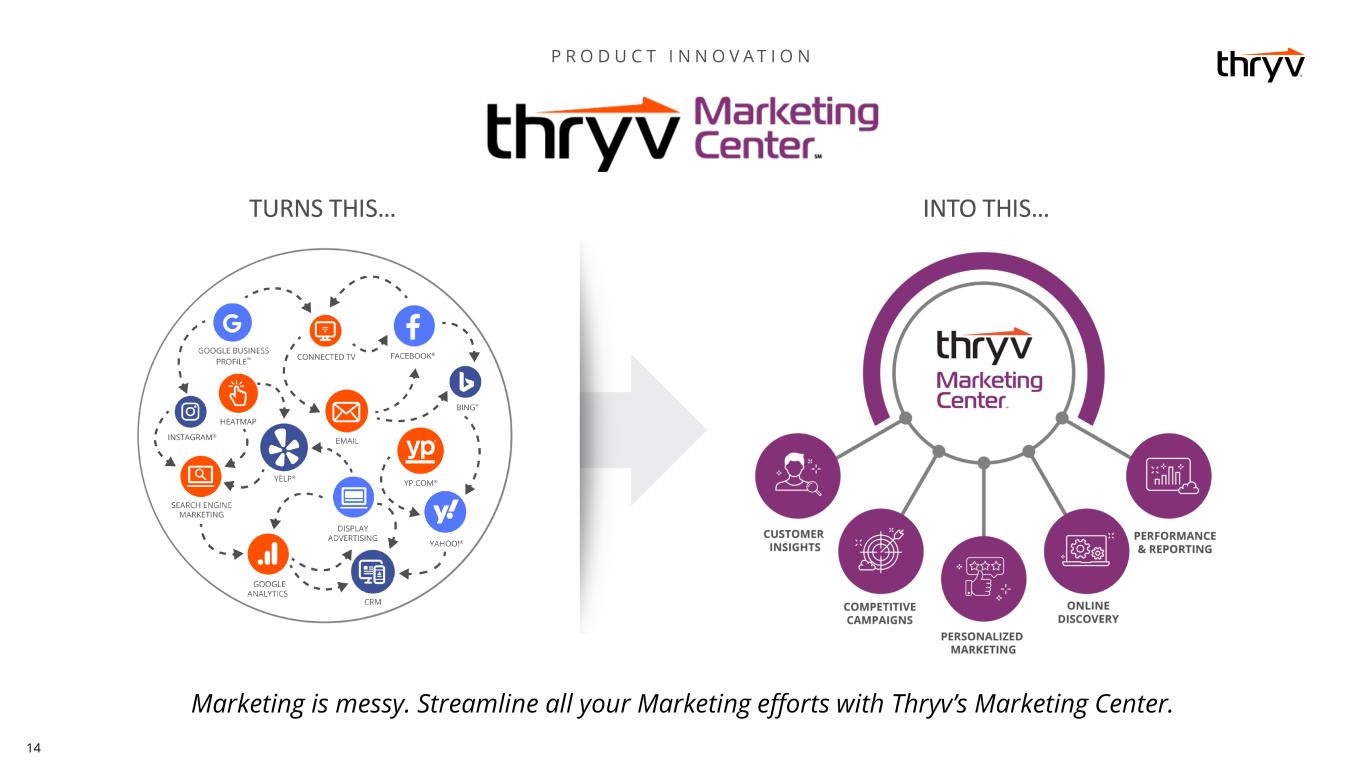
14

15

16

17

18
19 Q2 2023
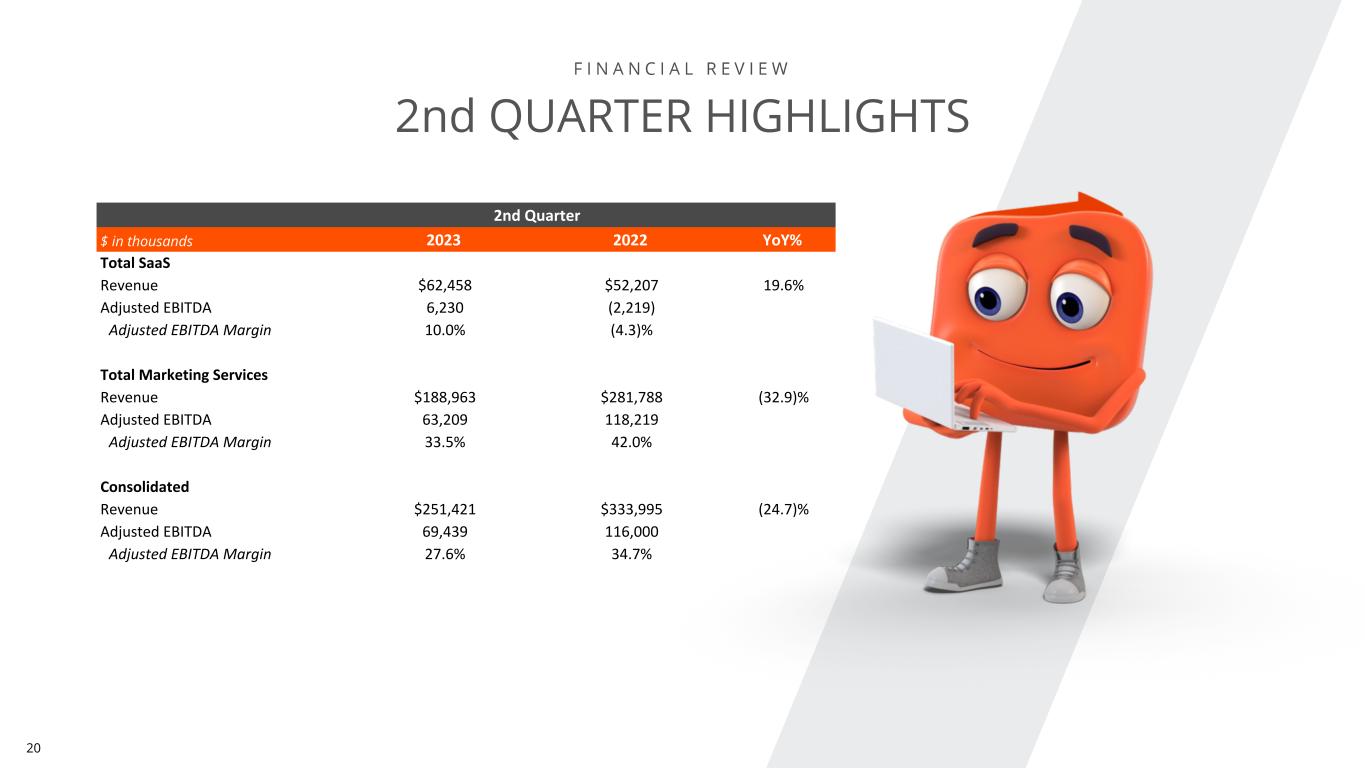
20 2nd QUARTER HIGHLIGHTS 2nd Quarter $ in thousands 2023 2022 YoY% Total SaaS Revenue $62,458 $52,207 19.6% Adjusted EBITDA 6,230 (2,219) Adjusted EBITDA Margin 10.0% (4.3)% Total Marketing Services Revenue $188,963 $281,788 (32.9)% Adjusted EBITDA 63,209 118,219 Adjusted EBITDA Margin 33.5% 42.0% Consolidated Revenue $251,421 $333,995 (24.7)% Adjusted EBITDA 69,439 116,000 Adjusted EBITDA Margin 27.6% 34.7%
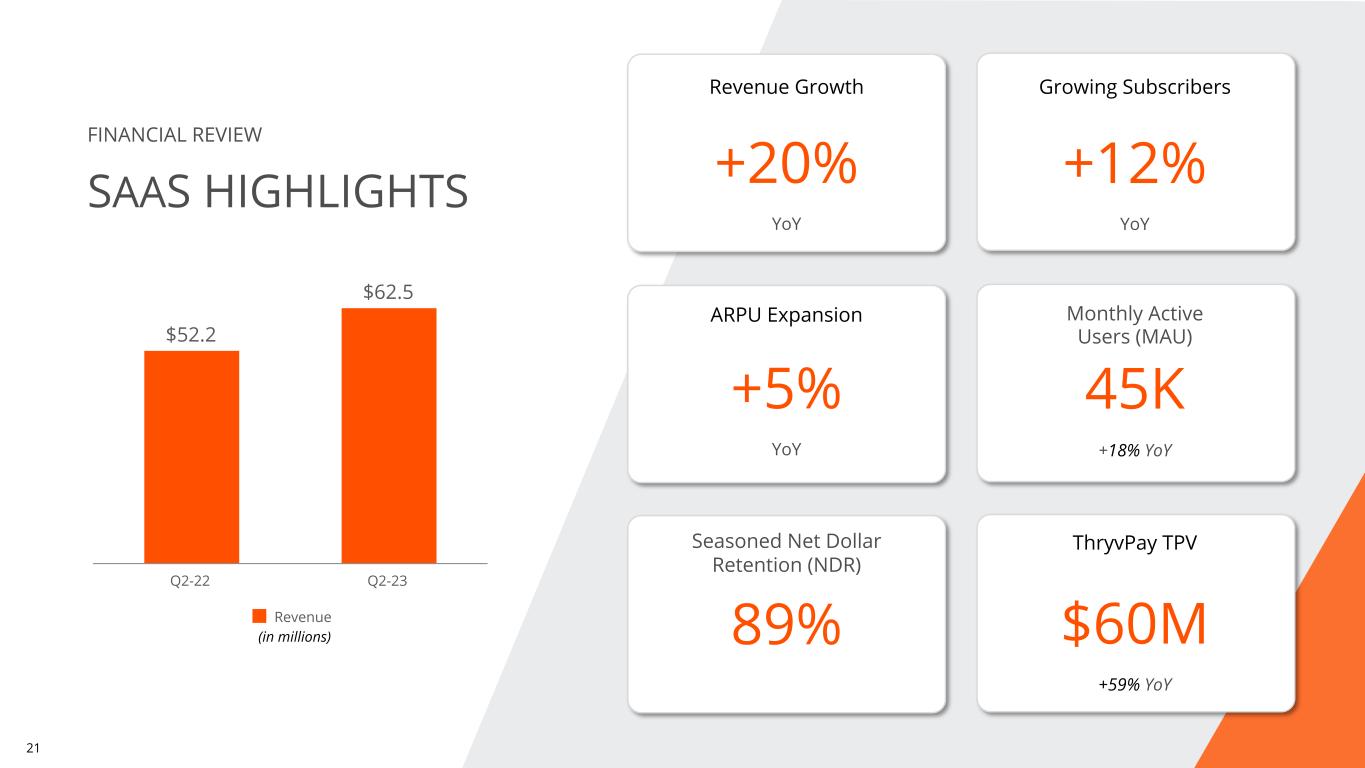
21 FINANCIAL REVIEW SAAS HIGHLIGHTS $52.2 $62.5 Revenue Q2-22 Q2-23 +20% YoY +12% YoY +5% YoY $60M +59% YoY Revenue Growth Growing Subscribers ARPU Expansion ThryvPay TPVSeasoned Net Dollar Retention (NDR) 45K 89% Monthly Active Users (MAU) +18% YoY (in millions)
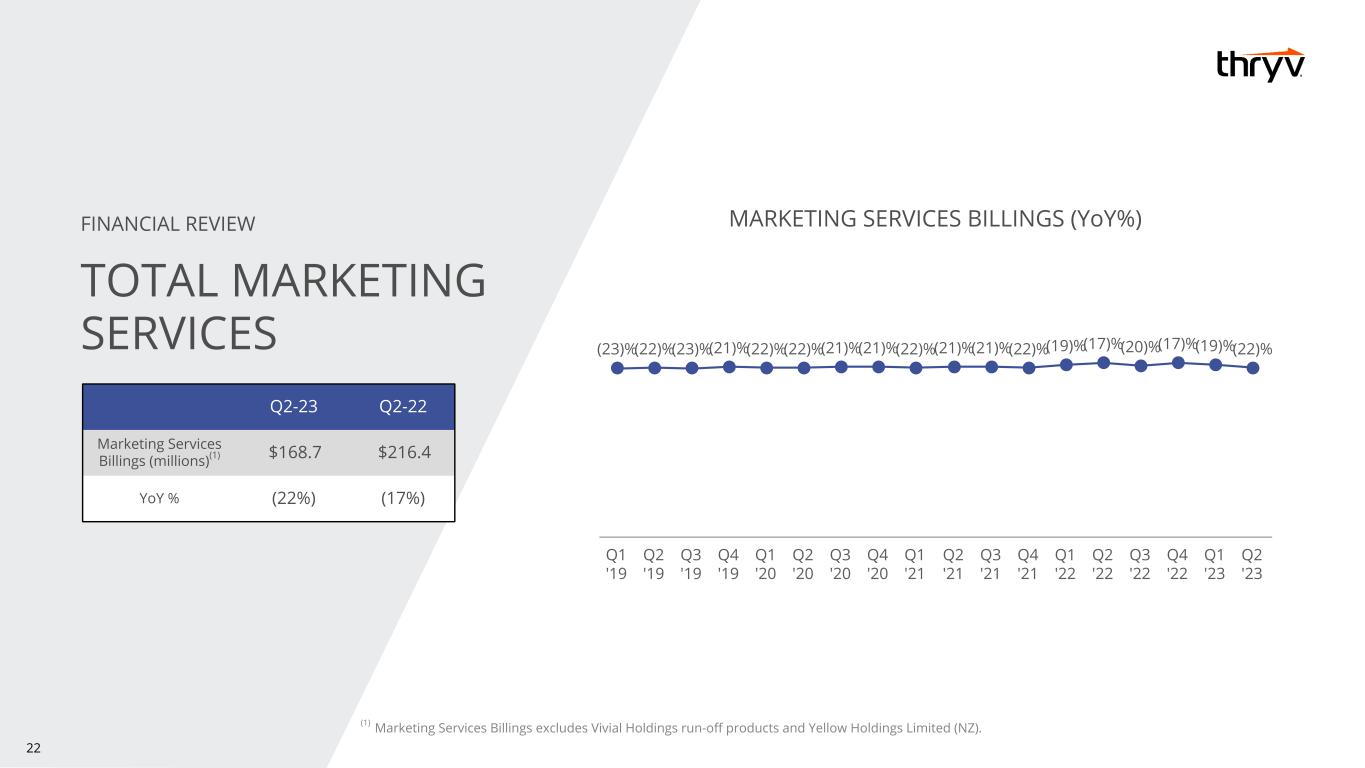
22 (1) Marketing Services Billings excludes Vivial Holdings run-off products and Yellow Holdings Limited (NZ). Q2-23 Q2-22 Marketing Services Billings (millions)(1) $168.7 $216.4 YoY % (22%) (17%) FINANCIAL REVIEW TOTAL MARKETING SERVICES MARKETING SERVICES BILLINGS (YoY%) (23)%(22)%(23)%(21)%(22)%(22)%(21)%(21)%(22)%(21)%(21)%(22)%(19)%(17)%(20)%(17)%(19)%(22)% Q1 '19 Q2 '19 Q3 '19 Q4 '19 Q1 '20 Q2 '20 Q3 '20 Q4 '20 Q1 '21 Q2 '21 Q3 '21 Q4 '21 Q1 '22 Q2 '22 Q3 '22 Q4 '22 Q1 '23 Q2 '23
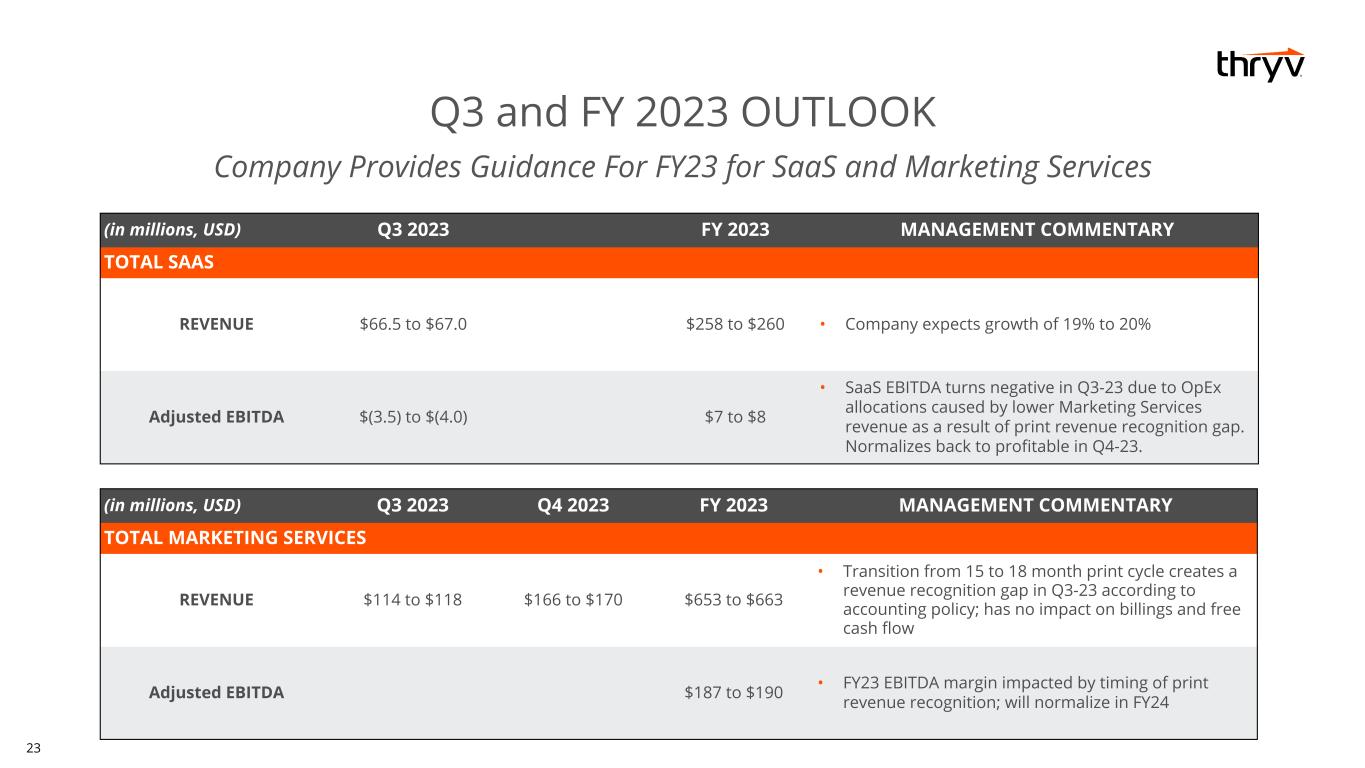
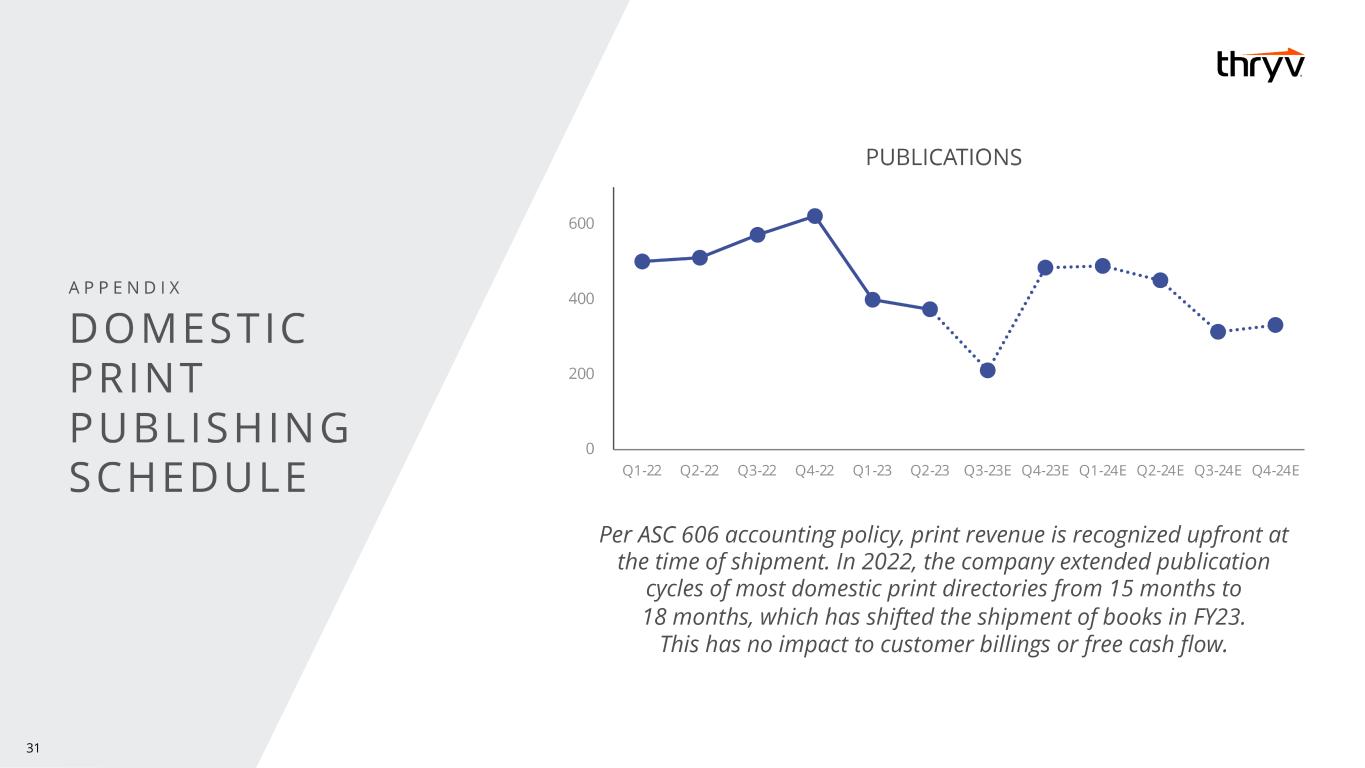
23 Q3 and FY 2023 OUTLOOK Company Provides Guidance For FY23 for SaaS and Marketing Services (in millions, USD) Q3 2023 Q4 2023 FY 2023 MANAGEMENT COMMENTARY TOTAL MARKETING SERVICES REVENUE $114 to $118 $166 to $170 $653 to $663 • Transition from 15 to 18 month print cycle creates a revenue recognition gap in Q3-23 according to accounting policy; has no impact on billings and free cash flow Adjusted EBITDA $187 to $190 • FY23 EBITDA margin impacted by timing of print revenue recognition; will normalize in FY24 (in millions, USD) Q3 2023 FY 2023 MANAGEMENT COMMENTARY TOTAL SAAS REVENUE $66.5 to $67.0 $258 to $260 • Company expects growth of 19% to 20% Adjusted EBITDA $(3.5) to $(4.0) $7 to $8 • SaaS EBITDA turns negative in Q3-23 due to OpEx allocations caused by lower Marketing Services revenue as a result of print revenue recognition gap. Normalizes back to profitable in Q4-23.

24
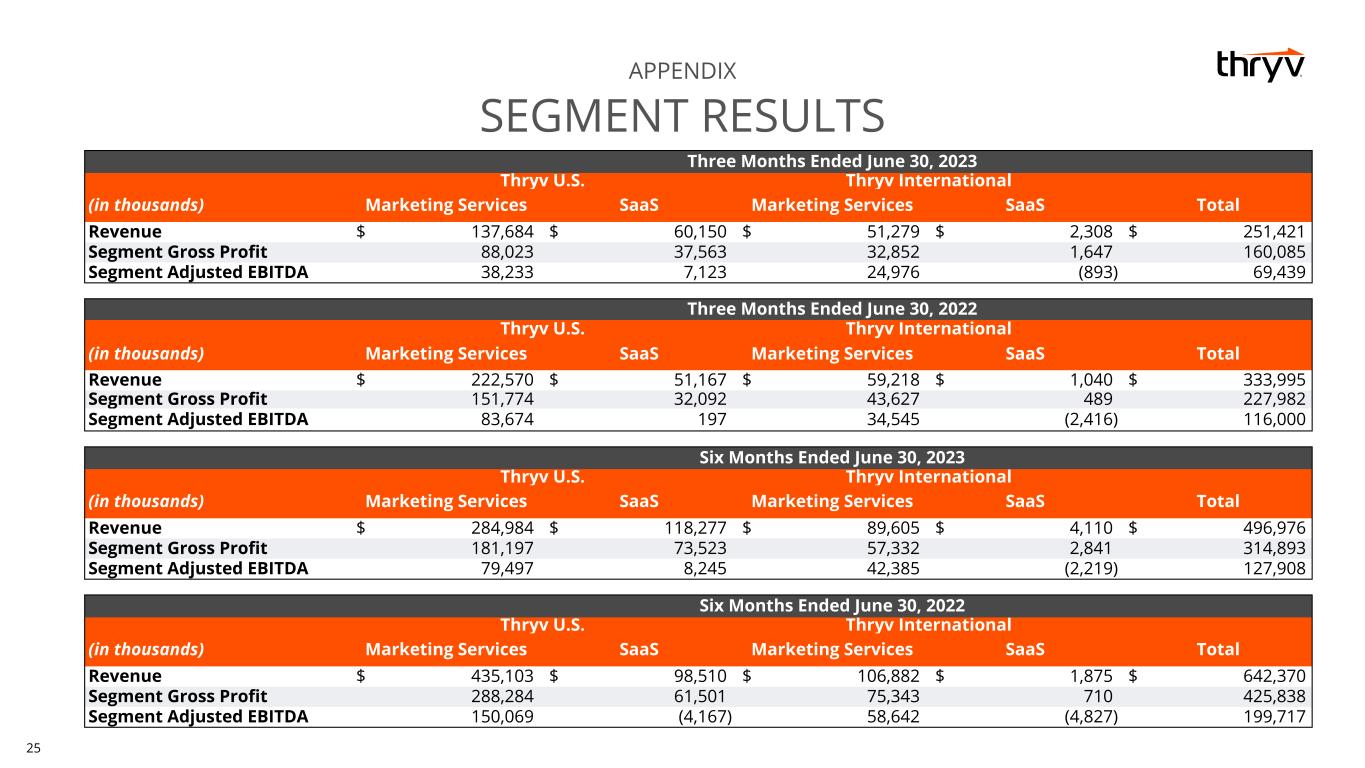
25 APPENDIX SEGMENT RESULTS Three Months Ended June 30, 2022 Thryv U.S. Thryv International (in thousands) Marketing Services SaaS Marketing Services SaaS Total Revenue $ 222,570 $ 51,167 $ 59,218 $ 1,040 $ 333,995 Segment Gross Profit 151,774 32,092 43,627 489 227,982 Segment Adjusted EBITDA 83,674 197 34,545 (2,416) 116,000 Three Months Ended June 30, 2023 Thryv U.S. Thryv International (in thousands) Marketing Services SaaS Marketing Services SaaS Total Revenue $ 137,684 $ 60,150 $ 51,279 $ 2,308 $ 251,421 Segment Gross Profit 88,023 37,563 32,852 1,647 160,085 Segment Adjusted EBITDA 38,233 7,123 24,976 (893) 69,439 Six Months Ended June 30, 2023 Thryv U.S. Thryv International (in thousands) Marketing Services SaaS Marketing Services SaaS Total Revenue $ 284,984 $ 118,277 $ 89,605 $ 4,110 $ 496,976 Segment Gross Profit 181,197 73,523 57,332 2,841 314,893 Segment Adjusted EBITDA 79,497 8,245 42,385 (2,219) 127,908 Six Months Ended June 30, 2022 Thryv U.S. Thryv International (in thousands) Marketing Services SaaS Marketing Services SaaS Total Revenue $ 435,103 $ 98,510 $ 106,882 $ 1,875 $ 642,370 Segment Gross Profit 288,284 61,501 75,343 710 425,838 Segment Adjusted EBITDA 150,069 (4,167) 58,642 (4,827) 199,717
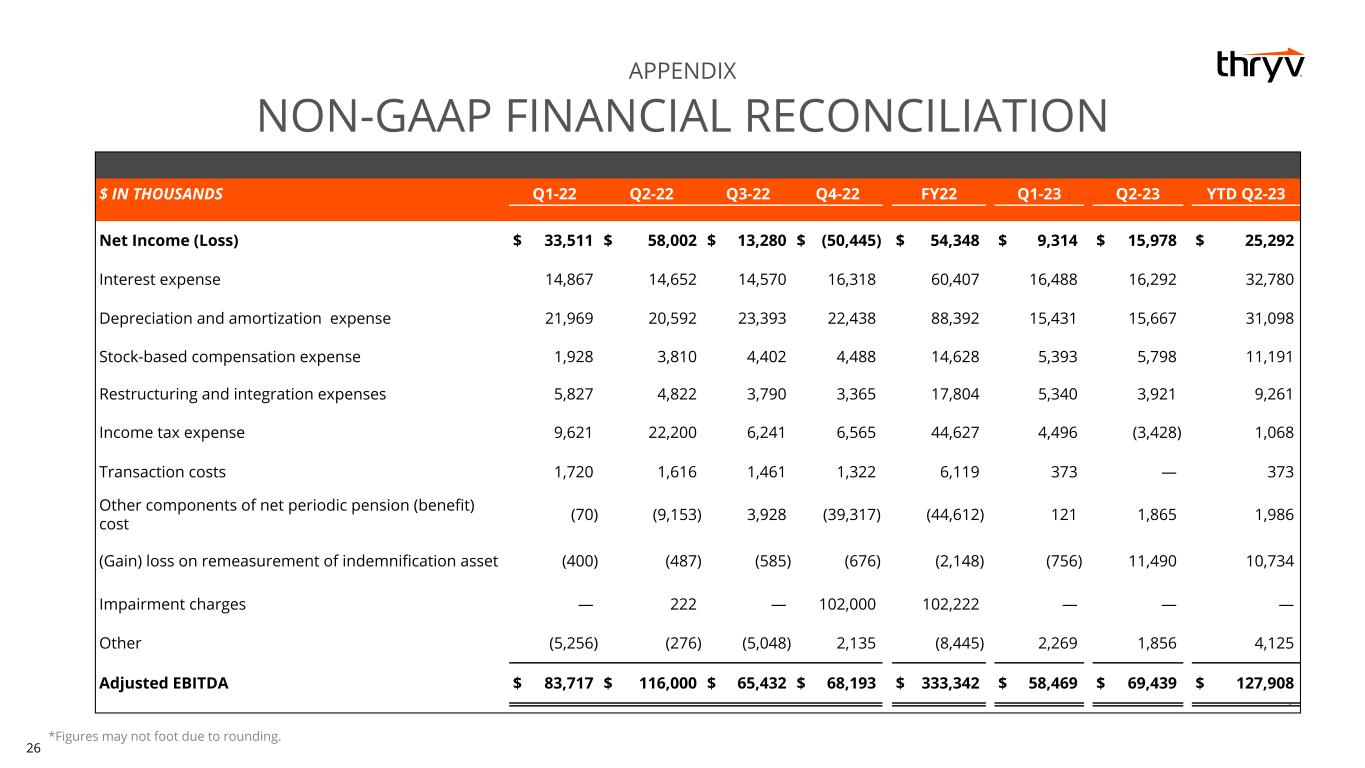
26 $ IN THOUSANDS Q1-22 Q2-22 Q3-22 Q4-22 FY22 Q1-23 Q2-23 YTD Q2-23 Net Income (Loss) $ 33,511 $ 58,002 $ 13,280 $ (50,445) $ 54,348 $ 9,314 $ 15,978 $ 25,292 Interest expense 14,867 14,652 14,570 16,318 60,407 16,488 16,292 32,780 Depreciation and amortization expense 21,969 20,592 23,393 22,438 88,392 15,431 15,667 31,098 Stock-based compensation expense 1,928 3,810 4,402 4,488 14,628 5,393 5,798 11,191 Restructuring and integration expenses 5,827 4,822 3,790 3,365 17,804 5,340 3,921 9,261 Income tax expense 9,621 22,200 6,241 6,565 44,627 4,496 (3,428) 1,068 Transaction costs 1,720 1,616 1,461 1,322 6,119 373 — 373 Other components of net periodic pension (benefit) cost (70) (9,153) 3,928 (39,317) (44,612) 121 1,865 1,986 (Gain) loss on remeasurement of indemnification asset (400) (487) (585) (676) (2,148) (756) 11,490 10,734 Impairment charges — 222 — 102,000 102,222 — — — Other (5,256) (276) (5,048) 2,135 (8,445) 2,269 1,856 4,125 Adjusted EBITDA $ 83,717 $ 116,000 $ 65,432 $ 68,193 $ 333,342 $ 58,469 $ 69,439 $ 127,908 0 APPENDIX NON-GAAP FINANCIAL RECONCILIATION *Figures may not foot due to rounding.
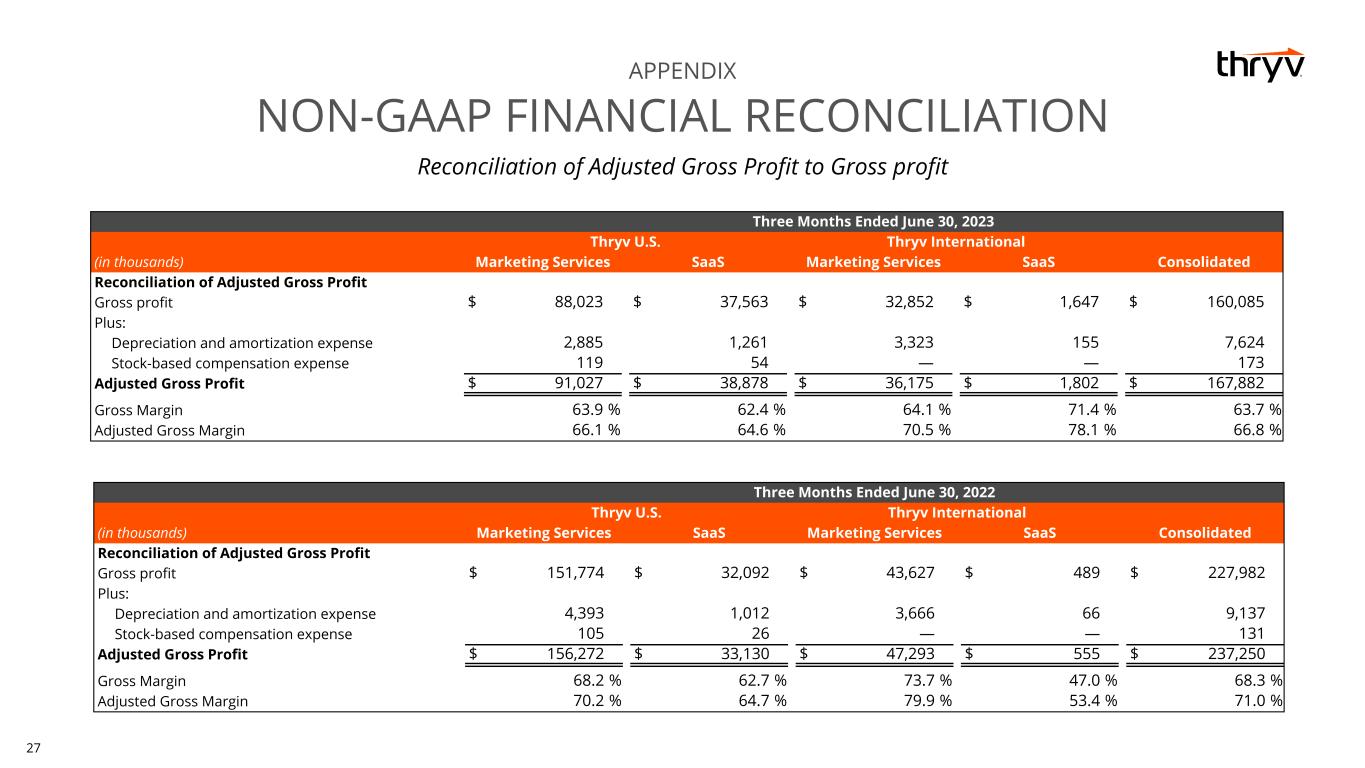
27 Reconciliation of Adjusted Gross Profit to Gross profit APPENDIX NON-GAAP FINANCIAL RECONCILIATION Three Months Ended June 30, 2023 Thryv U.S. Thryv International (in thousands) Marketing Services SaaS Marketing Services SaaS Consolidated Reconciliation of Adjusted Gross Profit Gross profit $ 88,023 $ 37,563 $ 32,852 $ 1,647 $ 160,085 Plus: Depreciation and amortization expense 2,885 1,261 3,323 155 7,624 Stock-based compensation expense 119 54 — — 173 Adjusted Gross Profit $ 91,027 $ 38,878 $ 36,175 $ 1,802 $ 167,882 Gross Margin 63.9 % 62.4 % 64.1 % 71.4 % 63.7 % Adjusted Gross Margin 66.1 % 64.6 % 70.5 % 78.1 % 66.8 % Three Months Ended June 30, 2022 Thryv U.S. Thryv International (in thousands) Marketing Services SaaS Marketing Services SaaS Consolidated Reconciliation of Adjusted Gross Profit Gross profit $ 151,774 $ 32,092 $ 43,627 $ 489 $ 227,982 Plus: Depreciation and amortization expense 4,393 1,012 3,666 66 9,137 Stock-based compensation expense 105 26 — — 131 Adjusted Gross Profit $ 156,272 $ 33,130 $ 47,293 $ 555 $ 237,250 Gross Margin 68.2 % 62.7 % 73.7 % 47.0 % 68.3 % Adjusted Gross Margin 70.2 % 64.7 % 79.9 % 53.4 % 71.0 %

28 Reconciliation of Adjusted Gross Profit to Gross profit APPENDIX NON-GAAP FINANCIAL RECONCILIATION Six Months Ended June 30, 2023 Thryv U.S. Thryv International (in thousands) Marketing Services SaaS Marketing Services SaaS Consolidated Reconciliation of Adjusted Gross Profit Gross profit $ 181,197 $ 73,523 $ 57,332 $ 2,841 $ 314,893 Plus: Depreciation and amortization expense 5,803 2,402 6,102 300 14,607 Stock-based compensation expense 222 100 — — 322 Adjusted Gross Profit $ 187,222 $ 76,025 $ 63,434 $ 3,141 $ 329,822 Gross Margin 63.6 % 62.2 % 64.0 % 69.1 % 63.4 % Adjusted Gross Margin 65.7 % 64.3 % 70.8 % 76.4 % 66.4 % Six Months Ended June 30, 2022 Thryv U.S. Thryv International (in thousands) Marketing Services SaaS Marketing Services SaaS Consolidated Reconciliation of Adjusted Gross Profit Gross profit $ 288,284 $ 61,501 $ 75,343 $ 710 $ 425,838 Plus: Depreciation and amortization expense 8,788 1,991 8,032 142 18,953 Stock-based compensation expense 166 41 — — 207 Adjusted Gross Profit $ 297,238 $ 63,533 $ 83,375 $ 852 $ 444,998 Gross Margin 66.3 % 62.4 % 70.5 % 37.9 % 66.3 % Adjusted Gross Margin 68.3 % 64.5 % 78.0 % 45.4 % 69.3 %
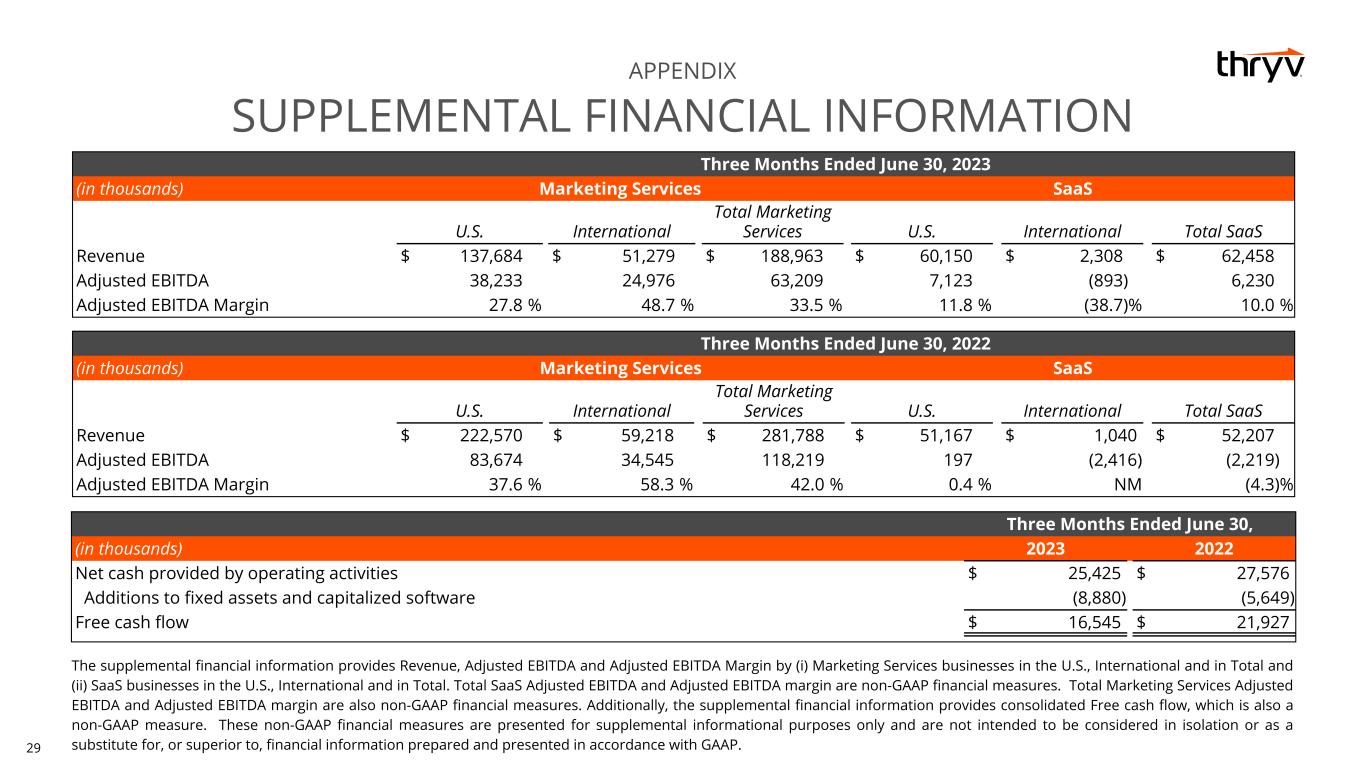
29 APPENDIX SUPPLEMENTAL FINANCIAL INFORMATION The supplemental financial information provides Revenue, Adjusted EBITDA and Adjusted EBITDA Margin by (i) Marketing Services businesses in the U.S., International and in Total and (ii) SaaS businesses in the U.S., International and in Total. Total SaaS Adjusted EBITDA and Adjusted EBITDA margin are non-GAAP financial measures. Total Marketing Services Adjusted EBITDA and Adjusted EBITDA margin are also non-GAAP financial measures. Additionally, the supplemental financial information provides consolidated Free cash flow, which is also a non-GAAP measure. These non-GAAP financial measures are presented for supplemental informational purposes only and are not intended to be considered in isolation or as a substitute for, or superior to, financial information prepared and presented in accordance with GAAP. Three Months Ended June 30, 2023 (in thousands) Marketing Services SaaS U.S. International Total Marketing Services U.S. International Total SaaS Revenue $ 137,684 $ 51,279 $ 188,963 $ 60,150 $ 2,308 $ 62,458 Adjusted EBITDA 38,233 24,976 63,209 7,123 (893) 6,230 Adjusted EBITDA Margin 27.8 % 48.7 % 33.5 % 11.8 % (38.7) % 10.0 % Three Months Ended June 30, 2022 (in thousands) Marketing Services SaaS U.S. International Total Marketing Services U.S. International Total SaaS Revenue $ 222,570 $ 59,218 $ 281,788 $ 51,167 $ 1,040 $ 52,207 Adjusted EBITDA 83,674 34,545 118,219 197 (2,416) (2,219) Adjusted EBITDA Margin 37.6 % 58.3 % 42.0 % 0.4 % NM (4.3) % Three Months Ended June 30, (in thousands) 2023 2022 Net cash provided by operating activities $ 25,425 $ 27,576 Additions to fixed assets and capitalized software (8,880) (5,649) Free cash flow $ 16,545 $ 21,927
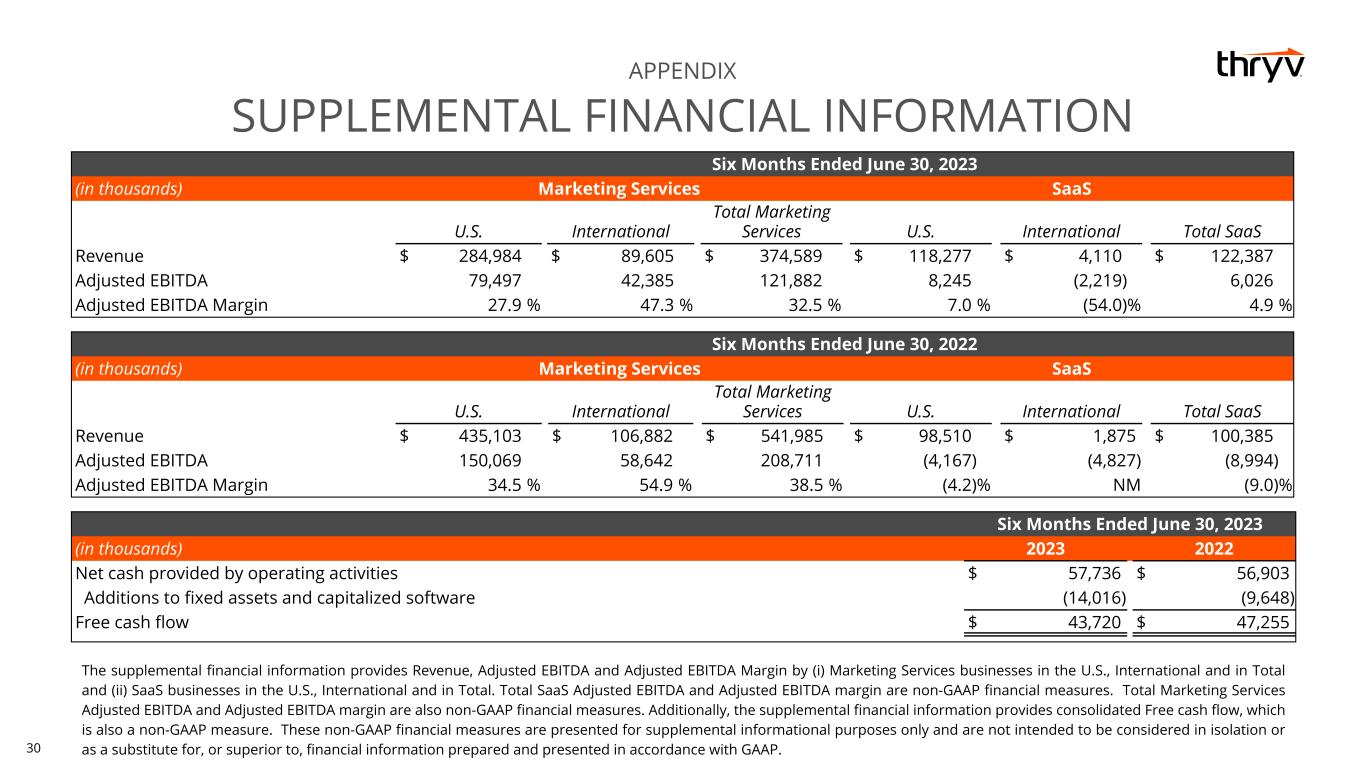
30 APPENDIX SUPPLEMENTAL FINANCIAL INFORMATION The supplemental financial information provides Revenue, Adjusted EBITDA and Adjusted EBITDA Margin by (i) Marketing Services businesses in the U.S., International and in Total and (ii) SaaS businesses in the U.S., International and in Total. Total SaaS Adjusted EBITDA and Adjusted EBITDA margin are non-GAAP financial measures. Total Marketing Services Adjusted EBITDA and Adjusted EBITDA margin are also non-GAAP financial measures. Additionally, the supplemental financial information provides consolidated Free cash flow, which is also a non-GAAP measure. These non-GAAP financial measures are presented for supplemental informational purposes only and are not intended to be considered in isolation or as a substitute for, or superior to, financial information prepared and presented in accordance with GAAP. Six Months Ended June 30, 2023 (in thousands) Marketing Services SaaS U.S. International Total Marketing Services U.S. International Total SaaS Revenue $ 284,984 $ 89,605 $ 374,589 $ 118,277 $ 4,110 $ 122,387 Adjusted EBITDA 79,497 42,385 121,882 8,245 (2,219) 6,026 Adjusted EBITDA Margin 27.9 % 47.3 % 32.5 % 7.0 % (54.0) % 4.9 % Six Months Ended June 30, 2022 (in thousands) Marketing Services SaaS U.S. International Total Marketing Services U.S. International Total SaaS Revenue $ 435,103 $ 106,882 $ 541,985 $ 98,510 $ 1,875 $ 100,385 Adjusted EBITDA 150,069 58,642 208,711 (4,167) (4,827) (8,994) Adjusted EBITDA Margin 34.5 % 54.9 % 38.5 % (4.2) % NM (9.0) % Six Months Ended June 30, 2023 (in thousands) 2023 2022 Net cash provided by operating activities $ 57,736 $ 56,903 Additions to fixed assets and capitalized software (14,016) (9,648) Free cash flow $ 43,720 $ 47,255
31
32


