UNITED STATES
SECURITIES AND EXCHANGE COMMISSION
Washington, D.C. 20549
FORM N-CSR
CERTIFIED SHAREHOLDER REPORT OF REGISTERED
MANAGEMENT INVESTMENT COMPANIES
Investment Company Act file number 811-22781
Goldman Sachs Trust II
(Exact name of registrant as specified in charter)
200 West Street
15th Floor
New York, New York 10282
(Address of principal executive offices) (Zip code)
| | |
Copies to: |
Robert Griffith, Esq. | | Stephen H. Bier, Esq. |
Goldman Sachs & Co. LLC | | Dechert LLP |
200 West Street | | 1095 Avenue of the Americas |
New York, New York 10282 | | New York, NY 10036 |
(Name and address of agents for service)
Registrant’s telephone number, including area code: (212) 902-1000
Date of fiscal year end: October 31
Date of reporting period: April 30, 2024
| ITEM 1. | REPORTS TO STOCKHOLDERS. |
| | The Semi-Annual Report to Shareholders is filed herewith. |
Goldman Sachs Funds Semi-Annual Report April 30, 2024 Active Equity Multi-Manager Funds Multi-Manager International Equity Multi-Manager U.S. Small Cap Equity Active Equity Multi-Manager Funds _ MULTI-MANAGER INTERNATIONAL EQUITY _ MULTI-MANAGER U.S. SMALL CAP EQUITY
Active Equity Multi-Manager Funds
| | |
| ∎ | | MULTI-MANAGER INTERNATIONAL EQUITY |
| | |
| ∎ | | MULTI-MANAGER U.S. SMALL CAP EQUITY |
TABLE OF CONTENTS
Effective January 24, 2023, open-end mutual funds and exchange-traded funds are required to provide shareholders with streamlined annual and semi-annual shareholder reports (“Tailored Shareholder Reports”). Funds will be required to prepare a separate Tailored Shareholder Report for each share class of a fund that highlights key information to investors. Other information, including financial statements, will no longer appear in a fund’s shareholder report, but will be available online, delivered free of charge upon request, and filed with the Securities and Exchange Commission on a semi-annual basis on Form N-CSR. The new requirements have a compliance date of July 24, 2024.
| | | | | | |
| | | | |
| NOT FDIC-INSURED | | May Lose Value | | No Bank Guarantee | | |
MARKET REVIEW
Active Equity Multi-Manager Funds
Market Review
Looking Ahead
The following are highlights both of key factors affecting the global equity and credit markets and of any key changes made to the Active Equity Multi-Manager Funds (the “Funds”) during the six months ended April 30, 2024 (the “Reporting Period”). A streamlined annual shareholder report covering the 12 months ended October 31, 2024 will be provided to Fund shareholders, per new Securities and Exchange Commission (“SEC”) requirements with a compliance date of July 24, 2024.
Market and Economic Review
Global Equity Markets
| ∎ | The broad global equity market, as represented by the MSCI* All Country World Index (“MSCI ACWI”) Investable Market Index, returned 19.64% during the Reporting Period. |
| ∎ | When the Reporting Period began in November 2023, global equities were in the midst of a rally. |
| | ∎ | The rally, which had started in late October 2023, followed a period of considerable volatility, as market participants weighed the probabilities for various U.S. economic scenarios, ranging from a “soft landing” to a “hard landing” to stagflation.1 |
| | ∎ | Late October 2023 marked a turning point in market sentiment, as the soft landing narrative became dominant. Investors appeared to believe the U.S. Federal Reserve (“Fed”) would not hike interest rates again, and they started pricing in interest rate cuts for 2024. (The Fed had last raised the target federal funds rate in July 2023.) |
| ∎ | Global equities continued to rally through the end of March 2024, delivering strongly positive returns. |
| ∎ | In April 2024, the global equity market gave back some of its gains, as persistent inflation led investors to scale back their expectations for the number of potential Fed rate cuts. |
| ∎ | From a style perspective, growth stocks and value stocks generated positive returns during the Reporting Period overall, with growth stocks outpacing their value counterparts. |
| | ∎ | From a regional perspective, developed markets equities and emerging markets equities produced gains, with developed markets equities outperforming emerging markets equities. |
| | ∎ | Within developed markets equities, the Japanese stock market was a particularly strong performer amid investor optimism about corporate governance reforms and potential changes to the Bank of Japan’s monetary policy. |
| | ∎ | Within emerging markets equities, China was the weakest performer due to that country’s economic challenges, including an ongoing property crisis and weak consumer sentiment. |
Credit Markets
| ∎ | Credit markets broadly advanced during the Reporting Period, as bond yields fell and credit spreads (or yield differentials versus duration-equivalent U.S. Treasury securities) tightened. |
| ∎ | In the first two months of the Reporting Period, bond yields plunged amidst speculation the Fed had reached the peak of its interest rate hikes and would begin cutting rates in 2024. |
| ∎ | Bond yields rose during the last four months of the Reporting Period, as markets came to terms with the possibility that interest rates could remain higher for longer. |
| | ∎ | Also, due to persistent inflation, investors had moderated their expectations for Fed rate cuts in 2024, which contributed further to the rise in yields. |
| | ∎ | Credit spreads continued to tighten as a result of strong demand and a drop in supply, especially net new supply. |
| 1 | A soft landing, in economics, is a cyclical downturn that avoids recession. It typically describes attempts by central banks to raise interest rates just enough to stop an economy from overheating and experiencing high inflation, without causing a significant increase in unemployment, or a hard landing. Stagflation is characterized by slow economic growth and high inflation. |
MARKET REVIEW
| ∎ | High yield corporate bonds and bank loans delivered strong performance during the Reporting Period overall, with high yield corporate bonds outpacing bank loans. |
| | ∎ | The outperformance of high yield corporate bonds was driven largely by spread tightening and their comparatively longer duration. (Duration is a measure of a security’s sensitivity to changes in interest rates.) |
| | ∎ | The default rate for bank loans and high yield corporate bonds increased modestly during the Reporting Period but remained below long-term averages. |
| ∎ | Investment grade corporate bonds also benefited from their longer duration profile, though they underperformed high yield corporate bonds during the Reporting Period overall. |
| | ∎ | As yields fell in the first two months of the Reporting Period, investment grade corporate bonds outperformed high yield corporate bonds. However, they lagged during the last four months of the Reporting Period when yields moved higher. |
| | ∎ | Among market segments, financial and industrial investment grade corporate bonds performed best, while utilities turned in the weakest performance. |
| ∎ | U.S. dollar-denominated emerging markets debt was the strongest performing credit sector of the Reporting Period, benefiting from spread compression across the credit spectrum and strong gains among the lowest rated credits. |
| | ∎ | Local currency-denominated bonds generally underperformed other credit sectors during the Reporting Period, largely because of a strong U.S. dollar and higher-for-longer central bank policy that anchored interest rates above market expectations. |
Fund Changes and Highlights
No material changes were made to the Funds during the Reporting Period.
FUND BASICS
Multi-Manager International Equity Fund
as of April 30, 2024
| | | | | | | | |
| | | | |
November 1, 2023–April 30, 2024 | | Fund Total
Return (based on NAV)1 | | | | MSCI*® EAFE® Index
(Net, USD, Unhedged)2 | | |
| | | | |
Class P Shares | | 17.07% | | | | 18.63% | | |
| | 1 | The net asset value (“NAV”) represents the net assets of the class of the Fund (ex-dividend) divided by the total number of shares of the class outstanding. The Fund’s performance assumes the reinvestment of dividends and other distributions. The Fund’s performance does not reflect the deduction of any applicable sales charges. |
| | 2 | The MSCI® EAFE® Index is a stock market index that is designed to measure the equity market performance of developed markets in Europe, Australasia and the Far East, excluding the U.S. and Canada. The Index figures do not reflect any deductions for fees, expenses or taxes. It is not possible to invest directly in an index. |
| | | The returns set forth in the table above represent past performance. Past performance does not guarantee future results. The Fund’s investment return and principal value will fluctuate so that an investor’s shares, when redeemed, may be worth more or less than their original cost. Current performance may be lower or higher than the performance quoted above. Please visit our web site at www.GSAMFUNDS.com to obtain the most recent month-end returns. Performance reflects applicable fee waivers and/or expense limitations in effect during the periods shown. In their absence, performance would be reduced. Returns do not reflect the deduction of taxes that a shareholder would pay on Fund distributions or the redemption of Fund shares. |
|
|
TOP TEN HOLDINGS AS OF 4/30/24± |
| | | | | | | | |
| | | | |
Holding | | % of Net Assets | | | | Line of Business | | |
| | | | |
Novo Nordisk AS | | 2.8% | | | | Pharmaceuticals | | |
Rolls-Royce Holdings PLC | | 2.2 | | | | Aerospace & Defense | | |
AstraZeneca PLC | | 1.9 | | | | Pharmaceuticals | | |
Schneider Electric SE | | 1.9 | | | | Electrical Equipment | | |
Samsung Electronics Co. Ltd. | | 1.8 | | | | Technology Hardware, Storage & Peripherals | | |
Canadian Pacific Kansas City Ltd. | | 1.8 | | | | Ground Transportation | | |
SAP SE | | 1.8 | | | | Software | | |
Air Liquide SA | | 1.7 | | | | Chemicals | | |
Roche Holding AG | | 1.7 | | | | Pharmaceuticals | | |
| | | | |
Compass Group PLC | | 1.6 | | | | Hotels, Restaurants & Leisure | | |
| | ± | The top 10 holdings may not be representative of the Fund’s future investments. The top 10 holdings exclude investments in money market funds. |
FUND BASICS
|
|
FUND VS. BENCHMARK SECTOR ALLOCATION† |
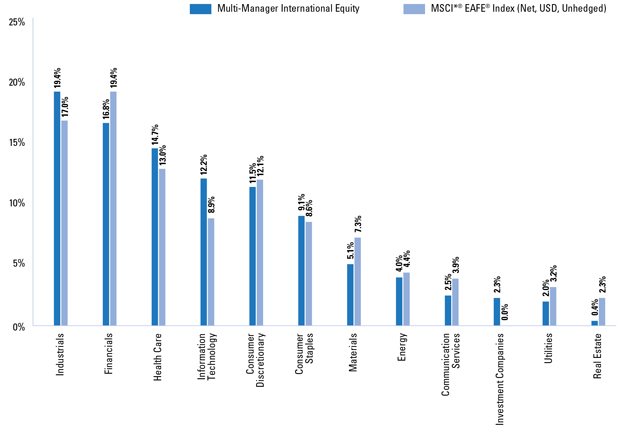
| † | The Fund is actively managed and, as such, its composition may differ over time. Consequently, the Fund’s overall sector allocations may differ from the percentages contained in the graph above. The graph categorizes investments using the Global Industry Classification Standard (“GICS”), however, the sector classifications used by the portfolio management team may differ from GICS. The percentage shown for each investment category reflects the value of investments in that category as a percentage of the total value of the Fund’s equity investments. The graph depicts the Fund’s investments but may not represent the Fund’s market exposure due to the exclusion of certain derivatives, if any, as listed in the Additional Investment Information section of the Schedule of Investments. Figures in the above graph may not sum to 100% due to the exclusion of other assets and liabilities. |
| | For more information about the Fund, please refer to www.GSAMFUNDS.com. There, you can learn more about the Fund’s investment strategies, holdings, and performance. |
FUND BASICS
Multi-Manager U.S. Small Cap Equity Fund
as of April 30, 2024
| | | | | | | | |
| | | | |
November 1, 2023–April 30, 2024 | | Fund Total
Return (based on NAV)1 | | | | Russell 2000®
Total Return Index2 | | |
| | | | |
Class P Shares | | 17.07% | | | | 19.66% | | |
| | 1 | The net asset value (“NAV”) represents the net assets of the class of the Fund (ex-dividend) divided by the total number of shares of the class outstanding. The Fund’s performance assumes the reinvestment of dividends and other distributions. The Fund’s performance does not reflect the deduction of any applicable sales charges. |
| | 2 | The Russell 2000® Total Return Index is an unmanaged index of common stock prices that measures the performance of the 2000 smallest companies in the Russell 3000® Index. The Index is constructed to provide a comprehensive and unbiased small-cap barometer and is completely reconstituted annually to ensure larger stocks do not distort the performance and characteristics of the true small-cap opportunity set. It is not possible to invest directly in an index. |
| | | The returns set forth in the table above represent past performance. Past performance does not guarantee future results. The Fund’s investment return and principal value will fluctuate so that an investor’s shares, when redeemed, may be worth more or less than their original cost. Current performance may be lower or higher than the performance quoted above. Please visit our web site at www.GSAMFUNDS.com to obtain the most recent month-end returns. Performance reflects applicable fee waivers and/or expense limitations in effect during the periods shown. In their absence, performance would be reduced. Returns do not reflect the deduction of taxes that a shareholder would pay on Fund distributions or the redemption of Fund shares. |
|
|
TOP TEN HOLDINGS AS OF 4/30/24± |
| | | | | | | | |
| | | | |
Holding | | % of Net Assets | | | | Line of Business | | |
| | | | |
Ascendis Pharma AS | | 1.5% | | | | Biotechnology | | |
Casella Waste Systems, Inc. | | 1.1 | | | | Commerical Services & Supplies | | |
ChampionX Corp. | | 1.1 | | | | Energy Equipment & Services | | |
Wintrust Financial Corp. | | 0.9 | | | | Banks | | |
Comfort Systems USA, Inc. | | 0.9 | | | | Construction & Engineering | | |
AZEK Co., Inc. | | 0.8 | | | | Building Products | | |
Bright Horizons Family Solutions, Inc. | | 0.8 | | | | Diversified Consumer Services | | |
Insight Enterprises, Inc. | | 0.8 | | | | Electronic Equipment, Instruments & Components | | |
HB Fuller Co. | | 0.8 | | | | Chemicals | | |
| | | | |
Haemonetics Corp. | | 0.8 | | | | Health Care Equipment & Supplies | | |
| | ± | The top 10 holdings may not be representative of the Fund’s future investments. The top 10 holdings exclude investments in money market funds. |
FUND BASICS
|
|
FUND VS. BENCHMARK SECTOR ALLOCATION† |
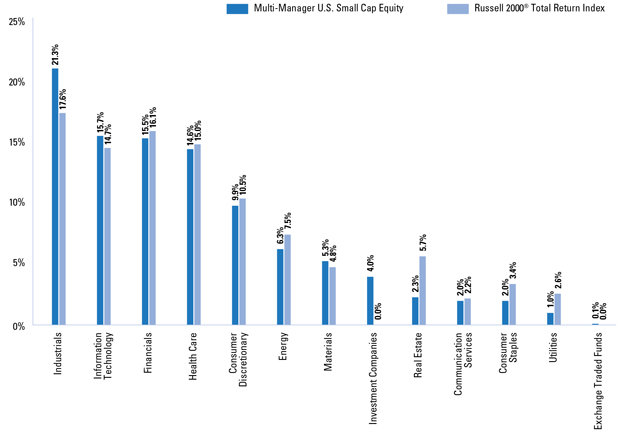
| † | The Fund is actively managed and, as such, its composition may differ over time. Consequently, the Fund’s overall sector allocations may differ from the percentages contained in the graph above. The graph categorizes investments using the Global Industry Classification Standard (“GICS”), however, the sector classifications used by the portfolio management team may differ from GICS. The percentage shown for each investment category reflects the value of investments in that category as a percentage of the total value of the Fund’s equity investments. The graph depicts the Fund’s investments but may not represent the Fund’s market exposure due to the exclusion of certain derivatives, if any, as listed in the Additional Investment Information section of the Schedule of Investments. Figures in the above graph may not sum to 100% due to the exclusion of other assets and liabilities. |
| | For more information about the Fund, please refer to www.GSAMFUNDS.com. There, you can learn more about the Fund’s investment strategies, holdings, and performance. |
MULTI-MANAGER INTERNATIONAL EQUITY FUND
|
Schedule of Investments April 30, 2024 (Unaudited) |
| | | | | | | | |
| | | Shares | | Description | | Value | |
| |
| | Common Stocks – 97.0% | |
| |
| | Belgium – 0.9% | |
| | 149,953 | | Anheuser-Busch InBev SA (Beverages) | | $ | 8,963,258 | |
| | 48,728 | | KBC Group NV (Banks) | | | 3,619,718 | |
| | | | | | | | |
| | | | | | | 12,582,976 | |
| | | |
| |
| | Bermuda* – 0.8% | |
| | 119,810 | | Arch Capital Group Ltd. (Insurance) | | | 11,207,027 | |
| | | |
| |
| | Brazil – 0.7% | |
| | 739,275 | | Banco Bradesco SA (Banks) | | | 1,996,042 | |
| | 798,630 | | NU Holdings Ltd. Class A* (Banks) | | | 8,673,122 | |
| | | | | | | | |
| | | | | | | 10,669,164 | |
| | | |
| |
| | Canada – 4.5% | |
| | 65,416 | | Canadian National Railway Co. (Ground Transportation) | | | 7,944,119 | |
| | 105,570 | | Canadian Natural Resources Ltd. (Oil, Gas & Consumable Fuels) | | | 7,999,900 | |
| | 331,513 | | Canadian Pacific Kansas City Ltd. (Ground Transportation) | | | 26,002,655 | |
| | 26,321 | | Intact Financial Corp. (Insurance) | | | 4,326,192 | |
| | 153,825 | | Suncor Energy, Inc. (Oil, Gas & Consumable Fuels) | | | 5,869,631 | |
| | 53,430 | | Thomson Reuters Corp. (Professional Services) | | | 8,070,098 | |
| | 97,693 | | Toronto-Dominion Bank (Banks) | | | 5,795,654 | |
| | | | | | | | |
| | | | | | | 66,008,249 | |
| | | |
| |
| | China – 1.3% | |
| | 210,100 | | NetEase, Inc. (Entertainment) | | | 3,938,246 | |
| | 302,800 | | Tencent Holdings Ltd. (Interactive Media & Services) | | | 13,287,828 | |
| | 62,422 | | Yum China Holdings, Inc. (Hotels, Restaurants & Leisure) | | | 2,279,027 | |
| | | | | | | | |
| | | | | | | 19,505,101 | |
| | | |
| |
| | Denmark – 3.2% | |
| | 49,940 | | Carlsberg AS Class B (Beverages) | | | 6,717,572 | |
| | 319,169 | | Novo Nordisk AS Class B (Pharmaceuticals) | | | 40,930,934 | |
| | | | | | | | |
| | | | | | | 47,648,506 | |
| | | |
| |
| | France – 15.4% | |
| | 126,513 | | Air Liquide SA (Chemicals) | | | 24,743,243 | |
| | 748,571 | | Alstom SA (Machinery) | | | 11,803,522 | |
| | 166,745 | | AXA SA (Insurance) | | | 5,761,303 | |
| | 61,957 | | BNP Paribas SA (Banks) | | | 4,458,541 | |
| | 65,772 | | Capgemini SE (IT Services) | | | 13,824,025 | |
| | 302,087 | | Carrefour SA (Consumer Staples Distribution & Retail) | | | 5,082,077 | |
| | 152,162 | | Cie de Saint-Gobain SA (Building Products) | | | 12,033,373 | |
| | 148,628 | | Cie Generale des Etablissements Michelin SCA (Automobile Components) | | | 5,710,086 | |
| | 118,491 | | Danone SA (Food Products) | | | 7,416,036 | |
| | | |
| | | | | | | | |
| | | Shares | | Description | | Value | |
| |
| | Common Stocks (continued) | |
| |
| | France (continued) | |
| | 75,534 | | Dassault Systemes SE (Software) | | $ | 2,964,855 | |
| | 71,908 | | Edenred SE (Financial Services) | | | 3,412,169 | |
| | 476,383 | | Engie SA* (Multi-Utilities) | | | 8,270,299 | |
| | 47,169 | | EssilorLuxottica SA (Health Care Equipment & Supplies) | | | 10,057,922 | |
| | 32,488 | | Kering SA (Textiles, Apparel & Luxury Goods) | | | 11,386,043 | |
| | 53,517 | | Legrand SA (Electrical Equipment) | | | 5,499,761 | |
| | 18,640 | | L’Oreal SA (Personal Products) | | | 8,739,423 | |
| | 28,323 | | LVMH Moet Hennessy Louis Vuitton SE (Textiles, Apparel & Luxury Goods) | | | 23,265,532 | |
| | 43,636 | | Pernod Ricard SA (Beverages) | | | 6,599,601 | |
| | 58,270 | | Safran SA (Aerospace & Defense) | | | 12,634,806 | |
| | 74,378 | | Sanofi SA (Pharmaceuticals) | | | 7,348,030 | |
| | 120,369 | | Schneider Electric SE (Electrical Equipment) | | | 27,445,742 | |
| | 23,411 | | Valeo SE (Automobile Components) | | | 296,699 | |
| | 40,687 | | Vinci SA (Construction & Engineering) | | | 4,767,544 | |
| | 146,249 | | Worldline SA*(a) (Financial Services) | | | 1,516,967 | |
| | | | | | | | |
| | | | | | | 225,037,599 | |
| | | |
| |
| | Germany – 6.5% | |
| | 12,886 | | Allianz SE (Insurance) | | | 3,656,854 | |
| | 79,793 | | Beiersdorf AG (Personal Products) | | | 11,993,173 | |
| | 59,079 | | Deutsche Boerse AG (Capital Markets) | | | 11,389,955 | |
| | 459,964 | | Deutsche Telekom AG (Diversified Telecommunication Services) | | | 10,535,735 | |
| | 206,233 | | Infineon Technologies AG (Semiconductors & Semiconductor Equipment) | | | 7,156,912 | |
| | 198,874 | | Lanxess AG (Chemicals) | | | 5,620,781 | |
| | 58,341 | | Merck KGaA (Pharmaceuticals) | | | 9,270,482 | |
| | 14,956 | | MTU Aero Engines AG (Aerospace & Defense) | | | 3,603,153 | |
| | 173,983 | | RWE AG (Independent Power and Renewable Electricity Producers) | | | 6,060,791 | |
| | 143,894 | | SAP SE (Software) | | | 25,982,528 | |
| | | | | | | | |
| | | | | | | 95,270,364 | |
| | | |
| |
| | Hong Kong – 0.8% | |
| | 1,201,000 | | AIA Group Ltd. (Insurance) | | | 8,796,548 | |
| | 609,700 | | Link REIT (Retail REITs) | | | 2,612,437 | |
| | | | | | | | |
| | | | | | | 11,408,985 | |
| | | |
| |
| | India – 1.3% | |
| | 396,575 | | HDFC Bank Ltd. (Banks) | | | 7,202,033 | |
| | 382,070 | | ICICI Bank Ltd. (Banks) | | | 10,518,387 | |
| | | |
| | |
| The accompanying notes are an integral part of these financial statements. | | 7 |
MULTI-MANAGER INTERNATIONAL EQUITY FUND
|
Schedule of Investments (continued) April 30, 2024 (Unaudited) |
| | | | | | | | |
| | | Shares | | Description | | Value | |
| |
| | Common Stocks (continued) | |
| |
| | India (continued) | |
| | 46,551 | | Tata Consultancy Services Ltd. (IT Services) | | $ | 2,124,592 | |
| | | | | | | | |
| | | | | | | 19,845,012 | |
| | | |
| |
| | Ireland – 5.4% | |
| | 766,572 | | AIB Group PLC (Banks) | | | 3,967,909 | |
| | 37,390 | | Aon PLC Class A (Insurance) | | | 10,544,354 | |
| | 429,418 | | Experian PLC (Professional Services) | | | 17,320,122 | |
| | 56,600 | | ICON PLC* (Life Sciences Tools & Services) | | | 16,860,008 | |
| | 36,523 | | Linde PLC (Chemicals) | | | 16,105,182 | |
| | 104,561 | | Ryanair Holdings PLC (Passenger Airlines) | | | 14,241,208 | |
| | | | | | | | |
| | | | | | | 79,038,783 | |
| | | |
| |
| | Israel* – 0.4% | |
| | 35,599 | | Check Point Software Technologies Ltd. (Software) | | | 5,319,203 | |
| | | |
| |
| | Italy – 4.0% | |
| | 1,757,862 | | Enel SpA (Electric Utilities) | | | 11,553,444 | |
| | 449,206 | | Eni SpA (Oil, Gas & Consumable Fuels) | | | 7,215,006 | |
| | 45,760 | | Ferrari NV (Automobiles) | | | 18,819,926 | |
| | 2,549,302 | | Intesa Sanpaolo SpA (Banks) | | | 9,542,051 | |
| | 302,826 | | UniCredit SpA (Banks) | | | 11,115,037 | |
| | | | | | | | |
| | | | | | | 58,245,464 | |
| | | |
| |
| | Japan – 9.3% | |
| | 48,900 | | Daikin Industries Ltd. (Building Products) | | | 6,674,424 | |
| | 473,800 | | Denso Corp. (Automobile Components) | | | 8,075,029 | |
| | 424,200 | | FANUC Corp. (Machinery) | | | 12,564,500 | |
| | 279,700 | | Fujitsu Ltd. (IT Services) | | | 4,320,845 | |
| | 177,800 | | Hitachi Ltd. (Industrial Conglomerates) | | | 16,403,947 | |
| | 18,300 | | Hoya Corp. (Health Care Equipment & Supplies) | | | 2,121,699 | |
| | 57,100 | | Kose Corp. (Personal Products) | | | 2,944,308 | |
| | 156,600 | | Kubota Corp. (Machinery) | | | 2,511,821 | |
| | 460,600 | | Kyocera Corp. (Electronic Equipment, Instruments & Components) | | | 5,614,087 | |
| | 384,300 | | Mitsubishi Electric Corp. (Electrical Equipment) | | | 6,698,321 | |
| | 472,100 | | Murata Manufacturing Co. Ltd. (Electronic Equipment, Instruments & Components) | | | 8,626,286 | |
| | 372,500 | | Olympus Corp. (Health Care Equipment & Supplies) | | | 5,188,817 | |
| | 501,900 | | Renesas Electronics Corp. (Semiconductors & Semiconductor Equipment) | | | 8,148,724 | |
| | | |
| | | | | | | | |
| | | Shares | | Description | | Value | |
| |
| | Common Stocks (continued) | |
| |
| | Japan (continued) | |
| | 927,100 | | Seven & i Holdings Co. Ltd. (Consumer Staples Distribution & Retail) | | $ | 11,979,239 | |
| | 150,400 | | Shin-Etsu Chemical Co. Ltd. (Chemicals) | | | 5,821,824 | |
| | 10,300 | | SMC Corp. (Machinery) | | | 5,411,276 | |
| | 89,300 | | Sony Group Corp. (Household Durables) | | | 7,380,764 | |
| | 261,200 | | Takeda Pharmaceutical Co. Ltd. (Pharmaceuticals) | | | 6,864,876 | |
| | 331,700 | | Terumo Corp. (Health Care Equipment & Supplies) | | | 5,627,000 | |
| | 141,900 | | ZOZO, Inc. (Specialty Retail) | | | 3,056,309 | |
| | | | | | | | |
| | | | | | | 136,034,096 | |
| | | |
| |
| | Netherlands – 5.4% | |
| | 8,113 | | Adyen NV*(a) (Financial Services) | | | 9,719,375 | |
| | 175,910 | | Akzo Nobel NV (Chemicals) | | | 11,606,883 | |
| | 21,370 | | ASM International NV (Semiconductors & Semiconductor Equipment) | | | 13,442,561 | |
| | 13,710 | | ASML Holding NV (Semiconductors & Semiconductor Equipment) | | | 11,961,564 | |
| | 27,234 | | Heineken NV (Beverages) | | | 2,650,403 | |
| | 1,020,881 | | ING Groep NV (Banks) | | | 16,140,400 | |
| | 508,428 | | Koninklijke Philips NV (Health Care Equipment & Supplies) | | | 13,501,912 | |
| | | | | | | | |
| | | | | | | 79,023,098 | |
| | | |
| |
| | Portugal – 0.4% | |
| | 267,480 | | Galp Energia SGPS SA (Oil, Gas & Consumable Fuels) | | | 5,745,780 | |
| | | |
| |
| | Singapore – 0.9% | |
| | 299,780 | | DBS Group Holdings Ltd. (Banks) | | | 7,631,620 | |
| | 230,000 | | United Overseas Bank Ltd. (Banks) | | | 5,103,881 | |
| | | | | | | | |
| | | | | | | 12,735,501 | |
| | | |
| |
| | South Korea – 2.6% | |
| | 435,420 | | Coupang, Inc.* (Broadline Retail) | | | 9,796,950 | |
| | 121,113 | | Samsung Electronics Co. Ltd. (Technology Hardware, Storage & Peripherals) | | | 26,171,079 | |
| | 18,898 | | SK Hynix, Inc. (Semiconductors & Semiconductor Equipment) | | | 2,332,119 | |
| | | | | | | | |
| | | | | | | 38,300,148 | |
| | | |
| |
| | Spain – 1.5% | |
| | 38,444 | | Aena SME SA(a) (Transportation Infrastructure) | | | 7,006,019 | |
| | 182,390 | | Amadeus IT Group SA (Hotels, Restaurants & Leisure) | | | 11,577,009 | |
| | 320,905 | | Iberdrola SA (Electric Utilities) | | | 3,934,801 | |
| | | | | | | | |
| | | | | | | 22,517,829 | |
| | | |
| | |
| 8 | | The accompanying notes are an integral part of these financial statements. |
MULTI-MANAGER INTERNATIONAL EQUITY FUND
| | | | | | | | |
| | | Shares | | Description | | Value | |
| |
| | Common Stocks (continued) | |
| |
| | Sweden – 0.8% | |
| | 85,100 | | Assa Abloy AB Class B (Building Products) | | $ | 2,248,461 | |
| | 83,160 | | Evolution AB(a) (Hotels, Restaurants & Leisure) | | | 9,187,945 | |
| | | | | | | | |
| | | | | | | 11,436,406 | |
| | | |
| |
| | Switzerland – 4.6% | |
| | 78,217 | | Cie Financiere Richemont SA Class A (Textiles, Apparel & Luxury Goods) | | | 10,811,704 | |
| | 107,242 | | Julius Baer Group Ltd. (Capital Markets) | | | 5,754,429 | |
| | 175,887 | | Novartis AG (Pharmaceuticals) | | | 17,071,148 | |
| | 15,941 | | Sika AG (Chemicals) | | | 4,534,599 | |
| | 14,006 | | Sonova Holding AG (Health Care Equipment & Supplies) | | | 3,871,708 | |
| | 616,080 | | UBS Group AG (Capital Markets) | | | 16,180,274 | |
| | 18,140 | | Zurich Insurance Group AG (Insurance) | | | 8,780,600 | |
| | | | | | | | |
| | | | | | | 67,004,462 | |
| | | |
| |
| | Taiwan – 1.2% | |
| | 455,249 | | Taiwan Semiconductor Manufacturing Co. Ltd. (Semiconductors & Semiconductor Equipment) | | | 17,959,173 | |
| | | |
| |
| | United Kingdom – 18.1% | |
| | 182,930 | | AstraZeneca PLC (Pharmaceuticals) | | | 27,667,955 | |
| | 6,155,904 | | Barclays PLC (Banks) | | | 15,520,833 | |
| | 52,674 | | Berkeley Group Holdings PLC (Household Durables) | | | 3,093,313 | |
| | 2,449,071 | | BP PLC (Oil, Gas & Consumable Fuels) | | | 15,785,823 | |
| | 255,181 | | British American Tobacco PLC (Tobacco) | | | 7,491,163 | |
| | 866,489 | | Compass Group PLC (Hotels, Restaurants & Leisure) | | | 24,100,272 | |
| | 522,705 | | Diageo PLC (Beverages) | | | 18,064,513 | |
| | 57,230 | | Ferguson PLC (Trading Companies & Distributors) | | | 12,067,279 | |
| | 475,967 | | GSK PLC (Pharmaceuticals) | | | 9,874,845 | |
| | 974,267 | | Kingfisher PLC (Specialty Retail) | | | 3,001,058 | |
| | 1,605,992 | | Legal & General Group PLC (Insurance) | | | 4,714,389 | |
| | 66,635 | | London Stock Exchange Group PLC (Capital Markets) | | | 7,345,847 | |
| | 1,086,133 | | NatWest Group PLC (Banks) | | | 4,099,480 | |
| | 1,827,817 | | Prudential PLC (Insurance) | | | 15,897,160 | |
| | 233,318 | | Reckitt Benckiser Group PLC (Household Products) | | | 13,044,110 | |
| | 425,578 | | RELX PLC (Professional Services) | | | 17,490,159 | |
| | 73,656 | | Rio Tinto PLC (Metals & Mining) | | | 4,983,618 | |
| | 6,247,900 | | Rolls-Royce Holdings PLC* (Aerospace & Defense) | | | 32,039,381 | |
| | | |
| | | | | | | | |
| | | Shares | | Description | | Value | |
| |
| | Common Stocks (continued) | |
| |
| | United Kingdom (continued) | |
| | 334,913 | | Segro PLC (Industrial REITs) | | $ | 3,522,656 | |
| | 443,029 | | Shell PLC (Oil, Gas & Consumable Fuels) | | | 15,831,108 | |
| | 1,316,708 | | Tesco PLC (Consumer Staples Distribution & Retail) | | | 4,861,376 | |
| | 302,720 | | WH Smith PLC (Specialty Retail) | | | 4,140,691 | |
| | | | | | | | |
| | | | | | | 264,637,029 | |
| | | |
| |
| | United States – 6.2% | |
| | 2,151 | | Accenture PLC Class A (IT Services) | | | 647,257 | |
| | 64,950 | | Atlassian Corp. Class A* (Software) | | | 11,190,885 | |
| | 19,680 | | EPAM Systems, Inc.* (IT Services) | | | 4,629,917 | |
| | 26,220 | | Monday.com Ltd.* (Software) | | | 4,964,233 | |
| | 151,919 | | Nestle SA (Food Products) | | | 15,252,691 | |
| | 107,368 | | Qiagen NV* (Life Sciences Tools & Services) | | | 4,482,792 | |
| | 101,368 | | Roche Holding AG (Pharmaceuticals) | | | 24,289,212 | |
| | 28,060 | | Spotify Technology SA* (Entertainment) | | | 7,869,146 | |
| | 40,080 | | STERIS PLC (Health Care Equipment & Supplies) | | | 8,198,765 | |
| | 54,040 | | Waste Connections, Inc. (Commerical Services & Supplies) | | | 8,759,344 | |
| | | | | | | | |
| | | | | | | 90,284,242 | |
| | | |
| |
| | Uruguay* – 0.8% | |
| | 7,710 | | MercadoLibre, Inc. (Broadline Retail) | | | 11,246,577 | |
| | | |
| | TOTAL COMMON STOCKS (Cost $1,135,496,036) | | $ | 1,418,710,774 | |
| | | |
| | | |
| | | Shares | | Dividend Rate | | Value | |
| |
| | Investment Company(b) – 2.3% | |
| | |
| | Goldman Sachs Financial Square Government Fund — Institutional Shares | | | | |
| | 33,345,532 | | 5.223% | | $ | 33,345,532 | |
| | (Cost $33,345,532) | | | | |
| | | |
| | TOTAL INVESTMENTS – 99.3% (Cost $1,168,841,568) | | $ | 1,452,056,306 | |
| | | |
| | OTHER ASSETS IN EXCESS OF
LIABILITIES – 0.7% | | | 10,436,728 | |
| | | |
| | NET ASSETS – 100.0% | | $ | 1,462,493,034 | |
| | | |
| | |
| The percentage shown for each investment category reflects the value of investments in that category as a percentage of net assets. |
| |
| * | | Non-income producing security. |
| | |
| The accompanying notes are an integral part of these financial statements. | | 9 |
MULTI-MANAGER INTERNATIONAL EQUITY FUND
|
Schedule of Investments (continued) April 30, 2024 (Unaudited) |
| | |
| |
| (a) | | Exempt from registration under Rule 144A of the Securities Act of 1933. |
| |
| (b) | | Represents an Affiliated Issuer. |
| | |
|
| SECTOR ALLOCATION AS OF APRIL 30, 2024 |
| |
| Sector | | % of Total Market Value |
| |
Industrials | | 19.4% |
| |
Financials | | 16.8 |
| |
Health Care | | 14.7 |
| |
Information Technology | | 12.2 |
| |
Consumer Discretionary | | 11.5 |
| |
Consumer Staples | | 9.1 |
| |
Materials | | 5.1 |
| |
Energy | | 4.0 |
| |
Communication Services | | 2.5 |
| |
Investment Company | | 2.3 |
| |
Utilities | | 2.0 |
| |
Real Estate | | 0.4 |
| |
| | | 100.0% |
|
|
ADDITIONAL INVESTMENT INFORMATION |
FORWARD FOREIGN CURRENCY EXCHANGE CONTRACTS — At April 30, 2024, the Fund had the following forward foreign currency exchange contracts:
FORWARD FOREIGN CURRENCY EXCHANGE CONTRACTS WITH UNREALIZED LOSS
| | | | | | | | | | | | | | | | | | | | | | | | | | |
| Counterparty | | Currency Purchased | | | | | | Currency Sold | | | | | | Settlement
Date | | | | Unrealized Loss |
|
|
| | | | | | | | | |
State Street Bank and Trust | | EUR | | | 186,881 | | | | | | | USD | | | 199,578 | | | | | | | 05/03/24 | | | | $(116) |
|
|
| | |
|
|
| Currency Abbreviations: |
| EUR | | —Euro |
| USD | | —U.S. Dollar |
|
|
| | |
|
|
| Investment Abbreviations: |
| PLC | | —Public Limited Company |
| REIT | | —Real Estate Investment Trust |
|
|
| | |
| 10 | | The accompanying notes are an integral part of these financial statements. |
MULTI-MANAGER U.S. SMALL CAP EQUITY FUND
|
Schedule of Investments April 30, 2024 (Unaudited) |
| | | | | | | | |
| | | Shares | | Description | | Value | |
| |
| | Common Stocks – 96.3% | |
| |
| | Aerospace & Defense – 1.1% | |
| | 20,963 | | AAR Corp.* | | $ | 1,449,382 | |
| | 11,990 | | Curtiss-Wright Corp. | | | 3,038,506 | |
| | 12,510 | | Hexcel Corp. | | | 803,267 | |
| | 43,500 | | Mercury Systems, Inc.* | | | 1,226,700 | |
| | 17,892 | | Woodward, Inc. | | | 2,904,945 | |
| | | | | | | | |
| | | | | | | 9,422,800 | |
| | | |
| |
| | Air Freight & Logistics – 0.5% | |
| | 89,600 | | Air Transport Services Group, Inc.* | | | 1,148,672 | |
| | 73,600 | | Hub Group, Inc. Class A | | | 2,960,192 | |
| | | | | | | | |
| | | | | | | 4,108,864 | |
| | | |
| |
| | Automobile Components – 0.7% | |
| | 12,100 | | LCI Industries | | | 1,258,158 | |
| | 28,527 | | Phinia, Inc. | | | 1,112,553 | |
| | 24,300 | | Visteon Corp.* | | | 2,688,309 | |
| | 10,299 | | XPEL, Inc.* | | | 541,212 | |
| | | | | | | | |
| | | | | | | 5,600,232 | |
| | | |
| |
| | Automobiles – 0.1% | |
| | 8,650 | | Thor Industries, Inc. | | | 859,983 | |
| | | |
| |
| | Banks – 5.1% | |
| | 23,275 | | Bank of Hawaii Corp. | | | 1,319,460 | |
| | 29,264 | | Dime Community Bancshares, Inc. | | | 532,605 | |
| | 42,791 | | First Merchants Corp. | | | 1,430,075 | |
| | 28,839 | | Hancock Whitney Corp. | | | 1,309,002 | |
| | 74,850 | | Heritage Commerce Corp. | | | 594,309 | |
| | 74,593 | | Hope Bancorp, Inc. | | | 747,422 | |
| | 23,200 | | Independent Bank Corp. | | | 1,165,568 | |
| | 35,400 | | Lakeland Financial Corp. | | | 2,080,458 | |
| | 90,954 | | OceanFirst Financial Corp. | | | 1,342,481 | |
| | 91,561 | | Old National Bancorp | | | 1,514,419 | |
| | 36,311 | | Peapack-Gladstone Financial Corp. | | | 812,640 | |
| | 19,839 | | Preferred Bank | | | 1,501,614 | |
| | 78,825 | | Prosperity Bancshares, Inc. | | | 4,884,785 | |
| | 91,500 | | Renasant Corp. | | | 2,658,990 | |
| | 26,741 | | S&T Bancorp, Inc. | | | 806,241 | |
| | 54,957 | | SouthState Corp. | | | 4,160,245 | |
| | 41,000 | | UMB Financial Corp. | | | 3,266,060 | |
| | 86,200 | | United Bankshares, Inc. | | | 2,798,052 | |
| | 38,316 | | Western Alliance Bancorp | | | 2,177,498 | |
| | 81,332 | | Wintrust Financial Corp. | | | 7,859,925 | |
| | | | | | | | |
| | | | | | | 42,961,849 | |
| | | |
| |
| | Biotechnology* – 5.0% | |
| | 162,230 | | 89bio, Inc. | | | 1,380,577 | |
| | 91,772 | | Alkermes PLC | | | 2,252,085 | |
| | 89,708 | | Ascendis Pharma AS | | | 12,419,175 | |
| | 90,620 | | Bicycle Therapeutics PLC | | | 2,125,039 | |
| | 18,188 | | Blueprint Medicines Corp. | | | 1,661,292 | |
| | 59,152 | | Catalyst Pharmaceuticals, Inc. | | | 890,238 | |
| | 50,077 | | Cytokinetics, Inc. | | | 3,070,722 | |
| | 20,816 | | Halozyme Therapeutics, Inc. | | | 793,090 | |
| | 21,978 | | Immunome, Inc. | | | 309,011 | |
| | 64,538 | | MoonLake Immunotherapeutics | | | 2,640,249 | |
| | | |
| | | | | | | | |
| | | Shares | | Description | | Value | |
| |
| | Common Stocks – (continued) | |
| |
| | Biotechnology* – (continued) | |
| | 89,941 | | Mural Oncology PLC | | $ | 332,782 | |
| | 28,204 | | Neurocrine Biosciences, Inc. | | | 3,879,178 | |
| | 137,890 | | Rocket Pharmaceuticals, Inc. | | | 2,967,393 | |
| | 66,354 | | Vaxcyte, Inc. | | | 4,017,735 | |
| | 26,070 | | Viking Therapeutics, Inc. | | | 2,074,650 | |
| | 37,830 | | Xenon Pharmaceuticals, Inc. | | | 1,537,789 | |
| | | | | | | | |
| | | | | | | 42,351,005 | |
| | | |
| |
| | Building Products – 2.3% | |
| | 26,100 | | Apogee Enterprises, Inc. | | | 1,612,458 | |
| | 157,044 | | AZEK Co., Inc.* | | | 7,167,488 | |
| | 19,100 | | Gibraltar Industries, Inc.* | | | 1,364,886 | |
| | 19,030 | | Griffon Corp. | | | 1,246,846 | |
| | 100,000 | | Hayward Holdings, Inc.* | | | 1,358,000 | |
| | 150,824 | | Janus International Group, Inc.* | | | 2,173,374 | |
| | 18,300 | | UFP Industries, Inc. | | | 2,062,410 | |
| | 90,479 | | Zurn Elkay Water Solutions Corp. | | | 2,830,183 | |
| | | | | | | | |
| | | | | | | 19,815,645 | |
| | | |
| |
| | Capital Markets – 1.4% | |
| | 340,534 | | BGC Group, Inc. Class A | | | 2,666,381 | |
| | 39,400 | | Cohen & Steers, Inc. | | | 2,709,932 | |
| | 20,945 | | Evercore, Inc. Class A | | | 3,801,517 | |
| | 12,689 | | Houlihan Lokey, Inc. | | | 1,617,721 | |
| | 18,293 | | StoneX Group, Inc.* | | | 1,328,072 | |
| | | | | | | | |
| | | | | | | 12,123,623 | |
| | | |
| |
| | Chemicals – 3.6% | |
| | 58,975 | | AdvanSix, Inc. | | | 1,489,709 | |
| | 15,921 | | Ashland, Inc. | | | 1,517,749 | |
| | 97,380 | | Avient Corp. | | | 4,130,860 | |
| | 129,320 | | Axalta Coating Systems Ltd.* | | | 4,065,821 | |
| | 152,075 | | Ecovyst, Inc.* | | | 1,434,067 | |
| | 88,420 | | HB Fuller Co. | | | 6,605,858 | |
| | 22,000 | | Innospec, Inc. | | | 2,640,000 | |
| | 23,931 | | Methanex Corp. | | | 1,146,534 | |
| | 30,900 | | Minerals Technologies, Inc. | | | 2,252,301 | |
| | 27,294 | | Orion SA | | | 645,776 | |
| | 17,665 | | Quaker Chemical Corp. | | | 3,295,052 | |
| | 16,400 | | Stepan Co. | | | 1,361,036 | |
| | | | | | | | |
| | | | | | | 30,584,763 | |
| | | |
| |
| | Commerical Services & Supplies – 4.0% | |
| | 17,705 | | Brady Corp. Class A | | | 1,044,595 | |
| | 52,765 | | Brink’s Co. | | | 4,614,827 | |
| | 100,301 | | Casella Waste Systems, Inc. Class A* | | | 9,067,210 | |
| | 130,743 | | CoreCivic, Inc.* | | | 1,948,071 | |
| | 20,347 | | MSA Safety, Inc. | | | 3,670,599 | |
| | 86,084 | | Rentokil Initial PLC | | | 2,205,472 | |
| | 13,900 | | UniFirst Corp. | | | 2,225,807 | |
| | 37,103 | | Vestis Corp. | | | 683,437 | |
| | 72,775 | | Viad Corp.* | | | 2,509,282 | |
| | 36,562 | | Waste Connections, Inc. | | | 5,926,335 | |
| | | | | | | | |
| | | | | | | 33,895,635 | |
| | | |
| | |
| The accompanying notes are an integral part of these financial statements. | | 11 |
MULTI-MANAGER U.S. SMALL CAP EQUITY FUND
|
Schedule of Investments (continued) April 30, 2024 (Unaudited) |
| | | | | | | | |
| | | Shares | | Description | | Value | |
| |
| | Common Stocks – (continued) | |
| |
| | Communications Equipment* – 0.9% | |
| | 29,300 | | Ciena Corp. | | $ | 1,354,539 | |
| | 34,029 | | Clearfield, Inc. | | | 1,024,954 | |
| | 15,490 | | F5, Inc. | | | 2,560,652 | |
| | 530,755 | | Infinera Corp. | | | 2,558,239 | |
| | | | | | | | |
| | | | | | | 7,498,384 | |
| | | |
| |
| | Construction & Engineering – 2.5% | |
| | 23,520 | | Comfort Systems USA, Inc. | | | 7,277,323 | |
| | 65,175 | | Fluor Corp.* | | | 2,628,508 | |
| | 29,374 | | Granite Construction, Inc. | | | 1,630,257 | |
| | 6,500 | | MYR Group, Inc.* | | | 1,080,625 | |
| | 33,992 | | Primoris Services Corp. | | | 1,584,027 | |
| | 17,842 | | Valmont Industries, Inc. | | | 3,654,042 | |
| | 93,980 | | WillScot Mobile Mini Holdings Corp.* | | | 3,473,501 | |
| | | | | | | | |
| | | | | | | 21,328,283 | |
| | | |
| |
| | Construction Materials – 0.3% | |
| | 2,900 | | Eagle Materials, Inc. | | | 727,059 | |
| | 8,981 | | Knife River Corp.* | | | 702,224 | |
| | 37,400 | | Summit Materials, Inc. Class A* | | | 1,454,860 | |
| | | | | | | | |
| | | | | | | 2,884,143 | |
| | | |
| |
| | Consumer Finance – 1.0% | |
| | 27,214 | | FirstCash Holdings, Inc. | | | 3,074,638 | |
| | 253,518 | | SLM Corp. | | | 5,372,046 | |
| | | | | | | | |
| | | | | | | 8,446,684 | |
| | | |
| |
| | Consumer Staples Distribution & Retail – 0.8% | |
| | 15,261 | | Casey’s General Stores, Inc. | | | 4,877,110 | |
| | 29,200 | | Performance Food Group Co.* | | | 1,982,096 | |
| | | | | | | | |
| | | | | | | 6,859,206 | |
| | | |
| |
| | Containers & Packaging – 0.6% | |
| | 59,200 | | Silgan Holdings, Inc. | | | 2,762,272 | |
| | 47,700 | | Sonoco Products Co. | | | 2,673,585 | |
| | | | | | | | |
| | | | | | | 5,435,857 | |
| | | |
| |
| | Diversified Consumer Services – 2.1% | |
| | 66,432 | | Bright Horizons Family Solutions, Inc.* | | | 6,889,663 | |
| | 99,685 | | Frontdoor, Inc.* | | | 3,059,333 | |
| | 9,110 | | Grand Canyon Education, Inc.* | | | 1,184,482 | |
| | 148,541 | | Laureate Education, Inc. | | | 2,153,844 | |
| | 497,995 | | Mister Car Wash, Inc.* | | | 3,331,586 | |
| | 59,126 | | Perdoceo Education Corp. | | | 1,082,006 | |
| | | | | | | | |
| | | | | | | 17,700,914 | |
| | | |
| |
| | Diversified Telecommunication Services – 0.3% | |
| | 38,906 | | Cogent Communications Holdings, Inc. | | | 2,496,987 | |
| | | |
| |
| | Electric Utilities – 0.6% | |
| | 32,200 | | IDACORP, Inc. | | | 3,051,916 | |
| | 22,900 | | MGE Energy, Inc. | | | 1,793,528 | |
| | | |
| | | | | | | | |
| | | Shares | | Description | | Value | |
| |
| | Common Stocks – (continued) | |
| |
| | Electric Utilities – (continued) | |
| | 11,097 | | Portland General Electric Co. | | $ | 479,723 | |
| | | | | | | | |
| | | | | | | 5,325,167 | |
| | | |
| |
| | Electrical Equipment – 2.1% | |
| | 10,822 | | Acuity Brands, Inc. | | | 2,687,103 | |
| | 12,681 | | Atkore, Inc. | | | 2,222,979 | |
| | 4,668 | | Encore Wire Corp. | | | 1,304,052 | |
| | 14,540 | | EnerSys | | | 1,315,143 | |
| | 99,510 | | NEXTracker, Inc. Class A* | | | 4,258,033 | |
| | 150,250 | | Sensata Technologies Holding PLC | | | 5,756,078 | |
| | | | | | | | |
| | | | | | | 17,543,388 | |
| | | |
| |
| | Electronic Equipment, Instruments & Components – 3.5% | |
| | 23,100 | | Advanced Energy Industries, Inc. | | | 2,213,904 | |
| | 9,083 | | Arrow Electronics, Inc.* | | | 1,159,627 | |
| | 51,679 | | Avnet, Inc. | | | 2,525,553 | |
| | 14,466 | | Belden, Inc. | | | 1,175,652 | |
| | 39,840 | | Coherent Corp.* | | | 2,176,459 | |
| | 24,700 | | Crane NXT Co. | | | 1,502,007 | |
| | 13,580 | | Fabrinet* | | | 2,350,290 | |
| | 37,105 | | Insight Enterprises, Inc.* | | | 6,774,260 | |
| | 20,384 | | Littelfuse, Inc. | | | 4,701,366 | |
| | 13,030 | | OSI Systems, Inc.* | | | 1,712,663 | |
| | 20,300 | | Rogers Corp.* | | | 2,417,527 | |
| | 20,375 | | ScanSource, Inc.* | | | 848,007 | |
| | | | | | | | |
| | | | | | | 29,557,315 | |
| | | |
| |
| | Energy Equipment & Services – 3.5% | |
| | 60,136 | | Archrock, Inc. | | | 1,154,010 | |
| | 52,310 | | Cactus, Inc. Class A | | | 2,596,668 | |
| | 269,082 | | ChampionX Corp. | | | 9,033,083 | |
| | 92,464 | | Expro Group Holdings NV* | | | 1,734,625 | |
| | 66,100 | | Helmerich & Payne, Inc. | | | 2,599,713 | |
| | 32,555 | | Noble Corp. PLC | | | 1,444,791 | |
| | 369,981 | | Patterson-UTI Energy, Inc. | | | 4,003,194 | |
| | 157,701 | | Select Water Solutions, Inc. | | | 1,457,157 | |
| | 21,127 | | Tidewater, Inc.* | | | 1,940,515 | |
| | 53,468 | | U.S. Silica Holdings, Inc.* | | | 825,011 | |
| | 22,803 | | Weatherford International PLC* | | | 2,818,907 | |
| | | | | | | | |
| | | | | | | 29,607,674 | |
| | | |
| |
| | Entertainment* – 0.4% | |
| | 20,878 | | Liberty Media Corp.-Liberty Live | | | | |
| | | | Class A | | | 748,685 | |
| | 11,299 | | Take-Two Interactive Software, Inc. | | | 1,613,610 | |
| | 140,589 | | Vivid Seats, Inc. Class A | | | 739,498 | |
| | | | | | | | |
| | | | | | | 3,101,793 | |
| | | |
| |
| | Financial Services – 3.6% | |
| | 30,662 | | Enact Holdings, Inc. | | | 911,581 | |
| | 43,949 | | Essent Group Ltd. | | | 2,327,978 | |
| | 46,600 | | EVERTEC, Inc. | | | 1,748,898 | |
| | 22,690 | | Federal Agricultural Mortgage Corp. Class C | | | 4,223,290 | |
| | 156,550 | | Flywire Corp.* | | | 3,209,275 | |
| | | |
| | |
| 12 | | The accompanying notes are an integral part of these financial statements. |
MULTI-MANAGER U.S. SMALL CAP EQUITY FUND
| | | | | | | | |
| | | Shares | | Description | | Value | |
| |
| | Common Stocks – (continued) | |
| |
| | Financial Services – (continued) | |
| | 32,907 | | International Money Express, Inc.* | | $ | 665,709 | |
| | 234,730 | | Marqeta, Inc. Class A* | | | 1,302,751 | |
| | 73,100 | | NCR Atleos Corp.* | | | 1,456,883 | |
| | 12,625 | | PennyMac Financial Services, Inc. | | | 1,081,205 | |
| | 59,880 | | Shift4 Payments, Inc. Class A* | | | 3,464,657 | |
| | 19,969 | | Voya Financial, Inc. | | | 1,361,087 | |
| | 27,132 | | Walker & Dunlop, Inc. | | | 2,486,105 | |
| | 30,257 | | WEX, Inc.* | | | 6,392,094 | |
| | | | | | | | |
| | | | | | | 30,631,513 | |
| | | |
| |
| | Food Products – 0.4% | |
| | 78,221 | | Nomad Foods Ltd. | | | 1,412,671 | |
| | 60,464 | | Simply Good Foods Co.* | | | 2,203,913 | |
| | | | | | | | |
| | | | | | | 3,616,584 | |
| | | |
| |
| | Gas Utilities – 0.2% | |
| | 18,901 | | New Jersey Resources Corp. | | | 825,785 | |
| | 19,550 | | ONE Gas, Inc. | | | 1,261,366 | |
| | | | | | | | |
| | | | | | | 2,087,151 | |
| | | |
| |
| | Ground Transportation – 0.9% | |
| | 3,025 | | Knight-Swift Transportation | | | | |
| | | | Holdings, Inc. | | | 139,846 | |
| | 98,400 | | Marten Transport Ltd. | | | 1,664,928 | |
| | 7,197 | | Saia, Inc.* | | | 2,855,985 | |
| | 82,900 | | Werner Enterprises, Inc. | | | 2,835,180 | |
| | | | | | | | |
| | | | | | | 7,495,939 | |
| | | |
| |
| | Health Care Equipment & Supplies* – 3.8% | |
| | 76,446 | | Establishment Labs Holdings, Inc. | | | 3,823,064 | |
| | 71,642 | | Haemonetics Corp. | | | 6,587,482 | |
| | 58,606 | | Inari Medical, Inc. | | | 2,188,348 | |
| | 12,100 | | Inspire Medical Systems, Inc. | | | 2,924,086 | |
| | 15,400 | | Integer Holdings Corp. | | | 1,719,102 | |
| | 24,000 | | Integra LifeSciences Holdings Corp. | | | 700,080 | |
| | 36,003 | | iRhythm Technologies, Inc. | | | 3,945,209 | |
| | 91,894 | | Lantheus Holdings, Inc. | | | 6,114,627 | |
| | 57,742 | | OrthoPediatrics Corp. | | | 1,710,895 | |
| | 155,950 | | SI-BONE, Inc. | | | 2,223,847 | |
| | | | | | | | |
| | | | | | | 31,936,740 | |
| | | |
| |
| | Health Care Providers & Services – 3.2% | |
| | 191,917 | | Accolade, Inc.* | | | 1,464,327 | |
| | 7,915 | | Addus HomeCare Corp.* | | | 761,027 | |
| | 56,276 | | agilon health, Inc.* | | | 309,518 | |
| | 9,626 | | Amedisys, Inc.* | | | 886,073 | |
| | 20,411 | | AMN Healthcare Services, Inc.* | | | 1,224,252 | |
| | 1,122 | | Chemed Corp. | | | 637,296 | |
| | 44,902 | | Encompass Health Corp. | | | 3,743,929 | |
| | 48,759 | | HealthEquity, Inc.* | | | 3,847,573 | |
| | 212,041 | | LifeStance Health Group, Inc.* | | | 1,310,413 | |
| | 300,749 | | NeoGenomics, Inc.* | | | 4,186,426 | |
| | 184,010 | | Option Care Health, Inc.* | | | 5,500,059 | |
| | 70,911 | | Pediatrix Medical Group, Inc.* | | | 628,981 | |
| | 65,832 | | PetIQ, Inc.* | | | 1,074,378 | |
| | | |
| | | | | | | | |
| | | Shares | | Description | | Value | |
| |
| | Common Stocks – (continued) | |
| |
| | Health Care Providers & Services – (continued) | |
| | 102,953 | | R1 RCM, Inc.* | | $ | 1,265,292 | |
| | | | | | | | |
| | | | | | | 26,839,544 | |
| | | |
| |
| | Health Care Technology* – 0.5% | |
| | 140,703 | | Definitive Healthcare Corp. | | | 976,479 | |
| | 144,232 | | Phreesia, Inc. | | | 2,991,372 | |
| | | | | | | | |
| | | | | | | 3,967,851 | |
| | | |
| |
| | Hotel & Resort REITs – 0.2% | |
| | 115,400 | | Apple Hospitality REIT, Inc. | | | 1,703,304 | |
| | | |
| |
| | Hotels, Restaurants & Leisure – 2.6% | |
| | 150,013 | | Bowlero Corp. Class A | | | 1,762,653 | |
| | 14,865 | | Boyd Gaming Corp. | | | 795,426 | |
| | 20,558 | | Brinker International, Inc.* | | | 1,101,909 | |
| | 23,400 | | Choice Hotels International, Inc. | | | 2,767,284 | |
| | 40,075 | | Churchill Downs, Inc. | | | 5,169,675 | |
| | 41,532 | | First Watch Restaurant Group, Inc.* | | | 1,059,897 | |
| | 22,530 | | Texas Roadhouse, Inc. | | | 3,622,373 | |
| | 14,860 | | Wingstop, Inc. | | | 5,717,979 | |
| | | | | | | | |
| | | | | | | 21,997,196 | |
| | | |
| |
| | Household Durables – 2.0% | |
| | 37,300 | | Beazer Homes USA, Inc.* | | | 1,045,519 | |
| | 12,450 | | Installed Building Products, Inc. | | | 2,934,838 | |
| | 28,376 | | M/I Homes, Inc.* | | | 3,297,859 | |
| | 33,684 | | Meritage Homes Corp. | | | 5,582,786 | |
| | 6,539 | | TopBuild Corp.* | | | 2,646,137 | |
| | 121,936 | | Vizio Holding Corp. Class A* | | | 1,292,522 | |
| | | | | | | | |
| | | | | | | 16,799,661 | |
| | | |
| |
| | Household Products* – 0.3% | |
| | 67,800 | | Central Garden & Pet Co. Class A | | | 2,402,154 | |
| | | |
| |
| | Industrial REITs – 0.8% | |
| | 15,844 | | EastGroup Properties, Inc. | | | 2,461,524 | |
| | 36,200 | | First Industrial Realty Trust, Inc. | | | 1,644,204 | |
| | 64,970 | | STAG Industrial, Inc. | | | 2,234,318 | |
| | | | | | | | |
| | | | | | | 6,340,046 | |
| | | |
| |
| | Insurance – 4.4% | |
| | 25,000 | | AMERISAFE, Inc. | | | 1,140,000 | |
| | 33,957 | | Assured Guaranty Ltd. | | | 2,604,502 | |
| | 79,130 | | Axis Capital Holdings Ltd. | | | 4,853,043 | |
| | 32,337 | | BRP Group, Inc. Class A* | | | 861,458 | |
| | 20,577 | | Employers Holdings, Inc. | | | 876,374 | |
| | 66,927 | | First American Financial Corp. | | | 3,585,279 | |
| | 24,200 | | Hanover Insurance Group, Inc. | | | 3,141,644 | |
| | 5,970 | | Kinsale Capital Group, Inc. | | | 2,168,603 | |
| | 30,416 | | Palomar Holdings, Inc.* | | | 2,392,827 | |
| | 15,290 | | Primerica, Inc. | | | 3,239,339 | |
| | 37,700 | | Ryan Specialty Holdings, Inc. | | | 1,860,118 | |
| | 28,600 | | Safety Insurance Group, Inc. | | | 2,275,702 | |
| | 42,745 | | Selective Insurance Group, Inc. | | | 4,345,029 | |
| | 16,400 | | Stewart Information Services Corp. | | | 1,016,964 | |
| | | |
| | |
| The accompanying notes are an integral part of these financial statements. | | 13 |
MULTI-MANAGER U.S. SMALL CAP EQUITY FUND
|
Schedule of Investments (continued) April 30, 2024 (Unaudited) |
| | | | | | | | |
| | | Shares | | Description | | Value | |
| |
| | Common Stocks – (continued) | |
| |
| | Insurance – (continued) | |
| | 1,435 | | White Mountains Insurance Group Ltd. | | $ | 2,551,631 | |
| | | | | | | | |
| | | | | | | 36,912,513 | |
| | | |
| |
| | Interactive Media & Services* – 0.6% | |
| | 47,851 | | Bumble, Inc. Class A | | | 483,295 | |
| | 67,047 | | Cars.com, Inc. | | | 1,120,355 | |
| | 82,228 | | Pinterest, Inc. Class A | | | 2,750,527 | |
| | 41,777 | | TripAdvisor, Inc. | | | 1,099,989 | |
| | | | | | | | |
| | | | | | | 5,454,166 | |
| | | |
| |
| | IT Services – 0.2% | |
| | 31,324 | | Hackett Group, Inc. | | | 679,418 | |
| | 26,650 | | Perficient, Inc.* | | | 1,259,479 | |
| | | | | | | | |
| | | | | | | 1,938,897 | |
| | | |
| |
| | Leisure Products – 0.7% | |
| | 15,300 | | Acushnet Holdings Corp. | | | 932,994 | |
| | 17,100 | | Brunswick Corp. | | | 1,378,944 | |
| | 193,467 | | Clarus Corp. | | | 1,224,646 | |
| | 135,900 | | Mattel, Inc.* | | | 2,489,688 | |
| | 126,975 | | Solo Brands, Inc. Class A* | | | 238,713 | |
| | | | | | | | |
| | | | | | | 6,264,985 | |
| | | |
| |
| | Life Sciences Tools & Services – 1.4% | |
| | 7,010 | | Bio-Rad Laboratories, Inc. Class A* | | | 1,890,947 | |
| | 27,567 | | Bio-Techne Corp. | | | 1,742,510 | |
| | 39,555 | | Bruker Corp. | | | 3,085,686 | |
| | 10,000 | | Charles River Laboratories International, Inc.* | | | 2,290,000 | |
| | 42,330 | | Fortrea Holdings, Inc.* | | | 1,548,855 | |
| | 26,400 | | Qiagen NV* | | | 1,117,512 | |
| | | | | | | | |
| | | | | | | 11,675,510 | |
| | | |
| |
| | Machinery – 4.6% | |
| | 8,000 | | Alamo Group, Inc. | | | 1,555,040 | |
| | 12,450 | | Albany International Corp. Class A | | | 992,888 | |
| | 34,048 | | Allison Transmission Holdings, Inc. | | | 2,504,230 | |
| | 41,500 | | Astec Industries, Inc. | | | 1,734,700 | |
| | 33,076 | | Atmus Filtration Technologies, Inc.* | | | 1,001,872 | |
| | 25,044 | | Blue Bird Corp.* | | | 825,325 | |
| | 7,848 | | Chart Industries, Inc.* | | | 1,130,583 | |
| | 8,825 | | Crane Co. | | | 1,235,588 | |
| | 10,809 | | Enpro, Inc. | | | 1,622,755 | |
| | 63,050 | | Hillenbrand, Inc. | | | 3,008,746 | |
| | 7,817 | | IDEX Corp. | | | 1,723,336 | |
| | 42,880 | | ITT, Inc. | | | 5,546,099 | |
| | 46,376 | | John Bean Technologies Corp. | | | 4,131,638 | |
| | 67,700 | | Kennametal, Inc. | | | 1,592,981 | |
| | 13,480 | | Lincoln Electric Holdings, Inc. | | | 2,959,264 | |
| | 27,900 | | Mueller Industries, Inc. | | | 1,557,378 | |
| | 123,172 | | Mueller Water Products, Inc. Class A | | | 1,951,045 | |
| | 12,600 | | SPX Technologies, Inc.* | | | 1,534,806 | |
| | | |
| | | | | | | | |
| | | Shares | | Description | | Value | |
| |
| | Common Stocks – (continued) | |
| |
| | Machinery – (continued) | |
| | 10,500 | | Watts Water Technologies, Inc. Class A | | $ | 2,083,830 | |
| | | | | | | | |
| | | | | | | 38,692,104 | |
| | | |
| |
| | Media – 0.7% | |
| | 101,850 | | EW Scripps Co. Class A* | | | 382,956 | |
| | 15,166 | | Nexstar Media Group, Inc. | | | 2,427,470 | |
| | 122,130 | | Stagwell, Inc.* | | | 726,674 | |
| | 155,846 | | TEGNA, Inc. | | | 2,125,739 | |
| | | | | | | | |
| | | | | | | 5,662,839 | |
| | | |
| |
| | Metals & Mining – 0.7% | |
| | 38,329 | | Commercial Metals Co. | | | 2,059,800 | |
| | 85,415 | | Eldorado Gold Corp.* | | | 1,218,018 | |
| | 23,675 | | Kaiser Aluminum Corp. | | | 2,142,351 | |
| | 56,000 | | MP Materials Corp.* | | | 896,000 | |
| | | | | | | | |
| | | | | | | 6,316,169 | |
| | | |
| |
| | Mortgage Real Estate Investment Trusts (REITs) – 0.1% | |
| | 111,640 | | Redwood Trust, Inc. | | | 617,369 | |
| | | |
| |
| | Multi-Utilities – 0.2% | |
| | 29,100 | | Northwestern Energy Group, Inc. | | | 1,467,804 | |
| | | |
| |
| | Office REITs – 0.4% | |
| | 84,400 | | COPT Defense Properties | | | 2,023,068 | |
| | 44,521 | | Cousins Properties, Inc. | | | 1,021,312 | |
| | | | | | | | |
| | | | | | | 3,044,380 | |
| | | |
| |
| | Oil, Gas & Consumable Fuels – 2.8% | |
| | 47,200 | | Civitas Resources, Inc. | | | 3,396,512 | |
| | 57,550 | | Delek U.S. Holdings, Inc. | | | 1,572,841 | |
| | 165,271 | | Kosmos Energy Ltd.* | | | 937,087 | |
| | 136,100 | | Magnolia Oil & Gas Corp. Class A | | | 3,412,027 | |
| | 48,200 | | Matador Resources Co. | | | 3,002,860 | |
| | 125,840 | | Northern Oil & Gas, Inc. | | | 5,133,014 | |
| | 50,372 | | Par Pacific Holdings, Inc.* | | | 1,551,458 | |
| | 91,100 | | Viper Energy, Inc. | | | 3,476,376 | |
| | 61,967 | | World Kinect Corp. | | | 1,456,224 | |
| | | | | | | | |
| | | | | | | 23,938,399 | |
| | | |
| |
| | Personal Products* – 0.2% | |
| | 22,490 | | BellRing Brands, Inc. | | | 1,240,774 | |
| | 13,345 | | Oddity Tech Ltd. Class A | | | 434,246 | |
| | | | | | | | |
| | | | | | | 1,675,020 | |
| | | |
| |
| | Pharmaceuticals – 0.8% | |
| | 13,074 | | Arvinas, Inc.* | | | 415,361 | |
| | 177,085 | | Innoviva, Inc.* | | | 2,675,754 | |
| | 42,385 | | Organon & Co. | | | 788,785 | |
| | 30,826 | | Perrigo Co. PLC | | | 1,006,777 | |
| | 31,800 | | Prestige Consumer Healthcare, Inc.* | | | 2,281,968 | |
| | | | | | | | |
| | | | | | | 7,168,645 | |
| | | |
| |
| | Professional Services – 2.5% | |
| | 115,948 | | Alight, Inc. Class A* | | | 1,045,851 | |
| | 19,700 | | ASGN, Inc.* | | | 1,900,065 | |
| | | |
| | |
| 14 | | The accompanying notes are an integral part of these financial statements. |
MULTI-MANAGER U.S. SMALL CAP EQUITY FUND
| | | | | | | | |
| | | Shares | | Description | | Value | |
| |
| | Common Stocks – (continued) | |
| |
| | Professional Services – (continued) | |
| | 11,687 | | Concentrix Corp. | | $ | 638,928 | |
| | 68,340 | | First Advantage Corp. | | | 1,113,942 | |
| | 19,292 | | FTI Consulting, Inc.* | | | 4,125,208 | |
| | 13,904 | | Huron Consulting Group, Inc.* | | | 1,296,409 | |
| | 10,825 | | ICF International, Inc. | | | 1,561,939 | |
| | 29,773 | | Kelly Services, Inc. Class A | | | 682,993 | |
| | 131,314 | | Legalzoom.com, Inc.* | | | 1,569,202 | |
| | 31,300 | | Maximus, Inc. | | | 2,512,764 | |
| | 15,815 | | Science Applications International Corp. | | | 2,035,391 | |
| | 56,870 | | WNS Holdings Ltd.* | | | 2,383,422 | |
| | | | | | | | |
| | | | | | | 20,866,114 | |
| | | |
| |
| | Real Estate Management & Development – 0.5% | |
| | 15,900 | | Colliers International Group, Inc. | | | 1,654,236 | |
| | 92,000 | | Cushman & Wakefield PLC* | | | 887,800 | |
| | 87,895 | | DigitalBridge Group, Inc. | | | 1,444,994 | |
| | | | | | | | |
| | | | | | | 3,987,030 | |
| | | |
| |
| | Semiconductors & Semiconductor Equipment – 3.9% | |
| | 26,705 | | Amkor Technology, Inc. | | | 863,907 | |
| | 7,656 | | Axcelis Technologies, Inc.* | | | 792,549 | |
| | 74,100 | | Cohu, Inc.* | | | 2,246,712 | |
| | 60,730 | | Credo Technology Group Holding Ltd.* | | | 1,085,245 | |
| | 26,717 | | Entegris, Inc. | | | 3,551,224 | |
| | 24,200 | | Ichor Holdings Ltd.* | | | 938,476 | |
| | 21,973 | | Impinj, Inc.* | | | 3,502,057 | |
| | 47,400 | | Kulicke & Soffa Industries, Inc. | | | 2,193,672 | |
| | 20,627 | | Lattice Semiconductor Corp.* | | | 1,415,012 | |
| | 15,650 | | Nova Ltd.* | | | 2,658,935 | |
| | 5,049 | | Onto Innovation, Inc.* | | | 936,539 | |
| | 31,433 | | Photronics, Inc.* | | | 861,579 | |
| | 34,678 | | Power Integrations, Inc. | | | 2,313,716 | |
| | 23,645 | | Rambus, Inc.* | | | 1,296,219 | |
| | 22,140 | | Semtech Corp.* | | | 832,907 | |
| | 18,660 | | SiTime Corp.* | | | 1,662,979 | |
| | 69,400 | | Tower Semiconductor Ltd.* | | | 2,281,178 | |
| | 27,551 | | Ultra Clean Holdings, Inc.* | | | 1,152,458 | |
| | 15,290 | | Universal Display Corp. | | | 2,415,514 | |
| | | | | | | | |
| | | | | | | 33,000,878 | |
| | | |
| |
| | Software – 7.0% | |
| | 125,390 | | Adeia, Inc. | | | 1,233,837 | |
| | 2,594 | | Bentley Systems, Inc. Class B | | | 136,263 | |
| | 51,157 | | BlackLine, Inc.* | | | 2,969,664 | |
| | 507,754 | | CCC Intelligent Solutions Holdings, Inc.* | | | 5,697,000 | |
| | 122,272 | | Clear Secure, Inc. Class A | | | 2,136,092 | |
| | 30,395 | | Clearwater Analytics Holdings, Inc. Class A* | | | 479,633 | |
| | 110,607 | | Dynatrace, Inc.* | | | 5,011,603 | |
| | 82,115 | | Envestnet, Inc.* | | | 5,096,878 | |
| | 60,430 | | Gitlab, Inc. Class A* | | | 3,170,762 | |
| | 18,067 | | Guidewire Software, Inc.* | | | 1,994,597 | |
| | | |
| | | | | | | | |
| | | Shares | | Description | | Value | |
| |
| | Common Stocks – (continued) | |
| |
| | Software – (continued) | |
| | 31,232 | | InterDigital, Inc. | | $ | 3,083,535 | |
| | 177,100 | | Lightspeed Commerce, Inc.* | | | 2,316,468 | |
| | 23,889 | | LiveRamp Holdings, Inc.* | | | 767,076 | |
| | 1,321 | | MicroStrategy, Inc. Class A* | | | 1,406,905 | |
| | 150,933 | | NCR Voyix Corp.* | | | 1,848,929 | |
| | 11,263 | | Pegasystems, Inc. | | | 669,247 | |
| | 102,721 | | PROS Holdings, Inc.* | | | 3,364,113 | |
| | 148,680 | | Samsara, Inc. Class A* | | | 5,193,392 | |
| | 88,490 | | Smartsheet, Inc. Class A* | | | 3,347,577 | |
| | 29,737 | | Sprout Social, Inc. Class A* | | | 1,500,232 | |
| | 59,160 | | Tenable Holdings, Inc.* | | | 2,660,425 | |
| | 71,100 | | Verint Systems, Inc.* | | | 2,152,908 | |
| | 34,160 | | Workiva, Inc.* | | | 2,691,808 | |
| | | | | | | | |
| | | | | | | 58,928,944 | |
| | | |
| |
| | Specialized REITs – 0.5% | |
| | 92,400 | | Four Corners Property Trust, Inc. | | | 2,166,780 | |
| | 70,600 | | Rayonier, Inc. | | | 2,093,996 | |
| | | | | | | | |
| | | | | | | 4,260,776 | |
| | | |
| |
| | Specialty Retail – 1.0% | |
| | 32,889 | | Caleres, Inc. | | | 1,211,302 | |
| | 5,171 | | Group 1 Automotive, Inc. | | | 1,520,377 | |
| | 3,900 | | Murphy USA, Inc. | | | 1,613,898 | |
| | 138,802 | | Revolve Group, Inc.* | | | 2,763,548 | |
| | 15,900 | | Signet Jewelers Ltd. | | | 1,558,677 | |
| | | | | | | | |
| | | | | | | 8,667,802 | |
| | | |
| |
| | Technology Hardware, Storage & Peripherals* – 0.3% | |
| | 2,697 | | Super Micro Computer, Inc. | | | 2,316,184 | |
| | | |
| |
| | Textiles, Apparel & Luxury Goods – 0.7% | |
| | 17,300 | | Columbia Sportswear Co. | | | 1,377,599 | |
| | 26,875 | | Kontoor Brands, Inc. | | | 1,667,863 | |
| | 9,700 | | Oxford Industries, Inc. | | | 1,045,466 | |
| | 50,664 | | Steven Madden Ltd. | | | 2,047,332 | |
| | | | | | | | |
| | | | | | | 6,138,260 | |
| | | |
| |
| | Tobacco – 0.3% | |
| | 22,174 | | Universal Corp. | | | 1,140,409 | |
| | 93,807 | | Vector Group Ltd. | | | 970,902 | |
| | | | | | | | |
| | | | | | | 2,111,311 | |
| | | |
| |
| | Trading Companies & Distributors – 0.9% | |
| | 32,723 | | Beacon Roofing Supply, Inc.* | | | 3,224,197 | |
| | 66,403 | | DNOW, Inc.* | | | 936,947 | |
| | 15,000 | | McGrath RentCorp | | | 1,599,900 | |
| | 10,773 | | SiteOne Landscape Supply, Inc.* | | | 1,690,176 | |
| | | | | | | | |
| | | | | | | 7,451,220 | |
| | | |
| |
| | Wireless Telecommunication Services*(a) – 0.0% | |
| | 29,864 | | GCI Liberty, Inc. | | | — | |
| | | |
| | TOTAL COMMON STOCKS (Cost $737,375,364) | | $ | 813,885,196 | |
| | | |
| | |
| The accompanying notes are an integral part of these financial statements. | | 15 |
MULTI-MANAGER U.S. SMALL CAP EQUITY FUND
|
Schedule of Investments (continued) April 30, 2024 (Unaudited) |
| | | | | | | | |
| | | Shares | | Description | | Value | |
| |
| | Exchange Traded Funds – 0.1% | |
| | | |
| | 7,000 | | iShares Russell 2000 Value ETF | | $ | 1,043,280 | |
| | (Cost $1,075,867) | | | | |
| | | |
| | | |
| | | Shares | | Dividend Rate | | Value | |
| |
| | Investment Company(b) – 4.0% | |
| |
| | Goldman Sachs Financial Square Government
Fund — Institutional Shares | |
| | 33,679,160 | | 5.223% | | $ | 33,679,160 | |
| | (Cost $33,679,160) | | | | |
| | | |
| | TOTAL INVESTMENTS – 100.4% (Cost $772,130,391) | | $ | 848,607,636 | |
| | | |
| | LIABILITIES IN EXCESS OF OTHER
ASSETS – (0.4)% | | | (3,040,753 | ) |
| | | |
| | NET ASSETS – 100.0% | | $ | 845,566,883 | |
| | | |
| | |
| The percentage shown for each investment category reflects the value of investments in that category as a percentage of net assets. |
| |
| * | | Non-income producing security. |
| |
| (a) | | Significant unobservable inputs were used in the valuation of this portfolio security; i.e., Level 3. |
| |
| (b) | | Represents an Affiliated Issuer. |
| | |
|
|
| Investment Abbreviations: |
| ETF | | —Exchange Traded Fund |
| PLC | | —Public Limited Company |
| REIT | | —Real Estate Investment Trust |
|
|
| | |
| 16 | | The accompanying notes are an integral part of these financial statements. |
ACTIVE EQUITY MULTI-MANAGER FUNDS
|
Statements of Assets and Liabilities April 30, 2024 (Unaudited) |
| | | | | | | | | | | | | | |
| | | | |
| | | | | Multi-Manager International Equity Fund | | | | | | Multi-Manager U.S. Small Cap Equity Fund | |
| | | | |
| | Assets: | | | | | | | | | | | | |
| | | | |
| | Investments in unaffiliated issuers, at value (cost $1,135,496,036 and $738,451,231, respectively) | | $ | 1,418,710,774 | | | | | | | $ | 814,928,476 | |
| | | | |
| | Investments in affiliated issuers, at value (cost $33,345,532 and $33,679,160, respectively) | | | 33,345,532 | | | | | | | | 33,679,160 | |
| | | | |
| | Cash | | | 677,707 | | | | | | | | 738,961 | |
| | | | |
| | Foreign currencies, at value (cost $1,176,288 and $0, respectively) | | | 1,174,336 | | | | | | | | — | |
| | | | |
| | Receivables: | | | | | | | | | | | | |
| | | | |
| | Dividends | | | 5,024,028 | | | | | | | | 300,116 | |
| | | | |
| | Foreign tax reclaims | | | 4,347,752 | | | | | | | | — | |
| | | | |
| | Investments sold | | | 3,096,552 | | | | | | | | 2,973,328 | |
| | | | |
| | Fund shares sold | | | 239,900 | | | | | | | | 270,900 | |
| | | | |
| | Other assets | | | 30,892 | | | | | | | | 36,560 | |
| | | |
| | | | |
| | Total assets | | | 1,466,647,473 | | | | | | | | 852,927,501 | |
| | | |
| | | | | | | | | | | | | | |
| | | | |
| | Liabilities: | | | | | | | | | | | | |
| | | | |
| | Unrealized loss on forward foreign currency exchange contracts | | | 116 | | | | | | | | — | |
| | | | |
| | Payables: | | | | | | | | | | | | |
| | | | |
| | Investments purchased | | | 1,888,329 | | | | | | | | 4,458,076 | |
| | | | |
| | Management fees | | | 505,805 | | | | | | | | 408,728 | |
| | | | |
| | Fund shares redeemed | | | 481,880 | | | | | | | | 1,975,900 | |
| | | | |
| | Investments purchased on an extended-settlement basis | | | 364,044 | | | | | | | | — | |
| | | | |
| | Transfer agency fees | | | 24,511 | | | | | | | | 14,373 | |
| | | | |
| | Accrued expenses | | | 889,754 | | | | | | | | 503,541 | |
| | | |
| | | | |
| | Total liabilities | | | 4,154,439 | | | | | | | | 7,360,618 | |
| | | |
| | | | | | | | | | | | | | |
| | | | |
| | Net Assets: | | | | | | | | | | | | |
| | | | |
| | Paid-in capital | | | 1,148,216,901 | | | | | | | | 763,962,407 | |
| | | | |
| | Total distributable earnings | | | 314,276,133 | | | | | | | | 81,604,476 | |
| | | |
| | | | |
| | NET ASSETS | | $ | 1,462,493,034 | | | | | | | $ | 845,566,883 | |
| | | |
| | | | |
| | Shares Outstanding $0.001 par value (unlimited shares authorized): | | | 101,974,514 | | | | | | | | 62,862,315 | |
| | | | |
| | Net asset value, offering and redemption price per share: | | $ | 14.34 | | | | | | | $ | 13.45 | |
| | | |
| | |
| The accompanying notes are an integral part of these financial statements. | | 17 |
ACTIVE EQUITY MULTI-MANAGER FUNDS
|
Statements of Operations For the Six Months Ended April 30, 2024 (Unaudited) |
| | | | | | | | | | | | | | |
| | | | |
| | | | | Multi-Manager International Equity Fund | | | | | | Multi-Manager U.S. Small Cap Equity Fund | |
| | | | |
| | Investment Income: | | | | | | | | | | | | |
| | | | |
| | Dividends — unaffiliated issuers (net of tax withholding of $894,811 and $9,753, respectively) | | $ | 16,408,253 | | | | | | | $ | 4,308,361 | |
| | | | |
| | Dividends — affiliated issuers | | | 981,175 | | | | | | | | 1,009,883 | |
| | | |
| | | | |
| | Total investment income | | | 17,389,428 | | | | | | | | 5,318,244 | |
| | | |
| | | | | | | | | | | | | | |
| | | | |
| | Expenses: | | | | | | | | | | | | |
| | | | |
| | Management fees | | | 4,244,291 | | | | | | | | 3,157,641 | |
| | | | |
| | Custody, accounting and administrative services | | | 402,965 | | | | | | | | 278,063 | |
| | | | |
| | Transfer Agency fees | | | 141,476 | | | | | | | | 84,204 | |
| | | | |
| | Professional fees | | | 112,231 | | | | | | | | 82,716 | |
| | | | |
| | Registration fees | | | 25,753 | | | | | | | | 37,787 | |
| | | | |
| | Trustee fees | | | 21,633 | | | | | | | | 19,726 | |
| | | | |
| | Printing and mailing costs | | | 7,937 | | | | | | | | 6,960 | |
| | | | |
| | Other | | | 26,516 | | | | | | | | 18,345 | |
| | | |
| | | | |
| | Total expenses | | | 4,982,802 | | | | | | | | 3,685,442 | |
| | | |
| | | | |
| | Less — expense reductions | | | (1,313,392 | ) | | | | | | | (758,658) | |
| | | |
| | | | |
| | Net expenses | | | 3,669,410 | | | | | | | | 2,926,784 | |
| | | |
| | | | |
| | NET INVESTMENT INCOME | | | 13,720,018 | | | | | | | | 2,391,460 | |
| | | |
| | | | | | | | | | | | | | |
| | | | |
| | Realized and unrealized gain (loss): | | | | | | | | | | | | |
| | | | |
| | Net realized gain (loss) from: | | | | | | | | | | | | |
| | | | |
| | Investments — unaffiliated issuers (including commission recapture of $6,859 and $20,982, respectively) | | | 58,486,763 | | | | | | | | 26,468,253 | |
| | | | |
| | Forward foreign currency exchange contracts | | | 11,253 | | | | | | | | — | |
| | | | |
| | Foreign currency transactions | | | (125,795 | ) | | | | | | | (92) | |
| | | | |
| | Net change in unrealized gain (loss) on: | | | | | | | | | | | | |
| | | | |
| | Investments — unaffiliated issuers (including the effects of foreign capital gains tax of $(36,388) and $0, respectively) | | | 136,471,243 | | | | | | | | 94,098,526 | |
| | | | |
| | Forward foreign currency exchange contracts | | | (116 | ) | | | | | | | — | |
| | | | |
| | Foreign currency translation | | | (27,269 | ) | | | | | | | — | |
| | | |
| | | | |
| | Net realized and unrealized gain | | | 194,816,079 | | | | | | | | 120,566,687 | |
| | | |
| | | | |
| | NET INCREASE IN NET ASSETS RESULTING FROM OPERATIONS | | $ | 208,536,097 | | | | | | | $ | 122,958,147 | |
| | | |
| | |
| 18 | | The accompanying notes are an integral part of these financial statements. |
ACTIVE EQUITY MULTI-MANAGER FUNDS
|
Statements of Changes in Net Assets |
| | | | | | | | | | | | | | | | | | | | |
| | | | | Multi-Manager International Equity Fund | | | Multi-Manager U.S. Small Cap Equity Fund | | | |
| | | | | | |
| | | | | For the Six Months Ended April 30, 2024 (Unaudited) | | | For the Fiscal Year Ended October 31, 2023 | | | For the Six Months Ended April 30, 2024 (Unaudited) | | | For the Fiscal Year Ended October 31, 2023 | | | |
| | | | | | |
| | From operations: | | | | | | | | | | | | | | | | | | |
| | | | | | |
| | Net investment income | | | $ 13,720,018 | | | | $ 21,687,381 | | | | $ 2,391,460 | | | | $ 4,265,931 | | | |
| | | | | | |
| | Net realized gain | | | 58,372,221 | | | | 14,300,109 | | | | 26,468,161 | | | | 9,768,523 | | | |
| | | | | | |
| | Net change in unrealized gain (loss) | | | 136,443,858 | | | | 139,803,878 | | | | 94,098,526 | | | | (53,130,896 | ) | | |
| | |
| | | | | | |
| | Net increase (decrease) in net assets resulting from operations | | | 208,536,097 | | | | 175,791,368 | | | | 122,958,147 | | | | (39,096,442 | ) | | |
| | |
| | | | | | | | | | | | | | | | | | | | |
| | | | | | |
| | Distributions to shareholders: | | | | | | | | | | | | | | | | | | |
| | | | | | |
| | From distributable earnings | | | (22,657,088 | ) | | | (16,119,210 | ) | | | (5,116,836 | ) | | | (3,365,968 | ) | | |
| | |
| | | | | | | | | | | | | | | | | | | | |
| | | | | | |
| | From share transactions: | | | | | | | | | | | | | | | | | | |
| | | | | | |
| | Proceeds from sales of shares | | | 149,416,310 | | | | 143,090,181 | | | | 75,490,070 | | | | 139,489,002 | | | |
| | | | | | |
| | Reinvestment of distributions | | | 22,657,088 | | | | 16,119,210 | | | | 5,116,836 | | | | 3,365,968 | | | |
| | | | | | |
| | Cost of shares redeemed | | | (116,510,707 | ) | | | (256,849,962 | ) | | | (74,495,983 | ) | | | (59,610,549 | ) | | |
| | |
| | | | | | |
| | Net increase (decrease) in net assets resulting from share transactions | | | 55,562,691 | | | | (97,640,571 | ) | | | 6,110,923 | | | | 83,244,421 | | | |
| | |
| | | | | | |
| | TOTAL INCREASE | | | 241,441,700 | | | | 62,031,587 | | | | 123,952,234 | | | | 40,782,011 | | | |
| | |
| | | | | | | | | | | | | | | | | | | | |
| | | | | | |
| | Net assets: | | | | | | | | | | | | | | | | | | |
| | | | | | |
| | Beginning of period | | | 1,221,051,334 | | | | 1,159,019,747 | | | | 721,614,649 | | | | 680,832,638 | | | |
| | |
| | | | | | |
| | End of period | | | $1,462,493,034 | | | | $1,221,051,334 | | | | $845,566,883 | | | | $721,614,649 | | | |
| | |
| | |
| The accompanying notes are an integral part of these financial statements. | | 19 |
|
Financial Highlights Selected Share Data for a Share Outstanding Throughout Each Period |
| | | | | | | | | | | | | | | | | | | | | | | | | | | | | | | | | | |
| | | | | Multi-Manager International Equity Fund | | |
| | | |
| | | | | Class P Shares | | |
| | | | | | | | |
| | | | | Six Months Ended April 30, 2024 (Unaudited) | | | | | | | | | | | | |
| | | | | Year Ended October 31, | | |
| | | | | 2023 | | 2022 | | 2021 | | 2020 | | 2019 | | |
| | | | | | | | |
| | | Per Share Data | | | | | | | | | | | | | | | | | | | | | | | | | | | | | |
| | | | | | | |
| | Net asset value, beginning of period | | | $ | 12.45 | | | | $ | 10.94 | | | | $ | 15.42 | | | | $ | 11.16 | | | | $ | 11.70 | | | $ 10.80 | |
| | |
| | | | | | | |
| | Net investment income(a) | | | | 0.14 | | | | | 0.22 | (b) | | | | 0.19 | | | | | 0.22 | | | | | 0.16 | | | 0.28 | |
| | | | | | | |
| | Net realized and unrealized gain (loss) | | | | 1.98 | | | | | 1.45 | | | | | (3.52 | ) | | | | 4.17 | | | | | (0.40 | ) | | 1.03 | |
| | |
| | | | | | | |
| | Total from investment operations | | | | 2.12 | | | | | 1.67 | | | | | (3.33 | ) | | | | 4.39 | | | | | (0.24 | ) | | 1.31 | |
| | |
| | | | | | | |
| | Distributions to shareholders from net investment income | | | | (0.23 | ) | | | | (0.16 | ) | | | | (0.23 | ) | | | | (0.13 | ) | | | | (0.28 | ) | | (0.16) | |
| | | | | | | |
| | Distributions to shareholders from net realized gains | | | | — | | | | | — | | | | | (0.92 | ) | | | | — | | | | | (0.02 | ) | | (0.25) | |
| | |
| | | | | | | |
| | Total distributions | | | | (0.23 | ) | | | | (0.16 | ) | | | | (1.15 | ) | | | | (0.13 | ) | | | | (0.30 | ) | | (0.41) | |
| | |
| | | | | | | |
| | Net asset value, end of period | | | $ | 14.34 | | | | $ | 12.45 | | | | $ | 10.94 | | | | $ | 15.42 | | | | $ | 11.16 | | | $ 11.70 | |
| | |
| | | | | | | |
| | Total return(c) | | | | 17.07 | % | | | | 15.32 | % | | | | (23.15 | )% | | | | 39.46 | % | | | | (2.28 | )% | | 12.78% | |
| | |
| | | | | | | |
| | Net assets, end of period (in 000s) | | | $ | 1,462,493 | | | | $ | 1,221,051 | | | | $ | 1,159,020 | | | | $ | 1,373,200 | | | | $ | 886,359 | | | $823,204 | |
| | | | | | | |
| | Ratio of net expenses to average net assets | | | | 0.52 | %(d) | | | | 0.54 | % | | | | 0.56 | % | | | | 0.56 | % | | | | 0.57 | % | | 0.56% | |
| | | | | | | |
| | Ratio of total expenses to average net assets | | | | 0.70 | %(d) | | | | 0.71 | % | | | | 0.73 | % | | | | 0.72 | % | | | | 0.74 | % | | 0.76% | |
| | | | | | | |
| | Ratio of net investment income to average net assets | | | | 1.94 | %(d) | | | | 1.70 | % | | | | 1.50 | % | | | | 1.50 | % | | | | 1.39 | % | | 2.51% | |
| | | | | | | |
| | Portfolio turnover rate(e) | | | | 54 | % | | | | 35 | % | | | | 39 | % | | | | 61 | % | | | | 52 | % | | 29% | |
| | |
| | (a) | Calculated based on the average shares outstanding methodology. |
| | (b) | Reflects income recognized from withholding tax reclaims which amounted to $0.01 per share and 0.09% of average net assets. |
| | (c) | Assumes investment at the NAV at the beginning of the period, reinvestment of all dividends and distributions, a complete redemption of the investment at the NAV at the end of the period and no sales or redemption charges (if any). Total returns would be reduced if a sales or redemption charge was taken into account. Returns do not reflect the impact of taxes to shareholders relating to Fund distributions or the redemption of Fund shares. Total returns for periods less than one full year are not annualized. |
| | (e) | The Fund’s portfolio turnover rate is calculated in accordance with regulatory requirements, without regard to transactions involving short term investments and certain derivatives. If such transactions were included, the Fund’s portfolio turnover rate may be higher. |
| | |
| 20 | | The accompanying notes are an integral part of these financial statements. |
|
Financial Highlights (continued) Selected Share Data for a Share Outstanding Throughout Each Period |
| | | | | | | | | | | | | | | | | | | | | | | | | | | | | | | | | | |
| | | | | Multi-Manager U.S. Small Cap Equity Fund | | |
| | | |
| | | | | Class P Shares | | |
| | | | | | | | |
| | | | | Six Months Ended April 30, 2024 (Unaudited) | | | | | | | | | | | | |
| | | | | Year Ended October 31, | | |
| | | | | 2023 | | 2022 | | 2021 | | 2020 | | 2019 | | |
| | | | | | | | |
| | Per Share Data | | | | | | | | | | | | | | | | | | | | | | | | | | | | | |
| | | | | | | |
| | Net asset value, beginning of period | | | $ | 11.56 | | | | $ | 12.23 | | | | $ | 17.45 | | | | $ | 12.14 | | | | $ | 13.31 | | | $ 12.40 | |
| | |
| | | | | | | |
| | Net investment income(a) | | | | 0.04 | | | | | 0.07 | | | | | 0.05 | | | | | 0.03 | (b) | | | | 0.05 | | | 0.08 | |
| | | | | | | |
| | Net realized and unrealized gain (loss) | | | | 1.93 | | | | | (0.68 | ) | | | | (2.47 | ) | | | | 5.31 | | | | | (0.79 | ) | | 1.17 | |
| | |
| | | | | | | |
| | Total from investment operations | | | | 1.97 | | | | | (0.61 | ) | | | | (2.42 | ) | | | | 5.34 | | | | | (0.74 | ) | | 1.25 | |
| | |
| | | | | | | |
| | Distributions to shareholders from net investment income | | | | (0.08 | ) | | | | (0.06 | ) | | | | (0.03 | ) | | | | (0.03 | ) | | | | (0.08 | ) | | (0.04) | |
| | | | | | | |
| | Distributions to shareholders from net realized gains | | | | — | | | | | — | | | | | (2.77 | ) | | | | — | | | | | (0.35 | ) | | (0.30) | |
| | |
| | | | | | | |
| | Total distributions | | | | (0.08 | ) | | | | (0.06 | ) | | | | (2.80 | ) | | | | (0.03 | ) | | | | (0.43 | ) | | (0.34) | |
| | |
| | | | | | | |
| | Net asset value, end of period | | | $ | 13.45 | | | | $ | 11.56 | | | | $ | 12.23 | | | | $ | 17.45 | | | | $ | 12.14 | | | $ 13.31 | |
| | |
| | | | | | | |
| | Total return(c) | | | | 17.07 | % | | | | (5.00 | )% | | | | (15.77 | )% | | | | 44.07 | % | | | | (5.88 | )% | | 10.56% | |
| | |
| | | | | | | |
| | Net assets, end of period (in 000s) | | | $ | 845,567 | | | | $ | 721,615 | | | | $ | 680,833 | | | | $ | 647,500 | | | | $ | 441,314 | | | $377,898 | |
| | | | | | | |
| | Ratio of net expenses to average net assets | | | | 0.70 | %(d) | | | | 0.71 | % | | | | 0.73 | % | | | | 0.75 | % | | | | 0.77 | % | | 0.79% | |
| | | | | | | |
| | Ratio of total expenses to average net assets | | | | 0.88 | %(d) | | | | 0.89 | % | | | | 0.90 | % | | | | 0.92 | % | | | | 0.95 | % | | 0.96% | |
| | | | | | | |
| | Ratio of net investment income to average net assets | | | | 0.57 | %(d) | | | | 0.58 | % | | | | 0.35 | % | | | | 0.17 | %(b) | | | | 0.44 | % | | 0.62% | |
| | | | | | | |
| | | Portfolio turnover rate(e) | | | | 32 | % | | | | 62 | % | | | | 57 | % | | | | 105 | % | | | | 85 | % | | 88% | |
| | |
| | (a) | Calculated based on the average shares outstanding methodology. |
| | (b) | Reflects income recognized from special dividends which amounted to $0.02 per share and 0.12% of average net assets. |
| | (c) | Assumes investment at the NAV at the beginning of the period, reinvestment of all dividends and distributions, a complete redemption of the investment at the NAV at the end of the period and no sales or redemption charges (if any). Total returns would be reduced if a sales or redemption charge was taken into account. Returns do not reflect the impact of taxes to shareholders relating to Fund distributions or the redemption of Fund shares. Total returns for periods less than one full year are not annualized. |
| | (e) | The Fund’s portfolio turnover rate is calculated in accordance with regulatory requirements, without regard to transactions involving short term investments and certain derivatives. If such transactions were included, the Fund’s portfolio turnover rate may be higher. |
| | |
| The accompanying notes are an integral part of these financial statements. | | 21 |
ACTIVE EQUITY MULTI-MANAGER FUNDS
|
Notes to Financial Statements April 30, 2024 (Unaudited) |
Goldman Sachs Trust II (the “Trust”) is a Delaware statutory trust registered under the Investment Company Act of 1940, as amended (the “Act”), as an open-end management investment company. The following table lists those series of the Trust that are included in this report (collectively, the “Funds” or individually a “Fund”), along with their corresponding share classes and respective diversification status under the Act:
| | | | |
| Fund | | Share Classes Offered | | Diversified/ Non-diversified |
| | |
| Multi-Manager International Equity | | Class P | | Diversified |
| | |
| Multi-Manager U.S. Small Cap Equity | | Class P | | Diversified |
Goldman Sachs Asset Management, L.P. (“GSAM”), an affiliate of Goldman Sachs & Co. LLC (“Goldman Sachs”), serves as investment adviser to the Funds pursuant to a management agreement (the “Agreement”) with the Trust. As of April 30, 2024, GSAM had sub-advisory agreements (the “Sub-Advisory Agreements”) for the Multi-Manager International Equity Fund with Causeway Capital Management LLC, Lazard Asset Management LLC, Massachusetts Financial Services Company, doing business as MFS Investment Management, and WCM Investment Management, LLC and for the Multi-Manager U.S. Small Cap Equity Fund with Boston Partners Global Investors, Inc., Brown Advisory LLC, Victory Capital Management, Inc., and Westfield Capital Management Company, L.P., (the “Underlying Managers”). Pursuant to the terms of the Sub-Advisory Agreements, the Underlying Managers are responsible for making investment decisions and managing the investments of the applicable Fund. GSAM compensates the Underlying Managers directly in accordance with the terms of the applicable Sub-Advisory Agreements. The Funds are not charged any separate or additional investment advisory fees by the Underlying Managers.
|
|
2. SIGNIFICANT ACCOUNTING POLICIES |
The financial statements have been prepared in accordance with accounting principles generally accepted in the United States of America (“GAAP”) and require management to make estimates and assumptions that may affect the reported amounts and disclosures. Actual results may differ from those estimates and assumptions. Each Fund is an investment company under GAAP and follows the accounting and reporting guidance applicable to investment companies.
A. Investment Valuation — The Funds’ valuation policy is to value investments at fair value.
B. Investment Income and Investments — Investment income includes interest income, dividend income and securities lending income, if any. Interest income is accrued daily and adjusted for amortization of premiums and accretion of discounts. Dividend income is recognized on ex-dividend date or, for certain foreign securities, as soon as such information is obtained subsequent to the ex-dividend date. Non-cash dividends, if any, are recorded at the fair market value of the securities received. Investment transactions are reflected on trade date. Realized gains and losses are calculated using identified cost. Investment transactions are recorded on the following business day for daily net asset value (“NAV”) calculations. Investment income is recorded net of any foreign withholding taxes, less any amounts reclaimable. The Funds may file withholding tax reclaims in certain jurisdictions to recover a portion of amounts previously withheld. These reclaims, if any, are recorded when the amount is known and there are no significant uncertainties on collectability. Such amounts recovered, if any, are reflected as other income in the Statements of Operations. Any foreign capital gains tax is accrued daily based upon net unrealized gains, and is payable upon sale of such investments. Distributions received from the Funds’ investments in U.S. real estate investment trusts (“REITs”) may be characterized as ordinary income, net capital gain and/or a return of capital. A return of capital is recorded by the Funds as a reduction to the cost basis of the REIT.
For derivative contracts, unrealized gains and losses are recorded daily and become realized gains and losses upon disposition or termination of the contract.
C. Expenses — Expenses incurred directly by a Fund are charged to the Fund, and certain expenses incurred by the Trust are allocated across the applicable Funds on a straight-line and/or pro-rata basis, depending upon the nature of the expenses, and are accrued daily.
ACTIVE EQUITY MULTI-MANAGER FUNDS
|
|
2. SIGNIFICANT ACCOUNTING POLICIES (continued) |
D. Federal Taxes and Distributions to Shareholders — It is each Fund’s policy to comply with the requirements of the Internal Revenue Code of 1986, as amended (the “Code”), applicable to regulated investment companies and to distribute each year substantially all of its investment company taxable income and capital gains to its shareholders. Accordingly, each Fund is not required to make any provisions for the payment of federal income tax. Distributions to shareholders are recorded on the ex-dividend date. Income and capital gains distributions, if any, are declared and paid annually.
Net capital losses, if any, are carried forward to future fiscal years and may be used to the extent allowed by the Code to offset any future capital gains. Losses that are carried forward will retain their character as either short-term or long-term capital losses. Utilization of capital loss carryforwards will reduce the requirement of future capital gains distributions.
The characterization of distributions to shareholders for financial reporting purposes is determined in accordance with federal income tax rules, which may differ from GAAP. The source of each Fund’s distributions may be shown in the accompanying financial statements as either from distributable earnings or capital. Certain components of the Funds’ net assets on the Statements of Assets and Liabilities reflect permanent GAAP/tax differences based on the appropriate tax character.
E. Foreign Currency Translation — The accounting records and reporting currency of a Fund are maintained in U.S. dollars. Assets and liabilities denominated in foreign currencies are translated into U.S. dollars using the current exchange rates at the close of each business day. The effect of changes in foreign currency exchange rates on investments is included within net realized and unrealized gain (loss) on investments. Changes in the value of other assets and liabilities as a result of fluctuations in foreign exchange rates are included in the Statements of Operations within net change in unrealized gain (loss) on foreign currency translation. Transactions denominated in foreign currencies are translated into U.S. dollars on the date the transaction occurred, the effects of which are included within net realized gain (loss) on foreign currency transactions.
F. Commission Recapture — GSAM, on behalf of certain Funds, may direct portfolio trades, subject to seeking best execution, to various brokers who have agreed to rebate a portion of the commissions generated. Such rebates are made directly to a Fund as cash payments and are included in net realized gain (loss) from investments on the Statements of Operations.
|
|
3. INVESTMENTS AND FAIR VALUE MEASUREMENTS |
U.S. GAAP defines the fair value of a financial instrument as the amount that would be received to sell an asset or paid to transfer a liability in an orderly transaction between market participants at the measurement date (i.e., the exit price); the Funds’ policy is to use the market approach. GAAP establishes a fair value hierarchy that prioritizes the inputs to valuation techniques used to measure fair value. The hierarchy gives the highest priority to unadjusted quoted prices in active markets for identical assets or liabilities (Level 1 measurements) and the lowest priority to unobservable inputs (Level 3 measurements). The level in the fair value hierarchy within which the fair value measurement in its entirety falls shall be determined based on the lowest level input that is significant to the fair value measurement in its entirety. The levels used for classifying investments are not necessarily an indication of the risk associated with investing in these investments. The three levels of the fair value hierarchy are described below:
Level 1 — Unadjusted quoted prices in active markets that are accessible at the measurement date for identical, unrestricted assets or liabilities;
Level 2 — Quoted prices in markets that are not active or financial instruments for which significant inputs are observable (including, but not limited to, quoted prices for similar investments, interest rates, foreign exchange rates, volatility and credit spreads), either directly or indirectly;
Level 3 — Prices or valuations that require significant unobservable inputs (including GSAM’s assumptions in determining fair value measurement).
The Board of Trustees (“Trustees”) has approved Valuation Procedures that govern the valuation of the portfolio investments held by the Funds, including investments for which market quotations are not readily available. With respect to the Funds’ investments that do not have readily available market quotations, the Trustees have designated GSAM as the valuation designee to perform fair valuations pursuant to Rule 2a-5 under the Investment Company Act of 1940 (the “Valuation Designee”). GSAM has day-to-day
ACTIVE EQUITY MULTI-MANAGER FUNDS
|
Notes to Financial Statements (continued) April 30, 2024 (Unaudited) |
|
|
3. INVESTMENTS AND FAIR VALUE MEASUREMENTS (continued) |
responsibility for implementing and maintaining internal controls and procedures related to the valuation of the Funds’ investments. To assess the continuing appropriateness of pricing sources and methodologies, GSAM regularly performs price verification procedures and issues challenges as necessary to third party pricing vendors or brokers, and any differences are reviewed in accordance with the Valuation Procedures.
A. Level 1 and Level 2 Fair Value Investments — The valuation techniques and significant inputs used in determining the fair values for investments classified as Level 1 and Level 2 are as follows:
Equity Securities — Equity securities traded on a United States (“U.S.”) securities exchange or the NASDAQ system, or those located on certain foreign exchanges, including but not limited to the Americas, are valued daily at their last sale price or official closing price on the principal exchange or system on which they are traded. If there is no sale or official closing price or such price is believed by GSAM to not represent fair value, equity securities will be valued at the valid closing bid price for long positions and at the valid closing ask price for short positions (i.e., where there is sufficient volume, during normal exchange trading hours). If no valid bid/ask price is available, the equity security will be valued pursuant to the Valuation Procedures and consistent with applicable regulatory guidance. To the extent these investments are actively traded, they are classified as Level 1 of the fair value hierarchy, otherwise they are generally classified as Level 2. Certain equity securities containing unique attributes may be classified as Level 2.
Unlisted equity securities for which market quotations are available are valued at the last sale price on the valuation date, or if no sale occurs, at the last bid price for long positions or the last ask price for short positions, and are generally classified as Level 2. Securities traded on certain foreign securities exchanges are valued daily at fair value determined by an independent fair value service (if available) under the Valuation Procedures and consistent with applicable regulatory guidance. The independent fair value service takes into account multiple factors including, but not limited to, movements in the securities markets, certain depositary receipts, futures contracts and foreign currency exchange rates that have occurred subsequent to the close of the foreign securities exchange. These investments are generally classified as Level 2 of the fair value hierarchy.
Underlying Funds (including Money Market Funds) — Underlying funds (“Underlying Funds”) include exchange-traded funds (“ETFs”) and other investment companies. Investments in the Underlying Funds (except ETFs) are valued at the NAV per share on the day of valuation. ETFs are valued daily at the last sale price or official closing price on the principal exchange or system on which the investment is traded. Because the Funds invest in Underlying Funds that fluctuate in value, the Funds’ shares will correspondingly fluctuate in value. Underlying Funds are generally classified as Level 1 of the fair value hierarchy. To the extent that underlying ETFs are actively traded, they are classified as Level 1 of the fair value hierarchy, otherwise they are generally classified as Level 2. For information regarding an Underlying Fund’s accounting policies and investment holdings, please see the Underlying Fund’s shareholder report.
Derivative Contracts — A derivative is an instrument whose value is derived from underlying assets, indices, reference rates or a combination of these factors. A Fund enters into derivative transactions to hedge against changes in interest rates, securities prices, and/or currency exchange rates, to increase total return, or to gain access to certain markets or attain exposure to other underliers. For financial reporting purposes, cash collateral that has been pledged to cover obligations of a Fund and cash collateral received, if any, is reported separately on the Statements of Assets and Liabilities as either due to broker/receivable for collateral on certain derivative contracts. Non-cash collateral pledged by a Fund, if any, is noted in the Schedules of Investments.
Exchange-traded derivatives, including futures and options contracts, are generally valued at the last sale or settlement price on the exchange where they are principally traded. Exchange-traded options without settlement prices are generally valued at the midpoint of the bid and ask prices on the exchange where they are principally traded (or, in the absence of two-way trading, at the last bid price for long positions and the last ask price for short positions). Exchange-traded derivatives typically fall within Level 1 of the fair value hierarchy. Over-the-counter (“OTC”) and centrally cleared derivatives are valued using market transactions and other market evidence, including market-based inputs to models, calibration to market-clearing transactions, broker or dealer quotations, or other alternative pricing sources. Where models are used, the selection of a particular model to value OTC and centrally cleared derivatives depends upon the contractual terms of, and specific risks inherent in, the instrument, as well as the availability of pricing information in the market. Valuation models require a variety of inputs, including contractual terms, market
ACTIVE EQUITY MULTI-MANAGER FUNDS
|
|
3. INVESTMENTS AND FAIR VALUE MEASUREMENTS (continued) |
prices, yield curves, credit curves, measures of volatility, voluntary and involuntary prepayment rates, loss severity rates and correlations of such inputs. For OTC and centrally cleared derivatives that trade in liquid markets, model inputs can generally be verified and model selection does not involve significant management judgment. OTC and centrally cleared derivatives are classified within Level 2 of the fair value hierarchy when significant inputs are corroborated by market evidence.
i. Forward Contracts — A forward contract is a contract between two parties to buy or sell an asset at a specified price on a future date. A forward contract settlement can occur on a cash or delivery basis. Forward contracts are marked-to-market daily using independent vendor prices, and the change in value, if any, is recorded as an unrealized gain or loss. Cash and certain investments may be used to collateralize forward contracts.
A forward foreign currency exchange contract is a forward contract in which a Fund agrees to receive or deliver a fixed quantity of one currency for another, at a pre-determined price at a future date. All forward foreign currency exchange contracts are marked to market daily by using the outright forward rates or interpolating based upon maturity dates, where available. Non-deliverable forward foreign currency exchange contracts are settled with the counterparty in cash without the delivery of foreign currency.
B. Level 3 Fair Value Investments — To the extent that significant inputs to valuation models and other alternative pricing sources are unobservable, or if quotations are not readily available, or if GSAM believes that such quotations do not accurately reflect fair value, the fair value of a Fund’s investments may be determined under the Valuation Procedures. GSAM, consistent with its procedures and applicable regulatory guidance, may make an adjustment to the most recent valuation prices of either domestic or foreign securities in light of significant events to reflect what it believes to be the fair value of the securities at the time of determining a Fund’s NAV. To the extent investments are valued using single source broker quotations obtained directly from the broker or passed through from third party pricing vendors, such investments are classified as Level 3 investments.
C. Fair Value Hierarchy — The following is a summary of the Funds’ investments and derivatives classified in the fair value hierarchy as of April 30, 2024:
| | | | | | | | | | | | |
| MULTI-MANAGER INTERNATIONAL EQUITY | | | | | | | | | | | | |
| | | |
| Investment Type | | Level 1 | | | Level 2 | | | Level 3 | |
|
| |
| | | |
Assets | | | | | | | | | | | | |
| | | |
Common Stock and/or Other Equity Investments(a) | | | | | | | | | | | | |
| | | |
Asia | | $ | 41,427,078 | | | $ | 224,644,374 | | | $ | — | |
| | | |
Europe | | | 78,558,338 | | | | 942,500,675 | | | | — | |
| | | |
North America | | | 120,911,145 | | | | — | | | | — | |
| | | |
South America | | | 10,669,164 | | | | — | | | | — | |
| | | |
Investment Company | | | 33,345,532 | | | | — | | | | — | |
|
| |
| | | |
Total | | $ | 284,911,257 | | | $ | 1,167,145,049 | | | $ | — | |
|
| |
| | | |
| Derivative Type | | | | | | | | | |
|
| |
| | | |
Liabilities(b) | | | | | | | | | | | | |
| | | |
Forward Foreign Currency Exchange Contracts | | $ | — | | | $ | (116 | ) | | $ | — | |
|
| |
| | (a) | Amounts are disclosed by continent to highlight the impact of time zone differences between local market close and the calculation of net asset value. Security valuations are based on the principal exchange or system on which they are traded, which may differ from country of domicile. The Funds utilize fair value model prices provided by an independent fair value service for international equities, resulting in a Level 2 classification. |
| | (b) | Amount shown represents unrealized gain (loss) at period end. |
ACTIVE EQUITY MULTI-MANAGER FUNDS
|
Notes to Financial Statements (continued) April 30, 2024 (Unaudited) |
|
|
3. INVESTMENTS AND FAIR VALUE MEASUREMENTS (continued) |
| | | | | | | | | | | | |
| MULTI-MANAGER U.S. SMALL CAP EQUITY | | | | | | | | | | | | |
| | | |
| Investment Type | | Level 1 | | | Level 2 | | | Level 3 | |
|
| |
| | | |
Assets | | | | | | | | | | | | |
| | | |
Common Stock and/or Other Equity Investments(a) | | | | | | | | | | | | |
| | | |
Asia | | $ | 10,108,071 | | | $ | — | | | $ | — | |
| | | |
Europe | | | 33,164,838 | | | | — | | | | — | |
| | | |
North America | | | 770,612,287 | | | | — | | | | — | |
| | | |
Exchange Traded Funds | | | 1,043,280 | | | | — | | | | — | |
| | | |
Investment Company | | | 33,679,160 | | | | — | | | | — | |
|
| |
| | | |
Total | | $ | 848,607,636 | | | $ | — | | | $ | — | |
|
| |
| | (a) | Amounts are disclosed by continent to highlight the impact of time zone differences between local market close and the calculation of net asset value. Security valuations are based on the principal exchange or system on which they are traded, which may differ from country of domicile. The Funds utilize fair value model prices provided by an independent fair value service for international equities, resulting in a Level 2 classification. |
For further information regarding security characteristics, see the Schedules of Investments.
|
|
4. INVESTMENTS IN DERIVATIVES |
The following table sets forth, by certain risk types, the gross value of derivative contracts (not considered to be hedging instruments for accounting disclosure purposes) as of April 30, 2024. These instruments were used as part of the Multi-Manager International Equity Fund’s investment strategies and to obtain and/or manage exposure related to the risks below. The values in the table below excludes the effects of cash collateral received or posted pursuant to these derivative contracts, and therefore are not representative of the Funds’ net exposure.
| | | | | | | | |
| Multi-Manager International Equity | | | | | | |
| | | | |
| Risk | | Statements of Assets and Liabilities | | Assets | | Statements of Assets and Liabilities | | Liabilities |
| | | | |
| Currency | | — | | $— | | Payable for unrealized loss on forward foreign currency exchange contracts | | $(116) |
The following table sets forth, by certain risk types, the Multi-Manager International Equity Fund’s gains (losses) related to these derivatives and their indicative volumes for the six months ended April 30, 2024. These gains (losses) should be considered in the context that these derivative contracts may have been executed to create investment opportunities and/or economically hedge certain investments, and accordingly, certain gains (losses) on such derivative contracts may offset certain (losses) gains attributable to investments. These gains (losses) are included in “Net realized gain (loss)” or “Net change in unrealized gain (loss)” on the Statements of Operations:
| | | | | | |
| Multi-Manager International Equity | | | | |
| | | |
| Risk | | Statements of Operations | | Net Realized Gain | | Net Change in
Unrealized
Gain (Loss) |
| | | |
| Currency | | Net realized gain (loss) from forward foreign currency exchange contracts/Net unrealized gain(loss) on forward foreign currency exchange contracts | | $11,253 | | $(116) |
ACTIVE EQUITY MULTI-MANAGER FUNDS
|
|
4. INVESTMENTS IN DERIVATIVES (continued) |
For the six months ended April 30, 2024, the relevant values for each derivative type were as follows:
| | |
| |
| | | Notional Amounts(a) |
| |
| Fund | | Forward Contracts |
|
|
| |
| Multi-Manager International Equity | | $500,722 |
| | (a) | Amounts disclosed represent notional amounts for forward contracts, based on absolute values, which is indicative of volume for this derivative type, for the months that the Fund held such derivatives for the six months ended April 30, 2024. |
|
|
5. AGREEMENTS AND AFFILIATED TRANSACTIONS |
A. Management Agreement — Under the Agreement, GSAM manages the Funds, subject to the general supervision of the Trustees.
As compensation for the services rendered pursuant to the Agreement, the assumption of the expenses related thereto and administration of the Funds’ business affairs, including providing facilities, GSAM is entitled to a management fee, accrued daily and paid monthly, equal to an annual percentage rate of each Fund’s average daily net assets.
For the six months ended April 30, 2024, contractual and effective net management fees with GSAM were at the following rates:
| | | | | | | | | | |
| | |
| Fund | | Contractual Management Rate | | Effective Net
Management
Rate#* |
| | |
| Multi-Manager International Equity | | | | 0.60 | % | | | | 0.42 | % |
| | |
| Multi-Manager U.S. Small Cap Equity | | | | 0.75 | | | | | 0.57 | |
| | * | GSAM has agreed to waive a portion of its management fee for each Fund in order to achieve an effective net management fee rate that is equal to the actual cost of fees paid to the Fund’s Underlying Managers. These arrangements will remain in effect through at least February 28, 2025, and prior to such date, GSAM may not terminate the applicable arrangement without the approval of the Trustees. |
| | # | Effective Net Management Rate includes impact of management fee waivers of underlying funds, if any. |
The Funds invest in Institutional Shares of the Goldman Sachs Financial Square Government Fund, which is an affiliated Underlying Fund. GSAM has agreed to waive a portion of its management fee payable by the Funds in an amount equal to the management fee it earns as an investment adviser to the affiliated Underlying Funds in which the Funds invest. For the six months ended April 30, 2024, the management fees waived by GSAM for each Fund was as follows:
| | | | |
| Fund | | Management
Fee Waived | |
| |
Multi-Manager International Equity | | | $30,670 | |
| |
Multi-Manager U.S. Small Cap Equity | | | 30,910 | |
B. Transfer Agency Agreement — Goldman Sachs also serves as the transfer agent of the Funds for a fee pursuant to the Transfer Agency Agreement. The fees charged for such transfer agency services are accrued daily and paid monthly at annual rates as follows: 0.02% of the average daily net assets of Class P Shares.
C. Other Expense Agreements and Affiliated Transactions — GSAM has agreed to reduce or limit certain “Other Expenses” of the Funds (excluding acquired fund fees and expenses, transfer agency fees and expenses, service fees and shareholder administration fees (as applicable), taxes, interest, brokerage fees, expenses of shareholder meetings, litigation and indemnification, and extraordinary expenses) to the extent such expenses exceed, on an annual basis, a percentage rate of the average daily net assets of each Fund. Such Other Expense reimbursements, if any, are accrued daily and paid monthly. In addition,
ACTIVE EQUITY MULTI-MANAGER FUNDS
|
Notes to Financial Statements (continued) April 30, 2024 (Unaudited) |
|
|
5. AGREEMENTS AND AFFILIATED TRANSACTIONS (continued) |
the Funds are not obligated to reimburse GSAM for prior fiscal year expense reimbursements, if any. The Total Annual Operating Expense limitations as an annual percentage rate of average daily net assets for the Multi-Manager International Equity and Multi-Manager U.S. Small Cap Equity Funds are 0.57% and 0.80%, respectively. These Other Expense limitations will remain in place through at least February 28, 2025, and prior to such date GSAM may not terminate the arrangements without the approval of the Trustees. In addition, the Funds have entered into certain offset arrangements with the transfer agent, which may result in a reduction of the Funds’ expenses and are received irrespective of the application of the “Other Expense” limitations described above.
For the six months ended April 30, 2024, these expense reductions, including any fee waivers, were as follows:
| | | | | | | | |
| Fund | | Management
Fee Waiver | | | Total
Expense
Reductions | |
| | |
Multi-Manager International Equity | | $ | 1,313,392 | | | $ | 1,313,392 | |
| | |
Multi-Manager U.S. Small Cap Equity | | | 758,658 | | | | 758,658 | |
D. Line of Credit Facility — As of April 30, 2024, the Funds participated in a $1,150,000,000 committed, unsecured revolving line of credit facility (the “facility”) together with other funds of the Trust and certain registered investment companies having management agreements with GSAM or its affiliates. This facility is to be used for temporary emergency purposes, or to allow for an orderly liquidation of securities to meet redemption requests. The interest rate on borrowings is based on the federal funds rate. The facility also requires a fee to be paid by the Funds based on the amount of the commitment that has not been utilized. For the six months ended April 30, 2024, the Funds did not have any borrowings under the facility. Prior to April 16, 2024, the facility was $1,110,000,000.
E. Other Transactions with Affiliates — For the six months ended April 30, 2024, Goldman Sachs earned $1,437 and $2,218 in brokerage commissions from portfolio transactions, including futures transactions executed with Goldman Sachs as the Futures Commission Merchant, on behalf of the Multi-Manager International Equity and Multi-Manager U.S. Small Cap Equity Funds, respectively.
The following table provides information about the Funds’ investments in the Goldman Sachs Financial Square Government Fund as of and for the six months ended April 30, 2024:
| | | | | | | | | | | | | | | | | | | | | | | | | | |
| Fund | | Underlying Fund | | Beginning
Value as of
October 31,
2023 | | | Purchases
at Cost | | | Proceeds
from Sales | | | Ending
Value as of
April 30,
2024 | | | Shares as of
April 30,
2024 | | | Dividend
Income | |
|
| |
| | | | | | | |
Multi-Manager International Equity | | Goldman Sachs Financial Square Government Fund — Institutional Shares | | $ | 40,942,755 | | | $ | 504,316,142 | | | $ | (511,913,365 | ) | | $ | 33,345,532 | | | | 33,345,532 | | | $ | 981,175 | |
|
| |
| | | | | | | |
Multi-Manager U.S. Small Cap Equity | | Goldman Sachs Financial Square Government Fund — Institutional Shares | | | 36,290,923 | | | | 253,288,280 | | | | (255,900,043 | ) | | | 33,679,160 | | | | 33,679,160 | | | | 1,009,883 | |
|
| |
ACTIVE EQUITY MULTI-MANAGER FUNDS
|
|
6. PORTFOLIO SECURITIES TRANSACTIONS |
The cost of purchases and proceeds from sales and maturities of long-term securities for the six months ended April 30, 2024, were as follows:
| | | | | | | | | | |
| Fund | | Purchases (Excluding
U.S. Government and
Agency Obligations) | | Sales and
Maturities of (Excluding
U.S. Government and
Agency Obligations) |
| | |
Multi-Manager International Equity | | | $ | 805,861,573 | | | | $ | 751,442,476 | |
| | |
Multi-Manager U.S. Small Cap Equity | | | | 276,615,482 | | | | | 262,762,669 | |
As of the Funds’ most recent fiscal year end, October 31, 2023, the Funds’ capital loss carryforwards on a tax basis were as follows:
| | | | | | | | |
| | | Multi-Manager
International
Equity Fund | | | Multi-Manager
U.S. Small Cap
Equity Fund | |
| | |
Capital loss carryforwards: | | | | | | | | |
| | |
Perpetual Short-Term | | $ | — | | | $ | (11,565,678 | ) |
| | |
Perpetual Long-Term | | | (1,869,895 | ) | | | — | |
| | |
Total capital loss carryforwards | | | (1,869,895 | ) | | | (11,565,678 | ) |
As of April 30, 2024, the Funds’ aggregate security unrealized gains and losses based on cost for U.S. federal income tax purposes were as follows:
| | | | | | | | |
| | | Multi-Manager
International
Equity Fund | | | Multi-Manager
U.S. Small Cap
Equity Fund | |
| | |
Tax Cost | | $ | 1,206,208,859 | | | $ | 782,745,220 | |
| | |
Gross unrealized gain | | | 313,689,201 | | | | 122,827,327 | |
| | |
Gross unrealized loss | | | (67,841,754 | ) | | | (56,964,911 | ) |
| | |
Net unrealized gain | | $ | 245,847,447 | | | $ | 65,862,416 | |
The difference between GAAP-basis and tax basis unrealized gains (losses) is attributable primarily to wash sales and differences in the tax treatment of passive foreign investment company investments.
GSAM has reviewed the Funds’ tax positions for all open tax years (the current and prior three years, as applicable) and has concluded that no provision for income tax is required in the Funds’ financial statements. Such open tax years remain subject to examination and adjustment by tax authorities.
The Funds’ risks include, but are not limited to, the following:
Asset Allocation Risk — The Funds’ allocations to the various asset classes and to the Underlying Managers may cause the Funds to underperform other funds with a similar investment objective.
ACTIVE EQUITY MULTI-MANAGER FUNDS
|
Notes to Financial Statements (continued) April 30, 2024 (Unaudited) |
|
|
8. OTHER RISKS (continued) |
Derivatives Risk — The Funds’ use of derivatives and other similar instruments (collectively referred to in this paragraph as “derivatives”) may result in loss, including due to adverse market movements. Derivatives, which may pose risks in addition to and greater than those associated with investing directly in securities, currencies or other assets and instruments, may increase market exposure and be illiquid or less liquid, volatile, difficult to price and leveraged so that small changes in the value of the underlying assets or instruments may produce disproportionate losses to the Funds. Certain derivatives are also subject to counterparty risk, which is the risk that the other party in the transaction will not, or lacks the capacity or authority to, fulfill its contractual obligations, liquidity risk, which includes the risk that the Funds will not be able to exit the derivative when it is advantageous to do so, and risks arising from margin requirements, which include the risk that the Funds will be required to pay additional margin or set aside additional collateral to maintain open derivative positions. The use of derivatives is a highly specialized activity that involves investment techniques and risks different from those associated with investments in more traditional securities and instruments. Losses from derivatives can also result from a lack of correlation between changes in the value of derivative instruments and the portfolio assets (if any) being hedged.
Foreign and Emerging Countries Risk — Investing in foreign markets may involve special risks and considerations not typically associated with investing in the U.S. Foreign securities may be subject to risk of loss because of more or less foreign government regulation; less public information; less stringent investor protections; less stringent accounting, corporate governance, financial reporting and disclosure standards; and less economic, political and social stability in the countries in which a Fund invests. The imposition of sanctions, exchange controls (including repatriation restrictions), confiscation of assets and property, trade restrictions (including tariffs) and other government restrictions by the U.S. or other governments, or from problems in registration, settlement or custody, may also result in losses. The type and severity of sanctions and other similar measures, including counter sanctions and other retaliatory actions, that may be imposed could vary broadly in scope, and their impact is impossible to predict. For example, the imposition of sanctions and other similar measures could, among other things, cause a decline in the value and/or liquidity of securities issued by the sanctioned country or companies located in or economically tied to the sanctioned country and increase market volatility and disruption in the sanctioned country and throughout the world. Sanctions and other similar measures could limit or prevent a Fund from buying and selling securities (in the sanctioned country and other markets), significantly delay or prevent the settlement of securities transactions, and significantly impact a Fund’s liquidity and performance. Foreign risk also involves the risk of negative foreign currency exchange rate fluctuations, which may cause the value of securities denominated in such foreign currency (or other instruments through which a Fund has exposure to foreign currencies) to decline in value. Currency exchange rates may fluctuate significantly over short periods of time. To the extent that a Fund also invests in securities of issuers located in, or economically tied to, emerging markets, these risks may be more pronounced.
Geographic Risk — If a Fund focuses its investments in securities of issuers located in a particular country or geographic region, the Fund may be subjected, to a greater extent than if its investments were less focused, to the risks of volatile economic cycles and/or conditions and developments that may be particular to that country or region, such as: adverse securities markets; adverse exchange rates; adverse social, political, regulatory, economic, business, environmental or other developments; or natural disasters.
Index/Tracking Error Risk — To the extent that an index-tracking strategy or implementation of a sub-strategy by a transition manager is used with respect to a portion of a Fund’s assets, including through investment in an ETF that seeks to track an index or implementation of an index-tracking strategy, the Fund will be negatively affected by general declines in the securities and asset classes represented in the relevant index. There is no guarantee that the Fund, or relevant portion of the Fund, will achieve a high degree of correlation to the relevant index. Market disruptions and regulatory restrictions could have an adverse effect on the Fund’s ability, or the ability of an ETF in which it invests, to adjust its exposure to the required levels in order for the relevant portion of the Fund to track the relevant index. In addition, because that portion of the Fund is not “actively” managed, unless a specific security is removed from the relevant index, the Fund or an ETF in which it invests generally would not sell a security because the security’s issuer was in financial trouble. At times when an index-tracking strategy is used with respect to a portion of the Fund’s assets, the Fund’s performance could be lower than funds that may actively shift all of their portfolio assets to take advantage of market opportunities or to lessen the impact of a market decline or a decline in the value of one or more issuers.
ACTIVE EQUITY MULTI-MANAGER FUNDS
|
|
8. OTHER RISKS (continued) |
Investment Style Risk — Different investment styles (e.g., “growth”, “value” or “quantitative”) tend to shift in and out of favor depending upon market and economic conditions and investor sentiment. The Funds may outperform or underperform other funds that invest in similar asset classes but employ different investment styles.
Investments in Other Investment Companies Risk — As a shareholder of another investment company, including an exchange-traded fund (“ETF”), a Fund will indirectly bear its proportionate share of any net management fees and other expenses paid by such other investment companies, in addition to the fees and expenses regularly borne by the Fund. ETFs are subject to risks that do not apply to conventional mutual funds, including but not limited to the following: (i) the market price of the ETF’s shares may trade at a premium or a discount to their NAV; and (ii) an active trading market for an ETF’s shares may not develop or be maintained.
Large Shareholder Transactions Risk — A Fund may experience adverse effects when certain large shareholders, such as other funds, institutional investors (including those trading by use of non-discretionary mathematical formulas), financial intermediaries (who may make investment decisions on behalf of underlying clients and/or include a Fund in their investment model), individuals, accounts and Goldman Sachs affiliates, purchase or redeem large amounts of shares of a Fund. Such large shareholder redemptions, which may occur rapidly or unexpectedly, may cause a Fund to sell portfolio securities at times when it would not otherwise do so, which may negatively impact a Fund’s NAV and liquidity. These transactions may also accelerate the realization of taxable income to shareholders if such sales of investments resulted in gains, and may also increase transaction costs. In addition, a large redemption could result in a Fund’s current expenses being allocated over a smaller asset base, leading to an increase in a Fund’s expense ratio. Similarly, large Fund share purchases may adversely affect a Fund’s performance to the extent that the Fund is delayed in investing new cash or otherwise maintains a larger cash position than it ordinarily would.
Liquidity Risk — A Fund may make investments that are illiquid or that may become less liquid in response to market developments or adverse investor perceptions. Illiquid investments may be more difficult to value. Liquidity risk may also refer to the risk that a Fund will not be able to pay redemption proceeds within the allowable time period or without significant dilution to remaining investors’ interests because of unusual market conditions, declining prices of the securities sold, an unusually high volume of redemption requests, or other reasons. To meet redemption requests, a Fund may be forced to sell investments at an unfavorable time and/or under unfavorable conditions. If a Fund is forced to sell securities at an unfavorable time and/or under unfavorable conditions, such sales may adversely affect a Fund’s NAV and dilute remaining investors’ interests. Liquidity risk may be the result of, among other things, the reduced number and capacity of traditional market participants to make a market in fixed income securities or the lack of an active market. The potential for liquidity risk may be magnified by a rising interest rate environment or other circumstances where investor redemptions from fixed income funds may be higher than normal, potentially causing increased supply in the market due to selling activity. These risks may be more pronounced in connection with the Funds’ investments in securities of issuers located in emerging market countries. Redemptions by large shareholders may have a negative impact on a Fund’s liquidity.
Market and Credit Risks — In the normal course of business, a Fund trades financial instruments and enters into financial transactions where risk of potential loss exists due to changes in the market (market risk). The value of the securities in which a Fund invests may go up or down in response to the prospects of individual companies, particular sectors or governments and/or general economic conditions throughout the world due to increasingly interconnected global economies and financial markets. Events such as war, military conflict, acts of terrorism, social unrest, natural disasters, recessions, inflation, rapid interest rate changes, supply chain disruptions, sanctions, the spread of infectious illness or other public health threats could also significantly impact a Fund and its investments. Additionally, a Fund may also be exposed to credit risk in the event that an issuer or guarantor fails to perform or that an institution or entity with which a Fund has unsettled or open transactions defaults.
Mid-Cap and Small-Cap Risk — Investments in mid-capitalization and small-capitalization companies involve greater risks than those associated with larger, more established companies. These securities may be subject to more abrupt or erratic price movements and may lack sufficient market liquidity, and these issuers often face greater business risks.
ACTIVE EQUITY MULTI-MANAGER FUNDS
|
Notes to Financial Statements (continued) April 30, 2024 (Unaudited) |
|
|
8. OTHER RISKS (continued) |
Multi-Manager Approach Risk — The Funds’ performance depends on the ability of the Investment Adviser in selecting, overseeing, and allocating Fund assets to the Underlying Managers. The Underlying Managers’ investment styles may not always be complementary. The Funds’ multi-manager approach may result in the Fund investing a significant percentage of its assets in certain types of investments, which could be beneficial or detrimental to the Funds’ performance depending on the performance of those investments and the overall market environment. The Funds’ Underlying Managers may underperform the market generally or underperform other investment managers that could have been selected for the Funds. Because the Funds’ Underlying Managers may trade with counterparties, prime brokers, clearing brokers or futures commission merchants on terms that are different than those on which the Investment Adviser would trade, and because each Underlying Manager applies its own risk analysis in evaluating potential counterparties for the Funds, the Funds may be subject to greater counterparty risk than if they were managed directly by the Investment Adviser.
Under the Trust’s organizational documents, its Trustees, officers, employees and agents are indemnified, to the extent permitted by the Act and state law, against certain liabilities that may arise out of performance of their duties to the Funds. Additionally, in the course of business, the Funds enter into contracts that contain a variety of indemnification clauses. The Funds’ maximum exposure under these arrangements is unknown, as this would involve future claims that may be made against the Funds that have not yet occurred. However, GSAM believes the risk of loss under these arrangements to be remote.
Subsequent events after the Statements of Assets and Liabilities date have been evaluated, and GSAM has concluded that there is no impact requiring adjustment or disclosure in the financial statements.
|
|
11. SUMMARY OF SHARE TRANSACTIONS |
Share activity is as follows:
| | | | | | | | | | | | | | | | |
| | | Multi-Manager International Equity Fund | |
| | |
| | | For the Six Months Ended April 30, 2024 (Unaudited) | | | For the Fiscal Year Ended
October 31, 2023 | |
| |
| | | | |
| | | | |
| | | Shares | | | Dollars | | | Shares | | | Dollars | |
| |
| | | | |
| | | | |
Class P Shares | | | | | | | | | | | | | | | | |
| | | | |
Shares sold | | | 10,435,101 | | | $ | 149,416,310 | | | | 10,853,620 | | | $ | 143,090,181 | |
| | | | |
Reinvestment of distributions | | | 1,650,188 | | | | 22,657,088 | | | | 1,364,878 | | | | 16,119,210 | |
| | | | |
Shares redeemed | | | (8,154,362 | ) | | | (116,510,707 | ) | | | (20,159,485 | ) | | | (256,849,962 | ) |
|
| |
| | | | |
NET INCREASE (DECREASE) | | | 3,930,927 | | | $ | 55,562,691 | | | | (7,940,987 | ) | | $ | (97,640,571 | ) |
|
| |
ACTIVE EQUITY MULTI-MANAGER FUNDS
|
|
11. SUMMARY OF SHARE TRANSACTIONS (continued) |
| | | | | | | | | | | | | | | | |
| | | Multi-Manager U.S. Small Cap Equity Fund | |
| | |
| | | For the Six Months Ended
April 30, 2024 (Unaudited) | | | For the Fiscal Year Ended
October 31, 2023 | |
| |
| | | | |
| | | | |
| | | Shares | | | Dollars | | | Shares | | | Dollars | |
| |
| | | | |
| | | | |
Class P Shares | | | | | | | | | | | | | | | | |
| | | | |
Shares sold | | | 5,531,703 | | | $ | 75,490,070 | | | | 11,178,433 | | | $ | 139,489,002 | |
| | | | |
Reinvestment of distributions | | | 383,571 | | | | 5,116,836 | | | | 284,048 | | | | 3,365,968 | |
| | | | |
Shares redeemed | | | (5,451,774 | ) | | | (74,495,983 | ) | | | (4,731,818 | ) | | | (59,610,549 | ) |
|
| |
| | | | |
NET INCREASE | | | 463,500 | | | $ | 6,110,923 | | | | 6,730,663 | | | $ | 83,244,421 | |
|
| |
ACTIVE EQUITY MULTI-MANAGER FUNDS
| | |
| | |
| Fund Expenses — Six Month Period Ended April 30, 2024 (Unaudited) | | |
As a shareholder of Class P Shares of the Funds, you incur two types of costs: (1) transaction costs, and (2) ongoing costs, including management fees; and other Fund expenses. This example is intended to help you understand your ongoing costs (in dollars) of investing in the Funds and to compare these costs with the ongoing costs of investing in other mutual funds.
The example is based on an investment of $1,000 invested at the beginning of the period and held for the entire period from November 1, 2023 through April 30, 2024, which represents a period of 182 days of a 366 day year. This projection assumes that annualized expense ratios were in effect during the period.
Actual Expenses — The first line in the table below provides information about actual account values and actual expenses. You may use the information in this line, together with the amount you invested, to estimate the expenses that you paid over the period. Simply divide your account value by $1,000 (for example, an $8,600 account value divided by $1,000=8.6), then multiply the result by the number in the first line under the heading entitled “Expenses Paid” to estimate the expenses you paid on your account during this period.
Hypothetical Example for Comparison Purposes — The second line in the table below provides information about hypothetical account values and hypothetical expenses based on the Funds’ actual net expense ratios and an assumed rate of return of 5% per year before expenses, which is not the Funds’ actual return. The hypothetical account values and expenses may not be used to estimate the actual ending account balance or expenses you paid for the period. You may use this information to compare the ongoing costs of investing in the Funds and other funds. To do so, compare this 5% hypothetical example with the 5% hypothetical examples that appear in the shareholder reports of the other funds.
Please note that the expenses shown in the table are meant to highlight your ongoing costs only and do not reflect any transactional costs, such as sales charges, redemption fees, or exchange fees. Therefore, the second line of the table is useful in comparing ongoing costs only, and will not help you determine the relative total costs of owning different funds. In addition, if these transactional costs were included, your costs would have been higher.
| | | | | | | | | | | | | | | | | | | | | | | | |
| | | Multi-Manager International Equity Fund | | | Multi-Manager U.S. Small Cap Equity Fund | |
| | | | | | | |
| Share Class | | Beginning
Account
Value
11/1/23 | | | Ending
Account Value
4/30/24 | | | Expenses Paid for the 6 months ended 4/30/24* | | | Beginning Account Value
11/1/23 | | | Ending
Account Value
4/30/24 | | | Expenses Paid for the 6 months ended 4/30/24* | |
| Class P | | | | | | | | | | | | | | | | | | | | | | | | |
Actual | | | $1,000.00 | | | | $1,170.70 | | | | $2.80 | | | | $1,000.00 | | | | $1,170.70 | | | | $3.75 | |
Hypothetical 5% return | | | 1,000.00 | | | | 1,022.30 | + | | | 2.61 | | | | 1,000.00 | | | | 1,021.40 | + | | | 3.49 | |
| * | Expenses for each share class are calculated using the Fund’s annualized net expense ratio for each class, which represents the ongoing expenses as a percentage of net assets for the six months ended April 30, 2024. Expenses are calculated by multiplying the annualized net expense ratio by the average account value for the period; then multiplying the result by the number of days in the most recent fiscal half year; and then dividing that result by the number of days in the fiscal year. The annualized net expense ratios for the period were as follows: |
| | | | | | |
Fund | | Class P | | | |
| | |
Multi-Manager International Equity | | | 0.52 | % | | |
Multi-Manager U.S. Small Cap Equity | | | 0.70 | | | |
| + | Hypothetical expenses are based on the Fund’s actual annualized net expense ratio (excluding proxy fee which is not annualized) and an assumed rate of return of 5% per year before expenses. |
34
ACTIVE EQUITY MULTI-MANAGER FUNDS
Liquidity Risk Management Program (Unaudited)
Each Fund has adopted and implemented a liquidity risk management program (the “Program”) in accordance with Rule 22e-4 under the 1940 Act. The Program seeks to assess and manage each Fund’s liquidity risk, i.e., the risk that a Fund is unable to satisfy redemption requests without significantly diluting remaining investors’ interests in the Fund. The Board of Trustees of the Trust has designated GSAM, each Fund’s investment adviser, to administer the Program. Certain aspects of the Program rely on third parties to perform certain functions, including the provision of market data and application of models.
The Program is comprised of various components designed to support the assessment and/or management of liquidity risk, including: (1) the periodic assessment (no less frequently than annually) of certain factors that influence a Fund’s liquidity risk; (2) the periodic classification (no less frequently than monthly) of a Fund’s investments into one of four liquidity categories that reflect an estimate of their liquidity under current market conditions; (3) a 15% limit on the acquisition of “illiquid investments” (as defined under Rule 22e-4); (4) for a Fund that does not invest primarily in “highly liquid investments” (as defined under Rule 22e-4), the determination of a minimum percentage of the Fund’s assets that will generally be invested in highly liquid investments (a “Highly Liquid Investment Minimum”); and (5) periodic reporting to the Board of Trustees.
At a meeting of the Board of Trustees on February 13-14, 2024, GSAM provided a written report to the Board addressing the operation, and the adequacy and effectiveness of the implementation, of the Program, including, as applicable, the operation of any Highly Liquid Investment Minimum and any material changes to the Program, for the period from January 1, 2023 through December 31, 2023 (the “Reporting Period”). Among other things, the annual report discussed: (1) the results of stress tests designed to assess liquidity under a hypothetical stressed scenario involving elevated redemptions; (2) an assessment of the methodologies used to classify investments into one of four liquidity categories; and (3) the impact of local holidays in non-U.S. jurisdictions. The report concluded that the Program continues to be reasonably designed to assess and manage liquidity risk and was adequately and effectively implemented during the Reporting Period.
There can be no assurance that the Program will achieve its objectives under all circumstances in the future. Please refer to your Fund’s prospectus for more information regarding the Fund’s exposure to liquidity risk and other risks to which it may be subject.
ACTIVE EQUITY MULTI-MANAGER FUNDS
Voting Results of Annual Meeting of Shareholders (Unaudited)
A Special Meeting of Shareholders (the “Meeting”) of the Goldman Sachs Trust II (the “Trust”) was held on November 16, 2023 to consider and elect nominees to the Trust’s Board of Trustees. At the Meeting, Gregory G. Weaver, Dwight L. Bush, Kathryn A. Cassidy, John G. Chou, Joaquin Delgado, Eileen H. Dowling and Paul C. Wirth were elected to the Trust’s Board of Trustees. In electing the nominees, the Trust’s shareholders voted as follows:
| | | | | | | | | | | | |
| Proposal | | | | | | | | |
| Election of Trustees | | For | | | | | Withheld | |
| | | | | | | | | | | | |
| | | |
Gregory G. Weaver | | | 1,292,078,725 | | | | | | | | 63,531,552 | |
| | | | | | | | | | | | |
| |
| | | |
Dwight L. Bush | | | 1,339,529,258 | | | | | | | | 16,081,019 | |
| | | | | | | | | | | | |
| |
| | | |
Kathryn A. Cassidy | | | 1,340,407,606 | | | | | | | | 15,202,670 | |
| | | | | | | | | | | | |
| |
| | | |
John G. Chou | | | 1,351,547,930 | | | | | | | | 4,062,346 | |
| | | | | | | | | | | | |
| |
| | | |
Joaquin Delgado | | | 1,340,312,893 | | | | | | | | 15,297,383 | |
| | | | | | | | | | | | |
| |
| | | |
Eileen H. Dowling | | | 1,351,944,019 | | | | | | | | 3,666,258 | |
| | | | | | | | | | | | |
| |
| | | |
Paul C. Wirth | | | 1,350,994,736 | | | | | | | | 4,615,540 | |
| | | | | | | | | | | | | |
FUNDS PROFILE
Goldman Sachs Funds
Goldman Sachs is a premier financial services firm, known since 1869 for creating thoughtful and customized investment solutions in complex global markets.
Today, the Asset Management Division of Goldman Sachs serves a diverse set of clients worldwide, including private institutions, public entities and individuals. With approximately $2.56 trillion in assets under supervision as of March 31, 2024, Goldman Sachs Asset Management has portfolio management teams located around the world and our investment professionals bring firsthand knowledge of local markets to every investment decision. Assets under supervision includes assets under management and other client assets for which Goldman Sachs does not have full discretion. Goldman Sachs Asset Management leverages the resources of Goldman Sachs & Co. LLC subject to legal, internal and regulatory restrictions.
Money Market
Financial Square FundsSM
| ∎ | Financial Square Treasury Solutions Fund1 |
| ∎ | Financial Square Government Fund1 |
| ∎ | Financial Square Money Market Fund2 |
| ∎ | Financial Square Prime Obligations Fund2 |
| ∎ | Financial Square Treasury Instruments Fund1 |
| ∎ | Financial Square Treasury Obligations Fund1 |
| ∎ | Financial Square Federal Instruments Fund1 |
Investor FundsSM
| ∎ | Investor Money Market Fund3 |
| ∎ | Investor Tax-Exempt Money Market Fund3 |
Fixed Income
Short Duration and Government
| ∎ | Short-Term Conservative Income Fund |
| ∎ | Short Duration Government Fund |
| ∎ | Short Duration Bond Fund |
| ∎ | Inflation Protected Securities Fund |
Multi-Sector
| ∎ | Global Core Fixed Income Fund |
Municipal and Tax-Free
| ∎ | High Yield Municipal Fund |
| ∎ | Dynamic Municipal Income Fund |
| ∎ | Short Duration Tax-Free Fund |
| ∎ | Municipal Income Completion Fund |
Single Sector
| ∎ | Investment Grade Credit Fund |
| ∎ | High Yield Floating Rate Fund |
| ∎ | Emerging Markets Debt Fund |
| ∎ | Emerging Markets Credit Fund |
Fixed Income Alternatives
| ∎ | Short Duration High Yield Fund4 |
Fundamental Equity
| ∎ | Small/Mid Cap Value Fund |
| ∎ | Small/Mid Cap Growth Fund |
| ∎ | Enhanced Core Equity Fund5 |
| ∎ | Technology Opportunities Fund |
| ∎ | Rising Dividend Growth Fund |
Tax-Advantaged Equity
| ∎ | U.S. Tax-Managed Equity Fund |
| ∎ | International Tax-Managed Equity Fund |
| ∎ | U.S. Equity Dividend and Premium Fund |
| ∎ | International Equity Dividend and Premium Fund |
Equity Insights
| ∎ | Small Cap Equity Insights Fund |
| ∎ | U.S. Equity Insights Fund |
| ∎ | Small Cap Growth Insights Fund |
| ∎ | Large Cap Growth Insights Fund |
| ∎ | Large Cap Value Insights Fund |
| ∎ | Small Cap Value Insights Fund |
| ∎ | International Small Cap Insights Fund |
| ∎ | International Equity Insights Fund |
| ∎ | Emerging Markets Equity Insights Fund |
Fundamental Equity International
| ∎ | International Equity Income Fund |
| ∎ | International Equity ESG Fund |
| ∎ | Emerging Markets Equity Fund |
| ∎ | Emerging Markets Equity ex. China Fund |
| ∎ | ESG Emerging Markets Equity Fund |
Alternative
| ∎ | Clean Energy Income Fund |
| ∎ | Real Estate Securities Fund |
| ∎ | Global Real Estate Securities Fund |
| ∎ | Absolute Return Tracker Fund |
| ∎ | Managed Futures Strategy Fund |
| ∎ | MLP Energy Infrastructure Fund |
| ∎ | Energy Infrastructure Fund |
| ∎ | Multi-Strategy Alternatives Fund |
| ∎ | Global Infrastructure Fund |
Total Portfolio Solutions
| ∎ | Global Managed Beta Fund |
| ∎ | Multi-Manager Non-Core Fixed Income Fund |
| ∎ | Multi-Manager Global Equity Fund |
| ∎ | Multi-Manager International Equity Fund |
| ∎ | Tactical Tilt Overlay Fund |
| ∎ | Balanced Strategy Portfolio |
| ∎ | Multi-Manager U.S. Small Cap Equity Fund |
| ∎ | Multi-Manager Real Assets Strategy Fund |
| ∎ | Growth and Income Strategy Portfolio |
| ∎ | Growth Strategy Portfolio |
| ∎ | Dynamic Global Equity Fund |
| ∎ | Enhanced Dividend Global Equity Portfolio |
| ∎ | Tax-Advantaged Global Equity Portfolio |
| ∎ | Strategic Factor Allocation Fund |
| ∎ | Strategic Volatility Premium Fund |
| ∎ | Goldman Sachs GQG Partners International Opportunities Fund |
| 1 | You could lose money by investing in the Fund. Although the Fund seeks to preserve the value of your investment at $1.00 per share, it cannot guarantee it will do so. An investment in the Fund is not a bank account or a deposit of a bank and is not insured or guaranteed by the Federal Deposit Insurance Corporation or any other government agency. The Fund’s sponsor is not required to reimburse the Fund for losses, and you should not expect that the sponsor will provide financial support to the Fund at any time, including during periods of market stress. |
| 2 | You could lose money by investing in the Fund. Because the share price of the Fund will fluctuate, when you sell your shares they may be worth more or less than what you originally paid for them. The Fund may impose a fee upon sale of your shares. Effective October 2, 2024, the Fund generally must impose a fee when net sales of Fund shares exceed certain levels. An investment in the Fund is not a bank account or a deposit of a bank and is not insured or guaranteed by the Federal Deposit Insurance Corporation or any other government agency. The Fund’s sponsor is not required to reimburse the Fund for losses, and you should not expect that the sponsor will provide financial support to the Fund at any time, including during periods of market stress. |
| 3 | You could lose money by investing in the Fund. Although the Fund seeks to preserve the value of your investment at $1.00 per share, it cannot guarantee it will do so. The Fund may impose a fee upon sale of your shares. An investment in the Fund is not a bank account or a deposit of a bank and is not insured or guaranteed by the Federal Deposit Insurance Corporation or any other government agency. The Fund’s sponsor is not required to reimburse the Fund for losses, and you should not expect that the sponsor will provide financial support to the Fund at any time, including during periods of market stress. |
| 4 | Effective after the close of business on April 17, 2024, the Goldman Sachs Long Short Credit Strategies Fund was renamed the Goldman Sachs Short Duration High Yield Fund. |
| 5 | Effective after the close of business on February 13, 2024, the Goldman Sachs Flexible Cap Fund was renamed the Goldman Sachs Enhanced Core Equity Fund. |
| 6 | Effective after the close of business on June 17, 2024, the Goldman Sachs Strategic Income Fund was renamed the Goldman Sachs Dynamic Bond Fund. |
| | Financial Square FundsSM and Investor FundsSM are registered service marks of Goldman Sachs & Co. LLC. |
| * | This list covers open-end funds only. Please visit our website at www.GSAMFUNDS.com to learn more about our closed-end funds and exchange-traded funds. |
TRUSTEES OFFICERS Gregory G. Weaver, Chair James A. McNamara, President Cheryl K. Beebe Joseph F. DiMaria, Principal Financial Officer, Principal Dwight L. Bush Accounting Officer and Treasurer Kathryn A. Cassidy Robert Griffith, Secretary John G. Chou Joaquin Delgado Eileen H. Dowling Lawrence Hughes John F. Killian Steven D. Krichmar Michael Latham James A. McNamara Lawrence W. Stranghoener Paul C. Wirth GOLDMAN SACHS & CO. LLC GOLDMAN SACHS ASSET MANAGEMENT, L.P. Distributor and Transfer Agent Investment Adviser Visit our website at www.GSAMFUNDS.com to obtain the most recent month-end returns. Goldman Sachs Asset Management, L.P., 200 West Street, New York, New York 10282 Neither MSCI nor any other party involved in or related to compiling, computing, or creating the MSCI data makes any express or implied warranties or representations with respect to such data (or the results to be obtained by the use thereof), and all such parties hereby expressly disclaim all warranties of originality, accuracy, completeness, merchantability, or fitness for a particular purpose with respect to any of such data. Without limiting any of the foregoing, in no event shall MSCI, any of its affiliates or any third party involved in or related to compiling, computing or creating the data have any liability for any direct, indirect, special, punitive, consequential or any other damages (including lost profits) even if notified of the possibility of such damages. No further distribution or dissemination of the MSCI data is permitted without MSCI’s express written consent. The reports concerning the Funds included in this shareholder report may contain certain forward-looking statements about the factors that may affect the performance of the Funds in the future. These statements are based on Fund management’s predictions and expectations concerning certain future events and their expected impact on the Funds, such as performance of the economy as a whole and of specific industry sectors, changes in the levels of interest rates, the impact of developing world events, and other factors that may influence the future performance of the Funds. Management believes these forward-looking statements to be reasonable, although they are inherently uncertain and difficult to predict. Actual events may cause adjustments in portfolio management strategies from those currently expected to be employed. A description of the policies and procedures that the Funds use to determine how to vote proxies relating to portfolio securities and information regarding how a Fund voted proxies relating to portfolio securities during the most recent 12-month period ended June 30 is available (i) without charge, upon request by calling 1-800-526-7384 (for Retail Shareholders) or 1-800-621-2550 (for Institutional Shareholders); and (ii) on the Securities and Exchange Commission (“SEC”) web site at http://www.sec.gov. The Funds will file its portfolio holdings information for each month in a fiscal quarter within 60 days after the end of the relevant fiscal quarter on Form N-PORT. Portfolio holdings information for the third month of each fiscal quarter will be made available on the SEC’s web site at http://www.sec.gov. Portfolio holdings information may be obtained upon request and without charge by calling 1-800-621-2550. Fund holdings and allocations shown are unaudited, and may not be representative of current or future investments. Fund holdings and allocations may not include a Fund’s entire investment portfolio, which may change at any time. Fund holdings should not be relied on in making investment decisions and should not be construed as research or investment advice regarding particular securities. Current and future holdings are subject to risk. The Global Industry Classification Standard (GICS) was developed by and is the exclusive property and a service mark of Morgan Stanley Capital International Inc. (MSCI) and Standard & Poor’s, a division of The McGraw-Hill Companies, Inc. (S&P) and is licensed for use by Goldman Sachs. Neither MSCI, S&P nor any other party involved in making or compiling the GICS or any GICS classifications makes any express or implied warranties or representations with respect to such standard or classification (or the results to be obtained by the use thereof), and all such parties hereby expressly disclaim all warranties of originality, accuracy, completeness, merchantability or fitness for a particular purpose with respect to any of such standard or classification. Without limiting any of the foregoing, in no event shall MSCI, S&P, any of their affiliates or any third party involved in making or compiling the GICS or any GICS classifications have any liability for any direct, indirect, special, punitive, consequential or any other damages (including lost profits) even if notified of the possibility of such damages. The portfolio risk management process includes an effort to monitor and manage risk, but does not imply low risk. Fund holdings and allocations shown are as of April 30, 2024 and may not be representative of future investments. Fund holdings should not be relied on in making investment decisions and should not be construed as research or investment advice regarding particular securities. Current and future holdings are subject to risk. This material is not authorized for distribution to prospective investors unless preceded or accompanied by a current prospectus or summary prospectus, if applicable. Investors should consider a Fund’s objective, risks, and charges and expenses, and read the summary prospectus, if available, and/or the prospectus carefully before investing or sending money. The summary prospectus, if available, and the prospectus contain this and other information about a Fund’s and may be obtained from your authorized dealer or from Goldman Sachs & Co. LLC by calling 1-800-526-7384 (for Retail Shareholders) or 1-800-621-2550 (for Institutional Shareholders). © 2024 Goldman Sachs. All rights reserved. 374625-OTU-2051997 MMGRFDSSAR-24
Goldman Sachs Funds
Semi-Annual Report April 30, 2024
Goldman Sachs GQG Partners
International Opportunities Fund
Goldman Sachs GQG Partners International Opportunities Fund
TABLE OF CONTENTS
|
| Effective January 24, 2023, open-end mutual funds and exchange-traded funds are required to provide shareholders with streamlined annual and semi-annual shareholder reports (“Tailored Shareholder Reports”). Funds will be required to prepare a separate Tailored Shareholder Report for each share class of a fund that highlights key information to investors. Other information, including financial statements, will no longer appear in a fund’s shareholder report, but will be available online, delivered free of charge upon request, and filed with the Securities and Exchange Commission on a semi-annual basis on Form N-CSR. The new requirements have a compliance date of July 24, 2024. |
| | | | |
| | | |
| NOT FDIC-INSURED | | May Lose Value | | No Bank Guarantee |
MARKET REVIEW
Goldman Sachs GQG Partners International Opportunities Fund
The following are highlights both of key factors affecting the international and emerging markets equity markets and of any key changes made to the Goldman Sachs GQG Partners International Opportunities Fund (the “Fund”) during the six months ended April 30, 2024 (the “Reporting Period”). Attribution highlights are provided if the Fund materially outperformed or underperformed its benchmark index during the Reporting Period. A streamlined annual shareholder report covering the 12 months ended October 31, 2024 will be provided to Fund shareholders, per new Securities and Exchange Commission (“SEC”) requirements with a compliance date of July 24, 2024.
Market and Economic Review
International Equities
| ∎ | International (or non-U.S. developed markets) equity markets recorded double-digit positive returns during the Reporting Period and outperformed emerging markets equities. |
| ∎ | As the Reporting Period began in November 2023, international equities performed strongly, as waning inflation numbers globally indicated towards a peaking of central bank tightening cycles. |
| ∎ | International equities continued to perform well in December 2023, with the late-year rally fueled by expectations of interest rate cuts in 2024 amid falling inflation numbers and the fizzling out of the “higher for longer” narrative. |
| ∎ | International equities posted solid positive returns for the first quarter of 2024. While continuing to temper interest rate cut expectations, markets welcomed positive readouts both from corporate earnings reports and macroeconomic indicators. |
| | ∎ | European equities gained, with economically-sensitive sectors, such as industrials and consumer discretionary, leading the advance, as Europe demonstrated economic resilience and an improving outlook. Its Purchasing Manager’s Index (“PMI”) rose to 49.9 in March, approaching expansionary territory. On the other hand, interest rate-sensitive sectors, such as real estate and utilities, suffered from the European Central Bank’s (“ECB”) cautionary guidance, which diminished expectations of imminent interest rate cuts. However, inflation continued to approach the ECB’s 2% target, cooling to 2.6% in February. |
| | ∎ | Similarly, in the U.K., inflation fell to 3.4% in February, its lowest level since September 2021. Nonetheless, the U.K. equity market lagged those of other developed markets, though remaining in positive territory. The U.K. market was challenged somewhat by underwhelming corporate earnings as well as by poor economic data signaling that the U.K. had entered a technical recession in the fourth quarter of 2023. (A technical recession is two successive quarters of negative economic growth.) |
| | ∎ | Japanese equity markets carried their strong 2023 momentum into the first months of 2024. Japan may have reached an inflection point in its economic cycle with the return of inflation and wage growth, a positive development, particularly for foreign investors who have seen Japan as an opportunity to rotate out of China. The Bank of Japan (“BoJ”) put an end to its negative interest rate policy, in place for eight years. Inflation as well as a weaker yen were tailwinds for Japanese corporate earnings, which, in turn, surprised to the upside. |
| ∎ | Despite positive macroeconomic indicators, particularly in Europe, international developed markets fell in April 2024 as expectations of interest rate cuts meaningfully diminished. |
| | ∎ | European equities’ decline was largely attributable to the return of the “higher for longer” narrative. However, the region’s inflation reading was widely expected to be 2.4% in April, remaining stable relative to March and thus fueling expectations that the first ECB interest rate cut may come in June 2024. Moreover, the region’s first quarter Gross Domestic Product expanded by 0.3% quarter-over-quarter and its PMI reached an 11-month high at 51.4, entering expansionary territory. |
| | ∎ | The U.K. equity market was the best performing major region in April, posting a positive total return. U.K. equity market performance was also buoyed by sterling weakness and a recovery in commodity prices. |
| | ∎ | The Japanese equity market declined in April. After an especially strong first quarter of 2024, the Japanese equity market saw some correction in April. This was most prevalent in the form of profit taking from large-cap and semiconductor stocks. Also, after putting an end to its negative rate policy in the first calendar quarter, the BoJ did not take any further action during its April meeting. Despite positive wage growth, there were concerns that imported inflation due to the interest rate differential between Japan and other developed markets may weaken domestic consumption. |
MARKET REVIEW
Emerging Markets Equities
| ∎ | Emerging markets equities posted double-digit positive returns but lagged international equity markets during the Reporting Period. |
| ∎ | As the Reporting Period began in November 2023, emerging markets equities generated gains, supported by the view that developed markets’ interest rates had reached their peak. |
| ∎ | In December 2023, emerging markets equities rose, proving to be beneficiaries of the widening view that U.S. interest rates were likely to fall more quickly than previously anticipated. A series of lower than consensus expected inflation reports in Europe and the U.S. were key drivers of such rate expectations. Adding to positive sentiment for emerging markets equities were high consensus earnings growth forecasts for emerging markets for 2024 and 2025. |
| ∎ | Emerging markets equities gained modestly for the first quarter of 2024 overall, falling in January but then posting positive returns in February and March, buoyed by global macroeconomic data that showed encouraging signs. |
| | ∎ | China’s equity market stabilized somewhat, as the National Peoples’ Congress announced positive fiscal and monetary support and travel data around the Lunar New Year demonstrated encouraging activity levels in line with pre-pandemic totals. |
| | ∎ | India maintained strong positive returns from 2023 into 2024, as both domestic and foreign investor flows boosted its equity market and as investors continued to see value in the country’s long-term, domestically-driven growth story. |
| | ∎ | Latin American equity markets saw divergent fortunes. Brazil significantly underperformed emerging markets equities broadly, as larger stocks disappointed on poor dividend payouts and on poor performance of commodity-related stocks. On the other hand, Mexico performed well, as the supply-chain diversification trend attracted investment. |
| | ∎ | Taiwan and South Korea posted strong returns toward the end of the quarter, as semiconductor prices showed signs of recovery from the post-pandemic slump and as the improving forecast for chip demand, in part driven by artificial intelligence (“AI”)-related products, boosted earnings forecasts. |
| | ∎ | Egypt saw the greatest weakness, as the International Monetary Fund announced it would tie payments of an $8 billion financial program to improvements in currency access. This led to a sharp decline in the local currency, which contributed to poor performance of its equity market. |
| ∎ | The emerging markets equity market was modestly positive in April 2024. |
| | ∎ | The Asian region generally performed best, mainly driven by China, while Latin America continued to be the weakest region, with major markets, such as Brazil and Mexico, posting declines. |
| | ∎ | Overall, emerging markets’ currencies struggled as U.S. interest rate views changed rapidly during the month. In turn, rate cut hopes in the emerging markets were also pushed back, with some countries, such as Indonesia, hiking interest rates to defend their currencies. |
| | ∎ | The main driver of returns was improvement in risk appetite for China, as indicated by positive flows into the Chinese equity market from both domestic and foreign investors. These flows were likely driven by attractive valuations in the context of earnings forecasts and historical averages; better than expected economic activity data; and supportive policy measures in financial markets and the real estate sector. India also had a strong month. |
| | ∎ | In Taiwan, the key theme for April continued to be the AI supply chain. Strong AI-driven demand was positive but a slower recovery in semiconductor demand outside of AI meant the overall Taiwan market consolidated for the month following a strong rally in the first quarter of 2024. Separately, South Korea’s equity market meaningfully corrected. |
Fund Changes and Highlights
| ∎ | The Fund generated strongly positive double-digit absolute returns during the Reporting Period and outperformed its benchmark, the MSCI ACWI ex USA Index (Net, Unhedged) (the “Index”). |
| ∎ | The Fund’s relative outperformance was largely the result of asset allocation decisions, particularly an overweighted position versus the Index in the information technology sector. |
| ∎ | In terms of stock selection, investments in the information technology and utilities sectors added to relative performance, but these positive results were partly offset by selection within the energy and materials sectors, which detracted. |
MARKET REVIEW
| ∎ | Among individual holdings, a position in U.S. semiconductor company NVIDIA added most to the Fund’s relative performance. Conversely, an investment in Canadian e-commerce company Shopify hurt relative returns the most. |
| ∎ | From a regional perspective, the Fund benefited from its overweights compared to the Index in the emerging markets and in North America, particularly the U.S. This was partially offset by an underweight position and poor stock selection in Japan, which detracted from relative performance. |
| ∎ | Effective January 24, 2024, Siddharth Jain became deputy portfolio manager for the Fund. Rajiv Jain, Brian Kersmanc and Sudarshan Murthy continued to serve as portfolio managers for the Fund. Rajiv Jain, Chairman and Chief Investment Officer of GQG Partners, has managed the Fund since December 2016. Brian Kersmanc, Portfolio Manager and Senior Investment Analyst, GQG Partners, has managed the Fund since September 2019. Sudarshan Murthy, CFA, Portfolio Manager and Senior Investment Analyst, GQG Partners, has managed the Fund since July 2022. |
FUND BASICS
Goldman Sachs GQG Partners International Opportunities Fund
as of April 30, 2024
| | | | | | |
| | | |
November 1, 2023–April 30, 2024 | | Fund Total
Return
(based on NAV)1 | | MSCI ACWI ex USA
(Net, unhedged)2 | | |
| | | |
Class A | | 27.68% | | 17.69% | | |
| | | |
Class C | | 27.17 | | 17.69 | | |
| | | |
Institutional | | 27.89 | | 17.69 | | |
| | | |
Investor | | 27.84 | | 17.69 | | |
| | | |
Class R6 | | 27.93 | | 17.69 | | |
| | | |
Class R | | 27.54 | | 17.69 | | |
| | | |
Class P | | 27.87 | | 17.69 | | |
| | 1 | The net asset value (“NAV”) represents the net assets of the class of the Fund (ex-dividend) divided by the total number of shares of the class outstanding. The Fund’s performance assumes the reinvestment of dividends and other distributions. The Fund’s performance does not reflect the deduction of any applicable sales charges. |
| | 2 | The MSCI ACWI ex USA Index (Net, unhedged) is an international equity index that tracks stocks from 22 developed and 24 emerging markets countries. Developed countries include Australia, Austria, Belgium, Canada, Denmark, Finland, France, Germany, Hong Kong, Ireland, Israel, Italy, Japan, the Netherlands, New Zealand, Norway, Portugal, Singapore, Spain, Sweden, Switzerland, and the U.K. Emerging markets countries include: Brazil, Chile, China, Colombia, Czech Republic, Egypt, Greece, Hungary, India, Indonesia, Korea, Kuwait, Malaysia, Mexico, Peru, Philippines, Poland, Qatar, Saudi Arabia, South Africa, Taiwan, Thailand, Turkey and United Arab Emirates. It is not possible to invest directly in an unmanaged index. |
| | | The returns set forth in the table above represent past performance. Past performance does not guarantee future results. The Fund’s investment return and principal value will fluctuate so that an investor’s shares, when redeemed, may be worth more or less than their original cost. Current performance may be lower or higher than the performance quoted above. Please visit our web site at www.GSAMFUNDS.com to obtain the most recent month-end returns. Performance reflects applicable fee waivers and/or expense limitations in effect during the periods shown. In their absence, performance would be reduced. Returns do not reflect the deduction of taxes that a shareholder would pay on Fund distributions or the redemption of Fund shares. |
|
|
TOP TEN HOLDINGS AS OF 4/30/24± |
| | | | |
| | |
Holding | | % of Net Assets | | Line of Business |
| | |
Novo Nordisk AS | | 7.4% | | Pharmaceuticals |
AstraZeneca PLC | | 4.9 | | Pharmaceuticals |
Petroleo Brasileiro SA | | 4.7 | | Oil, Gas & Consumable Fuels |
TotalEnergies SE | | 4.7 | | Oil, Gas & Consumable Fuels |
ASML Holding NV | | 4.6 | | Semiconductors & Semiconductor Equipment |
Glencore PLC | | 2.8 | | Metals & Mining |
NVIDIA Corp. | | 2.7 | | Semiconductors & Semiconductor Equipment |
SAP SE | | 2.5 | | Software |
Airbus SE | | 2.2 | | Aerospace & Defense |
Adani Power Ltd. | | 2.3 | | Independent Power and Renewable Electricity Producers |
| | ± | The top 10 holdings may not be representative of the Fund’s future investments. The top 10 holdings exclude investments in money market funds. |
FUND BASICS
|
|
FUND VS. BENCHMARK SECTOR ALLOCATION† |
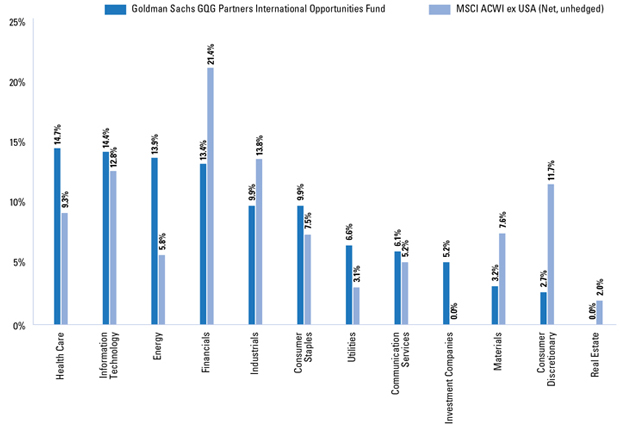
| | † | The Fund is actively managed and, as such, its composition may differ over time. Consequently, the Fund’s overall sector allocations may differ from the percentages contained in the graph above. The graph categorizes investments using the Global Industry Classification Standard (“GICS”); however, the sector classifications used by the portfolio management team may differ from GICS. The percentage shown for each investment category reflects the value of investments in that category as a percentage of market value (excluding investments in the securities lending reinvestment vehicle, if any). The graph depicts the Fund’s investments but may not represent the Fund’s market exposure due to the exclusion of certain derivatives, if any, as listed in the Additional Investment Information section of the Schedule of Investments. Underlying sector allocations of exchange traded funds and other investment companies held by the Fund are not reflected in the graph above. Figures in the graph may not sum to 100% due to rounding and/or the exclusion of other assets and liabilities. |
| | | For more information about the Fund, please refer to www.GSAMFUNDS.com. There, you can learn more about the Fund’s investment strategies, holdings, and performance. |
GOLDMAN SACHS GQG PARTNERS INTERNATIONAL OPPORTUNITIES FUND
|
Schedule of Investments April 30, 2024 (Unaudited) |
| | | | | | | | |
| | | Shares | | Description | | Value | |
| |
| | Common Stocks – 91.9% | |
| |
| | Australia – 0.8% | |
| | 17,393,939 | | Whitehaven Coal Ltd. (Oil, Gas & Consumable Fuels) | | $ | 86,038,874 | |
| | 4,421,513 | | WiseTech Global Ltd. (Software) | | | 260,482,546 | |
| | | | | | | | |
| | | | | | | 346,521,420 | |
| | | |
| |
| | Brazil – 2.3% | |
| | 58,990,380 | | Petroleo Brasileiro SA (Oil, | | | | |
| | | | Gas & Consumable Fuels) | | | 1,001,066,749 | |
| | | |
| |
| | Canada – 3.7% | |
| | 7,633,676 | | Canadian Natural Resources Ltd. (Oil, Gas & Consumable Fuels) | | | 578,465,899 | |
| | 153,037 | | Constellation Software, Inc. (Software) | | | 394,004,270 | |
| | 17,073,269 | | Enbridge, Inc.(a) (Oil, Gas & Consumable Fuels) | | | 607,079,881 | |
| | | | | | | | |
| | | | | | | 1,579,550,050 | |
| | | |
| |
| | China – 3.4% | |
| | 29,712,600 | | Meituan Class B*(b) (Hotels, Restaurants & Leisure) | | | 405,711,539 | |
| | 3,463,329 | | PDD Holdings, Inc.* (Broadline Retail) | | | 433,539,524 | |
| | 14,348,300 | | Tencent Holdings Ltd. (Interactive Media & Services) | | | 629,649,068 | |
| | | | | | | | |
| | | | | | | 1,468,900,131 | |
| | | |
| |
| | Denmark – 7.4% | |
| | 24,600,747 | | Novo Nordisk AS Class B (Pharmaceuticals) | | | 3,154,853,775 | |
| | | |
| |
| | France – 8.0% | |
| | 5,603,043 | | BNP Paribas SA (Banks) | | | 403,205,404 | |
| | 965,673 | | L’Oreal SA (Personal Products) | | | 452,758,826 | |
| | 1,887,516 | | Publicis Groupe SA (Media) | | | 208,281,318 | |
| | 1,961,995 | | Thales SA (Aerospace & Defense) | | | 329,747,397 | |
| | 27,476,593 | | TotalEnergies SE (Oil, Gas & Consumable Fuels) | | | 1,994,766,531 | |
| | | | | | | | |
| | | | | | | 3,388,759,476 | |
| | | |
| |
| | Germany – 4.0% | |
| | 3,892,933 | | BASF SE (Chemicals) | | | 203,976,264 | |
| | 15,043,771 | | Commerzbank AG (Banks) | | | 223,582,632 | |
| | 11,463,606 | | Deutsche Bank AG (Capital Markets) | | | 183,102,610 | |
| | 5,940,221 | | SAP SE (Software) | | | 1,072,608,725 | |
| | | | | | | | |
| | | | | | | 1,683,270,231 | |
| | | |
| |
| | Hong Kong – 0.3% | |
| | 18,389,400 | | AIA Group Ltd. (Insurance) | | | 134,690,454 | |
| | | |
| |
| | India – 16.3% | |
| | 30,201,059 | | Adani Energy Solutions Ltd.* (Electric Utilities) | | | 385,855,788 | |
| | | |
| | | | | | | | |
| | | Shares | | Description | | Value | |
| |
| | Common Stocks (continued) | |
| |
| | India (continued) | |
| | 22,064,491 | | Adani Enterprises Ltd. (Trading Companies & Distributors) | | $ | 806,240,828 | |
| | 40,526,616 | | Adani Green Energy Ltd.* (Independent Power and Renewable Electricity Producers) | | | 870,861,681 | |
| | 57,364,973 | | Adani Ports & Special Economic Zone Ltd. (Transportation Infrastructure) | | | 908,777,732 | |
| | 130,913,093 | | Adani Power Ltd.* (Independent Power and Renewable Electricity Producers) | | | 957,605,668 | |
| | 18,202,353 | | Bharti Airtel Ltd. (Wireless Telecommunication Services) | | | 288,119,171 | |
| | 202,445,401 | | GMR Airports Infrastructure Ltd.* (Transportation Infrastructure) | | | 205,905,027 | |
| | 35,351,513 | | ICICI Bank Ltd. (Banks) | | | 879,286,139 | |
| | 132,589,849 | | IDFC First Bank Ltd.* (Banks) | | | 130,129,016 | |
| | 134,459,783 | | ITC Ltd. (Tobacco) | | | 701,104,897 | |
| | 27,960,948 | | JSW Energy Ltd. (Independent Power and Renewable Electricity Producers) | | | 210,884,195 | |
| | 59,034,410 | | State Bank of India (Banks) | | | 583,139,170 | |
| | | | | | | | |
| | | | | | | 6,927,909,312 | |
| | | |
| |
| | Indonesia – 0.9% | |
| | 608,808,898 | | Bank Central Asia Tbk. PT (Banks) | | | 366,067,198 | |
| | | |
| |
| | Italy – 1.9% | |
| | 63,973,422 | | Enel SpA (Electric Utilities) | | | 420,461,544 | |
| | 10,054,597 | | UniCredit SpA(a) (Banks) | | | 369,047,611 | |
| | | | | | | | |
| | | | | | | 789,509,155 | |
| | | |
| |
| | Japan – 0.7% | |
| | 6,297,500 | | SoftBank Group Corp. (Wireless Telecommunication Services) | | | 309,714,814 | |
| | | |
| |
| | Netherlands – 7.7% | |
| | 5,850,271 | | Airbus SE (Aerospace & Defense) | | | 962,707,326 | |
| | 2,228,161 | | ASML Holding NV (Semiconductors & Semiconductor Equipment) | | | 1,942,014,378 | |
| | 1,662,581 | | Heineken NV (Beverages) | | | 161,801,812 | |
| | 12,976,666 | | ING Groep NV (Banks) | | | 205,164,536 | |
| | | | | | | | |
| | | | | | | 3,271,688,052 | |
| | | |
| |
| | Russia(c) – 0.0% | |
| | 48,039,056 | | Gazprom PJSC* (Oil, Gas & Consumable Fuels) | | | — | |
| | 3,681,622 | | LUKOIL PJSC (Oil, Gas & Consumable Fuels) | | | — | |
| | | |
| | |
| 6 | | The accompanying notes are an integral part of these financial statements. |
GOLDMAN SACHS GQG PARTNERS INTERNATIONAL OPPORTUNITIES FUND
| | | | | | | | | | | | |
| | | | Shares | | | Description | | Value | |
| |
| | | | | Common Stocks (continued) | |
| |
| | | | | Russia(c) (continued) | |
| | | | | 34,154,161 | | | Rosneft Oil Co. PJSC (Oil, Gas & Consumable Fuels) | | $ | — | |
| | | | | | | | | | | | |
| | | | | | | | | | | — | |
| | | | | | |
| |
| | | | | Spain – 2.4% | |
| | | | | 73,323,764 | | | Banco Bilbao Vizcaya Argentaria SA (Banks) | | | 792,921,209 | |
| | | | | 46,635,265 | | | CaixaBank SA (Banks) | | | 245,933,709 | |
| | | | | | | | | | | | |
| | | | | | | | | | | 1,038,854,918 | |
| | | | | | |
| |
| | | | | Switzerland – 4.8% | |
| | | | | 203,956,746 | | | Glencore PLC (Metals & Mining) | | | 1,186,734,629 | |
| | | | | 8,660,700 | | | Novartis AG (Pharmaceuticals) | | | 840,585,684 | |
| | | | | | | | | | | | |
| | | | | | | | | | | 2,027,320,313 | |
| | | | | | |
| |
| | | | | Taiwan – 2.2% | |
| | | | | 39,381,043 | | | Taiwan Semiconductor Manufacturing Co. Ltd. (Semiconductors & Semiconductor Equipment) | | | 942,930,021 | |
| | | | | | |
| |
| | | | | United Arab Emirates* – 1.0% | |
| | | | | 3,900,915 | | | International Holding Co. PJSC (Industrial Conglomerates) | | | 424,301,109 | |
| | | | | | |
| |
| | | | | United Kingdom – 9.5% | |
| | | | | 13,878,554 | | | AstraZeneca PLC (Pharmaceuticals) | | | 2,099,115,546 | |
| | | | | 51,580,565 | | | HSBC Holdings PLC (Banks) | | | 447,097,799 | |
| | | | | 1,840,416 | | | London Stock Exchange Group PLC (Capital Markets) | | | 202,887,602 | |
| | | | | 120,282,101 | | | Rolls-Royce Holdings PLC* (Aerospace & Defense) | | | 616,809,490 | |
| | | | | 18,848,453 | | | Shell PLC (Oil, Gas & Consumable Fuels) | | | 673,526,763 | |
| | | | | | | | | | | | |
| | | | | | | | | | | 4,039,437,200 | |
| | | | | | |
| |
| | | | | United States – 14.6% | |
| | | | | 1,042,060 | | | Alphabet, Inc. Class C* (Interactive Media & Services) | | | 171,564,758 | |
| | | | | 965,512 | | | Alphabet, Inc. Class A* (Interactive Media & Services) | | | 157,166,043 | |
| | | | | 336,891 | | | Broadcom, Inc. (Semiconductors & Semiconductor Equipment) | | | 438,049,261 | |
| | | | | 1,966,685 | | | Meta Platforms, Inc. Class A (Interactive Media & Services) | | | 846,008,887 | |
| | | | | 8,383,277 | | | Mondelez International, Inc. Class A (Food Products) | | | 603,092,947 | |
| | | | | 7,722,718 | | | Nestle SA (Food Products) | | | 775,362,105 | |
| | | | | 1,303,994 | | | NVIDIA Corp. (Semiconductors & Semiconductor Equipment) | | | 1,126,676,895 | |
| | | | | 9,181,545 | | | Philip Morris International, Inc. (Tobacco) | | | 871,695,882 | |
| | | | | | | | | | | | |
| | | | Shares | | | Description | | Value | |
| |
| | | | | Common Stocks (continued) | |
| |
| | | | | United States (continued) | |
| | | | | 4,160,492 | | | Procter & Gamble Co. (Household Products) | | $ | 678,992,295 | |
| | | | | 879,924 | | | Roche Holding AG (Pharmaceuticals) | | | 210,842,281 | |
| | | | | 14,040,802 | | | Stellantis NV (Automobiles) | | | 310,673,754 | |
| | | | | | | | | | | | |
| | | | | | | | | | | 6,190,125,108 | |
| | | | | | |
| | |
| | | |
| TOTAL COMMON STOCKS
(Cost $30,787,213,587) | | $ | 39,085,469,486 | |
| | | | | | |
| | | |
| | | | Shares | | | Dividend Rate | | Value | |
| |
| | | | | Preferred Stocks – 3.7% | |
| |
| | | | | Brazil – 3.7% | |
| | | | | Itau Unibanco Holding SA (Banks) | |
| | | | | 96,874,756 | | | 7.531% | | $ | 585,061,886 | |
| |
| | | | | Petroleo Brasileiro SA (Oil, Gas & Consumable Fuels) | |
| | | | | 124,012,163 | | | 8.432 | | | 1,003,541,788 | |
| | | | | | |
| | |
| | | |
| TOTAL PREFERRED STOCKS
(Cost $1,139,113,285) | | $ | 1,588,603,674 | |
| | | | | | |
| | | | | | | | | | | | |
| |
| | | | | Investment Company(d) – 5.2% | |
| |
| | | |
| Goldman Sachs Financial Square Government Fund — Institutional
Shares |
|
| | | | | 2,213,153,195 | | | 5.223% | | $ | 2,213,153,195 | |
| | |
| | | | | (Cost $2,213,153,195) | | | | |
| | | | | | |
| | | |
| | | | Shares | | | Dividend Rate | | Value | |
| |
| | | | | Securities Lending Reinvestment Vehicle(d) – 0.1% | |
| |
| | | |
| Goldman Sachs Financial Square Government Fund — Institutional
Shares |
|
| | | | | 36,320,241 | | | 5.223% | | $ | 36,320,241 | |
| |
| | | | | (Cost $36,320,241) | |
| | | | | | |
| | |
| | | |
| TOTAL INVESTMENTS – 100.9%
(Cost $34,175,800,308) | | $ | 42,923,546,596 | |
| | | | | | |
| | |
| | | |
| LIABILITIES IN EXCESS OF OTHER ASSETS
– (0.9)% | | | (402,681,262 | ) |
| | | | | | |
| | |
| | | | | NET ASSETS – 100.0% | | $ | 42,520,865,334 | |
| | | | | | |
The percentage shown for each investment category reflects the value of investments in that category as a percentage of net assets.
| | * | Non-income producing security. |
| | (a) | All or a portion of security is on loan. |
| | (b) | Exempt from registration under Rule 144A of the Securities Act of 1933. |
| | |
| The accompanying notes are an integral part of these financial statements. | | 7 |
GOLDMAN SACHS GQG PARTNERS INTERNATIONAL OPPORTUNITIES FUND
|
Schedule of Investments (continued) April 30, 2024 (Unaudited) |
| | (c) | Significant unobservable inputs were used in the valuation of this portfolio security; i.e., Level 3. |
| | (d) | Represents an Affiliated Issuer. |
| | | | |
|
SECTOR ALLOCATION AS OF APRIL 30, 2024 | |
| |
| Sector | | % of Total
Market Value |
| |
Health Care | | | 14.7 | % |
| |
Information Technology | | | 14.4 | |
| |
Energy | | | 13.9 | |
| |
Financials | | | 13.4 | |
| |
Industrials | | | 9.9 | |
| |
Consumer Staples | | | 9.9 | |
| |
Utilities | | | 6.6 | |
| |
Communication Services | | | 6.1 | |
| |
Investment Company | | | 5.2 | |
| |
Materials | | | 3.2 | |
| |
Consumer Discretionary | | | 2.7 | |
| |
| | | | 100.0 | % |
Investment Abbreviations:
PLC —Public Limited Company
| | |
| 8 | | The accompanying notes are an integral part of these financial statements. |
GOLDMAN SACHS GQG PARTNERS INTERNATIONAL OPPORTUNITIES FUND
|
Statement of Assets and Liabilities April 30, 2024 (Unaudited) |
| | | | | | | | | | |
| | | |
| | Assets: | | | | | | | | |
| | | |
| | Investments in unaffiliated issuers, at value (cost $31,926,326,872)(a) | | $ | 40,674,073,160 | | | | | |
| | Investments in affiliated issuers, at value (cost $2,213,153,195) | | | 2,213,153,195 | | | | | |
| | Investments in affiliated securities lending reinvestment vehicle, at value which equals cost | | | 36,320,241 | | | | | |
| | Cash | | | 45,017,426 | | | | | |
| | Foreign currencies, at value (cost $25,064,173) | | | 25,019,060 | | | | | |
| | Receivables: | | | | | | | | |
| | Investments sold on an extended-settlement basis | | | 166,276,004 | | | | | |
| | Investments sold | | | 136,560,637 | | | | | |
| | Dividends | | | 111,417,789 | | | | | |
| | Fund shares sold | | | 78,383,062 | | | | | |
| | Foreign tax reclaims | | | 35,897,751 | | | | | |
| | Reimbursement from investment adviser | | | 345,717 | | | | | |
| | Securities lending income | | | 322,061 | | | | | |
| | Other assets | | | 808,013 | | | | | |
| | | |
| | Total assets | | | 43,523,594,116 | | | | | |
| | | |
| | | | | | | | | | |
| | | |
| | Liabilities: | | | | | | | | |
| | Payables: | | | | | | | | |
| | Investments purchased on an extended-settlement basis | | | 457,601,286 | | | | | |
| | Investments purchased | | | 439,620,620 | | | | | |
| | Payable upon return of securities loaned | | | 36,320,241 | | | | | |
| | Fund shares redeemed | | | 35,049,403 | | | | | |
| | Management fees | | | 24,385,952 | | | | | |
| | Distribution and Service fees and Transfer Agency fees | | | 2,389,745 | | | | | |
| | Accrued expenses | | | 7,361,535 | | | | | |
| | | |
| | Total liabilities | | | 1,002,728,782 | | | | | |
| | | |
| | | | | | | | | | |
| | | |
| | Net Assets: | | | | | | | | |
| | Paid-in capital | | | 33,112,612,322 | | | | | |
| | Total distributable earnings | | | 9,408,253,012 | | | | | |
| | | |
| | NET ASSETS | | $ | 42,520,865,334 | | | | | |
| | | Net Assets: | | | | | | | | |
| | | Class A | | $ | 592,303,192 | | | | | |
| | | Class C | | | 128,908,052 | | | | | |
| | | Institutional | | | 26,819,962,015 | | | | | |
| | | Investor | | | 8,882,316,248 | | | | | |
| | | Class R6 | | | 2,352,819,730 | | | | | |
| | | Class R | | | 5,225,865 | | | | | |
| | | Class P | | | 3,739,330,232 | | | | | |
| | | Total Net Assets | | $ | 42,520,865,334 | | | | | |
| | | Shares Outstanding $0.001 par value (unlimited number of shares authorized): | | | | | | | | |
| | | Class A | | | 27,029,468 | | | | | |
| | | Class C | | | 6,064,760 | | | | | |
| | | Institutional | | | 1,214,259,978 | | | | | |
| | | Investor | | | 403,744,053 | | | | | |
| | | Class R6 | | | 106,560,393 | | | | | |
| | | Class R | | | 242,092 | | | | | |
| | | Class P | | | 169,393,385 | | | | | |
| | | Net asset value, offering and redemption price per share:(b) | | | | | | | | |
| | | Class A | | | $21.91 | | | | | |
| | | Class C | | | 21.26 | | | | | |
| | | Institutional | | | 22.09 | | | | | |
| | | Investor | | | 22.00 | | | | | |
| | | Class R6 | | | 22.08 | | | | | |
| | | Class R | | | 21.59 | | | | | |
| | | Class P | | | 22.07 | | | | | |
| | (a) | Includes loaned securities having market value of $34,118,656. |
| | (b) | Maximum public offering price per share for Class A Shares is $23.19. At redemption, Class C Shares may be subject to a contingent deferred sales charge, assessed on the amount equal to the lesser of the current net asset value (“NAV”) or the original purchase price of the shares. |
| | |
| The accompanying notes are an integral part of these financial statements. | | 9 |
GOLDMAN SACHS GQG PARTNERS INTERNATIONAL OPPORTUNITIES FUND
|
Statement of Operations For the Six Months Ended April 30, 2024 (Unaudited) |
| | | | | | | | |
| | | |
| | Investment Income: | | | | | | |
| | | |
| | Dividends — unaffiliated issuers (net of tax withholding of $49,766,818) | | $ | 487,152,370 | | | |
| | | |
| | Dividends — affiliated issuers | | | 26,674,819 | | | |
| | | |
| | Securities lending income, net of rebates received or paid to borrowers | | | 2,285,596 | | | |
| | | |
| | Interest | | | 55,682 | | | |
| | |
| | | |
| | Total investment income | | | 516,168,467 | | | |
| | |
| | | | | | | | |
| | | |
| | Expenses: | | | | | | |
| | | |
| | Management fees | | | 130,726,193 | | | |
| | | |
| | Transfer Agency fees(a) | | | 11,708,993 | | | |
| | | |
| | Custody, accounting and administrative services | | | 2,795,972 | | | |
| | | |
| | Distribution and Service (12b-1) fees(a) | | | 1,063,526 | | | |
| | | |
| | Printing and mailing costs | | | 936,735 | | | |
| | | |
| | Registration fees | | | 476,281 | | | |
| | | |
| | Professional fees | | | 145,043 | | | |
| | | |
| | Service fees — Class C | | | 142,319 | | | |
| | | |
| | Trustee fees | | | 128,092 | | | |
| | | |
| | Other | | | 10,343 | | | |
| | |
| | | |
| | Total expenses | | | 148,133,497 | | | |
| | |
| | | |
| | Less — expense reductions | | | (3,171,886 | ) | | |
| | |
| | | |
| | Net expenses | | | 144,961,611 | | | |
| | |
| | | |
| | NET INVESTMENT INCOME | | | 371,206,856 | | | |
| | |
| | | | | | | | |
| | | |
| | Realized and unrealized gain (loss): | | | | | | |
| | | |
| | Net realized gain (loss) from: | | | | | | |
| | | |
| | Investments — unaffiliated issuers | | | 2,035,004,549 | | | |
| | | |
| | Foreign currency transactions | | | (8,025,323 | ) | | |
| | | |
| | Net change in unrealized gain (loss) on: | | | | | | |
| | | |
| | Investments — unaffiliated issuers | | | 6,062,957,183 | | | |
| | | |
| | Foreign currency translation | | | (99,518 | ) | | |
| | |
| | | |
| | Net realized and unrealized gain | | | 8,089,836,891 | | | |
| | |
| | | |
| | NET INCREASE IN NET ASSETS RESULTING FROM OPERATIONS | | $ | 8,461,043,747 | | | |
| | |
| | | | | | | | | | | | | | | | | | | | | | |
(a) Class specific Distribution and/or Service (12b-1) and Transfer Agency fees were as follows: | | | | | | | | | | | | |
| | | | | | | | | | | | | | | | | | | | |
| | | Distribution and/or Service (12b-1) Fees | | Transfer Agency Fees |
Fund | | Class A | | Class C | | Class R | | Class A | | Class C | | Institutional | | Investor | | Class R6 | | Class R | | Class P |
Goldman Sachs GQG Partners International Opportunities Fund | | $625,160 | | $426,956 | | $11,410 | | $375,096 | | $85,391 | | $4,636,211 | | $5,810,901 | | $304,035 | | $3,423 | | $493,936 |
| | |
| 10 | | The accompanying notes are an integral part of these financial statements. |
GOLDMAN SACHS GQG PARTNERS INTERNATIONAL OPPORTUNITIES FUND
|
Statements of Changes in Net Assets |
| | | | | | | | | | | | | | | | | | | | | | | | | | | | |
| | | | | Goldman Sachs GQG Partners International Opportunities Fund |
| | | | |
| | | | | For the Six Months Ended April 30, 2024 (Unaudited) | | | For the Fiscal Year Ended October 31, 2023 | | | |
| | | | | | | | |
| | From operations: | | | | | | | | | | | | | | | | | | | | | | | | | | |
| | | | | | | | |
| | Net investment income | | | | | | $ | 371,206,856 | | | | | | | | | | | | $ 956,592,730 | | | | | | | |
| | | | | | | | |
| | Net realized gain (loss) | | | | | | | 2,026,979,226 | | | | | | | | | | | | (597,557,706 | ) | | | | | | |
| | | | | | | | |
| | Net change in unrealized gain | | | | | | | 6,062,857,665 | | | | | | | | | | | | 2,834,177,527 | | | | | | | |
| | |
| | | | | | | | |
| | Net increase in net assets resulting from operations | | | | | | | 8,461,043,747 | | | | | | | | | | | | 3,193,212,551 | | | | | | | |
| | |
| | | | | | | | | | | | | | | | | | | | | | | | | | | | |
| | | | | | | | |
| | Distributions to shareholders: | | | | | | | | | | | | | | | | | | | | | | | | | | |
| | | | | | | | |
| | From distributable earnings: | | | | | | | | | | | | | | | | | | | | | | | | | | |
| | | | | | | | |
| | Class A Shares | | | | | | | (9,160,064 | ) | | | | | | | | | | | (17,547,803 | ) | | | | | | |
| | | | | | | | |
| | Class C Shares | | | | | | | (1,553,079 | ) | | | | | | | | | | | (3,133,597 | ) | | | | | | |
| | | | | | | | |
| | Institutional Shares | | | | | | | (500,086,208 | ) | | | | | | | | | | | (728,324,807 | ) | | | | | | |
| | | | | | | | |
| | Investor Shares | | | | | | | (161,590,923 | ) | | | | | | | | | | | (226,000,395 | ) | | | | | | |
| | | | | | | | |
| | Class R6 Shares | | | | | | | (44,181,574 | ) | | | | | | | | | | | (49,848,199 | ) | | | | | | |
| | | | | | | | |
| | Class R Shares | | | | | | | (80,187 | ) | | | | | | | | | | | (62,600 | ) | | | | | | |
| | | | | | | | |
| | Class P Shares | | | | | | | (72,034,034 | ) | | | | | | | | | | | (103,698,041 | ) | | | | | | |
| | |
| | | | | | | | |
| | Total distributions to shareholders | | | | | | | (788,686,069 | ) | | | | | | | | | | | (1,128,615,442 | ) | | | | | | |
| | |
| | | | | | | | | | | | | | | | | | | | | | | | | | | | |
| | | | | | | | |
| | From share transactions: | | | | | | | | | | | | | | | | | | | | | | | | | | |
| | | | | | | | |
| | Proceeds from sales of shares | | | | | | | 8,578,990,883 | | | | | | | | | | | | 11,522,771,367 | | | | | | | |
| | | | | | | | |
| | Reinvestment of distributions | | | | | | | 690,217,338 | | | | | | | | | | | | 964,823,979 | | | | | | | |
| | | | | | | | |
| | Cost of shares redeemed | | | | | | | (3,834,874,274 | ) | | | | | | | | | | | (7,377,067,709 | ) | | | | | | |
| | |
| | | | | | | | |
| | Net increase in net assets resulting from share transactions | | | | | | | 5,434,333,947 | | | | | | | | | | | | 5,110,527,637 | | | | | | | |
| | |
| | | | | | | | |
| | TOTAL INCREASE | | | | | | | 13,106,691,625 | | | | | | | | | | | | 7,175,124,746 | | | | | | | |
| | |
| | | | | | | | | | | | | | | | | | | | | | | | | | | | |
| | | | | | | | |
| | Net assets: | | | | | | | | | | | | | | | | | | | | | | | | | | |
| | | | | | | | |
| | Beginning of period | | | | | | | 29,414,173,709 | | | | | | | | | | | | 22,239,048,963 | | | | | | | |
| | |
| | | | | | | | |
| | End of period | | | | | | $ | 42,520,865,334 | | | | | | | | | | | | $29,414,173,709 | | | | | | | |
| | |
| | |
| The accompanying notes are an integral part of these financial statements. | | 11 |
GOLDMAN SACHS GQG PARTNERS INTERNATIONAL OPPORTUNITIES FUND
|
Financial Highlights Selected Share Data for a Share Outstanding Throughout Each Period |
| | | | | | | | | | | | | | | | | | | | | | | | | | | | | | | | | | |
| | | | | Goldman Sachs GQG Partners International Opportunities Fund |
| | |
| | | | | Class A Shares |
| | | | | Six Months Ended | | Year Ended October 31, |
| | | | | April 30, 2024 (Unaudited) | | 2023 | | 2022 | | 2021 | | 2020 | | 2019 | | |
| | | | | | | | |
| | | Per Share Data | | | | | | | | | | | | | | | | | | | | | | | | | | | | | | | | |
| | | | | | | | |
| | | Net asset value, beginning of period | | | $ | 17.52 | | | | $ | 16.07 | | | | $ | 20.36 | | | | $ | 16.44 | | | | $ | 14.78 | | | | $ | 12.32 | | | |
| | |
| | | | | | | | |
| | Net investment income(a) | | | | 0.17 | | | | | 0.57 | | | | | 0.75 | | | | | 0.28 | | | | | 0.04 | | | | | 0.10 | | | |
| | | | | | | | |
| | Net realized and unrealized gain (loss) | | | | 4.62 | | | | | 1.62 | | | | | (4.67 | ) | | | | 3.64 | | | | | 1.68 | | | | | 2.38 | | | |
| | |
| | | | | | | | |
| | Total from investment operations | | | | 4.79 | | | | | 2.19 | | | | | (3.92 | ) | | | | 3.92 | | | | | 1.72 | | | | | 2.48 | | | |
| | |
| | | | | | | | |
| | Distributions to shareholders from net investment income | | | | (0.40 | ) | | | | (0.74 | ) | | | | (0.37 | ) | | | | — | | | | | (0.06 | ) | | | | (0.02 | ) | | |
| | |
| | | | | | | | |
| | Net asset value, end of period | | | $ | 21.91 | | | | $ | 17.52 | | | | $ | 16.07 | | | | $ | 20.36 | | | | $ | 16.44 | | | | $ | 14.78 | | | |
| | |
| | | | | | | | |
| | Total return(b) | | | | 27.68 | % | | | | 13.91 | % | | | | (19.55 | )% | | | | 23.84 | % | | | | 11.66 | % | | | | 20.19 | % | | |
| | |
| | | | | | | | |
| | Net assets, end of period (in 000s) | | | $ | 592,303 | | | | $ | 401,254 | | | | $ | 417,464 | | | | $ | 479,794 | | | | $ | 252,603 | | | | $ | 89,592 | | | |
| | | | | | | | |
| | Ratio of net expenses to average net assets | | | | 1.12 | %(c) | | | | 1.13 | % | | | | 1.14 | % | | | | 1.15 | % | | | | 1.17 | % | | | | 1.23 | % | | |
| | | | | | | | |
| | Ratio of total expenses to average net assets | | | | 1.13 | %(c) | | | | 1.16 | % | | | | 1.17 | % | | | | 1.19 | % | | | | 1.20 | % | | | | 1.29 | % | | |
| | | | | | | | |
| | Ratio of net investment income to average net assets | | | | 1.70 | %(c) | | | | 3.26 | % | | | | 4.17 | % | | | | 1.47 | % | | | | 0.23 | % | | | | 0.71 | % | | |
| | | | | | | | |
| | Portfolio turnover rate(d) | | | | 48 | % | | | | 62 | % | | | | 137 | % | | | | 94 | % | | | | 72 | % | | | | 55 | % | | |
| | |
| | (a) | Calculated based on the average shares outstanding methodology. |
| | (b) | Assumes investment at the NAV at the beginning of the period, reinvestment of all dividends and distributions, a complete redemption of the investment at the NAV at the end of the period and no sales or redemption charges (if any). Total returns would be reduced if a sales or redemption charge was taken into account. Returns do not reflect the impact of taxes to shareholders relating to Fund distributions or the redemption of Fund shares. Total returns for periods less than one full year are not annualized. |
| | (d) | The Fund’s portfolio turnover rate is calculated in accordance with regulatory requirements, without regard to transactions involving short term investments. If such transactions were included, the Fund’s portfolio turnover rate may be higher. |
| | |
| 12 | | The accompanying notes are an integral part of these financial statements. |
GOLDMAN SACHS GQG PARTNERS INTERNATIONAL OPPORTUNITIES FUND
|
Financial Highlights (continued) Selected Share Data for a Share Outstanding Throughout Each Period |
| | | | | | | | | | | | | | | | | | | | | | | | | | | | | | | | | | |
| | | | | Goldman Sachs GQG Partners International Opportunities Fund |
| | |
| | | | | Class C Shares |
| | | | | Six Months Ended | | Year Ended October 31, |
| | | | | April 30, 2024 (Unaudited) | | 2023 | | 2022 | | 2021 | | 2020 | | 2019 | | |
| | | | | | | | |
| | | Per Share Data | | | | | | | | | | | | | | | | | | | | | | | | | | | | | | | | |
| | | | | | | | |
| | | Net asset value, beginning of period | | | $ | 16.96 | | | | $ | 15.58 | | | | $ | 19.76 | | | | $ | 16.08 | | | | $ | 14.50 | | | | $ | 12.16 | | | |
| | |
| | | | | | | | |
| | Net investment income (loss)(a) | | | | 0.09 | | | | | 0.42 | | | | | 0.59 | | | | | 0.13 | | | | | (0.08 | ) | | | | — | (b) | | |
| | | | | | | | |
| | Net realized and unrealized gain (loss) | | | | 4.49 | | | | | 1.58 | | | | | (4.53 | ) | | | | 3.55 | | | | | 1.66 | | | | | 2.34 | | | |
| | |
| | | | | | | | |
| | Total from investment operations | | | | 4.58 | | | | | 2.00 | | | | | (3.94 | ) | | | | 3.68 | | | | | 1.58 | | | | | 2.34 | | | |
| | |
| | | | | | | | |
| | Distributions to shareholders from net investment income | | | | (0.28 | ) | | | | (0.62 | ) | | | | (0.24 | ) | | | | — | | | | | — | | | | | — | | | |
| | |
| | | | | | | | |
| | Net asset value, end of period | | | $ | 21.26 | | | | $ | 16.96 | | | | $ | 15.58 | | | | $ | 19.76 | | | | $ | 16.08 | | | | $ | 14.50 | | | |
| | |
| | | | | | | | |
| | Total return(c) | | | | 27.17 | % | | | | 13.06 | % | | | | (20.12 | )% | | | | 22.82 | % | | | | 10.87 | % | | | | 19.24 | % | | |
| | |
| | | | | | | | |
| | Net assets, end of period (in 000s) | | | $ | 128,908 | | | | $ | 93,751 | | | | $ | 78,662 | | | | $ | 97,057 | | | | $ | 61,784 | | | | $ | 32,620 | | | |
| | | | | | | | |
| | Ratio of net expenses to average net assets | | | | 1.87 | %(d) | | | | 1.88 | % | | | | 1.89 | % | | | | 1.90 | % | | | | 1.92 | % | | | | 1.98 | % | | |
| | | | | | | | |
| | Ratio of total expenses to average net assets | | | | 1.88 | %(d) | | | | 1.91 | % | | | | 1.92 | % | | | | 1.94 | % | | | | 1.95 | % | | | | 2.04 | % | | |
| | | | | | | | |
| | Ratio of net investment income (loss) to average net assets | | | | 0.92 | %(d) | | | | 2.48 | % | | | | 3.36 | % | | | | 0.69 | % | | | | (0.51 | )% | | | | (0.02 | )% | | |
| | | | | | | | |
| | Portfolio turnover rate(e) | | | | 48 | % | | | | 62 | % | | | | 137 | % | | | | 94 | % | | | | 72 | % | | | | 55 | % | | |
| | |
| | (a) | Calculated based on the average shares outstanding methodology. |
| | (b) | Amount is less than $0.005 per share. |
| | (c) | Assumes investment at the NAV at the beginning of the period, reinvestment of all dividends and distributions, a complete redemption of the investment at the NAV at the end of the period and no sales or redemption charges (if any). Total returns would be reduced if a sales or redemption charge was taken into account. Returns do not reflect the impact of taxes to shareholders relating to Fund distributions or the redemption of Fund shares. Total returns for periods less than one full year are not annualized. |
| | (e) | The Fund’s portfolio turnover rate is calculated in accordance with regulatory requirements, without regard to transactions involving short term investments. If such transactions were included, the Fund’s portfolio turnover rate may be higher. |
| | |
| The accompanying notes are an integral part of these financial statements. | | 13 |
GOLDMAN SACHS GQG PARTNERS INTERNATIONAL OPPORTUNITIES FUND
|
Financial Highlights (continued) Selected Share Data for a Share Outstanding Throughout Each Period |
| | | | | | | | | | | | | | | | | | | | | | | | | | | | | | | | | | |
| | | | | Goldman Sachs GQG Partners International Opportunities Fund |
| | |
| | | | | Institutional Shares |
| | | | | Six Months Ended | | Year Ended October 31, |
| | | | | April 30, 2024 (Unaudited) | | 2023 | | 2022 | | 2021 | | 2020 | | 2019 | | |
| | | | | | | | |
| | | Per Share Data | | | | | | | | | | | | | | | | | | | | | | | | | | | | | | | | |
| | | | | | | | |
| | | Net asset value, beginning of period | | | $ | 17.69 | | | | $ | 16.23 | | | | $ | 20.55 | | | | $ | 16.56 | | | | $ | 14.87 | | | | $ | 12.39 | | | |
| | |
| | | | | | | | |
| | Net investment income(a) | | | | 0.21 | | | | | 0.63 | | | | | 0.82 | | | | | 0.35 | | | | | 0.09 | | | | | 0.15 | | | |
| | | | | | | | |
| | Net realized and unrealized gain (loss) | | | | 4.66 | | | | | 1.64 | | | | | (4.70 | ) | | | | 3.67 | | | | | 1.70 | | | | | 2.39 | | | |
| | |
| | | | | | | | |
| | Total from investment operations | | | | 4.87 | | | | | 2.27 | | | | | (3.88 | ) | | | | 4.02 | | | | | 1.79 | | | | | 2.54 | | | |
| | |
| | | | | | | | |
| | Distributions to shareholders from net investment income | | | | (0.47 | ) | | | | (0.81 | ) | | | | (0.44 | ) | | | | (0.03 | ) | | | | (0.10 | ) | | | | (0.06 | ) | | |
| | |
| | | | | | | | |
| | Net asset value, end of period | | | $ | 22.09 | | | | $ | 17.69 | | | | $ | 16.23 | | | | $ | 20.55 | | | | $ | 16.56 | | | | $ | 14.87 | | | |
| | |
| | | | | | | | |
| | Total return(b) | | | | 27.89 | % | | | | 14.34 | % | | | | (19.23 | )% | | | | 24.31 | % | | | | 12.06 | % | | | | 20.65 | % | | |
| | |
| | | | | | | | |
| | Net assets, end of period (in 000s) | | | $ | 26,819,962 | | | | $ | 18,487,029 | | | | $ | 14,193,048 | | | | $ | 14,481,792 | | | | $ | 8,683,860 | | | | $ | 1,996,934 | | | |
| | | | | | | | |
| | Ratio of net expenses to average net assets | | | | 0.76 | %(c) | | | | 0.77 | % | | | | 0.76 | % | | | | 0.77 | % | | | | 0.79 | % | | | | 0.84 | % | | |
| | | | | | | | |
| | Ratio of total expenses to average net assets | | | | 0.77 | %(c) | | | | 0.79 | % | | | | 0.79 | % | | | | 0.81 | % | | | | 0.82 | % | | | | 0.90 | % | | |
| | | | | | | | |
| | Ratio of net investment income to average net assets | | | | 2.04 | %(c) | | | | 3.58 | % | | | | 4.54 | % | | | | 1.83 | % | | | | 0.55 | % | | | | 1.10 | % | | |
| | | | | | | | |
| | Portfolio turnover rate(d) | | | | 48 | % | | | | 62 | % | | | | 137 | % | | | | 94 | % | | | | 72 | % | | | | 55 | % | | |
| | |
| | (a) | Calculated based on the average shares outstanding methodology. |
| | (b) | Assumes investment at the NAV at the beginning of the period, reinvestment of all dividends and distributions, a complete redemption of the investment at the NAV at the end of the period and no sales or redemption charges (if any). Total returns would be reduced if a sales or redemption charge was taken into account. Returns do not reflect the impact of taxes to shareholders relating to Fund distributions or the redemption of Fund shares. Total returns for periods less than one full year are not annualized. |
| | (d) | The Fund’s portfolio turnover rate is calculated in accordance with regulatory requirements, without regard to transactions involving short term investments. If such transactions were included, the Fund’s portfolio turnover rate may be higher. |
| | |
| 14 | | The accompanying notes are an integral part of these financial statements. |
GOLDMAN SACHS GQG PARTNERS INTERNATIONAL OPPORTUNITIES FUND
|
Financial Highlights (continued) Selected Share Data for a Share Outstanding Throughout Each Period |
| | | | | | | | | | | | | | | | | | | | | | | | | | | | | | | | | | |
| | | | | Goldman Sachs GQG Partners International Opportunities Fund |
| | |
| | | | | Investor Shares |
| | | | | Six Months Ended | | Year Ended October 31, |
| | | | | April 30, 2024 (Unaudited) | | 2023 | | 2022 | | 2021 | | 2020 | | 2019 | | |
| | | | | | | | |
| | | Per Share Data | | | | | | | | | | | | | | | | | | | | | | | | | | | | | | | | |
| | | | | | | | |
| | | Net asset value, beginning of period | | | $ | 17.61 | | | | $ | 16.16 | | | | $ | 20.47 | | | | $ | 16.51 | | | | $ | 14.82 | | | | $ | 12.36 | | | |
| | |
| | | | | | | | |
| | Net investment income(a) | | | | 0.20 | | | | | 0.61 | | | | | 0.80 | | | | | 0.33 | | | | | 0.08 | | | | | 0.15 | | | |
| | | | | | | | |
| | Net realized and unrealized gain (loss) | | | | 4.64 | | | | | 1.63 | | | | | (4.69 | ) | | | | 3.64 | | | | | 1.70 | | | | | 2.36 | | | |
| | |
| | | | | | | | |
| | Total from investment operations | | | | 4.84 | | | | | 2.24 | | | | | (3.89 | ) | | | | 3.97 | | | | | 1.78 | | | | | 2.51 | | | |
| | |
| | | | | | | | |
| | Distributions to shareholders from net investment income | | | | (0.45 | ) | | | | (0.79 | ) | | | | (0.42 | ) | | | | (0.01 | ) | | | | (0.09 | ) | | | | (0.05 | ) | | |
| | |
| | | | | | | | |
| | Net asset value, end of period | | | $ | 22.00 | | | | $ | 17.61 | | | | $ | 16.16 | | | | $ | 20.47 | | | | $ | 16.51 | | | | $ | 14.82 | | | |
| | |
| | | | | | | | |
| | Total return(b) | | | | 27.84 | % | | | | 14.21 | % | | | | (19.35 | )% | | | | 24.09 | % | | | | 12.00 | % | | | | 20.42 | % | | |
| | |
| | | | | | | | |
| | Net assets, end of period (in 000s) | | | $ | 8,882,316 | | | | $ | 6,227,601 | | | | $ | 4,425,913 | | | | $ | 4,169,364 | | | | $ | 2,488,875 | | | | $ | 1,098,284 | | | |
| | | | | | | | |
| | Ratio of net expenses to average net assets | | | | 0.87 | %(c) | | | | 0.88 | % | | | | 0.89 | % | | | | 0.90 | % | | | | 0.92 | % | | | | 0.98 | % | | |
| | | | | | | | |
| | Ratio of total expenses to average net assets | | | | 0.88 | %(c) | | | | 0.91 | % | | | | 0.92 | % | | | | 0.94 | % | | | | 0.95 | % | | | | 1.04 | % | | |
| | | | | | | | |
| | Ratio of net investment income to average net assets | | | | 1.93 | %(c) | | | | 3.45 | % | | | | 4.42 | % | | | | 1.70 | % | | | | 0.48 | % | | | | 1.09 | % | | |
| | | | | | | | |
| | Portfolio turnover rate(d) | | | | 48 | % | | | | 62 | % | | | | 137 | % | | | | 94 | % | | | | 72 | % | | | | 55 | % | | |
| | |
| | (a) | Calculated based on the average shares outstanding methodology. |
| | (b) | Assumes investment at the NAV at the beginning of the period, reinvestment of all dividends and distributions, a complete redemption of the investment at the NAV at the end of the period and no sales or redemption charges (if any). Total returns would be reduced if a sales or redemption charge was taken into account. Returns do not reflect the impact of taxes to shareholders relating to Fund distributions or the redemption of Fund shares. Total returns for periods less than one full year are not annualized. |
| | (d) | The Fund’s portfolio turnover rate is calculated in accordance with regulatory requirements, without regard to transactions involving short term investments. If such transactions were included, the Fund’s portfolio turnover rate may be higher. |
| | |
| The accompanying notes are an integral part of these financial statements. | | 15 |
GOLDMAN SACHS GQG PARTNERS INTERNATIONAL OPPORTUNITIES FUND
|
Financial Highlights (continued) Selected Share Data for a Share Outstanding Throughout Each Period |
| | | | | | | | | | | | | | | | | | | | | | | | | | | | | | | | | | |
| | | | | Goldman Sachs GQG Partners International Opportunities Fund |
| | |
| | | | | Class R6 Shares |
| | | | | Six Months Ended | | Year Ended October 31, |
| | | | | April 30, 2024 (Unaudited) | | 2023 | | 2022 | | 2021 | | 2020 | | 2019 | | |
| | | | | | | | |
| | | Per Share Data | | | | | | | | | | | | | | | | | | | | | | | | | | | | | | | | |
| | | | | | | | |
| | | Net asset value, beginning of period | | | $ | 17.68 | | | | $ | 16.23 | | | | $ | 20.55 | | | | $ | 16.56 | | | | $ | 14.87 | | | | $ | 12.39 | | | |
| | |
| | | | | | | | |
| | Net investment income(a) | | | | 0.21 | | | | | 0.62 | | | | | 0.83 | | | | | 0.38 | | | | | 0.07 | | | | | 0.05 | | | |
| | | | | | | | |
| | Net realized and unrealized gain (loss) | | | | 4.66 | | | | | 1.65 | | | | | (4.71 | ) | | | | 3.64 | | | | | 1.72 | | | | | 2.50 | | | |
| | |
| | | | | | | | |
| | Total from investment operations | | | | 4.87 | | | | | 2.27 | | | | | (3.88 | ) | | | | 4.02 | | | | | 1.79 | | | | | 2.55 | | | |
| | |
| | | | | | | | |
| | Distributions to shareholders from net investment income | | | | (0.47 | ) | | | | (0.82 | ) | | | | (0.44 | ) | | | | (0.03 | ) | | | | (0.10 | ) | | | | (0.07 | ) | | |
| | |
| | | | | | | | |
| | Net asset value, end of period | | | $ | 22.08 | | | | $ | 17.68 | | | | $ | 16.23 | | | | $ | 20.55 | | | | $ | 16.56 | | | | $ | 14.87 | | | |
| | |
| | | | | | | | |
| | Total return(b) | | | | 27.93 | % | | | | 14.31 | % | | | | (19.17 | )% | | | | 24.27 | % | | | | 12.09 | % | | | | 20.68 | % | | |
| | |
| | | | | | | | |
| | Net assets, end of period (in 000s) | | | $ | 2,352,820 | | | | $ | 1,565,411 | | | | $ | 1,023,099 | | | | $ | 757,796 | | | | $ | 391,507 | | | | $ | 34,263 | | | |
| | | | | | | | |
| | Ratio of net expenses to average net assets | | | | 0.74 | %(c) | | | | 0.75 | % | | | | 0.74 | % | | | | 0.75 | % | | | | 0.77 | % | | | | 0.81 | % | | |
| | | | | | | | |
| | Ratio of total expenses to average net assets | | | | 0.76 | %(c) | | | | 0.78 | % | | | | 0.78 | % | | | | 0.80 | % | | | | 0.81 | % | | | | 0.92 | % | | |
| | | | | | | | |
| | Ratio of net investment income to average net assets | | | | 2.06 | %(c) | | | | 3.48 | % | | | | 4.63 | % | | | | 1.97 | % | | | | 0.42 | % | | | | 0.34 | % | | |
| | | | | | | | |
| | Portfolio turnover rate(d) | | | | 48 | % | | | | 62 | % | | | | 137 | % | | | | 94 | % | | | | 72 | % | | | | 55 | % | | |
| | |
| | (a) | Calculated based on the average shares outstanding methodology. |
| | (b) | Assumes investment at the NAV at the beginning of the period, reinvestment of all dividends and distributions, a complete redemption of the investment at the NAV at the end of the period and no sales or redemption charges (if any). Total returns would be reduced if a sales or redemption charge was taken into account. Returns do not reflect the impact of taxes to shareholders relating to Fund distributions or the redemption of Fund shares. Total returns for periods less than one full year are not annualized. |
| | (d) | The Fund’s portfolio turnover rate is calculated in accordance with regulatory requirements, without regard to transactions involving short term investments. If such transactions were included, the Fund’s portfolio turnover rate may be higher. |
| | |
| 16 | | The accompanying notes are an integral part of these financial statements. |
GOLDMAN SACHS GQG PARTNERS INTERNATIONAL OPPORTUNITIES FUND
|
Financial Highlights (continued) Selected Share Data for a Share Outstanding Throughout Each Period |
| | | | | | | | | | | | | | | | | | | | | | | | | | | | | | | | | | |
| | | | | Goldman Sachs GQG Partners International Opportunities Fund |
| | |
| | | | | Class R Shares |
| | | | | Six Months Ended | | Year Ended October 31, |
| | | | | April 30, 2024 (Unaudited) | | 2023 | | 2022 | | 2021 | | 2020 | | 2019 | | |
| | | | | | | | |
| | | Per Share Data | | | | | | | | | | | | | | | | | | | | | | | | | | | | | | | | |
| | | | | | | | |
| | | Net asset value, beginning of period | | | $ | 17.27 | | | | $ | 15.88 | | | | $ | 20.11 | | | | $ | 16.28 | | | | $ | 14.69 | | | | $ | 12.26 | | | |
| | |
| | | | | | | | |
| | Net investment income(a) | | | | 0.15 | | | | | 0.48 | | | | | 0.69 | | | | | 0.22 | | | | | 0.01 | | | | | 0.01 | | | |
| | | | | | | | |
| | Net realized and unrealized gain (loss) | | | | 4.55 | | | | | 1.64 | | | | | (4.61 | ) | | | | 3.61 | | | | | 1.65 | | | | | 2.43 | | | |
| | |
| | | | | | | | |
| | Total from investment operations | | | | 4.70 | | | | | 2.12 | | | | | (3.92 | ) | | | | 3.83 | | | | | 1.66 | | | | | 2.44 | | | |
| | |
| | | | | | | | |
| | Distributions to shareholders from net investment income | | | | (0.38 | ) | | | | (0.73 | ) | | | | (0.31 | ) | | | | — | | | | | (0.07 | ) | | | | (0.01 | ) | | |
| | |
| | | | | | | | |
| | Net asset value, end of period | | | $ | 21.59 | | | | $ | 17.27 | | | | $ | 15.88 | | | | $ | 20.11 | | | | $ | 16.28 | | | | $ | 14.69 | | | |
| | |
| | | | | | | | |
| | Total return(b) | | | | 27.54 | % | | | | 13.63 | % | | | | (19.73 | )% | | | | 23.53 | % | | | | 11.32 | % | | | | 19.91 | % | | |
| | |
| | | | | | | | |
| | Net assets, end of period (in 000s) | | | $ | 5,226 | | | | $ | 3,570 | | | | $ | 1,215 | | | | $ | 1,095 | | | | $ | 735 | | | | $ | 208 | | | |
| | | | | | | | |
| | Ratio of net expenses to average net assets | | |
| 1.37
| %(c)
| | | | 1.38 | % | | | | 1.39 | % | | | | 1.40 | % | | | | 1.42 | % | | | | 1.47 | % | | |
| | | | | | | | |
| | Ratio of total expenses to average net assets | | |
| 1.38
| %(c)
| | | | 1.41 | % | | | | 1.42 | % | | | | 1.44 | % | | | | 1.45 | % | | | | 1.54 | % | | |
| | | | | | | | |
| | Ratio of net investment income to average net assets | | |
| 1.44
| %(c)
| | | | 2.74 | % | | | | 3.88 | % | | | | 1.19 | % | | | | 0.07 | % | | | | 0.05 | % | | |
| | | | | | | | |
| | Portfolio turnover rate(d) | | | | 48 | % | | | | 62 | % | | | | 137 | % | | | | 94 | % | | | | 72 | % | | | | 55 | % | | |
| | |
| | (a) | Calculated based on the average shares outstanding methodology. |
| | (b) | Assumes investment at the NAV at the beginning of the period, reinvestment of all dividends and distributions, a complete redemption of the investment at the NAV at the end of the period and no sales or redemption charges (if any). Total returns would be reduced if a sales or redemption charge was taken into account. Returns do not reflect the impact of taxes to shareholders relating to Fund distributions or the redemption of Fund shares. Total returns for periods less than one full year are not annualized. |
| | (d) | The Fund’s portfolio turnover rate is calculated in accordance with regulatory requirements, without regard to transactions involving short term investments. If such transactions were included, the Fund’s portfolio turnover rate may be higher. |
| | |
| The accompanying notes are an integral part of these financial statements. | | 17 |
GOLDMAN SACHS GQG PARTNERS INTERNATIONAL OPPORTUNITIES FUND
|
Financial Highlights (continued) Selected Share Data for a Share Outstanding Throughout Each Period |
| | | | | | | | | | | | | | | | | | | | | | | | | | | | | | | | | | |
| | | | | Goldman Sachs GQG Partners International Opportunities Fund |
| | |
| | | | | Class P Shares |
| | | | | Six Months Ended | | Year Ended October 31, |
| | | | | April 30, 2024 (Unaudited) | | 2023 | | 2022 | | 2021 | | 2020 | | 2019 | | |
| | | | | | | | |
| | | Per Share Data | | | | | | | | | | | | | | | | | | | | | | | | | | | | | | | | |
| | | | | | | | |
| | Net asset value, beginning of period | | | $ | 17.68 | | | | $ | 16.22 | | | | $ | 20.54 | | | | $ | 16.55 | | | | $ | 14.86 | | | | $ | 12.39 | | | |
| | |
| | | | | | | | |
| | Net investment income(a) | | | | 0.21 | | | | | 0.64 | | | | | 0.83 | | | | | 0.37 | | | | | 0.10 | | | | | 0.16 | | | |
| | | | | | | | |
| | Net realized and unrealized gain (loss) | | | | 4.65 | | | | | 1.63 | | | | | (4.71 | ) | | | | 3.65 | | | | | 1.69 | | | | | 2.38 | | | |
| | |
| | | | | | | | |
| | Total from investment operations | | | | 4.86 | | | | | 2.27 | | | | | (3.88 | ) | | | | 4.02 | | | | | 1.79 | | | | | 2.54 | | | |
| | |
| | | | | | | | |
| | Distributions to shareholders from net investment income | | | | (0.47 | ) | | | | (0.81 | ) | | | | (0.44 | ) | | | | (0.03 | ) | | | | (0.10 | ) | | | | (0.07 | ) | | |
| | |
| | | | | | | | |
| | Net asset value, end of period | | | $ | 22.07 | | | | $ | 17.68 | | | | $ | 16.22 | | | | $ | 20.54 | | | | $ | 16.55 | | | | $ | 14.86 | | | |
| | |
| | | | | | | | |
| | Total return(b) | | | | 27.87 | % | | | | 14.38 | % | | | | (19.22 | )% | | | | 24.34 | % | | | | 12.08 | % | | | | 20.61 | % | | |
| | |
| | | | | | | | |
| | Net assets, end of period (in 000s) | | | $ | 3,739,330 | | | | $ | 2,635,558 | | | | $ | 2,099,648 | | | | $ | 2,330,569 | | | | $ | 1,186,744 | | | | $ | 477,609 | | | |
| | | | | | | | |
| | Ratio of net expenses to average net assets | | | | 0.74 | %(c) | | | | 0.75 | % | | | | 0.74 | % | | | | 0.75 | % | | | | 0.77 | % | | | | 0.82 | % | | |
| | | | | | | | |
| | Ratio of total expenses to average net assets | | | | 0.76 | %(c) | | | | 0.78 | % | | | | 0.78 | % | | | | 0.80 | % | | | | 0.81 | % | | | | 0.89 | % | | |
| | | | | | | | |
| | Ratio of net investment income to average net assets | | | | 2.06 | %(c) | | | | 3.60 | % | | | | 4.55 | % | | | | 1.90 | % | | | | 0.61 | % | | | | 1.14 | % | | |
| | | | | | | | |
| | Portfolio turnover rate(d) | | | | 48 | % | | | | 62 | % | | | | 137 | % | | | | 94 | % | | | | 72 | % | | | | 55 | % | | |
| | |
| | (a) | Calculated based on the average shares outstanding methodology. |
| | (b) | Assumes investment at the NAV at the beginning of the period, reinvestment of all dividends and distributions, a complete redemption of the investment at the NAV at the end of the period and no sales or redemption charges (if any). Total returns would be reduced if a sales or redemption charge was taken into account. Returns do not reflect the impact of taxes to shareholders relating to Fund distributions or the redemption of Fund shares. Total returns for periods less than one full year are not annualized. |
| | (d) | The Fund’s portfolio turnover rate is calculated in accordance with regulatory requirements, without regard to transactions involving short term investments. If such transactions were included, the Fund’s portfolio turnover rate may be higher. |
| | |
| 18 | | The accompanying notes are an integral part of these financial statements. |
GOLDMAN SACHS GQG PARTNERS INTERNATIONAL OPPORTUNITIES FUND
|
Notes to Financial Statements April 30, 2024 (Unaudited) |
Goldman Sachs Trust II (the “Trust”) is a Delaware statutory trust registered under the Investment Company Act of 1940, as amended (the “Act”), as an open-end management investment company. The Trust includes the Goldman Sachs GQG Partners International Opportunities Fund (the “Fund”). The Fund is a diversified portfolio that currently offers seven classes of shares: Class A, Class C, Institutional, Investor, Class R6, Class R and Class P Shares.
Class A Shares are sold with a front-end sales charge of up to 5.50%. Class C Shares are sold with a contingent deferred sales charge (“CDSC”) of 1.00%, which is imposed on redemptions made within 12 months of purchase. Institutional, Investor, Class R6, Class R, and Class P Shares are not subject to a sales charge.
Goldman Sachs Asset Management, L.P. (“GSAM”), an affiliate of Goldman Sachs & Co. LLC (“Goldman Sachs”), serves as investment adviser to the Fund pursuant to a management agreement (the “Agreement”) with the Trust.
GQG Partners LLC (“GQG Partners” or the “Sub-Adviser”) serves as the sub-adviser to the Fund. GSAM compensates the Sub-Adviser directly in accordance with the terms of the Sub-Advisory Agreement. The Fund is not charged any separate or additional investment advisory fees by the Sub-Adviser.
|
|
2. SIGNIFICANT ACCOUNTING POLICIES |
The financial statements have been prepared in accordance with accounting principles generally accepted in the United States of America (“GAAP”) and require management to make estimates and assumptions that may affect the reported amounts and disclosures. Actual results may differ from those estimates and assumptions. The Fund is an investment company under GAAP and follows the accounting and reporting guidance applicable to investment companies.
A. Investment Valuation — The Fund’s valuation policy is to value investments at fair value.
B. Investment Income and Investments — Investment income includes interest income, dividend income and securities lending income, if any. Interest income is accrued daily and adjusted for amortization of premiums and accretion of discounts. Dividend income is recognized on ex-dividend date or, for certain foreign securities, as soon as such information is obtained subsequent to the ex-dividend date. Non-cash dividends, if any, are recorded at the fair market value of the securities received. Investment transactions are reflected on trade date. Realized gains and losses are calculated using identified cost. Investment transactions are recorded on the following business day for daily net asset value (“NAV”) calculations. Investment income is recorded net of any foreign withholding taxes, less any amounts reclaimable. The Fund may file withholding tax reclaims in certain jurisdictions to recover a portion of amounts previously withheld. Any foreign capital gains tax is accrued daily based upon net unrealized gains, and is payable upon sale of such investments.
C. Class Allocations and Expenses — Investment income, realized and unrealized gain (loss), if any, and non-class specific expenses of the Fund are allocated daily based upon the proportion of net assets of each class. Non-class specific expenses directly incurred by the Fund are charged to the Fund, while such expenses incurred by the Trust are allocated across the Fund on a straight-line and/or pro-rata basis depending upon the nature of the expenses. Class specific expenses, where applicable, are borne by the respective share classes and include Distribution and Service, Transfer Agency and Service fees.
D. Federal Taxes and Distributions to Shareholders — It is the Fund’s policy to comply with the requirements of the Internal Revenue Code of 1986, as amended (the “Code”), applicable to regulated investment companies and to distribute each year substantially all of its investment company taxable income and capital gains to its shareholders. Accordingly, the Fund is not required to make any provisions for the payment of federal income tax. Distributions to shareholders are recorded on the ex-dividend date. Income and capital gains distributions, if any, are declared and paid annually.
Net capital losses, if any, are carried forward to future fiscal years and may be used to the extent allowed by the Code to offset any future capital gains. Losses that are carried forward will retain their character as either short-term or long-term capital losses. Utilization of capital loss carryforwards will reduce the requirement of future capital gains distributions.
GOLDMAN SACHS GQG PARTNERS INTERNATIONAL OPPORTUNITIES FUND
|
Notes to Financial Statements (continued) April 30, 2024 (Unaudited) |
|
|
2. SIGNIFICANT ACCOUNTING POLICIES (continued) |
The characterization of distributions to shareholders for financial reporting purposes is determined in accordance with federal income tax rules, which may differ from GAAP. The source of the Fund’s distributions may be shown in the accompanying financial statements as either from distributable earnings or capital. Certain components of the Fund’s net assets on the Statement of Assets and Liabilities reflect permanent GAAP/tax differences based on the appropriate tax character.
E. Foreign Currency Translation — The accounting records and reporting currency of the Fund are maintained in U.S. dollars. Assets and liabilities denominated in foreign currencies are translated into U.S. dollars using the current exchange rates at the close of each business day. The effect of changes in foreign currency exchange rates on investments is included within net realized and unrealized gain (loss) on investments. Changes in the value of other assets and liabilities as a result of fluctuations in foreign exchange rates are included in the Statement of Operations within net change in unrealized gain (loss) on foreign currency translation. Transactions denominated in foreign currencies are translated into U.S. dollars on the date the transaction occurred, the effects of which are included within net realized gain (loss) on foreign currency transactions.
|
|
3. INVESTMENTS AND FAIR VALUE MEASUREMENTS |
U.S. GAAP defines the fair value of a financial instrument as the amount that would be received to sell an asset or paid to transfer a liability in an orderly transaction between market participants at the measurement date (i.e., the exit price); the Fund’s policy is to use the market approach. GAAP establishes a fair value hierarchy that prioritizes the inputs to valuation techniques used to measure fair value. The hierarchy gives the highest priority to unadjusted quoted prices in active markets for identical assets or liabilities (Level 1 measurements) and the lowest priority to unobservable inputs (Level 3 measurements). The level in the fair value hierarchy within which the fair value measurement in its entirety falls shall be determined based on the lowest level input that is significant to the fair value measurement in its entirety. The levels used for classifying investments are not necessarily an indication of the risk associated with investing in these investments. The three levels of the fair value hierarchy are described below:
Level 1 — Unadjusted quoted prices in active markets that are accessible at the measurement date for identical, unrestricted assets or liabilities;
Level 2 — Quoted prices in markets that are not active or financial instruments for which significant inputs are observable (including, but not limited to, quoted prices for similar investments, interest rates, foreign exchange rates, volatility and credit spreads), either directly or indirectly;
Level 3 — Prices or valuations that require significant unobservable inputs (including GSAM’s assumptions in determining fair value measurement).
The Board of Trustees (“Trustees”) has approved Valuation Procedures that govern the valuation of the portfolio investments held by the Fund, including investments for which market quotations are not readily available. With respect to the Fund’s investments that do not have readily available market quotations, the Trustees have designated GSAM as the valuation designee to perform fair valuations pursuant to Rule 2a-5 under the Investment Company Act of 1940 (the “Valuation Designee”). GSAM has day-to-day responsibility for implementing and maintaining internal controls and procedures related to the valuation of the Fund’s investments. To assess the continuing appropriateness of pricing sources and methodologies, GSAM regularly performs price verification procedures and issues challenges as necessary to third party pricing vendors or brokers, and any differences are reviewed in accordance with the Valuation Procedures.
A. Level 1 and Level 2 Fair Value Investments — The valuation techniques and significant inputs used in determining the fair values for investments classified as Level 1 and Level 2 are as follows:
Equity Securities — Equity securities traded on a United States (“U.S.”) securities exchange or the NASDAQ system, or those located on certain foreign exchanges, including but not limited to the Americas, are valued daily at their last sale price or official closing price on the principal exchange or system on which they are traded. If there is no sale or official closing price or such price is believed by GSAM to not represent fair value, equity securities will be valued at the valid closing bid price for long positions and at the valid closing ask price for short positions (i.e., where there is sufficient volume, during normal exchange trading hours).
GOLDMAN SACHS GQG PARTNERS INTERNATIONAL OPPORTUNITIES FUND
|
|
3. INVESTMENTS AND FAIR VALUE MEASUREMENTS (continued) |
If no valid bid/ask price is available, the equity security will be valued pursuant to the Valuation Procedures and consistent with applicable regulatory guidance. To the extent these investments are actively traded, they are classified as Level 1 of the fair value hierarchy, otherwise they are generally classified as Level 2. Certain equity securities containing unique attributes may be classified as Level 2.
Unlisted equity securities for which market quotations are available are valued at the last sale price on the valuation date, or if no sale occurs, at the last bid price for long positions or the last ask price for short positions, and are generally classified as Level 2. Securities traded on certain foreign securities exchanges are valued daily at fair value determined by an independent fair value service (if available) under the Valuation Procedures and consistent with applicable regulatory guidance. The independent fair value service takes into account multiple factors including, but not limited to, movements in the securities markets, certain depositary receipts, futures contracts and foreign currency exchange rates that have occurred subsequent to the close of the foreign securities exchange. These investments are generally classified as Level 2 of the fair value hierarchy.
Money Market Funds — Investments in the Goldman Sachs Financial Square Government Fund (“Underlying Money Market Fund”) are valued at the NAV per share of the Institutional Share class on the day of valuation. These investments are generally classified as Level 1 of the fair value hierarchy. For information regarding the Underlying Money Market Fund’s accounting policies and investment holdings, please see the Underlying Money Market Fund’s shareholder report.
B. Level 3 Fair Value Investments — To the extent that significant inputs to valuation models and other alternative pricing sources are unobservable, or if quotations are not readily available, or if GSAM believes that such quotations do not accurately reflect fair value, the fair value of the Fund’s investments may be determined under the Valuation Procedures. GSAM, consistent with its procedures and applicable regulatory guidance, may make an adjustment to the most recent valuation prices of either domestic or foreign securities in light of significant events to reflect what it believes to be the fair value of the securities at the time of determining the Fund’s NAV. To the extent investments are valued using single source broker quotations obtained directly from the broker or passed through from third party pricing vendors, such investments are classified as Level 3 investments.
C. Fair Value Hierarchy — The following is a summary of the Fund’s investments classified in the fair value hierarchy as of April 30, 2024:
| | | | | | | | | | | | |
| Investment Type | | Level 1 | | | Level 2 | | | Level 3 | |
|
| |
| | | |
Assets | | | | | | | | | | | | |
| | | |
Common Stock and/or Other Equity Investments(a) | | | | | | | | | | | | |
| | | |
Asia | | $ | 1,642,995,187 | | | $ | 8,931,517,852 | | | $ | — | |
| | | |
Australia and Oceania | | | — | | | | 346,521,420 | | | | — | |
| | | |
Europe | | | 753,055,031 | | | | 19,937,516,229 | | | | — | |
| | | |
North America | | | 6,472,797,018 | | | | — | | | | — | |
| | | |
South America | | | 1,001,066,749 | | | | — | | | | — | |
| | | |
Preferred Stocks | | | — | | | | 1,588,603,674 | | | | — | |
| | | |
Securities Lending Reinvestment Vehicle | | | 36,320,241 | | | | — | | | | — | |
| | | |
Investment Company | | | 2,213,153,195 | | | | — | | | | — | |
|
| |
| | | |
Total | | $ | 12,119,387,421 | | | $ | 30,804,159,175 | | | $ | — | |
|
| |
| | (a) | Amounts are disclosed by continent to highlight the impact of time zone differences between local market close and the calculation of net asset value. Security valuations are based on the principal exchange or system on which they are traded, which may differ from country of domicile. The Fund utilizes fair value model prices provided by an independent fair value service for international equities, resulting in a Level 2 classification. |
For further information regarding security characteristics, see the Schedule of Investments.
GOLDMAN SACHS GQG PARTNERS INTERNATIONAL OPPORTUNITIES FUND
|
Notes to Financial Statements (continued) April 30, 2024 (Unaudited) |
|
|
4. AGREEMENTS AND AFFILIATED TRANSACTIONS |
A. Management Agreement — Under the Agreement, GSAM manages the Fund, subject to the general supervision of the Trustees.
As compensation for the services rendered pursuant to the Agreement, the assumption of the expenses related thereto and administration of the Fund’s business affairs, including providing facilities, GSAM is entitled to a management fee, accrued daily and paid monthly, equal to an annual percentage rate of the Fund’s average daily net assets. For the six months ended April 30, 2024, contractual and effective net management fees with GSAM were at the following rates:
| | | | | | | | | | | | | | | | | | | | | | | | | | | | |
| | | Contractual Management Rate | | | | | |
| | | | | | | |
| Fund | | First
$1 billion | | Next
$1 billion | | Next
$3 billion | | Next
$3 billion | | Over
$8 billion | | Effective Rate | | Effective Net
Management
Rate^ | |
|
| |
| | | | | | | |
Goldman Sachs GQG Partners | | | | | | | | | | | | | | | | | | | | | | | | | | | | |
International Opportunities Fund | | | 0.85 | % | | | 0.77 | % | | | 0.73 | % | | | 0.71 | % | | | 0.70 | % | | | 0.71 | % | | | 0.71% | |
|
| |
| | ^ | Effective Net Management Rate includes the impact of management fee waivers of affiliated underlying funds, if any. |
The Fund invests in Institutional Shares of the Goldman Sachs Financial Square Government Fund, which is an affiliated Underlying Fund. GSAM has agreed to waive a portion of its management fee payable by the Fund in an amount equal to the management fee it earns as an investment adviser to the affiliated Underlying Fund in which the Fund invests, except those management fees it earns from the Fund’s investments of cash collateral received in connection with securities lending transactions in the Goldman Sachs Financial Square Government Fund. For the six months ended April 30, 2024, GSAM waived $803,647 of the Fund’s management fee.
B. Distribution and/or Service (12b-1) Plans — The Trust, on behalf of Class A and Class R Shares of the Fund, has adopted Distribution and Service Plans subject to Rule 12b-1 under the Act. Under the Distribution and Service Plans, Goldman Sachs, which serves as distributor (the “Distributor”), is entitled to a fee accrued daily and paid monthly for distribution services and personal and account maintenance services, which may then be paid by Goldman Sachs to authorized dealers. These fees are equal to an annual percentage rate of the average daily net assets attributable to Class A or Class R Shares of the Fund, as applicable, as set forth below.
The Trust, on behalf of Class C Shares of the Fund, has adopted a Distribution Plan subject to Rule 12b-1 under the Act. Under the Distribution Plan, Goldman Sachs as Distributor is entitled to a fee accrued daily and paid monthly for distribution services, which may then be paid by Goldman Sachs to authorized dealers. These fees are equal to an annual percentage rate of the average daily net assets attributable to Class C Shares of the Fund, as set forth below.
| | | | | | |
| | | Distribution and/or Service Plan Rates |
| |
| | |
| | | |
| | | Class A* | | Class C | | Class R* |
|
|
| | | |
Distribution and/or Service Plan | | 0.25% | | 0.75% | | 0.50% |
|
|
| | * | With respect to Class A and Class R Shares, the Distributor at its discretion may use compensation for distribution services paid under the Distribution Plan to compensate service organizations for personal and account maintenance services and expenses as long as such total compensation does not exceed the maximum cap on “service fees” imposed by the Financial Industry Regulatory Authority. |
GOLDMAN SACHS GQG PARTNERS INTERNATIONAL OPPORTUNITIES FUND
|
|
4. AGREEMENTS AND AFFILIATED TRANSACTIONS (continued) |
C. Distribution Agreement — Goldman Sachs, as Distributor of the shares of the Fund pursuant to a Distribution Agreement, may retain a portion of the Class A Shares’ front end sales charge and Class C Shares’ CDSC. During the six months ended April 30, 2024, Goldman Sachs retained the following amounts:
| | | | |
| | | Front End
Sales Charge | |
| |
| | | | |
| |
| Fund | | Class A | |
|
| |
| |
Goldman Sachs GQG Partners | | | | |
| |
International Opportunities Fund | | | $65,085 | |
|
| |
During the six months ended April 30, 2024, Goldman Sachs did not retain any portion of Class C Shares’ CDSC.
D. Service Plan — The Trust, on behalf of the Fund, has adopted a Service Plan to allow Class C Shares to compensate service organizations (including Goldman Sachs) for providing varying levels of personal and account maintenance services to their customers who are beneficial owners of such shares. The Service Plan provides for compensation to the service organizations equal to an annual percentage rate of 0.25% of the average daily net assets attributable to Class C Shares of the Fund.
E. Transfer Agency Agreement — Goldman Sachs also serves as the transfer agent of the Fund for a fee pursuant to the Transfer Agency Agreement. The fees charged for such transfer agency services are accrued daily and paid monthly at annual rates as follows: 0.15% of the average daily net assets of Class A, Class C, Investor and Class R Shares; 0.03% of the average daily net assets of Class R6 and Class P Shares; and 0.04% of the average daily net assets of Institutional Shares. Goldman Sachs has agreed to waive a portion of its transfer agency fee equal to 0.01% as an annual percentage rate of the average daily net assets attributable to Class R6 and Class P Shares of the Fund. This arrangement will remain in effect through at least February 28, 2025, and prior to such date Goldman Sachs may not terminate the arrangement without the approval of the Trustees.
F. Other Expense Agreements and Affiliated Transactions — GSAM has agreed to reduce or limit certain “Other Expenses” of the Fund (excluding acquired fund fees and expenses, transfer agency fees and expenses, service fees and shareholder administration fees (as applicable), taxes, interest, brokerage fees, expenses of shareholder meetings, litigation and indemnification and extraordinary expenses) to the extent such expenses exceed, on an annual basis, a percentage rate of the average daily net assets of the Fund. Such Other Expense reimbursements, if any, are accrued daily and paid monthly. In addition, the Fund is not obligated to reimburse GSAM for prior fiscal year expense reimbursements, if any. The Other Expense limitation as an annual percentage rate of average daily net assets for the Fund is 0.014%. The Other Expense limitation will remain in place through at least February 28, 2025, and prior to such date GSAM may not terminate the arrangement without the approval of the Trustees. In addition, the Fund has entered into certain offset arrangements with the transfer agent, which may result in a reduction of the Fund’s expenses and are received irrespective of the application of the “Other Expense” limitations described above.
GSAM may voluntarily waive a portion of any payments under the Fund’s Distribution and Service Plan, Service Plan and Transfer Agency Agreement, and these waivers are in addition to what is stipulated in any contractual fee waiver arrangements (as applicable). These temporary waivers may be modified or terminated at any time at the option of Goldman Sachs without shareholder approval.
For the six months ended April 30, 2024, these expense reductions, including any fee waivers and Other Expense reimbursements, were as follows:
| | | | | | | | |
| Fund | | Management
Fee Waiver | | Transfer Agency
Waivers/Credits | | Other
Expense
Reimbursements | | Total
Expense
Reductions |
|
|
| | | | |
Goldman Sachs GQG Partners International Opportunities Fund | | $803,647 | | $287,067 | | $2,081,172 | | $3,171,886 |
|
|
GOLDMAN SACHS GQG PARTNERS INTERNATIONAL OPPORTUNITIES FUND
|
Notes to Financial Statements (continued) April 30, 2024 (Unaudited) |
|
|
4. AGREEMENTS AND AFFILIATED TRANSACTIONS (continued) |
G. Line of Credit Facility — As of April 30, 2024, the Fund participated in a $1,150,000,000 committed, unsecured revolving line of credit facility (the “facility”) together with other funds of the Trust and certain registered investment companies having management agreements with GSAM or its affiliates. This facility is to be used for temporary emergency purposes, or to allow for an orderly liquidation of securities to meet redemption requests. The interest rate on borrowings is based on the federal funds rate. The facility also requires a fee to be paid by the Fund based on the amount of the commitment that has not been utilized. For the six months ended April 30, 2024, the Fund did not have any borrowings under the facility. Prior to April 16, 2024, the facility was $1,110,000,000.
H. Other Transactions with Affiliates — For the six months ended April 30, 2024, Goldman Sachs did not earn any brokerage commissions from portfolio transactions, on behalf of the Fund.
The table below provides information about the Fund’s investments in the Goldman Sachs Financial Square Government Fund for the six months ended April 30, 2024:
| | | | | | | | | | | | | | | | | | | | | | | | | | |
| Fund | | Underlying Fund | | Beginning
Value as of
October 31,
2023 | | | Purchases
at Cost | | | Proceeds
from Sales | | | Ending
Value as of
April 30, 2024 | | | Shares as of
April 30,
2024 | | | Dividend
Income | |
|
| |
| | | | | | | |
Goldman Sachs GQG Partners International Opportunities Fund | | Goldman Sachs Financial Square Government Fund — Institutional Shares | | $ | 716,742,511 | | | $ | 8,881,161,987 | | | $ | (7,384,751,303 | ) | | $ | 2,213,153,195 | | | | 2,213,153,195 | | | $ | 26,674,819 | |
|
| |
|
|
5. PORTFOLIO SECURITIES TRANSACTIONS |
The cost of purchases and proceeds from sales and maturities of long-term securities for the six months ended April 30, 2024, were $20,919,626,486 and $17,380,016,201, respectively.
Pursuant to exemptive relief granted by the Securities and Exchange Commission (“SEC”) and the terms and conditions contained therein, the Fund may lend its securities through a securities lending agent, Goldman Sachs Agency Lending (“GSAL”), a wholly-owned subsidiary of Goldman Sachs, to certain qualified borrowers including Goldman Sachs and affiliates. In accordance with the Fund’s securities lending procedures, the Fund receives cash collateral at least equal to the market value of the securities on loan. The market value of the loaned securities is determined at the close of business of the Fund, at their last sale price or official closing price on the principal exchange or system on which they are traded, and any additional required collateral is delivered to the Fund on the next business day. As with other extensions of credit, the Fund may experience delay in the recovery of its securities or incur a loss should the borrower of the securities breach its agreement with the Fund or become insolvent at a time when the collateral is insufficient to cover the cost of repurchasing securities on loan. Dividend income received from securities on loan may not be subject to withholding taxes and therefore withholding taxes paid may differ from the amounts listed in the Statement of Operations. Loans of securities are terminable at any time and as such 1) the remaining contractual maturities of the outstanding securities lending transactions are considered to be overnight and continuous and 2) the borrower, after notice, is required to return borrowed securities within the standard time period for settlement of securities transactions.
The Fund invests the cash collateral received in connection with securities lending transactions in the Goldman Sachs Financial Square Government Fund (“Government Money Market Fund”), an affiliated series of the Goldman Sachs Trust. The Government Money Market Fund is registered under the Act as an open end investment company, is subject to Rule 2a-7 under the Act, and is managed by GSAM, for which GSAM may receive a management fee of up to 0.16% on an annualized basis of the average daily net assets of the Government Money Market Fund.
In the event of a default by a borrower with respect to any loan, GSAL will exercise any and all remedies provided under the applicable borrower agreement to make the Fund whole. These remedies include purchasing replacement securities by applying the collateral held from the defaulting broker against the purchase cost of the replacement securities. If GSAL is unable to purchase
GOLDMAN SACHS GQG PARTNERS INTERNATIONAL OPPORTUNITIES FUND
|
|
6. SECURITIES LENDING (continued) |
replacement securities, GSAL will indemnify the Fund by paying the Fund an amount equal to the market value of the securities loaned minus the value of cash collateral received from the borrower for the loan, subject to an exclusion for any shortfalls resulting from a loss of value in such cash collateral due to reinvestment risk. The Fund’s master netting agreements with certain borrowers provide the right, in the event of a default (including bankruptcy or insolvency), for the non-defaulting party to liquidate the collateral and calculate net exposure to the defaulting party or request additional collateral. However, in the event of a default by a borrower, a resolution authority could determine that such rights are not enforceable due to the restrictions or prohibitions against the right of set-off that may be imposed in accordance with a particular jurisdiction’s bankruptcy or insolvency laws. The Fund’s loaned securities were all subject to enforceable Securities Lending Agreements and the value of the collateral was at least equal to the value of the cash received. The amounts of the Fund’s overnight and continuous agreements, which represent the gross amounts of recognized liabilities for securities lending transactions outstanding as of April 30, 2024, are disclosed as “Payable upon return of securities loaned” on the Statement of Assets and Liabilities, where applicable.
Both the Fund and GSAL received compensation relating to the lending of the Fund’s securities. The amounts earned, if any, by the Fund for the six months ended April 30, 2024, are reported under Investment Income on the Statement of Operations.
The table below details securities lending activity with affiliates of Goldman Sachs:
| | | | | | | | | | | | |
| | | For the Six Months Ended April 30, 2024 | | | | |
| Fund | | Earnings of GSAL Relating to Securities Loaned | | | Amounts Received by the Funds from Lending to Goldman Sachs | | | Amounts Payable to Goldman Sachs Upon Return of Securities Loaned as of April 30, 2024 | |
|
| |
| | | |
Goldman Sachs GQG Partners | | | | | | | | | | | | |
International Opportunities Fund | | | $261,285 | | | | $38,594 | | | | $— | |
|
| |
The following table provides information about the Fund’s investment in the Government Money Market Fund for the six months ended April 30, 2024:
| | | | | | | | | | | | | | | | |
| | | | |
| Fund | | Beginning
Value as of
October 31, 2023 | | | Purchases at cost | | | Proceeds
from Sales | | | Ending
Value as of
April 30, 2024 | |
|
| |
| | | | |
Goldman Sachs GQG Partners | | | | | | | | | | | | | | | | |
International Opportunities Fund | | | $254,172,800 | | | | $2,491,454,343 | | | | $(2,709,306,902) | | | | $36,320,241 | |
|
| |
As of the Fund’s most recent fiscal year end, October 31, 2023, the Fund’s capital loss carryforwards on a tax basis were as follows:
| | | | | | | | | | | | |
| |
| | | Goldman Sachs GQG Partners
International Opportunities Fund | |
| | | |
| Capital loss carryforwards: | | | | | | | | | | | | |
| | | |
Perpetual Short-Term | | | | | | | $(1,407,239,042 | ) | | | | |
| | | |
Perpetual Long-Term | | | | | | | (109,783,998 | ) | | | | |
| | | |
| Total capital loss carryforwards | | | | | | | (1,517,023,040 | ) | | | | |
GOLDMAN SACHS GQG PARTNERS INTERNATIONAL OPPORTUNITIES FUND
|
Notes to Financial Statements (continued) April 30, 2024 (Unaudited) |
|
|
7. TAX INFORMATION (continued) |
As of April 30, 2024, the Fund’s aggregate security unrealized gains and losses based on cost for U.S. federal income tax purposes were as follows:
| | | | |
| | | Goldman Sachs GQG Partners | |
| | | International Opportunities Fund | |
|
| |
| |
Tax Cost | | | $34,306,234,062 | |
|
| |
| |
Gross unrealized gain | | | 9,726,479,218 | |
|
| |
| |
Gross unrealized loss | | | (1,109,166,684) | |
|
| |
| |
Net unrealized gain | | | $ 8,617,312,534 | |
|
| |
The difference between GAAP-basis and tax basis unrealized gains (losses) is attributable primarily to wash sales and differences in the tax treatment of passive foreign investment company investments.
GSAM has reviewed the Fund’s tax positions for all open tax years (the current and prior three years, as applicable) and has concluded that no provision for income tax is required in the Fund’s financial statements. Such open tax years remain subject to examination and adjustment by tax authorities.
The Fund’s risks include, but are not limited to, the following:
Depositary Receipts Risk - Foreign securities may trade in the form of depositary receipts, which include American Depositary Receipts (“ADRs”) and Global Depositary Receipts (“GDRs”) (collectively “Depositary Receipts”). To the extent the Fund acquires Depositary Receipts through banks which do not have a contractual relationship with the foreign issuer of the security underlying the Depositary Receipts to issue and service such unsponsored Depositary Receipts, there may be an increased possibility that the Fund would not become aware of and be able to respond to corporate actions such as stock splits or rights offerings involving the foreign issuer in a timely manner. In addition, the lack of information may result in inefficiencies in the valuation of such instruments. Investment in Depositary Receipts does not eliminate all the risks inherent in investing in securities of non-U.S. issuers. The market value of Depositary Receipts is dependent upon the market value of the underlying securities and fluctuations in the relative value of the currencies in which the Depositary Receipts and the underlying securities are quoted. The issuers of Depositary Receipts may discontinue issuing new Depositary Receipts and withdraw existing Depositary Receipts at any time, which may result in costs and delays in the distribution of the underlying assets to the Fund and may negatively impact the Fund’s performance.
Foreign and Emerging Countries Risk — Investing in foreign markets may involve special risks and considerations not typically associated with investing in the U.S. Foreign securities may be subject to risk of loss because of more or less foreign government regulation; less public information; less stringent investor protections; less stringent accounting, corporate governance, financial reporting and disclosure standards; and less economic, political and social stability in the countries in which the Fund invests. The imposition of sanctions, exchange controls (including repatriation restrictions), confiscation of assets and property, trade restrictions (including tariffs) and other government restrictions by the U.S. or other governments, or from problems in registration, settlement or custody, may also result in losses. The type and severity of sanctions and other similar measures, including counter sanctions and other retaliatory actions, that may be imposed could vary broadly in scope, and their impact is impossible to predict. For example, the imposition of sanctions and other similar measures could, among other things, cause a decline in the value and/or liquidity of securities issued by the sanctioned country or companies located in or economically tied to the sanctioned country and increase market volatility and disruption in the sanctioned country and throughout the world. Sanctions and other similar measures could limit or prevent the Fund from buying and selling securities (in the sanctioned country and other markets), significantly delay or prevent the settlement of securities transactions, and significantly impact the Fund’s liquidity and performance. Foreign risk also involves the risk of negative foreign currency exchange rate fluctuations, which may cause the value of securities denominated in such foreign currency (or other instruments through which the Fund has exposure to foreign
GOLDMAN SACHS GQG PARTNERS INTERNATIONAL OPPORTUNITIES FUND
|
|
8. OTHER RISKS (continued) |
currencies) to decline in value. Currency exchange rates may fluctuate significantly over short periods of time. To the extent that a Fund also invests in securities of issuers located in, or economically tied to, emerging markets, these risks may be more pronounced.
Geographic Risk— If the Fund focuses its investments in securities of issuers located in a particular country or geographic region, the Fund may be subjected, to a greater extent than if its investments were less focused, to the risks of volatile economic cycles and/or conditions and developments that may be particular to that country or region, such as: adverse securities markets; adverse exchange rates; adverse social, political, regulatory, economic, business, environmental or other developments; or natural disasters.
Investment Style Risk — Different investment styles (e.g., “growth”, “value” or “quantitative”) tend to shift in and out of favor depending upon market and economic conditions and investor sentiment. The Fund may outperform or underperform other funds that invest in similar asset classes but employ different investment styles.
Investments in Other Investment Companies Risk — As a shareholder of another investment company, the Fund will indirectly bear its proportionate share of any net management fees and other expenses paid by such other investment companies, in addition to the fees and expenses regularly borne by the Fund.
Large Shareholder Transactions Risk — The Fund may experience adverse effects when certain large shareholders, such as other funds, institutional investors (including those trading by use of non-discretionary mathematical formulas), financial intermediaries (who may make investment decisions on behalf of underlying clients and/or include the Fund in their investment model), individuals, accounts and Goldman Sachs affiliates, purchase or redeem large amounts of shares of the Fund. Such large shareholder redemptions, which may occur rapidly or unexpectedly, may cause the Fund to sell portfolio securities at times when it would not otherwise do so, which may negatively impact the Fund’s NAV and liquidity. These transactions may also accelerate the realization of taxable income to shareholders if such sales of investments resulted in gains, and may also increase transaction costs. In addition, a large redemption could result in the Fund’s current expenses being allocated over a smaller asset base, leading to an increase in the Fund’s expense ratio. Similarly, large Fund share purchases may adversely affect the Fund’s performance to the extent that the Fund is delayed in investing new cash or otherwise maintains a larger cash position than it ordinarily would.
Market and Credit Risks — In the normal course of business, the Fund trades financial instruments and enters into financial transactions where risk of potential loss exists due to changes in the market (market risk). The value of the securities in which the Fund invests may go up or down in response to the prospects of individual companies, particular sectors or governments and/or general economic conditions throughout the world due to increasingly interconnected global economies and financial markets. Events such as war, military conflict, acts of terrorism, social unrest, natural disasters, recessions, inflation, rapid interest rate changes, supply chain disruptions, sanctions, the spread of infectious illness or other public health threats could also significantly impact the Fund and its investments. Additionally, the Fund may also be exposed to credit risk in the event that an issuer or guarantor fails to perform or that an institution or entity with which the Fund has unsettled or open transactions defaults.
Mid-Cap and Small-Cap Risk — Investments in mid-capitalization and small-capitalization companies involve greater risks than those associated with larger, more established companies. These securities may be subject to more abrupt or erratic price movements and may lack sufficient market liquidity, and these issuers often face greater business risks.
Under the Trust’s organizational documents, its Trustees, officers, employees and agents are indemnified, to the extent permitted by the Act and state law, against certain liabilities that may arise out of performance of their duties to the Fund. Additionally, in the course of business, the Fund enters into contracts that contain a variety of indemnification clauses. The Fund’s maximum exposure under these arrangements is unknown, as this would involve future claims that may be made against the Fund that have not yet occurred. However, GSAM believes the risk of loss under these arrangements to be remote.
GOLDMAN SACHS GQG PARTNERS INTERNATIONAL OPPORTUNITIES FUND
|
Notes to Financial Statements (continued) April 30, 2024 (Unaudited) |
Subsequent events after the Statement of Assets and Liabilities date have been evaluated, and GSAM has concluded that there is no impact requiring adjustment or disclosure in the financial statements.
|
|
11. SUMMARY OF SHARE TRANSACTIONS |
Share activity is as follows:
| | | | | | | | | | | | | | | | |
| | | Goldman Sachs GQG Partners International Opportunities Fund | |
| | |
| | | For the Six Months Ended April 30, 2024 (Unaudited) | | | For the Fiscal Year Ended
October 31, 2023 | |
| |
| | | | |
| | | | |
| | | Shares | | | Dollars | | | Shares | | | Dollars | |
| |
| | | | |
| | | | |
Class A Shares | | | | | | | | | | | | | | | | |
| | | | |
Shares sold | | | 8,868,683 | | | $ | 183,924,944 | | | | 10,461,811 | | | $ | 182,944,586 | |
| | | | |
Reinvestment of distributions | | | 410,492 | | | | 7,869,138 | | | | 935,354 | | | | 15,367,872 | |
| | | | |
Shares redeemed | | | (5,148,790 | ) | | | (104,804,243 | ) | | | (14,468,795 | ) | | | (249,865,871 | ) |
|
| |
| | | | |
| | | 4,130,385 | | | | 86,989,839 | | | | (3,071,630 | ) | | | (51,553,413 | ) |
|
| |
| | | | |
Class C Shares | | | | | | | | | | | | | | | | |
| | | | |
Shares sold | | | 927,783 | | | | 18,774,902 | | | | 1,147,063 | | | | 19,518,625 | |
| | | | |
Reinvestment of distributions | | | 74,767 | | | | 1,394,408 | | | | 175,877 | | | | 2,815,789 | |
| | | | |
Shares redeemed | | | (465,442 | ) | | | (9,274,642 | ) | | | (843,516 | ) | | | (14,247,182 | ) |
|
| |
| | | | |
| | | 537,108 | | | | 10,894,668 | | | | 479,424 | | | | 8,087,232 | |
|
| |
| | | | |
Institutional Shares | | | | | | | | | | | | | | | | |
| | | | |
Shares sold | | | 257,971,028 | | | | 5,380,126,392 | | | | 398,800,485 | | | | 6,984,402,392 | |
| | | | |
Reinvestment of distributions | | | 21,490,569 | | | | 414,767,977 | | | | 34,889,014 | | | | 577,064,288 | |
| | | | |
Shares redeemed | | | (110,465,202 | ) | | | (2,288,070,372 | ) | | | (262,903,339 | ) | | | (4,592,681,744 | ) |
|
| |
| | | | |
| | | 168,996,395 | | | | 3,506,823,997 | | | | 170,786,160 | | | | 2,968,784,936 | |
|
| |
| | | | |
Investor Shares | | | | | | | | | | | | | | | | |
| | | | |
Shares sold | | | 91,704,441 | | | | 1,919,156,423 | | | | 169,576,947 | | | | 2,967,354,806 | |
| | | | |
Reinvestment of distributions | | | 8,402,211 | | | | 161,574,520 | | | | 13,711,437 | | | | 225,964,484 | |
| | | | |
Shares redeemed | | | (49,986,527 | ) | | | (1,037,227,330 | ) | | | (103,470,716 | ) | | | (1,814,437,962 | ) |
|
| |
| | | | |
| | | 50,120,125 | | | | 1,043,503,613 | | | | 79,817,668 | | | | 1,378,881,328 | |
|
| |
| | | | |
Class R6 Shares | | | | | | | | | | | | | | | | |
| | | | |
Shares sold | | | 26,667,070 | | | | 552,165,769 | | | | 41,030,062 | | | | 730,249,395 | |
| | | | |
Reinvestment of distributions | | | 1,684,659 | | | | 32,497,074 | | | | 2,410,823 | | | | 39,850,905 | |
| | | | |
Shares redeemed | | | (10,321,538 | ) | | | (215,212,148 | ) | | | (17,960,800 | ) | | | (310,270,416 | ) |
|
| |
| | | | |
| | | 18,030,191 | | | | 369,450,695 | | | | 25,480,085 | | | | 459,829,884 | |
|
| |
| | | | |
Class R Shares | | | | | | | | | | | | | | | | |
| | | | |
Shares sold | | | 60,267 | | | | 1,233,196 | | | | 152,241 | | | | 2,645,518 | |
| | | | |
Reinvestment of distributions | | | 4,243 | | | | 80,187 | | | | 3,857 | | | | 62,600 | |
| | | | |
Shares redeemed | | | (29,110 | ) | | | (606,087 | ) | | | (25,914 | ) | | | (451,004 | ) |
|
| |
| | | | |
| | | 35,400 | | | | 707,296 | | | | 130,184 | | | | 2,257,114 | |
|
| |
| | | | |
Class P Shares | | | | | | | | | | | | | | | | |
| | | | |
Shares sold | | | 25,328,664 | | | | 523,609,257 | | | | 36,213,294 | | | | 635,656,045 | |
| | | | |
Reinvestment of distributions | | | 3,734,268 | | | | 72,034,034 | | | | 6,277,121 | | | | 103,698,041 | |
| | | | |
Shares redeemed | | | (8,757,495 | ) | | | (179,679,452 | ) | | | (22,828,772 | ) | | | (395,113,530 | ) |
|
| |
| | | | |
| | | 20,305,437 | | | | 415,963,839 | | | | 19,661,643 | | | | 344,240,556 | |
|
| |
| | | | |
NET INCREASE | | | 262,155,041 | | | $ | 5,434,333,947 | | | | 293,283,534 | | | $ | 5,110,527,637 | |
|
| |
GOLDMAN SACHS GQG PARTNERS INTERNATIONAL OPPORTUNITIES FUND
|
| Fund Expenses — Six Month Period Ended April 30, 2024 (Unaudited) |
As a shareholder of Class A, Class C, Institutional, Investor, Class R6, Class R or Class P Shares of the Fund, you incur two types of costs: (1) transaction costs, including sales charges on purchase payments (with respect to Class A Shares), contingent deferred sales charges on redemptions (generally with respect to Class C Shares), and (2) ongoing costs, including management fees; distribution and/or service (12b-1) fees (with respect to Class A, Class C and Class R Shares); and other Fund expenses. This example is intended to help you understand your ongoing costs (in dollars) of investing in Class A, Class C, Institutional, Investor, Class R6, Class R or Class P Shares of the Fund and to compare these costs with the ongoing costs of investing in other mutual funds.
The example is based on an investment of $1,000 invested at the beginning of the period and held for the entire period from November 1, 2023 through April 30, 2024, which represents a period of 182 days of a 366-day year. This projection assumes that annualized expense ratios were in effect during the period.
Actual Expenses — The first line under each share class in the table below provides information about actual account values and actual expenses. You may use the information in this line, together with the amount you invested, to estimate the expenses that you paid over the period. Simply divide your account value by $1,000 (for example, an $8,600 account value divided by $1,000=8.6), then multiply the result by the number in the first line under the heading entitled “Expenses Paid” to estimate the expenses you paid on your account during this period.
Hypothetical Example for Comparison Purposes — The second line under each share class in the table below provides information about hypothetical account values and hypothetical expenses based on the Fund’s actual net expense ratios and an assumed rate of return of 5% per year before expenses, which is not the Fund’s actual return. The hypothetical account values and expenses may not be used to estimate the actual ending account balance or expenses you paid for the period. You may use this information to compare the ongoing costs of investing in the Fund and other funds. To do so, compare this 5% hypothetical example with the 5% hypothetical examples that appear in the shareholder reports of the other funds.
Please note that the expenses shown in the table are meant to highlight your ongoing costs only and do not reflect any transactional costs, such as sales charges, redemption fees, or exchange fees. Therefore, the second line of the table is useful in comparing ongoing costs only, and will not help you determine the relative total costs of owning different funds. In addition, if these transactional costs were included, your costs would have been higher.
| | | | | | | | | | | | |
| | | Goldman Sachs GQG Partners International Opportunities Fund | |
| | | | |
| Share Class | | Beginning Account Value 11/1/23 | | | Ending Account Value 4/30/24 | | | Expenses Paid for the 6 months ended 4/30/24* | |
| Class A | | | | | | | | | | | | |
Actual | | | $1,000.00 | | | | $1,276.80 | | | | $ 6.33 | |
Hypothetical 5% return | | | 1,000.00 | | | | 1,019.30 | + | | | 5.61 | |
| Class C | | | | | | | | | | | | |
Actual | | | 1,000.00 | | | | 1,271.70 | | | | 10.55 | |
Hypothetical 5% return | | | 1,000.00 | | |
| 1,015.60
| +
| | | 9.36 | |
| Institutional | | | | | | | | | | | | |
Actual | | | 1,000.00 | | | | 1,278.90 | | | | 4.29 | |
Hypothetical 5% return | | | 1,000.00 | | | | 1,021.10 | + | | | 3.81 | |
| Investor | | | | | | | | | | | | |
Actual | | | 1,000.00 | | | | 1,278.40 | | | | 4.92 | |
Hypothetical 5% return | | | 1,000.00 | | | | 1,020.50 | + | | | 4.36 | |
| Class R6 | | | | | | | | | | | | |
Actual | | | 1,000.00 | | | | 1,279.30 | | | | 4.18 | |
Hypothetical 5% return | | | 1,000.00 | | | | 1,021.20 | + | | | 3.71 | |
| Class R | | | | | | | | | | | | |
Actual | | | 1,000.00 | | | | 1,275.40 | | | | 7.74 | |
Hypothetical 5% return | | | 1,000.00 | | | | 1,018.10 | + | | | 6.86 | |
| Class P | | | | | | | | | | | | |
Actual | | | 1,000.00 | | | | 1,278.70 | | | | 4.18 | |
Hypothetical 5% return | | | 1,000.00 | | | | 1,021.20 | + | | | 3.71 | |
| | * | Expenses for each share class are calculated using the Fund’s annualized net expense ratio for each class, which represents the ongoing expenses as a percentage of net assets for the six months ended April 30, 2024. Expenses are calculated by multiplying the annualized net expense ratio by the average account value for the period; then multiplying the result by the number of days in the most recent fiscal half year; and then dividing that result by the number of days in the fiscal year. The annualized net expense ratios for the period were as follows: | |
| | | | | | | | | | | | | | | | |
| Fund | | Class A | | Class C | | Institutional | | Investor | | Class R6 | | Class R | | Class P | | |
| Goldman Sachs GQG Partners | | | | | | | | | | | | | | | | |
International Opportunities Fund | | 1.12% | | 1.87% | | 0.76% | | 0.87% | | 0.74% | | 1.37% | | 0.74% | | |
| | + | Hypothetical expenses are based on the Fund’s actual annualized net expenses ratios and an assumed rate of return of 5% per year before expenses. | |
29
GOLDMAN SACHS GQG PARTNERS INTERNATIONAL OPPORTUNITIES FUND
|
| Liquidity Risk Management Program (Unaudited) |
Each Fund has adopted and implemented a liquidity risk management program (the “Program”) in accordance with Rule 22e-4 under the 1940 Act. The Program seeks to assess and manage each Fund’s liquidity risk, i.e., the risk that a Fund is unable to satisfy redemption requests without significantly diluting remaining investors’ interests in the Fund. The Board of Trustees of the Trust has designated GSAM, each Fund’s investment adviser, to administer the Program. Certain aspects of the Program rely on third parties to perform certain functions, including the provision of market data and application of models.
The Program is comprised of various components designed to support the assessment and/or management of liquidity risk, including: (1) the periodic assessment (no less frequently than annually) of certain factors that influence a Fund’s liquidity risk; (2) the periodic classification (no less frequently than monthly) of a Fund’s investments into one of four liquidity categories that reflect an estimate of their liquidity under current market conditions; (3) a 15% limit on the acquisition of “illiquid investments” (as defined under Rule 22e-4); (4) for a Fund that does not invest primarily in “highly liquid investments” (as defined under Rule 22e-4), the determination of a minimum percentage of the Fund’s assets that will generally be invested in highly liquid investments (a “Highly Liquid Investment Minimum”); and (5) periodic reporting to the Board of Trustees.
At a meeting of the Board of Trustees on February 13-14, 2024, GSAM provided a written report to the Board addressing the operation, and the adequacy and effectiveness of the implementation, of the Program, including, as applicable, the operation of any Highly Liquid Investment Minimum and any material changes to the Program, for the period from January 1, 2023 through December 31, 2023 (the “Reporting Period”). Among other things, the annual report discussed: (1) the results of stress tests designed to assess liquidity under a hypothetical stressed scenario involving elevated redemptions; (2) an assessment of the methodologies used to classify investments into one of four liquidity categories; and (3) the impact of local holidays in non-U.S. jurisdictions. The report concluded that the Program continues to be reasonably designed to assess and manage liquidity risk and was adequately and effectively implemented during the Reporting Period.
There can be no assurance that the Program will achieve its objectives under all circumstances in the future. Please refer to your Fund’s prospectus for more information regarding the Fund’s exposure to liquidity risk and other risks to which it may be subject.
GOLDMAN SACHS GQG PARTNERS INTERNATIONAL OPPORTUNITIES FUND
Voting Results of Special Meeting of Shareholders (Unaudited)
A Special Meeting of Shareholders (the “Meeting”) of the Goldman Sachs Trust II (the “Trust”) was held on November 16, 2023 to consider and elect nominees to the Trust’s Board of Trustees. At the Meeting, Gregory G. Weaver, Dwight L. Bush, Kathryn A. Cassidy, John G. Chou, Joaquin Delgado, Eileen H. Dowling and Paul C. Wirth were elected to the Trust’s Board of Trustees. In electing the nominees, the Trust’s shareholders voted as follows:
| | | | | | | | |
| Proposal | | | | | | | |
| Election of Trustees | | For | | | | Withheld | |
| | | |
Gregory G. Weaver | | 1,292,078,725 | | | | | 63,531,552 | |
| | | |
Dwight L. Bush | | 1,339,529,258 | | | | | 16,081,019 | |
| | | |
Kathryn A. Cassidy | | 1,340,407,606 | | | | | 15,202,670 | |
| | | |
John G. Chou | | 1,351,547,930 | | | | | 4,062,346 | |
| | | |
Joaquin Delgado | | 1,340,312,893 | | | | | 15,297,383 | |
| | | |
Eileen H. Dowling | | 1,351,944,019 | | | | | 3,666,258 | |
| | | |
Paul C. Wirth | | 1,350,994,736 | | | | | 4,615,540 | |
FUNDS PROFILE
Goldman Sachs Funds
Goldman Sachs is a premier financial services firm, known since 1869 for creating thoughtful and customized investment solutions in complex global markets.
Today, the Asset Management Division of Goldman Sachs serves a diverse set of clients worldwide, including private institutions, public entities and individuals. With approximately $2.56 trillion in assets under supervision as of March 31, 2024, Goldman Sachs Asset Management has portfolio management teams located around the world and our investment professionals bring firsthand knowledge of local markets to every investment decision. Assets under supervision includes assets under management and other client assets for which Goldman Sachs does not have full discretion. Goldman Sachs Asset Management leverages the resources of Goldman Sachs & Co. LLC subject to legal, internal and regulatory restrictions.
Money Market
Financial Square FundsSM
| ∎ | Financial Square Treasury Solutions Fund1 |
| ∎ | Financial Square Government Fund1 |
| ∎ | Financial Square Money Market Fund2 |
| ∎ | Financial Square Prime Obligations Fund2 |
| ∎ | Financial Square Treasury Instruments Fund1 |
| ∎ | Financial Square Treasury Obligations Fund1 |
| ∎ | Financial Square Federal Instruments Fund1 |
Investor FundsSM
| ∎ | Investor Money Market Fund3 |
| ∎ | Investor Tax-Exempt Money Market Fund3 |
Fixed Income
Short Duration and Government
| ∎ | Short-Term Conservative Income Fund |
| ∎ | Short Duration Government Fund |
| ∎ | Short Duration Bond Fund |
| ∎ | Inflation Protected Securities Fund |
Multi-Sector
| ∎ | Global Core Fixed Income Fund |
Municipal and Tax-Free
| ∎ | High Yield Municipal Fund |
| ∎ | Dynamic Municipal Income Fund |
| ∎ | Short Duration Tax-Free Fund |
| ∎ | Municipal Income Completion Fund |
Single Sector
| ∎ | Investment Grade Credit Fund |
| ∎ | High Yield Floating Rate Fund |
| ∎ | Emerging Markets Debt Fund |
| ∎ | Emerging Markets Credit Fund |
Fixed Income Alternatives
| ∎ | Short Duration High Yield Fund4 |
Fundamental Equity
| ∎ | Small/Mid Cap Value Fund |
| ∎ | Small/Mid Cap Growth Fund |
| ∎ | Enhanced Core Equity Fund5 |
| ∎ | Technology Opportunities Fund |
| ∎ | Rising Dividend Growth Fund |
Tax-Advantaged Equity
| ∎ | U.S. Tax-Managed Equity Fund |
| ∎ | International Tax-Managed Equity Fund |
| ∎ | U.S. Equity Dividend and Premium Fund |
| ∎ | International Equity Dividend and Premium Fund |
Equity Insights
| ∎ | Small Cap Equity Insights Fund |
| ∎ | U.S. Equity Insights Fund |
| ∎ | Small Cap Growth Insights Fund |
| ∎ | Large Cap Growth Insights Fund |
| ∎ | Large Cap Value Insights Fund |
| ∎ | Small Cap Value Insights Fund |
| ∎ | International Small Cap Insights Fund |
| ∎ | International Equity Insights Fund |
| ∎ | Emerging Markets Equity Insights Fund |
Fundamental Equity International
| ∎ | International Equity Income Fund |
| ∎ | International Equity ESG Fund |
| ∎ | Emerging Markets Equity Fund |
| ∎ | Emerging Markets Equity ex. China Fund |
| ∎ | ESG Emerging Markets Equity Fund |
Alternative
| ∎ | Clean Energy Income Fund |
| ∎ | Real Estate Securities Fund |
| ∎ | Global Real Estate Securities Fund |
| ∎ | Absolute Return Tracker Fund |
| ∎ | Managed Futures Strategy Fund |
| ∎ | MLP Energy Infrastructure Fund |
| ∎ | Energy Infrastructure Fund |
| ∎ | Multi-Strategy Alternatives Fund |
| ∎ | Global Infrastructure Fund |
Total Portfolio Solutions
| ∎ | Global Managed Beta Fund |
| ∎ | Multi-Manager Non-Core Fixed Income Fund |
| ∎ | Multi-Manager Global Equity Fund |
| ∎ | Multi-Manager International Equity Fund |
| ∎ | Tactical Tilt Overlay Fund |
| ∎ | Balanced Strategy Portfolio |
| ∎ | Multi-Manager U.S. Small Cap Equity Fund |
| ∎ | Multi-Manager Real Assets Strategy Fund |
| ∎ | Growth and Income Strategy Portfolio |
| ∎ | Growth Strategy Portfolio |
| ∎ | Dynamic Global Equity Fund |
| ∎ | Enhanced Dividend Global Equity Portfolio |
| ∎ | Tax-Advantaged Global Equity Portfolio |
| ∎ | Strategic Factor Allocation Fund |
| ∎ | Strategic Volatility Premium Fund |
| ∎ | Goldman Sachs GQG Partners International Opportunities Fund |
| 1 | You could lose money by investing in the Fund. Although the Fund seeks to preserve the value of your investment at $1.00 per share, it cannot guarantee it will do so. An investment in the Fund is not a bank account or a deposit of a bank and is not insured or guaranteed by the Federal Deposit Insurance Corporation or any other government agency. The Fund’s sponsor is not required to reimburse the Fund for losses, and you should not expect that the sponsor will provide financial support to the Fund at any time, including during periods of market stress. |
| 2 | You could lose money by investing in the Fund. Because the share price of the Fund will fluctuate, when you sell your shares they may be worth more or less than what you originally paid for them. The Fund may impose a fee upon sale of your shares. Effective October 2, 2024, the Fund generally must impose a fee when net sales of Fund shares exceed certain levels. An investment in the Fund is not a bank account or a deposit of a bank and is not insured or guaranteed by the Federal Deposit Insurance Corporation or any other government agency. The Fund’s sponsor is not required to reimburse the Fund for losses, and you should not expect that the sponsor will provide financial support to the Fund at any time, including during periods of market stress. |
| 3 | You could lose money by investing in the Fund. Although the Fund seeks to preserve the value of your investment at $1.00 per share, it cannot guarantee it will do so. The Fund may impose a fee upon sale of your shares. An investment in the Fund is not a bank account or a deposit of a bank and is not insured or guaranteed by the Federal Deposit Insurance Corporation or any other government agency. The Fund’s sponsor is not required to reimburse the Fund for losses, and you should not expect that the sponsor will provide financial support to the Fund at any time, including during periods of market stress. |
| 4 | Effective after the close of business on April 17, 2024, the Goldman Sachs Long Short Credit Strategies Fund was renamed the Goldman Sachs Short Duration High Yield Fund. |
| 5 | Effective after the close of business on February 13, 2024, the Goldman Sachs Flexible Cap Fund was renamed the Goldman Sachs Enhanced Core Equity Fund. |
| 6 | Effective after the close of business on June 17, 2024, the Goldman Sachs Strategic Income Fund was renamed the Goldman Sachs Dynamic Bond Fund. |
| | Financial Square FundsSM and Investor FundsSM are registered service marks of Goldman Sachs & Co. LLC. |
| * | This list covers open-end funds only. Please visit our website at www.GSAMFUNDS.com to learn more about our closed-end funds and exchange-traded funds. |
TRUSTEES Gregory G. Weaver, Chair Cheryl K. Beebe Dwight L. Bush Kathryn A. Cassidy John G. Chou Joaquin Delgado Eileen H. Dowling Lawrence Hughes John F. Killian Steven D. Krichmar Michael Latham James A. McNamara Lawrence W. Stranghoener PaulC.Wirth GOLDMAN SACHS & CO. LLC Distributor and Transfer Agent OFFICERS James A. McNamara, President Joseph F. DiMaria, Principal Financial Officer, Principal Accounting Officer and Treasurer Robert Griffith, Secretary GOLDMAN SACHS ASSET MANAGEMENT, L.P. Investment Adviser Visit our website at www.GSAMFUNDS.com to obtain the most recent month-end returns. Goldman Sachs Asset Management, L.P., 200 West Street, New York, New York 10282 The reports concerning the Fund included in this shareholder report may contain certain forward-looking statements about the factors that may affectthe performance of the Fund in the future. These statements are based on Fund management’s predictions and expectations concerning certain future events and their expected impact on the Fund, such as performance of the economy as a whole and of specific industry sectors, changes in the levels of interest rates, the impact of developing world events, and other factors that may influence the future performance of the Fund. Management believes these forward-looking statements to be reasonable, although they are inherently uncertain and difficult to predict. Actual events may cause adjustments in portfolio management strategies from those currently expected to be employed. A description of the policies and procedures that the Fund uses to determine how to vote proxies relating to portfolio securities and information regarding how the Fund voted proxies relating to portfolio securities during the most recent 12-month period ended June 30 is available (i) without charge, upon request by calling 1-800-526-7384 (for Retail Shareholders) or 1-800-621-2550 (for Institutional Shareholders); and (ii) on the Securities and Exchange Commission (“SEC”) web site at http://www.sec.gov. The Fund will file its portfolio holdings information for each month in a fiscal quarter within 60 days after the end of the relevant fiscal quarter on Form N-PORT. Portfolio holdings information for the third month of each fiscal quarter will be made available on the SEC’s web site at http://www.sec.gov. Portfolio holdings information may be obtained upon request and without charge by calling 1-800-526-7384 (for Retail Shareholders) or 1-800-621-2550 (for Institutional Shareholders). Economic and market forecasts presented herein reflect our judgment as of the date of this presentation and are subject to change without notice. These forecasts do not take into account the specific investment objectives, restrictions, tax and financial situation or other needs of any specific client. Actual data will vary and may not be reflected here. These forecasts are subject to high levels of uncertainty that may affect actual performance. Accordingly, these forecasts should be viewed as merely representative of a broad range of possible outcomes. These forecasts are estimated, based on assumptions, and are subject to significant revision and may change materially as economic and market conditions change. Holdings and allocations shown are as of April 30, 2024 and may not be representative of future investments. Fund holdings should not be relied on in making investment decisions and should not be construed as research or investment advice regarding particular securities. Current and future holdings are subject to risk. The Global Industry Classification Standard (GICS) was developed by and is the exclusive property and a service mark of Morgan Stanley Capital International Inc. (MSCI) and Standard & Poor’s, a division of The McGraw-Hill Companies, Inc. (S&P) and is licensed for use by Goldman Sachs. Neither MSCI, S&P nor any other party involved in making or compiling the GICS or any GICS classifications makes any express or implied warranties or representations with respect to such standard or classification (or the results to be obtained by the use thereof), and all such parties hereby expressly disclaim all warranties of originality, accuracy, completeness, merchantability or fitness for a particular purpose with respect to any of such standard or classification. Without limiting any of the foregoing, in no event shall MSCI, S&P, any of their affiliates or any third party involved in making or compiling the GICS or any GICS classifications have any liability for any direct, indirect, special, punitive, consequential or any other damages (including lost profits) even if notified of the possibility of such damages. The portfolio risk management process includes an effort to monitor and manage risk, but does not imply low risk. This material is not authorized for distribution to prospective investors unless preceded or accompanied by a current prospectus or summary prospectus, if applicable. Investors should consider the Fund’s objective, risks, and charges and expenses, and read the summary prospectus, if available, and/or the prospectus carefully before investing or sending money. The summary prospectus, if available, and the prospectus contain this and other information about the Fund and may be obtained from your authorized dealer or from Goldman Sachs & Co. LLC by calling 1-800-526-7384 (for Retail Shareholders) or 1-800-621-2550 (for Institutional Shareholders). © 2024 Goldman Sachs. All rights reserved. 374643-OTU-06/2024 GQGPIOSAR-24
Goldman Sachs Funds Semi-Annual Report April 30, 2024 Goldman Sachs Multi-Strategy Alternatives Fund
Goldman Sachs Multi-Strategy Alternatives Fund
TABLE OF CONTENTS
|
Effective January 24, 2023, open-end mutual funds and exchange-traded funds are required to provide shareholders with streamlined annual and semi-annual shareholder reports (“Tailored Shareholder Reports”). Funds will be required to prepare a separate Tailored Shareholder Report for each share class of a fund that highlights key information to investors. Other information, including financial statements, will no longer appear in a fund’s shareholder report, but will be available online, delivered free of charge upon request, and filed with the Securities and Exchange Commission on a semi-annual basis on Form N-CSR. The new requirements have a compliance date of July 24, 2024. |
| | | | | | |
| | | | |
| NOT FDIC-INSURED | | May Lose Value | | No Bank Guarantee | | |
MARKET REVIEW
Goldman Sachs Multi-Strategy Alternatives Fund
The following are highlights both of key factors affecting the global equity and credit markets and of any key changes made to the Goldman Sachs Multi-Strategy Alternatives Fund (the “Fund”) during the six months ended April 30, 2024 (the “Reporting Period”). A streamlined annual shareholder report covering the 12 months ended October 31, 2024 will be provided to Fund shareholders, per new Securities and Exchange Commission (“SEC”) requirements with a compliance date of July 24, 2024.
Market and Economic Review
Global Equity Markets
| ∎ | The broad global equity market, as represented by the MSCI* All Country World Index (“MSCI ACWI”) Investable Market Index, returned 19.64% during the Reporting Period. |
| ∎ | When the Reporting Period began in November 2023, global equities were in the midst of a rally. |
| | ∎ | The rally, which had started in late October 2023, followed a period of considerable volatility, as market participants weighed the probabilities for various U.S. economic scenarios, ranging from a “soft landing” to a “hard landing” to stagflation.1 |
| | ∎ | Late October 2023 marked a turning point in market sentiment, as the soft landing narrative became dominant. Investors appeared to believe the U.S. Federal Reserve (“Fed”) would not hike interest rates again, and they started pricing in interest rate cuts for 2024. (The Fed had last raised the target federal funds rate in July 2023.) |
| ∎ | Global equities continued to rally through the end of March 2024, delivering strongly positive returns. |
| ∎ | In April 2024, the global equity market gave back some of its gains, as persistent inflation led investors to scale back their expectations for the number of potential Fed rate cuts. |
| ∎ | From a style perspective, growth stocks and value stocks generated positive returns during the Reporting Period overall, with growth stocks outpacing their value counterparts. |
| ∎ | From a regional perspective, developed markets equities and emerging markets equities produced gains, with developed markets equities outperforming emerging markets equities. |
| | ∎ | Within developed markets equities, the Japanese stock market was a particularly strong performer amid investor optimism about corporate governance reforms and potential changes to the Bank of Japan’s monetary policy. |
| | ∎ | Within emerging markets equities, China was the weakest performer due to that country’s economic challenges, including an ongoing property crisis and weak consumer sentiment. |
Credit Markets
| ∎ | Credit markets broadly advanced during the Reporting Period, as bond yields fell and credit spreads (or yield differentials versus duration-equivalent U.S. Treasury securities) tightened. |
| ∎ | In the first two months of the Reporting Period, bond yields plunged amidst speculation the Fed had reached the peak of its interest rate hikes and would begin cutting rates in 2024. |
| ∎ | Bond yields rose during the last four months of the Reporting Period, as markets came to terms with the possibility that interest rates could remain higher for longer. |
| | ∎ | Also, due to persistent inflation, investors had moderated their expectations for Fed rate cuts in 2024, which contributed further to the rise in yields. |
| | ∎ | Credit spreads continued to tighten as a result of strong demand and a drop in supply, especially net new supply. |
| 1 | A soft landing, in economics, is a cyclical downturn that avoids recession. It typically describes attempts by central banks to raise interest rates just enough to stop an economy from overheating and experiencing high inflation, without causing a significant increase in unemployment, or a hard landing. Stagflation is characterized by slow economic growth and high inflation. |
MARKET REVIEW
| ∎ | High yield corporate bonds and bank loans delivered strong performance during the Reporting Period overall, with high yield corporate bonds outpacing bank loans. |
| | ∎ | The outperformance of high yield corporate bonds was driven largely by spread tightening and their comparatively longer duration. (Duration is a measure of a security’s sensitivity to changes in interest rates.) |
| | ∎ | The default rate for bank loans and high yield corporate bonds increased modestly during the Reporting Period but remained below long-term averages. |
| ∎ | Investment grade corporate bonds also benefited from their longer duration profile, though they underperformed high yield corporate bonds during the Reporting Period overall. |
| | ∎ | As yields fell in the first two months of the Reporting Period, investment grade corporate bonds outperformed high yield corporate bonds. However, they lagged during the last four months of the Reporting Period when yields moved higher. |
| | ∎ | Among market segments, financial and industrial investment grade corporate bonds performed best, while utilities turned in the weakest performance. |
| ∎ | U.S. dollar-denominated emerging markets debt was the strongest performing credit sector of the Reporting Period, benefiting from spread compression across the credit spectrum and strong gains among the lowest rated credits. |
| | ∎ | Local currency-denominated bonds generally underperformed other credit sectors during the Reporting Period, largely because of a strong U.S. dollar and higher-for-longer central bank policy that anchored interest rates above market expectations. |
Fund Changes and Highlights
| ∎ | At a meeting of the Board of Trustees of Goldman Sachs Trust held on February 13-14, 2024, the Trustees approved the termination of the Fund’s Class R Shares. This termination occurred on April 16, 2024 (the “Termination Date”). |
| ∎ | Effective February 28, 2024, in anticipation of the termination, Class R Shares of the Fund were not sold to new investors. |
| ∎ | After April 12, 2024, Class R Shares of the Fund were no longer available for sale to existing shareholders. |
| ∎ | In connection with the termination, all outstanding Class R Shares on the Termination Date were automatically redeemed by the Fund. |
FUND BASICS
Goldman Sachs Multi-Strategy Alternatives Fund
as of April 30, 2024
| | | | | | |
| | | |
November 1, 2023–April 30, 2024 | | Fund Total
Return (based on NAV)1 | | ICE BofAML
Three-Month U.S. Treasury Bill Index2 | | |
| | | |
Class A | | -3.17% | | 2.66% | | |
| | | |
Class C | | -3.54 | | 2.66 | | |
| | | |
Institutional | | -3.06 | | 2.66 | | |
| | | |
Investor | | -3.06 | | 2.66 | | |
| | | |
Class R6 | | -3.00 | | 2.66 | | |
| | | |
Class P | | -3.06 | | 2.66 | | |
| | 1 | The net asset value (“NAV”) represents the net assets of the class of the Fund (ex-dividend) divided by the total number of shares of the class outstanding. The Fund’s performance assumes the reinvestment of dividends and other distributions. The Fund’s performance does not reflect the deduction of any applicable sales charges. |
| | 2 | The ICE BofAML Three-Month U.S. Treasury Bill Index is comprised of a single issue purchased at the beginning of the month and held for a full month. At the end of the month that issue is sold and rolled into a newly selected issue. The issue selected at each month-end rebalancing is the outstanding Treasury Bill that matures closest to, but not beyond, three months from the rebalancing date. To qualify for selection, an issue must have settled on or before the month-end rebalancing date. While the index will often hold the Treasury Bill issued at the most recent 3-month auction, it is also possible for a seasoned 6-month Bill to be selected. |
| | | The returns set forth in the table above represent past performance. Past performance does not guarantee future results. The Fund’s investment return and principal value will fluctuate so that an investor’s shares, when redeemed, may be worth more or less than their original cost. Current performance may be lower or higher than the performance quoted above. Please visit our web site at www.GSAMFUNDS.com to obtain the most recent month-end returns. Performance reflects applicable fee waivers and/or expense limitations in effect during the periods shown. In their absence, performance would be reduced. Returns do not reflect the deduction of taxes that a shareholder would pay on Fund distributions or the redemption of Fund shares. |
FUND BASICS
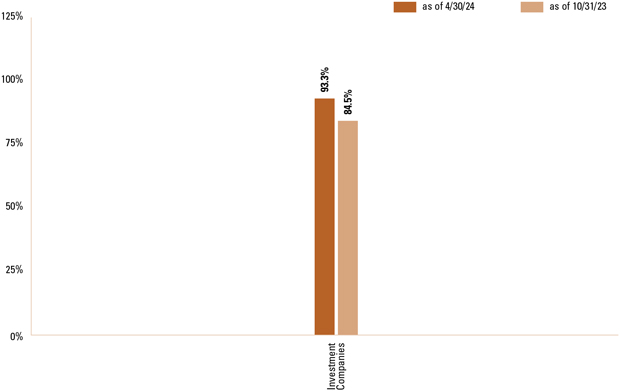
| | * | The percentage shown for each investment category reflects the value of investments in that category as a percentage of the Fund’s market value. Figures in the graph may not sum to 100% due to rounding and/or the exclusion of other assets and liabilities. The graph depicts the Fund’s investments but may not represent the Fund’s market exposure due to the exclusion of certain derivatives, if any, as listed in the Additional Investment Information section of the Consolidated Schedule of Investments. |
| | | For more information about the Fund, please refer to www.GSAMFUNDS.com. There, you can learn more about the Fund’s investment strategies, holdings, and performance. |
GOLDMAN SACHS MULTI-STRATEGY ALTERNATIVES FUND
|
Consolidated Schedule of Investments April 30, 2024 (Unaudited) |
| | | | | | | | | | | | | | | | |
| | | Shares | | | Description | | Value | |
| |
| | Common Stocks(a) – 0.0% | |
| |
| | Oil, Gas & Consumable Fuels – 0.0% | |
| | | | | 39,366 | | | | Gazprom PJSC* | | $ | — | |
| | | | | 3,021 | | | | LUKOIL PJSC | | | — | |
| | | | | 27,893 | | | | Rosneft Oil Co. PJSC | | | — | |
| | | | | | | | | | | | | | | | |
| | | | | | | | | | | | | | | — | |
| | | |
| |
| | TOTAL COMMON STOCKS | |
| | |
| | (Cost $621,979) | | $ | — | |
| | | |
| | | |
| | | Shares | | | Dividend Rate | | Value | |
| |
| | Investment Company(b) – 93.3% | |
| | Goldman Sachs Financial Square Government Fund — Institutional Shares | |
| | | | | 76,132,887 | | | | | | | 5.223% | | $ | 76,132,887 | |
| | (Cost $76,132,887) | |
| | | |
| | |
| | TOTAL INVESTMENTS – 93.3% (Cost $76,754,866) | | $ | 76,132,887 | |
| | | |
| | |
| | OTHER ASSETS IN EXCESS OF LIABILITIES – 6.7% | | | 5,424,844 | |
| | | |
| | |
| | NET ASSETS – 100.0% | | $ | 81,557,731 | |
| | | |
| | |
| The percentage shown for each investment category reflects the value of investments in that category as a percentage of net assets. |
| |
| * | | Non-income producing security. |
| |
| (a) | | Significant unobservable inputs were used in the valuation of this portfolio security; i.e., Level 3. |
| |
| (b) | | Represents an Affiliated Issuer. |
|
|
ADDITIONAL INVESTMENT INFORMATION |
FORWARD FOREIGN CURRENCY EXCHANGE CONTRACTS — At April 30, 2024, the Fund had the following forward foreign currency exchange contracts:
FORWARD FOREIGN CURRENCY EXCHANGE CONTRACTS WITH UNREALIZED GAIN
| | | | | | | | | | | | | | | | | | | | | | | | | | | | | | |
| Counterparty | | Currency Purchased | | | | | Currency Sold | | | | | | Settlement
Date | | | | | | Unrealized
Gain | |
|
| |
| | | | | | | | | |
MS & Co. Int. PLC | | EUR | | | 660,000 | | | | | USD | | | 705,285 | | | | | | | | 06/20/24 | | | | | | | $ | 564 | |
| | GBP | | | 2,010,000 | | | | | USD | | | 2,504,146 | | | | | | | | 06/20/24 | | | | | | | | 8,122 | |
| | USD | | | 28,858,165 | | | | | AUD | | | 43,910,000 | | | | | | | | 06/20/24 | | | | | | | | 369,970 | |
| | USD | | | 4,837,576 | | | | | CAD | | | 6,600,000 | | | | | | | | 06/20/24 | | | | | | | | 39,284 | |
| | USD | | | 51,361,531 | | | | | CHF | | | 44,960,000 | | | | | | | | 06/20/24 | | | | | | | | 2,170,080 | |
| | USD | | | 8,717,432 | | | | | EUR | | | 8,020,000 | | | | | | | | 06/20/24 | | | | | | | | 140,301 | |
| | USD | | | 4,063,467 | | | | | GBP | | | 3,220,000 | | | | | | | | 06/20/24 | | | | | | | | 38,837 | |
| | USD | | | 4,328,950 | | | | | JPY | | | 660,330,000 | | | | | | | | 06/20/24 | | | | | | | | 109,425 | |
| | USD | | | 19,432,545 | | | | | NOK | | | 208,140,000 | | | | | | | | 06/20/24 | | | | | | | | 671,235 | |
| | USD | | | 32,951,856 | | | | | NZD | | | 54,330,000 | | | | | | | | 06/20/24 | | | | | | | | 938,001 | |
| | USD | | | 6,088,844 | | | | | SEK | | | 64,980,000 | | | | | | | | 06/20/24 | | | | | | | | 178,846 | |
|
| |
| | | | | | | | | |
| TOTAL | | | | | | | | | | | | | | | | | | | | | | | | | | | | $ | 4,664,665 | |
|
| |
|
| FORWARD FOREIGN CURRENCY EXCHANGE CONTRACTS WITH UNREALIZED LOSS | |
| Counterparty | | Currency Purchased | | | | | Currency Sold | | | | | | Settlement
Date | | | | | | Unrealized
Loss | |
|
| |
| | | | | | | | | |
MS & Co. Int. PLC | | AUD | | | 3,130,000 | | | | | USD | | | 2,058,952 | | | | | | | | 06/20/24 | | | | | | | $ | (28,251 | ) |
| | CAD | | | 31,040,000 | | | | | USD | | | 22,981,486 | | | | | | | | 06/20/24 | | | | | | | | (414,971 | ) |
| | CHF | | | 30,120,000 | | | | | USD | | | 33,388,704 | | | | | | | | 06/20/24 | | | | | | | | (433,936 | ) |
| | |
| The accompanying notes are an integral part of these financial statements. | | 5 |
GOLDMAN SACHS MULTI-STRATEGY ALTERNATIVES FUND
|
Consolidated Schedule of Investments (continued) April 30, 2024 (Unaudited) |
|
|
ADDITIONAL INVESTMENT INFORMATION (continued) |
FORWARD FOREIGN CURRENCY EXCHANGE CONTRACTS WITH UNREALIZED LOSS (continued)
| | | | | | | | | | | | | | | | | | | | | | | | | | | | | | |
| Counterparty | | Currency Purchased | | | | | Currency Sold | | | | | | Settlement
Date | | | | | | Unrealized
Loss | |
|
| |
| | | | | | | | | |
MS & Co. Int. PLC (continued) | | EUR | | | 24,490,000 | | | | | USD | | | 26,486,923 | | | | | | | | 06/20/24 | | | | | | | $ | (295,657 | ) |
| | GBP | | | 8,670,000 | | | | | USD | | | 11,025,658 | | | | | | | | 06/20/24 | | | | | | | | (189,160 | ) |
| | JPY | | | 7,685,920,000 | | | | | USD | | | 51,169,417 | | | | | | | | 06/20/24 | | | | | | | | (2,056,201 | ) |
| | NOK | | | 89,290,000 | | | | | USD | | | 8,304,150 | | | | | | | | 06/20/24 | | | | | | | | (255,734 | ) |
| | NZD | | | 4,630,000 | | | | | USD | | | 2,766,714 | | | | | | | | 06/20/24 | | | | | | | | (38,494 | ) |
| | SEK | | | 508,030,000 | | | | | USD | | | 49,340,936 | | | | | | | | 06/20/24 | | | | | | | | (3,135,075 | ) |
| | USD | | | 927,491 | | | | | EUR | | | 870,000 | | | | | | | | 06/20/24 | | | | | | | | (2,946 | ) |
| | USD | | | 1,179,076 | | | | | GBP | | | 950,000 | | | | | | | | 06/20/24 | | | | | | | | (8,314 | ) |
|
| |
| | | | | | | | | |
| TOTAL | | | | | | | | | | | | | | | | | | | | | | | | | | | | $ | (6,858,739 | ) |
|
| |
FUTURES CONTRACTS — At April 30, 2024, the Fund had the following futures contracts:
| | | | | | | | | | | | | | | | | | | | | | |
| Description | | Number of
Contracts | | | | Expiration
Date | | | | Notional
Amount | | | | | | Unrealized
Appreciation/
(Depreciation) | |
|
| |
| | | | | | | |
Long position contracts: | | | | | | | | | | | | | | | | | | | | | | |
10 Year U.K. Long Gilt | | | 131 | | | | | 06/26/24 | | | | $ | 15,678,331 | | | | | | | $ | (260,154 | ) |
Brent Crude | | | 51 | | | | | 06/28/24 | | | | | 4,366,110 | | | | | | | | 177,800 | |
Cattle Feeder | | | 7 | | | | | 08/29/24 | | | | | 894,250 | | | | | | | | (14,438 | ) |
Cocoa | | | 1 | | | | | 07/16/24 | | | | | 92,830 | | | | | | | | (2,010 | ) |
Coffee | | | 23 | | | | | 12/18/24 | | | | | 1,837,125 | | | | | | | | 200,888 | |
Copper | | | 30 | | | | | 12/27/24 | | | | | 3,451,875 | | | | | | | | 177,950 | |
Corn | | | 92 | | | | | 12/13/24 | | | | | 2,159,700 | | | | | | | | (6,129 | ) |
Cotton No.2 | | | 17 | | | | | 12/06/24 | | | | | 653,055 | | | | | | | | (59,410 | ) |
Gasoline RBOB | | | 13 | | | | | 09/30/24 | | | | | 1,271,252 | | | | | | | | 55,352 | |
Japan 10 Year Government Bond | | | 24 | | | | | 06/13/24 | | | | | 21,989,031 | | | | | | | | (83,378 | ) |
KC HRW Wheat | | | 31 | | | | | 09/13/24 | | | | | 1,004,400 | | | | | | | | 89,938 | |
Lead | | | 51 | | | | | 08/19/24 | | | | | 2,837,653 | | | | | | | | 173,805 | |
Lead | | | 83 | | | | | 05/13/24 | | | | | 4,543,026 | | | | | | | | 204,013 | |
Lead | | | 39 | | | | | 11/18/24 | | | | | 2,189,460 | | | | | | | | 167,056 | |
Lead | | | 9 | | | | | 03/17/25 | | | | | 508,635 | | | | | | | | 7,702 | |
Lean Hogs | | | 26 | | | | | 07/15/24 | | | | | 1,096,420 | | | | | | | | 15,940 | |
Live Cattle | | | 27 | | | | | 08/30/24 | | | | | 1,869,480 | | | | | | | | (105,910 | ) |
LME Lead | | | 35 | | | | | 06/17/24 | | | | | 1,932,359 | | | | | | | | 76,773 | |
LME Zinc | | | 208 | | | | | 05/13/24 | | | | | 15,209,064 | | | | | | | | 2,190,121 | |
LME Zinc | | | 28 | | | | | 06/17/24 | | | | | 2,041,781 | | | | | | | | 180,656 | |
Low Sulphur Gas Oil | | | 12 | | | | | 12/12/24 | | | | | 926,400 | | | | | | | | (36,875 | ) |
Natural Gas | | | 32 | | | | | 05/29/24 | | | | | 637,120 | | | | | | | | (9,684 | ) |
Natural Gas | | | 17 | | | | | 03/27/25 | | | | | 515,950 | | | | | | | | 600 | |
Nickel | | | 124 | | | | | 06/17/24 | | | | | 14,261,736 | | | | | | | | 916,722 | |
Nickel | | | 41 | | | | | 05/13/24 | | | | | 4,699,092 | | | | | | | | 555,614 | |
Nickel | | | 1 | | | | | 07/15/24 | | | | | 115,386 | | | | | | | | 516 | |
Nickel | | | 41 | | | | | 11/18/24 | | | | | 4,798,343 | | | | | | | | 696,623 | |
Nickel | | | 16 | | | | | 02/17/25 | | | | | 1,892,588 | | | | | | | | 78,447 | |
NY Harbor ULSD | | | 7 | | | | | 05/31/24 | | | | | 743,114 | | | | | | | | (55,562 | ) |
NY Harbor ULSD | | | 6 | | | | | 02/28/25 | | | | | 636,854 | | | | | | | | (23,612 | ) |
Primary Aluminum | | | 114 | | | | | 05/13/24 | | | | | 7,312,217 | | | | | | | | 721,063 | |
Primary Aluminum | | | 149 | | | | | 12/16/24 | | | | | 9,822,825 | | | | | | | | 1,132,916 | |
Primary Aluminum | | | 44 | | | | | 02/17/25 | | | | | 2,911,700 | | | | | | | | 306,640 | |
Soybean | | | 33 | | | | | 11/14/24 | | | | | 1,913,175 | | | | | | | | (19,538 | ) |
Soybean | | | 71 | | | | | 12/13/24 | | | | | 2,112,620 | | | | | | | | (62,712 | ) |
Sugar 11 | | | 55 | | | | | 02/28/25 | | | | | 1,215,368 | | | | | | | | (173,741 | ) |
| | |
| 6 | | The accompanying notes are an integral part of these financial statements. |
GOLDMAN SACHS MULTI-STRATEGY ALTERNATIVES FUND
|
|
ADDITIONAL INVESTMENT INFORMATION (continued) |
FUTURES CONTRACTS (continued)
| | | | | | | | | | | | | | | | | | | | | | | | | | | | |
| Description | | Number of
Contracts | | | | | Expiration
Date | | | | | | Notional
Amount | | | | | | Unrealized
Appreciation/
(Depreciation) | |
|
| |
| | | | | | | |
Long position contracts: | | | | | | | | | | | | | | | | | | | | | | | | | | | | |
Wheat | | | 50 | | | | | | | | 09/13/24 | | | | | | | | $ 1,555,625 | | | | | | | | $ 87,325 | |
WTI Crude | | | 27 | | | | | | | | 08/20/24 | | | | | | | | 2,157,570 | | | | | | | | 102,600 | |
Zinc | | | 118 | | | | | | | | 08/19/24 | | | | | | | | 8,649,371 | | | | | | | | 1,325,283 | |
Zinc | | | 147 | | | | | | | | 11/18/24 | | | | | | | | 10,800,825 | | | | | | | | 1,877,437 | |
Zinc | | | 23 | | | | | | | | 02/17/25 | | | | | | | | 1,691,650 | | | | | | | | 202,619 | |
Zinc | | | 21 | | | | | | | | 03/17/25 | | | | | | | | 1,544,025 | | | | | | | | 73,214 | |
|
| |
| | | | | | | |
| Total | | | | | | | | | | | | | | | | | | | | | | | | | | | $10,882,460 | |
|
| |
| | | | | | | |
Short position contracts: | | | | | | | | | | | | | | | | | | | | | | | | | | | | |
10 Year German Euro-Bund | | | (32 | ) | | | | | | | 06/06/24 | | | | | | | | (4,442,286 | ) | | | | | | | 41,422 | |
10 Year U.S. Treasury Notes | | | (42 | ) | | | | | | | 06/18/24 | | | | | | | | (4,512,375 | ) | | | | | | | 72,391 | |
5 Year German Euro-Oat | | | (33 | ) | | | | | | | 06/06/24 | | | | | | | | (4,418,755 | ) | | | | | | | 40,639 | |
Australian 10 Year Government Bonds | | | (365 | ) | | | | | | | 06/17/24 | | | | | | | | (26,607,495 | ) | | | | | | | 591,771 | |
Brent Crude | | | (49 | ) | | | | | | | 05/31/24 | | | | | | | | (4,230,170 | ) | | | | | | | (169,640 | ) |
Canada 10 Year Government Bonds | | | (46 | ) | | | | | | | 06/19/24 | | | | | | | | (3,909,156 | ) | | | | | | | 49,934 | |
Coffee | | | (28 | ) | | | | | | | 07/19/24 | | | | | | | | (2,274,825 | ) | | | | | | | (4,465 | ) |
Copper | | | (43 | ) | | | | | | | 07/29/24 | | | | | | | | (4,906,838 | ) | | | | | | | (272,745 | ) |
Corn | | | (58 | ) | | | | | | | 07/12/24 | | | | | | | | (1,295,575 | ) | | | | | | | (30,450 | ) |
Cotton No.2 | | | (2 | ) | | | | | | | 07/09/24 | | | | | | | | (78,430 | ) | | | | | | | 6,720 | |
Gasoline RBOB | | | (12 | ) | | | | | | | 05/31/24 | | | | | | | | (1,356,365 | ) | | | | | | | 31,789 | |
Gasoline RBOB | | | (11 | ) | | | | | | | 06/28/24 | | | | | | | | (1,226,194 | ) | | | | | | | 28,300 | |
Gold 100 Oz | | | (3 | ) | | | | | | | 06/26/24 | | | | | | | | (690,870 | ) | | | | | | | 1,240 | |
Italian 10 Year Government Bonds | | | (30 | ) | | | | | | | 06/06/24 | | | | | | | | (3,745,554 | ) | | | | | | | 33,009 | |
KC HRW Wheat | | | (44 | ) | | | | | | | 07/12/24 | | | | | | | | (1,397,550 | ) | | | | | | | (57,588 | ) |
Korea 10 Year Government Bonds | | | (434 | ) | | | | | | | 06/18/24 | | | | | | | | (34,855,654 | ) | | | | | | | 549,004 | |
Lead | | | (83 | ) | | | | | | | 05/13/24 | | | | | | | | (4,543,026 | ) | | | | | | | (234,069 | ) |
Lead | | | (51 | ) | | | | | | | 08/19/24 | | | | | | | | (2,837,653 | ) | | | | | | | (35,229 | ) |
Lead | | | (39 | ) | | | | | | | 11/18/24 | | | | | | | | (2,189,460 | ) | | | | | | | (137,995 | ) |
Lead | | | (9 | ) | | | | | | | 07/15/24 | | | | | | | | (499,109 | ) | | | | | | | (9,300 | ) |
Lean Hogs | | | (28 | ) | | | | | | | 06/14/24 | | | | | | | | (1,147,720 | ) | | | | | | | (3,940 | ) |
Live Cattle | | | (14 | ) | | | | | | | 06/28/24 | | | | | | | | (979,860 | ) | | | | | | | 2,240 | |
LME Lead | | | (23 | ) | | | | | | | 06/17/24 | | | | | | | | (1,269,836 | ) | | | | | | | (20,884 | ) |
LME Zinc | | | (208 | ) | | | | | | | 05/13/24 | | | | | | | | (15,209,064 | ) | | | | | | | (2,466,291 | ) |
LME Zinc | | | (20 | ) | | | | | | | 06/17/24 | | | | | | | | (1,458,415 | ) | | | | | | | (56,070 | ) |
Low Sulphur Gas Oil | | | (11 | ) | | | | | | | 07/11/24 | | | | | | | | (855,800 | ) | | | | | | | 46,125 | |
Natural Gas | | | (15 | ) | | | | | | | 06/26/24 | | | | | | | | (347,850 | ) | | | | | | | 1,890 | |
Nickel | | | (110 | ) | | | | | | | 06/17/24 | | | | | | | | (12,651,540 | ) | | | | | | | (1,632,684 | ) |
Nickel | | | (41 | ) | | | | | | | 05/13/24 | | | | | | | | (4,699,092 | ) | | | | | | | (725,922 | ) |
Nickel | | | (14 | ) | | | | | | | 07/15/24 | | | | | | | | (1,615,404 | ) | | | | | | | (116,439 | ) |
Nickel | | | (41 | ) | | | | | | | 11/18/24 | | | | | | | | (4,798,343 | ) | | | | | | | (481,944 | ) |
Nickel | | | (16 | ) | | | | | | | 02/17/25 | | | | | | | | (1,892,588 | ) | | | | | | | (117,637 | ) |
NY Harbor ULSD | | | (6 | ) | | | | | | | 06/28/24 | | | | | | | | (639,727 | ) | | | | | | | 35,356 | |
Primary Aluminum | | | (114 | ) | | | | | | | 05/13/24 | | | | | | | | (7,312,217 | ) | | | | | | | (966,851 | ) |
Primary Aluminum | | | (149 | ) | | | | | | | 12/16/24 | | | | | | | | (9,822,825 | ) | | | | | | | (1,161,251 | ) |
Primary Aluminum | | | (39 | ) | | | | | | | 07/15/24 | | | | | | | | (2,524,616 | ) | | | | | | | (105,574 | ) |
Primary Aluminum | | | (6 | ) | | | | | | | 02/17/25 | | | | | | | | (397,050 | ) | | | | | | | (11,562 | ) |
Silver | | | (8 | ) | | | | | | | 07/29/24 | | | | | | | | (1,066,160 | ) | | | | | | | 51,070 | |
Soybean | | | (67 | ) | | | | | | | 07/12/24 | | | | | | | | (2,639,826 | ) | | | | | | | 76,687 | |
Sugar 11 | | | (23 | ) | | | | | | | 06/28/24 | | | | | | | | (500,002 | ) | | | | | | | 3,349 | |
Wheat | | | (53 | ) | | | | | | | 07/12/24 | | | | | | | | (1,598,613 | ) | | | | | | | (69,465 | ) |
WTI Crude | | | (16 | ) | | | | | | | 05/21/24 | | | | | | | | (1,310,880 | ) | | | | | | | 56,880 | |
| | |
| The accompanying notes are an integral part of these financial statements. | | 7 |
GOLDMAN SACHS MULTI-STRATEGY ALTERNATIVES FUND
|
Consolidated Schedule of Investments (continued) April 30, 2024 (Unaudited) |
|
|
ADDITIONAL INVESTMENT INFORMATION (continued) |
FUTURES CONTRACTS (continued)
| | | | | | | | | | | | | | | | | | | | | | | | | | | | |
| Description | | Number of
Contracts | | | | | Expiration
Date | | | | | | Notional
Amount | | | | | | Unrealized
Appreciation/
(Depreciation) | |
|
| |
| | | | | | | |
Short position contracts: | | | | | | | | | | | | | | | | | | | | | | | | | | | | |
WTI Crude | | | (24 | ) | | | | | | | 06/20/24 | | | | | | | $ | (1,950,720 | ) | | | | | | $ | 67,025 | |
Zinc | | | (118 | ) | | | | | | | 08/19/24 | | | | | | | | (8,649,370 | ) | | | | | | | (921,480 | ) |
Zinc | | | (147 | ) | | | | | | | 11/18/24 | | | | | | | | (10,800,825 | ) | | | | | | | (1,598,956 | ) |
Zinc | | | (20 | ) | | | | | | | 07/15/24 | | | | | | | | (1,463,725 | ) | | | | | | | (85,035 | ) |
Zinc | | | (23 | ) | | | | | | | 02/17/25 | | | | | | | | (1,691,650 | ) | | | | | | | (83,139 | ) |
|
| |
| | | | | | | |
Total | | | | | | | | | | | | | | | | | | | | | | | | | | $ | (9,789,764 | ) |
|
| |
| | | | | | | |
| TOTAL FUTURES CONTRACTS | | | | | | | | | | | | | | | | | | | | | | | | | | $ | 1,092,696 | |
|
| |
| | |
|
|
| Currency Abbreviations: |
| AUD | | —Australian Dollar |
| CAD | | —Canadian Dollar |
| CHF | | —Swiss Franc |
| EUR | | —Euro |
| GBP | | —British Pound |
| JPY | | —Japanese Yen |
| NOK | | —Norwegian Krone |
| NZD | | —New Zealand Dollar |
| SEK | | —Swedish Krona |
| USD | | —U.S. Dollar |
|
|
| | |
|
|
| Abbreviation: |
| MS & Co. Int. PLC | | —Morgan Stanley & Co. International PLC |
|
|
| | |
| 8 | | The accompanying notes are an integral part of these financial statements. |
GOLDMAN SACHS MULTI-STRATEGY ALTERNATIVES FUND
|
Consolidated Statement of Assets and Liabilities(a) April 30, 2024 (Unaudited) |
| | | | | | | | |
| | | |
| | | Assets: | | | | | | |
| | | |
| | Investments in affiliated issuers, at value (cost $76,132,887) | | $ | 76,132,887 | | | |
| | Investments in unaffiliated issuers, at value (cost $621,979) | | | — | | | |
| | Cash | | | 2,940,130 | | | |
| | Unrealized gain on forward foreign currency exchange contracts | | | 4,664,665 | | | |
| | Receivables: | | | | | | |
| | Collateral on certain derivative contracts(b) | | | 6,573,780 | | | |
| | Dividends | | | 333,654 | | | |
| | Reimbursement from investment adviser | | | 118,711 | | | |
| | Foreign tax reclaims | | | 39,120 | | | |
| | Fund shares sold | | | 6,343 | | | |
| | Other assets | | | 91,438 | | | |
| | | | | |
| | Total assets | | | 90,900,728 | | | |
| | | | | |
| | | | | | | | |
| | | |
| | Liabilities: | | | | | | |
| | | |
| | Unrealized loss on forward foreign currency exchange contracts | | | 6,858,739 | | | |
| | Variation margin on futures contracts | | | 202,047 | | | |
| | Payables: | | | | | | |
| | Fund shares redeemed | | | 1,141,849 | | | |
| | Investments purchased | | | 333,774 | | | |
| | Management fees | | | 67,295 | | | |
| | Distribution and Service fees and Transfer Agency fees | | | 4,904 | | | |
| | Accrued expenses | | | 734,389 | | | |
| | | | | |
| | Total liabilities | | | 9,342,997 | | | |
| | | | | |
| | | | | | | | |
| | | |
| | Net Assets: | | | | | | |
| | | |
| | Paid-in capital | | | 129,049,718 | | | |
| | Total distributable loss | | | (47,491,987) | | | |
| | | | | |
| | NET ASSETS | | $ | 81,557,731 | | | |
| | | Net Assets: | | | | | | |
| | | Class A | | $ | 6,697,343 | | | |
| | | Class C | | | 205,602 | | | |
| | | Institutional | | | 19,464,406 | | | |
| | | Investor | | | 3,849,296 | | | |
| | | Class R6 | | | 10,872 | | | |
| | | Class P | | | 51,330,212 | | | |
| | | Total Net Assets | | $ | 81,557,731 | | | |
| | | Shares Outstanding $0.001 par value (unlimited number of shares authorized): | | | | | | |
| | | Class A | | | 645,878 | | | |
| | | Class C | | | 20,500 | | | |
| | | Institutional | | | 1,844,564 | | | |
| | | Investor | | | 366,975 | | | |
| | | Class R6 | | | 1,028 | | | |
| | | Class P | | | 4,864,516 | | | |
| | | Net asset value, offering and redemption price per share:(c) | | | | | | |
| | | Class A | | | $10.37 | | | |
| | | Class C | | | 10.03 | | | |
| | | Institutional | | | 10.55 | | | |
| | | Investor | | | 10.49 | | | |
| | | Class R6 | | | 10.58 | | | |
| | | Class P | | | 10.55 | | | |
| | (a) | Statement of Assets and Liabilities for the Fund is consolidated and includes the balances of the wholly-owned subsidiary, Cayman Commodity-MMA IV, LLC. Accordingly, all interfund balances and transactions have been eliminated. |
| | (b) | Includes segregated cash of $4,313,780 and $2,260,000 relating to initial margin requirements and/or collateral on futures and forward foreign currency, respectively. |
| | (c) | Maximum public offering price per share for Class A Shares is $10.97. At redemption, Class C Shares may be subject to a contingent deferred sales charge, assessed on the amount equal to the lesser of the current net asset value (“NAV”) or the original purchase price of the shares. |
| | |
| The accompanying notes are an integral part of these financial statements. | | 9 |
GOLDMAN SACHS MULTI-STRATEGY ALTERNATIVES FUND
|
Consolidated Statement of Operations(a) For the Six Months Ended April 30, 2024 (Unaudited) |
| | | | | | | | |
| | | |
| | | Investment Income: | | | | | | |
| | | |
| | Dividends — affiliated issuers | | $ | 2,239,520 | | | |
| | Interest | | | 119,945 | | | |
| | Dividends — unaffiliated issuers | | | 740 | | | |
| | |
| | | |
| | Total investment income | | | 2,360,205 | | | |
| | |
| | | | | | | | |
| | | |
| | Expenses: | | | | | | |
| | | |
| | Management fees | | | 397,739 | | | |
| | Custody, accounting and administrative services | | | 388,677 | | | |
| | Professional fees | | | 157,310 | | | |
| | Registration fees | | | 58,338 | | | |
| | Transfer Agency fees(b) | | | 22,665 | | | |
| | Printing and mailing costs | | | 20,419 | | | |
| | Trustee fees | | | 17,332 | | | |
| | Distribution and Service (12b-1) fees(b) | | | 10,556 | | | |
| | Shareholder meeting expense | | | 1,478 | | | |
| | Service fees — Class C | | | 467 | | | |
| | Other | | | 13,566 | | | |
| | |
| | | |
| | Total expenses | | | 1,088,547 | | | |
| | |
| | | |
| | Less — expense reductions | | | (725,885 | ) | | |
| | |
| | | |
| | Net expenses | | | 362,662 | | | |
| | |
| | | |
| | NET INVESTMENT INCOME | | | 1,997,543 | | | |
| | |
| | | | | | | | |
| | | |
| | Realized and unrealized gain (loss): | | | | | | |
| | | |
| | Net realized gain (loss) from: | | | | | | |
| | Investments — unaffiliated issuers (including commission recapture of $ 535) | | | 80,342 | | | |
| | Futures contracts | | | (7,707,852 | ) | | |
| | Written options | | | 2,345 | | | |
| | Forward foreign currency exchange contracts | | | 2,168,947 | | | |
| | Foreign currency transactions | | | (18,336 | ) | | |
| | Net change in unrealized gain (loss) on: | | | | | | |
| | Futures contracts | | | 3,376,360 | | | |
| | Forward foreign currency exchange contracts | | | (2,355,824 | ) | | |
| | Foreign currency translation | | | (65,203 | ) | | |
| | |
| | | |
| | Net realized and unrealized loss | | | (4,519,221 | ) | | |
| | |
| | | |
| | NET DECREASE IN NET ASSETS RESULTING FROM OPERATIONS | | $ | (2,521,678 | ) | | |
| | |
| | (a) | Statement of Operations for the Fund is consolidated and includes the balances of the wholly-owned subsidiary, Cayman Commodity-MMA IV, LLC. Accordingly, all interfund balances and transactions have been eliminated. |
| | (b) | Class specific Distribution and/or Service (12b-1) and Transfer Agency fees were as follows: |
| | | | | | | | | | | | | | | | | | | | | | | | | | | | | | | | | | | | | | | | |
| | | Distribution and/or Service (12b-1) Fees | | | | Transfer Agency Fees | | | | |
| | | | | | | | | | | | | | | | | | | | |
| | | Class A | | Class C | | | | Class R | | | | Class A | | | | Class C | | | | Institutional | | | | Investor | | | | Class R6 | | | | Class R | | | | Class P | | | | |
| | | | | | | | | | | | | | | | | | | | |
| | $9,083 | | $1,402 | | | | $71 | | | | $5,450 | | | | $281 | | | | $4,817 | | | | $3,226 | | | | $2 | | | | $21 | | | | $8,868 | | | | |
| | |
| 10 | | The accompanying notes are an integral part of these financial statements. |
GOLDMAN SACHS MULTI-STRATEGY ALTERNATIVES FUND
|
Consolidated Statements of Changes in Net Assets(a) |
| | | | | | | | | | | | |
| | | | | Multi-Strategy Alternatives Fund | | | |
| | | | |
| | | | | For the Six Months Ended April 30, 2024 (Unaudited) | | | For the Fiscal Year Ended October 31, 2023 | | | |
| | | | |
| | | From operations: | | | | | | | | | | |
| | | | |
| | Net investment income | | | $ 1,997,543 | | | | $ 1,659,237 | | | |
| | | | |
| | Net realized gain (loss) | | | (5,474,554 | ) | | | 967,616 | | | |
| | | | |
| | Net change in unrealized gain (loss) | | | 955,333 | | | | (3,952,838 | ) | | |
| | |
| | | | |
| | Net decrease in net assets resulting from operations | | | (2,521,678 | ) | | | (1,325,985 | ) | | |
| | |
| | | | | | | | | | | | |
| | | | |
| | Distributions to shareholders: | | | | | | | | | | |
| | | | |
| | From distributable earnings: | | | | | | | | | | |
| | | | |
| | Class A Shares | | | (235,940 | ) | | | (19,132 | ) | | |
| | | | |
| | Class C Shares | | | (1,187 | ) | | | — | | | |
| | | | |
| | Institutional Shares | | | (883,239 | ) | | | (170,765 | ) | | |
| | | | |
| | Investor Shares | | | (151,781 | ) | | | (25,221 | ) | | |
| | | | |
| | Class R6 Shares | | | (387 | ) | | | (185 | ) | | |
| | | | |
| | Class R Shares(b) | | | (875 | ) | | | — | | | |
| | | | |
| | Class P Shares | | | (2,093,131 | ) | | | (484,761 | ) | | |
| | |
| | | | |
| | Total distributions to shareholders | | | (3,366,540 | ) | | | (700,064 | ) | | |
| | |
| | | | | | | | | | | | |
| | | | |
| | From share transactions: | | | | | | | | | | |
| | | | |
| | Proceeds from sales of shares | | | 1,980,468 | | | | 7,328,573 | | | |
| | | | |
| | Reinvestment of distributions | | | 3,304,757 | | | | 692,421 | | | |
| | | | |
| | Cost of shares redeemed | | | (18,411,099 | ) | | | (56,413,500 | ) | | |
| | |
| | | | |
| | Net decrease in net assets resulting from share transactions | | | (13,125,874 | ) | | | (48,392,506 | ) | | |
| | |
| | | | |
| | TOTAL DECREASE | | | (19,014,092 | ) | | | (50,418,555 | ) | | |
| | |
| | | | | | | | | | | | |
| | | | |
| | Net assets: | | | | | | | | | | |
| | | | |
| | Beginning of period | | | 100,571,823 | | | | 150,990,378 | | | |
| | |
| | | | |
| | End of period | | | $ 81,557,731 | | | | $100,571,823 | | | |
| | |
| | (a) | Statements of Changes in Net Assets for the Fund is consolidated and includes the balances of the wholly-owned subsidiary, Cayman Commodity — MMA IV, LLC. Accordingly, all interfund balances and transactions have been eliminated. |
| | (b) | At the close of business on April 16, 2024, Class R Shares of the Fund were liquidated. |
| | |
| The accompanying notes are an integral part of these financial statements. | | 11 |
GOLDMAN SACHS MULTI-STRATEGY ALTERNATIVES FUND
|
Consolidated Financial Highlights Selected Share Data for a Share Outstanding Throughout Each Period |
| | | | | | | | | | | | | | | | | | | | | | | | | | | | | | | | | | |
| | | | | Multi-Strategy Alternatives Fund |
| | |
| | | | | Class A Shares |
| | | | | Six Months Ended | | Year Ended October 31, |
| | | | | April 30, 2024 (Unaudited) | | 2023 | | 2022 | | 2021 | | 2020 | | 2019 | | |
| | | | | | | | |
| | | Per Share Data | | | | | | | | | | | | | | | | | | | | | | | | | | | | | | | | |
| | | | | | | | |
| | Net asset value, beginning of period | | | $ | 11.06 | | | | $ | 11.22 | | | | $ | 11.86 | | | | $ | 10.66 | | | | $ | 10.48 | | | | $ | 9.91 | | | |
| | |
| | | | | | | | |
| | Net investment income (loss)(a) | | | | 0.21 | | | | | 0.11 | | | | | (0.14 | ) | | | | (0.07 | ) | | | | (0.01 | ) | | | | 0.04 | | | |
| | | | | | | | |
| | Net realized and unrealized gain (loss) | | | | (0.54 | ) | | | | (0.25 | ) | | | | (0.50 | ) | | | | 1.27 | | | | | 0.25 | | | | | 0.53 | | | |
| | |
| | | | | | | | |
| | Total from investment operations | | | | (0.33 | ) | | | | (0.14 | ) | | | | (0.64 | ) | | | | 1.20 | | | | | 0.24 | | | | | 0.57 | | | |
| | |
| | | | | | | | |
| | Distributions to shareholders from net investment income | | | | (0.36 | ) | | | | (0.02 | ) | | | | — | | | | | — | | | | | (0.06 | ) | | | | — | | | |
| | |
| | | | | | | | |
| | Net asset value, end of period | | | $ | 10.37 | | | | $ | 11.06 | | | | $ | 11.22 | | | | $ | 11.86 | | | | $ | 10.66 | | | | $ | 10.48 | | | |
| | |
| | | | | | | | |
| | Total return(b) | | | | (3.17 | )% | | | | (1.30 | )% | | | | (5.31 | )% | | | | 11.26 | % | | | | 2.33 | % | | | | 5.75 | % | | |
| | |
| | | | | | | | |
| | Net assets, end of period (in 000s) | | | $ | 6,697 | | | | $ | 7,876 | | | | $ | 8,666 | | | | $ | 7,943 | | | | $ | 8,015 | | | | $ | 11,538 | | | |
| | | | | | | | |
| | Ratio of net expenses to average net assets (including dividend and interest payments and other expenses relating to securities sold short) | | | | 1.04 | %(c) | | | | 2.02 | % | | | | 2.18 | % | | | | 2.15 | % | | | | 2.13 | % | | | | 2.12 | % | | |
| | | | | | | | |
| | Ratio of net expenses to average net assets (excluding dividend and interest payments and other expenses relating to securities sold short) | | | | 1.04 | %(c) | | | | 1.95 | % | | | | 2.08 | % | | | | 2.08 | % | | | | 2.07 | % | | | | 2.07 | % | | |
| | | | | | | | |
| | Ratio of total expenses to average net assets (including dividend and interest payments and other expenses relating to securities sold short) | | | | 2.53 | %(c) | | | | 3.53 | % | | | | 3.38 | % | | | | 3.36 | % | | | | 4.32 | % | | | | 3.51 | % | | |
| | | | | | | | |
| | Ratio of total expenses to average net assets (excluding dividend and interest payments and other expenses relating to securities sold short) | | | | 2.53 | %(c) | | | | 3.46 | % | | | | 3.29 | % | | | | 3.30 | % | | | | 4.27 | % | | | | 3.46 | % | | |
| | | | | | | | |
| | Ratio of net investment income (loss) to average net assets | | | | 3.92 | %(c) | | | | 1.00 | % | | | | (1.21 | )% | | | | (0.63 | )% | | | | (0.17 | )% | | | | 0.39 | % | | |
| | | | | | | | |
| | Portfolio turnover rate(d) | | | | — | %(e) | | | | 242 | % | | | | 236 | % | | | | 269 | % | | | | 222 | % | | | | 202 | % | | |
| | |
| | (a) | Calculated based on the average shares outstanding methodology. |
| | (b) | Assumes investment at the NAV at the beginning of the period, reinvestment of all dividends and distributions, a complete redemption of the investment at the NAV at the end of the period and no sales or redemption charges (if any). Total returns would be reduced if a sales or redemption charge was taken into account. Returns do not reflect the impact of taxes to shareholders relating to Fund distributions or the redemption of Fund shares. Total returns for periods less than one full year are not annualized. |
| | (d) | The Fund’s portfolio turnover rate is calculated in accordance with regulatory requirements, without regard to transactions involving short term investments and certain derivatives. If such transactions were included, the Fund’s portfolio turnover rate may be higher. |
| | (e) | There were no long-term transactions for the period ended April 30, 2024. |
| | |
| 12 | | The accompanying notes are an integral part of these financial statements. |
GOLDMAN SACHS MULTI-STRATEGY ALTERNATIVES FUND
|
Consolidated Financial Highlights (continued) Selected Share Data for a Share Outstanding Throughout Each Period |
| | | | | | | | | | | | | | | | | | | | | | | | | | | | | | | | | | |
| | | | | Multi-Strategy Alternatives Fund |
| | |
| | | | | Class C Shares |
| | | | | Six Months Ended | | Year Ended October 31, |
| | | | | April 30, 2024 (Unaudited) | | 2023 | | 2022 | | 2021 | | 2020 | | 2019 | | |
| | | | | | | | |
| | | Per Share Data | | | | | | | | | | | | | | | | | | | | | | | | | | | | | | | | |
| | | | | | | | |
| | Net asset value, beginning of period | | | $ | 10.44 | | | | $ | 10.64 | | | | $ | 11.34 | | | | $ | 10.26 | | | | $ | 10.11 | | | | $ | 9.62 | | | |
| | |
| | | | | | | | |
| | Net investment income (loss)(a) | | | | 0.17 | | | | | 0.00 | | | | | (0.24 | ) | | | | (0.15 | ) | | | | (0.09 | ) | | | | (0.03 | ) | | |
| | | | | | | | |
| | Net realized and unrealized gain (loss) | | | | (0.55 | ) | | | | (0.20 | ) | | | | (0.46 | ) | | | | 1.23 | | | | | 0.24 | | | | | 0.52 | | | |
| | |
| | | | | | | | |
| | Total from investment operations | | | | (0.38 | ) | | | | (0.20 | ) | | | | (0.70 | ) | | | | 1.08 | | | | | 0.15 | | | | | 0.49 | | | |
| | |
| | | | | | | | |
| | Distributions to shareholders from net investment income | | | | (0.03 | ) | | | | — | | | | | — | | | | | — | | | | | — | | | | | — | | | |
| | |
| | | | | | | | |
| | Net asset value, end of period | | | $ | 10.03 | | | | $ | 10.44 | | | | $ | 10.64 | | | | $ | 11.34 | | | | $ | 10.26 | | | | $ | 10.11 | | | |
| | |
| | | | | | | | |
| | Total return(b) | | | | (3.54 | )% | | | | (1.97 | )% | | | | (6.08 | )% | | | | 10.53 | % | | | | 1.48 | % | | | | 4.98 | % | | |
| | |
| | | | | | | | |
| | Net assets, end of period (in 000s) | | | $ | 206 | | | | $ | 542 | | | | $ | 1,810 | | | | $ | 3,544 | | | | $ | 5,045 | | | | $ | 7,646 | | | |
| | | | | | | | |
| | Ratio of net expenses to average net assets (including dividend and interest payments and other expenses relating to securities sold short) | | | | 1.77 | %(c) | | | | 2.85 | % | | | | 2.93 | % | | | | 2.89 | % | | | | 2.88 | % | | | | 2.87 | % | | |
| | | | | | | | |
| | Ratio of net expenses to average net assets (excluding dividend and interest payments and other expenses relating to securities sold short) | | | | 1.77 | %(c) | | | | 2.76 | % | | | | 2.83 | % | | | | 2.84 | % | | | | 2.82 | % | | | | 2.82 | % | | |
| | | | | | | | |
| | Ratio of total expenses to average net assets (including dividend and interest payments and other expenses relating to securities sold short) | | | | 3.15 | %(c) | | | | 4.36 | % | | | | 4.11 | % | | | | 4.15 | % | | | | 5.09 | % | | | | 4.27 | % | | |
| | | | | | | | |
| | Ratio of total expenses to average net assets (excluding dividend and interest payments and other expenses relating to securities sold short) | | | | 3.15 | %(c) | | | | 4.27 | % | | | | 4.01 | % | | | | 4.09 | % | | | | 5.03 | % | | | | 4.21 | % | | |
| | | | | | | | |
| | Ratio of net investment income (loss) to average net assets | | | | 3.23 | %(c) | | | | 0.03 | % | | | | (2.16 | )% | | | | (1.39 | )% | | | | (0.92 | )% | | | | (0.36 | )% | | |
| | | | | | | | |
| | Portfolio turnover rate(d) | | | | — | %(e) | | | | 242 | % | | | | 236 | % | | | | 269 | % | | | | 222 | % | | | | 202 | % | | |
| | |
| | (a) | Calculated based on the average shares outstanding methodology. |
| | (b) | Assumes investment at the NAV at the beginning of the period, reinvestment of all dividends and distributions, a complete redemption of the investment at the NAV at the end of the period and no sales or redemption charges (if any). Total returns would be reduced if a sales or redemption charge was taken into account. Returns do not reflect the impact of taxes to shareholders relating to Fund distributions or the redemption of Fund shares. Total returns for periods less than one full year are not annualized. |
| | (d) | The Fund’s portfolio turnover rate is calculated in accordance with regulatory requirements, without regard to transactions involving short term investments and certain derivatives. If such transactions were included, the Fund’s portfolio turnover rate may be higher. |
| | (e) | There were no long-term transactions for the period ended April 30, 2024. |
| | |
| The accompanying notes are an integral part of these financial statements. | | 13 |
GOLDMAN SACHS MULTI-STRATEGY ALTERNATIVES FUND
|
Consolidated Financial Highlights (continued) Selected Share Data for a Share Outstanding Throughout Each Period |
| | | | | | | | | | | | | | | | | | | | | | | | | | | | | | | | | | |
| | | | | Multi-Strategy Alternatives Fund |
| | |
| | | | | Institutional Shares |
| | | | | Six Months Ended | | Year Ended October 31, |
| | | | | April 30, 2024 (Unaudited) | | 2023 | | 2022 | | 2021 | | 2020 | | 2019 | | |
| | | | | | | | |
| | | Per Share Data | | | | | | | | | | | | | | | | | | | | | | | | | | | | | | | | |
| | | | | | | | |
| | Net asset value, beginning of period | | | $ | 11.27 | | | | $ | 11.42 | | | | $ | 12.04 | | | | $ | 10.78 | | | | $ | 10.62 | | | | $ | 10.00 | | | |
| | |
| | | | | | | | |
| | Net investment income (loss)(a) | | | | 0.23 | | | | | 0.14 | | | | | (0.11 | ) | | | | (0.03 | ) | | | | 0.01 | | | | | 0.07 | | | |
| | | | | | | | |
| | Net realized and unrealized gain (loss) | | | | (0.56 | ) | | | | (0.23 | ) | | | | (0.51 | ) | | | | 1.29 | | | | | 0.26 | | | | | 0.55 | | | |
| | |
| | | | | | | | |
| | Total from investment operations | | | | (0.33 | ) | | | | (0.09 | ) | | | | (0.62 | ) | | | | 1.26 | | | | | 0.27 | | | | | 0.62 | | | |
| | |
| | | | | | | | |
| | Distributions to shareholders from net investment income | | | | (0.39 | ) | | | | (0.06 | ) | | | | — | | | | | — | | | | | (0.11 | ) | | | | — | | | |
| | |
| | | | | | | | |
| | Net asset value, end of period | | | $ | 10.55 | | | | $ | 11.27 | | | | $ | 11.42 | | | | $ | 12.04 | | | | $ | 10.78 | | | | $ | 10.62 | | | |
| | |
| | | | | | | | |
| | Total return(b) | | | | (3.06 | )% | | | | (0.92 | )% | | | | (5.07 | )% | | | | 11.58 | % | | | | 2.66 | % | | | | 6.20 | % | | |
| | |
| | | | | | | | |
| | Net assets, end of period (in 000s) | | | $ | 19,464 | | | | $ | 26,614 | | | | $ | 35,165 | | | | $ | 54,438 | | | | $ | 67,354 | | | | $ | 158,958 | | | |
| | | | | | | | |
| | Ratio of net expenses to average net assets (including dividend and interest payments and other expenses relating to securities sold short) | | | | 0.73 | %(c) | | | | 1.73 | % | | | | 1.86 | % | | | | 1.82 | % | | | | 1.81 | % | | | | 1.80 | % | | |
| | | | | | | | |
| | Ratio of net expenses to average net assets (excluding dividend and interest payments and other expenses relating to securities sold short) | | | | 0.73 | %(c) | | | | 1.66 | % | | | | 1.76 | % | | | | 1.76 | % | | | | 1.75 | % | | | | 1.74 | % | | |
| | | | | | | | |
| | Ratio of total expenses to average net assets (including dividend and interest payments and other expenses relating to securities sold short) | | | | 2.15 | %(c) | | | | 3.18 | % | | | | 3.00 | % | | | | 3.00 | % | | | | 3.94 | % | | | | 3.03 | % | | |
| | | | | | | | |
| | Ratio of total expenses to average net assets (excluding dividend and interest payments and other expenses relating to securities sold short) | | | | 2.15 | %(c) | | | | 3.10 | % | | | | 2.90 | % | | | | 2.94 | % | | | | 3.88 | % | | | | 2.98 | % | | |
| | | | | | | | |
| | Ratio of net investment income (loss) to average net assets | | | | 4.23 | %(c) | | | | 1.26 | % | | | | (0.98 | )% | | | | (0.28 | )% | | | | 0.14 | % | | | | 0.71 | % | | |
| | | | | | | | |
| | Portfolio turnover rate(d) | | | | — | %(e) | | | | 242 | % | | | | 236 | % | | | | 269 | % | | | | 222 | % | | | | 202 | % | | |
| | |
| | (a) | Calculated based on the average shares outstanding methodology. |
| | (b) | Assumes investment at the NAV at the beginning of the period, reinvestment of all dividends and distributions, a complete redemption of the investment at the NAV at the end of the period and no sales or redemption charges (if any). Total returns would be reduced if a sales or redemption charge was taken into account. Returns do not reflect the impact of taxes to shareholders relating to Fund distributions or the redemption of Fund shares. Total returns for periods less than one full year are not annualized. |
| | (d) | The Fund’s portfolio turnover rate is calculated in accordance with regulatory requirements, without regard to transactions involving short term investments and certain derivatives. If such transactions were included, the Fund’s portfolio turnover rate may be higher. |
| | (e) | There were no long-term transactions for the period ended April 30, 2024. |
| | |
| 14 | | The accompanying notes are an integral part of these financial statements. |
GOLDMAN SACHS MULTI-STRATEGY ALTERNATIVES FUND
|
Consolidated Financial Highlights (continued) Selected Share Data for a Share Outstanding Throughout Each Period |
| | | | | | | | | | | | | | | | | | | | | | | | | | | | | | | | | | |
| | | | | Multi-Strategy Alternatives Fund |
| | |
| | | | | Investor Shares |
| | | | | Six Months Ended | | Year Ended October 31, |
| | | | | April 30, 2024 (Unaudited) | | 2023 | | 2022 | | 2021 | | 2020 | | 2019 | | |
| | | | | | | | |
| | | Per Share Data | | | | | | | | | | | | | | | | | | | | | | | | | | | | | | | | |
| | | | | | | | |
| | Net asset value, beginning of period | | | $ | 11.20 | | | | $ | 11.35 | | | | $ | 11.97 | | | | $ | 10.73 | | | | $ | 10.56 | | | | $ | 9.95 | | | |
| | |
| | | | | | | | |
| | Net investment income (loss)(a) | | | | 0.23 | | | | | 0.14 | | | | | (0.12 | ) | | | | (0.04 | ) | | | | 0.01 | | | | | 0.07 | | | |
| | | | | | | | |
| | Net realized and unrealized gain (loss) | | | | (0.56 | ) | | | | (0.24 | ) | | | | (0.50 | ) | | | | 1.28 | | | | | 0.26 | | | | | 0.54 | | | |
| | |
| | | | | | | | |
| | Total from investment operations | | | | (0.33 | ) | | | | (0.10 | ) | | | | (0.62 | ) | | | | 1.24 | | | | | 0.27 | | | | | 0.61 | | | |
| | |
| | | | | | | | |
| | Distributions to shareholders from net investment income | | | | (0.38 | ) | | | | (0.05 | ) | | | | — | | | | | — | | | | | (0.10 | ) | | | | — | | | |
| | |
| | | | | | | | |
| | Net asset value, end of period | | | $ | 10.49 | | | | $ | 11.20 | | | | $ | 11.35 | | | | $ | 11.97 | | | | $ | 10.73 | | | | $ | 10.56 | | | |
| | |
| | | | | | | | |
| | Total return(b) | | | | (3.06 | )% | | | | (1.00 | )% | | | | (5.10 | )% | | | | 11.56 | % | | | | 2.59 | % | | | | 6.02 | % | | |
| | |
| | | | | | | | |
| | Net assets, end of period (in 000s) | | | $ | 3,849 | | | | $ | 4,537 | | | | $ | 5,853 | | | | $ | 7,478 | | | | $ | 10,061 | | | | $ | 12,457 | | | |
| | | | | | | | |
| | Ratio of net expenses to average net assets (including dividend and interest payments and other expenses relating to securities sold short) | | | | 0.79 | %(c) | | | | 1.79 | % | | | | 1.93 | % | | | | 1.89 | % | | | | 1.88 | % | | | | 1.87 | % | | |
| | | | | | | | |
| | Ratio of net expenses to average net assets (excluding dividend and interest payments and other expenses relating to securities sold short) | | | | 0.79 | %(c) | | | | 1.72 | % | | | | 1.83 | % | | | | 1.83 | % | | | | 1.82 | % | | | | 1.82 | % | | |
| | | | | | | | |
| | Ratio of total expenses to average net assets (including dividend and interest payments and other expenses relating to securities sold short) | | | | 2.28 | %(c) | | | | 3.30 | % | | | | 3.12 | % | | | | 3.10 | % | | | | 4.07 | % | | | | 3.23 | % | | |
| | | | | | | | |
| | Ratio of total expenses to average net assets (excluding dividend and interest payments and other expenses relating to securities sold short) | | | | 2.28 | %(c) | | | | 3.22 | % | | | | 3.02 | % | | | | 3.04 | % | | | | 4.02 | % | | | | 3.18 | % | | |
| | | | | | | | |
| | Ratio of net investment income (loss) to average net assets | | | | 4.17 | %(c) | | | | 1.22 | % | | | | (1.07 | )% | | | | (0.38 | )% | | | | 0.07 | % | | | | 0.63 | % | | |
| | | | | | | | |
| | Portfolio turnover rate(d) | | | | — | %(e) | | | | 242 | % | | | | 236 | % | | | | 269 | % | | | | 222 | % | | | | 202 | % | | |
| | |
| | (a) | Calculated based on the average shares outstanding methodology. |
| | (b) | Assumes investment at the NAV at the beginning of the period, reinvestment of all dividends and distributions, a complete redemption of the investment at the NAV at the end of the period and no sales or redemption charges (if any). Total returns would be reduced if a sales or redemption charge was taken into account. Returns do not reflect the impact of taxes to shareholders relating to Fund distributions or the redemption of Fund shares. Total returns for periods less than one full year are not annualized. |
| | (d) | The Fund’s portfolio turnover rate is calculated in accordance with regulatory requirements, without regard to transactions involving short term investments and certain derivatives. If such transactions were included, the Fund’s portfolio turnover rate may be higher. |
| | (e) | There were no long-term transactions for the period ended April 30, 2024. |
| | |
| The accompanying notes are an integral part of these financial statements. | | 15 |
GOLDMAN SACHS MULTI-STRATEGY ALTERNATIVES FUND
|
Consolidated Financial Highlights (continued) Selected Share Data for a Share Outstanding Throughout Each Period |
| | | | | | | | | | | | | | | | | | | | | | | | | | | | | | | | | | |
| | | | | Multi-Strategy Alternatives Fund |
| | |
| | | | | Class R6 Shares |
| | | | | Six Months Ended | | Year Ended October 31, |
| | | | | April 30, 2024 (Unaudited) | | 2023 | | 2022 | | 2021 | | 2020 | | 2019 | | |
| | | | | | | | |
| | | Per Share Data | | | | | | | | | | | | | | | | | | | | | | | | | | | | | | | | |
| | | | | | | | |
| | Net asset value, beginning of period | | | $ | 11.29 | | | | $ | 11.44 | | | | $ | 12.05 | | | | $ | 10.79 | | | | $ | 10.63 | | | | $ | 10.01 | | | |
| | |
| | | | | | | | |
| | Net investment income (loss)(a) | | | | 0.23 | | | | | 0.13 | | | | | (0.10 | ) | | | | (0.04 | ) | | | | 0.02 | | | | | 0.08 | | | |
| | | | | | | | |
| | Net realized and unrealized gain (loss) | | | | (0.55 | ) | | | | (0.22 | ) | | | | (0.51 | ) | | | | 1.30 | | | | | 0.25 | | | | | 0.54 | | | |
| | |
| | | | | | | | |
| | Total from investment operations | | | | (0.32 | ) | | | | (0.09 | ) | | | | (0.61 | ) | | | | 1.26 | | | | | 0.27 | | | | | 0.62 | | | |
| | |
| | | | | | | | |
| | Distributions to shareholders from net investment income | | | | (0.39 | ) | | | | (0.06 | ) | | | | — | | | | | — | | | | | (0.11 | ) | | | | — | | | |
| | |
| | | | | | | | |
| | Net asset value, end of period | | | $ | 10.58 | | | | $ | 11.29 | | | | $ | 11.44 | | | | $ | 12.05 | | | | $ | 10.79 | | | | $ | 10.63 | | | |
| | |
| | | | | | | | |
| | Total return(b) | | | | (3.00 | )% | | | | (0.81 | )% | | | | (5.06 | )% | | | | 11.68 | % | | | | 2.60 | % | | | | 6.19 | % | | |
| | |
| | | | | | | | |
| | Net assets, end of period (in 000s) | | | $ | 11 | | | | $ | 11 | | | | $ | 37 | | | | $ | 12 | | | | $ | 11 | | | | $ | 10 | | | |
| | | | | | | | |
| | Ratio of net expenses to average net assets (including dividend and interest payments and other expenses relating to securities sold short) | | | | 0.72 | %(c) | | | | 1.80 | % | | | | 1.87 | % | | | | 1.83 | % | | | | 1.81 | % | | | | 1.79 | % | | |
| | | | | | | | |
| | Ratio of net expenses to average net assets (excluding dividend and interest payments and other expenses relating to securities sold short) | | | | 0.72 | %(c) | | | | 1.70 | % | | | | 1.77 | % | | | | 1.76 | % | | | | 1.76 | % | | | | 1.74 | % | | |
| | | | | | | | |
| | Ratio of total expenses to average net assets (including dividend and interest payments and other expenses relating to securities sold short) | | | | 2.17 | %(c) | | | | 3.24 | % | | | | 3.01 | % | | | | 2.96 | % | | | | 3.93 | % | | | | 3.23 | % | | |
| | | | | | | | |
| | Ratio of total expenses to average net assets (excluding dividend and interest payments and other expenses relating to securities sold short) | | | | 2.17 | %(c) | | | | 3.14 | % | | | | 2.91 | % | | | | 2.89 | % | | | | 3.88 | % | | | | 3.18 | % | | |
| | | | | | | | |
| | Ratio of net investment income (loss) to average net assets | | | | 4.22 | %(c) | | | | 1.12 | % | | | | (0.91 | )% | | | | (0.30 | )% | | | | 0.12 | % | | | | 0.75 | % | | |
| | | | | | | | |
| | Portfolio turnover rate(d) | | | | — | %(e) | | | | 242 | % | | | | 236 | % | | | | 269 | % | | | | 222 | % | | | | 202 | % | | |
| | |
| | (a) | Calculated based on the average shares outstanding methodology. |
| | (b) | Assumes investment at the NAV at the beginning of the period, reinvestment of all dividends and distributions, a complete redemption of the investment at the NAV at the end of the period and no sales or redemption charges (if any). Total returns would be reduced if a sales or redemption charge was taken into account. Returns do not reflect the impact of taxes to shareholders relating to Fund distributions or the redemption of Fund shares. Total returns for periods less than one full year are not annualized. |
| | (d) | The Fund’s portfolio turnover rate is calculated in accordance with regulatory requirements, without regard to transactions involving short term investments and certain derivatives. If such transactions were included, the Fund’s portfolio turnover rate may be higher. |
| | (e) | There were no long-term transactions for the period ended April 30, 2024. |
| | |
| 16 | | The accompanying notes are an integral part of these financial statements. |
GOLDMAN SACHS MULTI-STRATEGY ALTERNATIVES FUND
|
Consolidated Financial Highlights (continued) Selected Share Data for a Share Outstanding Throughout Each Period |
| | | | | | | | | | | | | | | | | | | | | | | | | | | | | | | | | | |
| | | | | Multi-Strategy Alternatives Fund |
| | |
| | | | | Class P Shares |
| | | | | Six Months Ended | | Year Ended October 31, |
| | | | | April 30, 2024 (Unaudited) | | 2023 | | 2022 | | 2021 | | 2020 | | 2019 | | |
| | | | | | | | |
| | | Per Share Data | | | | | | | | | | | | | | | | | | | | | | | | | | | | | | | | |
| | | | | | | | |
| | Net asset value, beginning of period | | | $ | 11.27 | | | | $ | 11.42 | | | | $ | 12.04 | | | | $ | 10.78 | | | | $ | 10.62 | | | | $ | 10.00 | | | |
| | |
| | | | | | | | |
| | Net investment income (loss)(a) | | | | 0.23 | | | | | 0.14 | | | | | (0.11 | ) | | | | (0.03 | ) | | | | 0.02 | | | | | 0.08 | | | |
| | | | | | | | |
| | Net realized and unrealized gain (loss) | | | | (0.56 | ) | | | | (0.23 | ) | | | | (0.51 | ) | | | | 1.29 | | | | | 0.25 | | | | | 0.54 | | | |
| | |
| | | | | | | | |
| | Total from investment operations | | | | (0.33 | ) | | | | (0.09 | ) | | | | (0.62 | ) | | | | 1.26 | | | | | 0.27 | | | | | 0.62 | | | |
| | |
| | | | | | | | |
| | Distributions to shareholders from net investment income | | | | (0.39 | ) | | | | (0.06 | ) | | | | — | | | | | — | | | | | (0.11 | ) | | | | — | | | |
| | |
| | | | | | | | |
| | Net asset value, end of period | | | $ | 10.55 | | | | $ | 11.27 | | | | $ | 11.42 | | | | $ | 12.04 | | | | $ | 10.78 | | | | $ | 10.62 | | | |
| | |
| | | | | | | | |
| | Total return(b) | | | | (3.06 | )% | | | | (0.91 | )% | | | | (5.07 | )% | | | | 11.69 | % | | | | 2.60 | % | | | | 6.20 | % | | |
| | |
| | | | | | | | |
| | Net assets, end of period (in 000s) | | | $ | 51,330 | | | | $ | 60,963 | | | | $ | 99,431 | | | | $ | 103,080 | | | | $ | 59,182 | | | | $ | 73,641 | | | |
| | | | | | | | |
| | Ratio of net expenses to average net assets (including dividend and interest payments and other expenses relating to securities sold short) | | | | 0.73 | %(c) | | | | 1.75 | % | | | | 1.85 | % | | | | 1.81 | % | | | | 1.80 | % | | | | 1.79 | % | | |
| | | | | | | | |
| | Ratio of net expenses to average net assets (excluding dividend and interest payments and other expenses relating to securities sold short) | | | | 0.73 | %(c) | | | | 1.66 | % | | | | 1.75 | % | | | | 1.76 | % | | | | 1.74 | % | | | | 1.73 | % | | |
| | | | | | | | |
| | Ratio of total expenses to average net assets (including dividend and interest payments and other expenses relating to securities sold short) | | | | 2.17 | %(c) | | | | 3.19 | % | | | | 2.99 | % | | | | 2.91 | % | | | | 3.93 | % | | | | 3.13 | % | | |
| | | | | | | | |
| | Ratio of total expenses to average net assets (excluding dividend and interest payments and other expenses relating to securities sold short) | | | | 2.17 | %(c) | | | | 3.11 | % | | | | 2.89 | % | | | | 2.85 | % | | | | 3.88 | % | | | | 3.08 | % | | |
| | | | | | | | |
| | Ratio of net investment income (loss) to average net assets | | | | 4.23 | %(c) | | | | 1.24 | % | | | | (0.93 | )% | | | | (0.29 | )% | | | | 0.15 | % | | | | 0.73 | % | | |
| | | | | | | | |
| | Portfolio turnover rate(d) | | | | — | %(e) | | | | 242 | % | | | | 236 | % | | | | 269 | % | | | | 222 | % | | | | 202 | % | | |
| | |
| | (a) | Calculated based on the average shares outstanding methodology. |
| | (b) | Assumes investment at the NAV at the beginning of the period, reinvestment of all dividends and distributions, a complete redemption of the investment at the NAV at the end of the period and no sales or redemption charges (if any). Total returns would be reduced if a sales or redemption charge was taken into account. Returns do not reflect the impact of taxes to shareholders relating to Fund distributions or the redemption of Fund shares. Total returns for periods less than one full year are not annualized. |
| | (d) | The Fund’s portfolio turnover rate is calculated in accordance with regulatory requirements, without regard to transactions involving short term investments and certain derivatives. If such transactions were included, the Fund’s portfolio turnover rate may be higher. |
| | (e) | There were no long-term transactions for the period ended April 30, 2024. |
| | |
| The accompanying notes are an integral part of these financial statements. | | 17 |
GOLDMAN SACHS MULTI-STRATEGY ALTERNATIVES FUND
|
Consolidated Notes to Financial Statements April 30, 2024 (Unaudited) |
Goldman Sachs Trust II (the “Trust”) is a Delaware statutory trust registered under the Investment Company Act of 1940, as amended (the “Act”), as an open-end management investment company. The Trust includes the Goldman Sachs Multi-Strategy Alternatives Fund (the “Fund”). The Fund is a diversified portfolio and currently offers seven classes of shares: Class A, Class C, Institutional, Investor, Class R6 and Class P Shares.
Class A Shares are sold with a front-end sales charge of up to 5.50%. Class C Shares are sold with a contingent deferred sales charge (“CDSC”) of 1.00%, which is imposed on redemptions made within 12 months of purchase. Institutional, Investor, Class R6, and Class P Shares are not subject to a sales charge.
Goldman Sachs Asset Management, L.P. (“GSAM”), an affiliate of Goldman Sachs & Co. LLC (“Goldman Sachs”), serves as investment adviser to the Fund pursuant to a management agreement (the “Agreement”) with the Trust.
At the close of business on April 16, 2024, Class R Shares of the Fund were liquidated.
|
|
2. SIGNIFICANT ACCOUNTING POLICIES |
The financial statements have been prepared in accordance with accounting principles generally accepted in the United States of America (“GAAP”) and require management to make estimates and assumptions that may affect the reported amounts and disclosures. Actual results may differ from those estimates and assumptions. The Fund is an investment company under GAAP and follows the accounting and reporting guidance applicable to investment companies.
A. Basis of Consolidation for the Goldman Sachs Multi-Strategy Alternatives Fund — The Cayman Commodity — MMA IV, LLC (the “Subsidiary”), a Cayman Islands exempted company, is currently a wholly-owned subsidiary of the Fund. The Subsidiary acts as an investment vehicle for the Fund to enable the Fund to gain exposure to certain types of commodity-linked derivative instruments. The Fund is the sole shareholder of the Subsidiary and it is intended that the Fund will remain the sole shareholder and will continue to control the Subsidiary. All inter-fund balances and transactions have been eliminated in consolidation. As of April 30, 2024, the Fund’s net assets were $81,557,731 of which, $16,203,233 or 19.9%, represented the Subsidiary’s net assets.
B. Investment Valuation — The Fund’s valuation policy is to value investments at fair value.
C. Investment Income and Investments — Investment income includes interest income, dividend income and securities lending income, if any. Interest income is accrued daily and adjusted for amortization of premiums and accretion of discounts. Dividend income is recognized on ex-dividend date or, for certain foreign securities, as soon as such information is obtained subsequent to the ex-dividend date. Non-cash dividends, if any, are recorded at the fair market value of the securities received. Investment transactions are reflected on trade date. Realized gains and losses are calculated using identified cost. Investment transactions are recorded on the following business day for daily net asset value (“NAV”) calculations. Investment income is recorded net of any foreign withholding taxes, less any amounts reclaimable. The Fund may file withholding tax reclaims in certain jurisdictions to recover a portion of amounts previously withheld. Any foreign capital gains tax is accrued daily based upon net unrealized gains, and is payable upon sale of such investments.
For derivative contracts, unrealized gains and losses are recorded daily and become realized gains and losses upon disposition or termination of the contract. Upfront payments, if any, are made or received upon entering into a swap agreement and are reflected in the Consolidated Statement of Assets and Liabilities.
D. Class Allocations and Expenses — Investment income, realized and unrealized gain (loss), if any, and non-class specific expenses of the Fund are allocated daily based upon the proportion of net assets of each class. Non-class specific expenses directly incurred by the Fund are charged to the Fund, while such expenses incurred by the Trust are allocated across the Fund on a straight-line and/or pro-rata basis depending upon the nature of the expenses. Class specific expenses, where applicable, are borne by the respective share classes and include Distribution and Service, Transfer Agency and Service fees.
GOLDMAN SACHS MULTI-STRATEGY ALTERNATIVES FUND
|
|
2. SIGNIFICANT ACCOUNTING POLICIES (continued) |
E. Federal Taxes and Distributions to Shareholders — It is the Fund’s policy to comply with the requirements of the Internal Revenue Code of 1986, as amended (the “Code”), applicable to regulated investment companies and to distribute each year substantially all of its investment company taxable income and capital gains to its shareholders. Accordingly, the Fund is not required to make any provisions for the payment of federal income tax. Distributions to shareholders are recorded on the ex-dividend date. Income and capital gains distributions, if any, are declared and paid annually.
The Subsidiary is classified as a controlled foreign corporation under the Code. Therefore, the Fund is required to increase its taxable income by its share of the Subsidiary’s income. Net losses of the Subsidiary cannot be deducted by the Fund in the current period nor carried forward to offset taxable income in future periods.
Net capital losses, if any, are carried forward to future fiscal years and may be used to the extent allowed by the Code to offset any future capital gains. Losses that are carried forward will retain their character as either short-term or long-term capital losses. Utilization of capital loss carryforwards will reduce the requirement of future capital gains distributions.
The characterization of distributions to shareholders for financial reporting purposes is determined in accordance with federal income tax rules, which may differ from GAAP. The source of the Fund’s distributions may be shown in the accompanying financial statements as either from distributable earnings or capital. Certain components of the Fund’s net assets on the Consolidated Statement of Assets and Liabilities reflect permanent GAAP/tax differences based on the appropriate tax character.
F. Foreign Currency Translation — The accounting records and reporting currency of the Fund are maintained in U.S. dollars. Assets and liabilities denominated in foreign currencies are translated into U.S. dollars using the current exchange rates at the close of each business day. The effect of changes in foreign currency exchange rates on investments is included within net realized and unrealized gain (loss) on investments. Changes in the value of other assets and liabilities as a result of fluctuations in foreign exchange rates are included in the Consolidated Statement of Operations within net change in unrealized gain (loss) on foreign currency translation. Transactions denominated in foreign currencies are translated into U.S. dollars on the date the transaction occurred, the effects of which are included within net realized gain (loss) on foreign currency transactions.
G. Commission Recapture — GSAM, on behalf of certain Funds, may direct portfolio trades, subject to seeking best execution, to various brokers who have agreed to rebate a portion of the commissions generated. Such rebates are made directly to the Fund as cash payments and are included in net realized gain (loss) from investments on the Consolidated Statement of Operations.
|
|
3. INVESTMENTS AND FAIR VALUE MEASUREMENTS |
U.S. GAAP defines the fair value of a financial instrument as the amount that would be received to sell an asset or paid to transfer a liability in an orderly transaction between market participants at the measurement date (i.e., the exit price); the Fund’s policy is to use the market approach. GAAP establishes a fair value hierarchy that prioritizes the inputs to valuation techniques used to measure fair value. The hierarchy gives the highest priority to unadjusted quoted prices in active markets for identical assets or liabilities (Level 1 measurements) and the lowest priority to unobservable inputs (Level 3 measurements). The level in the fair value hierarchy within which the fair value measurement in its entirety falls shall be determined based on the lowest level input that is significant to the fair value measurement in its entirety. The levels used for classifying investments are not necessarily an indication of the risk associated with investing in these investments. The three levels of the fair value hierarchy are described below:
Level 1 — Unadjusted quoted prices in active markets that are accessible at the measurement date for identical, unrestricted assets or liabilities;
Level 2 — Quoted prices in markets that are not active or financial instruments for which significant inputs are observable (including, but not limited to, quoted prices for similar investments, interest rates, foreign exchange rates, volatility and credit spreads), either directly or indirectly;
Level 3 — Prices or valuations that require significant unobservable inputs (including GSAM’s assumptions in determining fair value measurement).
GOLDMAN SACHS MULTI-STRATEGY ALTERNATIVES FUND
|
Consolidated Notes to Financial Statements (continued) April 30, 2024 (Unaudited) |
|
|
3. INVESTMENTS AND FAIR VALUE MEASUREMENTS (continued) |
The Board of Trustees (“Trustees”) has approved Valuation Procedures that govern the valuation of the portfolio investments held by the Fund, including investments for which market quotations are not readily available. With respect to the Fund’s investments that do not have readily available market quotations, the Trustees have designated GSAM as the valuation designee to perform fair valuations pursuant to Rule 2a-5 under the Investment Company Act of 1940 (the “Valuation Designee”). GSAM has day-to-day responsibility for implementing and maintaining internal controls and procedures related to the valuation of the Fund’s investments. To assess the continuing appropriateness of pricing sources and methodologies, GSAM regularly performs price verification procedures and issues challenges as necessary to third party pricing vendors or brokers, and any differences are reviewed in accordance with the Valuation Procedures.
A. Level 1 and Level 2 Fair Value Investments — The valuation techniques and significant inputs used in determining the fair values for investments classified as Level 1 and Level 2 are as follows:
Equity Securities — Equity securities traded on a United States (“U.S.”) securities exchange or the NASDAQ system, or those located on certain foreign exchanges, including but not limited to the Americas, are valued daily at their last sale price or official closing price on the principal exchange or system on which they are traded. If there is no sale or official closing price or such price is believed by GSAM to not represent fair value, equity securities will be valued at the valid closing bid price for long positions and at the valid closing ask price for short positions (i.e., where there is sufficient volume, during normal exchange trading hours). If no valid bid/ask price is available, the equity security will be valued pursuant to the Valuation Procedures and consistent with applicable regulatory guidance. To the extent these investments are actively traded, they are classified as Level 1 of the fair value hierarchy, otherwise they are generally classified as Level 2. Certain equity securities containing unique attributes may be classified as Level 2.
Unlisted equity securities for which market quotations are available are valued at the last sale price on the valuation date, or if no sale occurs, at the last bid price for long positions or the last ask price for short positions, and are generally classified as Level 2. Securities traded on certain foreign securities exchanges are valued daily at fair value determined by an independent fair value service (if available) under the Valuation Procedures and consistent with applicable regulatory guidance. The independent fair value service takes into account multiple factors including, but not limited to, movements in the securities markets, certain depositary receipts, futures contracts and foreign currency exchange rates that have occurred subsequent to the close of the foreign securities exchange. These investments are generally classified as Level 2 of the fair value hierarchy.
Money Market Funds — Investments in the Goldman Sachs Financial Square Government Fund (“Underlying Money Market Fund”) are valued at the NAV per share of the Institutional Share class on the day of valuation. These investments are generally classified as Level 1 of the fair value hierarchy. For information regarding the Underlying Money Market Fund’s accounting policies and investment holdings, please see the Underlying Money Market Fund’s shareholder report.
Derivative Contracts — A derivative is an instrument whose value is derived from underlying assets, indices, reference rates or a combination of these factors. The Fund enters into derivative transactions to hedge against changes in interest rates, securities prices, and/or currency exchange rates, to increase total return, or to gain access to certain markets or attain exposure to other underliers. For financial reporting purposes, cash collateral that has been pledged to cover obligations of the Fund and cash collateral received, if any, is reported separately on the Consolidated Statement of Assets and Liabilities as either due to broker/receivable for collateral on certain derivative contracts. Non-cash collateral pledged by the Fund, if any, is noted in the Consolidated Schedule of Investments.
Exchange-traded derivatives, including futures and options contracts, are generally valued at the last sale or settlement price on the exchange where they are principally traded. Exchange-traded options without settlement prices are generally valued at the midpoint of the bid and ask prices on the exchange where they are principally traded (or, in the absence of two-way trading, at the last bid price for long positions and the last ask price for short positions). Exchange-traded derivatives including future contracts typically fall within Level 1 of the fair value hierarchy. Over-the-counter (“OTC”) and centrally cleared derivatives are valued using market transactions and other market evidence, including market-based inputs to models, calibration to market-clearing transactions, broker or dealer quotations, or other alternative pricing sources. Where models are used, the selection of a particular model to value OTC and centrally cleared derivatives depends upon the contractual terms of, and specific risks inherent in, the
GOLDMAN SACHS MULTI-STRATEGY ALTERNATIVES FUND
|
|
3. INVESTMENTS AND FAIR VALUE MEASUREMENTS (continued) |
instrument, as well as the availability of pricing information in the market. Valuation models require a variety of inputs, including contractual terms, market prices, yield curves, credit curves, measures of volatility, voluntary and involuntary prepayment rates, loss severity rates and correlations of such inputs. For OTC and centrally cleared derivatives that trade in liquid markets, model inputs can generally be verified and model selection does not involve significant management judgment. OTC and centrally cleared derivatives are classified within Level 2 of the fair value hierarchy when significant inputs are corroborated by market evidence.
i. Forward Contracts — A forward contract is a contract between two parties to buy or sell an asset at a specified price on a future date. A forward contract settlement can occur on a cash or delivery basis. Forward contracts are marked-to-market daily using independent vendor prices, and the change in value, if any, is recorded as an unrealized gain or loss. Cash and certain investments may be used to collateralize forward contracts.
A forward foreign currency exchange contract is a forward contract in which the Fund agrees to receive or deliver a fixed quantity of one currency for another, at a pre-determined price at a future date. All forward foreign currency exchange contracts are marked to market daily by using the outright forward rates or interpolating based upon maturity dates, where available. Non-deliverable forward foreign currency exchange contracts are settled with the counterparty in cash without the delivery of foreign currency.
ii. Futures Contracts — Futures contracts are contracts to buy or sell a standardized quantity of a specified commodity or security. Upon entering into a futures contract, a Fund deposits cash or securities in an account on behalf of the broker in an amount sufficient to meet the initial margin requirement. Subsequent payments are made or received by the Fund equal to the daily change in the contract value and are recorded as variation margin receivable or payable with a corresponding offset to unrealized gains or losses.
B. Level 3 Fair Value Investments — To the extent that significant inputs to valuation models and other alternative pricing sources are unobservable, or if quotations are not readily available, or if GSAM believes that such quotations do not accurately reflect fair value, the fair value of the Fund’s investments may be determined under the Valuation Procedures. GSAM, consistent with its procedures and applicable regulatory guidance, may make an adjustment to the most recent valuation prices of either domestic or foreign securities in light of significant events to reflect what it believes to be the fair value of the securities at the time of determining the Fund’s NAV. To the extent investments are valued using single source broker quotations obtained directly from the broker or passed through from third party pricing vendors, such investments are classified as Level 3 investments.
C. Fair Value Hierarchy — The following is a summary of the Fund’s investments and derivatives classified in the fair value hierarchy as of April 30, 2024:
| | | | | | | | | | | | |
| Investment Type | | Level 1 | | | Level 2 | | | Level 3 | |
|
| |
| | | |
Assets | | | | | | | | | | | | |
| | | |
Common Stock and/or Other Equity Investments(a) | | | | | | | | | | | | |
| | | |
Asia | | $ | — | | | $ | — | | | $ | — | |
| | | |
Investment Company | | | 76,132,887 | | | | — | | | | — | |
|
| |
| | | |
Total | | $ | 76,132,887 | | | $ | — | | | $ | — | |
|
| |
| | | |
| Derivative Type | | | | | | | | | |
|
| |
| | | |
Assets(b) | | | | | | | | | | | | |
| | | |
Forward Foreign Currency Exchange Contracts | | $ | — | | | $ | 4,664,665 | | | $ | — | |
| | | |
Futures Contracts | | | 13,582,454 | | | | — | | | | — | |
|
| |
| | | |
Total | | $ | 13,582,454 | | | $ | 4,664,665 | | | $ | — | |
|
| |
GOLDMAN SACHS MULTI-STRATEGY ALTERNATIVES FUND
|
Consolidated Notes to Financial Statements (continued) April 30, 2024 (Unaudited) |
|
|
3. INVESTMENTS AND FAIR VALUE MEASUREMENTS (continued) |
| | | | | | | | | | | | |
| Derivative Type | | | Level 1 | | | | Level 2 | | | | Level 3 | |
|
| |
| | | |
Liabilities(b) | | | | | | | | | | | | |
| | | |
Forward Foreign Currency Exchange Contracts | | $ | — | | | $ | (6,858,739 | ) | | $ | — | |
| | | |
Futures Contracts | | | (12,489,758 | ) | | | — | | | | — | |
|
| |
| | | |
Total | | $ | (12,489,758 | ) | | $ | (6,858,739 | ) | | $ | — | |
|
| |
| | (a) | Amounts are disclosed by continent to highlight the impact of time zone differences between local market close and the calculation of net asset value. Security valuations are based on the principal exchange or system on which they are traded, which may differ from country of domicile. |
| | (b) | Amount shown represents unrealized gain (loss) at period end. |
For further information regarding security characteristics, see the Consolidated Schedule of Investments.
|
|
4. INVESTMENTS IN DERIVATIVES |
The following table sets forth, by certain risk types, the gross value of derivative contracts (not considered to be hedging instruments for accounting disclosure purposes) as of April 30, 2024. These instruments were used as part of the Fund’s investment strategies and to obtain and/or manage exposure related to the risks below. The values in the tables below exclude the effects of cash collateral received or posted pursuant to these derivative contracts, and therefore are not representative of the Fund’s net exposure.
| | | | | | | | | | | | |
| | | | |
| Risk | | Consolidated Statement of Assets and Liabilities | | Assets | | | Consolidated Statement of Assets and Liabilities | | Liabilities | |
| | | | |
| Commodity | | Variation margin on futures contracts | | $ | 12,204,284 | (a) | | Variation margin on futures contracts | | $ | (12,146,226 | )(a) |
| | | | |
| Currency | | Receivable for unrealized gain on forward foreign currency exchange contracts | | | 4,664,665 | | | Payable for unrealized loss on forward foreign currency exchange contracts | | | (6,858,739 | ) |
| | | | |
| Interest rate | | Variation margin on futures contracts | | | 1,378,170 | (a) | | Variation margin on futures contracts | | | (343,532 | )(a) |
| | | | |
Total | | | | $ | 18,247,119 | | | | | $ | (19,348,497 | ) |
| | (a) | Includes unrealized gain (loss) on futures contracts described in the Additional Investment Information sections of the Consolidated Schedule of Investments. Only current day’s variation margin is reported within the Consolidated Statement of Assets and Liabilities. |
The following table sets forth, by certain risk types, the Fund’s gains (losses) related to these derivatives and their indicative volumes for the six months ended April 30, 2024. These gains (losses) should be considered in the context that these derivative contracts may have been executed to create investment opportunities and/or economically hedge certain investments, and accordingly, certain gains (losses) on such derivative contracts may offset certain (losses) gains attributable to investments. These
GOLDMAN SACHS MULTI-STRATEGY ALTERNATIVES FUND
|
|
4. INVESTMENTS IN DERIVATIVES (continued) |
gains (losses) are included in “Net realized gain (loss)” or “Net change in unrealized gain (loss)” on the Consolidated Statement of Operations:
| | | | | | | | | | | | |
| Risk | | Consolidated Statement of Operations | | Net Realized Gain (Loss) | | Net Change in
Unrealized
Gain (Loss) |
| | | |
| Commodity | | Net realized gain (loss) from futures contracts/Net change in unrealized gain (loss) on futures contracts | | | | $(7,371,008 | ) | | | | $ 987,933 | |
| | | |
| Currency | | Net realized gain (loss) from forward foreign currency exchange contracts/Net change in unrealized gain (loss) on forward foreign currency exchange contracts | | | | 2,168,947 | | | | | (2,355,824 | ) |
| | | |
| Equity | | Net realized gain (loss) from written options | | | | 2,345 | | | | | — | |
| | | |
| Interest rate | | Net realized gain (loss) from futures contracts/Net change in unrealized gain (loss) on futures contracts | | | | (336,844 | ) | | | | 2,388,427 | |
| | | |
Total | | | | | | $(5,536,560 | ) | | | | $ 1,020,536 | |
For the six months ended April 30, 2024, the relevant values for each derivative type were as follows:
| | |
|
| Average Number of Contracts, Notional Amounts(a) |
| |
Futures Contracts | | Forward Contracts |
| |
| 5,971 | | $468,706,062 |
| | (a) | Amounts disclosed represent average number of contracts for Futures and Notional amounts for forwards contracts, which is indicative of volume for this derivative type, for the months that the Fund held such derivatives during the six month period ended April 30, 2024. |
In order to better define its contractual rights and to secure rights that will help the Fund mitigate its counterparty risk, the Fund may enter into an International Swaps and Derivatives Association, Inc. Master Agreement (“ISDA Master Agreement”) or similar agreement with its derivatives counterparties. An ISDA Master Agreement is a bilateral agreement between the Fund and a counterparty that governs OTC derivatives (including forward foreign currency exchange contracts, and certain options and swaps), and typically contains, among other things, collateral posting terms and netting provisions in the event of a default and/or termination event. The provisions of the ISDA Master Agreement typically permit a single net payment in the event of a default (close-out netting) or similar event, including the bankruptcy or insolvency of the counterparty.
Collateral and margin requirements differ between exchange traded derivatives and OTC derivatives. Margin requirements are established by the broker or clearing house for exchange-traded and centrally cleared derivatives (financial futures contracts, options and centrally cleared swaps) pursuant to governing agreements for those instrument types. Brokers can ask for margin in excess of the minimum in certain circumstances. Collateral terms are contract-specific for OTC derivatives. For derivatives traded under an ISDA Master Agreement, the collateral requirements are typically calculated by netting the marked to market amount for each transaction under such agreement and comparing that amount to the value of any collateral currently pledged by the Fund and the counterparty. Additionally, the Fund may be required to post initial margin to the counterparty, the terms of which would be outlined in the confirmation of the OTC transaction.
Generally, the amount of collateral due from or to a counterparty must exceed a minimum transfer amount threshold before a transfer is required to be made. To the extent amounts due to the Fund from its counterparties are not fully collateralized, contractually or otherwise, the Fund bears the risk of loss from counterparty nonperformance. The Fund attempts to mitigate counterparty risk by only entering into agreements with counterparties that the Underlying Managers believe to be of good standing and by monitoring the financial stability of those counterparties.
GOLDMAN SACHS MULTI-STRATEGY ALTERNATIVES FUND
|
Consolidated Notes to Financial Statements (continued) April 30, 2024 (Unaudited) |
|
|
4. INVESTMENTS IN DERIVATIVES (continued) |
Additionally, the netting of assets and liabilities and the offsetting of collateral pledged or received are based on contractual netting/set-off provisions in the ISDA Master Agreement or similar agreements. However, in the event of a default or insolvency of a counterparty, a court could determine that such rights are not enforceable due to the restrictions or prohibitions against the right of setoff that may be imposed in accordance with a particular jurisdiction’s bankruptcy or insolvency laws.
The following table sets forth the Fund’s net exposure for derivative instruments that are subject to enforceable master netting arrangements or similar agreements as of April 30, 2024:
Multi-Strategy Alternatives Fund
| | | | | | | | | | |
| | | | | |
| | | Derivative Assets(1) | | Derivative Liabilities(1) | | | | | | |
| | | | | |
| Counterparty | | Forward Currency Contracts | | Forward Currency Contracts | | Net Derivative Asset (Liabilities) | | Collateral (Received) Pledged(1) | | Net Amount(2) |
|
|
| | | | | |
MS & Co. Int. PLC | | $4,664,665 | | $(6,858,739) | | $(2,194,074) | | $2,194,074 | | $— |
|
|
| | (1) | Gross amounts available for offset but not netted in the Consolidated Statement of Assets and Liabilities. |
| | (2) | Net amount represents the net amount due (to) from counterparty in the event of a default based on the contractual set-off rights under the agreement. Net amount excludes any over-collateralized amounts. |
|
|
5. AGREEMENTS AND AFFILIATED TRANSACTIONS |
A. Management Agreement — Under the Agreement, GSAM manages the Fund, subject to the general supervision of the Trustees.
As compensation for the services rendered pursuant to the Agreement, the assumption of the expenses related thereto and administration of the Fund’s business affairs, including providing facilities, GSAM is entitled to a management fee, accrued daily and paid monthly, equal to an annual percentage rate of the Fund’s average daily net assets. For the six months ended April 30, 2024, contractual and effective net management fees with GSAM were at the following rates:
| | | | | | | | | | | | |
| | | Contractual Management Rate | | | | Effective Net Management Rate^(a) |
| | | First $2 billion | | Next $3 billion | | Next $3 billion | | Over $8 billion | | Effective Rate |
|
|
| | | | | | |
| | 0.75% | | 0.68% | | 0.64% | | 0.63% | | 0.75% | | 0.57% |
|
|
| | ^ | Effective Net Management Rate includes the impact of management fee waivers of affiliated underlying funds, if any. |
| | (a) | Reflects combined management fees paid to GSAM under the Agreement and the Subsidiary Agreements as defined below after waivers. |
The Fund invests in Institutional Shares of the Goldman Sachs Financial Square Government Fund, which is an affiliated Underlying Fund. GSAM has agreed to waive a portion of its management fee payable by the Fund in an amount equal to the management fee it earns as an investment adviser to the affiliated Underlying Fund in which the Fund invests. For the six months ended April 30, 2024, GSAM waived $97,573 of the Fund’s management fee.
GSAM also provides management services to the Subsidiary pursuant to a Subsidiary Management Agreement (the “Subsidiary Agreement”) and is entitled to a management fee accrued daily and paid monthly, equal to an annual percentage rate of 0.42% of the Subsidiary’s average daily net assets. In consideration of the Subsidiary’s management fee, and for as long as the Subsidiary Agreement remains in effect, GSAM has contractually agreed to waive irrevocably a portion of the Fund’s management fee in an amount equal to the management fee accrued and paid to GSAM by the Subsidiary under the Subsidiary Agreement. For the six months ended April 30, 2024, GSAM waived $40,779 of the Fund’s management fee.
GOLDMAN SACHS MULTI-STRATEGY ALTERNATIVES FUND
|
|
5. AGREEMENTS AND AFFILIATED TRANSACTIONS (continued) |
B. Distribution and/or Service (12b-1) Plans — The Trust, on behalf of Class A Shares of the Fund, has adopted Distribution and Service Plans subject to Rule 12b-1 under the Act. Under the Distribution and Service Plans, Goldman Sachs, which serves as distributor (the “Distributor”), is entitled to a fee accrued daily and paid monthly for distribution services and personal and account maintenance services, which may then be paid by Goldman Sachs to authorized dealers. These fees are equal to an annual percentage rate of the average daily net assets attributable to Class A Shares of the Fund, as applicable, as set forth below.
The Trust, on behalf of Class C Shares of the Fund, has adopted a Distribution Plan subject to Rule 12b-1 under the Act. Under the Distribution Plan, Goldman Sachs as Distributor is entitled to a fee accrued daily and paid monthly for distribution services, which may then be paid by Goldman Sachs to authorized dealers. These fees are equal to an annual percentage rate of the average daily net assets attributable to Class C Shares of the Fund, as set forth below.
| | | | |
| | | Distribution and/or Service Plan Rates |
| |
| | |
| | |
| | | Class A* | | Class C |
|
|
| | |
Distribution and/or Service Plan | | 0.25% | | 0.75% |
|
|
| | * | With respect to Class A Shares, the Distributor at its discretion may use compensation for distribution services paid under the Distribution and Service Plan to compensate service organizations for personal and account maintenance services and expenses as long as such total compensation does not exceed the maximum cap on “service fees” imposed by the Financial Industry Regulatory Authority. |
C. Distribution Agreement — Goldman Sachs, as Distributor of the shares of the Fund pursuant to a Distribution Agreement, may retain a portion of the Class A Shares’ front end sales charge and Class C Shares’ CDSC. During the six months ended April 30, 2024, Goldman Sachs retained the following amounts:
| | |
| | | Front End
Sales Charge |
| |
| Fund | | Class A |
|
|
| |
Multi-Strategy Alternatives Fund | | $4 |
|
|
During the six months ended April 30, 2024, Goldman Sachs did not retain any portion of Class C Shares’ CDSC.
D. Service Plan — The Trust, on behalf of the Fund, has adopted a Service Plan to allow Class C Shares to compensate service organizations (including Goldman Sachs) for providing varying levels of personal and account maintenance services to their customers who are beneficial owners of such shares. The Service Plan provides for compensation to the service organizations equal to an annual percentage rate of 0.25% of the average daily net assets attributable to Class C Shares of the Fund.
E. Transfer Agency Agreement — Goldman Sachs also serves as the transfer agent of the Fund for a fee pursuant to the Transfer Agency Agreement. The fees charged for such transfer agency services are accrued daily and paid monthly at annual rates as follows: 0.15% of the average daily net assets of Class A, Class C and Investor Shares; 0.04% of the average daily net assets of Institutional Shares; and 0.03% of the average daily net assets of Class R6 and Class P Shares. Goldman Sachs has agreed to waive a portion of the transfer agency fees equal to 0.06% of the average daily net assets attributable to Class A, Class C and Investor Shares of the Fund through at least February 28, 2025 (the “TA Fee Waiver”). Prior to such date, Goldman Sachs may not terminate the arrangement without approval of the Board of Trustees.
F. Other Expense Agreements and Affiliated Transactions — GSAM has agreed to reduce or limit certain “Other Expenses” of the Fund (excluding acquired fund fees and expenses, transfer agency fees and expenses, service fees and shareholder administration fees (as applicable), taxes, dividends and interest payments on securities sold short, interest, brokerage fees, expenses of shareholder meetings, litigation and indemnification, and extraordinary expenses) to 0.064% of the average daily net assets of the Fund and limit the Fund’s annual operating expenses. These Other Expense limitations will remain in effect through at least February 28, 2025, and prior to such date GSAM may not terminate the arrangements without the approval of the Trustees.
GOLDMAN SACHS MULTI-STRATEGY ALTERNATIVES FUND
|
Consolidated Notes to Financial Statements (continued) April 30, 2024 (Unaudited) |
|
|
5. AGREEMENTS AND AFFILIATED TRANSACTIONS (continued) |
In addition, the Fund has entered into certain offset arrangements with the transfer agent, which may result in a reduction of the Fund’s expenses and are received irrespective of the application of the “Other Expense” limitations described above. For the six months ended April 30, 2024, these expense reductions, including any fee waivers and Other Expense reimbursements, were as follows:
| | | | | | | | | | | | | | |
| | | | | | | |
| Fund | | Management Fee Waiver | | | | Transfer Agency Waivers/Credits | | | | Other Expense Reimbursements | | | | Total Expense Reductions |
|
|
| | | | | | | |
Multi-Strategy Alternatives Fund | | $97,573 | | | | $3,627 | | | | $624,685 | | | | $725,885 |
|
|
G. Line of Credit Facility — As of April 30, 2024, the Fund participated in a $1,150,000,000 committed, unsecured revolving line of credit facility (the “facility”) together with other funds of the Trust and certain registered investment companies having management agreements with GSAM or its affiliates. This facility is to be used for temporary emergency purposes, or to allow for an orderly liquidation of securities to meet redemption requests. The interest rate on borrowings is based on the federal funds rate. The facility also requires a fee to be paid by the Fund based on the amount of the commitment that has not been utilized. For the six months ended April 30, 2024, the Fund did not have any borrowings under the facility. Prior to April 16, 2024, the facility was $1,110,000,000.
H. Other Transactions with Affiliates — For the six months ended April 30, 2024, Goldman Sachs did not earn any brokerage commissions from portfolio transactions, on behalf of the Fund.
As of April 30, 2024, The Goldman Sachs Group, Inc. was the beneficial owner of approximately 100% of Class R6 Shares of the Fund.
The table below shows the transaction in and earnings from investments in the Goldman Sachs Financial Square Government Fund for the six months ended April 30, 2024.
| | | | | | | | | | | | | | | | | | | | | | | | | | |
| Fund | | Underlying Fund | | Beginning Value as of October 31, 2023 | | | Purchases at Cost | | | Proceeds
from Sales | | | Ending Value as of April 30, 2024 | | | Shares as of April 30, 2024 | | | Dividend Income | |
|
| |
| | | | | | | |
Multi-Strategy Alternatives Fund | | Goldman Sachs Financial Square Government Fund — Institutional Shares | | $ | 84,998,501 | | | $ | 37,096,187 | | | $ | (45,961,801 | ) | | $ | 76,132,887 | | | | 76,132,887 | | | $ | 2,239,520 | |
|
| |
|
|
6. PORTFOLIO SECURITIES TRANSACTIONS |
The cost of purchases and proceeds from sales and maturities of long-term securities for the six months ended April 30, 2024, were as follows:
| | | | |
| | |
| Fund | | Purchases (Excluding U.S. Government and Agency Obligations) | | Sales and Maturities of (Excluding U.S. Government and Agency Obligations) |
|
|
| | |
Multi-Strategy Alternatives Fund | | $176,755 | | $162,739 |
|
|
GOLDMAN SACHS MULTI-STRATEGY ALTERNATIVES FUND
As of the Fund’s most recent fiscal year end, October 31, 2023, the Fund’s capital loss carryforwards and certain timing differenceson a tax basis were as follows:
| | |
|
| |
Capital loss carryforwards: | | |
| |
Perpetual Short-Term | | $(41,474,724) |
| |
Perpetual Long-Term | | (1,626,550) |
|
| |
Total capital loss carryforwards | | (43,101,274) |
|
| |
Timing differences (Straddles, Russian Dividend Accrual) | | $ (183,351) |
|
As of April 30, 2024, the Fund’s aggregate security unrealized gains and losses based on cost for U.S. federal income tax purposes were as follows:
| | |
|
| |
Tax Cost | | $75,693,614 |
|
| |
Gross unrealized gain | | 1,061,252 |
| |
Gross unrealized loss | | (621,979) |
|
| |
Net unrealized gain | | $ 439,273 |
|
The difference between GAAP-basis and tax basis unrealized gains (losses) is attributable primarily to wash sales, net mark to market gains/(losses) on regulated futures contracts, net mark to market gains/(losses) on foreign currency contracts, and differences in the tax treatment of underlying fund investments.
GSAM has reviewed the Fund’s tax positions for all open tax years (the current and prior three years, as applicable) and has concluded that no provision for income tax is required in the Fund’s financial statements. Such open tax years remain subject to examination and adjustment by tax authorities.
The Fund’s risks include, but are not limited to, the following:
Derivatives Risk — The Fund’s use of derivatives and other similar instruments (collectively referred to in this paragraph as “derivatives”) may result in loss, including due to adverse market movements. Derivatives, which may pose risks in addition to and greater than those associated with investing directly in securities, currencies or other assets and instruments, may increase market exposure and be illiquid or less liquid, volatile, difficult to price and leveraged so that small changes in the value of the underlying assets or instruments may produce disproportionate losses to the Fund. Certain derivatives are also subject to counterparty risk, which is the risk that the other party in the transaction will not, or lacks the capacity or authority to, fulfill its contractual obligations, liquidity risk, which includes the risk that the Fund will not be able to exit the derivative when it is advantageous to do so, and risks arising from margin requirements, which include the risk that the Fund will be required to pay additional margin or set aside additional collateral to maintain open derivative positions. The use of derivatives is a highly specialized activity that involves investment techniques and risks different from those associated with investments in more traditional securities and instruments. Losses from derivatives can also result from a lack of correlation between changes in the value of derivative instruments and the portfolio assets (if any) being hedged.
Foreign and Emerging Countries Risk — Investing in foreign markets may involve special risks and considerations not typically associated with investing in the U.S. Foreign securities may be subject to risk of loss because of more or less foreign government regulation; less public information; less stringent investor protections; less stringent accounting, corporate governance, financial reporting and disclosure standards; and less economic, political and social stability in the countries in which the Fund invests. The imposition of sanctions, exchange controls (including repatriation restrictions), confiscation of assets and property, trade restrictions (including tariffs) and other government restrictions by the U.S. or other governments, or from problems in
GOLDMAN SACHS MULTI-STRATEGY ALTERNATIVES FUND
|
Consolidated Notes to Financial Statements (continued) April 30, 2024 (Unaudited) |
|
|
8. OTHER RISKS (continued) |
registration, settlement or custody, may also result in losses. The type and severity of sanctions and other similar measures, including counter sanctions and other retaliatory actions, that may be imposed could vary broadly in scope, and their impact is impossible to predict. For example, the imposition of sanctions and other similar measures could, among other things, cause a decline in the value and/or liquidity of securities issued by the sanctioned country or companies located in or economically tied to the sanctioned country and increase market volatility and disruption in the sanctioned country and throughout the world. Sanctions and other similar measures could limit or prevent the Fund from buying and selling securities (in the sanctioned country and other markets), significantly delay or prevent the settlement of securities transactions, and significantly impact the Fund’s liquidity and performance. Foreign risk also involves the risk of negative foreign currency exchange rate fluctuations, which may cause the value of securities denominated in such foreign currency (or other instruments through which the Fund has exposure to foreign currencies) to decline in value. Currency exchange rates may fluctuate significantly over short periods of time. To the extent that the Fund also invests in securities of issuers located in, or economically tied to, emerging markets, these risks may be more pronounced.
Geographic Risk — If the Fund focuses its investments in securities of issuers located in a particular country or geographic region, the Fund may be subjected, to a greater extent than if its investments were less focused, to the risks of volatile economic cycles and/or conditions and developments that may be particular to that country or region, such as: adverse securities markets; adverse exchange rates; adverse social, political, regulatory, economic, business, environmental or other developments; or natural disasters.
Interest Rate Risk — When interest rates increase, fixed income securities or instruments held by the Fund will generally decline in value. Long-term fixed income securities or instruments will normally have more price volatility because of this risk than short-term fixed income securities or instruments. A wide variety of market factors can cause interest rates to rise, including central bank monetary policy, rising inflation and changes in general economic conditions. Changing interest rates may have unpredictable effects on the markets, may result in heightened market volatility and may detract from Fund performance. In addition, changes in monetary policy may exacerbate the risks associated with changing interest rates. Funds with longer average portfolio durations will generally be more sensitive to changes in interest rates than funds with a shorter average portfolio duration. Fluctuations in interest rates may also affect the liquidity of fixed income securities and instruments held by the Fund. A sudden or unpredictable increase in interest rates may cause volatility in the market and may decrease the liquidity of the Fund’s investments, which would make it harder for the Fund to sell its investments at an advantageous time.
Investment Style Risk — Different investment styles (e.g., “growth”, “value” or “quantitative”) tend to shift in and out of favor depending upon market and economic conditions and investor sentiment. The Fund may outperform or underperform other funds that invest in similar asset classes but employ different investment styles.
Large Shareholder Transactions Risk — The Fund may experience adverse effects when certain large shareholders, such as other funds, institutional investors (including those trading by use of non-discretionary mathematical formulas), financial intermediaries (who may make investment decisions on behalf of underlying clients and/or include the Fund in their investment model), individuals, accounts and Goldman Sachs affiliates, purchase or redeem large amounts of shares of the Fund. Such large shareholder redemptions, which may occur rapidly or unexpectedly, may cause the Fund to sell portfolio securities at times when it would not otherwise do so, which may negatively impact the Fund’s NAV and liquidity. These transactions may also accelerate the realization of taxable income to shareholders if such sales of investments resulted in gains, and may also increase transaction costs. In addition, a large redemption could result in the Fund’s current expenses being allocated over a smaller asset base, leading to an increase in the Fund’s expense ratio. Similarly, large Fund share purchases may adversely affect the Fund’s performance to the extent that the Fund is delayed in investing new cash or otherwise maintains a larger cash position than it ordinarily would.
Liquidity Risk — The Fund may make investments that are illiquid or that may become less liquid in response to market developments or adverse investor perceptions. Illiquid investments may be more difficult to value. Liquidity risk may also refer to the risk that the Fund will not be able to pay redemption proceeds within the allowable time period or without significant dilution to remaining investors’ interests because of unusual market conditions, declining prices of the securities sold, an unusually high volume of redemption requests, or other reasons. To meet redemption requests, the Fund may be forced to sell investments at an
GOLDMAN SACHS MULTI-STRATEGY ALTERNATIVES FUND
|
|
8. OTHER RISKS (continued) |
unfavorable time and/or under unfavorable conditions. If the Fund is forced to sell securities at an unfavorable time and/or under unfavorable conditions, such sales may adversely affect the Fund’s NAV and dilute remaining investors’ interests. These risks may be more pronounced in connection with the Fund’s investments in securities of issuers located in emerging market countries. Redemptions by large shareholders may have a negative impact on the Fund’s liquidity.
Market and Credit Risks — In the normal course of business, the Fund trades financial instruments and enters into financial transactions where risk of potential loss exists due to changes in the market (market risk). The value of the securities in which the Fund invests may go up or down in response to the prospects of individual companies, particular sectors or governments and/or general economic conditions throughout the world due to increasingly interconnected global economies and financial markets. Events such as war, military conflict, acts of terrorism, social unrest, natural disasters, recessions, inflation, rapid interest rate changes, supply chain disruptions, sanctions, the spread of infectious illness or other public health threats could also significantly impact the Fund and its investments. Additionally, the Fund may also be exposed to credit risk in the event that an issuer or guarantor fails to perform or that an institution or entity with which the Fund has unsettled or open transactions defaults.
Short Position Risk — The Fund may enter into a short position through a futures contract, an option or swap agreement or through short sales of any instrument that the Fund may purchase for investment. Taking short positions involves leverage of the Fund’s assets and presents various risks, including counterparty risk. If the value of the underlying instrument or market in which the Fund has taken a short position increases, then the Fund will incur a loss equal to the increase in value from the time that the short position was entered into plus any related interest payments or other fees. Taking short positions involves the risk that losses may be disproportionate, may exceed the amount invested, and may be unlimited. To the extent that the Fund uses the proceeds it receives from a short position to take additional long positions, the risks associated with the short position, including leverage risks, may be heightened, because doing so increases the exposure of the Fund to the markets and therefore could magnify changes to the Fund’s NAV.
Tax Risk — The Fund will seek to gain exposure to the commodity markets primarily through investments in the Subsidiary and/ or commodity index-linked structured notes, as applicable. Historically, the Internal Revenue Service (“IRS”) issued private letter rulings (“PLRs”) in which the IRS specifically concluded that income and gains from investments in commodity index-linked structured notes (the “Notes Rulings”) or a wholly-owned foreign subsidiary that invests in commodity-linked instruments are “qualifying income” for purposes of compliance with Subchapter M of the Code. However, the Fund has not received a PLR, and is/are not able to rely on PLRs issued to other taxpayers. The IRS recently issued final regulations that, would generally treat the Fund’s income inclusion with respect to a subsidiary as qualifying income either if (A) there is a distribution out of the earnings and profits of a subsidiary that are attributable to such income inclusion or (B) such inclusion is derived with respect to the Fund’s business of investing in stock, securities, or currencies.
The IRS also issued a revenue procedure, which states that the IRS will not in the future issue PLRs that would require a determination of whether an asset (such as a commodity index-linked note) is a “security” under the Investment Company Act of 1940. In connection with issuing such revenue procedure, the IRS has revoked the Notes Ruling on a prospective basis. In light of the revocation of the Notes Rulings, the Fund has limited its investments in commodity index-linked structured notes. The Fund has obtained an opinion of counsel that the Fund’s income from investments in the Subsidiary should constitute “qualifying income.” However, no assurances can be provided that the IRS would not be able to successfully assert that the Fund’s income from such investments was not “qualifying income,” in which case the Fund would fail to qualify as a regulated investment company (“RIC”) under Subchapter M of the Code if over 10% of its gross income were derived from these investments. If the Fund failed to qualify as a RIC, it would be subject to federal and state income tax on all of its taxable income at regular corporate tax rates with no deduction for any distributions paid to shareholders, which would significantly adversely affect the returns to, and could cause substantial losses for, Fund shareholders.
GOLDMAN SACHS MULTI-STRATEGY ALTERNATIVES FUND
|
Consolidated Notes to Financial Statements (continued) April 30, 2024 (Unaudited) |
Under the Trust’s organizational documents, its Trustees, officers, employees and agents are indemnified, to the extent permitted by the Act and state law, against certain liabilities that may arise out of performance of their duties to the Fund. Additionally, in the course of business, the Fund enters into contracts that contain a variety of indemnification clauses. The Fund’s maximum exposure under these arrangements is unknown, as this would involve future claims that may be made against the Fund that have not yet occurred. However, GSAM believes the risk of loss under these arrangements to be remote.
Subsequent events after the Consolidated Statement of Assets and Liabilities date have been evaluated, and GSAM has concluded that there is no impact requiring adjustment or disclosure in the financial statements.
GOLDMAN SACHS MULTI-STRATEGY ALTERNATIVES FUND
|
|
11. SUMMARY OF SHARE TRANSACTIONS |
Share activity is as follows:
| | | | | | | | | | | | | | | | |
| | | Multi-Strategy Alternatives Fund | |
| | |
| | | For the Six Months Ended April 30, 2024 (Unaudited) | | | For the Fiscal Year Ended October 31, 2023 | |
| |
| | | | |
| | | | |
| | | Shares | | | Dollars | | | Shares | | | Dollars | |
| |
| | | | |
| | | | |
Class A Shares | | | | | | | | | | | | | | | | |
| | | | |
Shares sold | | | 32,464 | | | $ | 359,913 | | | | 147,853 | | | $ | 1,646,506 | |
| | | | |
Reinvestment of distributions | | | 20,637 | | | | 230,923 | | | | 1,655 | | | | 18,502 | |
| | | | |
Shares redeemed | | | (119,506 | ) | | | (1,343,228 | ) | | | (209,620 | ) | | | (2,342,229 | ) |
|
| |
| | | | |
| | | (66,405 | ) | | | (752,392 | ) | | | (60,112 | ) | | | (677,221 | ) |
|
| |
| | | | |
Class C Shares | | | | | | | | | | | | | | | | |
| | | | |
Shares sold | | | — | | | | — | | | | 2,316 | | | | 24,403 | |
| | | | |
Reinvestment of distributions | | | 108 | | | | 1,171 | | | | — | | | | — | |
| | | | |
Shares redeemed | | | (31,549 | ) | | | (336,414 | ) | | | (120,429 | ) | | | (1,267,292 | ) |
|
| |
| | | | |
| | | (31,441 | ) | | | (335,243 | ) | | | (118,113 | ) | | | (1,242,889 | ) |
|
| |
| | | | |
Institutional Shares | | | | | | | | | | | | | | | | |
| | | | |
Shares sold | | | 80,538 | | | | 891,646 | | | | 258,269 | | | | 2,933,294 | |
| | | | |
Reinvestment of distributions | | | 72,629 | | | | 826,520 | | | | 14,428 | | | | 163,755 | |
| | | | |
Shares redeemed | | | (670,991 | ) | | | (7,420,598 | ) | | | (988,807 | ) | | | (11,214,686 | ) |
|
| |
| | | | |
| | | (517,824 | ) | | | (5,702,432 | ) | | | (716,110 | ) | | | (8,117,637 | ) |
|
| |
| | | | |
Investor Shares | | | | | | | | | | | | | | | | |
| | | | |
Shares sold | | | 11,678 | | | | 130,974 | | | | 72,337 | | | | 814,913 | |
| | | | |
Reinvestment of distributions | | | 13,417 | | | | 151,751 | | | | 2,234 | | | | 25,218 | |
| | | | |
Shares redeemed | | | (63,363 | ) | | | (702,404 | ) | | | (185,030 | ) | | | (2,074,466 | ) |
|
| |
| | | | |
| | | (38,268 | ) | | | (419,679 | ) | | | (110,459 | ) | | | (1,234,335 | ) |
|
| |
| | | | |
Class R6 Shares | | | | | | | | | | | | | | | | |
| | | | |
Reinvestment of distributions | | | 34 | | | | 386 | | | | 16 | | | | 185 | |
| | | | |
Shares redeemed | | | — | | | | — | | | | (2,246 | ) | | | (25,364 | ) |
|
| |
| | | | |
| | | 34 | | | | 386 | | | | (2,230 | ) | | | (25,179 | ) |
|
| |
| | | | |
Class R Shares(a) | | | | | | | | | | | | | | | | |
| | | | |
Shares sold | | | 706 | | | | 7,561 | | | | — | | | | — | |
| | | | |
Reinvestment of distributions | | | 79 | | | | 875 | | | | — | | | | — | |
| | | | |
Shares redeemed | | | (3,410 | ) | | | (34,985 | ) | | | — | | | | — | |
|
| |
| | | | |
| | | (2,625 | ) | | | (26,549 | ) | | | — | | | | — | |
|
| |
| | | | |
Class P Shares | | | | | | | | | | | | | | | | |
| | | | |
Shares sold | | | 53,867 | | | | 590,374 | | | | 169,134 | | | | 1,909,457 | |
| | | | |
Reinvestment of distributions | | | 184,092 | | | | 2,093,131 | | | | 42,710 | | | | 484,761 | |
| | | | |
Shares redeemed | | | (784,828 | ) | | | (8,573,470 | ) | | | (3,504,125 | ) | | | (39,489,463 | ) |
|
| |
| | | | |
| | | (546,869 | ) | | | (5,889,965 | ) | | | (3,292,281 | ) | | | (37,095,245 | ) |
|
| |
| | | | |
NET DECREASE | | | (1,203,398 | ) | | $ | (13,125,874 | ) | | | (4,299,305 | ) | | $ | (48,392,506 | ) |
|
| |
| | (a) | At the close of business on April 16, 2024, Class R Shares of the Fund were liquidated. |
GOLDMAN SACHS MULTI-STRATEGY ALTERNATIVES FUND
| | |
| | |
| Fund Expenses — Six Month Period Ended April 30, 2024 (Unaudited) | | |
As a shareholder of Class A, Class C, Institutional, Investor, Class R6 or Class P Shares of the Fund, you incur two types of costs: (1) transaction costs, including sales charges on purchase payments (with respect to Class A Shares), contingent deferred sales charges on redemptions (with respect to Class C Shares), and (2) ongoing costs, including management fees; distribution and service (12b-1) fees (with respect to Class A Shares); and other Fund expenses. This example is intended to help you understand your ongoing costs (in dollars) of investing in Class A, Class C, Institutional, Investor, Class R6 or Class P Shares of the Fund and to compare these costs with the ongoing costs of investing in other mutual funds.
The example is based on an investment of $1,000 invested at the beginning of the period and held for the entire period from November 1, 2023 through April 30, 2024, which represents a period of 182 days of a 366 day year. This projection assumes that annualized expense ratios were in effect during the period.
Actual Expenses — The first line under each share class in the table below provides information about actual account values and actual expenses. You may use the information in this line, together with the amount you invested, to estimate the expenses that you paid over the period. Simply divide your account value by $1,000 (for example, an $8,600 account value divided by $1,000=8.6), then multiply the result by the number in the first line under the heading entitled “Expenses Paid” to estimate the expenses you paid on your account during this period.
Hypothetical Example for Comparison Purposes — The second line under each share class in the table below provides information about hypothetical account values and hypothetical expenses based on the Fund’s actual net expense ratios and an assumed rate of return of 5% per year before expenses, which is not the Fund’s actual return. The hypothetical account values and expenses may not be used to estimate the actual ending account balance or expenses you paid for the period. You may use this information to compare the ongoing costs of investing in the Fund and other funds. To do so, compare this 5% hypothetical example with the 5% hypothetical examples that appear in the shareholder reports of the other funds.
Please note that the expenses shown in the table are meant to highlight your ongoing costs only and do not reflect any transactional costs, such as sales charges, redemption fees, or exchange fees. Therefore, the second line of the table is useful in comparing ongoing costs only, and will not help you determine the relative total costs of owning different funds. In addition, if these transactional costs were included, your costs would have been higher.
| | | | | | | | | | | | |
| | | Multi-Strategy Alternatives Fund | |
| Share Class | | Beginning Account Value 11/1/23 | | | Ending Account Value 4/30/24 | | | Expenses Paid for the 6 months ended 4/30/24* | |
| | | | |
| Class A | | | | | | | | | | | | |
| | | | |
Actual | | | $1,000.00 | | | | $ 968.30 | | | | $5.09 | |
| | | | |
Hypothetical 5% return | | | 1,000.00 | | | | 1,019.70 | + | | | 5.23 | |
| | | | |
| Class C | | | | | | | | | | | | |
| | | | |
Actual | | | 1,000.00 | | | | 964.60 | | | | 8.62 | |
| | | | |
Hypothetical 5% return | | | 1,000.00 | | | | 1,016.10 | + | | | 8.85 | |
| | | | |
| Institutional | | | | | | | | | | | | |
| | | | |
Actual | | | 1,000.00 | | | | 969.40 | | | | 3.59 | |
| | | | |
Hypothetical 5% return | | | 1,000.00 | | | | 1,021.20 | + | | | 3.69 | |
| | | | |
| Investor | | | | | | | | | | | | |
| | | | |
Actual | | | 1,000.00 | | | | 969.40 | | | | 3.86 | |
| | | | |
Hypothetical 5% return | | | 1,000.00 | | | | 1,020.90 | + | | | 3.96 | |
| | | | |
| Class R6 | | | | | | | | | | | | |
| | | | |
Actual | | | 1,000.00 | | | | 970.00 | | | | 3.55 | |
| | | | |
Hypothetical 5% return | | | 1,000.00 | | | | 1,021.30 | + | | | 3.64 | |
| | | | |
| Class P | | | | | | | | | | | | |
| | | | |
Actual | | | 1,000.00 | | | | 969.40 | | | | 3.57 | |
| | | | |
Hypothetical 5% return | | | 1,000.00 | | | | 1,021.20 | + | | | 3.66 | |
| | * | Expenses for each share class are calculated using the Fund’s annualized net expense ratio for each class, which represents the ongoing expenses as a percentage of net assets for the six months ended April 30, 2024. Expenses are calculated by multiplying the annualized net expense ratio by the average account value for the period; then multiplying the result by the number of days in the most recent fiscal half year; and then dividing that result by the number of days in the fiscal year. The annualized net expense ratios for the period were as follows: | |
| | | | | | | | | | | | | | | | | | | | | | | | |
| Fund | | Class A | | | Class C | | | Institutional | | Investor | | | Class R6 | | | Class P | | | |
| | | | | | | |
Multi-Strategy Alternatives Fund | | | 1.04% | | | | 1.77% | | | 0.73% | | | 0.79% | | | | 0.72% | | | | 0.73% | | | |
| | + | Hypothetical expenses are based on the Fund’s actual annualized net expense ratio (excluding proxy fee which is not annualized) and an assumed rate of return of 5% per year before expenses. | |
GOLDMAN SACHS MULTI-STRATEGY ALTERNATIVES FUND
Liquidity Risk Management Program (Unaudited)
Each Fund has adopted and implemented a liquidity risk management program (the “Program”) in accordance with Rule 22e-4 under the 1940 Act. The Program seeks to assess and manage each Fund’s liquidity risk, i.e., the risk that a Fund is unable to satisfy redemption requests without significantly diluting remaining investors’ interests in the Fund. The Board of Trustees of the Trust has designated GSAM, each Fund’s investment adviser, to administer the Program. Certain aspects of the Program rely on third parties to perform certain functions, including the provision of market data and application of models.
The Program is comprised of various components designed to support the assessment and/or management of liquidity risk, including: (1) the periodic assessment (no less frequently than annually) of certain factors that influence a Fund’s liquidity risk; (2) the periodic classification (no less frequently than monthly) of a Fund’s investments into one of four liquidity categories that reflect an estimate of their liquidity under current market conditions; (3) a 15% limit on the acquisition of “illiquid investments” (as defined under Rule 22e-4); (4) for a Fund that does not invest primarily in “highly liquid investments” (as defined under Rule 22e-4), the determination of a minimum percentage of the Fund’s assets that will generally be invested in highly liquid investments (a “Highly Liquid Investment Minimum”); and (5) periodic reporting to the Board of Trustees.
At a meeting of the Board of Trustees on February 13-14, 2024, GSAM provided a written report to the Board addressing the operation, and the adequacy and effectiveness of the implementation, of the Program, including, as applicable, the operation of any Highly Liquid Investment Minimum and any material changes to the Program, for the period from January 1, 2023 through December 31, 2023 (the “Reporting Period”). Among other things, the annual report discussed: (1) the results of stress tests designed to assess liquidity under a hypothetical stressed scenario involving elevated redemptions; (2) an assessment of the methodologies used to classify investments into one of four liquidity categories; and (3) the impact of local holidays in non-U.S. jurisdictions. The report concluded that the Program continues to be reasonably designed to assess and manage liquidity risk and was adequately and effectively implemented during the Reporting Period.
There can be no assurance that the Program will achieve its objectives under all circumstances in the future. Please refer to your Fund’s prospectus for more information regarding the Fund’s exposure to liquidity risk and other risks to which it may be subject.
GOLDMAN SACHS MULTI-STRATEGY ALTERNATIVES FUND
Voting Results of Special Meeting of Shareholders (Unaudited)
A Special Meeting of Shareholders (the “Meeting”) of the Goldman Sachs Trust II (the “Trust”) was held on November 16, 2023 to consider and elect nominees to the Trust’s Board of Trustees. At the Meeting, Gregory G. Weaver, Dwight L. Bush, Kathryn A. Cassidy, John G. Chou, Joaquin Delgado, Eileen H. Dowling and Paul C. Wirth were elected to the Trust’s Board of Trustees. In electing the nominees, the Trust’s shareholders voted as follows:
| | | | | | | | | | |
| Proposal | | | | | | | | |
| | | |
| Election of Trustees | | For | | Withheld | | | | |
| | | |
Gregory G. Weaver | | 1,292,078,725 | | | 63,531,552 | | | | | |
| | | |
Dwight L. Bush | | 1,339,529,258 | | | 16,081,019 | | | | | |
| | | |
Kathryn A. Cassidy | | 1,340,407,606 | | | 15,202,670 | | | | | |
| | | |
John G. Chou | | 1,351,547,930 | | | 4,062,346 | | | | | |
| | | |
Joaquin Delgado | | 1,340,312,893 | | | 15,297,383 | | | | | |
| | | |
Eileen H. Dowling | | 1,351,944,019 | | | 3,666,258 | | | | | |
| | | |
Paul C. Wirth | | 1,350,994,736 | | | 4,615,540 | | | | | |
FUNDS PROFILE
Goldman Sachs Funds
Goldman Sachs is a premier financial services firm, known since 1869 for creating thoughtful and customized investment solutions in complex global markets.
Today, the Asset Management Division of Goldman Sachs serves a diverse set of clients worldwide, including private institutions, public entities and individuals. With approximately $2.56 trillion in assets under supervision as of March 31, 2024, Goldman Sachs Asset Management has portfolio management teams located around the world and our investment professionals bring firsthand knowledge of local markets to every investment decision. Assets under supervision includes assets under management and other client assets for which Goldman Sachs does not have full discretion. Goldman Sachs Asset Management leverages the resources of Goldman Sachs & Co. LLC subject to legal, internal and regulatory restrictions.
Money Market
Financial Square FundsSM
| ∎ | Financial Square Treasury Solutions Fund1 |
| ∎ | Financial Square Government Fund1 |
| ∎ | Financial Square Money Market Fund2 |
| ∎ | Financial Square Prime Obligations Fund2 |
| ∎ | Financial Square Treasury Instruments Fund1 |
| ∎ | Financial Square Treasury Obligations Fund1 |
| ∎ | Financial Square Federal Instruments Fund1 |
Investor FundsSM
| ∎ | Investor Money Market Fund3 |
| ∎ | Investor Tax-Exempt Money Market Fund3 |
Fixed Income
Short Duration and Government
| ∎ | Short-Term Conservative Income Fund |
| ∎ | Short Duration Government Fund |
| ∎ | Short Duration Bond Fund |
| ∎ | Inflation Protected Securities Fund |
Multi-Sector
| ∎ | Global Core Fixed Income Fund |
Municipal and Tax-Free
| ∎ | High Yield Municipal Fund |
| ∎ | Dynamic Municipal Income Fund |
| ∎ | Short Duration Tax-Free Fund |
| ∎ | Municipal Income Completion Fund |
Single Sector
| ∎ | Investment Grade Credit Fund |
| ∎ | High Yield Floating Rate Fund |
| ∎ | Emerging Markets Debt Fund |
| ∎ | Emerging Markets Credit Fund |
Fixed Income Alternatives
| ∎ | Short Duration High Yield Fund4 |
Fundamental Equity
| ∎ | Small/Mid Cap Value Fund |
| ∎ | Small/Mid Cap Growth Fund |
| ∎ | Enhanced Core Equity Fund5 |
| ∎ | Technology Opportunities Fund |
| ∎ | Rising Dividend Growth Fund |
Tax-Advantaged Equity
| ∎ | U.S. Tax-Managed Equity Fund |
| ∎ | International Tax-Managed Equity Fund |
| ∎ | U.S. Equity Dividend and Premium Fund |
| ∎ | International Equity Dividend and Premium Fund |
Equity Insights
| ∎ | Small Cap Equity Insights Fund |
| ∎ | U.S. Equity Insights Fund |
| ∎ | Small Cap Growth Insights Fund |
| ∎ | Large Cap Growth Insights Fund |
| ∎ | Large Cap Value Insights Fund |
| ∎ | Small Cap Value Insights Fund |
| ∎ | International Small Cap Insights Fund |
| ∎ | International Equity Insights Fund |
| ∎ | Emerging Markets Equity Insights Fund |
Fundamental Equity International
| ∎ | International Equity Income Fund |
| ∎ | International Equity ESG Fund |
| ∎ | Emerging Markets Equity Fund |
| ∎ | Emerging Markets Equity ex. China Fund |
| ∎ | ESG Emerging Markets Equity Fund |
Alternative
| ∎ | Clean Energy Income Fund |
| ∎ | Real Estate Securities Fund |
| ∎ | Global Real Estate Securities Fund |
| ∎ | Absolute Return Tracker Fund |
| ∎ | Managed Futures Strategy Fund |
| ∎ | MLP Energy Infrastructure Fund |
| ∎ | Energy Infrastructure Fund |
| ∎ | Multi-Strategy Alternatives Fund |
| ∎ | Global Infrastructure Fund |
Total Portfolio Solutions
| ∎ | Global Managed Beta Fund |
| ∎ | Multi-Manager Non-Core Fixed Income Fund |
| ∎ | Multi-Manager Global Equity Fund |
| ∎ | Multi-Manager International Equity Fund |
| ∎ | Tactical Tilt Overlay Fund |
| ∎ | Balanced Strategy Portfolio |
| ∎ | Multi-Manager U.S. Small Cap Equity Fund |
| ∎ | Multi-Manager Real Assets Strategy Fund |
| ∎ | Growth and Income Strategy Portfolio |
| ∎ | Growth Strategy Portfolio |
| ∎ | Dynamic Global Equity Fund |
| ∎ | Enhanced Dividend Global Equity Portfolio |
| ∎ | Tax-Advantaged Global Equity Portfolio |
| ∎ | Strategic Factor Allocation Fund |
| ∎ | Strategic Volatility Premium Fund |
| ∎ | Goldman Sachs GQG Partners International Opportunities Fund |
| | 1 | You could lose money by investing in the Fund. Although the Fund seeks to preserve the value of your investment at $1.00 per share, it cannot guarantee it will do so. An investment in the Fund is not a bank account or a deposit of a bank and is not insured or guaranteed by the Federal Deposit Insurance Corporation or any other government agency. The Fund’s sponsor is not required to reimburse the Fund for losses, and you should not expect that the sponsor will provide financial support to the Fund at any time, including during periods of market stress. |
| | 2 | You could lose money by investing in the Fund. Because the share price of the Fund will fluctuate, when you sell your shares they may be worth more or less than what you originally paid for them. The Fund may impose a fee upon sale of your shares. Effective October 2, 2024, the Fund generally must impose a fee when net sales of Fund shares exceed certain levels. An investment in the Fund is not a bank account or a deposit of a bank and is not insured or guaranteed by the Federal Deposit Insurance Corporation or any other government agency. The Fund’s sponsor is not required to reimburse the Fund for losses, and you should not expect that the sponsor will provide financial support to the Fund at any time, including during periods of market stress. |
| | 3 | You could lose money by investing in the Fund. Although the Fund seeks to preserve the value of your investment at $1.00 per share, it cannot guarantee it will do so. The Fund may impose a fee upon sale of your shares. An investment in the Fund is not a bank account or a deposit of a bank and is not insured or guaranteed by the Federal Deposit Insurance Corporation or any other government agency. The Fund’s sponsor is not required to reimburse the Fund for losses, and you should not expect that the sponsor will provide financial support to the Fund at any time, including during periods of market stress. |
| | 4 | Effective after the close of business on April 17, 2024, the Goldman Sachs Long Short Credit Strategies Fund was renamed the Goldman Sachs Short Duration High Yield Fund. |
| | 5 | Effective after the close of business on February 13, 2024, the Goldman Sachs Flexible Cap Fund was renamed the Goldman Sachs Enhanced Core Equity Fund. |
| | 6 | Effective after the close of business on June 17, 2024, the Goldman Sachs Strategic Income Fund was renamed the Goldman Sachs Dynamic Bond Fund. |
| | | Financial Square FundsSM and Investor FundsSM are registered service marks of Goldman Sachs & Co. LLC. |
| | * | This list covers open-end funds only. Please visit our website at www.GSAMFUNDS.com to learn more about our closed-end funds and exchange-traded funds. |
TRUSTEES OFFICERS Gregory G. Weaver, Chair James A. McNamara, President Cheryl K. Beebe Joseph F. DiMaria, Principal Financial Officer, Principal Dwight L. Bush Accounting Officer and Treasurer Kathryn A. Cassidy Robert Griffith, Secretary John G. Chou Joaquin Delgado Eileen H. Dowling Lawrence Hughes John F. Killian Steven D. Krichmar Michael Latham James A. McNamara Lawrence W. Stranghoener Paul C. Wirth GOLDMAN SACHS & CO. LLC GOLDMAN SACHS ASSET MANAGEMENT, L.P. Distributor and Transfer Agent Investment Adviser Visit our website at www.GSAMFUNDS.com to obtain the most recent month-end returns. Goldman Sachs Asset Management, L.P. 200 West Street, New York, New York 10282 Neither MSCI nor any other party involved in or related to compiling, computing, or creating the MSCI data makes any express or implied warranties or representations with respect to such data (or the results to be obtained by the use thereof), and all such parties hereby expressly disclaim all warranties of originality, accuracy, completeness, merchantability, or fitness for a particular purpose with respect to any of such data. Without limiting any of the foregoing, in no event shall MSCI, any of its affiliates or any third party involved in or related to compiling, computing or creating the data have any liability for any direct, indirect, special, punitive, consequential or any other damages (including lost profits) even if notified of the possibility of such damages. No further distribution or dissemination of the MSCI data is permitted without MSCI’s express written consent. The reports concerning the Fund included in this shareholder report may contain certain forward-looking statements about the factors that may affect the performance of the Fund in the future. These statements are based on Fund management’s predictions and expectations concerning certain future events and their expected impact on the Fund, such as performance of the economy as a whole and of specific industry sectors, changes in the levels of interest rates, the impact of developing world events, and other factors that may influence the future performance of the Fund. Management believes these forward-looking statements to be reasonable, although they are inherently uncertain and difficult to predict. Actual events may cause adjustments in portfolio management strategies from those currently expected to be employed. A description of the policies and procedures that the Fund uses to determine how to vote proxies relating to portfolio securities and information regarding how the Fund voted proxies relating to portfolio securities during the most recent 12-month period ended June 30 is available (I) without charge, upon request by calling 1-800-526-7384 (for Retail Shareholders) or 1-800-621-2550 (for Institutional Shareholders); and (II) on the Securities and Exchange Commission (“SEC”) web site at http://www.sec.gov. The Fund will file its portfolio holdings for each month in a fiscal quarter within 60 days after the end of the relevant fiscal quarter on Form N-PORT. Portfolio holdings information for the third month of each fiscal quarter will be made available on the SEC’s web site at http://www.sec.gov. Portfolio holdings information may be obtained upon request and without charge by calling 1-800-526-7384 (for Retail Shareholders) or 1-800-621-2550 (for Institutional Shareholders). Fund holdings and allocations shown are unaudited, and may not be representative of current or future investments. Fund holdings and allocations may not include the Fund’s entire investment portfolio, which may change at any time. Fund holdings should not be relied on in making investment decisions and should not be construed as research or investment advice regarding particular securities. Current and future holdings are subject to risk. Economic and market forecasts presented herein reflect our judgment as of the date of this presentation and are subject to change without notice. These forecasts do not take into account the specific investment objectives, restrictions, tax and financial situation or other needs of any specific client. Actual data will vary and may not be reflected here. These forecasts are subject to high levels of uncertainty that may affect actual performance. Accordingly, these forecasts should be viewed as merely representative of a broad range of possible outcomes. These forecasts are estimated, based on assumptions, and are subject to significant revision and may change materially as economic and market conditions change. Goldman Sachs has no obligation to provide updates or changes to these forecasts. Case studies and examples are for illustrative purposes only. The portfolio risk management process includes an effort to monitor and manage risk, but does not imply low risk. Past correlations are not indicative of future correlations, which may vary. This material is not authorized for distribution to prospective investors unless preceded or accompanied by a current Prospectus or summary prospectus, if applicable. Investors should consider the Fund objective, risks, and charges and expenses, and read the summary prospectus, if available, and/or the Prospectus carefully before investing or sending money. The summary prospectus, if available, and the Prospectus contain this and other information about the Fund and may be obtained from your authorized dealer or from Goldman Sachs & Co. LLC by calling (retail – 1-800-526-7384) (institutional – 1-800-621-2550). 2024 Goldman Sachs. All rights reserved. 374637-OTU-2051989 MMALTSAR 24
Goldman Sachs FundsSemi-Annual Report April 30, 2024Strategic Multi-Asset Class FundsGoldman Sachs Multi-Manager Global Equity FundGoldman Sachs Multi-Manager Non-Core Fixed Income FundGoldman Sachs Multi-Manager Real Assets Strategy Fund
Strategic Multi-Asset Class Funds
| | |
| ∎ | | GOLDMAN SACHS MULTI-MANAGER GLOBAL EQUITY FUND |
| | |
| ∎ | | GOLDMAN SACHS MULTI-MANAGER NON-CORE FIXED INCOME FUND |
| | |
| ∎ | | GOLDMAN SACHS MULTI-MANAGER REAL ASSETS STRATEGY FUND |
TABLE OF CONTENTS
Effective January 24, 2023, open-end mutual funds and exchange-traded funds are required to provide shareholders with streamlined annual and semi-annual shareholder reports (“Tailored Shareholder Reports”). Funds will be required to prepare a separate Tailored Shareholder Report for each share class of a fund that highlights key information to investors. Other information, including financial statements, will no longer appear in a fund’s shareholder report, but will be available online, delivered free of charge upon request, and filed with the Securities and Exchange Commission on a semi-annual basis on Form N-CSR. The new requirements have a compliance date of July 24, 2024.
| | | | | | |
| | | | |
| NOT FDIC-INSURED | | May Lose Value | | No Bank Guarantee | | |
MARKET REVIEW
Goldman Sachs Strategic Multi-Asset Class Funds
The following are highlights both of key factors affecting the global equity, credit and real assets markets and of any key changes made to the Goldman Sachs Strategic Multi-Asset Class Funds (the “Funds”) during the six months ended April 30, 2024 (the “Reporting Period”). A streamlined annual shareholder report covering the 12 months ended October 31, 2024 will be provided to Fund shareholders, per new Securities and Exchange Commission (“SEC”) requirements with a compliance date of July 24, 2024.
Market and Economic Review
Global Equity Markets
| ∎ | The broad global equity market, as represented by the MSCI* All Country World Index (“MSCI ACWI”) Investable Market Index, returned 19.64% during the Reporting Period. |
| ∎ | When the Reporting Period began in November 2023, global equities were in the midst of a rally. |
| | ∎ | The rally, which had started in late October 2023, followed a period of considerable volatility, as market participants weighed the probabilities for various U.S. economic scenarios, ranging from a “soft landing” to a “hard landing” to stagflation.1 |
| | ∎ | Late October 2023 marked a turning point in market sentiment, as the soft landing narrative became dominant. Investors appeared to believe the U.S. Federal Reserve (“Fed”) would not hike interest rates again, and they started pricing in interest rate cuts for 2024. (The Fed had last raised the target federal funds rate in July 2023.) |
| ∎ | Global equities continued to rally through the end of March 2024, delivering strong positive returns. |
| ∎ | In April 2024, the global equity market gave back some of its gains, as persistent inflation led investors to scale back their expectations for the number of potential Fed rate cuts. |
| ∎ | From a style perspective, growth stocks and value stocks generated positive returns during the Reporting Period overall, with growth stocks outpacing their value counterparts. |
| ∎ | From a regional perspective, developed markets equities and emerging markets equities produced gains, with developed markets equities outperforming emerging markets equities. |
| | ∎ | Within developed markets equities, the Japanese stock market was a particularly strong performer amid investor optimism about corporate governance reforms and potential changes to the Bank of Japan’s monetary policy. |
| | ∎ | Within emerging markets equities, China was the weakest performer due to that country’s economic challenges, including an ongoing property crisis and weak consumer sentiment. |
Credit Markets
| ∎ | Credit markets broadly advanced during the Reporting Period, as bond yields fell and credit spreads (or yield differentials versus duration-equivalent U.S. Treasury securities) tightened. |
| ∎ | In the first two months of the Reporting Period, bond yields plunged amidst speculation the Fed had reached the peak of its interest rate hikes and would begin cutting rates in 2024. |
| ∎ | Bond yields rose during the last four months of the Reporting Period, as markets came to terms with the possibility that interest rates could remain higher for longer. |
| | ∎ | Also, due to persistent inflation, investors had moderated their expectations for Fed rate cuts in 2024, which contributed further to the rise in yields. |
| | ∎ | Credit spreads continued to tighten as a result of strong demand and a drop in supply, especially net new supply. |
| 1 | A soft landing, in economics, is a cyclical downturn that avoids recession. It typically describes attempts by central banks to raise interest rates just enough to stop an economy from overheating and experiencing high inflation, without causing a significant increase in unemployment, or a hard landing. Stagflation is characterized by slow economic growth and high inflation. |
MARKET REVIEW
| ∎ | High yield corporate bonds and bank loans delivered strong performance during the Reporting Period overall, with high yield corporate bonds outpacing bank loans. |
| | ∎ | The outperformance of high yield corporate bonds was driven largely by spread tightening and their comparatively longer duration. (Duration is a measure of a security’s sensitivity to changes in interest rates.) |
| | ∎ | The default rate for bank loans and high yield corporate bonds increased modestly during the Reporting Period but remained below long-term averages. |
| ∎ | Investment grade corporate bonds also benefited from their longer duration profile, though they underperformed high yield corporate bonds during the Reporting Period overall. |
| | ∎ | As yields fell in the first two months of the Reporting Period, investment grade corporate bonds outperformed high yield corporate bonds. However, they lagged during the last four months of the Reporting Period when yields moved higher. |
| | ∎ | Among market segments, financial and industrial investment grade corporate bonds performed best, while utilities turned in the weakest performance. |
| ∎ | U.S. dollar-denominated emerging markets debt was the strongest performing credit sector of the Reporting Period, benefiting from spread compression across the credit spectrum and strong gains among the lowest rated credits. |
| | ∎ | Local currency-denominated bonds generally underperformed other credit sectors during the Reporting Period, largely because of a strong U.S. dollar and higher-for-longer central bank policy that anchored interest rates above market expectations. |
Real Assets
| ∎ | Global real estate securities and global infrastructure securities posted positive returns during the Reporting Period overall, but both market segments underperformed the broader global equity market. Global real estate securities outpaced global infrastructure securities. |
| ∎ | Interest rates were the key driver of performance for both real asset classes. |
| | ∎ | In November and December 2023, global real estate securities and global infrastructure securities delivered gains, as yields fell on the prospect the Fed would cut interest rates due to softening inflation. |
| | ∎ | Performance turned negative, however, during the first four months of 2024 when yields rose. |
| ∎ | In the global real estate market, the Reporting Period saw a rebound in the performance of property types that had been out of favor for most of the 2023 calendar year. |
| | ∎ | Among the property types that performed best were those that tended to be more economically sensitive, including hotel real estate investment trusts (“REITs”), retail REITs, office REITs and real estate operating companies. (Real estate operating companies are comprised mainly of non-U.S. real estate and developers). |
| | ∎ | Notable laggards were more growth-oriented property types, such as industrial REITs and data center REITs, and to a smaller degree, health care REITs and single-family residential REITs. |
| | ∎ | Regionally, performance was strongest in Europe and the U.K. and weakest in Asia ex-Japan. |
| | ∎ | Europe’s avoidance of an economic hard landing, coupled with declining yields, benefited property types that were more economically sensitive, were more leveraged and had longer lease durations. |
| | ∎ | In Asia ex-Japan, Australian property types performed strongly, while Hong Kong property types lagged significantly due to China’s continued economic weakness and general weakness among developers. Singapore property types also underperformed, though to a lesser degree. |
MARKET REVIEW
| ∎ | In the global infrastructure market, positive performance was driven mainly by cyclically-oriented businesses, specifically those in transportation and midstream2 energy. |
| | ∎ | Transportation infrastructure, notably airports and toll roads, broadly advanced on positive traffic volumes and on the recovery to pre-pandemic levels of air travel in Latin America and Europe. |
| | ∎ | Midstream energy companies benefited as higher oil prices increased the prospect of greater pipeline volumes and as liquefied natural gas exports remained a key growth opportunity. |
| | ∎ | The weakest performing infrastructure securities during the Reporting Period were those sensitive to interest rates, specifically utilities and cell tower REITs. |
| ∎ | Regionally, performance was strongest in Europe, mainly because of its large number of transportation infrastructure companies. North America provided mixed results, with weakness among utilities and strength among midstream energy companies. Emerging markets infrastructure securities were up sharply due to a recovery among Mexican airports. |
Fund Changes and Highlights
No material changes were made to the Funds during the Reporting Period.
| 2 | The midstream component of the energy industry is usually defined as those companies providing products or services that help link the supply side (i.e., energy producers) and the demand side (i.e., energy end-users) for any type of energy commodity. Such midstream businesses can include, but are not limited to, those that process, store, market and transport various energy commodities. |
FUND BASICS
Goldman Sachs Multi-Manager Global Equity Fund
as of April 30, 2024
| | | | |
| | | Fund Total | | MSCI ACWI IMI |
| | | Return | | (Net, USD, 50% Non-U.S. |
| | |
November 1, 2023–April 30, 2024 | | (based on NAV)1 | | Developed Hedged to USD)2 |
| | |
Class R6 Shares | | 19.07% | | 19.83% |
| | 1 | The net asset value (“NAV”) represents the net assets of the class of the Fund (ex-dividend) divided by the total number of shares of the class outstanding. The Fund’s performance assumes the reinvestment of dividends and other distributions. The Fund’s performance does not reflect the deduction of any applicable sales charges. |
| | 2 | The MSCI ACWI IMI (Net, USD, 50% Non-U.S. Developed Hedged to USD) is a custom index that comprises the MSCI ACWI IMI (which covers 9,022 securities and includes large, mid, small and micro cap size segments for all developed markets countries in the index together with large, mid and small cap size segments for the emerging markets countries) and a currency hedge on 50% of the non-U.S. developed markets exposures back to U.S. dollars. As of April 30, 2024, the 23 developed markets in the MSCI ACWI IMI include Australia, Austria, Belgium, Canada, Denmark, Finland, France, Germany, Hong Kong, Ireland, Israel, Italy, Japan, Netherlands, New Zealand, Norway, Portugal, Singapore, Spain, Sweden, Switzerland, the U.K. and the U.S. The 24 emerging markets include Brazil, Chile, China, Colombia, Czech Republic, Egypt, Greece, Hungary, India, Indonesia, Korea, Kuwait, Malaysia, Mexico, Peru, Philippines, Poland, Qatar, Saudi Arabia, South Africa, Taiwan, Thailand, Turkey and United Arab Emirates. The Index figures do not reflect any deductions for fees or expenses. It is not possible to invest directly in an index. |
| | | The returns set forth in the table above represent past performance. Past performance does not guarantee future results. The Fund’s investment return and principal value will fluctuate so that an investor’s shares, when redeemed, may be worth more or less than their original cost. Current performance may be lower or higher than the performance quoted above. Please visit our web site at www.GSAMFUNDS.com to obtain the most recent month-end returns. Performance reflects applicable fee waivers and/or expense limitations in effect during the periods shown. In their absence, performance would be reduced. Returns do not reflect the deduction of taxes that a shareholder would pay on Fund distributions or the redemption of Fund shares. |
|
|
TOP TEN HOLDINGS AS OF 4/30/24‡ |
| | | | |
| | |
Holding | | % of Net Assets | | Line of Business |
| | |
Microsoft Corp. | | 3.1% | | Software |
| | |
Amazon.com, Inc. | | 2.3 | | Broadline Retail |
| | |
Alphabet, Inc. | | 2.2 | | Interactive Media & Services |
| | |
NVIDIA Corp. | | 2.2 | | Semiconductors & Semiconductor Equipment |
| | |
Union Pacific Corp. | | 1.1 | | Ground Transportation |
| | |
JPMorgan Chase & Co. | | 1.0 | | Banks |
| | |
Berkshire Hathaway, Inc. | | 1.0 | | Financial Services |
| | |
Monolithic Power Systems, Inc. | | 1.0 | | Semiconductors & Semiconductor Equipment |
| | |
Danaher Corp. | | 0.9 | | Life Sciences Tools & Services |
| | |
Taiwan Semiconductor Manufacturing Co. Ltd. | | 0.9 | | Semiconductors & Semiconductor Equipment |
| | ‡ | The top 10 holdings may not be representative of the Fund’s future investments. The Fund’s overall top 10 holdings differ from the table above due to the exclusion of the Goldman Sachs Financial Square Government Fund, which represents approximately 7.6% of the Fund’s net assets as of 4/30/24. |
FUND BASICS
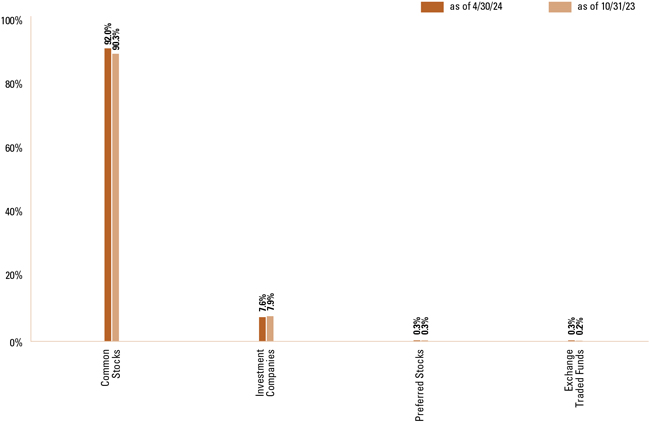
| | * | The percentage shown for each investment category reflects the value of investments in that category as a percentage of net assets. Underlying compositions of exchange traded funds and investment companies held by the Fund are not reflected in the graph above. Figures in the graph may not sum to 100% due to the rounding and/or exclusion of other assets and liabilities. The graph depicts the Fund’s investments but may not represent the Fund’s market exposure due to the exclusion of certain derivatives, if any, as listed in the Additional Investment Information section of the Schedule of Investments. |
| | | For more information about the Fund, please refer to www.GSAMFUNDS.com. There, you can learn more about the Fund’s investment strategies, holdings, and performance. |
FUND BASICS
Goldman Sachs Multi-Manager Non-Core Fixed Income Fund
as of April 30, 2024
| | | | | | | | | | | | |
| | | | | | |
November 1, 2023–April 30, 2024 | | Fund Total
Return
(based on NAV)1 | | Multi-
Manager
Non-Core
Fixed
Income
Composite
Dynamic
Index2 | | Bloomberg
Global
High Yield
Corporate
Index
(Gross,
USD,
Unhedged) | | Credit
Suisse
Leveraged
Loan Index
(Gross,
USD,
Unhedged) | | J.P.
Morgan
EMBISM
Global
Diversified
Index
(Gross,
USD,
Unhedged) | | J.P.
Morgan
GBI-EMSM
Global
Diversified
Index
(Gross,
USD,
Unhedged) |
| | | | | | |
Class R6 Shares | | 6.91% | | 7.02% | | 9.24% | | 6.13% | | 10.57% | | 4.07% |
| | 1 | The net asset value (“NAV”) represents the net assets of the class of the Fund (ex-dividend) divided by the total number of shares of the class outstanding. The Fund’s performance assumes the reinvestment of dividends and other distributions. The Fund’s performance does not reflect the deduction of any applicable sales charges. |
| | 2 | The Multi-Manager Non-Core Fixed Income Composite Dynamic Index is comprised of the Bloomberg Global High Yield Corporate Index (Gross, USD, Unhedged), the Credit Suisse Leveraged Loan Index (Gross, USD, Unhedged), the J.P. Morgan Emerging Market Bond Index (EMBISM) Global Diversified Index (Gross, USD, Unhedged) and the J.P. Morgan Government Bond Index — Emerging Markets (GBI-EMSM) Global Diversified Index (Gross, USD, Unhedged). The index figures do not reflect any deductions for fees, expenses or taxes. It is not possible to invest directly in an index. |
| | | The returns set forth in the table above represent past performance. Past performance does not guarantee future results. The Fund’s investment return and principal value will fluctuate so that an investor’s shares, when redeemed, may be worth more or less than their original cost. Current performance may be lower or higher than the performance quoted above. Please visit our web site at www.GSAMFUNDS.com to obtain the most recent month-end returns. Performance reflects applicable fee waivers and/or expense limitations in effect during the periods shown. In their absence, performance would be reduced. Returns do not reflect the deduction of taxes that a shareholder would pay on Fund distributions or the redemption of Fund shares. |
|
|
TOP TEN HOLDINGS AS OF 4/30/24‡ |
| | | | | | | | |
| | | | |
Holding | | Coupon Rate | | Maturity Date | | % of Net Assets | | Line of Business |
| | | | |
Brazil Notas do Tesouro Nacional | | 10.000 | | 01/01/2031 | | 1.3% | | Sovereign Debt Obligations |
| | | | |
Brazil Notas do Tesouro Nacional | | 10.000 | | 01/01/2029 | | 1.1 | | Sovereign Debt Obligations |
| | | | |
Brazil Notas do Tesouro Nacional | | 10.000 | | 01/01/2027 | | 1.0 | | Sovereign Debt Obligations |
| | | | |
India Government Bonds | | 7.180 | | 08/14/2033 | | 0.8 | | Sovereign Debt Obligations |
| | | | |
Indonesia Treasury Bonds | | 6.625 | | 02/15/2034 | | 0.8 | | Sovereign Debt Obligations |
| | | | |
Brazil Notas do Tesouro Nacional | | 10.000 | | 01/01/2025 | | 0.8 | | Sovereign Debt Obligations |
| | | | |
Republic of South Africa Government Bonds | | 8.750 | | 01/31/2044 | | 0.6 | | Sovereign Debt Obligations |
| | | | |
UKG, Inc. | | 8.814 | | 02/10/2031 | | 0.6 | | Bank Loans |
| | | | |
AssuredPartners, Inc. | | 0.000 | | 02/14/2031 | | 0.6 | | Bank Loans |
| | | | |
Romania Government Bonds | | 6.700 | | 02/25/2032 | | 0.6 | | Sovereign Debt Obligations |
| | ‡ | The top 10 holdings may not be representative of the Fund’s future investments. The Fund’s overall top 10 holdings differ from the table above due to the exclusion of the Goldman Sachs Financial Square Government Fund, which represents approximately 8.4% of the Fund’s net assets as of 4/30/24. |
FUND BASICS
Performance Summary
April 30, 2024
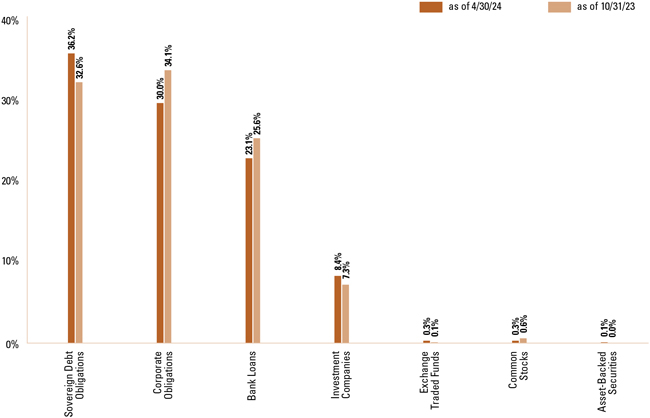
| | * | The percentage shown for each investment category reflects the value of investments in that category as a percentage of net assets. Underlying compositions of exchange traded funds and investment companies held by the Fund are not reflected in the graph above. Figures in the graph may not sum to 100% due to the rounding and/or exclusion of other assets and liabilities. The graph depicts the Fund’s investments but may not represent the Fund’s market exposure due to the exclusion of certain derivatives, if any, as listed in the Additional Investment Information section of the Schedule of Investments. |
| | | For more information about the Fund, please refer to www.GSAMFUNDS.com. There, you can learn more about the Fund’s investment strategies, holdings, and performance. |
FUND BASICS
Goldman Sachs Multi-Manager Real Assets Strategy Fund
as of April 30, 2024
| | | | | | | | |
| | | | |
November 1, 2023–April 30, 2024 | | Fund Total
Return
(based on NAV)1 | | Multi-Manager
Real Assets
Strategy
Composite
Dynamic
Index2 | | FTSE EPRA/NAREIT Developed Index
(Net, USD,
Unhedged) | | Dow Jones Brookfield
Global Infrastructure
Index (Net, USD,
Unhedged) |
| | | | |
Class R6 Shares | | 11.15% | | 10.99% | | 12.47% | | 9.10% |
| | 1 | The net asset value (“NAV”) represents the net assets of the class of the Fund (ex-dividend) divided by the total number of shares of the class outstanding. The Fund’s performance assumes the reinvestment of dividends and other distributions. The Fund’s performance does not reflect the deduction of any applicable sales charges. |
| | 2 | The Multi-Manager Real Assets Strategy Composite Dynamic Index is comprised of the FTSE EPRA/NAREIT Developed Index (Net, USD, Unhedged) and the Dow Jones Brookfield Global Infrastructure Index (Net, USD, Unhedged). The constituent indexes of the Multi-Manager Real Assets Strategy Composite Dynamic Index are weighted in accordance with the relative market capitalizations of each constituent index (as determined by the constituent index providers) as of the last business day of the previous calendar year. The index figures do not reflect any deductions for fees, expenses or taxes. It is not possible to invest directly in an index. |
| | | The returns set forth in the table above represent past performance. Past performance does not guarantee future results. The Fund’s investment return and principal value will fluctuate so that an investor’s shares, when redeemed, may be worth more or less than their original cost. Current performance may be lower or higher than the performance quoted above. Please visit our web site at www.GSAMFUNDS.com to obtain the most recent month-end returns. Performance reflects applicable fee waivers and/or expense limitations in effect during the periods shown. In their absence, performance would be reduced. Returns do not reflect the deduction of taxes that a shareholder would pay on Fund distributions or the redemption of Fund shares. |
|
|
TOP TEN HOLDINGS AS OF 4/30/24‡ |
| | | | |
| | |
Holding | | % of Net Assets | | Line of Business |
| | |
American Tower Corp. | | 3.6% | | Specialized REITs |
Prologis, Inc. | | 2.7 | | Industrial REITs |
Welltower, Inc. | | 2.5 | | Health Care REITs |
Equinix, Inc. | | 2.4 | | Specialized REITs |
National Grid PLC | | 2.4 | | Multi-Utilities |
PG&E Corp. | | 2.0 | | Electric Utilities |
Enbridge, Inc. | | 1.9 | | Oil, Gas & Consumable Fuels |
Vinci SA | | 1.9 | | Construction & Engineering |
Sempra | | 1.9 | | Multi-Utilities |
ONEOK, Inc. | | 1.6 | | Oil, Gas & Consumable Fuels |
| | ‡ | The top 10 holdings may not be representative of the Fund’s future investments. The Fund’s overall top 10 holdings differ from the table above due to the exclusion of the Goldman Sachs Financial Square Government Fund, which represents approximately 2.6% of the Fund’s net assets as of 4/30/24. |
FUND BASICS
Performance Summary
April 30, 2024
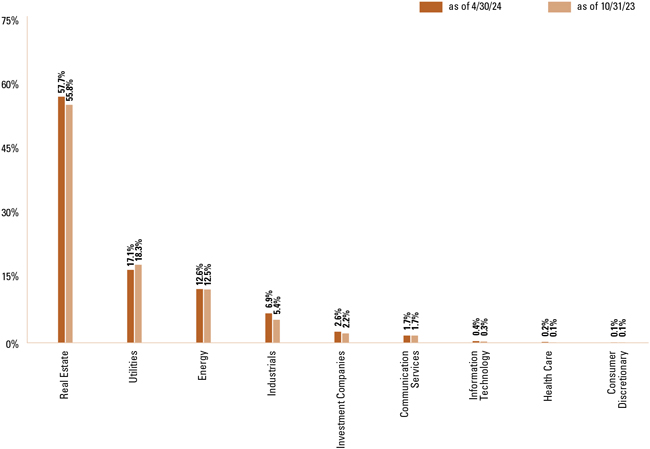
| | † | The Fund is actively managed and, as such, its composition may differ over time. Consequently, the Fund’s overall sector allocations may differ from the percentages contained in the graph above. The graph categorizes investments using the Global Industry Classification Standard (“GICS”); however, the sector classifications used by the portfolio management team may differ from GICS. The percentage shown for each investment category reflects the value of investments in that category as a percentage of market value (excluding investments in the securities lending reinvestment vehicle, if any). The graph depicts the Fund’s investments but may not represent the Fund’s market exposure due to the exclusion of certain derivatives, if any, as listed in the Additional Investment Information section of the Schedule of Investments. Figures in the graph may not sum to 100% due to rounding and/or the exclusion of other assets and liabilities. |
| | | For more information about the Fund, please refer to www.GSAMFUNDS.com. There, you can learn more about the Fund’s investment strategies, holdings, and performance. |
GOLDMAN SACHS MULTI-MANAGER GLOBAL EQUITY FUND
|
Schedule of Investments April 30, 2024 (Unaudited) |
| | | | | | | | |
| | | Shares | | Description | | Value | |
| |
| | Common Stocks – 92.0% | |
| |
| | Australia – 0.2% | |
| | 7,569 | | Ampol Ltd. (Oil, Gas & Consumable Fuels) | | $ | 178,733 | |
| | 8,949 | | AUB Group Ltd. (Insurance) | | | 162,302 | |
| | 153,312 | | Bellevue Gold Ltd.* (Metals & Mining) | | | 173,226 | |
| | 193,443 | | De Grey Mining Ltd.* (Metals & Mining) | | | 160,977 | |
| | 40,707 | | Deterra Royalties Ltd. (Metals & Mining) | | | 128,854 | |
| | 19,665 | | Eagers Automotive Ltd. (Specialty Retail) | | | 158,414 | |
| | 17,774 | | Flight Centre Travel Group Ltd. (Hotels, Restaurants & Leisure) | | | 241,585 | |
| | 29,777 | | GrainCorp Ltd. Class A (Consumer Staples Distribution & Retail) | | | 163,614 | |
| | 144,991 | | HomeCo Daily Needs REIT (Retail REITs) | | | 113,678 | |
| | 134,803 | | Mirvac Group (Diversified REITs) | | | 176,628 | |
| | 88,249 | | Orora Ltd. (Containers & Packaging) | | | 123,698 | |
| | 2,811 | | Pro Medicus Ltd. (Health Care Technology) | | | 200,832 | |
| | 9,281 | | Seven Group Holdings Ltd. (Trading Companies & Distributors) | | | 225,520 | |
| | 105,529 | | Ventia Services Group Pty. Ltd. (Construction & Engineering) | | | 245,603 | |
| | | | | | | | |
| | | | | | | 2,453,664 | |
| | | |
| |
| | Austria – 0.1% | |
| | 3,481 | | ANDRITZ AG (Machinery) | | | 190,005 | |
| | 5,227 | | BAWAG Group AG(a) (Banks) | | | 312,108 | |
| | 5,392 | | Erste Group Bank AG (Banks) | | | 251,457 | |
| | 7,273 | | Wienerberger AG (Construction Materials) | | | 259,903 | |
| | | | | | | | |
| | | | | | | 1,013,473 | |
| | | |
| |
| | Belgium – 0.2% | |
| | 26,215 | | Anheuser-Busch InBev SA (Beverages) | | | 1,566,970 | |
| | 8,719 | | KBC Group NV (Banks) | | | 647,683 | |
| | 6,407 | | Warehouses De Pauw CVA (Industrial REITs) | | | 169,429 | |
| | | | | | | | |
| | | | | | | 2,384,082 | |
| | | |
| |
| | Bermuda – 0.3% | |
| | 20,320 | | Arch Capital Group Ltd.* (Insurance) | | | 1,900,733 | |
| | 3,603 | | Assured Guaranty Ltd. (Insurance) | | | 276,350 | |
| | 5,691 | | Axis Capital Holdings Ltd. (Insurance) | | | 349,029 | |
| | 3,699 | | Seadrill Ltd.* (Energy Equipment & Services) | | | 179,586 | |
| | | | | | | | |
| | | | | | | 2,705,698 | |
| | | |
| | | | | | | | |
| | | Shares | | Description | | Value | |
| |
| | Common Stocks (continued) | |
| |
| | Brazil – 0.6% | |
| | 14,450 | | Ambev SA (Beverages) | | $ | 33,811 | |
| | 123,697 | | Banco Bradesco SA (Banks) | | | 333,982 | |
| | 79,450 | | Banco BTG Pactual SA (Capital Markets) | | | 511,041 | |
| | 113,400 | | Banco do Brasil SA (Banks) | | | 598,819 | |
| | 18,350 | | BRF SA* (Food Products) | | | 59,652 | |
| | 36,600 | | Caixa Seguridade Participacoes SA (Insurance) | | | 110,379 | |
| | 132,950 | | Embraer SA* (Aerospace & Defense) | | | 853,885 | |
| | 11,250 | | Enauta Participacoes SA (Oil, Gas & Consumable Fuels) | | | 59,190 | |
| | 27,200 | | Localiza Rent a Car SA (Ground Transportation) | | | 256,830 | |
| | 203,960 | | NU Holdings Ltd. Class A* (Banks) | | | 2,215,006 | |
| | 28,100 | | Raia Drogasil SA (Consumer Staples Distribution & Retail) | | | 138,427 | |
| | 42,250 | | Telefonica Brasil SA (Diversified Telecommunication Services) | | | 385,186 | |
| | 128,600 | | TIM SA (Wireless Telecommunication Services) | | | 436,129 | |
| | 33,600 | | TOTVS SA (Software) | | | 178,204 | |
| | 48,000 | | WEG SA (Electrical Equipment) | | | 365,597 | |
| | 9,050 | | XP, Inc. Class A (Capital Markets) | | | 185,254 | |
| | | | | | | | |
| | | | | | | 6,721,392 | |
| | | |
| |
| | Canada – 1.6% | |
| | 18,500 | | Alamos Gold, Inc. Class A (Metals & Mining) | | | 272,128 | |
| | 13,500 | | ARC Resources Ltd. (Oil, Gas & Consumable Fuels) | | | 244,474 | |
| | 4,000 | | ATS Corp.* (Machinery) | | | 131,595 | |
| | 2,760 | | BRP, Inc. (Leisure Products) | | | 185,691 | |
| | 5,450 | | Canadian Apartment Properties REIT (Residential REITs) | | | 169,638 | |
| | 10,718 | | Canadian National Railway Co. (Ground Transportation) | | | 1,301,594 | |
| | 17,910 | | Canadian Natural Resources Ltd. (Oil, Gas & Consumable Fuels) | | | 1,357,187 | |
| | 57,009 | | Canadian Pacific Kansas City Ltd. (Ground Transportation) | | | 4,471,587 | |
| | 8,180 | | Capital Power Corp. (Independent Power and Renewable Electricity Producers) | | | 213,495 | |
| | 28,700 | | Capstone Copper Corp.* (Metals & Mining) | | | 198,679 | |
| | 5,360 | | Celestica, Inc.* (Electronic Equipment, Instruments & Components) | | | 232,092 | |
| | 37,800 | | Crescent Point Energy Corp. (Oil, Gas & Consumable Fuels) | | | 333,340 | |
| | 9,349 | | Descartes Systems Group, Inc.* (Software) | | | 867,420 | |
| | 12,200 | | Element Fleet Management Corp. (Commerical Services & Supplies) | | | 194,700 | |
| | | |
| | |
| 10 | | The accompanying notes are an integral part of these financial statements. |
GOLDMAN SACHS MULTI-MANAGER GLOBAL EQUITY FUND
| | | | | | | | |
| | | Shares | | Description | | Value | |
| |
| | Common Stocks (continued) | |
| |
| | Canada (continued) | |
| | 5,850 | | Empire Co. Ltd. Class A (Consumer Staples Distribution & Retail) | | $ | 136,280 | |
| | 13,120 | | Filo Corp.* (Metals & Mining) | | | 235,114 | |
| | 6,510 | | Gildan Activewear, Inc. (Textiles, Apparel & Luxury Goods) | | | 225,662 | |
| | 4,544 | | Intact Financial Corp. (Insurance) | | | 746,864 | |
| | 9,450 | | Interfor Corp.* (Paper & Forest Products) | | | 119,923 | |
| | 8,400 | | Keyera Corp. (Oil, Gas & Consumable Fuels) | | | 215,514 | |
| | 2,538 | | Methanex Corp. (Chemicals) | | | 121,596 | |
| | 17,200 | | Osisko Gold Royalties Ltd. (Metals & Mining) | | | 264,250 | |
| | 8,300 | | Quebecor, Inc. Class B (Diversified Telecommunication Services) | | | 171,770 | |
| | 17,844 | | Shopify, Inc. Class A* (IT Services) | | | 1,252,649 | |
| | 2,970 | | Stantec, Inc. (Construction & Engineering) | | | 236,474 | |
| | 25,063 | | Suncor Energy, Inc. (Oil, Gas & Consumable Fuels) | | | 956,350 | |
| | 9,060 | | Thomson Reuters Corp. (Professional Services) | | | 1,368,427 | |
| | 1,947 | | Toromont Industries Ltd. (Trading Companies & Distributors) | | | 178,202 | |
| | 16,907 | | Toronto-Dominion Bank (Banks) | | | 1,003,011 | |
| | | | | | | | |
| | | | | | | 17,405,706 | |
| | | |
| |
| | Cayman Islands* – 0.0% | |
| | 10,616 | | Legend Biotech Corp. (Biotechnology) | | | 464,344 | |
| | | |
| |
| | Chile – 0.0% | |
| | 54,828 | | Cencosud SA (Consumer Staples Distribution & Retail) | | | 93,951 | |
| | 10,558,250 | | Latam Airlines Group SA* (Passenger Airlines) | | | 142,859 | |
| | | | | | | | |
| | | | | | | 236,810 | |
| | | |
| |
| | China – 2.6% | |
| | 14,950 | | AAC Technologies Holdings, Inc. (Electronic Equipment, Instruments & Components) | | | 47,580 | |
| | 1,137,450 | | Agricultural Bank of China Ltd. Class H (Banks) | | | 507,201 | |
| | 174,250 | | Alibaba Group Holding Ltd. (Broadline Retail) | | | 1,631,513 | |
| | 358,100 | | Aluminum Corp. of China Ltd. Class H (Metals & Mining) | | | 237,497 | |
| | 3,800 | | Anker Innovations Technology Co. Ltd. Class A (Technology Hardware, Storage & Peripherals) | | | 45,067 | |
| | 19,300 | | Avary Holding Shenzhen Co. Ltd. Class A (Electronic Equipment, Instruments & Components) | | | 63,917 | |
| | | |
| | | | | | | | |
| | | Shares | | Description | | Value | |
| |
| | Common Stocks (continued) | |
| |
| | China (continued) | |
| | 70,100 | | Baidu, Inc. Class A* (Interactive Media & Services) | | $ | 908,186 | |
| | 401,400 | | Baoshan Iron & Steel Co. Ltd. Class A (Metals & Mining) | | | 383,753 | |
| | 45,100 | | BYD Electronic International Co. Ltd. (Communications Equipment) | | | 151,932 | |
| | 1,380,111 | | China Cinda Asset Management Co. Ltd. Class H (Capital Markets) | | | 124,371 | |
| | 954,650 | | China CITIC Bank Corp. Ltd. Class H (Banks) | | | 558,502 | |
| | 471,000 | | China Construction Bank Corp. Class H (Banks) | | | 304,733 | |
| | 229,750 | | China Feihe Ltd.(a) (Food Products) | | | 125,642 | |
| | 28,600 | | China Mengniu Dairy Co. Ltd. (Food Products) | | | 59,244 | |
| | 551,600 | | China National Building Material Co. Ltd. Class H (Construction Materials) | | | 213,435 | |
| | 709,000 | | China Petroleum & Chemical Corp. Class H (Oil, Gas & Consumable Fuels) | | | 423,203 | |
| | 124,150 | | China Resources Land Ltd. (Real Estate Management & Development) | | | 446,423 | |
| | 193,000 | | China Resources Pharmaceutical Group Ltd.(a) (Pharmaceuticals) | | | 124,806 | |
| | 234,650 | | China Taiping Insurance Holdings Co. Ltd. (Insurance) | | | 214,544 | |
| | 195,900 | | CITIC Ltd. (Industrial Conglomerates) | | | 185,400 | |
| | 434,000 | | CSPC Pharmaceutical Group Ltd. (Pharmaceuticals) | | | 356,371 | |
| | 9,600 | | Eastroc Beverage Group Co. Ltd. Class A (Beverages) | | | 281,739 | |
| | 11,900 | | Empyrean Technology Co. Ltd. Class A (Software) | | | 128,098 | |
| | 278,150 | | Geely Automobile Holdings Ltd. (Automobiles) | | | 334,770 | |
| | 26,400 | | GoerTek, Inc. Class A (Electronic Equipment, Instruments & Components) | | | 57,227 | |
| | 62,700 | | Gree Electric Appliances, Inc. of Zhuhai Class A (Household Durables) | | | 363,127 | |
| | 38,300 | | GRG Banking Equipment Co. Ltd. Class A (Technology Hardware, Storage & Peripherals) | | | 62,657 | |
| | 228,000 | | Guotai Junan Securities Co. Ltd. Class A (Capital Markets) | | | 430,816 | |
| | 7,390 | | Hello Group, Inc. (Interactive Media & Services) | | | 43,084 | |
| | 21,600 | | Hoyuan Green Energy Co. Ltd. Class A (Semiconductors & Semiconductor Equipment) | | | 65,323 | |
| | | |
| | |
| The accompanying notes are an integral part of these financial statements. | | 11 |
GOLDMAN SACHS MULTI-MANAGER GLOBAL EQUITY FUND
|
Schedule of Investments (continued) April 30, 2024 (Unaudited) |
| | | | | | | | |
| | | Shares | | Description | | Value | |
| |
| | Common Stocks (continued) | |
| |
| | China (continued) | |
| | 61,300 | | Huatai Securities Co. Ltd. Class A (Capital Markets) | | $ | 115,730 | |
| | 3,415 | | Hwatsing Technology Co. Ltd. Class A (Semiconductors & Semiconductor Equipment) | | | 79,945 | |
| | 21,696 | | iQIYI, Inc.* (Entertainment) | | | 105,226 | |
| | 19,500 | | JA Solar Technology Co. Ltd. Class A* (Semiconductors & Semiconductor Equipment) | | | 38,176 | |
| | 74,800 | | JD.com, Inc. Class A (Broadline Retail) | | | 1,077,746 | |
| | 1,161 | | JOYY, Inc. (Interactive Media & Services) | | | 37,872 | |
| | 137,150 | | Kuaishou Technology*(a) (Interactive Media & Services) | | | 961,518 | |
| | 205,600 | | Lenovo Group Ltd. (Technology Hardware, Storage & Peripherals) | | | 231,251 | |
| | 19,050 | | Li Auto, Inc. Class A* (Automobiles) | | | 249,591 | |
| | 19,800 | | Li Ning Co. Ltd. (Textiles, Apparel & Luxury Goods) | | | 51,834 | |
| | 81,100 | | Lingyi iTech Guangdong Co. Class A (Electronic Equipment, Instruments & Components) | | | 57,897 | |
| | 2,800 | | Maxscend Microelectronics Co. Ltd. Class A (Electronic Equipment, Instruments & Components) | | | 34,827 | |
| | 8,500 | | NAURA Technology Group Co. Ltd. Class A (Semiconductors & Semiconductor Equipment) | | | 371,567 | |
| | 92,150 | | NetEase, Inc. (Entertainment) | | | 1,727,317 | |
| | 18,750 | | New Oriental Education & Technology Group, Inc.* (Diversified Consumer Services) | | | 480,926 | |
| | 6,940 | | PDD Holdings, Inc.* (Broadline Retail) | | | 868,749 | |
| | 725,350 | | People’s Insurance Co. Group of China Ltd. Class H (Insurance) | | | 238,078 | |
| | 47,150 | | Pop Mart International Group
Ltd.(a) (Specialty Retail) | | | 201,775 | |
| | 108,200 | | Shandong Weigao Group Medical Polymer Co. Ltd. Class H (Health Care Equipment & Supplies) | | | 73,860 | |
| | 38,400 | | Shanghai RAAS Blood Products Co. Ltd. Class A (Biotechnology) | | | 37,911 | |
| | 12,200 | | Shenzhen Goodix Technology Co. Ltd. Class A* (Semiconductors & Semiconductor Equipment) | | | 102,783 | |
| | 4,500 | | Shenzhen Mindray Bio-Medical Electronics Co. Ltd. Class A (Health Care Equipment & Supplies) | | | 188,626 | |
| | 11,200 | | Shenzhen SC New Energy Technology Corp. Class A (Semiconductors & Semiconductor Equipment) | | | 105,720 | |
| | | |
| | | | | | | | |
| | | Shares | | Description | | Value | |
| |
| | Common Stocks (continued) | |
| |
| | China (continued) | |
| | 5,751 | | Shenzhen Transsion Holdings Co. Ltd. Class A (Technology Hardware, Storage & Peripherals) | | $ | 114,169 | |
| | 42,150 | | Sinopharm Group Co. Ltd. Class H (Health Care Providers & Services) | | | 106,444 | |
| | 38,750 | | Sinotruk Hong Kong Ltd. (Machinery) | | | 96,437 | |
| | 149,716 | | Tencent Holdings Ltd. (Interactive Media & Services) | | | 6,570,015 | |
| | 36,900 | | Tencent Music Entertainment Group ADR* (Entertainment) | | | 463,095 | |
| | 72,300 | | Tongcheng Travel Holdings Ltd.* (Hotels, Restaurants & Leisure) | | | 190,285 | |
| | 30,250 | | Trip.com Group Ltd.* (Hotels, Restaurants & Leisure) | | | 1,465,770 | |
| | 4,187 | | Vipshop Holdings Ltd. (Broadline Retail) | | | 62,972 | |
| | 21,600 | | Weichai Power Co. Ltd. Class H (Machinery) | | | 44,137 | |
| | 250,600 | | Weichai Power Co. Ltd. Class A (Machinery) | | | 600,179 | |
| | 23,400 | | Wuliangye Yibin Co. Ltd. Class A (Beverages) | | | 483,098 | |
| | 125,850 | | Wuxi Biologics Cayman, Inc.*(a) (Life Sciences Tools & Services) | | | 218,014 | |
| | 24,626 | | Xinjiang Daqo New Energy Co. Ltd. Class A* (Semiconductors & Semiconductor Equipment) | | | 82,852 | |
| | 236,150 | | Yuexiu Property Co. Ltd. (Real Estate Management & Development) | | | 140,939 | |
| | 21,626 | | Yum China Holdings, Inc. (Hotels, Restaurants & Leisure) | | | 789,565 | |
| | 6,300 | | Zhongji Innolight Co. Ltd. Class A (Communications Equipment) | | | 158,529 | |
| | 94,300 | | Zhongsheng Group Holdings Ltd. (Specialty Retail) | | | 171,983 | |
| | | | | | | | |
| | | | | | | 28,077,569 | |
| | | |
| |
| | Denmark – 0.9% | |
| | 9,112 | | ALK-Abello AS* (Pharmaceuticals) | | | 168,927 | |
| | 6,505 | | Bavarian Nordic AS* (Biotechnology) | | | 141,956 | |
| | 8,558 | | Carlsberg AS Class B (Beverages) | | | 1,151,161 | |
| | 3,642 | | NKT AS* (Electrical Equipment) | | | 302,120 | |
| | 54,171 | | Novo Nordisk AS Class B (Pharmaceuticals) | | | 6,947,008 | |
| | 3,183 | | Royal Unibrew AS* (Beverages) | | | 239,704 | |
| | 4,287 | | Sydbank AS (Banks) | | | 217,992 | |
| | 713 | | Zealand Pharma AS* (Biotechnology) | | | 63,988 | |
| | | | | | | | |
| | | | | | | 9,232,856 | |
| | | |
| |
| | France – 3.8% | |
| | 21,922 | | Air Liquide SA (Chemicals) | | | 4,287,475 | |
| | | |
| | |
| 12 | | The accompanying notes are an integral part of these financial statements. |
GOLDMAN SACHS MULTI-MANAGER GLOBAL EQUITY FUND
| | | | | | | | |
| | | Shares | | Description | | Value | |
| |
| | Common Stocks (continued) | |
| |
| | France (continued) | |
| | 140,914 | | Alstom SA (Machinery) | | $ | 2,221,942 | |
| | 1,097 | | Alten SA (IT Services) | | | 128,920 | |
| | 29,764 | | AXA SA (Insurance) | | | 1,028,393 | |
| | 10,556 | | BNP Paribas SA (Banks) | | | 759,629 | |
| | 11,222 | | Capgemini SE (IT Services) | | | 2,358,651 | |
| | 52,129 | | Carrefour SA (Consumer Staples Distribution & Retail) | | | 876,978 | |
| | 26,070 | | Cie de Saint-Gobain SA (Building Products) | | | 2,061,685 | |
| | 26,447 | | Cie Generale des Etablissements Michelin SCA (Automobile Components) | | | 1,016,058 | |
| | 21,488 | | Danone SA (Food Products) | | | 1,344,877 | |
| | 12,949 | | Dassault Systemes SE (Software) | | | 508,273 | |
| | 12,446 | | Edenred SE (Financial Services) | | | 590,586 | |
| | 14,260 | | Elis SA (Commerical Services & Supplies) | | | 320,157 | |
| | 81,834 | | Engie SA* (Multi-Utilities) | | | 1,420,688 | |
| | 8,096 | | EssilorLuxottica SA (Health Care Equipment & Supplies) | | | 1,726,323 | |
| | 14,554 | | Forvia SE* (Automobile Components) | | | 231,622 | |
| | 1,694 | | Gecina SA (Office REITs) | | | 172,960 | |
| | 5,794 | | Kering SA (Textiles, Apparel & Luxury Goods) | | | 2,030,619 | |
| | 9,173 | | Legrand SA (Electrical Equipment) | | | 942,678 | |
| | 3,160 | | L’Oreal SA (Personal Products) | | | 1,481,576 | |
| | 4,835 | | LVMH Moet Hennessy Louis Vuitton SE (Textiles, Apparel & Luxury Goods) | | | 3,971,643 | |
| | 7,584 | | Pernod Ricard SA (Beverages) | | | 1,147,020 | |
| | 8,446 | | Rexel SA (Trading Companies & Distributors) | | | 218,919 | |
| | 9,880 | | Safran SA (Aerospace & Defense) | | | 2,142,301 | |
| | 13,054 | | Sanofi SA (Pharmaceuticals) | | | 1,289,645 | |
| | 20,713 | | Schneider Electric SE (Electrical Equipment) | | | 4,722,841 | |
| | 7,519 | | SCOR SE (Insurance) | | | 245,328 | |
| | 959 | | Sopra Steria Group (IT Services) | | | 209,981 | |
| | 7,063 | | SPIE SA (Commerical Services & Supplies) | | | 256,815 | |
| | 10,101 | | Technip Energies NV (Energy Equipment & Services) | | | 237,879 | |
| | 4,093 | | Valeo SE (Automobile Components) | | | 51,873 | |
| | 15,756 | | Vallourec SACA* (Energy Equipment & Services) | | | 271,267 | |
| | 6,010 | | Vinci SA (Construction & Engineering) | | | 704,228 | |
| | 25,882 | | Worldline SA*(a) (Financial Services) | | | 268,461 | |
| | | | | | | | |
| | | | | | | 41,248,291 | |
| | | |
| | | | | | | | |
| | | Shares | | Description | | Value | |
| |
| | Common Stocks (continued) | |
| |
| | Germany – 1.7% | |
| | 4,480 | | AIXTRON SE (Semiconductors & Semiconductor Equipment) | | $ | 104,097 | |
| | 2,300 | | Allianz SE (Insurance) | | | 652,706 | |
| | 13,646 | | Beiersdorf AG (Personal Products) | | | 2,051,043 | |
| | 4,378 | | CompuGroup Medical SE & Co. KGaA (Health Care Technology) | | | 131,147 | |
| | 3,181 | | CTS Eventim AG & Co. KGaA (Entertainment) | | | 281,292 | |
| | 10,291 | | Deutsche Boerse AG (Capital Markets) | | | 1,984,022 | |
| | 84,974 | | Deutsche Telekom AG (Diversified Telecommunication Services) | | | 1,946,377 | |
| | 1,228 | | Gerresheimer AG (Life Sciences Tools & Services) | | | 132,252 | |
| | 38,631 | | Infineon Technologies AG (Semiconductors & Semiconductor Equipment) | | | 1,340,613 | |
| | 5,130 | | KION Group AG (Machinery) | | | 236,431 | |
| | 34,817 | | Lanxess AG (Chemicals) | | | 984,034 | |
| | 10,012 | | Merck KGaA (Pharmaceuticals) | | | 1,590,923 | |
| | 2,535 | | MTU Aero Engines AG (Aerospace & Defense) | | | 610,724 | |
| | 31,228 | | RWE AG (Independent Power and Renewable Electricity Producers) | | | 1,087,844 | |
| | 24,770 | | SAP SE (Software) | | | 4,472,648 | |
| | 2,840 | | Scout24 SE(a) (Interactive Media & Services) | | | 208,620 | |
| | 1,292 | | Sixt SE (Ground Transportation) | | | 123,703 | |
| | 3,250 | | Stroeer SE & Co. KGaA (Media) | | | 208,409 | |
| | 15,983 | | TAG Immobilien AG* (Real Estate Management & Development) | | | 227,241 | |
| | | | | | | | |
| | | | | | | 18,374,126 | |
| | | |
| |
| | Greece* – 0.1% | |
| | 180,700 | | Alpha Services & Holdings SA (Banks) | | | 305,133 | |
| | 112,800 | | Eurobank Ergasias Services & Holdings SA Class A (Banks) | | | 241,964 | |
| | 47,040 | | National Bank of Greece SA (Banks) | | | 379,521 | |
| | 82,298 | | Piraeus Financial Holdings SA (Banks) | | | 329,682 | |
| | | | | | | | |
| | | | | | | 1,256,300 | |
| | | |
| |
| | Hong Kong – 0.3% | |
| | 201,900 | | AIA Group Ltd. (Insurance) | | | 1,478,787 | |
| | 134,000 | | Hang Lung Properties Ltd. (Real Estate Management & Development) | | | 147,897 | |
| | 46,603 | | Hopson Development Holdings Ltd.* (Real Estate Management & Development) | | | 22,146 | |
| | 242,250 | | Kunlun Energy Co. Ltd. (Gas Utilities) | | | 234,832 | |
| | 104,400 | | Link REIT (Retail REITs) | | | 447,332 | |
| | | |
| | |
| The accompanying notes are an integral part of these financial statements. | | 13 |
GOLDMAN SACHS MULTI-MANAGER GLOBAL EQUITY FUND
|
Schedule of Investments (continued) April 30, 2024 (Unaudited) |
| | | | | | | | |
| | | Shares | | Description | | Value | |
| |
| | Common Stocks (continued) | |
| |
| | Hong Kong (continued) | |
| | 335,850 | | Sino Biopharmaceutical Ltd. (Pharmaceuticals) | | $ | 114,760 | |
| | 36,000 | | Techtronic Industries Co. Ltd. (Machinery) | | | 497,494 | |
| | | | | | | | |
| | | | | | | 2,943,248 | |
| | | |
| |
| | Hungary – 0.0% | |
| | 3,450 | | OTP Bank Nyrt (Banks) | | | 171,194 | |
| | | |
| |
| | India – 2.2% | |
| | 6,350 | | ABB India Ltd. (Electrical Equipment) | | | 497,224 | |
| | 48,772 | | Adani Ports & Special Economic Zone Ltd. (Transportation Infrastructure) | | | 772,648 | |
| | 4,554 | | Apollo Hospitals Enterprise Ltd. (Health Care Providers & Services) | | | 323,903 | |
| | 5,050 | | Apollo Tyres Ltd. (Automobile Components) | | | 30,781 | |
| | 91,573 | | Ashok Leyland Ltd. (Machinery) | | | 210,885 | |
| | 23,959 | | Axis Bank Ltd. (Banks) | | | 334,422 | |
| | 5,267 | | Bajaj Auto Ltd. (Automobiles) | | | 562,293 | |
| | 2,234 | | Bajaj Finance Ltd. (Consumer Finance) | | | 185,315 | |
| | 127,400 | | Bank of Baroda (Banks) | | | 428,359 | |
| | 435,185 | | Bharat Electronics Ltd. (Aerospace & Defense) | | | 1,216,939 | |
| | 27,698 | | Bharti Airtel Ltd. (Wireless Telecommunication Services) | | | 438,423 | |
| | 16,350 | | Birlasoft Ltd. (Software) | | | 126,859 | |
| | 3,400 | | BSE Ltd. (Capital Markets) | | | 112,875 | |
| | 16,650 | | Canara Bank (Banks) | | | 123,762 | |
| | 21,449 | | Chambal Fertilisers & Chemicals Ltd. (Chemicals) | | | 108,859 | |
| | 110,500 | | Coal India Ltd. (Oil, Gas & Consumable Fuels) | | | 600,782 | |
| | 12,400 | | Cochin Shipyard Ltd.(a) (Machinery) | | | 193,468 | |
| | 2,950 | | Colgate-Palmolive India Ltd. (Personal Products) | | | 99,833 | |
| | 8,000 | | Cummins India Ltd. (Machinery) | | | 313,232 | |
| | 3,684 | | Dixon Technologies India Ltd. (Household Durables) | | | 367,670 | |
| | 82,026 | | DLF Ltd. (Real Estate Management & Development) | | | 873,955 | |
| | 3,100 | | Dr Reddy’s Laboratories Ltd. (Pharmaceuticals) | | | 230,044 | |
| | 3,800 | | Fertilisers & Chemicals Travancore Ltd. (Chemicals) | | | 32,499 | |
| | 2,300 | | Godrej Properties Ltd.* (Real Estate Management & Development) | | | 72,695 | |
| | 13,702 | | Gujarat Narmada Valley Fertilizers & Chemicals Ltd. (Chemicals) | | | 116,825 | |
| | 67,801 | | HDFC Bank Ltd. (Banks) | | | 1,231,306 | |
| | | |
| | | | | | | | |
| | | Shares | | Description | | Value | |
| |
| | Common Stocks (continued) | |
| |
| | India (continued) | |
| | 21,699 | | HDFC Life Insurance Co. Ltd.(a) (Insurance) | | $ | 151,460 | |
| | 57,800 | | Hindalco Industries Ltd.(a) (Metals & Mining) | | | 444,526 | |
| | 1,000 | | Hindustan Aeronautics Ltd. (Aerospace & Defense) | | | 47,192 | |
| | 126,571 | | ICICI Bank Ltd. (Banks) | | | 2,635,083 | |
| | 64,215 | | Indian Hotels Co. Ltd. (Hotels, Restaurants & Leisure) | | | 442,500 | |
| | 10,800 | | InterGlobe Aviation Ltd.*(a) (Passenger Airlines) | | | 514,986 | |
| | 14,200 | | KPIT Technologies Ltd. (Software) | | | 253,153 | |
| | 19,895 | | Larsen & Toubro Ltd. (Construction & Engineering) | | | 855,205 | |
| | 3,350 | | Lupin Ltd. (Pharmaceuticals) | | | 65,962 | |
| | 20,000 | | Max Healthcare Institute Ltd. (Health Care Providers & Services) | | | 200,979 | |
| | 6,350 | | Natco Pharma Ltd. (Pharmaceuticals) | | | 77,182 | |
| | 36,450 | | NMDC Ltd. (Metals & Mining) | | | 110,614 | |
| | 6,600 | | Oil India Ltd. (Oil, Gas & Consumable Fuels) | | | 48,799 | |
| | 750 | | Oracle Financial Services Software Ltd. (Software) | | | 68,083 | |
| | 3,500 | | Persistent Systems Ltd. (IT Services) | | | 140,798 | |
| | 2,000 | | Phoenix Mills Ltd. (Real Estate Management & Development) | | | 75,430 | |
| | 5,650 | | PI Industries Ltd. (Chemicals) | | | 246,934 | |
| | 4,223 | | Polycab India Ltd. (Electrical Equipment) | | | 286,575 | |
| | 44,943 | | Power Finance Corp. Ltd. (Financial Services) | | | 236,906 | |
| | 107,150 | | Power Grid Corp. of India Ltd. (Electric Utilities) | | | 386,466 | |
| | 95,300 | | Punjab National Bank (Banks) | | | 160,724 | |
| | 28,760 | | Reliance Industries Ltd. (Oil, Gas & Consumable Fuels) | | | 1,009,599 | |
| | 163,449 | | Samvardhana Motherson International Ltd. (Automobile Components) | | | 255,979 | |
| | 4,250 | | Shriram Finance Ltd. (Consumer Finance) | | | 129,668 | |
| | 4,981 | | Siemens Ltd. (Industrial Conglomerates) | | | 348,015 | |
| | 11,100 | | Sun TV Network Ltd. (Media) | | | 87,062 | |
| | 1,400 | | Supreme Industries Ltd. (Chemicals) | | | 84,791 | |
| | 12,470 | | Tata Consultancy Services Ltd. (IT Services) | | | 569,132 | |
| | 62,550 | | Tata Motors Ltd. (Automobiles) | | | 754,294 | |
| | 99,000 | | Tata Power Co. Ltd. (Electric Utilities) | | | 531,309 | |
| | 6,546 | | Titan Co. Ltd. (Textiles, Apparel & Luxury Goods) | | | 280,871 | |
| | | |
| | |
| 14 | | The accompanying notes are an integral part of these financial statements. |
GOLDMAN SACHS MULTI-MANAGER GLOBAL EQUITY FUND
| | | | | | | | |
| | | Shares | | Description | | Value | |
| |
| | Common Stocks (continued) | |
| |
| | India (continued) | |
| | 2,850 | | Trent Ltd. (Specialty Retail) | | $ | 150,437 | |
| | 14,072 | | TVS Motor Co. Ltd. (Automobiles) | | | 346,486 | |
| | 26,600 | | United Spirits Ltd. (Beverages) | | | 374,200 | |
| | 34,894 | | Varun Beverages Ltd. (Beverages) | | | 617,268 | |
| | 17,250 | | Zensar Technologies Ltd. (IT Services) | | | 126,357 | |
| | 540,406 | | Zomato Ltd.* (Hotels, Restaurants & Leisure) | | | 1,247,217 | |
| | | | | | | | |
| | | | | | | 23,968,098 | |
| | | |
| |
| | Indonesia – 0.2% | |
| | 1,382,100 | | Adaro Energy Indonesia Tbk. PT (Oil, Gas & Consumable Fuels) | | | 230,350 | |
| | 395,800 | | Bank Central Asia Tbk. PT (Banks) | | | 237,989 | |
| | 2,900,600 | | Bank Mandiri Persero Tbk. PT (Banks) | | | 1,226,016 | |
| | 1,570,550 | | Bank Rakyat Indonesia Persero Tbk. PT (Banks) | | | 475,411 | |
| | | | | | | | |
| | | | | | | 2,169,766 | |
| | | |
| |
| | Ireland – 1.6% | |
| | 143,501 | | AIB Group PLC (Banks) | | | 742,786 | |
| | 6,340 | | Aon PLC Class A (Insurance) | | | 1,787,943 | |
| | 18,054 | | Bank of Ireland Group PLC (Banks) | | | 192,626 | |
| | 76,613 | | Experian PLC (Professional Services) | | | 3,090,104 | |
| | 9,600 | | ICON PLC* (Life Sciences Tools & Services) | | | 2,859,648 | |
| | 11,785 | | Keywords Studios PLC (IT Services) | | | 168,280 | |
| | 6,260 | | Linde PLC (Chemicals) | | | 2,760,410 | |
| | 41,258 | | Medtronic PLC (Health Care Equipment & Supplies) | | | 3,310,542 | |
| | 19,044 | | Ryanair Holdings PLC (Passenger Airlines) | | | 2,593,793 | |
| | 2,418 | | Weatherford International PLC* (Energy Equipment & Services) | | | 298,913 | |
| | | | | | | | |
| | | | | | | 17,805,045 | |
| | | |
| |
| | Israel* – 0.1% | |
| | 5,722 | | Check Point Software Technologies Ltd. (Software) | | | 854,981 | |
| | 939 | | CyberArk Software Ltd. (Software) | | | 224,656 | |
| | 1,440 | | Nova Ltd. (Semiconductors & Semiconductor Equipment) | | | 244,656 | |
| | | | | | | | |
| | | | | | | 1,324,293 | |
| | | |
| |
| | Italy – 1.1% | |
| | 27,047 | | Banca Mediolanum SpA (Financial Services) | | | 292,691 | |
| | 17,621 | | BFF Bank SpA(a) (Financial Services) | | | 226,124 | |
| | 2,536 | | Brunello Cucinelli SpA (Textiles, Apparel & Luxury Goods) | | | 258,830 | |
| | 7,131 | | Buzzi SpA (Construction Materials) | | | 256,932 | |
| | | |
| | | | | | | | |
| | | Shares | | Description | | Value | |
| |
| | Common Stocks (continued) | |
| |
| | Italy (continued) | |
| | 333,427 | | Enel SpA (Electric Utilities) | | $ | 2,191,429 | |
| | 76,660 | | Eni SpA (Oil, Gas & Consumable Fuels) | | | 1,231,289 | |
| | 5,743 | | ERG SpA (Independent Power and Renewable Electricity Producers) | | | 154,656 | |
| | 7,760 | | Ferrari NV (Automobiles) | | | 3,191,491 | |
| | 47,672 | | Hera SpA (Multi-Utilities) | | | 172,119 | |
| | 395,037 | | Intesa Sanpaolo SpA (Banks) | | | 1,478,626 | |
| | 53,442 | | UniCredit SpA (Banks) | | | 1,961,555 | |
| | | | | | | | |
| | | | | | | 11,415,742 | |
| | | |
| |
| | Japan – 3.3% | |
| | 8,900 | | ABC-Mart, Inc. (Specialty Retail) | | | 177,273 | |
| | 10,600 | | ADEKA Corp. (Chemicals) | | | 220,276 | |
| | 18,200 | | Air Water, Inc. (Chemicals) | | | 273,277 | |
| | 12,964 | | Allegro MicroSystems, Inc.* (Semiconductors & Semiconductor Equipment) | | | 384,901 | |
| | 26,200 | | Amada Co. Ltd. (Machinery) | | | 286,158 | |
| | 6,600 | | Amano Corp. (Electronic Equipment, Instruments & Components) | | | 158,738 | |
| | 13,900 | | Amvis Holdings, Inc. (Health Care Providers & Services) | | | 189,637 | |
| | 6,800 | | Asics Corp. (Textiles, Apparel & Luxury Goods) | | | 291,464 | |
| | 7,500 | | BIPROGY, Inc. (IT Services) | | | 218,186 | |
| | 7,400 | | Canon Marketing Japan, Inc. (Electronic Equipment, Instruments & Components) | | | 203,332 | |
| | 32,200 | | Chiba Bank Ltd. (Banks) | | | 271,995 | |
| | 41,800 | | Concordia Financial Group Ltd. (Banks) | | | 225,224 | |
| | 15,600 | | Credit Saison Co. Ltd. (Consumer Finance) | | | 287,963 | |
| | 8,200 | | Daikin Industries Ltd. (Building Products) | | | 1,119,229 | |
| | 76,500 | | Denso Corp. (Automobile Components) | | | 1,303,798 | |
| | 12,400 | | DMG Mori Co. Ltd. (Machinery) | | | 331,483 | |
| | 74,400 | | FANUC Corp. (Machinery) | | | 2,203,675 | |
| | 11,100 | | Ferrotec Holdings Corp. (Semiconductors & Semiconductor Equipment) | | | 210,751 | |
| | 11,600 | | Food & Life Cos. Ltd. (Hotels, Restaurants & Leisure) | | | 219,250 | |
| | 18,100 | | Fuji Media Holdings, Inc. (Media) | | | 215,126 | |
| | 50,200 | | Fujitsu Ltd. (IT Services) | | | 775,497 | |
| | 6,400 | | Fuso Chemical Co. Ltd. (Chemicals) | | | 164,373 | |
| | 2,000 | | GMO Payment Gateway, Inc. (Financial Services) | | | 91,482 | |
| | 15,500 | | H2O Retailing Corp. (Consumer Staples Distribution & Retail) | | | 175,138 | |
| | | |
| | |
| The accompanying notes are an integral part of these financial statements. | | 15 |
GOLDMAN SACHS MULTI-MANAGER GLOBAL EQUITY FUND
|
Schedule of Investments (continued) April 30, 2024 (Unaudited) |
| | | | | | | | |
| | | Shares | | Description | | Value | |
| |
| | Common Stocks (continued) | |
| |
| | Japan (continued) | |
| | 7,300 | | Hitachi Construction Machinery Co. Ltd. (Machinery) | | $ | 208,505 | |
| | 30,800 | | Hitachi Ltd. (Industrial Conglomerates) | | | 2,841,629 | |
| | 5,500 | | Hoya Corp. (Health Care Equipment & Supplies) | | | 637,669 | |
| | 20,000 | | IDOM, Inc. (Specialty Retail) | | | 177,028 | |
| | 23,500 | | INFRONEER Holdings, Inc. (Construction & Engineering) | | | 208,108 | |
| | 9,700 | | Internet Initiative Japan, Inc. (Diversified Telecommunication Services) | | | 164,114 | |
| | 489 | | Invincible Investment Corp. (Hotel & Resort REITs) | | | 219,092 | |
| | 16,200 | | J Front Retailing Co. Ltd. (Broadline Retail) | | | 141,083 | |
| | 251 | | Japan Metropolitan Fund Invest (Retail REITs) | | | 151,536 | |
| | 5,300 | | JINS Holdings, Inc. (Specialty Retail) | | | 111,347 | |
| | 11,800 | | Kajima Corp. (Construction & Engineering) | | | 226,054 | |
| | 10,600 | | Kamigumi Co. Ltd. (Transportation Infrastructure) | | | 228,913 | |
| | 181 | | KDX Realty Investment Corp. (Diversified REITs) | | | 178,527 | |
| | 12,000 | | Kinden Corp. (Construction & Engineering) | | | 228,973 | |
| | 11,800 | | KOMEDA Holdings Co. Ltd. (Hotels, Restaurants & Leisure) | | | 193,682 | |
| | 10,000 | | Kose Corp. (Personal Products) | | | 515,641 | |
| | 23,800 | | Kubota Corp. (Machinery) | | | 381,745 | |
| | 80,100 | | Kyocera Corp. (Electronic Equipment, Instruments & Components) | | | 976,310 | |
| | 72,400 | | Mebuki Financial Group, Inc. (Banks) | | | 256,124 | |
| | 68,600 | | Mitsubishi Electric Corp. (Electrical Equipment) | | | 1,195,693 | |
| | 80 | | Mitsui Fudosan Logistics Park, Inc. (Industrial REITs) | | | 229,508 | |
| | 8,000 | | Monogatari Corp. (Hotels, Restaurants & Leisure) | | | 216,146 | |
| | 85,200 | | Murata Manufacturing Co. Ltd. (Electronic Equipment, Instruments & Components) | | | 1,556,788 | |
| | 9,200 | | Nifco, Inc. (Automobile Components) | | | 222,396 | |
| | 18,900 | | NOF Corp. (Chemicals) | | | 253,561 | |
| | 4,500 | | OKUMA Corp. (Machinery) | | | 202,113 | |
| | 67,400 | | Olympus Corp. (Health Care Equipment & Supplies) | | | 938,862 | |
| | 89,600 | | Renesas Electronics Corp. (Semiconductors & Semiconductor Equipment) | | | 1,454,723 | |
| | | |
| | | | | | | | |
| | | Shares | | Description | | Value | |
| |
| | Common Stocks (continued) | |
| |
| | Japan (continued) | |
| | 27,500 | | Rengo Co. Ltd. (Containers & Packaging) | | $ | 206,191 | |
| | 9,400 | | Rohto Pharmaceutical Co. Ltd. (Personal Products) | | | 183,398 | |
| | 6,100 | | Sankyu, Inc. (Air Freight & Logistics) | | | 211,485 | |
| | 2,100 | | SCREEN Holdings Co. Ltd. (Semiconductors & Semiconductor Equipment) | | | 216,672 | |
| | 174,200 | | Seven & i Holdings Co. Ltd. (Consumer Staples Distribution & Retail) | | | 2,250,872 | |
| | 17,100 | | SG Holdings Co. Ltd. (Air Freight & Logistics) | | | 200,157 | |
| | 22,800 | | Shin-Etsu Chemical Co. Ltd. (Chemicals) | | | 882,564 | |
| | 1,900 | | SMC Corp. (Machinery) | | | 998,196 | |
| | 8,600 | | Socionext, Inc. (Semiconductors & Semiconductor Equipment) | | | 251,426 | |
| | 12,400 | | Sojitz Corp. (Trading Companies & Distributors) | | | 319,261 | |
| | 15,400 | | Sony Group Corp. (Household Durables) | | | 1,272,831 | |
| | 8,600 | | Sumitomo Osaka Cement Co. Ltd. (Construction Materials) | | | 213,522 | |
| | 5,200 | | Suzuken Co. Ltd. (Health Care Providers & Services) | | | 153,575 | |
| | 44,600 | | Takeda Pharmaceutical Co. Ltd. (Pharmaceuticals) | | | 1,172,180 | |
| | 11,500 | | TechnoPro Holdings, Inc. (Professional Services) | | | 195,884 | |
| | 53,900 | | Terumo Corp. (Health Care Equipment & Supplies) | | | 914,366 | |
| | 9,100 | | TIS, Inc. (IT Services) | | | 194,345 | |
| | 36,100 | | Tokyu Fudosan Holdings Corp. (Real Estate Management & Development) | | | 264,478 | |
| | 5,700 | | Toyo Suisan Kaisha Ltd. (Food Products) | | | 356,445 | |
| | 8,400 | | Yamazaki Baking Co. Ltd. (Food Products) | | | 203,308 | |
| | 5,400 | | Yokohama Rubber Co. Ltd. (Automobile Components) | | | 141,341 | |
| | 26,100 | | ZOZO, Inc. (Specialty Retail) | | | 562,154 | |
| | | | | | | | |
| | | | | | | 35,678,747 | |
| | | |
| |
| | Jordan – 0.0% | |
| | 7,479 | | Hikma Pharmaceuticals PLC (Pharmaceuticals) | | | 179,575 | |
| | | |
| |
| | Luxembourg – 0.0% | |
| | 2,894 | | Orion SA (Chemicals) | | | 68,472 | |
| | 5,574 | | Ternium SA (Metals & Mining) | | | 234,665 | |
| | | | | | | | |
| | | | | | | 303,137 | |
| | | |
| | |
| 16 | | The accompanying notes are an integral part of these financial statements. |
GOLDMAN SACHS MULTI-MANAGER GLOBAL EQUITY FUND
| | | | | | | | |
| | | Shares | | Description | | Value | |
| |
| | Common Stocks (continued) | |
| |
| | Macau – 0.0% | |
| | 137,200 | | MGM China Holdings Ltd. (Hotels, Restaurants & Leisure) | | $ | 231,586 | |
| | | |
| |
| | Malaysia – 0.1% | |
| | 413,050 | | CIMB Group Holdings Bhd. (Banks) | | | 570,847 | |
| | 151,800 | | RHB Bank Bhd. (Banks) | | | 174,738 | |
| | | | | | | | |
| | | | | | | 745,585 | |
| | | |
| |
| | Mexico – 0.4% | |
| | 15,850 | | Banco del Bajio SA(a) (Banks) | | | 58,438 | |
| | 59,700 | | Cemex SAB de CV* (Construction Materials) | | | 472,227 | |
| | 952 | | Coca-Cola Femsa SAB de CV (Beverages) | | | 94,391 | |
| | 59,850 | | Corp. Inmobiliaria Vesta SAB de CV (Real Estate Management & Development) | | | 211,754 | |
| | 3,250 | | Fomento Economico Mexicano SAB de CV (Beverages) | | | 382,395 | |
| | 11,150 | | Gruma SAB de CV Class B (Food Products) | | | 218,994 | |
| | 11,600 | | Grupo Aeroportuario del Sureste SAB de CV Class B (Transportation Infrastructure) | | | 398,466 | |
| | 75,850 | | Grupo Financiero Banorte SAB de CV Class O (Banks) | | | 750,718 | |
| | 19,300 | | Grupo Financiero Inbursa SAB de CV Class O* (Banks) | | | 53,481 | |
| | 50,900 | | Grupo Mexico SAB de CV (Metals & Mining) | | | 314,508 | |
| | 170,200 | | Kimberly-Clark de Mexico SAB de CV Class A (Household Products) | | | 354,295 | |
| | 20,900 | | Regional SAB de CV (Banks) | | | 188,763 | |
| | 2,950 | | Vista Energy SAB de CV* (Oil, Gas & Consumable Fuels) | | | 127,292 | |
| | 65,300 | | Wal-Mart de Mexico SAB de CV (Consumer Staples Distribution & Retail) | | | 243,654 | |
| | | | | | | | |
| | | | | | | 3,869,376 | |
| | | |
| |
| | Netherlands – 1.6% | |
| | 1,390 | | Adyen NV*(a) (Financial Services) | | | 1,665,220 | |
| | 30,650 | | Akzo Nobel NV (Chemicals) | | | 2,022,347 | |
| | 2,438 | | Arcadis NV (Professional Services) | | | 150,568 | |
| | 1,849 | | Argenx SE* (Biotechnology) | | | 694,299 | |
| | 3,620 | | ASM International NV (Semiconductors & Semiconductor Equipment) | | | 2,277,121 | |
| | 5,023 | | ASML Holding NV (Semiconductors & Semiconductor Equipment) | | | 4,382,417 | |
| | 5,866 | | ASR Nederland NV (Insurance) | | | 293,532 | |
| | 9,810 | | Expro Group Holdings NV* (Energy Equipment & Services) | | | 184,036 | |
| | | |
| | | | | | | | |
| | | Shares | | Description | | Value | |
| |
| | Common Stocks (continued) | |
| |
| | Netherlands (continued) | |
| | 4,769 | | Heineken NV (Beverages) | | $ | 464,117 | |
| | 174,716 | | ING Groep NV (Banks) | | | 2,762,306 | |
| | 92,346 | | Koninklijke Philips NV (Health Care Equipment & Supplies) | | | 2,452,358 | |
| | 34,000 | | NEPI Rockcastle NV (Real Estate Management & Development) | | | 229,422 | |
| | | | | | | | |
| | | | | | | 17,577,743 | |
| | | |
| |
| | Norway – 0.0% | |
| | 71,912 | | Var Energi ASA (Oil, Gas & Consumable Fuels) | | | 233,464 | |
| | | |
| |
| | Philippines – 0.0% | |
| | 44,700 | | Metropolitan Bank & Trust Co. (Banks) | | | 54,087 | |
| | | |
| |
| | Poland – 0.1% | |
| | 12,300 | | Bank Polska Kasa Opieki SA (Banks) | | | 509,224 | |
| | 400 | | Budimex SA (Construction & Engineering) | | | 67,665 | |
| | 1,231 | | Dino Polska SA*(a) (Consumer Staples Distribution & Retail) | | | 117,933 | |
| | 43,600 | | Powszechna Kasa Oszczednosci Bank Polski SA (Banks) | | | 647,334 | |
| | | | | | | | |
| | | | | | | 1,342,156 | |
| | | |
| |
| | Portugal – 0.1% | |
| | 47,472 | | Galp Energia SGPS SA (Oil, Gas & Consumable Fuels) | | | 1,019,754 | |
| | 165,213 | | Sonae SGPS SA (Consumer Staples Distribution & Retail) | | | 165,422 | |
| | | | | | | | |
| | | | | | | 1,185,176 | |
| | | |
| |
| | Qatar – 0.0% | |
| | 4,556 | | Barwa Real Estate Co. (Real Estate Management & Development) | | | 3,511 | |
| | 39,850 | | Ooredoo QPSC (Diversified Telecommunication Services) | | | 109,338 | |
| | | | | | | | |
| | | | | | | 112,849 | |
| | | |
| |
| | Russia(b) – 0.0% | |
| | 61,284 | | Gazprom PJSC* (Oil, Gas & Consumable Fuels) | | | — | |
| | 5,200 | | LUKOIL PJSC* (Oil, Gas & Consumable Fuels) | | | — | |
| | 2,390 | | Magnit PJSC (Consumer Staples Distribution & Retail) | | | — | |
| | 3,393 | | Novolipetsk Steel PJSC* (Metals & Mining) | | | — | |
| | 5,650 | | PhosAgro PJSC* (Chemicals) | | | — | |
| | 19,000 | | Surgutneftegas PJSC* (Oil, Gas & Consumable Fuels) | | | — | |
| | 23,847 | | VTB Bank PJSC* (Banks) | | | — | |
| | | | | | | | |
| | | | | | | — | |
| | | |
| | |
| The accompanying notes are an integral part of these financial statements. | | 17 |
GOLDMAN SACHS MULTI-MANAGER GLOBAL EQUITY FUND
|
Schedule of Investments (continued) April 30, 2024 (Unaudited) |
| | | | | | | | |
| | | Shares | | Description | | Value | |
| |
| | Common Stocks (continued) | |
| |
| | Singapore – 0.3% | |
| | 129,800 | | CapitaLand Ascendas REIT (Industrial REITs) | | $ | 245,870 | |
| | 52,250 | | DBS Group Holdings Ltd. (Banks) | | | 1,330,149 | |
| | 56,800 | | Sembcorp Industries Ltd. (Multi-Utilities) | | | 221,979 | |
| | 42,000 | | United Overseas Bank Ltd. (Banks) | | | 932,013 | |
| | | | | | | | |
| | | | | | | 2,730,011 | |
| | | |
| |
| | South Africa – 0.1% | |
| | 11,100 | | Exxaro Resources Ltd. (Oil, Gas & Consumable Fuels) | | | 106,350 | |
| | 45,794 | | Harmony Gold Mining Co. Ltd. (Metals & Mining) | | | 392,455 | |
| | 69,450 | | Impala Platinum Holdings Ltd. (Metals & Mining) | | | 309,160 | |
| | 15,015 | | Investec Ltd. (Capital Markets) | | | 95,700 | |
| | | | | | | | |
| | | | | | | 903,665 | |
| | | |
| |
| | South Korea – 2.1% | |
| | 1,785 | | Chong Kun Dang Pharmaceutical Corp. (Pharmaceuticals) | | | 133,982 | |
| | 400 | | CJ CheilJedang Corp. (Food Products) | | | 96,955 | |
| | 1,650 | | Classys, Inc. (Health Care Equipment & Supplies) | | | 44,905 | |
| | 750 | | Cosmax, Inc. (Personal Products) | | | 75,669 | |
| | 150,969 | | Coupang, Inc.* (Broadline Retail) | | | 3,396,803 | |
| | 4,700 | | Doosan Bobcat, Inc. (Machinery) | | | 175,662 | |
| | 2,400 | | GS Holdings Corp. (Industrial Conglomerates) | | | 77,596 | |
| | 1,500 | | Hankook Tire & Technology Co. Ltd. (Automobile Components) | | | 63,648 | |
| | 1,400 | | Hanmi Pharm Co. Ltd. (Pharmaceuticals) | | | 318,924 | |
| | 3,277 | | Hanmi Semiconductor Co. Ltd. (Semiconductors & Semiconductor Equipment) | | | 312,058 | |
| | 2,828 | | Hanwha Aerospace Co. Ltd. (Aerospace & Defense) | | | 429,563 | |
| | 34,550 | | Hanwha Life Insurance Co. Ltd. (Insurance) | | | 73,287 | |
| | 3,100 | | HD Hyundai Co. Ltd. (Oil, Gas & Consumable Fuels) | | | 150,080 | |
| | 1,727 | | HD Hyundai Electric Co. Ltd. (Electrical Equipment) | | | 304,668 | |
| | 550 | | Hyosung Heavy Industries Corp. (Electrical Equipment) | | | 122,735 | |
| | 12,850 | | Hyundai Engineering & Construction Co. Ltd. (Construction & Engineering) | | | 327,356 | |
| | 650 | | Hyundai Motor Co. (Automobiles) | | | 116,919 | |
| | 16,550 | | Hyundai Steel Co. (Metals & Mining) | | | 384,306 | |
| | 7,478 | | KB Financial Group, Inc. (Banks) | | | 405,584 | |
| | 950 | | KCC Corp. (Chemicals) | | | 171,970 | |
| | | |
| | | | | | | | |
| | | Shares | | Description | | Value | |
| |
| | Common Stocks (continued) | |
| |
| | South Korea (continued) | |
| | 17,142 | | Kia Corp. (Automobiles) | | $ | 1,452,314 | |
| | 4,841 | | Korea Aerospace Industries Ltd. (Aerospace & Defense) | | | 180,255 | |
| | 6,400 | | Korea Investment Holdings Co. Ltd. (Capital Markets) | | | 309,335 | |
| | 1,250 | | LG H&H Co. Ltd. (Personal Products) | | | 376,635 | |
| | 5,450 | | NAVER Corp. (Interactive Media & Services) | | | 718,852 | |
| | 330 | | NongShim Co. Ltd. (Food Products) | | | 94,756 | |
| | 2,200 | | OCI Holdings Co. Ltd. (Chemicals) | | | 149,891 | |
| | 6,850 | | Poongsan Corp. (Metals & Mining) | | | 320,080 | |
| | 683 | | Samsung Biologics Co. Ltd.*(a) (Life Sciences Tools & Services) | | | 383,885 | |
| | 7,650 | | Samsung E&A Co. Ltd.* (Construction & Engineering) | | | 145,039 | |
| | 82,641 | | Samsung Electronics Co. Ltd. (Technology Hardware, Storage & Peripherals) | | | 8,002,361 | |
| | 4,300 | | Shinhan Financial Group Co. Ltd. (Banks) | | | 144,468 | |
| | 19,142 | | SK Hynix, Inc. (Semiconductors & Semiconductor Equipment) | | | 2,362,230 | |
| | 1 | | SK Innovation Co. Ltd.* (Oil, Gas & Consumable Fuels) | | | 79 | |
| | 41,505 | | Woori Financial Group, Inc. (Banks) | | | 425,332 | |
| | | | | | | | |
| | | | | | | 22,248,182 | |
| | | |
| |
| | Spain – 0.4% | |
| | 6,817 | | Aena SME SA(a) (Transportation Infrastructure) | | | 1,242,327 | |
| | 31,669 | | Amadeus IT Group SA (Hotels, Restaurants & Leisure) | | | 2,010,156 | |
| | 173,533 | | Banco de Sabadell SA (Banks) | | | 331,483 | |
| | 5,069 | | CIE Automotive SA (Automobile Components) | | | 133,988 | |
| | 55,757 | | Iberdrola SA (Electric Utilities) | | | 683,669 | |
| | | | | | | | |
| | | | | | | 4,401,623 | |
| | | |
| |
| | Sweden – 0.3% | |
| | 10,987 | | AAK AB (Food Products) | | | 282,603 | |
| | 15,191 | | Assa Abloy AB Class B (Building Products) | | | 401,368 | |
| | 21,555 | | Castellum AB* (Real Estate Management & Development) | | | 256,116 | |
| | 14,110 | | Evolution AB(a) (Hotels, Restaurants & Leisure) | | | 1,558,945 | |
| | 6,330 | | Loomis AB (Commerical Services & Supplies) | | | 161,774 | |
| | 3,273 | | Saab AB Class B (Aerospace & Defense) | | | 259,119 | |
| | 27,369 | | Securitas AB Class B (Commerical Services & Supplies) | | | 274,281 | |
| | | |
| | |
| 18 | | The accompanying notes are an integral part of these financial statements. |
GOLDMAN SACHS MULTI-MANAGER GLOBAL EQUITY FUND
| | | | | | | | |
| | | Shares | | Description | | Value | |
| |
| | Common Stocks (continued) | |
| |
| | Sweden (continued) | |
| | 9,598 | | Trelleborg AB Class B (Machinery) | | $ | 338,257 | |
| | | | | | | | |
| | | | | | | 3,532,463 | |
| | | |
| |
| | Switzerland – 1.2% | |
| | 1,286 | | BKW AG (Electric Utilities) | | | 190,891 | |
| | 13,409 | | Cie Financiere Richemont SA Class A (Textiles, Apparel & Luxury Goods) | | | 1,853,486 | |
| | 15,785 | | Julius Baer Group Ltd. (Capital Markets) | | | 846,997 | |
| | 30,569 | | Novartis AG (Pharmaceuticals) | | | 2,966,950 | |
| | 2,309 | | PSP Swiss Property AG (Real Estate Management & Development) | | | 285,442 | |
| | 2,737 | | Sika AG (Chemicals) | | | 778,571 | |
| | 2,404 | | Sonova Holding AG (Health Care Equipment & Supplies) | | | 664,543 | |
| | 645 | | Tecan Group AG (Life Sciences Tools & Services) | | | 227,547 | |
| | 110,765 | | UBS Group AG (Capital Markets) | | | 2,909,051 | |
| | 402 | | VAT Group AG(a) (Machinery) | | | 200,140 | |
| | 3,102 | | Zurich Insurance Group AG (Insurance) | | | 1,501,511 | |
| | | | | | | | |
| | | | | | | 12,425,129 | |
| | | |
| |
| | Taiwan – 2.0% | |
| | 67,350 | | Accton Technology Corp. (Communications Equipment) | | | 943,533 | |
| | 6,500 | | Alchip Technologies Ltd. (Semiconductors & Semiconductor Equipment) | | | 613,047 | |
| | 25,350 | | Arcadyan Technology Corp. (Communications Equipment) | | | 133,645 | |
| | 11,550 | | Asustek Computer, Inc. (Technology Hardware, Storage & Peripherals) | | | 151,452 | |
| | 30,350 | | Chicony Electronics Co. Ltd. (Technology Hardware, Storage & Peripherals) | | | 187,885 | |
| | 879,550 | | China Development Financial Holding Corp.* (Insurance) | | | 367,690 | |
| | 371,850 | | Compal Electronics, Inc. (Technology Hardware, Storage & Peripherals) | | | 405,599 | |
| | 1,064,750 | | CTBC Financial Holding Co. Ltd. (Banks) | | | 1,111,299 | |
| | 43,500 | | E Ink Holdings, Inc. (Electronic Equipment, Instruments & Components) | | | 278,105 | |
| | 15,350 | | Eclat Textile Co. Ltd. (Textiles, Apparel & Luxury Goods) | | | 241,519 | |
| | 23,250 | | Elan Microelectronics Corp. (Semiconductors & Semiconductor Equipment) | | | 117,023 | |
| | | |
| | | | | | | | |
| | | Shares | | Description | | Value | |
| |
| | Common Stocks (continued) | |
| |
| | Taiwan (continued) | |
| | 7,958 | | Faraday Technology Corp. (Semiconductors & Semiconductor Equipment) | | $ | 70,782 | |
| | 117,600 | | Gigabyte Technology Co. Ltd. (Technology Hardware, Storage & Peripherals) | | | 1,060,563 | |
| | 24,400 | | Hon Hai Precision Industry Co. Ltd. (Electronic Equipment, Instruments & Components) | | | 116,152 | |
| | 4,500 | | International Games System Co. Ltd. (Entertainment) | | | 137,616 | |
| | 2,850 | | King Slide Works Co. Ltd. (Technology Hardware, Storage & Peripherals) | | | 106,011 | |
| | 45,250 | | MediaTek, Inc. (Semiconductors & Semiconductor Equipment) | | | 1,364,340 | |
| | 10,050 | | MPI Corp. (Semiconductors & Semiconductor Equipment) | | | 134,886 | |
| | 117,000 | | Nanya Technology Corp. (Semiconductors & Semiconductor Equipment) | | | 236,158 | |
| | 30,350 | | Phison Electronics Corp. (Semiconductors & Semiconductor Equipment) | | | 647,857 | |
| | 79,550 | | Quanta Computer, Inc. (Technology Hardware, Storage & Peripherals) | | | 624,327 | |
| | 16,550 | | Raydium Semiconductor Corp. (Semiconductors & Semiconductor Equipment) | | | 215,744 | |
| | 7,450 | | Realtek Semiconductor Corp. (Semiconductors & Semiconductor Equipment) | | | 117,525 | |
| | 211,150 | | SinoPac Financial Holdings Co. Ltd. (Banks) | | | 142,054 | |
| | 428,426 | | Taiwan Semiconductor Manufacturing Co. Ltd. (Semiconductors & Semiconductor Equipment) | | | 11,547,556 | |
| | 16,550 | | Tong Yang Industry Co. Ltd. (Automobile Components) | | | 60,246 | |
| | 19,700 | | Wistron Corp. (Technology Hardware, Storage & Peripherals) | | | 67,454 | |
| | 5,800 | | Wiwynn Corp. (Technology Hardware, Storage & Peripherals) | | | 412,607 | |
| | 53,600 | | Yuanta Financial Holding Co. Ltd. (Financial Services) | | | 50,279 | |
| | | | | | | | |
| | | | | | | 21,662,954 | |
| | | |
| |
| | Thailand – 0.2% | |
| | 156,150 | | Bangchak Corp. PCL (Oil, Gas & Consumable Fuels) | | | 175,884 | |
| | 62,700 | | Bangkok Bank PCL (Banks) | | | 231,326 | |
| | 509,400 | | Bangkok Dusit Medical Services PCL (Health Care Providers & Services) | | | 397,781 | |
| | | |
| | |
| The accompanying notes are an integral part of these financial statements. | | 19 |
GOLDMAN SACHS MULTI-MANAGER GLOBAL EQUITY FUND
|
Schedule of Investments (continued) April 30, 2024 (Unaudited) |
| | | | | | | | |
| | | Shares | | Description | | Value | |
| |
| | Common Stocks (continued) | |
| |
| | Thailand (continued) | |
| | 41,850 | | Bumrungrad Hospital PCL (Health Care Providers & Services) | | $ | 276,221 | |
| | 102,650 | | Krung Thai Bank PCL (Banks) | | | 46,425 | |
| | 115,150 | | PTT Exploration & Production PCL (Oil, Gas & Consumable Fuels) | | | 481,706 | |
| | 33,900 | | SCB X PCL (Banks) | | | 97,079 | |
| | 6,100,600 | | TMBThanachart Bank PCL (Banks) | | | 297,273 | |
| | | | | | | | |
| | | | | | | 2,003,695 | |
| | | |
| |
| | Turkey – 0.1% | |
| | 9,061 | | Eldorado Gold Corp.* (Metals & Mining) | | | 129,210 | |
| | 47,148 | | KOC Holding AS (Industrial Conglomerates) | | | 329,157 | |
| | 3,950 | | Migros Ticaret AS (Consumer Staples Distribution & Retail) | | | 53,909 | |
| | 135,800 | | Turkiye Is Bankasi AS Class C (Banks) | | | 57,488 | |
| | 31,450 | | Turkiye Petrol Rafinerileri AS (Oil, Gas & Consumable Fuels) | | | 190,139 | |
| | | | | | | | |
| | | | | | | 759,903 | |
| | | |
| |
| | United Arab Emirates – 0.2% | |
| | 165,722 | | Abu Dhabi Commercial Bank PJSC (Banks) | | | 376,302 | |
| | 79,065 | | Abu Dhabi Islamic Bank PJSC (Banks) | | | 240,237 | |
| | 48,100 | | Aldar Properties PJSC (Real Estate Management & Development) | | | 71,504 | |
| | 58,600 | | Dubai Islamic Bank PJSC (Banks) | | | 88,708 | |
| | 504,858 | | Emaar Properties PJSC* (Real Estate Management & Development) | | | 1,128,505 | |
| | 136,897 | | Emirates NBD Bank PJSC (Banks) | | | 633,627 | |
| | | | | | | | |
| | | | | | | 2,538,883 | |
| | | |
| |
| | United Kingdom – 5.2% | |
| | 3,345 | | 4imprint Group PLC (Media) | | | 258,529 | |
| | 32,434 | | AstraZeneca PLC (Pharmaceuticals) | | | 4,905,606 | |
| | 37,210 | | B&M European Value Retail SA (Broadline Retail) | | | 240,137 | |
| | 47,087 | | Balfour Beatty PLC (Construction & Engineering) | | | 213,539 | |
| | 1,090,333 | | Barclays PLC (Banks) | | | 2,749,048 | |
| | 32,835 | | Beazley PLC (Insurance) | | | 271,669 | |
| | 9,238 | | Berkeley Group Holdings PLC (Household Durables) | | | 542,507 | |
| | 431,227 | | BP PLC (Oil, Gas & Consumable Fuels) | | | 2,779,533 | |
| | 24,190 | | Breedon Group PLC (Construction Materials) | | | 108,693 | |
| | 46,232 | | British American Tobacco PLC (Tobacco) | | | 1,357,199 | |
| | 61,283 | | British Land Co. PLC (Diversified REITs) | | | 295,516 | |
| | | |
| | | | | | | | |
| | | Shares | | Description | | Value | |
| |
| | Common Stocks (continued) | |
| |
| | United Kingdom (continued) | |
| | 147,903 | | Compass Group PLC (Hotels, Restaurants & Leisure) | | $ | 4,113,731 | |
| | 6,484 | | Computacenter PLC (IT Services) | | | 207,880 | |
| | 75,858 | | ConvaTec Group PLC(a) (Health Care Equipment & Supplies) | | | 236,018 | |
| | 3,619 | | Cranswick PLC (Food Products) | | | 194,359 | |
| | 91,400 | | Diageo PLC (Beverages) | | | 3,158,754 | |
| | 5,769 | | Diploma PLC (Trading Companies & Distributors) | | | 260,762 | |
| | 67,803 | | DS Smith PLC (Containers & Packaging) | | | 295,386 | |
| | 5,380 | | Endava PLC* (IT Services) | | | 156,020 | |
| | 15,565 | | Entain PLC (Hotels, Restaurants & Leisure) | | | 151,855 | |
| | 23,052 | | Ferguson PLC (Trading Companies & Distributors) | | | 4,847,896 | |
| | 4 | | Flutter Entertainment PLC* (Hotels, Restaurants & Leisure) | | | 745 | |
| | 86,002 | | GSK PLC (Pharmaceuticals) | | | 1,784,276 | |
| | 26,381 | | IG Group Holdings PLC (Capital Markets) | | | 246,168 | |
| | 11,943 | | IMI PLC (Machinery) | | | 260,151 | |
| | 823 | | Immunocore Holdings PLC* (Biotechnology) | | | 48,623 | |
| | 11,828 | | Indivior PLC* (Pharmaceuticals) | | | 212,329 | |
| | 14,301 | | Intermediate Capital Group PLC (Capital Markets) | | | 372,740 | |
| | 44,763 | | J Sainsbury PLC (Consumer Staples Distribution & Retail) | | | 146,830 | |
| | 155,800 | | JD Sports Fashion PLC (Specialty Retail) | | | 223,055 | |
| | 15,172 | | JET2 PLC (Passenger Airlines) | | | 271,315 | |
| | 152,055 | | Kingfisher PLC (Specialty Retail) | | | 468,379 | |
| | 286,990 | | Legal & General Group PLC (Insurance) | | | 842,459 | |
| | 11,449 | | London Stock Exchange Group PLC (Capital Markets) | | | 1,262,139 | |
| | 86,687 | | Man Group PLC (Capital Markets) | | | 277,997 | |
| | 192,418 | | NatWest Group PLC (Banks) | | | 726,259 | |
| | 3,457 | | Noble Corp. PLC (Energy Equipment & Services) | | | 153,422 | |
| | 8,298 | | Nomad Foods Ltd. (Food Products) | | | 149,862 | |
| | 316,779 | | Prudential PLC (Insurance) | | | 2,755,137 | |
| | 40,481 | | Reckitt Benckiser Group PLC (Household Products) | | | 2,263,171 | |
| | 77,201 | | RELX PLC (Professional Services) | | | 3,172,783 | |
| | 12,736 | | Rio Tinto PLC (Metals & Mining) | | | 861,727 | |
| | 1,112,694 | | Rolls-Royce Holdings PLC* (Aerospace & Defense) | | | 5,705,921 | |
| | 14,988 | | Safestore Holdings PLC (Specialized REITs) | | | 144,452 | |
| | 57,542 | | Segro PLC (Industrial REITs) | | | 605,234 | |
| | 112,033 | | Serco Group PLC (Commerical Services & Supplies) | | | 256,463 | |
| | | |
| | |
| 20 | | The accompanying notes are an integral part of these financial statements. |
GOLDMAN SACHS MULTI-MANAGER GLOBAL EQUITY FUND
| | | | | | | | |
| | | Shares | | Description | | Value | |
| |
| | Common Stocks (continued) | |
| |
| | United Kingdom (continued) | |
| | 79,821 | | Shell PLC (Oil, Gas & Consumable Fuels) | | $ | 2,852,307 | |
| | 228,628 | | Tesco PLC (Consumer Staples Distribution & Retail) | | | 844,110 | |
| | 104,532 | | Tritax Big Box REIT PLC (Industrial REITs) | | | 197,444 | |
| | 10,898 | | Weir Group PLC (Machinery) | | | 278,088 | |
| | 54,036 | | WH Smith PLC (Specialty Retail) | | | 739,120 | |
| | 4,836 | | Whitbread PLC (Hotels, Restaurants & Leisure) | | | 190,600 | |
| | | | | | | | |
| | | | | | | 55,657,943 | |
| | | |
| |
| | United States – 56.4% | |
| | 2,229 | | AAR Corp.* (Aerospace & Defense) | | | 154,113 | |
| | 56,948 | | Abbott Laboratories (Health Care Equipment & Supplies) | | | 6,034,780 | |
| | 14,164 | | AbbVie, Inc. (Biotechnology) | | | 2,303,633 | |
| | 24,671 | | Accenture PLC Class A (IT Services) | | | 7,423,751 | |
| | 1,150 | | Acuity Brands, Inc. (Electrical Equipment) | | | 285,545 | |
| | 841 | | Addus HomeCare Corp.* (Health Care Providers & Services) | | | 80,862 | |
| | 13,303 | | Adeia, Inc. (Software) | | | 130,902 | |
| | 5,113 | | Adobe, Inc.* (Software) | | | 2,366,450 | |
| | 5,748 | | Advanced Micro Devices, Inc.* (Semiconductors & Semiconductor Equipment) | | | 910,368 | |
| | 5,113 | | Affirm Holdings, Inc.* (Financial Services) | | | 163,002 | |
| | 5,850 | | Agios Pharmaceuticals, Inc.* (Biotechnology) | | | 190,125 | |
| | 6,140 | | Agree Realty Corp. (Retail REITs) | | | 351,331 | |
| | 2,245 | | Alamo Group, Inc. (Machinery) | | | 436,383 | |
| | 12,301 | | Alight, Inc. Class A* (Professional Services) | | | 110,955 | |
| | 2,286 | | Allegiant Travel Co. (Passenger Airlines) | | | 124,724 | |
| | 3,613 | | Allison Transmission Holdings, Inc. (Machinery) | | | 265,736 | |
| | 35,668 | | Allstate Corp. (Insurance) | | | 6,065,700 | |
| | 146,440 | | Alphabet, Inc. Class A* (Interactive Media & Services) | | | 23,837,503 | |
| | 142,597 | | Amazon.com, Inc.* (Broadline Retail) | | | 24,954,475 | |
| | 1,023 | | Amedisys, Inc.* (Health Care Providers & Services) | | | 94,167 | |
| | 117,949 | | American International Group, Inc. (Insurance) | | | 8,882,739 | |
| | 10,244 | | Ameris Bancorp (Banks) | | | 486,385 | |
| | 5,666 | | AMERISAFE, Inc. (Insurance) | | | 258,370 | |
| | 2,833 | | Amkor Technology, Inc. (Semiconductors & Semiconductor Equipment) | | | 91,648 | |
| | | |
| | | | | | | | |
| | | Shares | | Description | | Value | |
| |
| | Common Stocks (continued) | |
| |
| | United States (continued) | |
| | 2,166 | | AMN Healthcare Services, Inc.* (Health Care Providers & Services) | | $ | 129,917 | |
| | 26,414 | | Amphenol Corp. Class A (Electronic Equipment, Instruments & Components) | | | 3,190,019 | |
| | 147,095 | | Antero Resources Corp.* (Oil, Gas & Consumable Fuels) | | | 5,002,701 | |
| | 3,275 | | Appfolio, Inc. Class A* (Software) | | | 742,704 | |
| | 52,145 | | Apple, Inc. (Technology Hardware, Storage & Peripherals) | | | 8,881,858 | |
| | 6,424 | | Archrock, Inc. (Energy Equipment & Services) | | | 123,277 | |
| | 19,548 | | Arcutis Biotherapeutics, Inc.* (Biotechnology) | | | 162,639 | |
| | 960 | | Arrow Electronics, Inc.* (Electronic Equipment, Instruments & Components) | | | 122,563 | |
| | 14,171 | | Artivion, Inc.* (Health Care Equipment & Supplies) | | | 278,035 | |
| | 1,825 | | Asbury Automotive Group, Inc.* (Specialty Retail) | | | 383,688 | |
| | 1,691 | | Ashland, Inc. (Chemicals) | | | 161,203 | |
| | 1,347 | | Atkore, Inc. (Electrical Equipment) | | | 236,129 | |
| | 22,044 | | Atlassian Corp. Class A* (Software) | | | 3,798,181 | |
| | 3,535 | | Atmus Filtration Technologies, Inc.* (Machinery) | | | 107,075 | |
| | 9,500 | | AtriCure, Inc.* (Health Care Equipment & Supplies) | | | 229,140 | |
| | 67,525 | | Aurora Innovation, Inc.* (Software) | | | 187,382 | |
| | 13,896 | | Avient Corp. (Chemicals) | | | 589,468 | |
| | 5,484 | | Avnet, Inc. (Electronic Equipment, Instruments & Components) | | | 268,003 | |
| | 814 | | Axcelis Technologies, Inc.* (Semiconductors & Semiconductor Equipment) | | | 84,265 | |
| | 5,489 | | Azenta, Inc.* (Life Sciences Tools & Services) | | | 287,953 | |
| | 3,409 | | Balchem Corp. (Chemicals) | | | 481,964 | |
| | 176,493 | | Bank of America Corp. (Banks) | | | 6,532,006 | |
| | 3,474 | | Beacon Roofing Supply, Inc.* (Trading Companies & Distributors) | | | 342,293 | |
| | 3,973 | | Beazer Homes USA, Inc.* (Household Durables) | | | 111,363 | |
| | 22,839 | | Becton Dickinson & Co. (Health Care Equipment & Supplies) | | | 5,358,029 | |
| | 1,537 | | Belden, Inc. (Electronic Equipment, Instruments & Components) | | | 124,912 | |
| | 2,387 | | BellRing Brands, Inc.* (Personal Products) | | | 131,691 | |
| | 26,369 | | Berkshire Hathaway, Inc. Class B* (Financial Services) | | | 10,461,373 | |
| | 36,128 | | BGC Group, Inc. Class A (Capital Markets) | | | 282,882 | |
| | 36,440 | | BioCryst Pharmaceuticals, Inc.* (Biotechnology) | | | 150,497 | |
| | | |
| | |
| The accompanying notes are an integral part of these financial statements. | | 21 |
GOLDMAN SACHS MULTI-MANAGER GLOBAL EQUITY FUND
|
Schedule of Investments (continued) April 30, 2024 (Unaudited) |
| | | | | | | | |
| | | Shares | | Description | | Value | |
| |
| | Common Stocks (continued) | |
| |
| | United States (continued) | |
| | 2,663 | | Blue Bird Corp.* (Machinery) | | $ | 87,759 | |
| | 1,101 | | Boeing Co.* (Aerospace & Defense) | | | 184,792 | |
| | 682 | | Booking Holdings, Inc. (Hotels, Restaurants & Leisure) | | | 2,354,284 | |
| | 4,998 | | Boot Barn Holdings, Inc.* (Specialty Retail) | | | 532,137 | |
| | 15,916 | | Bowlero Corp. Class A (Hotels, Restaurants & Leisure) | | | 187,013 | |
| | 1,578 | | Boyd Gaming Corp. (Hotels, Restaurants & Leisure) | | | 84,439 | |
| | 1,880 | | Brady Corp. Class A (Commerical Services & Supplies) | | | 110,920 | |
| | 2,182 | | Brinker International, Inc.* (Hotels, Restaurants & Leisure) | | | 116,955 | |
| | 5,598 | | Brink’s Co. (Commerical Services & Supplies) | | | 489,601 | |
| | 3,431 | | BRP Group, Inc. Class A* (Insurance) | | | 91,402 | |
| | 5,077 | | Bumble, Inc. Class A* (Interactive Media & Services) | | | 51,278 | |
| | 1,745 | | Cactus, Inc. Class A (Energy Equipment & Services) | | | 86,622 | |
| | 4,561 | | Cadence Design Systems, Inc.* (Software) | | | 1,257,148 | |
| | 3,491 | | Caleres, Inc. (Specialty Retail) | | | 128,574 | |
| | 58,828 | | CarMax, Inc.* (Specialty Retail) | | | 3,998,539 | |
| | 7,113 | | Cars.com, Inc.* (Interactive Media & Services) | | | 118,858 | |
| | 6,276 | | Catalyst Pharmaceuticals, Inc.* (Biotechnology) | | | 94,454 | |
| | 14,048 | | Caterpillar, Inc. (Machinery) | | | 4,700,039 | |
| | 9,779 | | Cathay General Bancorp (Banks) | | | 336,789 | |
| | 7,850 | | CBIZ, Inc.* (Professional Services) | | | 558,763 | |
| | 17,920 | | Central Garden & Pet Co. Class A* (Household Products) | | | 634,906 | |
| | 17,116 | | ChampionX Corp. (Energy Equipment & Services) | | | 574,584 | |
| | 16,371 | | Charles Schwab Corp. (Capital Markets) | | | 1,210,635 | |
| | 3,449 | | Chart Industries, Inc.* (Machinery) | | | 496,863 | |
| | 24,804 | | Chevron Corp. (Oil, Gas & Consumable Fuels) | | | 4,000,141 | |
| | 606 | | Chipotle Mexican Grill, Inc.* (Hotels, Restaurants & Leisure) | | | 1,914,718 | |
| | 2,450 | | Chord Energy Corp. (Oil, Gas & Consumable Fuels) | | | 433,601 | |
| | 7,497 | | Chuy’s Holdings, Inc.* (Hotels, Restaurants & Leisure) | | | 220,862 | |
| | 11,895 | | Cigna Group (Health Care Providers & Services) | | | 4,246,991 | |
| | 3,611 | | Clearfield, Inc.* (Communications Equipment) | | | 108,763 | |
| | 3,110 | | Cognizant Technology Solutions Corp. Class A (IT Services) | | | 204,265 | |
| | | |
| | | | | | | | |
| | | Shares | | Description | | Value | |
| |
| | Common Stocks (continued) | |
| |
| | United States (continued) | |
| | 7,477 | | Cohen & Steers, Inc. (Capital Markets) | | $ | 514,268 | |
| | 1,267 | | Commercial Metals Co. (Metals & Mining) | | | 68,089 | |
| | 1,239 | | Concentrix Corp. (Professional Services) | | | 67,736 | |
| | 60,497 | | ConocoPhillips (Oil, Gas & Consumable Fuels) | | | 7,599,633 | |
| | 11,108 | | Constellium SE* (Metals & Mining) | | | 218,717 | |
| | 13,871 | | CoreCivic, Inc.* (Commerical Services & Supplies) | | | 206,678 | |
| | 4,724 | | Cousins Properties, Inc. (Office REITs) | | | 108,369 | |
| | 7,741 | | CryoPort, Inc.* (Life Sciences Tools & Services) | | | 125,327 | |
| | 41,052 | | Danaher Corp. (Life Sciences Tools & Services) | | | 10,124,244 | |
| | 8,750 | | Deere & Co. (Machinery) | | | 3,424,837 | |
| | 56,425 | | Dexcom, Inc.* (Health Care Equipment & Supplies) | | | 7,187,981 | |
| | 16,605 | | Diamondback Energy, Inc. (Oil, Gas & Consumable Fuels) | | | 3,339,764 | |
| | 3,104 | | Dime Community Bancshares, Inc. (Banks) | | | 56,493 | |
| | 7,045 | | DNOW, Inc.* (Trading Companies & Distributors) | | | 99,405 | |
| | 8,783 | | Dollar General Corp. (Consumer Staples Distribution & Retail) | | | 1,222,506 | |
| | 59,748 | | Dominion Energy, Inc. (Multi-Utilities) | | | 3,045,953 | |
| | 3,850 | | Ducommun, Inc.* (Aerospace & Defense) | | | 208,246 | |
| | 20,888 | | Dynatrace, Inc.* (Software) | | | 946,435 | |
| | 16,132 | | Ecovyst, Inc.* (Chemicals) | | | 152,125 | |
| | 5,277 | | Eli Lilly & Co. (Pharmaceuticals) | | | 4,121,865 | |
| | 2,183 | | Employers Holdings, Inc. (Insurance) | | | 92,974 | |
| | 3,252 | | Enact Holdings, Inc. (Financial Services) | | | 96,682 | |
| | 502 | | Encore Wire Corp. (Electrical Equipment) | | | 140,239 | |
| | 1,543 | | EnerSys (Electrical Equipment) | | | 139,564 | |
| | 3,340 | | EPAM Systems, Inc.* (IT Services) | | | 785,768 | |
| | 4,561 | | Equifax, Inc. (Professional Services) | | | 1,004,287 | |
| | 4,664 | | Essent Group Ltd. (Financial Services) | | | 247,052 | |
| | 46,490 | | Estee Lauder Cos., Inc. Class A (Personal Products) | | | 6,820,548 | |
| | 2,222 | | Evercore, Inc. Class A (Capital Markets) | | | 403,293 | |
| | 27,873 | | Extra Space Storage, Inc. (Specialized REITs) | | | 3,742,786 | |
| | 1,037 | | Fair Isaac Corp.* (Software) | | | 1,175,263 | |
| | 2,425 | | Federal Agricultural Mortgage Corp. Class C (Financial Services) | | | 451,365 | |
| | | |
| | |
| 22 | | The accompanying notes are an integral part of these financial statements. |
GOLDMAN SACHS MULTI-MANAGER GLOBAL EQUITY FUND
| | | | | | | | |
| | | Shares | | Description | | Value | |
| |
| | Common Stocks (continued) | |
| |
| | United States (continued) | |
| | 7,320 | | First Advantage Corp. (Professional Services) | | $ | 119,316 | |
| | 1,994 | | First American Financial Corp. (Insurance) | | | 106,819 | |
| | 4,541 | | First Merchants Corp. (Banks) | | | 151,760 | |
| | 4,808 | | First Watch Restaurant Group, Inc.* (Hotels, Restaurants & Leisure) | | | 122,700 | |
| | 2,888 | | FirstCash Holdings, Inc. (Consumer Finance) | | | 326,286 | |
| | 33,462 | | Fiserv, Inc.* (Financial Services) | | | 5,108,644 | |
| | 22,992 | | Flywire Corp.* (Financial Services) | | | 471,336 | |
| | 18,486 | | Fortinet, Inc.* (Software) | | | 1,167,945 | |
| | 4,492 | | Fortrea Holdings, Inc.* (Life Sciences Tools & Services) | | | 164,362 | |
| | 3,990 | | Fox Factory Holding Corp.* (Automobile Components) | | | 155,291 | |
| | 74,379 | | Freeport-McMoRan, Inc. (Metals & Mining) | | | 3,714,487 | |
| | 5,778 | | Frontdoor, Inc.* (Diversified Consumer Services) | | | 177,327 | |
| | 721 | | FTI Consulting, Inc.* (Professional Services) | | | 154,171 | |
| | 102,166 | | General Motors Co. (Automobiles) | | | 4,549,452 | |
| | 8,072 | | Glacier Bancorp, Inc. (Banks) | | | 292,045 | |
| | 7,169 | | Global Payments, Inc. (Financial Services) | | | 880,138 | |
| | 820 | | Globant SA* (IT Services) | | | 146,444 | |
| | 8,804 | | Globus Medical, Inc. Class A* (Health Care Equipment & Supplies) | | | 438,351 | |
| | 3,265 | | Grand Canyon Education, Inc.* (Diversified Consumer Services) | | | 424,515 | |
| | 3,117 | | Granite Construction, Inc. (Construction & Engineering) | | | 172,994 | |
| | 2,018 | | Griffon Corp. (Building Products) | | | 132,219 | |
| | 546 | | Group 1 Automotive, Inc. (Specialty Retail) | | | 160,535 | |
| | 3,322 | | Hackett Group, Inc. (IT Services) | | | 72,054 | |
| | 2,287 | | Haemonetics Corp.* (Health Care Equipment & Supplies) | | | 210,290 | |
| | 14,606 | | Halozyme Therapeutics, Inc.* (Biotechnology) | | | 556,489 | |
| | 3,060 | | Hancock Whitney Corp. (Banks) | | | 138,893 | |
| | 29,921 | | Hartford Financial Services Group, Inc. (Insurance) | | | 2,899,046 | |
| | 15,398 | | HCA Healthcare, Inc. (Health Care Providers & Services) | | | 4,770,608 | |
| | 8,235 | | HealthEquity, Inc.* (Health Care Providers & Services) | | | 649,824 | |
| | 9,270 | | Heartland Express, Inc. (Ground Transportation) | | | 92,144 | |
| | 2,413 | | Helen of Troy Ltd.* (Household Durables) | | | 223,709 | |
| | 7,939 | | Heritage Commerce Corp. (Banks) | | | 63,036 | |
| | | |
| | | | | | | | |
| | | Shares | | Description | | Value | |
| |
| | Common Stocks (continued) | |
| |
| | United States (continued) | |
| | 25,877 | | Hillman Solutions Corp.* (Machinery) | | $ | 247,384 | |
| | 10,730 | | Home Depot, Inc. (Specialty Retail) | | | 3,586,181 | |
| | 14,008 | | Honeywell International, Inc. (Industrial Conglomerates) | | | 2,699,762 | |
| | 7,913 | | Hope Bancorp, Inc. (Banks) | | | 79,288 | |
| | 13,639 | | Horace Mann Educators Corp. (Insurance) | | | 502,734 | |
| | 3,965 | | Houlihan Lokey, Inc. (Capital Markets) | | | 505,498 | |
| | 17,373 | | Howmet Aerospace, Inc. (Aerospace & Defense) | | | 1,159,648 | |
| | 9,755 | | Humana, Inc. (Health Care Providers & Services) | | | 2,946,888 | |
| | 1,485 | | Huron Consulting Group, Inc.* (Professional Services) | | | 138,461 | |
| | 3,906 | | ICF International, Inc. (Professional Services) | | | 563,597 | |
| | 1,835 | | ICU Medical, Inc.* (Health Care Equipment & Supplies) | | | 179,683 | |
| | 3,850 | | IDACORP, Inc. (Electric Utilities) | | | 364,903 | |
| | 5,602 | | Independent Bank Corp. (Banks) | | | 281,444 | |
| | 26,196 | | Ingersoll Rand, Inc. (Machinery) | | | 2,444,611 | |
| | 862 | | Insight Enterprises, Inc.* (Electronic Equipment, Instruments & Components) | | | 157,375 | |
| | 9,827 | | Insmed, Inc.* (Biotechnology) | | | 242,923 | |
| | 13,628 | | Intapp, Inc.* (Software) | | | 421,378 | |
| | 7,262 | | Integra LifeSciences Holdings Corp.* (Health Care Equipment & Supplies) | | | 211,833 | |
| | 57,195 | | Intercontinental Exchange, Inc. (Capital Markets) | | | 7,364,428 | |
| | 3,313 | | InterDigital, Inc. (Software) | | | 327,092 | |
| | 3,491 | | International Money Express, Inc.* (Financial Services) | | | 70,623 | |
| | 6,846 | | Intra-Cellular Therapies, Inc.* (Pharmaceuticals) | | | 491,611 | |
| | 8,926 | | Intuit, Inc. (Software) | | | 5,584,284 | |
| | 9,929 | | Intuitive Surgical, Inc.* (Health Care Equipment & Supplies) | | | 3,679,886 | |
| | 4,585 | | ITT, Inc. (Machinery) | | | 593,024 | |
| | 16,000 | | Janus International Group, Inc.* (Building Products) | | | 230,560 | |
| | 54,730 | | JPMorgan Chase & Co. (Banks) | | | 10,493,930 | |
| | 3,192 | | Kelly Services, Inc. Class A (Professional Services) | | | 73,224 | |
| | 199,339 | | KeyCorp (Banks) | | | 2,888,422 | |
| | 14,855 | | Kinsale Capital Group, Inc. (Insurance) | | | 5,396,079 | |
| | 26,610 | | KKR & Co., Inc. (Capital Markets) | | | 2,476,593 | |
| | 954 | | Knife River Corp.* (Construction Materials) | | | 74,593 | |
| | 806,144 | | Kosmos Energy Ltd.* (Oil, Gas & Consumable Fuels) | | | 4,570,836 | |
| | | |
| | |
| The accompanying notes are an integral part of these financial statements. | | 23 |
GOLDMAN SACHS MULTI-MANAGER GLOBAL EQUITY FUND
|
Schedule of Investments (continued) April 30, 2024 (Unaudited) |
| | | | | | | | |
| | | Shares | | Description | | Value | |
| |
| | Common Stocks (continued) | |
| |
| | United States (continued) | |
| | 15,427 | | L3Harris Technologies, Inc. (Aerospace & Defense) | | $ | 3,302,149 | |
| | 16,509 | | Laboratory Corp. of America Holdings (Health Care Providers & Services) | | | 3,324,417 | |
| | 2,981 | | Lantheus Holdings, Inc.* (Health Care Equipment & Supplies) | | | 198,356 | |
| | 15,758 | | Laureate Education, Inc. (Diversified Consumer Services) | | | 228,491 | |
| | 21,321 | | Lear Corp. (Automobile Components) | | | 2,683,674 | |
| | 13,931 | | Legalzoom.com, Inc.* (Professional Services) | | | 166,475 | |
| | 2,237 | | Liberty Media Corp.-Liberty Live Class A* (Entertainment) | | | 80,219 | |
| | 2,534 | | LiveRamp Holdings, Inc.* (Software) | | | 81,367 | |
| | 7,123 | | MACOM Technology Solutions Holdings, Inc.* (Semiconductors & Semiconductor Equipment) | | | 726,190 | |
| | 25,186 | | Magnolia Oil & Gas Corp. Class A (Oil, Gas & Consumable Fuels) | | | 631,413 | |
| | 3,178 | | Martin Marietta Materials, Inc. (Construction Materials) | | | 1,865,708 | |
| | 12,478 | | Mastercard, Inc. Class A (Financial Services) | | | 5,630,074 | |
| | 11,550 | | Matador Resources Co. (Oil, Gas & Consumable Fuels) | | | 719,565 | |
| | 1,829 | | Medpace Holdings, Inc.* (Life Sciences Tools & Services) | | | 710,292 | |
| | 892 | | Meritage Homes Corp. (Household Durables) | | | 147,840 | |
| | 17,875 | | Meta Platforms, Inc. Class A (Interactive Media & Services) | | | 7,689,289 | |
| | 85,941 | | Microsoft Corp. (Software) | | | 33,459,410 | |
| | 7,302 | | Minerals Technologies, Inc. (Chemicals) | | | 532,243 | |
| | 4,450 | | Monday.com Ltd.* (Software) | | | 842,518 | |
| | 991 | | MongoDB, Inc.* (IT Services) | | | 361,893 | |
| | 15,335 | | Monolithic Power Systems, Inc. (Semiconductors & Semiconductor Equipment) | | | 10,264,176 | |
| | 48,868 | | Nasdaq, Inc. (Capital Markets) | | | 2,924,750 | |
| | 5,190 | | National Health Investors, Inc. (Health Care REITs) | | | 327,281 | |
| | 5,880 | | NCR Voyix Corp.* (Software) | | | 72,030 | |
| | 25,998 | | Nestle SA (Food Products) | | | 2,610,203 | |
| | 3,889 | | Netflix, Inc.* (Entertainment) | | | 2,141,439 | |
| | 2,004 | | New Jersey Resources Corp. (Gas Utilities) | | | 87,555 | |
| | 1,608 | | Nexstar Media Group, Inc. (Media) | | | 257,376 | |
| | 8,856 | | Northwestern Energy Group, Inc. (Multi-Utilities) | | | 446,697 | |
| | | |
| | | | | | | | |
| | | Shares | | Description | | Value | |
| |
| | Common Stocks (continued) | |
| |
| | United States (continued) | |
| | 4,192 | | Novanta, Inc.* (Electronic Equipment, Instruments & Components) | | $ | 656,048 | |
| | 26,939 | | NVIDIA Corp. (Semiconductors & Semiconductor Equipment) | | | 23,275,835 | |
| | 513 | | NVR, Inc.* (Household Durables) | | | 3,816,130 | |
| | 30,958 | | OceanFirst Financial Corp. (Banks) | | | 456,940 | |
| | 9,712 | | Old National Bancorp (Banks) | | | 160,636 | |
| | 115,515 | | ON Semiconductor Corp.* (Semiconductors & Semiconductor Equipment) | | | 8,104,532 | |
| | 8,064 | | O’Reilly Automotive, Inc.* (Specialty Retail) | | | 8,170,929 | |
| | 4,496 | | Organon & Co. (Pharmaceuticals) | | | 83,671 | |
| | 1,382 | | OSI Systems, Inc.* (Electronic Equipment, Instruments & Components) | | | 181,650 | |
| | 4,554 | | Oxford Industries, Inc. (Textiles, Apparel & Luxury Goods) | | | 490,830 | |
| | 16,782 | | Pacific Premier Bancorp, Inc. (Banks) | | | 360,813 | |
| | 5,344 | | Par Pacific Holdings, Inc.* (Oil, Gas & Consumable Fuels) | | | 164,595 | |
| | 13,940 | | Paragon 28, Inc.* (Health Care Equipment & Supplies) | | | 128,527 | |
| | 7,402 | | Parker-Hannifin Corp. (Machinery) | | | 4,033,424 | |
| | 3,911 | | Patrick Industries, Inc. (Automobile Components) | | | 408,660 | |
| | 22,032 | | Patterson-UTI Energy, Inc. (Energy Equipment & Services) | | | 238,386 | |
| | 18,853 | | Paycor HCM, Inc.* (Professional Services) | | | 327,477 | |
| | 8,760 | | Paylocity Holding Corp.* (Professional Services) | | | 1,359,202 | |
| | 3,853 | | Peapack-Gladstone Financial Corp. (Banks) | | | 86,230 | |
| | 7,522 | | Pediatrix Medical Group, Inc.* (Health Care Providers & Services) | | | 66,720 | |
| | 1,195 | | Pegasystems, Inc. (Software) | | | 71,007 | |
| | 47,186 | | Peloton Interactive, Inc. Class A* (Leisure Products) | | | 146,748 | |
| | 1,339 | | PennyMac Financial Services, Inc. (Financial Services) | | | 114,672 | |
| | 2,040 | | Penumbra, Inc.* (Health Care Equipment & Supplies) | | | 400,799 | |
| | 32,315 | | PepsiCo, Inc. (Beverages) | | | 5,684,532 | |
| | 6,282 | | Perdoceo Education Corp. (Diversified Consumer Services) | | | 114,961 | |
| | 14,900 | | Perella Weinberg Partners (Capital Markets) | | | 222,308 | |
| | 3,271 | | Perrigo Co. PLC (Pharmaceuticals) | | | 106,831 | |
| | 6,982 | | PetIQ, Inc.* (Health Care Providers & Services) | | | 113,946 | |
| | 166,406 | | Pfizer, Inc. (Pharmaceuticals) | | | 4,263,322 | |
| | | |
| | |
| 24 | | The accompanying notes are an integral part of these financial statements. |
GOLDMAN SACHS MULTI-MANAGER GLOBAL EQUITY FUND
| | | | | | | | |
| | | Shares | | Description | | Value | |
| |
| | Common Stocks (continued) | |
| |
| | United States (continued) | |
| | 3,025 | | Phinia, Inc. (Automobile Components) | | $ | 117,975 | |
| | 3,335 | | Photronics, Inc.* (Semiconductors & Semiconductor Equipment) | | | 91,412 | |
| | 17,416 | | Phreesia, Inc.* (Health Care Technology) | | | 361,208 | |
| | 1,177 | | Portland General Electric Co. (Electric Utilities) | | | 50,882 | |
| | 2,105 | | Preferred Bank (Banks) | | | 159,327 | |
| | 19,660 | | Primoris Services Corp. (Construction & Engineering) | | | 916,156 | |
| | 9,060 | | Progyny, Inc.* (Health Care Providers & Services) | | | 290,464 | |
| | 40,835 | | Prologis, Inc. (Industrial REITs) | | | 4,167,212 | |
| | 17,632 | | Qiagen NV* (Life Sciences Tools & Services) | | | 736,165 | |
| | 10,921 | | R1 RCM, Inc.* (Health Care Providers & Services) | | | 134,219 | |
| | 5,570 | | Rapid7, Inc.* (Software) | | | 249,536 | |
| | 2,650 | | RBC Bearings, Inc.* (Machinery) | | | 648,057 | |
| | 11,843 | | Redwood Trust, Inc. (Mortgage Real Estate Investment Trusts (REITs)) | | | 65,492 | |
| | 20,034 | | Regal Rexnord Corp. (Electrical Equipment) | | | 3,232,887 | |
| | 7,381 | | Revolve Group, Inc.* (Specialty Retail) | | | 146,956 | |
| | 17,757 | | Roche Holding AG (Pharmaceuticals) | | | 4,254,829 | |
| | 17,021 | | Ross Stores, Inc. (Specialty Retail) | | | 2,205,071 | |
| | 5,807 | | Ryman Hospitality Properties, Inc. (Hotel & Resort REITs) | | | 612,522 | |
| | 2,835 | | S&T Bancorp, Inc. (Banks) | | | 85,475 | |
| | 20,650 | | Saia, Inc.* (Ground Transportation) | | | 8,194,539 | |
| | 21,207 | | Salesforce, Inc. (Software) | | | 5,703,411 | |
| | 19,311 | | SBA Communications Corp. (Specialized REITs) | | | 3,594,163 | |
| | 26,110 | | Schlumberger NV (Energy Equipment & Services) | | | 1,239,703 | |
| | 1,666 | | Science Applications International Corp. (Professional Services) | | | 214,414 | |
| | 16,002 | | Seacoast Banking Corp. of Florida (Banks) | | | 369,166 | |
| | 10,790 | | Select Water Solutions, Inc. (Energy Equipment & Services) | | | 99,700 | |
| | 3,386 | | Sensata Technologies Holding PLC (Electrical Equipment) | | | 129,718 | |
| | 4,710 | | ServiceNow, Inc.* (Software) | | | 3,265,584 | |
| | 25,655 | | Sherwin-Williams Co. (Chemicals) | | | 7,686,495 | |
| | 20,111 | | Shoals Technologies Group, Inc. Class A* (Electrical Equipment) | | | 169,938 | |
| | 12,430 | | Silgan Holdings, Inc. (Containers & Packaging) | | | 579,984 | |
| | | |
| | | | | | | | |
| | | Shares | | Description | | Value | |
| |
| | Common Stocks (continued) | |
| |
| | United States (continued) | |
| | 3,063 | | Silicon Laboratories, Inc.* (Semiconductors & Semiconductor Equipment) | | $ | 372,124 | |
| | 2,685 | | Simply Good Foods Co.* (Food Products) | | | 97,868 | |
| | 7,341 | | Skyline Champion Corp.* (Household Durables) | | | 550,502 | |
| | 26,896 | | SLM Corp. (Consumer Finance) | | | 569,926 | |
| | 42,345 | | Snowflake, Inc. Class A* (IT Services) | | | 6,571,944 | |
| | 13,577 | | Solo Brands, Inc. Class A* (Leisure Products) | | | 25,525 | |
| | 1,300 | | SouthState Corp. (Banks) | | | 98,410 | |
| | 8,254 | | Spotify Technology SA* (Entertainment) | | | 2,314,752 | |
| | 7,201 | | SPX Technologies, Inc.* (Machinery) | | | 877,154 | |
| | 63,736 | | SS&C Technologies Holdings, Inc. (Professional Services) | | | 3,944,621 | |
| | 18,476 | | STAG Industrial, Inc. (Industrial REITs) | | | 635,390 | |
| | 12,957 | | Stagwell, Inc.* (Media) | | | 77,094 | |
| | 22,069 | | Starbucks Corp. (Hotels, Restaurants & Leisure) | | | 1,952,886 | |
| | 6,800 | | STERIS PLC (Health Care Equipment & Supplies) | | | 1,391,008 | |
| | 5,367 | | Steven Madden Ltd. (Textiles, Apparel & Luxury Goods) | | | 216,880 | |
| | 8,192 | | Stifel Financial Corp. (Capital Markets) | | | 654,705 | |
| | 1,940 | | StoneX Group, Inc.* (Capital Markets) | | | 140,844 | |
| | 16,543 | | Stryker Corp. (Health Care Equipment & Supplies) | | | 5,566,719 | |
| | 14,066 | | Supernus Pharmaceuticals, Inc.* (Pharmaceuticals) | | | 423,387 | |
| | 52,946 | | Sysco Corp. (Food Products) | | | 3,934,947 | |
| | 26,170 | | Target Corp. (Consumer Staples Distribution & Retail) | | | 4,212,847 | |
| | 16,534 | | TEGNA, Inc. (Media) | | | 225,524 | |
| | 32,029 | | Texas Instruments, Inc. (Semiconductors & Semiconductor Equipment) | | | 5,650,556 | |
| | 6,579 | | Texas Roadhouse, Inc. (Hotels, Restaurants & Leisure) | | | 1,057,772 | |
| | 918 | | Thor Industries, Inc. (Automobiles) | | | 91,268 | |
| | 2,240 | | Tidewater, Inc.* (Energy Equipment & Services) | | | 205,744 | |
| | 6,383 | | T-Mobile U.S., Inc. (Wireless Telecommunication Services) | | | 1,047,897 | |
| | 8,683 | | Tradeweb Markets, Inc. Class A (Capital Markets) | | | 883,148 | |
| | 11,027 | | Tri Pointe Homes, Inc.* (Household Durables) | | | 406,345 | |
| | | |
| | |
| The accompanying notes are an integral part of these financial statements. | | 25 |
GOLDMAN SACHS MULTI-MANAGER GLOBAL EQUITY FUND
|
Schedule of Investments (continued) April 30, 2024 (Unaudited) |
| | | | | | | | |
| | | Shares | | Description | | Value | |
| |
| | Common Stocks (continued) | |
| |
| | United States (continued) | |
| | 4,431 | | TripAdvisor, Inc.* (Interactive Media & Services) | | $ | 116,668 | |
| | 3,775 | | U.S. Physical Therapy, Inc. (Health Care Providers & Services) | | | 383,200 | |
| | 5,759 | | U.S. Silica Holdings, Inc.* (Energy Equipment & Services) | | | 88,861 | |
| | 5,650 | | UFP Industries, Inc. (Building Products) | | | 636,755 | |
| | 2,923 | | Ultra Clean Holdings, Inc.* (Semiconductors & Semiconductor Equipment) | | | 122,269 | |
| | 3,437 | | UMB Financial Corp. (Banks) | | | 273,791 | |
| | 48,876 | | Union Pacific Corp. (Ground Transportation) | | | 11,591,432 | |
| | 12,301 | | UnitedHealth Group, Inc. (Health Care Providers & Services) | | | 5,949,994 | |
| | 2,360 | | Universal Corp. (Tobacco) | | | 121,375 | |
| | 15,309 | | Utz Brands, Inc. (Food Products) | | | 276,021 | |
| | 492 | | Valmont Industries, Inc. (Construction & Engineering) | | | 100,762 | |
| | 9,950 | | Vector Group Ltd. (Tobacco) | | | 102,983 | |
| | 13,493 | | Veracyte, Inc.* (Biotechnology) | | | 264,058 | |
| | 3,935 | | Vestis Corp. (Commerical Services & Supplies) | | | 72,483 | |
| | 3,286 | | Viad Corp.* (Commerical Services & Supplies) | | | 113,301 | |
| | 42,910 | | Viavi Solutions, Inc.* (Communications Equipment) | | | 338,989 | |
| | 9,665 | | Viper Energy, Inc. (Oil, Gas & Consumable Fuels) | | | 368,816 | |
| | 26,310 | | Visa, Inc. Class A (Financial Services) | | | 7,067,129 | |
| | 7,400 | | Vita Coco Co., Inc.* (Beverages) | | | 179,376 | |
| | 14,916 | | Vivid Seats, Inc. Class A* (Entertainment) | | | 78,458 | |
| | 2,122 | | Voya Financial, Inc. (Financial Services) | | | 144,636 | |
| | 1,086 | | Walker & Dunlop, Inc. (Financial Services) | | | 99,510 | |
| | 79,770 | | Walt Disney Co. (Entertainment) | | | 8,862,447 | |
| | 9,170 | | Waste Connections, Inc. (Commerical Services & Supplies) | | | 1,486,365 | |
| | 15,489 | | Waste Management, Inc. (Commerical Services & Supplies) | | | 3,222,022 | |
| | 70,963 | | Wells Fargo & Co. (Banks) | | | 4,209,525 | |
| | 4,066 | | Western Alliance Bancorp (Banks) | | | 231,071 | |
| | 153 | | White Mountains Insurance Group Ltd. (Insurance) | | | 272,055 | |
| | 3,189 | | Wintrust Financial Corp. (Banks) | | | 308,185 | |
| | 6,573 | | World Kinect Corp. (Oil, Gas & Consumable Fuels) | | | 154,466 | |
| | 57,295 | | Zoetis, Inc. (Pharmaceuticals) | | | 9,123,656 | |
| | | | | | | | |
| | | | | | | 609,018,607 | |
| | | |
| | | | | | | | |
| | | Shares | | Description | | Value | |
| |
| | Common Stocks (continued) | |
| |
| | Uruguay* – 0.3% | |
| | 2,162 | | MercadoLibre, Inc. (Broadline Retail) | | $ | 3,153,709 | |
| | | |
| | TOTAL COMMON STOCKS (Cost $855,308,778) | | $ | 993,921,945 | |
| | | |
| | | | | | | | |
| | | Shares | | Dividend
Rate | | Value | |
| |
| | Preferred Stocks – 0.3% | |
| |
| | Brazil – 0.2% | |
| | Cia Energetica de Minas Gerais (Electric Utilities) | |
| | 17,550 | | 11.044% | | $ | 33,021 | |
| | Companhia Paranaense de Energia (Electric Utilities) | |
| | 50,600 | | 4.182 | | | 88,579 | |
| | Itau Unibanco Holding SA (Banks) | |
| | 19,500 | | 7.531 | | | 117,768 | |
| | Itausa SA (Banks) | |
| | 325,705 | | 8.985 | | | 599,649 | |
| | Petroleo Brasileiro SA (Oil, Gas & Consumable Fuels) | |
| | 171,200 | | 8.432 | | | 1,385,399 | |
| | Usinas Siderurgicas de Minas Gerais SA Usiminas (Metals & Mining) | |
| | 50,400 | | 3.579 | | | 76,775 | |
| | | | | | | | |
| | | | | | | 2,301,191 | |
| | | |
| |
| | South Korea – 0.1% | |
| | Samsung Electronics Co. Ltd. (Technology Hardware, Storage & Peripherals) | |
| | 19,686 | | 2.216 | | | 919,161 | |
| | | |
| | TOTAL PREFERRED STOCKS (Cost $3,036,208) | | $ | 3,220,352 | |
| | | |
| | | | | | | | |
| | | Shares | | Description | | Value | |
| |
| | Exchange Traded Funds – 0.3% | |
| | 25,400 | | iShares Core MSCI Emerging Markets ETF | | $ | 1,311,910 | |
| | 38,190 | | iShares MSCI Saudi Arabia ETF | | | 1,642,934 | |
| | | |
| | TOTAL EXCHANGE TRADED FUNDS (Cost $2,955,606) | | $ | 2,954,844 | |
| | | |
| | | | | | | | |
| | | Shares | | Dividend Rate | | Value | |
| |
| | Investment Companies(c) – 7.6% | |
| | Goldman Sachs Financial Square Government Fund — Class R6 | |
| | 40,273,560 | | 5.223% | | $ | 40,273,560 | |
| | | |
| | |
| 26 | | The accompanying notes are an integral part of these financial statements. |
GOLDMAN SACHS MULTI-MANAGER GLOBAL EQUITY FUND
| | | | | | | | |
| | | Shares | | Dividend Rate | | Value | |
| |
| | Investment Companies(c) | |
| | Goldman Sachs Financial Square Government Fund — Institutional Shares | |
| | 42,170,801 | | 5.223% | | $ | 42,170,801 | |
| | | |
| | TOTAL INVESTMENT COMPANIES – 7.6% (Cost $82,444,361) | | $ | 82,444,361 | |
| | | |
| | TOTAL INVESTMENTS – 100.2% (Cost $943,744,953) | | $ | 1,082,541,502 | |
| | | |
| | LIABILITIES IN EXCESS OF
OTHER ASSETS – ( 0.2)% | | | (2,271,196 | ) |
| | | |
| | NET ASSETS – 100.0% | | $ | 1,080,270,306 | |
| | | |
| | |
| The percentage shown for each investment category reflects the value of investments in that category as a percentage of net assets. |
| |
| * | | Non-income producing security. |
| |
| (a) | | Exempt from registration under Rule 144A of the Securities Act of 1933. |
| | |
| |
| (b) | | Significant unobservable inputs were used in the valuation of this portfolio security; i.e., Level 3. |
| |
| (c) | | Represents an Affiliated Issuer. |
| | | | |
|
| SECTOR ALLOCATION AS OF APRIL 30, 2024 | |
| |
Sector | | % of Total
Market Value |
| |
Information Technology | | | 18.7 | % |
| |
Financials | | | 15.7 | |
| |
Industrials | | | 12.7 | |
| |
Health Care | | | 12.5 | |
| |
Consumer Discretionary | | | 10.8 | |
| |
Investment Companies | | | 7.6 | |
| |
Communication Services | | | 5.8 | |
| |
Consumer Staples | | | 4.9 | |
| |
Energy | | | 4.4 | |
| |
Materials | | | 3.5 | |
| |
Real Estate | | | 2.0 | |
| |
Utilities | | | 1.1 | |
| |
Exchange Traded Funds | | | 0.3 | |
| |
| | | | 100.0 | % |
|
|
ADDITIONAL INVESTMENT INFORMATION |
FORWARD FOREIGN CURRENCY EXCHANGE CONTRACTS — At April 30, 2024, the Fund had the following forward foreign currency exchange contracts:
FORWARD FOREIGN CURRENCY EXCHANGE CONTRACTS WITH UNREALIZED GAIN
| | | | | | | | | | | | | | | | | | |
| Counterparty | | Currency Purchased | | | Currency Sold | | | Settlement
Date | | Unrealized
Gain | |
|
| |
| | | | | | |
BNP Paribas SA | | GBP | | | 10,295,000 | | | USD | | | 12,832,814 | | | 05/02/24 | | $ | 31,422 | |
| | HKD | | | 12,080,000 | | | USD | | | 1,542,969 | | | 05/02/24 | | | 1,356 | |
| | ILS | | | 1,280,000 | | | USD | | | 336,504 | | | 05/02/24 | | | 5,619 | |
| | USD | | | 6,481,149 | | | AUD | | | 9,890,000 | | | 05/02/24 | | | 74,022 | |
| | USD | | | 6,425,543 | | | AUD | | | 9,890,000 | | | 06/04/24 | | | 11,881 | |
| | USD | | | 8,386,178 | | | CHF | | | 7,550,000 | | | 05/02/24 | | | 171,135 | |
| | USD | | | 8,281,735 | | | CHF | | | 7,550,000 | | | 06/04/24 | | | 36,173 | |
| | USD | | | 3,277,553 | | | DKK | | | 22,500,000 | | | 05/02/24 | | | 57,653 | |
| | USD | | | 3,233,135 | | | DKK | | | 22,500,000 | | | 06/04/24 | | | 7,911 | |
| | USD | | | 30,457,959 | | | EUR | | | 28,050,000 | | | 05/02/24 | | | 520,652 | |
| | USD | | | 30,042,153 | | | EUR | | | 28,050,000 | | | 06/04/24 | | | 64,909 | |
| | USD | | | 13,014,561 | | | GBP | | | 10,295,000 | | | 05/02/24 | | | 150,324 | |
| | USD | | | 1,545,663 | | | HKD | | | 12,080,000 | | | 05/02/24 | | | 1,338 | |
| | USD | | | 349,903 | | | ILS | | | 1,280,000 | | | 05/02/24 | | | 7,780 | |
| | USD | | | 21,481,939 | | | JPY | | | 3,235,000,000 | | | 05/02/24 | | | 964,183 | |
| | USD | | | 20,895,135 | | | JPY | | | 3,235,000,000 | | | 06/04/24 | | | 272,204 | |
| | USD | | | 536,523 | | | NOK | | | 5,750,000 | | | 05/02/24 | | | 18,875 | |
| | USD | | | 522,317 | | | NOK | | | 5,750,000 | | | 06/04/24 | | | 4,230 | |
| | USD | | | 168,386 | | | NZD | | | 280,000 | | | 05/02/24 | | | 3,397 | |
| | USD | | | 165,875 | | | NZD | | | 280,000 | | | 06/04/24 | | | 886 | |
| | USD | | | 2,827,827 | | | SEK | | | 29,850,000 | | | 05/02/24 | | | 118,988 | |
| | USD | | | 2,728,296 | | | SEK | | | 29,850,000 | | | 06/04/24 | | | 15,436 | |
| | USD | | | 1,057,108 | | | SGD | | | 1,420,000 | | | 05/02/24 | | | 16,759 | |
| | |
| The accompanying notes are an integral part of these financial statements. | | 27 |
GOLDMAN SACHS MULTI-MANAGER GLOBAL EQUITY FUND
|
Schedule of Investments (continued) April 30, 2024 (Unaudited) |
|
|
ADDITIONAL INVESTMENT INFORMATION (continued) |
FORWARD FOREIGN CURRENCY EXCHANGE CONTRACTS WITH UNREALIZED GAIN (continued)
| | | | | | | | | | | | | | | | | | | | |
| Counterparty | | Currency
Purchased | | | Currency Sold | | | Settlement
Date | | | Unrealized
Gain | |
|
| |
| | | | | | |
BNP Paribas SA (continued) | | USD | | | 1,044,111 | | | SGD | | | 1,420,000 | | | | 06/04/24 | | | $ | 2,145 | |
Brown Brothers Harriman & Co. | | USD | | | 18,037 | | | MXN | | | 306,900 | | | | 05/02/24 | | | | 128 | |
JPMorgan Securities, Inc. | | GBP | | | 4,095,000 | | | USD | | | 5,104,456 | | | | 05/02/24 | | | | 12,499 | |
| | HKD | | | 4,870,000 | | | USD | | | 622,041 | | | | 05/02/24 | | | | 547 | |
| | ILS | | | 520,000 | | | USD | | | 136,705 | | | | 05/02/24 | | | | 2,283 | |
| | USD | | | 2,575,489 | | | AUD | | | 3,930,000 | | | | 05/02/24 | | | | 29,482 | |
| | USD | | | 2,553,325 | | | AUD | | | 3,930,000 | | | | 06/04/24 | | | | 4,721 | |
| | USD | | | 3,320,510 | | | CHF | | | 2,990,000 | | | | 05/02/24 | | | | 67,135 | |
| | USD | | | 3,279,787 | | | CHF | | | 2,990,000 | | | | 06/04/24 | | | | 14,325 | |
| | USD | | | 1,319,651 | | | DKK | | | 9,060,000 | | | | 05/02/24 | | | | 23,104 | |
| | USD | | | 1,301,876 | | | DKK | | | 9,060,000 | | | | 06/04/24 | | | | 3,185 | |
| | USD | | | 12,046,328 | | | EUR | | | 11,090,000 | | | | 05/02/24 | | | | 210,152 | |
| | USD | | | 11,877,628 | | | EUR | | | 11,090,000 | | | | 06/04/24 | | | | 25,663 | |
| | USD | | | 5,176,643 | | | GBP | | | 4,095,000 | | | | 05/02/24 | | | | 59,689 | |
| | USD | | | 632,099 | | | HKD | | | 4,940,000 | | | | 05/02/24 | | | | 562 | |
| | USD | | | 142,181 | | | ILS | | | 520,000 | | | | 05/02/24 | | | | 3,193 | |
| | USD | | | 8,484,755 | | | JPY | | | 1,278,000,000 | | | | 05/02/24 | | | | 379,132 | |
| | USD | | | 8,254,709 | | | JPY | | | 1,278,000,000 | | | | 06/04/24 | | | | 107,535 | |
| | USD | | | 214,908 | | | NOK | | | 2,300,000 | | | | 05/02/24 | | | | 7,848 | |
| | USD | | | 208,927 | | | NOK | | | 2,300,000 | | | | 06/04/24 | | | | 1,692 | |
| | USD | | | 66,169 | | | NZD | | | 110,000 | | | | 05/02/24 | | | | 1,351 | |
| | USD | | | 65,165 | | | NZD | | | 110,000 | | | | 06/04/24 | | | | 348 | |
| | USD | | | 1,123,802 | | | SEK | | | 11,850,000 | | | | 05/02/24 | | | | 48,433 | |
| | USD | | | 1,083,092 | | | SEK | | | 11,850,000 | | | | 06/04/24 | | | | 6,128 | |
| | USD | | | 417,098 | | | SGD | | | 560,000 | | | | 05/02/24 | | | | 6,819 | |
| | USD | | | 411,762 | | | SGD | | | 560,000 | | | | 06/04/24 | | | | 846 | |
State Street Bank and Trust | | USD | | | 16,225 | | | EUR | | | 15,128 | | | | 05/02/24 | | | | 78 | |
| | USD | | | 20,343 | | | EUR | | | 19,052 | | | | 05/03/24 | | | | 8 | |
| | USD | | | 71,556 | | | JPY | | | 11,217,565 | | | | 05/01/24 | | | | 420 | |
|
| |
| | | | | | |
| TOTAL | | | | | | | | | | | | | | | | | | $ | 3,576,584 | |
|
| |
|
| FORWARD FOREIGN CURRENCY EXCHANGE CONTRACTS WITH UNREALIZED LOSS | |
| Counterparty | | Currency Purchased | | | Currency Sold | | | Settlement
Date | | | Unrealized
Loss | |
|
| |
| | | | | | |
BNP Paribas SA | | AUD | | | 9,890,000 | | | USD | | | 6,419,216 | | | | 05/02/24 | | | $ | (12,089 | ) |
| | CHF | | | 7,550,000 | | | USD | | | 8,251,144 | | | | 05/02/24 | | | | (36,101 | ) |
| | DKK | | | 22,500,000 | | | USD | | | 3,227,761 | | | | 05/02/24 | | | | (7,860 | ) |
| | EUR | | | 28,050,000 | | | USD | | | 30,002,493 | | | | 05/02/24 | | | | (65,186 | ) |
| | JPY | | | 3,235,000,000 | | | USD | | | 20,790,427 | | | | 05/02/24 | | | | (272,671 | ) |
| | NOK | | | 5,750,000 | | | USD | | | 521,881 | | | | 05/02/24 | | | | (4,233 | ) |
| | NZD | | | 280,000 | | | USD | | | 165,872 | | | | 05/02/24 | | | | (882 | ) |
| | SEK | | | 29,850,000 | | | USD | | | 2,724,290 | | | | 05/02/24 | | | | (15,451 | ) |
| | SGD | | | 1,420,000 | | | USD | | | 1,042,542 | | | | 05/02/24 | | | | (2,193 | ) |
| | USD | | | 12,834,973 | | | GBP | | | 10,295,000 | | | | 06/04/24 | | | | (31,506 | ) |
| | USD | | | 1,544,842 | | | HKD | | | 12,080,000 | | | | 06/04/24 | | | | (1,137 | ) |
| | USD | | | 337,020 | | | ILS | | | 1,280,000 | | | | 06/04/24 | | | | (5,611 | ) |
JPMorgan Securities, Inc. | | AUD | | | 3,930,000 | | | USD | | | 2,550,811 | | | | 05/02/24 | | | | (4,804 | ) |
| | CHF | | | 2,990,000 | | | USD | | | 3,267,672 | | | | 05/02/24 | | | | (14,297 | ) |
| | |
| 28 | | The accompanying notes are an integral part of these financial statements. |
GOLDMAN SACHS MULTI-MANAGER GLOBAL EQUITY FUND
|
|
ADDITIONAL INVESTMENT INFORMATION (continued) |
FORWARD FOREIGN CURRENCY EXCHANGE CONTRACTS WITH UNREALIZED LOSS (continued)
| | | | | | | | | | | | | | | | | | | | |
| Counterparty | | Currency
Purchased | | | Currency Sold | | | Settlement
Date | | | Unrealized
Loss | |
|
| |
| | | | | | |
JPMorgan Securities, Inc. (continued) | | DKK | | | 9,060,000 | | | USD | | | 1,299,712 | | | | 05/02/24 | | | $ | (3,165 | ) |
| | EUR | | | 11,090,000 | | | USD | | | 11,861,948 | | | | 05/02/24 | | | | (25,772 | ) |
| | HKD | | | 70,000 | | | USD | | | 8,957 | | | | 05/02/24 | | | | (8 | ) |
| | JPY | | | 1,278,000,000 | | | USD | | | 8,213,343 | | | | 05/02/24 | | | | (107,720 | ) |
| | NOK | | | 2,300,000 | | | USD | | | 208,753 | | | | 05/02/24 | | | | (1,693 | ) |
| | NZD | | | 110,000 | | | USD | | | 65,164 | | | | 05/02/24 | | | | (347 | ) |
| | SEK | | | 11,850,000 | | | USD | | | 1,081,502 | | | | 05/02/24 | | | | (6,134 | ) |
| | SGD | | | 560,000 | | | USD | | | 411,143 | | | | 05/02/24 | | | | (865 | ) |
| | USD | | | 5,105,315 | | | GBP | | | 4,095,000 | | | | 06/04/24 | | | | (12,532 | ) |
| | USD | | | 622,796 | | | HKD | | | 4,870,000 | | | | 06/04/24 | | | | (458 | ) |
| | USD | | | 136,914 | | | ILS | | | 520,000 | | | | 06/04/24 | | | | (2,280 | ) |
State Street Bank and Trust | | EUR | | | 20,388 | | | USD | | | 21,865 | | | | 05/02/24 | | | | (106 | ) |
| | EUR | | | 48,655 | | | USD | | | 51,957 | | | | 05/03/24 | | | | (27 | ) |
| | JPY | | | 28,984,609 | | | USD | | | 184,891 | | | | 05/01/24 | | | | (1,085 | ) |
UBS AG (London) | | TRY | | | 1,475,822 | | | USD | | | 45,497 | | | | 05/02/24 | | | | (4 | ) |
| | TRY | | | 1,938,700 | | | USD | | | 59,762 | | | | 05/03/24 | | | | (51 | ) |
|
| |
| | | | | | |
| TOTAL | | | | | | | | | | | | | | | | | | $ | (636,268 | ) |
|
| |
FUTURES CONTRACTS — At April 30, 2024, the Fund had the following futures contracts:
| | | | | | | | | | | | | | | | |
| Description | | Number of
Contracts | | | Expiration
Date | | | Notional
Amount | | | Unrealized
Appreciation/
(Depreciation) | |
|
| |
| | | | |
Long position contracts: | | | | | | | | | | | | | | | | |
S&P 500 E-Mini Index | | | 230 | | | | 06/21/24 | | | $ | 58,270,500 | | | | $(1,940,991 | ) |
S&P Toronto Stock Exchange 60 Index | | | 159 | | | | 06/20/24 | | | | 30,156,467 | | | | (313,540 | ) |
|
| |
| | | | |
| TOTAL FUTURES CONTRACTS | | | | | | | | | | | | | | | $(2,254,531 | ) |
|
| |
| | | | |
| | |
| |
| Currency Abbreviations: | | |
| AUD | | —Australian Dollar | | |
| CHF | | —Swiss Franc | | |
| DKK | | —Denmark Krone | | |
| EUR | | —Euro | | |
| GBP | | —British Pound | | |
| HKD | | —Hong Kong Dollar | | |
| ILS | | —Israeli Shekel | | |
| JPY | | —Japanese Yen | | |
| MXN | | —Mexican Peso | | |
| NOK | | —Norwegian Krone | | |
| NZD | | —New Zealand Dollar | | |
| SEK | | —Swedish Krona | | |
| SGD | | —Singapore Dollar | | |
| TRY | | —Turkish Lira | | |
| USD | | —U.S. Dollar | | |
| |
| | |
| | |
| The accompanying notes are an integral part of these financial statements. | | 29 |
GOLDMAN SACHS MULTI-MANAGER GLOBAL EQUITY FUND
|
Schedule of Investments (continued) April 30, 2024 (Unaudited) |
|
|
ADDITIONAL INVESTMENT INFORMATION (continued) |
| | | | |
| | |
| |
| Investment Abbreviations: | | |
| ADR | | —American Depositary Receipt | | |
| ETF | | —Exchange Traded Fund | | |
| MSCI | | —Morgan Stanley Capital International | | |
| PLC | | —Public Limited Company | | |
| REIT | | —Real Estate Investment Trust | | |
| |
| | |
| | |
| 30 | | The accompanying notes are an integral part of these financial statements. |
GOLDMAN SACHS MULTI-MANAGER NON-CORE FIXED INCOME FUND
|
Schedule of Investments April 30, 2024 (Unaudited) |
| | | | | | | | | | | | | | | | |
| | | | | Principal Amount | | | Interest
Rate | | | Maturity
Date | | Value | |
| |
| | Sovereign Debt Obligations – 36.2% | |
| |
| | Brazil Real – 4.2% | |
| | Brazil Notas do Tesouro Nacional | |
| | BRL | | | 65,480,000 | | | | 10.000 | % | | 01/01/25 | | $ | 12,570,256 | |
| | | | | 82,765,000 | | | | 10.000 | | | 01/01/27 | | | 15,599,368 | |
| | | | | 86,100,000 | | | | 10.000 | | | 01/01/29 | | | 15,762,244 | |
| | | | | 108,036,000 | | | | 10.000 | | | 01/01/31 | | | 19,239,910 | |
| | | | | | | | | | | | | | | | |
| | | | | | | | | | | | | | | 63,171,778 | |
| | | |
| |
| | Chilean Peso – 0.2% | |
| | Bonos de la Tesoreria de la Republica | |
| | CLP | | | 74,523,960 | | | | 2.000 | | | 03/01/35 | | | 72,199 | |
| | Bonos de la Tesoreria de la Republica en pesos | |
| | | | | 285,000,000 | | | | 4.500 | | | 03/01/26 | | | 290,879 | |
| | | | | 1,375,000,000 | | | | 5.000 | | | 10/01/28 | | | 1,383,283 | |
| | | | | 895,000,000 | | | | 6.000 | | | 04/01/33 | | | 927,634 | |
| | | | | 550,000,000 | | | | 5.000 | | | 03/01/35 | | | 524,213 | |
| | | | | | | | | | | | | | | | |
| | | | | | | | | | | | | | | 3,198,208 | |
| | | |
| |
| | Colombia Peso – 1.5% | |
| | Colombia TES | |
| | COP | | | 4,371,800,000 | | | | 6.000 | | | 04/28/28 | | | 970,101 | |
| | | | | 25,077,700,000 | | | | 7.750 | | | 09/18/30 | | | 5,669,219 | |
| | | | | 25,047,500,000 | | | | 7.000 | | | 06/30/32 | | | 5,212,153 | |
| | | | | 24,058,900,000 | | | | 13.250 | | | 02/09/33 | | | 7,013,786 | |
| | | | | 15,330,000,000 | | | | 7.250 | | | 10/18/34 | | | 3,092,387 | |
| | | | | 8,216,000,000 | | | | 6.250 | | | 07/09/36 | | | 1,452,099 | |
| | | | | | | | | | | | | | | | |
| | | | | | | | | | | | | | | 23,409,745 | |
| | | |
| |
| | Czech Republic Koruna – 1.6% | |
| | Czech Republic Government Bonds | |
| | CZK | | | 42,110,000 | | | | 2.500 | | | 08/25/28 | | | 1,668,413 | |
| | | | | 77,560,000 | | | | 5.500 | | | 12/12/28 | | | 3,467,316 | |
| | | | | 44,920,000 | | | | 0.950 | | | 05/15/30 | | | 1,572,844 | |
| | | | | 60,910,000 | | | | 5.000 | | | 09/30/30 | | | 2,684,550 | |
| | | | | 94,200,000 | | | | 1.750 | | | 06/23/32 | | | 3,291,297 | |
| | | | | 81,840,000 | | | | 2.000 | | | 10/13/33 | | | 2,845,625 | |
| | | | | 208,050,000 | | | | 3.500 | | | 05/30/35 | | | 8,128,084 | |
| | | | | | | | | | | | | | | | |
| | | | | | | | | | | | | | | 23,658,129 | |
| | | |
| |
| | Egyptian Pound – 1.1% | |
| | Egypt Treasury Bills (a) | |
| | EGP | | | 187,575,000 | | | | 0.000 | | | 06/11/24 | | | 3,810,340 | |
| | | | | 208,000,000 | | | | 0.000 | | | 09/10/24 | | | 3,968,584 | |
| | | | | 194,050,000 | | | | 0.000 | | | 09/17/24 | | | 3,676,609 | |
| | | | | 110,675,000 | | | | 0.000 | | | 12/10/24 | | | 1,991,641 | |
| | | | | 202,750,000 | | | | 0.000 | | | 12/17/24 | | | 3,632,678 | |
| | | | | | | | | | | | | | | | |
| | | | | | | | | | | | | | | 17,079,852 | |
| | | |
| |
| | Hungarian Forint – 0.9% | |
| | Hungary Government Bonds | |
| | HUF | | | 875,110,000 | | | | 5.500 | | | 06/24/25 | | | 2,340,017 | |
| | | | | 463,200,000 | | | | 2.750 | | | 12/22/26 | | | 1,129,977 | |
| | | | | 594,880,000 | | | | 3.000 | | | 10/27/27 | | | 1,415,536 | |
| | | | | 496,810,000 | | | | 3.250 | | | 10/22/31 | | | 1,053,774 | |
| | | | | 518,390,000 | | | | 4.750 | | | 11/24/32 | | | 1,199,069 | |
| | | |
| | | | | | | | | | | | | | | | |
| | | | | Principal Amount | | | Interest
Rate | | | Maturity
Date | | Value | |
| |
| | Sovereign Debt Obligations – (continued) | |
| |
| | Hungarian Forint – (continued) | |
| | HUF | | | 3,224,840,000 | | | | 2.250 | % | | 04/20/33 | | $ | 6,004,267 | |
| | | | | | | | | | | | | | | | |
| | | | | | | | | | | | | | | 13,142,640 | |
| | | |
| |
| | Indian Rupee – 1.0% | |
| | India Government Bonds | |
| | INR | | | 253,000,000 | | | | 7.320 | | | 11/13/30 | | | 3,035,677 | |
| | | | | 1,069,660,000 | | | | 7.180 | | | 08/14/33 | | | 12,802,844 | |
| | | | | | | | | | | | | | | | |
| | | | | | | | | | | | | | | 15,838,521 | |
| | | |
| |
| | Indonesia Rupiah – 3.0% | |
| | Indonesia Treasury Bonds | |
| | IDR | | | 43,278,000,000 | | | | 8.375 | | | 09/15/26 | | | 2,723,684 | |
| | | | | 24,713,000,000 | | | | 6.375 | | | 08/15/28 | | | 1,477,920 | |
| | | | | 30,431,000,000 | | | | 9.000 | | | 03/15/29 | | | 2,008,147 | |
| | | | | 80,973,000,000 | | | | 6.875 | | | 04/15/29 | | | 4,915,805 | |
| | | | | 46,028,000,000 | | | | 7.000 | | | 09/15/30 | | | 2,793,836 | |
| | | | | 76,236,000,000 | | | | 6.375 | | | 04/15/32 | | | 4,437,792 | |
| | | | | 84,613,000,000 | | | | 7.500 | | | 08/15/32 | | | 5,321,356 | |
| | | | | 82,740,000,000 | | | | 7.000 | | | 02/15/33 | | | 5,013,486 | |
| | | | | 217,561,000,000 | | | | 6.625 | | | 02/15/34 | | | 12,795,946 | |
| | | | | 18,457,000,000 | | | | 8.375 | | | 03/15/34 | | | 1,219,342 | |
| | | | | 21,618,000,000 | | | | 7.500 | | | 06/15/35 | | | 1,351,787 | |
| | | | | 21,506,000,000 | | | | 8.375 | | | 04/15/39 | | | 1,460,238 | |
| | | | | | | | | | | | | | | | |
| | | | | | | | | | | | | | | 45,519,339 | |
| | | |
| |
| | Malaysia Ringgit – 2.7% | |
| | Malaysia Government Bonds | |
| | MYR | | | 34,323,000 | | | | 3.882 | | | 03/14/25 | | | 7,217,359 | |
| | | | | 38,600,000 | | | | 3.733 | | | 06/15/28 | | | 8,067,784 | |
| | | | | 32,217,000 | | | | 3.885 | | | 08/15/29 | | | 6,777,552 | |
| | | | | 19,860,000 | | | | 2.632 | | | 04/15/31 | | | 3,842,998 | |
| | | | | 9,583,000 | | | | 3.582 | | | 07/15/32 | | | 1,953,346 | |
| | | | | 25,986,000 | | | | 4.762 | | | 04/07/37 | | | 5,804,856 | |
| | | | | 19,729,000 | | | | 4.893 | | | 06/08/38 | | | 4,469,978 | |
| | | | | 10,544,000 | | | | 3.757 | | | 05/22/40 | | | 2,108,579 | |
| | Malaysia Government Investment Issue | |
| | | | | 6,994,000 | | | | 3.465 | | | 10/15/30 | | | 1,430,748 | |
| | | | | | | | | | | | | | | | |
| | | | | | | | | | | | | | | 41,673,200 | |
| | | |
| |
| | Mexican Peso – 2.4% | |
| | Mexico Bonos | |
| | MXN | | | 91,132,900 | | | | 5.750 | | | 03/05/26 | | | 4,875,742 | |
| | | | | 81,658,000 | | | | 8.500 | | | 05/31/29 | | | 4,467,362 | |
| | | | | 153,148,300 | | | | 7.750 | | | 05/29/31 | | | 7,914,037 | |
| | | | | 145,127,400 | | | | 7.500 | | | 05/26/33 | | | 7,218,014 | |
| | | | | 17,967,900 | | | | 7.750 | | | 11/23/34 | | | 897,058 | |
| | | | | 35,107,700 | | | | 10.000 | | | 11/20/36 | | | 2,056,836 | |
| | | | | 89,433,200 | | | | 8.500 | | | 11/18/38 | | | 4,617,394 | |
| | | | | 90,073,200 | | | | 7.750 | | | 11/13/42 | | | 4,233,662 | |
| | | | | | | | | | | | | | | | |
| | | | | | | | | | | | | | | 36,280,105 | |
| | | |
| |
| | Peru Nuevo Sol – 0.4% | |
| | Peru Government Bonds | |
| | PEN | | | 4,150,000 | | | | 6.150 | | | 08/12/32 | | | 1,040,751 | |
| | | | | 5,636,000 | | | | 7.300 | | | 08/12/33 | | | 1,508,504 | |
| | | |
| | |
| The accompanying notes are an integral part of these financial statements. | | 31 |
GOLDMAN SACHS MULTI-MANAGER NON-CORE FIXED INCOME FUND
|
Schedule of Investments (continued) April 30, 2024 (Unaudited) |
| | | | | | | | | | | | | | | | |
| | | | | Principal Amount | | | Interest Rate | | | Maturity Date | | Value | |
| |
| | Sovereign Debt Obligations – (continued) | |
| |
| | Peru Nuevo Sol – (continued) | |
| | PEN | | | 5,908,000 | | | | 5.400 | % | | 08/12/34 | | $ | 1,355,409 | |
| | Peru Government International Bonds | |
| | | | | 8,176,000 | | | | 6.900 | | | 08/12/37 | | | 2,061,849 | |
| | | | | | | | | | | | | | | | |
| | | | | | | | | | | | | | | 5,966,513 | |
| | | |
| |
| | Polish Zloty – 1.7% | |
| | Republic of Poland Government Bonds | |
| | PLN | | | 13,923,000 | | | | 0.750 | | | 04/25/25 | | | 3,292,211 | |
| | | | | 13,028,000 | | | | 3.250 | | | 07/25/25 | | | 3,136,047 | |
| | | | | 13,523,000 | | | | 2.500 | | | 07/25/27 | | | 3,052,443 | |
| | | | | 14,157,000 | | | | 2.750 | | | 10/25/29 | | | 3,038,150 | |
| | | | | 36,934,000 | | | | 1.250 | | | 10/25/30 | | | 7,002,382 | |
| | | | | 23,937,000 | | | | 1.750 | | | 04/25/32 | | | 4,439,533 | |
| | | | | 6,797,000 | | | | 6.000 | | | 10/25/33 | | | 1,708,952 | |
| | | | | | | | | | | | | | | | |
| | | | | | | | | | | | | | | 25,669,718 | |
| | | |
| |
| | Romania New Leu – 1.2% | |
| | Romania Government Bonds | |
| | RON | | | 5,615,000 | | | | 4.750 | | | 02/24/25 | | | 1,191,941 | |
| | | | | 10,565,000 | | | | 3.250 | | | 06/24/26 | | | 2,143,042 | |
| | | | | 16,200,000 | | | | 5.800 | | | 07/26/27 | | | 3,421,291 | |
| | | | | 16,485,000 | | | | 4.150 | | | 01/26/28 | | | 3,285,069 | |
| | | | | 40,445,000 | | | | 6.700 | | | 02/25/32 | | | 8,575,655 | |
| | | | | | | | | | | | | | | | |
| | | | | | | | | | | | | | | 18,616,998 | |
| | | |
| |
| | South African Rand – 2.5% | |
| | Republic of South Africa Government Bonds | |
| | ZAR | | | 50,988,411 | | | | 10.500 | | | 12/21/26 | | | 2,773,355 | |
| | | | | 166,623,177 | | | | 8.250 | | | 03/31/32 | | | 7,367,669 | |
| | | | | 61,579,560 | | | | 8.875 | | | 02/28/35 | | | 2,631,259 | |
| | | | | 102,991,381 | | | | 6.250 | | | 03/31/36 | | | 3,442,317 | |
| | | | | 140,312,261 | | | | 8.500 | | | 01/31/37 | | | 5,571,419 | |
| | | | | 145,916,073 | | | | 9.000 | | | 01/31/40 | | | 5,790,520 | |
| | | | | 255,739,071 | | | | 8.750 | | | 01/31/44 | | | 9,638,702 | |
| | | | | | | | | | | | | | | | |
| | | | | | | | | | | | | | | 37,215,241 | |
| | | |
| |
| | Thailand Baht – 2.0% | |
| | Thailand Government Bonds | |
| | THB | | | 232,116,000 | | | | 2.250 | | | 03/17/27 | | | 6,221,285 | |
| | | | | 217,633,000 | | | | 1.600 | | | 12/17/29 | | | 5,555,925 | |
| | | | | 91,813,000 | | | | 2.000 | | | 12/17/31 | | | 2,351,562 | |
| | | | | 219,138,000 | | | | 3.350 | | | 06/17/33 | | | 6,162,000 | |
| | | | | 39,026,000 | | | | 1.585 | | | 12/17/35 | | | 916,363 | |
| | | | | 120,623,000 | | | | 3.300 | | | 06/17/38 | | | 3,337,150 | |
| | | | | 203,212,000 | | | | 3.450 | | | 06/17/43 | | | 5,580,927 | |
| | | | | | | | | | | | | | | | |
| | | | | | | | | | | | | | | 30,125,212 | |
| | | |
| |
| | United States Dollar – 9.8% | |
| | Abu Dhabi Government International Bonds | |
| | $ | | | 3,442,000 | | | | 1.700 | | | 03/02/31 | | | 2,774,037 | |
| | | | | 881,000 | | | | 5.000 | (b) | | 04/30/34 | | | 871,838 | |
| | | | | 1,226,000 | | | | 3.125 | | | 09/30/49 | | | 804,562 | |
| | | | | 253,000 | | | | 3.000 | | | 09/15/51 | | | 161,535 | |
| | | | | 254,000 | | | | 3.000 | (b) | | 09/15/51 | | | 160,893 | |
| | | | | 715,000 | | | | 5.500 | (b) | | 04/30/54 | | | 692,656 | |
| | | |
| | | | | | | | | | | | | | | | |
| | | | | Principal Amount | | | Interest Rate | | | Maturity Date | | Value | |
| |
| | Sovereign Debt Obligations – (continued) | |
| |
| | United States Dollar – (continued) | |
| | Angola Government International Bonds | |
| | $ | | | 349,000 | | | | 8.750 | %(b) | | 04/14/32 | | $ | 315,736 | |
| | | | | 1,850,000 | | | | 8.750 | | | 04/14/32 | | | 1,673,672 | |
| | Argentina Republic Government International Bonds (c)(d) | |
| | | | | 6,248,919 | | | | 3.500 | | | 07/09/41 | | | 2,730,778 | |
| | Bahrain Government International Bonds | |
| | | | | 200,000 | | | | 7.000 | | | 01/26/26 | | | 201,188 | |
| | | | | 1,138,000 | | | | 4.250 | | | 01/25/28 | | | 1,051,370 | |
| | | | | 2,560,000 | | | | 5.450 | | | 09/16/32 | | | 2,297,984 | |
| | | | | 233,000 | | | | 7.500 | (b) | | 02/12/36 | | | 231,486 | |
| | Benin Government International Bonds | |
| | | | | 505,000 | | | | 7.960 | (b) | | 02/13/38 | | | 477,067 | |
| | | | | 200,000 | | | | 7.960 | | | 02/13/38 | | | 188,500 | |
| | Bolivia Government International Bonds | |
| | | | | 409,000 | | | | 4.500 | | | 03/20/28 | | | 229,679 | |
| | Brazil Government International Bonds | |
| | | | | 3,477,000 | | | | 6.125 | | | 03/15/34 | | | 3,320,535 | |
| | | | | 2,904,000 | | | | 4.750 | (c) | | 01/14/50 | | | 2,042,964 | |
| | | | | 1,005,000 | | | | 7.125 | | | 05/13/54 | | | 958,770 | |
| | CBB International Sukuk Programme Co. WLL | |
| | | | | 791,000 | | | | 3.875 | | | 05/18/29 | | | 705,612 | |
| | | | | 306,000 | | | | 6.000 | (b) | | 02/12/31 | | | 302,653 | |
| | Chile Government International Bonds (c) | |
| | | | | 2,269,000 | | | | 4.850 | | | 01/22/29 | | | 2,206,602 | |
| | | | | 732,632 | | | | 4.950 | | | 01/05/36 | | | 681,577 | |
| | China Government International Bonds | |
| | | | | 707,000 | | | | 0.750 | | | 10/26/24 | | | 690,651 | |
| | | | | 1,796,000 | | | | 1.950 | | | 12/03/24 | | | 1,757,835 | |
| | | | | 688,000 | | | | 0.550 | | | 10/21/25 | | | 641,512 | |
| | | | | 256,000 | | | | 1.250 | | | 10/26/26 | | | 233,674 | |
| | Colombia Government International Bonds (c) | |
| | | | | 2,651,000 | | | | 8.000 | | | 04/20/33 | | | 2,692,090 | |
| | | | | 726,000 | | | | 8.000 | | | 11/14/35 | | | 729,993 | |
| | | | | 1,034,000 | | | | 4.125 | | | 05/15/51 | | | 599,203 | |
| | | | | 1,126,000 | | | | 8.750 | | | 11/14/53 | | | 1,155,276 | |
| | Costa Rica Government International Bonds (c) | |
| | | | | 400,000 | | | | 6.550 | | | 04/03/34 | | | 403,800 | |
| | | | | 1,347,000 | | | | 7.300 | (b) | | 11/13/54 | | | 1,400,880 | |
| | | | | 200,000 | | | | 7.300 | | | 11/13/54 | | | 208,000 | |
| | Dominican Republic International Bonds (c) | |
| | | | | 4,089,000 | | | | 7.050 | | | 02/03/31 | | | 4,131,168 | |
| | Ecuador Government International Bonds | |
| | | | | 437,130 | | | | 0.000 | (a) | | 07/31/30 | | | 237,362 | |
| | | | | 733,798 | | | | 6.000 | (d) | | 07/31/30 | | | 513,292 | |
| | | | | 2,508,084 | | | | 3.500 | (d) | | 07/31/35 | | | 1,366,906 | |
| | Egypt Government International Bonds | |
| | | | | 1,111,000 | | | | 7.625 | | | 05/29/32 | | | 922,477 | |
| | | | | 2,529,000 | | | | 7.300 | | | 09/30/33 | | | 2,023,990 | |
| | | | | 905,000 | | | | 8.500 | | | 01/31/47 | | | 690,786 | |
| | Egyptian Financial Co. for Sovereign Taskeek | |
| | | | | 1,090,000 | | | | 10.875 | | | 02/28/26 | | | 1,125,425 | |
| | El Salvador Government International Bonds | |
| | | | | 305,000 | | | | 8.250 | | | 04/10/32 | | | 242,475 | |
| | | | | 454,000 | | | | 7.125 | (c) | | 01/20/50 | | | 290,560 | |
| | | | | 793,000 | | | | 9.500 | (c) | | 07/15/52 | | | 622,505 | |
| | | |
| | |
| 32 | | The accompanying notes are an integral part of these financial statements. |
GOLDMAN SACHS MULTI-MANAGER NON-CORE FIXED INCOME FUND
| | | | | | | | | | | | | | | | |
| | | | | Principal Amount | | | Interest Rate | | | Maturity Date | | Value | |
| |
| | Sovereign Debt Obligations – (continued) | |
| |
| | United States Dollar – (continued) | |
| | Ethiopia International Bonds | |
| | $ | | | 200,000 | | | | 6.625 | % | | 12/11/24 | | $ | 140,563 | |
| | Export-Import Bank of India | |
| | | | | 1,232,000 | | | | 2.250 | | | 01/13/31 | | | 992,487 | |
| | Finance Department Government of Sharjah (b) | |
| | | | | 453,000 | | | | 6.125 | | | 03/06/36 | | | 441,250 | |
| | Gabon Government International Bonds (c) | |
| | | | | 435,000 | | | | 7.000 | (b) | | 11/24/31 | | | 342,563 | |
| | | | | 200,000 | | | | 7.000 | | | 11/24/31 | | | 157,500 | |
| | Ghana Government International Bonds | |
| | | | | 2,332,000 | | | | 8.625 | | | 04/07/34 | | | 1,130,291 | |
| | | | | 1,195,000 | | | | 7.875 | | | 02/11/35 | | | 578,081 | |
| | Guatemala Government Bonds | |
| | | | | 678,000 | | | | 4.875 | | | 02/13/28 | | | 638,379 | |
| | | | | 200,000 | | | | 6.600 | (c) | | 06/13/36 | | | 195,688 | |
| | | | | 1,028,000 | | | | 6.600 | (b)(c) | | 06/13/36 | | | 1,005,834 | |
| | Hazine Mustesarligi Varlik Kiralama AS | |
| | | | | 813,000 | | | | 8.509 | | | 01/14/29 | | | 855,682 | |
| | | | | 2,759,000 | | | | 8.509 | (b) | | 01/14/29 | | | 2,903,847 | |
| | Honduras Government International Bonds (c) | |
| | | | | 259,000 | | | | 5.625 | | | 06/24/30 | | | 221,850 | |
| | Hungary Government International Bonds | |
| | | | | 200,000 | | | | 6.125 | (b) | | 05/22/28 | | | 201,700 | |
| | | | | 2,217,000 | | | | 6.125 | | | 05/22/28 | | | 2,235,844 | |
| | | | | 750,000 | | | | 5.500 | (b) | | 03/26/36 | | | 700,425 | |
| | | | | 658,000 | | | | 5.500 | | | 03/26/36 | | | 614,506 | |
| | | | | 2,182,000 | | | | 3.125 | | | 09/21/51 | | | 1,292,071 | |
| | Indonesia Government International Bonds | |
| | | | | 1,025,000 | | | | 4.550 | (c) | | 01/11/28 | | | 993,930 | |
| | | | | 1,778,000 | | | | 4.400 | (c) | | 03/10/29 | | | 1,706,880 | |
| | | | | 1,562,000 | | | | 2.850 | | | 02/14/30 | | | 1,363,821 | |
| | | | | 1,741,000 | | | | 3.550 | (c) | | 03/31/32 | | | 1,522,287 | |
| | | | | 2,630,000 | | | | 5.650 | (c) | | 01/11/53 | | | 2,575,756 | |
| | Israel Government International Bonds | |
| | | | | 1,246,000 | | | | 5.750 | | | 03/12/54 | | | 1,124,515 | |
| | | | | 493,000 | | | | 4.500 | (e) | | 04/03/20 | | | 338,321 | |
| | Ivory Coast Government International Bonds (b) | |
| | | | | 1,190,000 | | | | 8.250 | | | 01/30/37 | | | 1,136,450 | |
| | Jordan Government International Bonds | |
| | | | | 811,000 | | | | 7.500 | (b) | | 01/13/29 | | | 799,342 | |
| | | | | 886,000 | | | | 7.500 | | | 01/13/29 | | | 873,264 | |
| | Kazakhstan Government International Bonds | |
| | | | | 923,000 | | | | 4.875 | | | 10/14/44 | | | 853,821 | |
| | Lebanon Government International Bonds (f) | |
| | | | | 3,668,000 | | | | 6.100 | | | 10/04/22 | | | 232,918 | |
| | | | | 1,247,000 | | | | 6.600 | | | 11/27/26 | | | 78,935 | |
| | | | | 1,564,000 | | | | 7.000 | | | 03/20/28 | | | 97,750 | |
| | | | | 1,259,000 | | | | 6.650 | | | 11/03/28 | | | 79,947 | |
| | | | | 758,000 | | | | 11.500 | | | 11/27/29 | | | 49,081 | |
| | Mexico Government International Bonds | |
| | | | | 1,408,000 | | | | 5.000 | (c) | | 05/07/29 | | | 1,358,016 | |
| | | | | 3,046,000 | | | | 2.659 | (c) | | 05/24/31 | | | 2,472,019 | |
| | | | | 200,000 | | | | 6.000 | (c) | | 05/07/36 | | | 192,400 | |
| | | | | 928,000 | | | | 4.600 | | | 01/23/46 | | | 708,760 | |
| | | |
| | | | | | | | | | | | | | | | |
| | | | | Principal Amount | | | Interest Rate | | | Maturity Date | | Value | |
| |
| | Sovereign Debt Obligations – (continued) | |
| |
| | United States Dollar – (continued) | |
| | Mongolia Government International Bonds (b) | |
| | $ | | | 471,000 | | | | 7.875 | % | | 06/05/29 | | $ | 476,351 | |
| | Montenegro Government International Bonds (b) | |
| | | | | 200,000 | | | | 7.250 | | | 03/12/31 | | | 200,313 | |
| | Morocco Government International Bonds | |
| | | | | 408,000 | | | | 5.950 | (b) | | 03/08/28 | | | 404,736 | |
| | | | | 498,000 | | | | 4.000 | | | 12/15/50 | | | 328,058 | |
| | Mozambique International Bonds (d) | |
| | | | | 269,000 | | | | 9.000 | | | 09/15/31 | | | 224,615 | |
| | Nigeria Government International Bonds | |
| | | | | 1,107,000 | | | | 8.375 | | | 03/24/29 | | | 1,049,159 | |
| | | | | 2,997,000 | | | | 7.375 | | | 09/28/33 | | | 2,480,017 | |
| | Oman Government International Bonds | |
| | | | | 5,046,000 | | | | 6.750 | | | 10/28/27 | | | 5,161,112 | |
| | Pakistan Global Sukuk Programme Co. Ltd. | |
| | | | | 455,000 | | | | 7.950 | | | 01/31/29 | | | 394,855 | |
| | Pakistan Government International Bonds | |
| | | | | 236,000 | | | | 8.250 | | | 09/30/25 | | | 224,226 | |
| | | | | 923,000 | | | | 8.875 | | | 04/08/51 | | | 704,941 | |
| | Panama Government International Bonds (c) | |
| | | | | 919,000 | | | | 2.252 | | | 09/29/32 | | | 634,570 | |
| | | | | 1,020,000 | | | | 6.400 | | | 02/14/35 | | | 934,320 | |
| | | | | 1,380,000 | | | | 8.000 | | | 03/01/38 | | | 1,408,031 | |
| | | | | 1,562,000 | | | | 4.500 | | | 04/16/50 | | | 1,003,585 | |
| | | | | 853,000 | | | | 7.875 | | | 03/01/57 | | | 837,006 | |
| | Paraguay Government International Bonds (c) | |
| | | | | 1,146,000 | | | | 5.850 | (b) | | 08/21/33 | | | 1,108,039 | |
| | | | | 200,000 | | | | 5.850 | | | 08/21/33 | | | 193,375 | |
| | Peru Government International Bonds (c) | |
| | | | | 4,022,000 | | | | 2.783 | | | 01/23/31 | | | 3,348,315 | |
| | | | | 172,000 | | | | 3.230 | (g) | | 07/28/21 | | | 90,676 | |
| | Philippines Government International Bonds | |
| | | | | 1,561,000 | | | | 5.170 | | | 10/13/27 | | | 1,549,292 | |
| | | | | 1,326,000 | | | | 1.648 | | | 06/10/31 | | | 1,031,379 | |
| | | | | 2,843,000 | | | | 1.950 | | | 01/06/32 | | | 2,219,317 | |
| | | | | 825,000 | | | | 5.000 | | | 07/17/33 | | | 797,672 | |
| | Qatar Government International Bonds | |
| | | | | 4,331,000 | | | | 4.500 | | | 04/23/28 | | | 4,251,147 | |
| | | | | 945,000 | | | | 4.817 | | | 03/14/49 | | | 834,529 | |
| | Republic of Azerbaijan International Bonds | |
| | | | | 33,000 | | | | 5.125 | | | 09/01/29 | | | 31,432 | |
| | | | | 835,000 | | | | 5.125 | | | 09/01/29 | | | 795,329 | |
| | | | | 175,000 | | | | 3.500 | | | 09/01/32 | | | 145,303 | |
| | Republic of Kenya Government International Bonds | |
| | | | | 1,405,000 | | | | 9.750 | (b) | | 02/16/31 | | | 1,408,952 | |
| | | | | 220,000 | | | | 9.750 | | | 02/16/31 | | | 220,506 | |
| | Republic of Poland Government International Bonds (c) | |
| | | | | 963,000 | | | | 4.625 | | | 03/18/29 | | | 938,569 | |
| | | | | 406,000 | | | | 4.875 | | | 10/04/33 | | | 386,745 | |
| | | | | 1,686,000 | | | | 5.125 | | | 09/18/34 | | | 1,622,353 | |
| | | | | 790,000 | | | | 5.500 | | | 04/04/53 | | | 747,427 | |
| | | | | 2,329,000 | | | | 5.500 | | | 03/18/54 | | | 2,192,637 | |
| | Republic of South Africa Government International Bonds | |
| | | | | 1,111,000 | | | | 5.875 | | | 04/20/32 | | | 987,401 | |
| | | | | 3,505,000 | | | | 5.750 | | | 09/30/49 | | | 2,488,550 | |
| | | |
| | |
| The accompanying notes are an integral part of these financial statements. | | 33 |
GOLDMAN SACHS MULTI-MANAGER NON-CORE FIXED INCOME FUND
|
Schedule of Investments (continued) April 30, 2024 (Unaudited) |
| | | | | | | | | | | | | | | | |
| | | | | Principal Amount | | | Interest Rate | | | Maturity Date | | Value | |
| |
| | Sovereign Debt Obligations – (continued) | |
| |
| | United States Dollar – (continued) | |
| | Republic of Uzbekistan International Bonds | |
| | $ | | | 835,000 | | | | 3.900 | % | | 10/19/31 | | $ | 665,912 | |
| | Romania Government International Bonds | |
| | | | | 814,000 | | | | 5.875 | | | 01/30/29 | | | 798,208 | |
| | | | | 138,000 | | | | 7.125 | | | 01/17/33 | | | 142,313 | |
| | | | | 918,000 | | | | 7.125 | (b) | | 01/17/33 | | | 946,687 | |
| | | | | 158,000 | | | | 6.375 | | | 01/30/34 | | | 154,248 | |
| | | | | 3,700,000 | | | | 4.000 | | | 02/14/51 | | | 2,479,000 | |
| | Rwanda International Government Bonds | |
| | | | | 200,000 | | | | 5.500 | | | 08/09/31 | | | 161,500 | |
| | Saudi Government International Bonds | |
| | | | | 5,076,000 | | | | 4.750 | (b) | | 01/16/30 | | | 4,898,340 | |
| | | | | 200,000 | | | | 2.250 | | | 02/02/33 | | | 155,500 | |
| | | | | 221,000 | | | | 5.000 | | | 04/17/49 | | | 191,021 | |
| | Senegal Government International Bonds | |
| | | | | 637,000 | | | | 6.750 | | | 03/13/48 | | | 469,389 | |
| | Serbia International Bonds | |
| | | | | 400,000 | | | | 6.500 | | | 09/26/33 | | | 399,000 | |
| | Sri Lanka Government International Bonds | |
| | | | | 339,000 | | | | 5.750 | | | 04/18/23 | | | 191,149 | |
| | | | | 2,734,000 | | | | 6.750 | | | 04/18/28 | | | 1,538,176 | |
| | Trinidad & Tobago Government International Bonds (b)(c) | |
| | | | | 686,000 | | | | 5.950 | | | 01/14/31 | | | 671,594 | |
| | Tunisian Republic | |
| | | | | 200,000 | | | | 5.750 | | | 01/30/25 | | | 188,250 | |
| | Turkiye Government International Bonds | |
| | | | | 438,000 | | | | 9.125 | | | 07/13/30 | | | 473,084 | |
| | | | | 2,616,000 | | | | 7.625 | | | 05/15/34 | | | 2,587,387 | |
| | Ukraine Government International Bonds | |
| | | | | 390,000 | | | | 7.750 | | | 09/01/24 | | | 122,070 | |
| | | | | 606,000 | | | | 7.750 | | | 09/01/29 | | | 169,074 | |
| | | | | 794,000 | | | | 9.750 | | | 11/01/30 | | | 237,009 | |
| | | | | 1,515,000 | | | | 6.876 | | | 05/21/31 | | | 377,538 | |
| | | | | 371,000 | | | | 7.375 | | | 09/25/34 | | | 91,674 | |
| | | | | 2,740,000 | | | | 7.253 | | | 03/15/35 | | | 672,396 | |
| | Uruguay Government International Bonds | |
| | | | | 3,476,038 | | | | 5.750 | (c) | | 10/28/34 | | | 3,533,393 | |
| | | | | 445,766 | | | | 4.975 | | | 04/20/55 | | | 392,497 | |
| | Venezuela Government International Bonds (f) | |
| | | | | 110,000 | | | | 7.750 | | | 10/13/19 | | | 18,117 | |
| | | | | 85,000 | | | | 6.000 | | | 12/09/20 | | | 13,175 | |
| | | | | 140,000 | | | | 12.750 | | | 08/23/22 | | | 29,260 | |
| | | | | 203,000 | | | | 9.000 | | | 05/07/23 | | | 38,570 | |
| | | | | 175,000 | | | | 8.250 | | | 10/13/24 | | | 30,625 | |
| | | | | 199,000 | | | | 7.650 | | | 04/21/25 | | | 34,527 | |
| | | | | 205,000 | | | | 11.750 | | | 10/21/26 | | | 42,640 | |
| | | | | 165,000 | | | | 9.250 | | | 09/15/27 | | | 34,485 | |
| | | | | 273,900 | | | | 9.250 | | | 05/07/28 | | | 52,178 | |
| | | | | 205,000 | | | | 11.950 | | | 08/05/31 | | | 42,743 | |
| | | | | 152,000 | | | | 9.375 | | | 01/13/34 | | | 31,434 | |
| | | | | 190,000 | | | | 7.000 | | | 03/31/38 | | | 31,464 | |
| | | |
| | | | | | | | | | | | | | | | |
| | | | | Principal Amount | | | Interest Rate | | | Maturity Date | | Value | |
| |
| | Sovereign Debt Obligations – (continued) | |
| |
| | United States Dollar – (continued) | |
| | Zambia Government International Bonds | |
| | $ | | | 884,000 | | | | 5.375 | % | | 09/20/22 | | $ | 581,539 | |
| | | | | | | | | | | | | | | | |
| | | | | | | | | | | | | | | 148,510,334 | |
| | | |
| | |
| | TOTAL SOVEREIGN DEBT OBLIGATIONS (Cost $563,088,154) | | $ | 549,075,533 | |
| | | |
| | | | | | | | | | | | | | | | |
| |
| | Corporate Obligations – 30.0% | |
| |
| | Advertising(b)(c) – 0.1% | |
| | CMG Media Corp. | |
| | $ | | | 2,426,000 | | | | 8.875 | % | | 12/15/27 | | $ | 1,348,298 | |
| | Summer BC Holdco A SARL | |
| | EUR | | | 282,931 | | | | 9.250 | | | 10/31/27 | | | 288,942 | |
| | Summer BC Holdco B SARL | |
| | | | | 442,000 | | | | 5.750 | | | 10/31/26 | | | 463,089 | |
| | | | | | | | | | | | | | | | |
| | | | | | | | | | | | | | | 2,100,329 | |
| | | |
| |
| | Aerospace & Defense(c) – 0.3% | |
| | Bombardier, Inc. (b) | |
| | $ | | | 818,000 | | | | 7.875 | | | 04/15/27 | | | 814,687 | |
| | | | | 1,011,000 | | | | 7.500 | | | 02/01/29 | | | 1,033,990 | |
| | | | | 425,000 | | | | 7.250 | | | 07/01/31 | | | 426,203 | |
| | Rolls-Royce PLC (b) | |
| | GBP | | | 450,000 | | | | 5.750 | | | 10/15/27 | | | 566,464 | |
| | TransDigm, Inc. | |
| | $ | | | 650,000 | | | | 5.500 | | | 11/15/27 | | | 631,423 | |
| | | | | 1,675,000 | | | | 7.125 | (b) | | 12/01/31 | | | 1,708,266 | |
| | | | | | | | | | | | | | | | |
| | | | | | | | | | | | | | | 5,181,033 | |
| | | |
| |
| | Airlines(b) – 0.4% | |
| | Air Canada (c) | |
| | | | | 1,275,000 | | | | 3.875 | | | 08/15/26 | | | 1,210,039 | |
| | American Airlines, Inc. (c) | |
| | | | | 504,000 | | | | 7.250 | | | 02/15/28 | | | 506,066 | |
| | American Airlines, Inc./AAdvantage Loyalty IP Ltd. | |
| | | | | 466,667 | | | | 5.500 | | | 04/20/26 | | | 461,445 | |
| | Azul Secured Finance LLP (c) | |
| | | | | 484,000 | | | | 11.930 | | | 08/28/28 | | | 481,580 | |
| | Spirit Loyalty Cayman Ltd./Spirit IP Cayman Ltd. (c) | |
| | | | | 887,000 | | | | 8.000 | | | 09/20/25 | | | 693,208 | |
| | | | | 269,000 | | | | 8.000 | | | 09/20/25 | | | 210,492 | |
| | United Airlines, Inc. (c) | |
| | | | | 345,000 | | | | 4.375 | | | 04/15/26 | | | 332,025 | |
| | | | | 990,000 | | | | 4.625 | | | 04/15/29 | | | 912,958 | |
| | VistaJet Malta Finance PLC/Vista Management Holding, Inc. (c) | |
| | | | | 347,000 | | | | 9.500 | | | 06/01/28 | | | 310,249 | |
| | | | | 1,325,000 | | | | 6.375 | | | 02/01/30 | | | 1,027,074 | |
| | | | | | | | | | | | | | | | |
| | | | | | | | | | | | | | | 6,145,136 | |
| | | |
| |
| | Apparel(b)(c) – 0.1% | |
| | Hanesbrands, Inc. | |
| | | | | 784,000 | | | | 9.000 | | | 02/15/31 | | | 779,829 | |
| | | |
| | |
| 34 | | The accompanying notes are an integral part of these financial statements. |
GOLDMAN SACHS MULTI-MANAGER NON-CORE FIXED INCOME FUND
| | | | | | | | | | | | | | | | |
| | | | | Principal Amount | | | Interest Rate | | | Maturity Date | | Value | |
| |
| | Corporate Obligations – (continued) | |
| |
| | Apparel(b)(c) – (continued) | |
| | Wolverine World Wide, Inc. | |
| | $ | | | 1,383,000 | | | | 4.000 | % | | 08/15/29 | | $ | 1,105,017 | |
| | | | | | | | | | | | | | | | |
| | | | | | | | | | | | | | | 1,884,846 | |
| | | |
| |
| | Automotive(c) – 0.5% | |
| | Adient Global Holdings Ltd. (b) | |
| | | | | 608,000 | | | | 8.250 | | | 04/15/31 | | | 631,280 | |
| | Allison Transmission, Inc. (b) | |
| | | | | 1,000,000 | | | | 4.750 | | | 10/01/27 | | | 957,500 | |
| | Benteler International AG | |
| | EUR | | | 433,000 | | | | 9.375 | | | 05/15/28 | | | 493,867 | |
| | Clarios Global LP/Clarios U.S. Finance Co. (b) | |
| | $ | | | 569,000 | | | | 8.500 | | | 05/15/27 | | | 569,723 | |
| | Dana Financing Luxembourg SARL | |
| | EUR | | | 600,000 | | | | 3.000 | (b) | | 07/15/29 | | | 575,008 | |
| | | | | 430,000 | | | | 8.500 | | | 07/15/31 | | | 500,605 | |
| | Dealer Tire LLC/DT Issuer LLC (b) | |
| | $ | | | 799,000 | | | | 8.000 | | | 02/01/28 | | | 785,673 | |
| | IHO Verwaltungs GmbH (b)(h) | |
| | (PIK 4.625%, Cash 3.875%) | |
| | EUR | | | 725,000 | | | | 3.875 | | | 05/15/27 | | | 752,784 | |
| | (PIK 9.500%, Cash 8.750%) | |
| | | | | 531,000 | | | | 8.750 | | | 05/15/28 | | | 609,349 | |
| | LKQ European Holdings BV (b) | |
| | | | | 300,000 | | | | 4.125 | | | 04/01/28 | | | 320,704 | |
| | Tenneco, Inc. (b) | |
| | $ | | | 888,000 | | | | 8.000 | | | 11/17/28 | | | 831,807 | |
| | | | | | | | | | | | | | | | |
| | | | | | | | | | | | | | | 7,028,300 | |
| | | |
| |
| | Banks – 1.8% | |
| | Banca Monte dei Paschi di Siena SpA (c)(i) (5 yr. EURIBOR ICE Swap + 5.005%) | |
| | EUR | | | 1,580,000 | | | | 7.708 | | | 01/18/28 | | | 1,762,308 | |
| | Banco Bilbao Vizcaya Argentaria SA (c)(i) | |
| | (-1X 5 yr. EUR Swap + 6.456%) | |
| | | | | 400,000 | | | | 6.000 | | | 01/15/26 | | | 423,679 | |
| | (5 yr. CMT + 5.192%) | |
| | $ | | | 600,000 | | | | 6.500 | | | 03/05/25 | | | 591,156 | |
| | Banco de Sabadell SA (c)(i) (5 yr. EUR Swap + 6.830%) | |
| | EUR | | | 800,000 | | | | 9.375 | | | 07/18/28 | | | 935,790 | |
| | Bank of Ireland Group PLC (c)(i) (-1X 5 yr. EUR Swap + 6.434%) | |
| | | | | 406,000 | | | | 6.000 | | | 09/01/25 | | | 428,708 | |
| | Barclays PLC (c)(i) | |
| | (5 yr. GBP Swap + 5.639%) | |
| | GBP | | | 1,828,000 | | | | 9.250 | | | 09/15/28 | | | 2,335,572 | |
| | (5 yr. U.K. Government Bond + 6.579%) | |
| | | | | 370,000 | | | | 7.125 | | | 06/15/25 | | | 455,399 | |
| | BBVA Bancomer SA (b)(c)(i) (5 yr. CMT + 4.214%) | |
| | $ | | | 900,000 | | | | 8.125 | | | 01/08/39 | | | 909,585 | |
| | CaixaBank SA (c)(i) (-1X 5 yr. EUR Swap + 3.857%) | |
| | EUR | | | 800,000 | | | | 3.625 | | | 09/14/28 | | | 698,111 | |
| | Commerzbank AG (c)(i) (-1X 5 yr. EUR Swap + 6.363%) | |
| | | | | 600,000 | | | | 6.125 | | | 10/09/25 | | | 629,640 | |
| | Deutsche Bank AG (c)(i) (5 yr. EURIBOR ICE Swap + 6.940%) | |
| | | | | 1,000,000 | | | | 10.000 | | | 12/01/27 | | | 1,144,412 | |
| | | |
| | | | | | | | | | | | | | | | |
| | | | | Principal Amount | | | Interest Rate | | | Maturity Date | | Value | |
| |
| | Corporate Obligations – (continued) | |
| |
| | Banks – (continued) | |
| | Development Bank of Kazakhstan JSC (b) | |
| | $ | | | 239,000 | | | | 5.500 | % | | 04/15/27 | | $ | 236,084 | |
| | Freedom Mortgage Corp. (b)(c) | |
| | | | | 932,000 | | | | 6.625 | | | 01/15/27 | | | 897,175 | |
| | | | | 1,265,000 | | | | 12.000 | | | 10/01/28 | | | 1,357,573 | |
| | International Finance Corp. | |
| | INR | | | 398,380,000 | | | | 6.300 | | | 11/25/24 | | | 4,754,323 | |
| | Intesa Sanpaolo SpA (c)(i) | |
| | (1 yr. CMT + 2.750%) | |
| | $ | | | 2,260,000 | | | | 4.950 | (b) | | 06/01/42 | | | 1,625,189 | |
| | (-1X 5 yr. EUR Swap + 5.848%) | |
| | EUR | | | 621,000 | | | | 5.500 | | | 03/01/28 | | | 630,423 | |
| | (-1X 5 yr. EUR Swap + 6.086%) | |
| | | | | 1,020,000 | | | | 5.875 | | | 09/01/31 | | | 1,012,346 | |
| | Lloyds Banking Group PLC (c)(i) | |
| | (5 yr. U.K. Government Bond + 5.143%) | |
| | GBP | | | 950,000 | | | | 8.500 | | | 03/27/28 | | | 1,195,976 | |
| | (5 yr. U.K. Government Bond + 5.883%) | |
| | | | | 700,000 | | | | 8.500 | | | 09/27/27 | | | 882,339 | |
| | Societe Generale SA (c)(i) | |
| | (5 yr. CMT + 5.385%) | |
| | $ | | | 402,000 | | | | 9.375 | | | 11/22/27 | | | 409,469 | |
| | (5 yr. EUR Swap + 5.228%) | |
| | EUR | | | 600,000 | | | | 7.875 | | | 01/18/29 | | | 659,632 | |
| | TC Ziraat Bankasi AS (b)(c)(i) (5 yr. CMT + 4.327%) | |
| | $ | | | 639,000 | | | | 8.994 | | | 08/02/34 | | | 640,997 | |
| | UniCredit SpA (c)(i) | |
| | (-1X 5 yr. EUR Swap + 4.606%) | |
| | EUR | | | 721,000 | | | | 4.450 | | | 12/03/27 | | | 700,201 | |
| | (5 yr. EURIBOR ICE Swap + 7.334%) | |
| | | | | 380,000 | | | | 7.500 | | | 06/03/26 | | | 416,181 | |
| | (5 yr. USD ICE Swap + 3.703%) | |
| | $ | | | 1,525,000 | | | | 5.861 | (b) | | 06/19/32 | | | 1,476,002 | |
| | | | | | | | | | | | | | | | |
| | | | | | | | | | | | | | | 27,208,270 | |
| | | |
| |
| | Biotechnology(c) – 0.1% | |
| | Cidron Aida Finco SARL | |
| | EUR | | | 944,000 | | | | 5.000 | | | 04/01/28 | | | 956,199 | |
| | | |
| |
| | Building Materials(c) – 0.7% | |
| | AmeriTex HoldCo Intermediate LLC (b) | |
| | $ | | | 977,000 | | | | 10.250 | | | 10/15/28 | | | 1,028,820 | |
| | Builders FirstSource, Inc. (b) | |
| | | | | 580,000 | | | | 4.250 | | | 02/01/32 | | | 505,441 | |
| | | | | 787,000 | | | | 6.375 | | | 03/01/34 | | | 772,354 | |
| | Camelot Return Merger Sub, Inc. (b) | |
| | | | | 1,336,000 | | | | 8.750 | | | 08/01/28 | | | 1,314,971 | |
| | CP Atlas Buyer, Inc. (b) | |
| | | | | 858,000 | | | | 7.000 | | | 12/01/28 | | | 773,161 | |
| | EMRLD Borrower LP/Emerald Co.-Issuer, Inc. (b) | |
| | | | | 1,103,000 | | | | 6.625 | | | 12/15/30 | | | 1,095,213 | |
| | Griffon Corp. | |
| | | | | 567,000 | | | | 5.750 | | | 03/01/28 | | | 545,981 | |
| | Sisecam U.K. PLC (b) | |
| | | | | 609,000 | | | | 8.625 | | | 05/02/32 | | | 617,374 | |
| | | |
| | |
| The accompanying notes are an integral part of these financial statements. | | 35 |
GOLDMAN SACHS MULTI-MANAGER NON-CORE FIXED INCOME FUND
|
Schedule of Investments (continued) April 30, 2024 (Unaudited) |
| | | | | | | | | | | | | | | | |
| | | | | Principal Amount | | | Interest Rate | | | Maturity Date | | Value | |
| |
| | Corporate Obligations – (continued) | |
| |
| | Building Materials(c) – (continued) | |
| | Smyrna Ready Mix Concrete LLC (b) | |
| | $ | | | 976,000 | | | | 6.000 | % | | 11/01/28 | | $ | 944,456 | |
| | | | | 875,000 | | | | 8.875 | | | 11/15/31 | | | 921,200 | |
| | Standard Industries, Inc. (b) | |
| | | | | 1,150,000 | | | | 4.375 | | | 07/15/30 | | | 1,018,957 | |
| | Summit Materials LLC/Summit Materials Finance Corp. (b) | |
| | | | | 563,000 | | | | 5.250 | | | 01/15/29 | | | 541,133 | |
| | | | | 415,000 | | | | 7.250 | | | 01/15/31 | | | 426,276 | |
| | | | | | | | | | | | | | | | |
| | | | | | | | | | | | | | | 10,505,337 | |
| | | |
| |
| | Chemicals – 1.2% | |
| | ASP Unifrax Holdings, Inc. (b)(c) | |
| | | | | 650,000 | | | | 5.250 | | | 09/30/28 | | | 412,555 | |
| | Axalta Coating Systems Dutch Holding B BV (b)(c) | |
| | | | | 495,000 | | | | 7.250 | | | 02/15/31 | | | 506,850 | |
| | Axalta Coating Systems LLC (b)(c) | |
| | | | | 855,000 | | | | 3.375 | | | 02/15/29 | | | 752,349 | |
| | Cerdia Finanz GmbH (b)(c)(j) | |
| | | | | 1,200,000 | | | | 10.500 | | | 02/15/27 | | | 1,243,896 | |
| | CF Industries, Inc. | |
| | | | | 792,000 | | | | 5.150 | | | 03/15/34 | | | 746,531 | |
| | Chemours Co. (b)(c) | |
| | | | | 922,000 | | | | 5.750 | | | 11/15/28 | | | 846,774 | |
| | | | | 999,000 | | | | 4.625 | | | 11/15/29 | | | 856,503 | |
| | Cornerstone Chemical Co. LLC (b)(c)(k) | |
| | | | | 1,000,000 | | | | 10.250 | | | 09/01/27 | | | 1,000,000 | |
| | Cornerstone Chemical Co. LLC (k)(b)(c)(h) | |
| | | | | 1,217,000 | | | | 15.000 | | | 12/06/28 | | | 1,217,000 | |
| | INEOS Finance PLC (c) | |
| | EUR | | | 860,000 | | | | 6.375 | | | 04/15/29 | | | 922,831 | |
| | Innophos Holdings, Inc. (b)(c) | |
| | $ | | | 715,000 | | | | 9.375 | | | 02/15/28 | | | 617,896 | |
| | Iris Holdings, Inc. (b)(c)(h) | |
| | | | | 615,000 | | | | 8.750 | | | 02/15/26 | | | 520,216 | |
| | NOVA Chemicals Corp. (b)(c) | |
| | | | | 1,931,000 | | | | 4.250 | | | 05/15/29 | | | 1,627,119 | |
| | OCI NV (b)(c) | |
| | | | | 581,000 | | | | 6.700 | | | 03/16/33 | | | 557,958 | |
| | OCP SA (b)(c) | |
| | | | | 1,237,000 | | | | 7.500 | | | 05/02/54 | | | 1,201,127 | |
| | Rain Carbon, Inc. (b)(c) | |
| | | | | 855,000 | | | | 12.250 | | | 09/01/29 | | | 889,226 | |
| | Rain CII Carbon LLC/CII Carbon Corp. (b)(c) | |
| | | | | 14,000 | | | | 7.250 | | | 04/01/25 | | | 13,691 | |
| | Rayonier AM Products, Inc. (b)(c) | |
| | | | | 528,000 | | | | 7.625 | | | 01/15/26 | | | 468,991 | |
| | SCIH Salt Holdings, Inc. (b)(c) | |
| | | | | 210,000 | | | | 4.875 | | | 05/01/28 | | | 195,247 | |
| | | | | 556,000 | | | | 6.625 | | | 05/01/29 | | | 512,688 | |
| | Tronox, Inc. (b)(c) | |
| | | | | 2,313,000 | | | | 4.625 | | | 03/15/29 | | | 2,065,833 | |
| | Vibrantz Technologies, Inc. (b)(c) | |
| | | | | 679,000 | | | | 9.000 | | | 02/15/30 | | | 627,905 | |
| | | |
| | | | | | | | | | | | | | | | |
| | | | | Principal Amount | | | Interest Rate | | | Maturity Date | | Value | |
| |
| | Corporate Obligations – (continued) | |
| |
| | Chemicals – (continued) | |
| | WR Grace Holdings LLC (b)(c) | |
| | $ | | | 578,000 | | | | 5.625 | % | | 08/15/29 | | $ | 518,321 | |
| | | | | | | | | | | | | | | | |
| | | | | | | | | | | | | | | 18,321,507 | |
| | | |
| |
| | Commercial Services(c) – 1.3% | |
| | ADT Security Corp. (b) | |
| | | | | 476,000 | | | | 4.125 | | | 08/01/29 | | | 430,066 | |
| | Albion Financing 1 SARL/Aggreko Holdings, Inc. (b) | |
| | EUR | | | 575,000 | | | | 5.250 | | | 10/15/26 | | | 614,119 | |
| | Allied Universal Holdco LLC/Allied Universal Finance Corp. (b) | |
| | $ | | | 616,000 | | | | 6.625 | | | 07/15/26 | | | 614,787 | |
| | APX Group, Inc. (b) | |
| | | | | 599,000 | | | | 5.750 | | | 07/15/29 | | | 556,363 | |
| | Avis Budget Car Rental LLC/Avis Budget Finance, Inc. (b) | |
| | | | | 496,000 | | | | 8.000 | | | 02/15/31 | | | 474,836 | |
| | BCP V Modular Services Finance II PLC (b) | |
| | EUR | | | 615,000 | | | | 4.750 | | | 11/30/28 | | | 617,152 | |
| | BCP V Modular Services Finance PLC (b) | |
| | | | | 280,000 | | | | 6.750 | | | 11/30/29 | | | 259,922 | |
| | Boels Topholding BV (b) | |
| | | | | 475,000 | | | | 6.250 | | | 02/15/29 | | | 522,341 | |
| | Boost Newco Borrower LLC/GTCR W Dutch Finance Sub BV | |
| | GBP | | | 726,000 | | | | 8.500 | | | 01/15/31 | | | 966,485 | |
| | Cerved Group SpA (b) | |
| | EUR | | | 691,000 | | | | 6.000 | | | 02/15/29 | | | 684,952 | |
| | Champions Financing, Inc. (b) | |
| | $ | | | 560,000 | | | | 8.750 | | | 02/15/29 | | | 572,891 | |
| | CoreLogic, Inc. (b) | |
| | | | | 1,250,000 | | | | 4.500 | | | 05/01/28 | | | 1,080,863 | |
| | CPI CG, Inc. (b) | |
| | | | | 653,000 | | | | 8.625 | | | 03/15/26 | | | 649,160 | |
| | GEMS MENASA Cayman Ltd./GEMS Education Delaware LLC(b) | |
| | | | | 1,445,000 | | | | 7.125 | | | 07/31/26 | | | 1,436,420 | |
| | House of HR Group BV (b) | |
| | EUR | | | 550,000 | | | | 9.000 | | | 11/03/29 | | | 604,857 | |
| | Korn Ferry (b) | |
| | $ | | | 915,000 | | | | 4.625 | | | 12/15/27 | | | 868,289 | |
| | Loxam SAS (b) | |
| | EUR | | | 376,000 | | | | 6.375 | | | 05/31/29 | | | 415,541 | |
| | Neptune Bidco U.S., Inc. (b) | |
| | $ | | | 851,000 | | | | 9.290 | | | 04/15/29 | | | 803,302 | |
| | Q-Park Holding I BV (b) | |
| | EUR | | | 600,000 | | | | 5.125 | | | 03/01/29 | | | 644,252 | |
| | Sabre GLBL, Inc. (b) | |
| | $ | | | 1,095,000 | | | | 11.250 | | | 12/15/27 | | | 1,022,653 | |
| | StoneMor, Inc. (b) | |
| | | | | 975,000 | | | | 8.500 | | | 05/15/29 | | | 777,806 | |
| | United Rentals North America, Inc. | |
| | | | | 535,000 | | | | 5.250 | | | 01/15/30 | | | 513,359 | |
| | | | | 595,000 | | | | 4.000 | | | 07/15/30 | | | 529,514 | |
| | Verisure Holding AB (b) | |
| | EUR | | | 100,000 | | | | 3.250 | | | 02/15/27 | | | 102,463 | |
| | | | | 461,000 | | | | 7.125 | | | 02/01/28 | | | 512,889 | |
| | | |
| | |
| 36 | | The accompanying notes are an integral part of these financial statements. |
GOLDMAN SACHS MULTI-MANAGER NON-CORE FIXED INCOME FUND
| | | | | | | | | | | | | | | | |
| | | | | Principal Amount | | | Interest Rate | | | Maturity Date | | Value | |
| |
| | Corporate Obligations – (continued) | |
| |
| | Commercial Services(c) – (continued) | |
| | Wand NewCo 3, Inc. (b) | |
| | $ | | | 2,592,550 | | | | 7.625 | % | | 01/30/32 | | $ | 2,641,186 | |
| | WW International, Inc. (b) | |
| | | | | 530,000 | | | | 4.500 | | | 04/15/29 | | | 221,105 | |
| | | | | | | | | | | | | | | | |
| | | | | | | | | | | | | | | 19,137,573 | |
| | | |
| |
| | Computers – 0.2% | |
| | Ahead DB Holdings LLC (b)(c) | |
| | | | | 823,000 | | | | 6.625 | | | 05/01/28 | | | 747,959 | |
| | CA Magnum Holdings (b)(c) | |
| | | | | 1,800,000 | | | | 5.375 | | | 10/31/26 | | | 1,702,800 | |
| | Endo Design LLC (b)(l) | |
| | | | | 1,183,000 | | | | 9.500 | | | 07/31/27 | | | — | |
| | Entorian Technologies, Inc. (k)(f)(l) | |
| | | | | 835,000 | | | | 8.750 | | | 10/15/26 | | | — | |
| | McAfee Corp. (b)(c) | |
| | | | | 906,000 | | | | 7.375 | | | 02/15/30 | | | 840,215 | |
| | Seagate HDD Cayman (c) | |
| | | | | 552,000 | | | | 3.375 | | | 07/15/31 | | | 427,215 | |
| | | | | | | | | | | | | | | | |
| | | | | | | | | | | | | | | 3,718,189 | |
| | | |
| |
| | Distribution & Wholesale(b)(c) – 0.1% | |
| | Green Bidco SA | |
| | EUR | | | 300,000 | | | | 10.250 | | | 07/15/28 | | | 304,428 | |
| | H&E Equipment Services, Inc. | |
| | $ | | | 1,143,000 | | | | 3.875 | | | 12/15/28 | | | 1,011,509 | |
| | | | | | | | | | | | | | | | |
| | | | | | | | | | | | | | | 1,315,937 | |
| | | |
| |
| | Diversified Financial Services – 1.0% | |
| | Ally Financial, Inc. (c) | |
| | | | | 670,000 | | | | 4.750 | | | 06/09/27 | | | 644,346 | |
| | Bach Bidco SpA (b)(c)(i) (3 mo. EUR Euribor + 4.250%) | |
| | EUR | | | 575,000 | | | | 8.156 | | | 10/15/28 | | | 616,709 | |
| | Bread Financial Holdings, Inc. (b)(c) | |
| | $ | | | 512,000 | | | | 9.750 | | | 03/15/29 | | | 532,557 | |
| | Coinbase Global, Inc. (b)(c) | |
| | | | | 1,166,000 | | | | 3.375 | | | 10/01/28 | | | 978,344 | |
| | Finance of America Funding LLC (b)(c) | |
| | | | | 1,810,000 | | | | 7.875 | | | 11/15/25 | | | 1,429,900 | |
| | Freedom Mortgage Holdings LLC (b)(c) | |
| | | | | 404,000 | | | | 9.250 | | | 02/01/29 | | | 406,670 | |
| | GGAM Finance Ltd. (b)(c) | |
| | | | | 350,000 | | | | 6.875 | | | 04/15/29 | | | 350,294 | |
| | Global Aircraft Leasing Co. Ltd. (b)(c)(h) (PIK 7.250%, Cash 6.500%) | |
| | | | | 846,004 | | | | 6.500 | | | 09/15/24 | | | 799,567 | |
| | Jefferies Finance LLC/JFIN Co.-Issuer Corp. (b)(c) | |
| | | | | 574,000 | | | | 5.000 | | | 08/15/28 | | | 516,474 | |
| | Kane Bidco Ltd. (c) | |
| | EUR | | | 300,000 | | | | 5.000 | (b) | | 02/15/27 | | | 310,110 | |
| | GBP | | | 213,000 | | | | 6.500 | | | 02/15/27 | | | 256,128 | |
| | LD Holdings Group LLC (b)(c) | |
| | $ | | | 520,000 | | | | 6.125 | | | 04/01/28 | | | 393,916 | |
| | Macquarie Airfinance Holdings Ltd. (b)(c) | |
| | | | | 105,000 | | | | 6.400 | | | 03/26/29 | | | 104,775 | |
| | | |
| | | | | | | | | | | | | | | | |
| | | | | Principal Amount | | | Interest Rate | | | Maturity Date | | Value | |
| |
| | Corporate Obligations – (continued) | |
| |
| | Diversified Financial Services – (continued) | |
| | $ | | | 105,000 | | | | 6.500 | % | | 03/26/31 | | $ | 105,133 | |
| | Midcap Financial Issuer Trust (b)(c) | |
| | | | | 1,448,000 | | | | 6.500 | | | 05/01/28 | | | 1,310,788 | |
| | | | | 775,000 | | | | 5.625 | | | 01/15/30 | | | 651,488 | |
| | Nationstar Mortgage Holdings, Inc. (b)(c) | |
| | | | | 500,000 | | | | 5.000 | | | 02/01/26 | | | 486,360 | |
| | | | | 1,045,000 | | | | 5.500 | | | 08/15/28 | | | 982,854 | |
| | Navient Corp. | |
| | | | | 500,000 | | | | 5.625 | | | 08/01/33 | | | 397,575 | |
| | OneMain Finance Corp. | |
| | | | | 675,000 | | | | 7.125 | | | 03/15/26 | | | 681,264 | |
| | | | | 377,000 | | | | 3.500 | (c) | | 01/15/27 | | | 347,277 | |
| | | | | 775,000 | | | | 3.875 | (c) | | 09/15/28 | | | 682,426 | |
| | | | | 91,000 | | | | 9.000 | (c) | | 01/15/29 | | | 95,606 | |
| | | | | 1,565,000 | | | | 5.375 | (c) | | 11/15/29 | | | 1,446,968 | |
| | PennyMac Financial Services, Inc. (b)(c) | |
| | | | | 555,000 | | | | 4.250 | | | 02/15/29 | | | 492,934 | |
| | Rocket Mortgage LLC/Rocket Mortgage Co.-Issuer, Inc. (b)(c) | |
| | | | | 437,000 | | | | 3.625 | | | 03/01/29 | | | 385,185 | |
| | United Wholesale Mortgage LLC (b)(c) | |
| | | | | 345,000 | | | | 5.500 | | | 11/15/25 | | | 339,721 | |
| | Voyager Aviation Holdings LLC (b)(c)(f) | |
| | | | | 729,562 | | | | 8.500 | | | 05/09/26 | | | 116,730 | |
| | | | | | | | | | | | | | | | |
| | | | | | | | | | | | | | | 15,862,099 | |
| | | |
| |
| | Diversified Manufacturing(b)(f)(l) – 0.0% | |
| | Endo Finance LLC | |
| | | | | 946,000 | | | | 6.000 | | | 06/30/28 | | | — | |
| | | |
| |
| | Electrical – 0.9% | |
| | Buffalo Energy Mexico Holdings/Buffalo Energy Infrastructure/ Buffalo Energy (b)(c) | |
| | $ | | | 692,000 | | | | 7.875 | | | 02/15/39 | | | 722,237 | |
| | Calpine Corp. (b)(c) | |
| | | | | 443,000 | | | | 4.500 | | | 02/15/28 | | | 413,837 | |
| | | | | 755,000 | | | | 4.625 | | | 02/01/29 | | | 693,536 | |
| | Electricite de France SA (c)(i) | |
| | (-1X 5 yr. EUR Swap + 3.198%) | |
| | EUR | | | 800,000 | | | | 3.000 | | | 09/03/27 | | | 787,594 | |
| | (-1X 5 yr. EUR Swap + 3.970%) | |
| | | | | 1,600,000 | | | | 3.375 | | | 06/15/30 | | | 1,489,812 | |
| | Eskom Holdings SOC Ltd. (m) | |
| | $ | | | 1,154,000 | | | | 4.314 | | | 07/23/27 | | | 1,045,720 | |
| | Mercury Chile Holdco LLC (c) | |
| | | | | 1,887,000 | | | | 6.500 | | | 01/24/27 | | | 1,816,827 | |
| | NRG Energy, Inc. (b)(c) | |
| | | | | 1,165,000 | | | | 3.625 | | | 02/15/31 | | | 987,244 | |
| | (5 yr. CMT + 5.920%) | |
| | | | | 639,000 | | | | 10.250 | (i) | | 03/15/28 | | | 687,660 | |
| | Pattern Energy Operations LP/Pattern Energy Operations, Inc. (b)(c) | |
| | | | | 1,233,000 | | | | 4.500 | | | 08/15/28 | | | 1,102,869 | |
| | Talen Energy Supply LLC (b)(c) | |
| | | | | 688,000 | | | | 8.625 | | | 06/01/30 | | | 727,698 | |
| | | |
| | |
| The accompanying notes are an integral part of these financial statements. | | 37 |
GOLDMAN SACHS MULTI-MANAGER NON-CORE FIXED INCOME FUND
|
Schedule of Investments (continued) April 30, 2024 (Unaudited) |
| | | | | | | | | | | | | | | | |
| | | | | Principal Amount | | | Interest Rate | | | Maturity Date | | Value | |
| |
| | Corporate Obligations – (continued) | |
| |
| | Electrical – (continued) | |
| | Vistra Corp. (b)(c)(i) (5 yr. CMT + 5.740%) | |
| | $ | | | 745,000 | | | | 7.000 | % | | 12/15/26 | | $ | 731,173 | |
| | Vistra Operations Co. LLC (b)(c) | |
| | | | | 1,000,000 | | | | 5.000 | | | 07/31/27 | | | 951,690 | |
| | | | | 400,000 | | | | 4.375 | | | 05/01/29 | | | 364,648 | |
| | | | | 29,000 | | | | 4.300 | | | 07/15/29 | | | 26,803 | |
| | | | | 1,290,000 | | | | 7.750 | | | 10/15/31 | | | 1,326,223 | |
| | | | | | | | | | | | | | | | |
| | | | | | | | | | | | | | | 13,875,571 | |
| | | |
| |
| | Electrical Components & Equipment(b)(c) – 0.1% | |
| | Belden, Inc. | |
| | EUR | | | 751,000 | | | | 3.375 | | | 07/15/31 | | | 733,343 | |
| | | |
| |
| | Electronics(b)(c) – 0.1% | |
| | Coherent Corp. | |
| | $ | | | 1,306,000 | | | | 5.000 | | | 12/15/29 | | | 1,204,341 | |
| | Sensata Technologies BV | |
| | | | | 1,015,000 | | | | 4.000 | | | 04/15/29 | | | 908,405 | |
| | | | | | | | | | | | | | | | |
| | | | | | | | | | | | | | | 2,112,746 | |
| | | |
| |
| | Energy-Alternate Sources(b)(c) – 0.2% | |
| | Cullinan Holdco SCSp | |
| | EUR | | | 700,000 | | | | 4.625 | | | 10/15/26 | | | 608,838 | |
| | Enviva Partners LP/Enviva Partners Finance Corp. (f) | |
| | $ | | | 994,000 | | | | 6.500 | | | 01/15/26 | | | 446,465 | |
| | FS Luxembourg SARL | |
| | | | | 580,000 | | | | 8.875 | | | 02/12/31 | | | 552,450 | |
| | TerraForm Power Operating LLC | |
| | | | | 952,000 | | | | 5.000 | | | 01/31/28 | | | 890,853 | |
| | | | | 250,000 | | | | 4.750 | | | 01/15/30 | | | 223,102 | |
| | | | | | | | | | | | | | | | |
| | | | | | | | | | | | | | | 2,721,708 | |
| | | |
| |
| | Engineering & Construction(c) – 0.2% | |
| | Abertis Infraestructuras Finance BV (i) (-1X 5 yr. EUR Swap +3.269%) | |
| | EUR | | | 400,000 | | | | 2.625 | | | 01/26/27 | | | 396,427 | |
| | Artera Services LLC (b) | |
| | $ | | | 275,000 | | | | 8.500 | | | 02/15/31 | | | 281,363 | |
| | Global Infrastructure Solutions, Inc. (b) | |
| | | | | 989,000 | | | | 5.625 | | | 06/01/29 | | | 889,536 | |
| | Tutor Perini Corp. (b) | |
| | | | | 1,533,000 | | | | 6.875 | | | 05/01/25 | | | 1,533,000 | |
| | | | | | | | | | | | | | | | |
| | | | | | | | | | | | | | | 3,100,326 | |
| | | |
| |
| | Entertainment(c) – 1.3% | |
| | 888 Acquisitions Ltd. (b) | |
| | EUR | | | 1,138,000 | | | | 7.558 | | | 07/15/27 | | | 1,173,364 | |
| | Allwyn Entertainment Financing U.K. PLC | |
| | | | | 750,000 | | | | 7.250 | (b) | | 04/30/30 | | | 832,416 | |
| | | | | 510,000 | | | | 7.250 | | | 04/30/30 | | | 566,043 | |
| | Allwyn International AS (b) | |
| | | | | 550,000 | | | | 3.875 | | | 02/15/27 | | | 570,819 | |
| | Banijay Entertainment SASU (b) | |
| | | | | 475,000 | | | | 7.000 | | | 05/01/29 | | | 531,633 | |
| | Caesars Entertainment, Inc. (b) | |
| | $ | | | 1,675,000 | | | | 8.125 | | | 07/01/27 | | | 1,699,489 | |
| | | |
| | | | | | | | | | | | | | | | |
| | | | | Principal Amount | | | Interest Rate | | | Maturity Date | | Value | |
| |
| | Corporate Obligations – (continued) | |
| |
| | Entertainment(c) – (continued) | |
| | $ | | | 839,000 | | | | 4.625 | % | | 10/15/29 | | $ | 748,052 | |
| | | | | 1,140,000 | | | | 7.000 | | | 02/15/30 | | | 1,149,127 | |
| | Churchill Downs, Inc. (b) | |
| | | | | 729,000 | | | | 6.750 | | | 05/01/31 | | | 723,562 | |
| | Cirsa Finance International SARL (b) | |
| | EUR | | | 1,040,000 | | | | 4.500 | | | 03/15/27 | | | 1,092,086 | |
| | | | | 400,000 | | | | 6.500 | | | 03/15/29 | | | 435,217 | |
| | Empire Resorts, Inc. (b) | |
| | $ | | | 1,730,000 | | | | 7.750 | | | 11/01/26 | | | 1,609,160 | |
| | Flutter Treasury DAC (b) | |
| | EUR | | | 109,000 | | | | 5.000 | | | 04/29/29 | | | 117,922 | |
| | $ | | | 670,000 | | | | 6.375 | | | 04/29/29 | | | 672,600 | |
| | International Game Technology PLC (b) | |
| | EUR | | | 1,450,000 | | | | 2.375 | | | 04/15/28 | | | 1,448,652 | |
| | $ | | | 375,000 | | | | 5.250 | | | 01/15/29 | | | 354,173 | |
| | Jacobs Entertainment, Inc. (b) | |
| | | | | 970,000 | | | | 6.750 | | | 02/15/29 | | | 924,371 | |
| | | | | 150,000 | | | | 6.750 | | | 02/15/29 | | | 142,014 | |
| | LHMC Finco 2 SARL (b)(h) (PIK 8.000%, Cash 7.250%) | |
| | EUR | | | 157,259 | | | | 7.250 | | | 10/02/25 | | | 167,884 | |
| | Loarre Investments SARL (b) | |
| | | | | 600,000 | | | | 6.500 | | | 05/15/29 | | | 644,610 | |
| | Melco Resorts Finance Ltd. (b) | |
| | $ | | | 1,167,000 | | | | 7.625 | | | 04/17/32 | | | 1,143,660 | |
| | Merlin Entertainments Ltd. (b) | |
| | | | | 250,000 | | | | 5.750 | | | 06/15/26 | | | 247,325 | |
| | Pinewood Finco PLC (b) | |
| | GBP | | | 400,000 | | | | 6.000 | | | 03/27/30 | | | 486,475 | |
| | Raptor Acquisition Corp./Raptor Co.-Issuer LLC (b) | |
| | $ | | | 640,000 | | | | 4.875 | | | 11/01/26 | | | 610,688 | |
| | WMG Acquisition Corp. (b) | |
| | EUR | | | 769,000 | | | | 2.250 | | | 08/15/31 | | | 714,317 | |
| | Wynn Resorts Finance LLC/Wynn Resorts Capital Corp. (b) | |
| | $ | | | 138,000 | | | | 7.125 | | | 02/15/31 | | | 140,027 | |
| | | | | | | | | | | | | | | | |
| | | | | | | | | | | | | | | 18,945,686 | |
| | | |
| |
| | Environmental(b)(c) – 0.0% | |
| | Clean Harbors, Inc. | |
| | | | | 398,000 | | | | 4.875 | | | 07/15/27 | | | 383,461 | |
| | | |
| |
| | Food & Drug Retailing – 0.5% | |
| | Albertsons Cos., Inc./Safeway, Inc./New Albertsons LP/ Albertsons LLC (b)(c) | |
| | | | | 335,000 | | | | 4.875 | | | 02/15/30 | | | 312,310 | |
| | Iceland Bondco PLC (b)(c) | |
| | GBP | | | 357,600 | | | | 4.625 | | | 03/15/25 | | | 441,830 | |
| | (3 mo. EUR Euribor + 5.500%) | |
| | EUR | | | 200,000 | | | | 9.401 | (i) | | 12/15/27 | | | 213,306 | |
| | Lamb Weston Holdings, Inc. (b)(c) | |
| | $ | | | 1,175,000 | | | | 4.125 | | | 01/31/30 | | | 1,047,195 | |
| | MARB BondCo PLC (c) | |
| | | | | 1,228,000 | | | | 3.950 | | | 01/29/31 | | | 983,935 | |
| | Minerva Luxembourg SA (b)(c) | |
| | | | | 1,064,000 | | | | 8.875 | | | 09/13/33 | | | 1,091,451 | |
| | | |
| | |
| 38 | | The accompanying notes are an integral part of these financial statements. |
GOLDMAN SACHS MULTI-MANAGER NON-CORE FIXED INCOME FUND
| | | | | | | | | | | | | | | | |
| | | | | Principal Amount | | | Interest Rate | | | Maturity Date | | Value | |
| |
| | Corporate Obligations – (continued) | |
| |
| | Food & Drug Retailing – (continued) | |
| | New Albertsons LP | |
| | $ | | | 800,000 | | | | 8.700 | % | | 05/01/30 | | $ | 860,768 | |
| | | | | 175,000 | | | | 8.000 | | | 05/01/31 | | | 182,072 | |
| | Nomad Foods Bondco PLC (b)(c) | |
| | EUR | | | 407,000 | | | | 2.500 | | | 06/24/28 | | | 403,677 | |
| | Ocado Group PLC (b)(c) | |
| | GBP | | | 500,000 | | | | 3.875 | | | 10/08/26 | | | 543,904 | |
| | Post Holdings, Inc. (b)(c) | |
| | $ | | | 565,000 | | | | 5.625 | | | 01/15/28 | | | 548,372 | |
| | Sigma Holdco BV (b)(c) | |
| | EUR | | | 550,000 | | | | 5.750 | | | 05/15/26 | | | 547,875 | |
| | Simmons Foods, Inc./Simmons Prepared Foods, Inc./Simmons Pet Food, Inc./Simmons Feed (b)(c) | |
| | $ | | | 1,248,000 | | | | 4.625 | | | 03/01/29 | | | 1,078,322 | |
| | | | | | | | | | | | | | | | |
| | | | | | | | | | | | | | | 8,255,017 | |
| | | |
| |
| | Forest Products & Paper(b)(c) – 0.2% | |
| | Domtar Corp. | |
| | | | | 3,037,000 | | | | 6.750 | | | 10/01/28 | | | 2,651,514 | |
| | WEPA Hygieneprodukte GmbH | |
| | EUR | | | 566,000 | | | | 5.625 | | | 01/15/31 | | | 604,005 | |
| | | | | | | | | | | | | | | | |
| | | | | | | | | | | | | | | 3,255,519 | |
| | | |
| |
| | Gaming(c) – 0.1% | |
| | MGM Resorts International | |
| | $ | | | 1,069,000 | | | | 4.750 | | | 10/15/28 | | | 995,356 | |
| | Wynn Macau Ltd. (b) | |
| | | | | 1,305,000 | | | | 5.125 | | | 12/15/29 | | | 1,154,925 | |
| | | | | | | | | | | | | | | | |
| | | | | | | | | | | | | | | 2,150,281 | |
| | | |
| |
| | Hand/Machine Tools(b)(c) – 0.0% | |
| | IMA Industria Macchine Automatiche SpA | |
| | EUR | | | 360,000 | | | | 3.750 | | | 01/15/28 | | | 360,318 | |
| | | |
| |
| | Health Care Services(b)(c) – 0.2% | |
| | Charles River Laboratories International, Inc. | |
| | $ | | | 1,428,000 | | | | 4.250 | | | 05/01/28 | | | 1,331,624 | |
| | Kedrion SpA | |
| | | | | 1,250,000 | | | | 6.500 | | | 09/01/29 | | | 1,123,050 | |
| | | | | | | | | | | | | | | | |
| | | | | | | | | | | | | | | 2,454,674 | |
| | | |
| |
| | Healthcare Providers & Services(c) – 1.3% | |
| | Acadia Healthcare Co., Inc. (b) | |
| | | | | 1,000,000 | | | | 5.000 | | | 04/15/29 | | | 937,160 | |
| | Akumin, Inc. (b) | |
| | | | | 1,590,000 | | | | 9.000 | (h) | | 08/01/27 | | | 1,327,809 | |
| | | | | 15,000 | | | | 8.000 | | | 08/01/28 | | | 11,736 | |
| | Avantor Funding, Inc. (b) | |
| | EUR | | | 504,000 | | | | 2.625 | | | 11/01/25 | | | 524,664 | |
| | | | | 195,000 | | | | 3.875 | | | 07/15/28 | | | 201,865 | |
| | CAB SELAS (b) | |
| | | | | 835,000 | | | | 3.375 | | | 02/01/28 | | | 780,124 | |
| | CHS/Community Health Systems, Inc. (b) | |
| | $ | | | 850,000 | | | | 8.000 | | | 03/15/26 | | | 846,243 | |
| | | | | 1,049,000 | | | | 5.625 | | | 03/15/27 | | | 960,874 | |
| | | |
| | | | | | | | | | | | | | | | |
| | | | | Principal Amount | | | Interest Rate | | | Maturity Date | | Value | |
| |
| | Corporate Obligations – (continued) | |
| |
| | Healthcare Providers & Services(c) – (continued) | |
| | DaVita, Inc. (b) | |
| | $ | | | 800,000 | | | | 3.750 | % | | 02/15/31 | | $ | 658,776 | |
| | Global Medical Response, Inc. (b) | |
| | | | | 1,930,000 | | | | 6.500 | | | 10/01/25 | | | 1,828,926 | |
| | HCA, Inc. | |
| | | | | 611,000 | | | | 3.500 | | | 09/01/30 | | | 538,633 | |
| | LifePoint Health, Inc. (b) | |
| | | | | 246,000 | | | | 5.375 | | | 01/15/29 | | | 196,670 | |
| | | | | 1,673,000 | | | | 9.875 | | | 08/15/30 | | | 1,743,149 | |
| | Medline Borrower LP (b) | |
| | | | | 1,561,000 | | | | 3.875 | | | 04/01/29 | | | 1,397,485 | |
| | Molina Healthcare, Inc. (b) | |
| | | | | 893,000 | | | | 4.375 | | | 06/15/28 | | | 828,427 | |
| | | | | 650,000 | | | | 3.875 | | | 11/15/30 | | | 564,668 | |
| | Radiology Partners, Inc. (b)(h) | |
| | | | | 1,703,389 | | | | 8.500 | | | 01/31/29 | | | 1,571,819 | |
| | | | | 648,311 | | | | 9.781 | | | 02/15/30 | | | 508,717 | |
| | RegionalCare Hospital Partners Holdings, Inc./LifePoint Health, Inc. (b) | |
| | | | | 363,000 | | | | 9.750 | | | 12/01/26 | | | 361,301 | |
| | Team Health Holdings, Inc. (b) | |
| | | | | 956,000 | | | | 6.375 | | | 02/01/25 | | | 889,023 | |
| | Tenet Healthcare Corp. | |
| | | | | 685,000 | | | | 6.125 | | | 10/01/28 | | | 677,047 | |
| | | | | 1,665,000 | | | | 6.750 | (b) | | 05/15/31 | | | 1,669,962 | |
| | | | | | | | | | | | | | | | |
| | | | | | | | | | | | | | | 19,025,078 | |
| | | |
| |
| | Home Builders(b)(c) – 0.1% | |
| | Ashton Woods USA LLC/Ashton Woods Finance Co. | |
| | | | | 258,000 | | | | 6.625 | | | 01/15/28 | | | 257,384 | |
| | | | | 321,000 | | | | 4.625 | | | 08/01/29 | | | 290,463 | |
| | Brookfield Residential Properties, Inc./Brookfield Residential U.S. LLC | |
| | | | | 800,000 | | | | 4.875 | | | 02/15/30 | | | 692,440 | |
| | | | | | | | | | | | | | | | |
| | | | | | | | | | | | | | | 1,240,287 | |
| | | |
| |
| | Home Furnishings(b)(c) – 0.1% | |
| | International Design Group SpA | |
| | EUR | | | 300,000 | | | | 10.000 | | | 11/15/28 | | | 327,325 | |
| | Versuni Group BV | |
| | | | | 425,000 | | | | 3.125 | | | 06/15/28 | | | 406,454 | |
| | | | | | | | | | | | | | | | |
| | | | | | | | | | | | | | | 733,779 | |
| | | |
| |
| | Insurance – 0.8% | |
| | Acrisure LLC/Acrisure Finance, Inc. (b)(c) | |
| | $ | | | 525,000 | | | | 10.125 | | | 08/01/26 | | | 542,509 | |
| | | | | 840,000 | | | | 8.250 | | | 02/01/29 | | | 834,120 | |
| | Alliant Holdings Intermediate LLC/Alliant Holdings Co-Issuer (b)(c) | |
| | | | | 1,406,000 | | | | 7.000 | | | 01/15/31 | | | 1,411,202 | |
| | AmWINS Group, Inc. (b)(c) | |
| | | | | 600,000 | | | | 6.375 | | | 02/15/29 | | | 593,292 | |
| | Ardonagh Finco Ltd. (b)(c) | |
| | | | | 575,000 | | | | 7.750 | | | 02/15/31 | | | 564,937 | |
| | | |
| | |
| The accompanying notes are an integral part of these financial statements. | | 39 |
GOLDMAN SACHS MULTI-MANAGER NON-CORE FIXED INCOME FUND
|
Schedule of Investments (continued) April 30, 2024 (Unaudited) |
| | | | | | | | | | | | | | | | |
| | | | | Principal Amount | | | Interest Rate | | | Maturity Date | | Value | |
| |
| | Corporate Obligations – (continued) | |
| |
| | Insurance – (continued) | |
| | Ardonagh Group Finance Ltd. (b)(c) | |
| | $ | | | 1,050,000 | | | | 8.875 | % | | 02/15/32 | | $ | 1,022,658 | |
| | Genworth Holdings, Inc. | |
| | | | | 440,000 | | | | 6.500 | | | 06/15/34 | | | 409,631 | |
| | Highlands Holdings Bond Issuer Ltd./Highlands Holdings Bond Co.-Issuer, Inc. (b)(c)(h) (PIK 8.375%, Cash 7.625%) | |
| | | | | 1,391,875 | | | | 7.625 | | | 10/15/25 | | | 1,391,332 | |
| | Howden U.K. Refinance PLC/Howden U.K. Refinance 2 PLC/Howden U.S. Refinance LLC (b)(c) | |
| | | | | 1,775,000 | | | | 7.250 | | | 02/15/31 | | | 1,750,949 | |
| | | | | 375,000 | | | | 8.125 | | | 02/15/32 | | | 369,836 | |
| | NMI Holdings, Inc. (b)(c) | |
| | | | | 800,000 | | | | 7.375 | | | 06/01/25 | | | 806,512 | |
| | Panther Escrow Issuer LLC (b)(c) | |
| | | | | 2,100,000 | | | | 7.125 | | | 06/01/31 | | | 2,110,941 | |
| | Sagicor Financial Co. Ltd. (c) | |
| | | | | 235,000 | | | | 5.300 | | | 05/13/28 | | | 225,013 | |
| | | | | | | | | | | | | | | | |
| | | | | | | | | | | | | | | 12,032,932 | |
| | | |
| |
| | Internet – 0.5% | |
| | ANGI Group LLC (b)(c) | |
| | | | | 1,229,000 | | | | 3.875 | | | 08/15/28 | | | 1,042,549 | |
| | Cablevision Lightpath LLC (b)(c) | |
| | | | | 750,000 | | | | 5.625 | | | 09/15/28 | | | 605,670 | |
| | Engineering - Ingegneria Informatica - SpA (b)(c) | |
| | EUR | | | 650,000 | | | | 5.875 | | | 09/30/26 | | | 667,903 | |
| | Go Daddy Operating Co. LLC/GD Finance Co., Inc. (b)(c) | |
| | $ | | | 1,297,000 | | | | 3.500 | | | 03/01/29 | | | 1,151,191 | |
| | GrubHub Holdings, Inc. (b)(c) | |
| | | | | 1,365,000 | | | | 5.500 | | | 07/01/27 | | | 1,219,628 | |
| | HSE Finance SARL (b)(c) | |
| | EUR | | | 150,000 | | | | 5.625 | | | 10/15/26 | | | 94,753 | |
| | Netflix, Inc. (b)(c) | |
| | | | | 323,000 | | | | 3.625 | | | 06/15/30 | | | 342,200 | |
| | Rakuten Group, Inc. (b) | |
| | $ | | | 500,000 | | | | 9.750 | | | 04/15/29 | | | 495,260 | |
| | United Group BV (c) | |
| | EUR | | | 870,000 | | | | 5.250 | (b) | | 02/01/30 | | | 882,041 | |
| | (3 mo. EUR Euribor + 4.250%) | |
| | | | | 460,000 | | | | 8.134 | (i) | | 02/15/31 | | | 490,912 | |
| | | | | | | | | | | | | | | | |
| | | | | | | | | | | | | | | 6,992,107 | |
| | | |
| |
| | Investment Companies – 0.5% | |
| | Blackstone Private Credit Fund (c) | |
| | $ | | | 1,000,000 | | | | 2.625 | | | 12/15/26 | | | 907,840 | |
| | Blue Owl Capital Corp. (c) | |
| | | | | 962,000 | | | | 3.400 | | | 07/15/26 | | | 902,154 | |
| | Gaci First Investment Co. (c) | |
| | | | | 905,000 | | | | 4.875 | | | 02/14/35 | | | 834,580 | |
| | | | | 3,203,000 | | | | 5.375 | | | 01/29/54 | | | 2,710,539 | |
| | Icahn Enterprises LP/Icahn Enterprises Finance Corp. (c) | |
| | | | | 1,175,000 | | | | 5.250 | | | 05/15/27 | | | 1,079,132 | |
| | | |
| | | | | | | | | | | | | | | | |
| | | | | Principal Amount | | | Interest Rate | | | Maturity Date | | Value | |
| |
| | Corporate Obligations – (continued) | |
| |
| | Investment Companies – (continued) | |
| | Khazanah Global Sukuk Bhd. | |
| | $ | | | 696,000 | | | | 4.687 | % | | 06/01/28 | | $ | 675,337 | |
| | | | | | | | | | | | | | | | |
| | | | | | | | | | | | | | | 7,109,582 | |
| | | |
| |
| | Iron/Steel – 0.3% | |
| | Baffinland Iron Mines Corp./Baffinland Iron Mines LP (b)(c) | |
| | | | | 1,960,000 | | | | 8.750 | | | 07/15/26 | | | 1,804,298 | |
| | CSN Resources SA (c) | |
| | | | | 958,000 | | | | 5.875 | | | 04/08/32 | | | 797,834 | |
| | Mineral Resources Ltd. (b)(c) | |
| | | | | 615,000 | | | | 8.125 | | | 05/01/27 | | | 620,350 | |
| | | | | 442,000 | | | | 8.000 | | | 11/01/27 | | | 447,251 | |
| | | | | 582,000 | | | | 9.250 | | | 10/01/28 | | | 610,693 | |
| | | | | 504,000 | | | | 8.500 | | | 05/01/30 | | | 516,534 | |
| | Tacora Resources, Inc. (b) | |
| | | | | 45,300 | | | | 13.000 | (k) | | 11/03/23 | | | 45,300 | |
| | | | | 405,000 | | | | 8.250 | (c)(f) | | 05/15/26 | | | 199,321 | |
| | | | | | | | | | | | | | | | |
| | | | | | | | | | | | | | | 5,041,581 | |
| | | |
| |
| | Leisure Time(b)(c) – 0.4% | |
| | Carnival Corp. | |
| | | | | 350,000 | | | | 4.000 | | | 08/01/28 | | | 319,466 | |
| | | | | 1,600,000 | | | | 10.500 | | | 06/01/30 | | | 1,738,912 | |
| | Carnival Holdings Bermuda Ltd. | |
| | | | | 1,670,000 | | | | 10.375 | | | 05/01/28 | | | 1,810,464 | |
| | Deuce Finco PLC | |
| | GBP | | | 250,000 | | | | 5.500 | | | 06/15/27 | | | 294,944 | |
| | (3 mo. EUR Euribor + 4.750%) | |
| | EUR | | | 200,000 | | | | 8.690 | (i) | | 06/15/27 | | | 214,059 | |
| | NCL Corp. Ltd. | |
| | $ | | | 1,050,000 | | | | 5.875 | | | 03/15/26 | | | 1,028,359 | |
| | | | | 200,000 | | | | 8.125 | | | 01/15/29 | | | 208,352 | |
| | Viking Cruises Ltd. | |
| | | | | 1,200,000 | | | | 5.875 | | | 09/15/27 | | | 1,165,430 | |
| | | | | | | | | | | | | | | | |
| | | | | | | | | | | | | | | 6,779,986 | |
| | | |
| |
| | Lodging(b)(c) – 0.3% | |
| | Hilton Domestic Operating Co., Inc. | |
| | | | | 1,030,000 | | | | 3.750 | | | 05/01/29 | | | 925,187 | |
| | | | | 765,000 | | | | 4.000 | | | 05/01/31 | | | 669,956 | |
| | Melco Resorts Finance Ltd. | |
| | | | | 950,000 | | | | 5.375 | | | 12/04/29 | | | 847,011 | |
| | Studio City Finance Ltd. | |
| | | | | 1,250,000 | | | | 5.000 | | | 01/15/29 | | | 1,071,875 | |
| | Wynn Las Vegas LLC/Wynn Las Vegas Capital Corp. | |
| | | | | 650,000 | | | | 5.250 | | | 05/15/27 | | | 630,461 | |
| | | | | | | | | | | | | | | | |
| | | | | | | | | | | | | | | 4,144,490 | |
| | | |
| |
| | Machinery - Construction & Mining(b)(c) – 0.0% | |
| | BWX Technologies, Inc. | |
| | | | | 645,000 | | | | 4.125 | | | 06/30/28 | | | 589,143 | |
| | | |
| |
| | Machinery-Diversified(b)(c) – 0.2% | |
| | Chart Industries, Inc. | |
| | | | | 907,000 | | | | 7.500 | | | 01/01/30 | | | 928,260 | |
| | | | | 1,074,000 | | | | 9.500 | | | 01/01/31 | | | 1,153,530 | |
| | | |
| | |
| 40 | | The accompanying notes are an integral part of these financial statements. |
GOLDMAN SACHS MULTI-MANAGER NON-CORE FIXED INCOME FUND
| | | | | | | | | | | | | | | | |
| | | | | Principal Amount | | | Interest Rate | | | Maturity Date | | Value | |
| |
| | Corporate Obligations – (continued) | |
| |
| | Machinery-Diversified(b)(c) – (continued) | |
| | OT Merger Corp. | |
| | $ | | | 684,000 | | | | 7.875 | % | | 10/15/29 | | $ | 445,729 | |
| | TK Elevator Holdco GmbH | |
| | EUR | | | 450,000 | | | | 6.625 | | | 07/15/28 | | | 457,707 | |
| | | | | | | | | | | | | | | | |
| | | | | | | | | | | | | | | 2,985,226 | |
| | | |
| |
| | Media – 2.4% | |
| | Altice Financing SA (b)(c) | |
| | | | | 300,000 | | | | 2.250 | | | 01/15/25 | | | 309,803 | |
| | $ | | | 2,509,000 | | | | 5.000 | | | 01/15/28 | | | 1,996,938 | |
| | | | | 767,000 | | | | 5.750 | | | 08/15/29 | | | 580,757 | |
| | AMC Networks, Inc. (b)(c) | |
| | | | | 500,000 | | | | 10.250 | | | 01/15/29 | | | 500,010 | |
| | Audacy Capital Corp. (b)(c)(f) | |
| | | | | 745,000 | | | | 6.500 | | | 05/01/27 | | | 23,378 | |
| | | | | 925,000 | | | | 6.750 | | | 03/31/29 | | | 30,562 | |
| | Beasley Mezzanine Holdings LLC (b)(c) | |
| | | | | 1,610,000 | | | | 8.625 | | | 02/01/26 | | | 974,613 | |
| | CCO Holdings LLC/CCO Holdings Capital Corp. (b)(c) | |
| | | | | 525,000 | | | | 5.375 | | | 06/01/29 | | | 462,110 | |
| | | | | 1,726,000 | | | | 6.375 | | | 09/01/29 | | | 1,580,740 | |
| | | | | 2,200,000 | | | | 4.500 | | | 08/15/30 | | | 1,788,094 | |
| | | | | 650,000 | | | | 4.250 | | | 02/01/31 | | | 510,237 | |
| | | | | 1,087,000 | | | | 7.375 | | | 03/01/31 | | | 1,031,650 | |
| | | | | 820,000 | | | | 4.250 | | | 01/15/34 | | | 594,385 | |
| | CSC Holdings LLC (b)(c) | |
| | | | | 721,000 | | | | 5.500 | | | 04/15/27 | | | 591,025 | |
| | | | | 425,000 | | | | 7.500 | | | 04/01/28 | | | 230,099 | |
| | | | | 695,000 | | | | 6.500 | | | 02/01/29 | | | 520,242 | |
| | | | | 2,293,000 | | | | 5.750 | | | 01/15/30 | | | 1,003,371 | |
| | Diamond Sports Group LLC/Diamond Sports Finance Co. (b)(c)(f) | |
| | | | | 1,620,000 | | | | 5.375 | | | 08/15/26 | | | 41,488 | |
| | | | | 1,274,000 | | | | 6.625 | | | 08/15/27 | | | 32,462 | |
| | Directv Financing LLC (b)(c) | |
| | | | | 530,000 | | | | 8.875 | | | 02/01/30 | | | 515,165 | |
| | DISH DBS Corp. | |
| | | | | 631,000 | | | | 5.875 | | | 11/15/24 | | | 595,746 | |
| | | | | 563,000 | | | | 7.750 | | | 07/01/26 | | | 354,054 | |
| | | | | 2,260,000 | | | | 5.250 | (b)(c) | | 12/01/26 | | | 1,779,321 | |
| | | | | 837,000 | | | | 5.750 | (b)(c) | | 12/01/28 | | | 567,277 | |
| | | | | 790,000 | | | | 5.125 | | | 06/01/29 | | | 318,188 | |
| | DISH Network Corp. (b)(c) | |
| | | | | 480,000 | | | | 11.750 | | | 11/15/27 | | | 484,099 | |
| | Gray Television, Inc. (b)(c) | |
| | | | | 1,803,000 | | | | 7.000 | | | 05/15/27 | | | 1,642,245 | |
| | | | | 2,401,000 | | | | 4.750 | | | 10/15/30 | | | 1,444,682 | |
| | | | | 665,000 | | | | 5.375 | | | 11/15/31 | | | 398,521 | |
| | LCPR Senior Secured Financing DAC (b)(c) | |
| | | | | 649,000 | | | | 6.750 | | | 10/15/27 | | | 600,494 | |
| | Liberty Interactive LLC (c) | |
| | | | | 2,633,100 | | | | 4.000 | | | 11/15/29 | | | 974,247 | |
| | | | | 150,131 | | | | 3.750 | | | 02/15/30 | | | 54,047 | |
| | McGraw-Hill Education, Inc. (b)(c) | |
| | | | | 450,000 | | | | 5.750 | | | 08/01/28 | | | 417,438 | |
| | | |
| | | | | | | | | | | | | | | | |
| | | | | Principal Amount | | | Interest Rate | | | Maturity Date | | Value | |
| |
| | Corporate Obligations – (continued) | |
| |
| | Media – (continued) | |
| | Nexstar Media, Inc. (b)(c) | |
| | $ | | | 374,000 | | | | 5.625 | % | | 07/15/27 | | $ | 351,650 | |
| | | | | 658,000 | | | | 4.750 | | | 11/01/28 | | | 584,383 | |
| | Paramount Global (c)(i) (5 yr. CMT + 3.999%) | |
| | | | | 1,347,000 | | | | 6.375 | | | 03/30/62 | | | 1,245,988 | |
| | Radiate Holdco LLC/Radiate Finance, Inc. (b)(c) | |
| | | | | 835,000 | | | | 4.500 | | | 09/15/26 | | | 637,815 | |
| | Scripps Escrow II, Inc. (b)(c) | |
| | | | | 1,822,000 | | | | 3.875 | | | 01/15/29 | | | 1,346,330 | |
| | Sinclair Television Group, Inc. (b)(c) | |
| | | | | 805,000 | | | | 5.500 | | | 03/01/30 | | | 557,688 | |
| | | | | 649,000 | | | | 4.125 | | | 12/01/30 | | | 446,110 | |
| | Sirius XM Radio, Inc. (b)(c) | |
| | | | | 300,000 | | | | 3.125 | | | 09/01/26 | | | 279,810 | |
| | | | | 858,000 | | | | 5.000 | | | 08/01/27 | | | 810,364 | |
| | Spanish Broadcasting System, Inc. (b)(c) | |
| | | | | 1,225,000 | | | | 9.750 | | | 03/01/26 | | | 577,159 | |
| | Summer BidCo BV (b)(c)(h) (PIK 10.750%, Cash 10.000%) | |
| | EUR | | | 300,000 | | | | 10.000 | | | 02/15/29 | | | 322,531 | |
| | TEGNA, Inc. (c) | |
| | $ | | | 1,129,000 | | | | 4.625 | | | 03/15/28 | | | 1,022,772 | |
| | Tele Columbus AG (b)(c)(h) | |
| | EUR | | | 202,281 | | | | 10.000 | | | 03/19/29 | | | 137,080 | |
| | Telenet Finance Luxembourg Notes SARL (b)(c) | |
| | $ | | | 1,000,000 | | | | 5.500 | | | 03/01/28 | | | 946,990 | |
| | Univision Communications, Inc. (b)(c) | |
| | | | | 608,000 | | | | 6.625 | | | 06/01/27 | | | 587,170 | |
| | | | | 390,000 | | | | 4.500 | | | 05/01/29 | | | 338,501 | |
| | | | | 528,000 | | | | 7.375 | | | 06/30/30 | | | 506,062 | |
| | Urban One, Inc. (b)(c) | |
| | | | | 1,215,000 | | | | 7.375 | | | 02/01/28 | | | 985,742 | |
| | Virgin Media Vendor Financing Notes III DAC (b)(c) | |
| | GBP | | | 635,000 | | | | 4.875 | | | 07/15/28 | | | 708,992 | |
| | Virgin Media Vendor Financing Notes IV DAC (b)(c) | |
| | $ | | | 500,000 | | | | 5.000 | | | 07/15/28 | | | 445,560 | |
| | | | | | | | | | | | | | | | |
| | | | | | | | | | | | | | | 35,786,185 | |
| | | |
| |
| | Metal Fabricate & Hardware(b)(c) – 0.1% | |
| | Vallourec SACA | |
| | | | | 995,000 | | | | 7.500 | | | 04/15/32 | | | 1,005,010 | |
| | | |
| |
| | Mining(c) – 0.9% | |
| | Antofagasta PLC (b) | |
| | | | | 838,000 | | | | 6.250 | | | 05/02/34 | | | 834,648 | |
| | Arsenal AIC Parent LLC (b) | |
| | | | | 403,000 | | | | 8.000 | | | 10/01/30 | | | 420,430 | |
| | Compass Minerals International, Inc. (b) | |
| | | | | 1,164,000 | | | | 6.750 | | | 12/01/27 | | | 1,093,508 | |
| | Corp. Nacional del Cobre de Chile | |
| | | | | 1,045,000 | | | | 5.950 | | | 01/08/34 | | | 1,013,977 | |
| | | | | 1,232,000 | | | | 6.440 | (b) | | 01/26/36 | | | 1,226,995 | |
| | Eldorado Gold Corp. (b) | |
| | | | | 1,000,000 | | | | 6.250 | | | 09/01/29 | | | 943,700 | |
| | First Quantum Minerals Ltd. (b) | |
| | | | | 1,700,000 | | | | 9.375 | | | 03/01/29 | | | 1,768,544 | |
| | | |
| | |
| The accompanying notes are an integral part of these financial statements. | | 41 |
GOLDMAN SACHS MULTI-MANAGER NON-CORE FIXED INCOME FUND
|
Schedule of Investments (continued) April 30, 2024 (Unaudited) |
| | | | | | | | | | | | | | | | |
| | | | | Principal Amount | | | Interest Rate | | | Maturity Date | | Value | |
| |
| | Corporate Obligations – (continued) | |
| |
| | Mining(c) – (continued) | |
| | $ | | | 1,195,000 | | | | 8.625 | % | | 06/01/31 | | $ | 1,162,078 | |
| | Freeport-McMoRan, Inc. | |
| | | | | 320,000 | | | | 4.625 | | | 08/01/30 | | | 300,688 | |
| | | | | 795,000 | | | | 5.400 | | | 11/14/34 | | | 765,537 | |
| | Mountain Province Diamonds, Inc. (k)(b) | |
| | | | | 2,861,000 | | | | 9.000 | | | 12/15/25 | | | 2,795,197 | |
| | Northwest Acquisitions ULC/Dominion Finco, Inc. (b)(f) | |
| | | | | 1,260,000 | | | | 7.125 | | | 11/01/22 | | | 13 | |
| | WE Soda Investments Holding PLC | |
| | | | | 680,000 | | | | 9.375 | | | 02/14/31 | | | 693,387 | |
| | | | | | | | | | | | | | | | |
| | | | | | | | | | | | | | | 13,018,702 | |
| | | |
| |
| | Miscellaneous Manufacturing(b)(c) – 0.0% | |
| | LSB Industries, Inc. | |
| | | | | 360,000 | | | | 6.250 | | | 10/15/28 | | | 341,244 | |
| | | |
| |
| | Office & Business Equipment(b)(c) – 0.1% | |
| | Pitney Bowes, Inc. | |
| | | | | 420,000 | | | | 6.875 | | | 03/15/27 | | | 378,248 | |
| | | | | 560,000 | | | | 7.250 | | | 03/15/29 | | | 477,635 | |
| | Xerox Holdings Corp. | |
| | | | | 562,000 | | | | 8.875 | | | 11/30/29 | | | 535,895 | |
| | | | | | | | | | | | | | | | |
| | | | | | | | | | | | | | | 1,391,778 | |
| | | |
| |
| | Oil Field Services – 2.6% | |
| | Apache Corp. (c) | |
| | | | | 1,234,000 | | | | 5.100 | | | 09/01/40 | | | 1,027,108 | |
| | Archrock Partners LP/Archrock Partners Finance Corp. (b)(c) | |
| | | | | 444,000 | | | | 6.250 | | | 04/01/28 | | | 435,338 | |
| | Ascent Resources Utica Holdings LLC/ARU Finance Corp. (b)(c) | |
| | | | | 230,000 | | | | 7.000 | | | 11/01/26 | | | 230,198 | |
| | | | | 500,000 | | | | 8.250 | | | 12/31/28 | | | 509,720 | |
| | Chesapeake Energy Corp. | |
| | | | | 195,000 | | | | 7.000 | (l) | | 10/01/24 | | | 4,388 | |
| | | | | 935,000 | | | | 7.500 | (l) | | 10/01/26 | | | 21,037 | |
| | | | | 1,250,000 | | | | 5.875 | (b)(c) | | 02/01/29 | | | 1,228,100 | |
| | CITGO Petroleum Corp. (b)(c) | |
| | | | | 671,000 | | | | 7.000 | | | 06/15/25 | | | 670,396 | |
| | | | | 1,074,000 | | | | 6.375 | | | 06/15/26 | | | 1,074,526 | |
| | | | | 1,452,000 | | | | 8.375 | | | 01/15/29 | | | 1,502,820 | |
| | Civitas Resources, Inc. (b)(c) | |
| | | | | 460,000 | | | | 8.625 | | | 11/01/30 | | | 490,880 | |
| | | | | 710,000 | | | | 8.750 | | | 07/01/31 | | | 754,389 | |
| | Comstock Resources, Inc. (b)(c) | |
| | | | | 1,110,000 | | | | 6.750 | | | 03/01/29 | | | 1,045,287 | |
| | Ecopetrol SA (c) | |
| | | | | 717,000 | | | | 8.875 | | | 01/13/33 | | | 732,433 | |
| | EDO Sukuk Ltd. (b) | |
| | | | | 466,000 | | | | 5.875 | | | 09/21/33 | | | 469,786 | |
| | Energean Israel Finance Ltd. (c) | |
| | | | | 1,070,240 | | | | 8.500 | | | 09/30/33 | | | 1,027,430 | |
| | Greenfire Resources Ltd. (b)(c) | |
| | | | | 1,555,000 | | | | 12.000 | | | 10/01/28 | | | 1,648,906 | |
| | Guara Norte SARL (b) | |
| | | | | 599,753 | | | | 5.198 | | | 06/15/34 | | | 539,433 | |
| | | |
| | | | | | | | | | | | | | | | |
| | | | | Principal Amount | | | Interest Rate | | | Maturity Date | | Value | |
| |
| | Corporate Obligations – (continued) | |
| |
| | Oil Field Services – (continued) | |
| | Kosmos Energy Ltd. (b)(c) | |
| | $ | | | 1,242,000 | | | | 7.750 | % | | 05/01/27 | | $ | 1,211,338 | |
| | Moss Creek Resources Holdings, Inc. (b)(c) | |
| | | | | 1,149,000 | | | | 7.500 | | | 01/15/26 | | | 1,146,794 | |
| | Nabors Industries, Inc. (b)(c) | |
| | | | | 530,000 | | | | 9.125 | | | 01/31/30 | | | 548,280 | |
| | Pan American Energy LLC (b) | |
| | | | | 694,000 | | | | 8.500 | | | 04/30/32 | | | 699,996 | |
| | Petroleos de Venezuela SA (f) | |
| | | | | 2,439,000 | | | | 6.000 | | | 11/15/26 | | | 297,558 | |
| | | | | 554,800 | | | | 5.375 | | | 04/12/27 | | | 66,576 | |
| | Petroleos del Peru SA | |
| | | | | 2,182,000 | | | | 5.625 | | | 06/19/47 | | | 1,320,110 | |
| | Petroleos Mexicanos | |
| | | | | 981,000 | | | | 6.375 | | | 01/23/45 | | | 609,260 | |
| | | | | 5,827,000 | | | | 6.750 | | | 09/21/47 | | | 3,715,004 | |
| | Petronas Capital Ltd. (c) | |
| | | | | 1,806,000 | | | | 3.500 | | | 04/21/30 | | | 1,621,878 | |
| | | | | 1,279,000 | | | | 2.480 | | | 01/28/32 | | | 1,038,625 | |
| | | | | 1,553,000 | | | | 3.404 | | | 04/28/61 | | | 991,575 | |
| | Rockcliff Energy II LLC (b)(c) | |
| | | | | 1,217,000 | | | | 5.500 | | | 10/15/29 | | | 1,123,072 | |
| | Southwestern Energy Co. (c) | |
| | | | | 1,250,000 | | | | 4.750 | | | 02/01/32 | | | 1,125,625 | |
| | Strathcona Resources Ltd. (b)(c) | |
| | | | | 870,000 | | | | 6.875 | | | 08/01/26 | | | 861,613 | |
| | Sunoco LP (b)(c) | |
| | | | | 345,000 | | | | 7.250 | | | 05/01/32 | | | 350,392 | |
| | Transocean Titan Financing Ltd. (b)(c) | |
| | | | | 370,000 | | | | 8.375 | | | 02/01/28 | | | 379,831 | |
| | Transocean, Inc. | |
| | | | | 550,000 | | | | 8.250 | (b)(c) | | 05/15/29 | | | 546,601 | |
| | | | | 2,494,800 | | | | 8.750 | (b)(c) | | 02/15/30 | | | 2,602,451 | |
| | | | | 700,000 | | | | 8.500 | (b)(c) | | 05/15/31 | | | 696,304 | |
| | | | | 1,119,000 | | | | 6.800 | | | 03/15/38 | | | 906,390 | |
| | Valaris Ltd. (b)(c) | |
| | | | | 800,000 | | | | 8.375 | | | 04/30/30 | | | 822,000 | |
| | Var Energi ASA (c)(i) (5 yr. EURIBOR ICE Swap + 4.765%) | |
| | EUR | | | 360,000 | | | | 7.862 | | | 11/15/83 | | | 411,524 | |
| | Vital Energy, Inc. (b)(c) | |
| | $ | | | 1,116,000 | | | | 7.875 | | | 04/15/32 | | | 1,132,818 | |
| | Wintershall Dea Finance 2 BV (c)(i) (-1X 5 yr. EUR Swap + 3.319%) | |
| | EUR | | | 1,400,000 | | | | 3.000 | | | 07/20/28 | | | 1,305,483 | |
| | YPF SA (b)(c) | |
| | $ | | | 1,109,000 | | | | 9.500 | | | 01/17/31 | | | 1,117,900 | |
| | | | | | | | | | | | | | | | |
| | | | | | | | | | | | | | | 40,061,173 | |
| | | |
| |
| | Packaging(c) – 0.6% | |
| | ARD Finance SA (b)(h) | |
| | (PIK 5.750%, Cash 5.000%) | |
| | EUR | | | 271,000 | | | | 5.000 | | | 06/30/27 | | | 64,575 | |
| | (PIK 7.250%, Cash 6.500%) | |
| | $ | | | 135,000 | | | | 6.500 | | | 06/30/27 | | | 37,018 | |
| | | |
| | |
| 42 | | The accompanying notes are an integral part of these financial statements. |
GOLDMAN SACHS MULTI-MANAGER NON-CORE FIXED INCOME FUND
| | | | | | | | | | | | | | | | |
| | | | | Principal Amount | | | Interest Rate | | | Maturity Date | | Value | |
| |
| | Corporate Obligations – (continued) | |
| |
| | Packaging(c) – (continued) | |
| | Ardagh Metal Packaging Finance USA LLC/Ardagh Metal Packaging Finance PLC (b) | |
| | EUR | | | 400,000 | | | | 2.000 | % | | 09/01/28 | | $ | 372,073 | |
| | Ardagh Packaging Finance PLC/Ardagh Holdings USA, Inc. (b) | |
| | $ | | | 367,000 | | | | 5.250 | | | 04/30/25 | | | 363,587 | |
| | | | | 600,000 | | | | 4.125 | | | 08/15/26 | | | 500,496 | |
| | | | | 453,000 | | | | 5.250 | | | 08/15/27 | | | 230,944 | |
| | | | | 328,000 | | | | 5.250 | | | 08/15/27 | | | 167,293 | |
| | Ball Corp. | |
| | EUR | | | 675,000 | | | | 1.500 | | | 03/15/27 | | | 678,515 | |
| | $ | | | 949,000 | | | | 2.875 | | | 08/15/30 | | | 792,975 | |
| | Canpack SA/Canpack U.S. LLC (b) | |
| | EUR | | | 307,000 | | | | 2.375 | | | 11/01/27 | | | 302,652 | |
| | Fiber Bidco Spa (b)(i) (3 mo. EUR EURIBOR + 4.000%) | |
| | | | | 250,000 | | | | 7.908 | | | 01/15/30 | | | 268,324 | |
| | Fiber Bidco SpA (b) | |
| | | | | 266,000 | | | | 11.000 | | | 10/25/27 | | | 306,358 | |
| | Guala Closures SpA (b) | |
| | | | | 725,000 | | | | 3.250 | | | 06/15/28 | | | 720,705 | |
| | Intelligent Packaging Ltd. Finco, Inc./Intelligent Packaging Ltd. Co.-Issuer LLC (b) | |
| | $ | | | 1,306,000 | | | | 6.000 | | | 09/15/28 | | | 1,247,583 | |
| | LABL, Inc. (b) | |
| | | | | 149,000 | | | | 10.500 | | | 07/15/27 | | | 146,409 | |
| | OI European Group BV (b) | |
| | EUR | | | 450,000 | | | | 2.875 | | | 02/15/25 | | | 473,315 | |
| | $ | | | 500,000 | | | | 4.750 | | | 02/15/30 | | | 457,310 | |
| | Sealed Air Corp./Sealed Air Corp. U.S. (b) | |
| | | | | 974,000 | | | | 6.125 | | | 02/01/28 | | | 962,468 | |
| | Trident TPI Holdings, Inc. (b) | |
| | | | | 1,061,000 | | | | 12.750 | | | 12/31/28 | | | 1,147,100 | |
| | | | | | | | | | | | | | | | |
| | | | | | | | | | | | | | | 9,239,700 | |
| | | |
| |
| | Pharmaceuticals – 0.5% | |
| | 1375209 BC Ltd. (b)(c) | |
| | | | | 300,000 | | | | 9.000 | | | 01/30/28 | | | 294,399 | |
| | Almirall SA (b)(c) | |
| | EUR | | | 554,000 | | | | 2.125 | | | 09/30/26 | | | 563,264 | |
| | Bausch Health Cos., Inc. (b) | |
| | $ | | | 850,000 | | | | 11.000 | | | 09/30/28 | | | 664,513 | |
| | Bayer AG (c)(i) (5 yr. EUR Swap + 3.432%) | |
| | EUR | | | 600,000 | | | | 6.625 | | | 09/25/83 | | | 638,982 | |
| | Bormioli Pharma SpA (b)(c)(i) (3 mo. EUR Euribor + 5.500%) | |
| | | | | 550,000 | | | | 9.401 | | | 05/15/28 | | | 591,586 | |
| | Cheplapharm Arzneimittel GmbH (b)(c) | |
| | | | | 650,000 | | | | 4.375 | | | 01/15/28 | | | 666,800 | |
| | $ | | | 1,696,000 | | | | 5.500 | | | 01/15/28 | | | 1,594,460 | |
| | Grifols SA (b)(c) | |
| | | | | 250,000 | | | | 4.750 | | | 10/15/28 | | | 201,015 | |
| | Nidda BondCo GmbH (b)(c) | |
| | EUR | | | 450,000 | | | | 5.000 | | | 09/30/25 | | | 476,005 | |
| | Nidda Healthcare Holding GmbH (b)(c) | |
| | | | | 300,000 | | | | 7.500 | | | 08/21/26 | | | 330,918 | |
| | Organon & Co./Organon Foreign Debt Co.-Issuer BV (b)(c) | |
| | $ | | | 685,000 | | | | 5.125 | | | 04/30/31 | | | 592,463 | |
| | | |
| | | | | | | | | | | | | | | | |
| | | | | Principal Amount | | | Interest Rate | | | Maturity Date | | Value | |
| |
| | Corporate Obligations – (continued) | |
| |
| | Pharmaceuticals – (continued) | |
| | Par Pharmaceutical, Inc. | |
| | $ | | | 344,000 | | | | 7.500 | % | | 04/01/27 | | $ | — | |
| | Teva Pharmaceutical Finance Netherlands II BV (c) | |
| | EUR | | | 451,000 | | | | 7.375 | | | 09/15/29 | | | 531,556 | |
| | | | | 400,000 | | | | 4.375 | | | 05/09/30 | | | 408,661 | |
| | | | | | | | | | | | | | | | |
| | | | | | | | | | | | | | | 7,554,622 | |
| | | |
| |
| | Pipelines – 1.4% | |
| | Antero Midstream Partners LP/Antero Midstream Finance Corp. (b)(c) | |
| | $ | | | 1,270,000 | | | | 5.375 | | | 06/15/29 | | | 1,212,304 | |
| | CQP Holdco LP/BIP-V Chinook Holdco LLC (b)(c) | |
| | | | | 477,000 | | | | 5.500 | | | 06/15/31 | | | 438,778 | |
| | | | | 978,000 | | | | 7.500 | | | 12/15/33 | | | 986,352 | |
| | Energy Transfer LP (c) | |
| | | | | 540,000 | | | | 5.750 | | | 04/01/25 | | | 539,303 | |
| | EnLink Midstream LLC (c) | |
| | | | | 502,000 | | | | 5.375 | | | 06/01/29 | | | 484,325 | |
| | | | | 1,240,000 | | | | 6.500 | (b) | | 09/01/30 | | | 1,255,264 | |
| | EnLink Midstream Partners LP (c) | |
| | | | | 71,000 | | | | 5.600 | | | 04/01/44 | | | 61,423 | |
| | | | | 149,000 | | | | 5.450 | | | 06/01/47 | | | 126,358 | |
| | EQM Midstream Partners LP (c) | |
| | | | | 200,000 | | | | 6.000 | (b) | | 07/01/25 | | | 199,762 | |
| | | | | 468,000 | | | | 7.500 | (b) | | 06/01/30 | | | 490,810 | |
| | | | | 1,191,000 | | | | 6.500 | | | 07/15/48 | | | 1,176,851 | |
| | Genesis Energy LP/Genesis Energy Finance Corp. (c) | |
| | | | | 900,000 | | | | 8.000 | | | 01/15/27 | | | 910,179 | |
| | | | | 650,000 | | | | 8.875 | | | 04/15/30 | | | 672,490 | |
| | Global Partners LP/GLP Finance Corp. (c) | |
| | | | | 495,000 | | | | 7.000 | | | 08/01/27 | | | 491,406 | |
| | ITT Holdings LLC (b)(c) | |
| | | | | 2,940,000 | | | | 6.500 | | | 08/01/29 | | | 2,658,436 | |
| | New Fortress Energy, Inc. (b)(c) | |
| | | | | 930,000 | | | | 6.500 | | | 09/30/26 | | | 890,196 | |
| | NGL Energy Operating LLC/NGL Energy Finance Corp. (b)(c) | |
| | | | | 609,000 | | | | 8.125 | | | 02/15/29 | | | 619,219 | |
| | QazaqGaz NC JSC | |
| | | | | 729,000 | | | | 4.375 | | | 09/26/27 | | | 680,248 | |
| | Summit Midstream Holdings LLC/Summit Midstream Finance
Corp.(c) | |
| | | | | 636,000 | | | | 5.750 | | | 04/15/25 | | | 627,764 | |
| | | | | 88,000 | | | | 12.000 | (b) | | 10/15/26 | | | 89,036 | |
| | Tallgrass Energy Partners LP/Tallgrass Energy Finance Corp. (b)(c) | |
| | | | | 318,000 | | | | 6.000 | | | 03/01/27 | | | 310,037 | |
| | | | | 402,000 | | | | 7.375 | | | 02/15/29 | | | 402,832 | |
| | | | | 2,228,000 | | | | 6.000 | | | 12/31/30 | | | 2,096,437 | |
| | Venture Global Calcasieu Pass LLC (b)(c) | |
| | | | | 590,000 | | | | 4.125 | | | 08/15/31 | | | 516,563 | |
| | | | | 1,480,000 | | | | 3.875 | | | 11/01/33 | | | 1,213,541 | |
| | Venture Global LNG, Inc. (b)(c) | |
| | | | | 793,000 | | | | 9.500 | | | 02/01/29 | | | 852,602 | |
| | | |
| | |
| The accompanying notes are an integral part of these financial statements. | | 43 |
GOLDMAN SACHS MULTI-MANAGER NON-CORE FIXED INCOME FUND
|
Schedule of Investments (continued) April 30, 2024 (Unaudited) |
| | | | | | | | | | | | | | | | |
| | | | | Principal Amount | | | Interest Rate | | | Maturity Date | | Value | |
| |
| | Corporate Obligations – (continued) | |
| |
| | Pipelines – (continued) | |
| | Western Midstream Operating LP (c) | |
| | $ | | | 965,000 | | | | 5.250 | % | | 02/01/50 | | $ | 818,079 | |
| | | | | | | | | | | | | | | | |
| | | | | | | | | | | | | | | 20,820,595 | |
| | | |
| |
| | Real Estate(c) – 0.2% | |
| | Heimstaden Bostad Treasury BV | |
| | EUR | | | 994,000 | | | | 1.625 | | | 10/13/31 | | | 765,090 | |
| | Howard Hughes Corp. (b) | |
| | $ | | | 1,050,000 | | | | 4.375 | | | 02/01/31 | | | 892,269 | |
| | Newmark Group, Inc. (b) | |
| | | | | 782,000 | | | | 7.500 | | | 01/12/29 | | | 790,000 | |
| | Samhallsbyggnadsbolaget i Norden AB | |
| | EUR | | | 550,000 | | | | 3.000 | | | 01/14/25 | | | 530,013 | |
| | | | | 500,000 | | | | 2.375 | | | 09/04/26 | | | 402,468 | |
| | WeWork Cos U.S. LLC (b)(f) | |
| | $ | | | 1,335,000 | | | | 11.000 | | | 08/15/27 | | | 66,523 | |
| | | | | 1,064,106 | | | | 15.000 | | | 08/15/27 | | | 106,666 | |
| | | | | | | | | | | | | | | | |
| | | | | | | | | | | | | | | 3,553,029 | |
| | | |
| |
| | Real Estate Investment Trust – 0.9% | |
| | Apollo Commercial Real Estate Finance, Inc. (b)(c) | |
| | | | | 900,000 | | | | 4.625 | | | 06/15/29 | | | 744,237 | |
| | Brandywine Operating Partnership LP (c) | |
| | | | | 851,000 | | | | 8.050 | | | 03/15/28 | | | 866,088 | |
| | Brookfield Property REIT, Inc./BPR Cumulus LLC/BPR | |
| | Nimbus LLC/GGSI Sellco LLC (b)(c) | |
| | | | | 1,866,000 | | | | 4.500 | | | 04/01/27 | | | 1,669,622 | |
| | Diversified Healthcare Trust (c) | |
| | | | | 300,000 | | | | 4.750 | | | 02/15/28 | | | 235,980 | |
| | | | | 1,320,000 | | | | 4.375 | | | 03/01/31 | | | 955,799 | |
| | HAT Holdings I LLC/HAT Holdings II LLC (b) | |
| | | | | 506,000 | | | | 3.375 | (c) | | 06/15/26 | | | 471,946 | |
| | | | | 126,000 | | | | 3.750 | | | 09/15/30 | | | 104,348 | |
| | Iron Mountain U.K. PLC (b)(c) | |
| | GBP | | | 400,000 | | | | 3.875 | | | 11/15/25 | | | 484,860 | |
| | Iron Mountain, Inc. (b)(c) | |
| | $ | | | 419,000 | | | | 5.250 | | | 03/15/28 | | | 401,079 | |
| | | | | 935,000 | | | | 4.875 | | | 09/15/29 | | | 863,660 | |
| | | | | 175,000 | | | | 4.500 | | | 02/15/31 | | | 154,403 | |
| | Ladder Capital Finance Holdings LLLP/Ladder Capital Finance Corp.(b)(c) | |
| | | | | 287,000 | | | | 5.250 | | | 10/01/25 | | | 281,983 | |
| | | | | 883,000 | | | | 4.250 | | | 02/01/27 | | | 818,179 | |
| | | | | 1,000,000 | | | | 4.750 | | | 06/15/29 | | | 891,580 | |
| | Piedmont Operating Partnership LP (c) | |
| | | | | 704,000 | | | | 9.250 | | | 07/20/28 | | | 743,234 | |
| | Service Properties Trust (c) | |
| | | | | 700,000 | | | | 4.950 | | | 02/15/27 | | | 644,700 | |
| | | | | 380,000 | | | | 5.500 | | | 12/15/27 | | | 359,366 | |
| | | | | 485,000 | | | | 4.375 | | | 02/15/30 | | | 369,420 | |
| | Starwood Property Trust, Inc. (b)(c) | |
| | | | | 700,000 | | | | 3.625 | | | 07/15/26 | | | 648,256 | |
| | | | | 430,000 | | | | 7.250 | | | 04/01/29 | | | 424,440 | |
| | Uniti Group LP/Uniti Group Finance, Inc./CSL Capital LLC (b)(c) | |
| | | | | 566,000 | | | | 10.500 | | | 02/15/28 | | | 587,316 | |
| | | |
| | | | | | | | | | | | | | | | |
| | | | | Principal Amount | | | Interest Rate | | | Maturity Date | | Value | |
| |
| | Corporate Obligations – (continued) | |
| |
| | Real Estate Investment Trust – (continued) | |
| | VICI Properties LP/VICI Note Co., Inc. (b)(c) | |
| | $ | | | 898,000 | | | | 3.750 | % | | 02/15/27 | | $ | 842,674 | |
| | | | | | | | | | | | | | | | |
| | | | | | | | | | | | | | | 13,563,170 | |
| | | |
| |
| | Retailing – 1.4% | |
| | 1011778 BC ULC/New Red Finance, Inc. (b)(c) | |
| | | | | 750,000 | | | | 3.875 | | | 01/15/28 | | | 692,385 | |
| | | | | 450,000 | | | | 4.375 | | | 01/15/28 | | | 419,296 | |
| | Asbury Automotive Group, Inc. (c) | |
| | | | | 782,000 | | | | 4.500 | | | 03/01/28 | | | 733,665 | |
| | | | | 138,000 | | | | 4.625 | (b) | | 11/15/29 | | | 125,028 | |
| | Bath & Body Works, Inc. | |
| | | | | 256,000 | | | | 9.375 | (b) | | 07/01/25 | | | 265,347 | |
| | | | | 145,000 | | | | 5.250 | | | 02/01/28 | | | 139,494 | |
| | | | | 795,000 | | | | 6.875 | | | 11/01/35 | | | 789,594 | |
| | | | | 705,000 | | | | 6.750 | | | 07/01/36 | | | 687,608 | |
| | BCPE Ulysses Intermediate, Inc. (b)(c)(h) (PIK 8.500%, Cash 7.720%) | |
| | | | | 829,667 | | | | 7.750 | | | 04/01/27 | | | 806,752 | |
| | Bloomin’ Brands, Inc./OSI Restaurant Partners LLC (b)(c) | |
| | | | | 700,000 | | | | 5.125 | | | 04/15/29 | | | 646,751 | |
| | Doman Building Materials Group Ltd. (b)(c) | |
| | CAD | | | 1,590,000 | | | | 5.250 | | | 05/15/26 | | | 1,107,335 | |
| | Ferrellgas LP/Ferrellgas Finance Corp. (b)(c) | |
| | $ | | | 1,073,000 | | | | 5.375 | | | 04/01/26 | | | 1,052,237 | |
| | | | | 435,000 | | | | 5.875 | | | 04/01/29 | | | 412,315 | |
| | Global Auto Holdings Ltd./AAG FH U.K. Ltd. (b)(c) | |
| | | | | 812,000 | | | | 8.375 | | | 01/15/29 | | | 777,035 | |
| | | | | 612,000 | | | | 8.750 | | | 01/15/32 | | | 576,584 | |
| | Kohl’s Corp. (c) | |
| | | | | 220,000 | | | | 4.625 | | | 05/01/31 | | | 181,689 | |
| | | | | 260,000 | | | | 5.550 | | | 07/17/45 | | | 178,337 | |
| | LBM Acquisition LLC (b)(c) | |
| | | | | 1,981,000 | | | | 6.250 | | | 01/15/29 | | | 1,819,073 | |
| | LCM Investments Holdings II LLC (b)(c) | |
| | | | | 804,000 | | | | 4.875 | | | 05/01/29 | | | 734,349 | |
| | Macy’s Retail Holdings LLC (c) | |
| | | | | 805,000 | | | | 6.125 | (b) | | 03/15/32 | | | 762,118 | |
| | | | | 670,000 | | | | 4.500 | | | 12/15/34 | | | 571,791 | |
| | Neiman Marcus Group Ltd. LLC (k)(l) | |
| | | | | 605,000 | | | | 8.000 | | | 10/15/21 | | | 21,189 | |
| | PetSmart, Inc./PetSmart Finance Corp. (b)(c) | |
| | | | | 500,000 | | | | 4.750 | | | 02/15/28 | | | 461,490 | |
| | QVC, Inc. (c) | |
| | | | | 1,425,000 | | | | 4.750 | | | 02/15/27 | | | 1,239,579 | |
| | Rite Aid Corp. (b)(c)(f) | |
| | | | | 445,000 | | | | 7.500 | | | 07/01/25 | | | 277,021 | |
| | Shiba Bidco SpA (b)(c) | |
| | EUR | | | 343,000 | | | | 4.500 | | | 10/31/28 | | | 350,171 | |
| | Specialty Building Products Holdings LLC/SBP Finance Corp. (b)(c) | |
| | $ | | | 1,838,000 | | | | 6.375 | | | 09/30/26 | | | 1,821,715 | |
| | Victoria’s Secret & Co. (b)(c) | |
| | | | | 1,874,000 | | | | 4.625 | | | 07/15/29 | | | 1,472,870 | |
| | | |
| | |
| 44 | | The accompanying notes are an integral part of these financial statements. |
GOLDMAN SACHS MULTI-MANAGER NON-CORE FIXED INCOME FUND
| | | | | | | | | | | | | | | | |
| | | Principal Amount | | | Interest Rate | | | Maturity Date | | Value | |
| |
| | Corporate Obligations – (continued) | |
| |
| | Retailing – (continued) | |
| | Walgreens Boots Alliance, Inc. (c) | |
| | $ | | | 700,000 | | | | 4.800 | % | | 11/18/44 | | $ | 566,328 | |
| | White Cap Parent LLC (b)(c)(h) (PIK 9.000%, Cash 8.250%) | |
| | | | | 673,000 | | | | 8.250 | | | 03/15/26 | | | 674,043 | |
| | Yum! Brands, Inc. | |
| | | | | 260,000 | | | | 5.375 | (c) | | 04/01/32 | | | 245,534 | |
| | | | | 285,000 | | | | 6.875 | | | 11/15/37 | | | 303,106 | |
| | | | | | | | | | | | | | | | |
| | | | | | | | | | | | | | | 20,911,829 | |
| | | |
| |
| | Semiconductors(b)(c) – 0.2% | |
| | Entegris, Inc. | |
| | | | | 1,000,000 | | | | 4.750 | | | 04/15/29 | | | 944,760 | |
| | | | | 145,000 | | | | 3.625 | | | 05/01/29 | | | 128,332 | |
| | ON Semiconductor Corp. | |
| | | | | 1,101,000 | | | | 3.875 | | | 09/01/28 | | | 998,684 | |
| | Synaptics, Inc. | |
| | | | | 1,150,000 | | | | 4.000 | | | 06/15/29 | | | 1,010,770 | |
| | | | | | | | | | | | | | | | |
| | | | | | | | | | | | | | | 3,082,546 | |
| | | |
| |
| | Software(b)(c) – 0.6% | |
| | Central Parent LLC/CDK Global II LLC/CDK Financing Co., Inc. | |
| | | | | 500,000 | | | | 8.000 | | | 06/15/29 | | | 514,175 | |
| | Central Parent, Inc./CDK Global, Inc. | |
| | | | | 1,250,000 | | | | 7.250 | | | 06/15/29 | | | 1,263,600 | |
| | Cloud Software Group, Inc. | |
| | | | | 1,430,000 | | | | 6.500 | | | 03/31/29 | | | 1,356,098 | |
| | | | | 880,000 | | | | 9.000 | | | 09/30/29 | | | 847,854 | |
| | Elastic NV | |
| | | | | 1,040,000 | | | | 4.125 | | | 07/15/29 | | | 925,465 | |
| | Open Text Holdings, Inc. | |
| | | | | 1,317,000 | | | | 4.125 | | | 02/15/30 | | | 1,157,116 | |
| | Rocket Software, Inc. | |
| | | | | 1,470,000 | | | | 9.000 | | | 11/28/28 | | | 1,475,262 | |
| | UKG, Inc. | |
| | | | | 805,000 | | | | 6.875 | | | 02/01/31 | | | 806,465 | |
| | | | | | | | | | | | | | | | |
| | | | | | | | | | | | | | | 8,346,035 | |
| | | |
| |
| | Telecommunication Services – 1.8% | |
| | Altice France Holding SA (b)(c) | |
| | EUR | | | 365,000 | | | | 8.000 | | | 05/15/27 | | | 115,254 | |
| | $ | | | 1,069,000 | | | | 10.500 | | | 05/15/27 | | | 381,558 | |
| | Altice France SA (b)(c) | |
| | EUR | | | 100,000 | | | | 2.500 | | | 01/15/25 | | | 95,301 | |
| | | | | 500,000 | | | | 2.125 | | | 02/15/25 | | | 476,238 | |
| | $ | | | 350,000 | | | | 5.500 | | | 01/15/28 | | | 236,061 | |
| | | | | 2,058,000 | | | | 5.500 | | | 10/15/29 | | | 1,347,537 | |
| | Ciena Corp. (b)(c) | |
| | | | | 730,000 | | | | 4.000 | | | 01/31/30 | | | 640,385 | |
| | CommScope, Inc. (b)(c) | |
| | | | | 909,000 | | | | 6.000 | | | 03/01/26 | | | 812,710 | |
| | | | | 1,790,000 | | | | 8.250 | | | 03/01/27 | | | 685,373 | |
| | | | | 395,000 | | | | 7.125 | | | 07/01/28 | | | 132,325 | |
| | | | | 657,000 | | | | 4.750 | | | 09/01/29 | | | 458,606 | |
| | ILIAD HOLDING SAS (c) | |
| | | | | 700,000 | | | | 8.500 | | | 04/15/31 | | | 706,875 | |
| | | |
| | | | | | | | | | | | | | | | |
| | | Principal Amount | | | Interest Rate | | | Maturity Date | | Value | |
| |
| | Corporate Obligations – (continued) | |
| |
| | Telecommunication Services – (continued) | |
| | Iliad Holding SASU (b)(c) | |
| | $ | | | 1,175,000 | | | | 6.500 | % | | 10/15/26 | | $ | 1,169,113 | |
| | EUR | | | 500,000 | | | | 5.625 | | | 10/15/28 | | | 527,501 | |
| | $ | | | 1,717,000 | | | | 7.000 | | | 10/15/28 | | | 1,679,243 | |
| | Kaixo Bondco Telecom SA (b)(c) | |
| | EUR | | | 200,000 | | | | 5.125 | | | 09/30/29 | | | 204,994 | |
| | Level 3 Financing, Inc. (b)(c) | |
| | $ | | | 243,000 | | | | 4.625 | | | 09/15/27 | | | 142,891 | |
| | | | | 270,000 | | | | 4.250 | | | 07/01/28 | | | 105,265 | |
| | | | | 530,000 | | | | 3.625 | | | 01/15/29 | | | 181,292 | |
| | | | | 125,000 | | | | 10.500 | | | 04/15/29 | | | 125,245 | |
| | | | | 1,128,000 | | | | 4.875 | | | 06/15/29 | | | 713,765 | |
| | | | | 585,000 | | | | 3.750 | | | 07/15/29 | | | 202,638 | |
| | | | | 300,000 | | | | 3.875 | | | 11/15/29 | | | 110,250 | |
| | | | | 280,000 | | | | 11.000 | | | 11/15/29 | | | 285,519 | |
| | | | | 1,997,000 | | | | 10.500 | | | 05/15/30 | | | 1,995,263 | |
| | Lorca Telecom Bondco SA (b)(c) | |
| | EUR | | | 450,000 | | | | 4.000 | | | 09/18/27 | | | 468,412 | |
| | SoftBank Group Corp. (c) | |
| | | | | 1,199,000 | | | | 3.375 | | | 07/06/29 | | | 1,163,119 | |
| | TDC Net AS (c) | |
| | | | | 821,000 | | | | 6.500 | | | 06/01/31 | | | 930,748 | |
| | Telecom Italia Capital SA | |
| | $ | | | 326,000 | | | | 6.000 | | | 09/30/34 | | | 274,645 | |
| | Telecom Italia SpA | |
| | | | | 230,000 | | | | 5.303 | (b) | | 05/30/24 | | | 229,446 | |
| | EUR | | | 1,295,000 | | | | 6.875 | (c) | | 02/15/28 | | | 1,444,907 | |
| | Telesat Canada/Telesat LLC (b)(c) | |
| | $ | | | 1,020,000 | | | | 5.625 | | | 12/06/26 | | | 495,485 | |
| | Viasat, Inc. (b)(c) | |
| | | | | 1,062,000 | | | | 7.500 | | | 05/30/31 | | | 749,475 | |
| | Vmed O2 U.K. Financing I PLC (b)(c) | |
| | | | | 1,230,000 | | | | 4.250 | | | 01/31/31 | | | 1,008,379 | |
| | | | | 2,442,000 | | | | 7.750 | | | 04/15/32 | | | 2,405,492 | |
| | Windstream Escrow LLC/Windstream Escrow Finance Corp. (b)(c) | |
| | | | | 1,720,000 | | | | 7.750 | | | 08/15/28 | | | 1,657,822 | |
| | Zayo Group Holdings, Inc. (b)(c) | |
| | | | | 4,055,000 | | | | 4.000 | | | 03/01/27 | | | 3,230,213 | |
| | | | | | | | | | | | | | | | |
| | | | | | | | | | | | | | | 27,589,345 | |
| | | |
| |
| | Transportation – 0.1% | |
| | Rand Parent LLC (b)(c) | |
| | | | | 828,000 | | | | 8.500 | | | 02/15/30 | | | 818,594 | |
| | SGL Group ApS (c)(i) (3 mo. EUR Euribor + 4.750%) | |
| | EUR | | | 340,000 | | | | 8.647 | | | 04/22/30 | | | 360,863 | |
| | Transnet SOC Ltd. (b) | |
| | $ | | | 727,000 | | | | 8.250 | | | 02/06/28 | | | 715,186 | |
| | | | | | | | | | | | | | | | |
| | | | | | | | | | | | | | | 1,894,643 | |
| | | |
| |
| | Water(b)(c) – 0.1% | |
| | Aegea Finance SARL | |
| | | | | 721,000 | | | | 9.000 | | | 01/20/31 | | | 757,266 | |
| | | |
| | |
| The accompanying notes are an integral part of these financial statements. | | 45 |
GOLDMAN SACHS MULTI-MANAGER NON-CORE FIXED INCOME FUND
|
Schedule of Investments (continued) April 30, 2024 (Unaudited) |
| | | | | | | | | | | | | | | | |
| | | Principal Amount | | | Interest Rate | | | Maturity Date | | Value | |
| |
| | Corporate Obligations – (continued) | |
| |
| | Water Utilities(b)(c) – 0.0% | |
| | Aegea Finance SARL | |
| | $ | | | 616,000 | | | | 6.750 | % | | 05/20/29 | | $ | 594,348 | |
| | | |
| | |
| | TOTAL CORPORATE OBLIGATIONS (Cost $474,389,159) | | $ | 453,898,816 | |
| | | |
| | | | | | | | | | | | | | | | |
| |
| | Bank Loans(n) – 23.1% | |
| |
| | Aerospace & Defense(i) – 1.3% | |
| | Bleriot U.S. Bidco, Inc. (3 mo. USD Term SOFR + 4.000%) | |
| | $ | | | 602,644 | | | | 9.571 | % | | 10/31/28 | | $ | 605,320 | |
| | Cobham Ultra SeniorCo SARL (6 mo. USD Term SOFR + 3.500%) | |
| | | | | 726,978 | | | | 9.012 | | | 08/03/29 | | | 712,439 | |
| | Dynasty Acquisition Co., Inc. (1 mo. USD Term SOFR + 3.500%) | |
| | | | | 8,623,835 | | | | 8.816 | | | 08/24/28 | | | 8,663,074 | |
| | Kaman Corp. (3 mo. USD Term SOFR + 3.500%) | |
| | | | | 1,045,000 | | | | 8.827 | | | 04/21/31 | | | 1,048,271 | |
| | Propulsion (BC) Finco SARL (3 mo.USD Term SOFR + 3.750%) | |
| | | | | 568,466 | | | | 9.058 | | | 09/14/29 | | | 570,717 | |
| | Spirit Aerosystems, Inc. (3 mo.USD Term SOFR + 4.250%) | |
| | | | | 1,246,206 | | | | 9.580 | | | 01/15/27 | | | 1,251,664 | |
| | TransDigm, Inc. (1 mo. USD Term SOFR + 3.250%) | |
| | | | | 568,575 | | | | 8.559 | | | 02/28/31 | | | 571,662 | |
| | (3 mo. USD Term SOFR + 2.750%) | |
| | | | | 5,342,699 | | | | 8.059 | | | 08/24/28 | | | 5,368,397 | |
| | | | | 1,238,229 | | | | 8.059 | | | 02/22/30 | | | 1,243,231 | |
| | | | | | | | | | | | | | | | |
| | | | | | | | | | | | | | | 20,034,775 | |
| | | |
| |
| | Airlines(i) – 0.1% | |
| | American Airlines, Inc. (3 mo.USD Term SOFR + 4.750%) | |
| | | | | 578,400 | | | | 10.336 | | | 04/20/28 | | | 600,992 | |
| | Mileage Plus Holdings LLC (3 mo. USD Term SOFR + 5.250%) | |
| | | | | 580,412 | | | | 10.733 | | | 06/21/27 | | | 595,224 | |
| | | | | | | | | | | | | | | | |
| | | | | | | | | | | | | | | 1,196,216 | |
| | | |
| |
| | Auto Parts & Equipment(i) – 0.1% | |
| | Autokiniton U.S. Holdings, Inc. (1 mo. USD Term SOFR + 4.000%) | |
| | | | | 497,474 | | | | 9.430 | | | 04/06/28 | | | 499,494 | |
| | Clarios Global LP (1 mo. USD Term SOFR + 3.000%) | |
| | | | | 448,875 | | | | 8.316 | | | 05/06/30 | | | 449,997 | |
| | First Brands Group LLC (3 mo. USD Term SOFR + 5.000%) | |
| | | | | 480,101 | | | | 10.591 | | | 03/30/27 | | | 459,495 | |
| | | | | | | | | | | | | | | | |
| | | | | | | | | | | | | | | 1,408,986 | |
| | | |
| |
| | Beverages(i) – 0.0% | |
| | Naked Juice LLC (3 mo. USD Term SOFR + 0.000%) | |
| | | | | 733,359 | | | | 8.659 | | | 01/24/29 | | | 707,464 | |
| | | |
| |
| | Building Materials(i) – 0.4% | |
| | Chamberlain Group, Inc. (1 mo. USD Term SOFR + 3.250%) | |
| | | | | 2,606,911 | | | | 8.666 | | | 11/03/28 | | | 2,602,480 | |
| | | |
| | | | | | | | | | | | | | | | |
| | | Principal Amount | | | Interest Rate | | | Maturity Date | | Value | |
| |
| | Bank Loans(n) – (continued) | |
| |
| | Building Materials(i) – (continued) | |
| | Cornerstone Building Brands, Inc. (1 mo. USD Term SOFR + 5.265%) | |
| | $ | | | 248,741 | | | | 10.946 | % | | 08/01/28 | | $ | 251,317 | |
| | CP Atlas Buyer, Inc. (1 mo. USD Term SOFR + 3.750%) | |
| | | | | 872,961 | | | | 9.166 | | | 11/23/27 | | | 866,702 | |
| | Emrld Borrower LP (1 mo. USD Term SOFR + 2.500%) | |
| | | | | 248,752 | | | | 7.816 | | | 05/31/30 | | | 249,485 | |
| | Icebox Holdco III, Inc. (3 mo. USD Term SOFR + 3.500%) | |
| | | | | 497,465 | | | | 9.321 | | | 12/22/28 | | | 496,132 | |
| | Ingersoll-Rand Services Co. (1 mo. USD Term SOFR + 1.750%) | |
| | | | | 17,376 | | | | 7.166 | | | 03/01/27 | | | 17,402 | |
| | Wilsonart LLC (3 mo. USD Term SOFR + 3.250%) | |
| | | | | 1,005,691 | | | | 8.652 | | | 12/31/26 | | | 1,007,391 | |
| | | | | | | | | | | | | | | | |
| | | | | | | | | | | | | | | 5,490,909 | |
| | | |
| |
| | Chemicals – 0.4% | |
| | Aruba Investments Holdings LLC | |
| | (1 mo. USD Term SOFR + 4.000%) | |
| | | | | 268,972 | | | | 9.416 | (i) | | 11/24/27 | | | 260,789 | |
| | (3 mo. USD Term SOFR + 7.750%) | |
| | | | | 424,596 | | | | 13.166 | (i) | | 11/24/28 | | | 403,791 | |
| | Derby Buyer LLC (1 mo. USD Term SOFR + 4.250%) | |
| | | | | 655,724 | | | | 9.577 | (i) | | 11/01/30 | | | 658,596 | |
| | Eastman Chemical Co. (3 mo. USD Term SOFR + 5.250%) | |
| | | | | 731,522 | | | | 10.821 | (i) | | 11/01/28 | | | 714,149 | |
| | Lonza Group AG (3 mo. USD Term SOFR + 3.925%) | |
| | | | | 548,563 | | | | 9.334 | (i) | | 07/03/28 | | | 525,704 | |
| | Nouryon Finance B.V. | |
| | | | | 426,572 | | | | 0.000 | (o) | | 04/03/28 | | | 427,150 | |
| | Polar U.S. Borrower LLC (3 mo.USD Term SOFR + 4.750%) | |
| | | | | 1,342,395 | | | | 10.178 | (i) | | 10/15/25 | | | 1,001,950 | |
| | SCIH Salt Holdings, Inc. (3 mo. USD Term SOFR + 3.500%) | |
| | | | | 795,947 | | | | 8.830 | (i) | | 03/16/27 | | | 797,277 | |
| | Tronox Finance LLC | |
| | | | | 729,446 | | | | 0.000 | (o) | | | | | 729,752 | |
| | (1 mo. USD Term SOFR + 3.500%) | |
| | | | | 249,375 | | | | 8.816 | (i) | | 08/16/28 | | | 249,532 | |
| | | | | | | | | | | | | | | | |
| | | | | | | | | | | | | | | 5,768,690 | |
| | | |
| |
| | Commercial Services – 1.6% | |
| | AlixPartners LLP (1 mo. USD Term SOFR + 2.500%) | |
| | | | | 751,127 | | | | 7.930 | (i) | | 02/04/28 | | | 752,900 | |
| | Allied Universal Holdco LLC | |
| | (1 mo. USD Term SOFR + 3.750%) | |
| | | | | 1,000,000 | | | | 9.166 | (i) | | 05/12/28 | | | 1,000,190 | |
| | (1 mo. USD Term SOFR + 4.750%) | |
| | | | | 4,353,125 | | | | 10.066 | (i) | | 05/12/28 | | | 4,367,882 | |
| | American Auto Auction Group LLC (3 mo. USD Term SOFR + 5.000%) | |
| | | | | 382,400 | | | | 10.459 | (i) | | 12/30/27 | | | 381,444 | |
| | Anticimex International AB | |
| | | | | 625,000 | | | | 0.000 | | | 11/16/28 | | | 627,738 | |
| | (3 mo. USD Term SOFR + 3.150%) | |
| | | | | 2,182,157 | | | | 8.461 | (i) | | 11/16/28 | | | 2,184,427 | |
| | | |
| | |
| 46 | | The accompanying notes are an integral part of these financial statements. |
GOLDMAN SACHS MULTI-MANAGER NON-CORE FIXED INCOME FUND
| | | | | | | | | | | | | | | | |
| | | Principal Amount | | | Interest Rate | | | Maturity Date | | Value | |
| |
| | Bank Loans(n) – (continued) | |
| |
| | Commercial Services – (continued) | |
| | Armorica Lux SARL (3 mo. EUR EURIBOR + 5.000%) | |
| | EUR | | | 500,000 | | | | 8.790 | %(i) | | 07/28/28 | | $ | 510,479 | |
| | AVSC Holding Corp. | |
| | (1 mo. USD Term SOFR + 3.250%) | |
| | $ | | | 621,892 | | | | 8.666 | (i) | | 03/03/25 | | | 615,051 | |
| | (1 mo. USD Term SOFR + 5.500%) | |
| | | | | 350,899 | | | | 9.926 | (i) | | 10/15/26 | | | 348,706 | |
| | Celestial Saturn Parent, Inc. (1 mo. USD Term SOFR) | |
| | | | | 1,350,000 | | | | 7.000 | | | 06/04/29 | | | 1,210,788 | |
| | Conservice Midco LLC (1 mo. USD Term SOFR + 4.000%) | |
| | | | | 916,846 | | | | 9.316 | (i) | | 05/13/27 | | | 917,992 | |
| | Creative Artists Agency LLC (1 mo. USD Term SOFR + 3.250%) | |
| | | | | 602,222 | | | | 8.566 | (i) | | 11/27/28 | | | 604,065 | |
| | Ensemble RCM LLC (3 mo. USD Term SOFR + 3.000%) | |
| | | | | 577,347 | | | | 8.330 | (i) | | 08/01/29 | | | 578,882 | |
| | Fugue Finance BV (3 mo. USD Term SOFR + 4.000%) | |
| | | | | 447,739 | | | | 9.343 | (i) | | 01/31/28 | | | 449,194 | |
| | Fugue Finance LLC (1 mo. USD Term SOFR) | |
| | | | | 360,000 | | | | 0.000 | | | 02/26/31 | | | 362,250 | |
| | Global Education Management Systems Establishment (1 mo. USD Term SOFR + 4.750%) | |
| | | | | 683,752 | | | | 10.180 | (i) | | 07/31/26 | | | 685,830 | |
| | Groundworks LLC (1 mo. USD Term SOFR + 3.500%)(i) | |
| | | | | 6,130 | | | | 8.818 | | | 03/14/31 | | | 6,786 | |
| | | | | 384,275 | | | | 8.821 | | | 03/14/31 | | | 384,882 | |
| | GTCR W Merger Sub LLC (1 mo. USD Term SOFR + 3.000%) | |
| | | | | 240,000 | | | | 8.309 | (i) | | 01/31/31 | | | 240,451 | |
| | Hertz Corp. (1 mo. USD Term SOFR + 3.250%) | |
| | | | | 376,950 | | | | 0.000 | (i) | | 06/30/28 | | | 345,905 | |
| | | | | 73,050 | | | | 8.680 | | | 06/30/28 | | | 67,033 | |
| | Mavis Tire Express Services Topco Corp. (1 mo. USD Term SOFR + 3.750%) | |
| | | | | 2,211,000 | | | | 9.066 | (i) | | 05/04/28 | | | 2,216,926 | |
| | Mister Car Wash Holdings, Inc. (1 mo. USD Term SOFR + 3.000%) | |
| | | | | 475,000 | | | | 8.318 | (i) | | 03/21/31 | | | 475,694 | |
| | PG Investment Co. 59 SARL (3 mo. USD Term SOFR + 3.500%) | |
| | | | | 625,000 | | | | 8.813 | (i) | | 03/26/31 | | | 627,081 | |
| | R1 RCM, Inc. (1 mo. USD Term SOFR + 3.000%) | |
| | | | | 299,241 | | | | 8.327 | (i) | | 06/21/29 | | | 300,288 | |
| | Sabert Corp. (1 mo. USD Term SOFR + 3.750%) | |
| | | | | 139,030 | | | | 9.183 | (i) | | 12/10/26 | | | 139,436 | |
| | Sabre GLBL, Inc. (1 mo. USD Term SOFR + 5.000%) | |
| | | | | 165,000 | | | | 10.416 | (i) | | 06/30/28 | | | 144,258 | |
| | Spin Holdco, Inc. (3 mo. USD Term SOFR + 4.000%) | |
| | | | | 1,095,522 | | | | 9.585 | (i) | | 03/04/28 | | | 963,545 | |
| | Spring Education Group, Inc. (3 mo. USD Term SOFR + 4.500%) | |
| | | | | 599,375 | | | | 9.809 | (i) | | 10/04/30 | | | 601,623 | |
| | St. George’s University Scholastic Services (1 mo. USD Term SOFR + 3.000%) | |
| | | | | 447,710 | | | | 8.416 | (i) | | 02/10/29 | | | 447,374 | |
| | Teneo Holdings LLC (1 mo. USD Term SOFR + 4.750%) | |
| | | | | 478,000 | | | | 10.066 | (i) | | 03/13/31 | | | 480,691 | |
| | Verscend Holding Corp. | |
| | | | | 533,501 | | | | 0.000 | (i) | | 08/27/25 | | | 533,634 | |
| | | |
| | | | | | | | | | | | | | | | |
| | | Principal Amount | | | Interest Rate | | | Maturity Date | | Value | |
| |
| | Bank Loans(n) – (continued) | |
| |
| | Commercial Services – (continued) | |
| | Wand NewCo 3, Inc. (1 mo. USD Term SOFR + 3.750%) | |
| | $ | | | 1,000,000 | | | | 9.066 | %(i) | | 01/30/31 | | $ | 1,005,280 | |
| | | | | | | | | | | | | | | | |
| | | | | | | | | | | | | | | 24,578,705 | |
| | | |
| |
| | Computers(i) – 0.5% | |
| | Access CIG LLC (3 mo. USD Term SOFR + 5.000%) | |
| | | | | 1,472,184 | | | | 10.330 | | | 08/18/28 | | | 1,477,086 | |
| | Idemia Group (3 mo.USD Term SOFR + 4.250%) | |
| | | | | 499,200 | | | | 9.559 | | | 09/30/28 | | | 500,449 | |
| | Magenta Buyer LLC (3 mo. USD Term SOFR + 5.000%) | |
| | | | | 1,865,090 | | | | 10.591 | | | 07/27/28 | | | 935,454 | |
| | McAfee LLC (1 mo. USD Term SOFR + 3.750%) | |
| | | | | 391,127 | | | | 9.177 | | | 03/01/29 | | | 391,181 | |
| | Netsmart Technologies, Inc. (1 mo. USD Term SOFR + 3.750%) | |
| | | | | 1,042,861 | | | | 9.180 | | | 10/01/27 | | | 1,045,479 | |
| | Peraton Corp. | |
| | (1 mo. USD Term SOFR + 3.750%) | |
| | | | | 249,343 | | | | 9.166 | | | 02/01/28 | | | 249,299 | |
| | (3 mo. USD Term SOFR + 7.750%) | |
| | | | | 1,361,339 | | | | 13.176 | | | 02/01/29 | | | 1,367,302 | |
| | Verifone Systems, Inc. (3 mo. USD Term SOFR + 4.000%) | |
| | | | | 971,164 | | | | 9.585 | | | 08/20/25 | | | 875,086 | |
| | Virtusa Corp. (1 mo. USD Term SOFR + 3.750%) | |
| | | | | 1,836 | | | | 9.180 | | | 02/11/28 | | | 1,840 | |
| | | | | | | | | | | | | | | | |
| | | | | | | | | | | | | | | 6,843,176 | |
| | | |
| |
| | Distribution & Wholesale(i) – 0.3% | |
| | BCPE Empire Holdings, Inc. (1 mo. USD Term SOFR + 4.000%) | |
| | | | | 2,490,000 | | | | 9.316 | | | 12/11/28 | | | 2,496,051 | |
| | Core & Main LP (1 mo. USD Term SOFR + 2.500%) – (3 mo.
USD Term SOFR + 2.500%) | |
| | | | | 359,469 | | | | 7.918 | | | 07/27/28 | | | 360,817 | |
| | OptiGroup (1 mo. EUR EURIBOR + 5.250%) | |
| | EUR | | | 570,000 | | | | 9.078 | | | 03/16/29 | | | 589,295 | |
| | Windsor Holdings III LLC (1 mo. USD Term SOFR + 4.000%) | |
| | $ | | | 1,745,625 | | | | 9.319 | | | 08/01/30 | | | 1,758,717 | |
| | | | | | | | | | | | | | | | |
| | | | | | | | | | | | | | | 5,204,880 | |
| | | |
| |
| | Diversified Financial Services(i) – 0.6% | |
| | Apex Group Treasury LLC | |
| | (3 mo. USD Term SOFR + 5.000%) | |
| | | | | 864,372 | | | | 10.317 | | | 07/27/28 | | | 867,613 | |
| | (3 mo.USD Term SOFR + 3.750%) | |
| | | | | 1,594,207 | | | | 9.326 | | | 07/27/28 | | | 1,592,883 | |
| | Avolon TLB Borrower 1 (U.S.) LLC (1 mo. USD Term SOFR + 2.000%) | |
| | | | | 413,963 | | | | 7.315 | | | 06/22/28 | | | 414,695 | |
| | Deerfield Dakota Holding LLC | |
| | (3 mo.USD Term SOFR + 3.750%) | |
| | | | | 950,000 | | | | 9.059 | | | 04/09/27 | | | 948,338 | |
| | (3 mo.USD Term SOFR + 6.750%) | |
| | | | | 3,047,000 | | | | 12.321 | | | 04/07/28 | | | 3,040,327 | |
| | Ditech Holding Corp. (k) | |
| | | | | 188,851 | | | | 0.000 | (f) | | 03/28/25 | | | 18,885 | |
| | | |
| | |
| The accompanying notes are an integral part of these financial statements. | | 47 |
GOLDMAN SACHS MULTI-MANAGER NON-CORE FIXED INCOME FUND
|
Schedule of Investments (continued) April 30, 2024 (Unaudited) |
| | | | | | | | | | | | | | | | |
| | | Principal Amount | | | Interest Rate | | | Maturity Date | | Value | |
| |
| | Bank Loans(n) – (continued) | |
| |
| | Diversified Financial Services(i) – (continued) | |
| | Focus Financial Partners LLC | |
| | (1 mo. USD Term SOFR + 2.500%) | |
| | $ | | | 265,493 | | | | 7.816 | % | | 06/30/28 | | $ | 265,079 | |
| | (1 mo. USD Term SOFR + 2.750%) | |
| | | | | 498,750 | | | | 8.066 | | | 06/30/28 | | | 498,551 | |
| | Hightower Holding LLC (3 mo. USD Term SOFR + 4.000%) | |
| | | | | 273,724 | | | | 9.586 | | | 04/21/28 | | | 274,581 | |
| | Vida Capital, Inc. (1 mo. USD Term SOFR + 6.000%) | |
| | | | | 687,345 | | | | 11.430 | | | 10/01/26 | | | 584,243 | |
| | | | | | | | | | | | | | | | |
| | | | | | | | | | | | | | | 8,505,195 | |
| | | |
| |
| | Electrical(i) – 0.1% | |
| | Generation Bridge Northeast LLC (1 mo. USD Term SOFR + 3.500%) | |
| | | | | 449,815 | | | | 8.816 | | | 08/22/29 | | | 451,313 | |
| | Hamilton Projects Acquiror LLC (1 mo. USD Term SOFR + 4.500%) | |
| | | | | 215,040 | | | | 9.930 | | | 06/17/27 | | | 216,160 | |
| | Lackawanna Energy Center LLC (1 mo. USD Term SOFR + 5.000%) | |
| | | | | 496,756 | | | | 10.316 | | | 08/06/29 | | | 495,047 | |
| | Talen Energy Supply LLC (3 mo. USD Term SOFR + 4.500%) | |
| | | | | 496,592 | | | | 9.826 | | | 05/17/30 | | | 497,421 | |
| | | | | | | | | | | | | | | | |
| | | | | | | | | | | | | | | 1,659,941 | |
| | | |
| |
| | Electronics(i) – 0.2% | |
| | II-VI, Inc. (1 mo. USD Term SOFR + 2.500%) | |
| | | | | 800,000 | | | | 7.829 | | | 07/02/29 | | | 802,248 | |
| | Roper Industrial Products Investment Co. LLC (3 mo. USD Term SOFR + 4.000%) | |
| | | | | 2,475,059 | | | | 9.302 | | | 11/22/29 | | | 2,493,622 | |
| | | | | | | | | | | | | | | | |
| | | | | | | | | | | | | | | 3,295,870 | |
| | | |
| |
| | Energy-Alternate Sources(i) – 0.1% | |
| | Enstall Group BV (3 mo. USD Term SOFR + 5.000%) | |
| | | | | 301,576 | | | | 10.571 | | | 08/30/28 | | | 291,021 | |
| | Enviva Partners LP/Fin C | |
| | (3 mo. U.S. (Fed) Prime Rate + 1.750%) | |
| | | | | 304,776 | | | | 10.250 | | | 06/30/27 | | | 305,959 | |
| | (3 mo. USD Term SOFR + 8.000%) | |
| | | | | 136,356 | | | | 13.329 | | | 12/13/24 | | | 154,991 | |
| | | | | | | | | | | | | | | | |
| | | | | | | | | | | | | | | 751,971 | |
| | | |
| |
| | Engineering & Construction – 0.7% | |
| | Apple Bidco LLC | |
| | (1 mo. USD Term SOFR + 2.750%) | |
| | | | | 244,375 | | | | 8.180 | (i) | | 09/22/28 | | | 244,529 | |
| | (1 mo. USD Term SOFR + 3.500%) | |
| | | | | 4,328,872 | | | | 8.816 | (i) | | 09/22/28 | | | 4,337,530 | |
| | Artera Services LLC (3 mo. USD Term SOFR + 4.500%) | |
| | | | | 440,000 | | | | 9.809 | (i) | | 02/15/31 | | | 443,485 | |
| | Brand Industrial Services, Inc. | |
| | | | | 1,000,000 | | | | 0.000 | | | 08/01/30 | | | 1,002,710 | |
| | | |
| | | | | | | | | | | | | | | | |
| | | Principal Amount | | | Interest Rate | | | Maturity Date | | Value | |
| |
| | Bank Loans(n) – (continued) | |
| |
| | Engineering & Construction – (continued) | |
| | Service Logic Acquisition, Inc. (1 mo. USD Term SOFR + 4.000%) – (3 mo. USD Term SOFR + 4.000%) | |
| | $ | | | 851,447 | | | | 9.430 | – | | | | | | |
| | | | | | | | | 9.591 | (i) | | 10/29/27 | | $ | 852,511 | |
| | Tutor Perini Corp. (1 mo. USD Term SOFR + 4.750%) | |
| | | | | 663,490 | | | | 10.180 | (i) | | 08/18/27 | | | 660,591 | |
| | USIC Holdings, Inc. (1 mo. USD Term SOFR + 3.500%) – (3 mo. USD Term SOFR + 3.500%) | |
| | | | | 2,000,000 | | | | 8.933 | – | | | | | | |
| | | | | | | | | 9.110 | (i) | | 05/12/28 | | | 2,004,062 | |
| | (3 mo. USD Term SOFR + 3.500%) | |
| | | | | 1,246,841 | | | | 12.064 | (i) | | 05/14/29 | | | 1,244,759 | |
| | | | | | | | | | | | | | | | |
| | | | | | | | | | | | | | | 10,790,177 | |
| | | |
| |
| | Entertainment – 0.5% | |
| | Caesars Entertainment, Inc. | |
| | (1 mo. USD Term SOFR + 2.750%) | |
| | | | | 225,000 | | | | 8.066 | (i) | | 02/06/31 | | | 225,113 | |
| | (1 mo. USD Term SOFR + 3.250%) | |
| | | | | 445,749 | | | | 8.666 | (i) | | 02/06/30 | | | 446,194 | |
| | Churchill Downs, Inc. (1 mo. USD Term SOFR + 2.000%) | |
| | | | | 33,397 | | | | 7.416 | (i) | | 03/17/28 | | | 33,397 | |
| | Delta 2 (LUX) SARL (3 mo. USD Term SOFR + 2.250%) | |
| | | | | 600,000 | | | | 7.559 | (i) | | 01/15/30 | | | 600,450 | |
| | East Valley Tourist Development Authority (1 mo. USD Term SOFR + 7.500%)(k) | |
| | | | | 1,067,535 | | | | 12.930 | (i) | | 11/23/26 | | | 1,044,049 | |
| | ECL Entertainment LLC | |
| | | | | 135,000 | | | | 0.000 | | | 08/31/30 | | | 135,321 | |
| | (1 mo. USD Term SOFR + 4.750%) | |
| | | | | 856,275 | | | | 10.066 | (i) | | 08/31/30 | | | 858,313 | |
| | Great Canadian Gaming Corp. (3 mo. USD Term SOFR + 4.000%) | |
| | | | | 748,096 | | | | 9.590 | (i) | | 11/01/26 | | | 750,528 | |
| | GVC Holdings (Gibraltar) Ltd. (3 mo. USD Term SOFR + 3.500%) | |
| | | | | 148,126 | | | | 8.909 | (i) | | 10/31/29 | | | 148,381 | |
| | NASCAR Holdings LLC (1 mo. USD Term SOFR + 2.500%) | |
| | | | | 316,221 | | | | 7.930 | (i) | | 10/19/26 | | | 317,735 | |
| | Ontario Gaming GTA LP (3 mo.USD Term SOFR + 4.250%) | |
| | | | | 643,750 | | | | 9.559 | (i) | | 08/01/30 | | | 646,834 | |
| | UFC Holdings LLC (3 mo.USD Term SOFR + 2.750%) | |
| | | | | 941,090 | | | | 8.336 | (i) | | 04/29/26 | | | 942,558 | |
| | William Morris Endeavor Entertainment LLC (1 mo. USD Term SOFR + 2.750%) | |
| | | | | 1,126,261 | | | | 8.180 | (i) | | 05/18/25 | | | 1,128,603 | |
| | | | | | | | | | | | | | | | |
| | | | | | | | | | | | | | | 7,277,476 | |
| | | |
| |
| | Environmental(i) – 0.2% | |
| | Filtration Group Corp. (1 mo. USD Term SOFR + 4.250%) | |
| | | | | 2,721,225 | | | | 9.680 | | | 10/21/28 | | | 2,729,742 | |
| | GFL Environmental, Inc. (3 mo. USD Term SOFR + 2.500%) | |
| | | | | 487,380 | | | | 7.826 | | | 05/31/27 | | | 489,003 | |
| | | |
| | |
| 48 | | The accompanying notes are an integral part of these financial statements. |
GOLDMAN SACHS MULTI-MANAGER NON-CORE FIXED INCOME FUND
| | | | | | | | | | | | | | | | |
| | | Principal Amount | | | Interest Rate | | | Maturity Date | | Value | |
| |
| | Bank Loans(n) – (continued) | |
| |
| | Environmental(i) – (continued) | |
| | WIN Waste Innovations Holdings, Inc. (1 mo. USD Term SOFR + 2.750%) | |
| | $ | | | 402,053 | | | | 8.180 | % | | 03/24/28 | | $ | 378,642 | |
| | | | | | | | | | | | | | | | |
| | | | | | | | | | | | | | | 3,597,387 | |
| | | |
| |
| | Food & Drug Retailing – 0.4% | |
| | 8th Avenue Food & Provisions, Inc. | |
| | (1 mo. USD Term SOFR + 7.750%) | |
| | | | | 280,000 | | | | 13.180 | (i) | | 10/01/26 | | | 251,168 | |
| | (1 mo. USD Term SOFR + 3.750%) | |
| | | | | 3,024,046 | | | | 9.180 | (i) | | 10/01/25 | | | 2,904,989 | |
| | (1 mo. USD Term SOFR + 4.750%) | |
| | | | | 372,454 | | | | 10.180 | (i) | | 10/01/25 | | | 358,796 | |
| | Chobani LLC (1 mo. USD Term SOFR) | |
| | | | | 580,000 | | | | 3.250 | | | 10/25/27 | | | 582,175 | |
| | Fiesta Purchaser, Inc. (1 mo. USD Term SOFR + 4.000%) | |
| | | | | 625,000 | | | | 9.316 | – | | | | | | |
| | | | | | | | | 9.318 | (i) | | 02/12/31 | | | 627,113 | |
| | Nomad Foods U.S. LLC | |
| | | | | 643,447 | | | | 0.000 | (o) | | | | | 643,448 | |
| | Quirch Foods Holdings LLC (3 mo.USD Term SOFR + 4.750%) | |
| | $ | | | 248,715 | | | | 10.324 | (i) | | 10/27/27 | | | 249,259 | |
| | Solina Bidco (3 mo.USD Term SOFR + 3.750%) | |
| | | | | 655,000 | | | | 9.071 | (i)(k) | | 03/07/29 | | | 656,637 | |
| | U.S. Foods, Inc. (1 mo. USD Term SOFR + 2.000%) | |
| | | | | 63,084 | | | | 7.430 | (i) | | 09/13/26 | | | 63,245 | |
| | | | | | | | | | | | | | | | |
| | | | | | | | | | | | | | | 6,336,830 | |
| | | |
| |
| | Hand/Machine Tools(i) – 0.0% | |
| | Alliance Laundry Systems LLC (1 mo. USD Term SOFR + 3.500%) – (3 mo. USD Term SOFR + 3.500%) | |
| | | | | 198,632 | | | | 8.899 | – | | | | | | |
| | | | | | | | | 8.921 | | | 10/08/27 | | | 199,179 | |
| | | |
| |
| | Health Care Products – 1.0% | |
| | Agiliti Health, Inc | |
| | | | | 145,000 | | | | 0.000 | | | 05/01/30 | | | 145,181 | |
| | Agiliti Health, Inc. (3 mo. USD Term SOFR + 3.000%) | |
| | | | | 648,750 | | | | 8.302 | (i) | | 05/01/30 | | | 648,348 | |
| | Bausch & Lomb Corp. | |
| | (1 mo. USD Term SOFR + 3.250%) | |
| | | | | 382,001 | | | | 8.669 | (i) | | 05/10/27 | | | 379,377 | |
| | (1 mo. USD Term SOFR + 4.000%) | |
| | | | | 2,245,304 | | | | 9.316 | (i) | | 09/29/28 | | | 2,249,525 | |
| | Carestream Health, Inc. (3 mo. USD Term SOFR + 7.500%) | |
| | | | | 1,247,861 | | | | 12.909 | (i) | | 09/30/27 | | | 1,119,955 | |
| | Confluent Medical Technologies, Inc. (3 mo.USD Term SOFR + 3.750%) | |
| | | | | 458,830 | | | | 9.059 | (i) | | 02/16/29 | | | 458,830 | |
| | Curia Global, Inc. (1 mo. USD Term SOFR + 3.750%) – (3 mo. USD Term SOFR + 3.750%) | |
| | | | | 1,599,545 | | | | 9.166 | – | | | | | | |
| | | | | | | | | 9.180 | (i) | | 08/30/26 | | | 1,516,464 | |
| | ICU Medical, Inc. (1 mo. USD Term SOFR) | |
| | | | | 508,366 | | | | 0.000 | | | 01/08/29 | | | 507,731 | |
| | | |
| | | | | | | | | | | | | | | | |
| | | Principal Amount | | | Interest Rate | | | Maturity Date | | Value | |
| |
| | Bank Loans(n) – (continued) | |
| |
| | Health Care Products – (continued) | |
| | Lifescan Global Corp. (3 mo. USD Term SOFR + 6.500%) | |
| | $ | | | 3,106,579 | | | | 11.975 | %(i) | | 12/31/26 | | $ | 1,133,902 | |
| | Maravai Intermediate Holdings LLC (3 mo. USD Term SOFR + 3.000%) | |
| | | | | 847,602 | | | | 8.327 | (i) | | 10/19/27 | | | 837,541 | |
| | Medline Borrower LP (1 mo. USD Term SOFR + 2.750%) | |
| | | | | 5,141,430 | | | | 8.068 | (i) | | 10/23/28 | | | 5,152,792 | |
| | Viant Medical Holdings, Inc. (1 mo. USD Term SOFR + 3.750%) | |
| | | | | 619,450 | | | | 9.180 | (i) | | 07/02/25 | | | 617,387 | |
| | Vyaire Medical, Inc. (6 mo. USD Term SOFR + 4.750%) | |
| | | | | 363,906 | | | | 10.310 | (i) | | 04/16/25 | | | 225,469 | |
| | | | | | | | | | | | | | | | |
| | | | | | | | | | | | | | | 14,992,502 | |
| | | |
| |
| | Health Care Services – 0.9% | |
| | Cambrex Corp. (1 mo. USD Term SOFR + 3.500%) | |
| | | | | 989,874 | | | | 8.916 | (i) | | 12/04/26 | | | 952,258 | |
| | Catalent Pharma Solutions, Inc. (1 mo. USD Term SOFR + 3.000%) | |
| | | | | 415,000 | | | | 8.315 | (i) | | 02/22/28 | | | 416,556 | |
| | Charlotte Buyer, Inc. (1 mo. USD Term SOFR + 5.250%) | |
| | | | | 532,305 | | | | 10.571 | (i) | | 02/11/28 | | | 534,333 | |
| | Da Vinci Purchaser Corp. (1 mo. USD Term SOFR + 4.000%) | |
| | | | | 721,575 | | | | 9.430 | (i) | | 01/08/27 | | | 723,386 | |
| | Electron BidCo, Inc. (1 mo. USD Term SOFR + 3.000%) | |
| | | | | 397,970 | | | | 8.430 | (i) | | 11/01/28 | | | 398,519 | |
| | eResearchTechnology, Inc. (1 mo. USD Term SOFR + 4.500%) | |
| | | | | 1,096,251 | | | | 9.930 | (i) | | 02/04/27 | | | 1,098,992 | |
| | Global Medical Response, Inc. (3 mo.USD Term SOFR + 4.250%) | |
| | | | | 1,037,973 | | | | 9.814 | (i) | | 10/02/25 | | | 983,698 | |
| | Heartland Dental LLC (1 mo. USD Term SOFR + 5.000%) | |
| | | | | 355,990 | | | | 10.315 | (i) | | 04/28/28 | | | 356,791 | |
| | HomeVi SAS | |
| | EUR | | | 500,000 | | | | 0.000 | (i) | | 10/31/26 | | | 457,295 | |
| | LifePoint Health, Inc. (3 mo.USD Term SOFR + 4.750%) | |
| | $ | | | 725,001 | | | | 10.056 | (i) | | 11/16/28 | | | 727,227 | |
| | MDVIP, Inc. | |
| | (1 mo. USD Term SOFR + 3.500%) | |
| | | | | 622,270 | | | | 8.930 | (i) | | 10/16/28 | | | 624,604 | |
| | (1 mo. USD Term SOFR + 6.500%) | |
| | | | | 100,000 | | | | 11.930 | (i) | | 10/15/29 | | | 98,750 | |
| | Pluto Acquisition I, Inc. (k) | |
| | (3 mo. USD Term SOFR + 4.000%)(k) | |
| | | | | 537,207 | | | | 9.316 | (i) | | 09/20/28 | | | 472,742 | |
| | (3 mo. USD Term SOFR + 5.500%) | |
| | | | | 238,343 | | | | 10.687 | (i) | | 06/20/28 | | | 240,429 | |
| | Precision Medicine Group LLC (3 mo. USD Term SOFR) | |
| | | | | 498,713 | | | | 3.000 | | | 11/18/27 | | | 492,170 | |
| | Radnet Management, Inc. (3 mo. USD Term SOFR + 0.000%) | |
| | | | | 615,000 | | | | 8.574 | (i) | | 04/21/28 | | | 613,272 | |
| | Select Medical Corp. (1 mo. USD Term SOFR + 3.000%) | |
| | | | | 645,748 | | | | 8.316 | (i) | | 03/06/27 | | | 646,155 | |
| | Surgery Center Holdings, Inc. (1 mo. USD Term SOFR + 3.500%) | |
| | | | | 786,046 | | | | 8.815 | (i) | | 12/19/30 | | | 790,141 | |
| | | |
| | |
| The accompanying notes are an integral part of these financial statements. | | 49 |
GOLDMAN SACHS MULTI-MANAGER NON-CORE FIXED INCOME FUND
|
Schedule of Investments (continued) April 30, 2024 (Unaudited) |
| | | | | | | | | | | | | | | | |
| | | Principal Amount | | | Interest Rate | | | Maturity Date | | Value | |
| |
| | Bank Loans(n) – (continued) | |
| |
| | Health Care Services – (continued) | |
| | Team Health Holdings, Inc. (3 mo. USD Term SOFR + 5.250%) | |
| | $ | | | 2,992,472 | | | | 10.580 | %(i) | | 03/02/27 | | $ | 2,609,316 | |
| | | | | | | | | | | | | | | | |
| | | | | | | | | | | | | | | 13,236,634 | |
| | | |
| |
| | Holding Companies-Diversified(i) – 0.1% | |
| | Belfor Holdings, Inc. (1 mo. USD Term SOFR + 3.750%) | |
| | | | | 713,846 | | | | 9.066 | | | 11/01/30 | | | 715,188 | |
| | | |
| |
| | Home Furnishings(i) – 0.1% | |
| | AI Aqua Merger Sub, Inc. (1 mo. USD Term SOFR + 4.000%) | |
| | | | | 862,206 | | | | 9.324 | | | 07/31/28 | | | 864,707 | |
| | | |
| |
| | Housewares(i) – 0.1% | |
| | Solis IV BV (3 mo. USD Term SOFR + 3.500%) | |
| | | | | 431,556 | | | | 8.824 | | | 02/26/29 | | | 428,013 | |
| | Springs Windows Fashions LLC (1 mo. USD Term SOFR + 4.000%) | |
| | | | | 1,704,785 | | | | 9.430 | | | 10/06/28 | | | 1,439,589 | |
| | | | | | | | | | | | | | | | |
| | | | | | | | | | | | | | | 1,867,602 | |
| | | |
| |
| | Insurance – 2.5% | |
| | Acrisure LLC | |
| | (1 mo. USD LIBOR + 3.500%) | |
| | | | | 6,394,990 | | | | 8.930 | (i) | | 02/15/27 | | | 6,381,816 | |
| | (1 mo. USD Term SOFR + 4.500%) | |
| | | | | 463,837 | | | | 9.816 | (i) | | 11/06/30 | | | 464,709 | |
| | Alliant Holdings Intermediate LLC (1 mo. USD Term SOFR + 3.500%) | |
| | | | | 606,008 | | | | 8.819 | (i) | | 11/06/30 | | | 608,196 | |
| | AmWINS Group, Inc. | |
| | (1 mo. USD Term SOFR + 2.250%) | |
| | | | | 560,000 | | | | 7.680 | (i) | | 02/19/28 | | | 560,420 | |
| | (1 mo. USD Term SOFR + 2.750%) | |
| | | | | 527,330 | | | | 8.180 | (i) | | 02/19/28 | | | 528,190 | |
| | AssuredPartners, Inc. | |
| | (1 mo. USD Term SOFR) | |
| | | | | 8,569,000 | | | | 0.000 | | | 02/14/31 | | | 8,605,161 | |
| | (1 mo. USD Term SOFR + 3.500%) | |
| | | | | 480,702 | | | | 8.942 | (i) | | 02/12/27 | | | 480,601 | |
| | Asurion LLC (1 mo. USD Term SOFR + 5.250%) | |
| | | | | 276,000 | | | | 10.680 | (i) | | 01/20/29 | | | 247,787 | |
| | (1 mo. USD Term SOFR + 3.250%)(i) | |
| | | | | 126,023 | | | | 8.680 | | | 12/23/26 | | | 123,048 | |
| | | | | 373,523 | | | | 8.680 | | | 07/31/27 | | | 362,317 | |
| | Broadstreet Partners, Inc. | |
| | (1 mo. USD Term SOFR + 3.000%) | |
| | | | | 797,922 | | | | 8.430 | (i) | | 01/27/27 | | | 799,063 | |
| | (1 mo. USD Term SOFR + 3.750%) | |
| | | | | 3,020,746 | | | | 9.066 | (i) | | 01/27/29 | | | 3,028,298 | |
| | Cross Financial Corp. (1 mo. USD Term SOFR + 3.500%) | |
| | | | | 354,092 | | | | 8.816 | (i) | | 09/15/27 | | | 353,873 | |
| | Howden Group Holdings Ltd. (1 mo. USD Term SOFR + 4.000%) | |
| | | | | 2,696,976 | | | | 9.316 | (i) | | 04/18/30 | | | 2,706,523 | |
| | | |
| | | | | | | | | | | | | | | | |
| | | Principal Amount | | | Interest Rate | | | Maturity Date | | Value | |
| |
| | Bank Loans(n) – (continued) | |
| |
| | Insurance – (continued) | |
| | HUB International Ltd. (3 mo. USD Term SOFR + 3.250%) | |
| | $ | | | 6,469,528 | | | | 8.565 | – | | | | | | |
| | | | | | | | | 8.575 | (i) | | 06/20/30 | | $ | 6,501,617 | |
| | Hyperion Refinance SARL (1 mo. USD Term SOFR) | |
| | | | | 215,000 | | | | 0.000 | | | 02/15/31 | | | 215,537 | |
| | IMA Financial Group, Inc. (1 mo. USD Term SOFR + 3.750%) | |
| | | | | 1,119,275 | | | | 9.180 | (i) | | 11/01/28 | | | 1,120,204 | |
| | OneDigital Borrower LLC (1 mo. USD Term SOFR + 4.250%) | |
| | | | | 847,832 | | | | 9.666 | (i) | | 11/16/27 | | | 847,306 | |
| | Ryan Specialty Group LLC (1 mo. USD Term SOFR + 2.750%) | |
| | | | | 498,708 | | | | 8.066 | (i) | | 09/01/27 | | | 499,207 | |
| | Sedgwick Claims Management Services, Inc. (1 mo. USD Term SOFR + 3.750%) | |
| | | | | 846,545 | | | | 9.066 | (i) | | 02/24/28 | | | 849,407 | |
| | Truist Insurance Holdings LLC | |
| | | | | 2,088,304 | | | | 0.000 | | | 03/08/32 | | | 2,105,282 | |
| | USI, Inc. (3 mo. USD Term SOFR + 3.250%) | |
| | | | | 498,747 | | | | 8.552 | (i) | | 09/27/30 | | | 499,994 | |
| | | | | | | | | | | | | | | | |
| | | | | | | | | | | | | | | 37,888,556 | |
| | | |
| |
| | Internet(i) – 0.4% | |
| | CNT Holdings I Corp. (3 mo. USD Term SOFR + 3.500%) | |
| | | | | 3,368,401 | | | | 8.830 | | | 11/08/27 | | | 3,377,293 | |
| | MH Sub I LLC (1 mo. USD Term SOFR + 4.250%) | |
| | | | | 382,779 | | | | 9.566 | | | 05/03/28 | | | 381,214 | |
| | Polaris Purchaser, Inc. (3 mo. USD Term SOFR + 4.500%)(k) | |
| | | | | 500,000 | | | | 9.841 | | | 03/03/31 | | | 502,500 | |
| | Proofpoint, Inc. (1 mo. USD Term SOFR + 3.250%) | |
| | | | | 437,632 | | | | 8.680 | | | 08/31/28 | | | 439,409 | |
| | PUG LLC (1 mo. USD Term SOFR + 0.000%) | |
| | | | | 1,000,000 | | | | 10.066 | | | 03/15/30 | | | 999,060 | |
| | | | | | | | | | | | | | | | |
| | | | | | | | | | | | | | | 5,699,476 | |
| | | |
| |
| | Investment Companies – 0.1% | |
| | BEP Intermediate Holdco LLC | |
| | | | | 329,000 | | | | 0.000 | | | 04/11/31 | | | 330,645 | |
| | Wec U.S. Holdings Ltd. (1 mo. USD Term SOFR + 2.750%) | |
| | | | | 798,715 | | | | 8.066 | (i) | | 01/27/31 | | | 799,050 | |
| | | | | | | | | | | | | | | | |
| | | | | | | | | | | | | | | 1,129,695 | |
| | | |
| |
| | Leisure Time(i) – 0.8% | |
| | Alterra Mountain Co. (1 mo. USD Term SOFR + 3.500%) | |
| | | | | 3,715,716 | | | | 8.827 | | | 05/31/30 | | | 3,734,294 | |
| | | | | 130,000 | | | | 9.180 | | | 05/31/30 | | | 130,650 | |
| | (1 yr. USD Term SOFR + 3.250%) | |
| | | | | 364,991 | | | | 8.577 | | | 08/17/28 | | | 366,206 | |
| | ClubCorp Holdings, Inc. (3 mo. USD Term SOFR + 5.000%) | |
| | | | | 4,800,261 | | | | 10.564 | | | 09/18/26 | | | 4,803,862 | |
| | Fitness International LLC (1 mo. USD Term SOFR + 5.250%) – (3 mo. USD Term SOFR + 5.250%) | |
| | | | | 220,000 | | | | 10.666 | – | | | | | | |
| | | | | | | | | 10.679 | | | 02/05/29 | | | 216,700 | |
| | Life Time Fitness, Inc. (3 mo. USD Term SOFR + 4.000%) | |
| | | | | 357,868 | | | | 9.591 | | | 01/15/26 | | | 359,210 | |
| | | |
| | |
| 50 | | The accompanying notes are an integral part of these financial statements. |
GOLDMAN SACHS MULTI-MANAGER NON-CORE FIXED INCOME FUND
| | | | | | | | | | | | | | | | |
| | | Principal Amount | | | Interest Rate | | | Maturity Date | | Value | |
| |
| | Bank Loans(n) – (continued) | |
| |
| | Leisure Time(i) – (continued) | |
| | MajorDrive Holdings IV LLC (1 mo. USD Term SOFR) | |
| | $ | | | 997,436 | | | | 4.500 | % | | 06/01/28 | | $ | 1,001,176 | |
| | Recess Holdings, Inc. (3 mo. USD Term SOFR + 4.500%) | |
| | | | | 750,000 | | | | 9.843 | | | 02/20/30 | | | 751,875 | |
| | | | | | | | | | | | | | | | |
| | | | | | | | | | | | | | | 11,363,973 | |
| | | |
| |
| | Lodging(i) – 0.2% | |
| | Awaze Ltd. (3 mo. EUR EURIBOR + 5.000%) | |
| | EUR | | | 472,973 | | | | 8.928 | | | 05/09/28 | | | 500,552 | |
| | Fertitta Entertainment LLC (1 mo. USD Term SOFR + 3.750%) | |
| | $ | | | 1,045,547 | | | | 9.069 | | | 01/27/29 | | | 1,047,419 | |
| | Four Seasons Hotels Ltd. (3 mo. USD Term SOFR + 2.000%) | |
| | | | | 323,363 | | | | 7.316 | | | 11/30/29 | | | 323,631 | |
| | Station Casinos LLC (1 mo. USD Term SOFR + 2.250%) | |
| | | | | 1,295,000 | | | | 7.566 | | | 03/14/31 | | | 1,294,417 | |
| | | | | | | | | | | | | | | | |
| | | | | | | | | | | | | | | 3,166,019 | |
| | | |
| |
| | Machinery-Diversified – 1.6% | |
| | ASP Blade Holdings, Inc. (3 mo. USD Term SOFR + 4.000%) | |
| | | | | 1,596,963 | | | | 9.564 | (i) | | 10/13/28 | | | 1,385,366 | |
| | CD&R Hydra Buyer, Inc. (3 mo. USD Term SOFR + 4.000%) | |
| | | | | 2,500,000 | | | | 9.420 | (i) | | 03/25/31 | | | 2,520,825 | |
| | Chart Industries, Inc. (1 mo. USD Term SOFR + 3.250%) | |
| | | | | 1,083,379 | | | | 8.673 | (i) | | 03/15/30 | | | 1,086,088 | |
| | Eagle Parent Corp. (3 mo.USD Term SOFR + 4.250%) | |
| | | | | 159,593 | | | | 9.552 | (i) | | 04/02/29 | | | 156,567 | |
| | Engineered Machinery Holdings, Inc. | |
| | (3 mo.USD Term SOFR + 3.750%) | |
| | | | | 623,406 | | | | 9.321 | (i) | | 05/19/28 | | | 623,144 | |
| | (3 mo. USD Term SOFR + 6.500%) | |
| | | | | 500,000 | | | | 12.071 | (i) | | 05/21/29 | | | 497,190 | |
| | INNIO Group Holding GmbH (3 mo. USD Term SOFR + 4.250%) | |
| | | | | 300,156 | | | | 9.575 | – | | | | | | |
| | | | | | | | | 9.578 | (i) | | 11/02/28 | | | 301,846 | |
| | Pro Mach Group, Inc. (1 mo. USD Term SOFR + 3.750%) | |
| | | | | 1,750,000 | | | | 9.066 | (i) | | 08/31/28 | | | 1,756,387 | |
| | Project Castle, Inc. (3 mo. USD Term SOFR + 5.500%) | |
| | | | | 721,716 | | | | 10.798 | – | | | | | | |
| | | | | | | | | 10.809 | (i) | | 06/01/29 | | | 653,608 | |
| | SPX Flow, Inc. (1 mo. USD Term SOFR + 4.500%) | |
| | | | | 2,426,783 | | | | 9.916 | (i) | | 04/05/29 | | | 2,439,038 | |
| | Star U.S. Bidco LLC (1 mo. USD Term SOFR + 4.250%) | |
| | | | | 2,252,134 | | | | 9.666 | (i) | | 03/17/27 | | | 2,263,395 | |
| | Titan Acquisition Ltd. | |
| | | | | 6,748,674 | | | | 0.000 | | | 02/01/29 | | | 6,781,000 | |
| | TK Elevator U.S. Newco, Inc. (3 mo. USD Term SOFR + 3.500%) | |
| | | | | 3,046,964 | | | | 8.791 | (i) | | 04/30/30 | | | 3,058,451 | |
| | Victory Buyer LLC (3 mo.USD Term SOFR + 3.750%) | |
| | | | | 759,595 | | | | 9.342 | (i) | | 11/19/28 | | | 717,817 | |
| | | | | | | | | | | | | | | | |
| | | | | | | | | | | | | | | 24,240,722 | |
| | | |
| | | | | | | | | | | | | | | | |
| | | Principal Amount | | | Interest Rate | | | Maturity Date | | Value | |
| |
| | Bank Loans(n) – (continued) | |
| |
| | Media – 0.3% | |
| | Diamond Sports Group LLC (1 mo. USD Term SOFR + 5.000%) | |
| | $ | | | 161,247 | | | | 5.000 | %(i) | | 12/02/24 | | $ | 255,846 | |
| | NEP Group, Inc. | |
| | (1 mo. USD Term SOFR) | |
| | | | | 51,290 | | | | 0.000 | | | 08/19/26 | | | 47,956 | |
| | (1 mo. USD Term SOFR + 1.500%) | |
| | | | | 1,910,760 | | | | 8.566 | (i) | | 08/19/26 | | | 1,797,070 | |
| | Simon & Schuster, Inc. (3 mo. USD Term SOFR + 4.000%) | |
| | | | | 825,000 | | | | 9.330 | (i) | | 10/30/30 | | | 827,888 | |
| | United Talent Agency LLC | |
| | | | | 500,000 | | | | 0.000 | (o) | | | | | 500,000 | |
| | (1 mo. USD Term SOFR + 4.000%) | |
| | | | | 477,551 | | | | 9.430 | (i) | | 07/07/28 | | | 477,350 | |
| | Virgin Media Bristol LLC (6 mo. USD Term SOFR + 3.250%) | |
| | | | | 775,000 | | | | 8.656 | (i) | | 03/31/31 | | | 760,577 | |
| | WideOpenWest Finance LLC (3 mo. USD Term SOFR + 3.000%) | |
| | | | | 339,133 | | | | 8.302 | (i) | | 12/20/28 | | | 293,563 | |
| | | | | | | | | | | | | | | | |
| | | | | | | | | | | | | | | 4,960,250 | |
| | | |
| |
| | Metal Fabricate & Hardware(i) – 0.2% | |
| | Crosby U.S. Acquisition Corp. (1 mo. USD Term SOFR + 4.000%) | |
| | | | | 2,992,500 | | | | 9.316 | | | 08/16/29 | | | 3,009,946 | |
| | | |
| |
| | Mining(i) – 0.0% | |
| | Dominion Diamond (k) | |
| | | | | 467,153 | | | | 10.000 | | | 06/30/26 | | | 467,153 | |
| | | |
| |
| | Miscellaneous Manufacturing – 0.1% | |
| | Gates Global LLC (1 mo. USD Term SOFR + 2.500%) | |
| | | | | 218,636 | | | | 7.916 | (i) | | 03/31/27 | | | 219,143 | |
| | LTI Holdings, Inc. | |
| | (1 mo. USD Term SOFR + 3.500%) | |
| | | | | 277,663 | | | | 8.930 | (i) | | 09/06/25 | | | 274,409 | |
| | (1 mo. USD Term SOFR + 4.750%) | |
| | | | | 248,052 | | | | 10.180 | (i) | | 07/24/26 | | | 245,056 | |
| | Rohm Holding GmbH (6 mo. USD Term SOFR) | |
| | | | | 585,971 | | | | 5.000 | | | 07/31/26 | | | 549,348 | |
| | Touchdown Acquirer, Inc. | |
| | (3 mo. USD Term SOFR + 4.000%) | |
| | | | | 586,557 | | | | 9.314 | (i) | | 02/21/31 | | | 588,575 | |
| | | | | 55,689 | | | | 0.000 | (i) | | 02/21/31 | | | 55,764 | |
| | | | | | | | | | | | | | | | |
| | | | | | | | | | | | | | | 1,932,295 | |
| | | |
| |
| | Oil & Gas(i) – 0.1% | |
| | Gulf Finance LLC (1 mo. USD Term SOFR + 6.750%) | |
| | | | | 1,221,059 | | | | 12.180 | – | | | | | | |
| | | | | | | | | 12.182 | | | 08/25/26 | | | 1,221,718 | |
| | | |
| |
| | Packaging – 1.2% | |
| | Anchor Packaging LLC (1 mo. USD Term SOFR + 3.500%) | |
| | | | | 400,000 | | | | 8.916 | (i) | | 07/18/26 | | | 399,600 | |
| | Brook and Whittle Holding Corp. (3 mo. USD Term SOFR + 4.000%) | |
| | | | | 681,897 | | | | 9.493 | (i) | | 12/14/28 | | | 638,140 | |
| | | |
| | |
| The accompanying notes are an integral part of these financial statements. | | 51 |
GOLDMAN SACHS MULTI-MANAGER NON-CORE FIXED INCOME FUND
|
Schedule of Investments (continued) April 30, 2024 (Unaudited) |
| | | | | | | | | | | | | | | | |
| | | Principal Amount | | | Interest Rate | | | Maturity Date | | Value | |
| |
| | Bank Loans(n) – (continued) | |
| |
| | Packaging – (continued) | |
| | Charter NEX U.S., Inc. (1 mo. USD Term SOFR + 3.500%) | |
| | $ | | | 2,451,384 | | | | 8.816 | %(i) | | 12/01/27 | | $ | 2,459,890 | |
| | Kloeckner Pentaplast of America, Inc. (6 mo. USD Term SOFR + 4.725%) | |
| | | | | 292,127 | | | | 10.268 | (i) | | 02/12/26 | | | 261,942 | |
| | LABL, Inc. (1 mo. USD Term SOFR + 5.000%) | |
| | | | | 3,533,792 | | | | 10.416 | (i) | | 10/29/28 | | | 3,455,166 | |
| | LC Ahab U.S. Bidco LLC | |
| | | | | 344,474 | | | | 0.000 | | | 04/11/31 | | | 343,613 | |
| | Pregis TopCo Corp. | |
| | (1 mo. USD Term SOFR + 3.750%) | |
| | | | | 3,068,609 | | | | 9.066 | (i) | | 07/31/26 | | | 3,075,789 | |
| | (1 mo. USD Term SOFR) | |
| | | | | 249,361 | | | | 4.250 | | | 07/31/26 | | | 249,518 | |
| | Pretium Packaging LLC | |
| | (3 mo. USD Term SOFR + 5.000%) | |
| | | | | 1,304,299 | | | | 10.327 | (i) | | 10/02/28 | | | 1,319,207 | |
| | (3 mo. USD Term SOFR + 4.600%) | |
| | | | | 2,428,041 | | | | 9.906 | (i) | | 10/02/28 | | | 2,139,111 | |
| | Proampac PG Borrower LLC (1 mo. USD Term SOFR + 4.000%) – (3 mo. USD Term SOFR + 4.000%) | |
| | | | | 2,749,250 | | | | 9.321 | – | | | | | | |
| | | | | | | | | 9.329 | (i) | | 09/15/28 | | | 2,765,278 | |
| | Trident TPI Holdings, Inc. (3 mo. USD Term SOFR + 4.000%)(i) | |
| | | | | 508,321 | | | | 9.302 | | | 09/15/28 | | | 508,849 | |
| | | | | 99,496 | | | | 9.571 | | | 09/15/28 | | | 99,550 | |
| | (3 mo. USD Term SOFR + 5.250%) | |
| | | | | 994,962 | | | | 10.559 | (i) | | 09/15/28 | | | 996,415 | |
| | | | | | | | | | | | | | | | |
| | | | | | | | | | | | | | | 18,712,068 | |
| | | |
| |
| | Pharmaceuticals(i) – 0.7% | |
| | Curium BidCo SARL (3 mo. USD Term SOFR + 4.500%)(k) | |
| | | | | 1,000,000 | | | | 9.788 | – | | | | | | |
| | | | | | | | | 9.917 | | | 07/31/29 | | | 1,007,500 | |
| | Gainwell Acquisition Corp. | |
| | (3 mo. USD Term SOFR + 8.000%) | |
| | | | | 750,000 | | | | 13.402 | | | 10/02/28 | | | 701,250 | |
| | (3 mo. USD Term SOFR + 4.000%) | |
| | | | | 2,843,825 | | | | 9.409 | | | 10/01/27 | | | 2,707,862 | |
| | Grifols Worldwide Operations USA, Inc. (3 mo. USD Term SOFR + 2.000%) | |
| | | | | 645,384 | | | | 7.459 | | | 11/15/27 | | | 630,624 | |
| | Lannett Co., Inc. (3 mo.USD LIBOR + 2.000%)(k) | |
| | | | | 397,572 | | | | 2.000 | | | 06/16/30 | | | 397,572 | |
| | Midwest Veterinary Partners LLC (1 mo. USD Term SOFR + 4.000%) | |
| | | | | 621,316 | | | | 9.430 | | | 04/27/28 | | | 620,695 | |
| | Packaging Coordinators Midco, Inc. (3 mo. USD Term SOFR + 3.500%) | |
| | | | | 641,444 | | | | 9.071 | | | 11/30/27 | | | 643,246 | |
| | Pathway Vet Alliance LLC (1 mo. USD Term SOFR + 3.750%) | |
| | | | | 1,535,761 | | | | 9.180 | | | 03/31/27 | | | 1,282,913 | |
| | Sharp Services LLC (3 mo.USD Term SOFR + 3.750%) | |
| | | | | 973,155 | | | | 9.052 | (k) | | 12/31/28 | | | 975,588 | |
| | | |
| | | | | | | | | | | | | | | | |
| | | Principal Amount | | | Interest Rate | | | Maturity Date | | Value | |
| |
| | Bank Loans(n) – (continued) | |
| |
| | Pharmaceuticals(i) – (continued) | |
| | Southern Veterinary Partners LLC (1 mo. USD Term SOFR + 4.000%) | |
| | $ | | | 2,316,630 | | | | 9.430 | % | | 10/05/27 | | $ | 2,317,348 | |
| | | | | | | | | | | | | | | | |
| | | | | | | | | | | | | | | 11,284,598 | |
| | | |
| |
| | Pipelines – 0.6% | |
| | Brazos Delaware II LLC | |
| | | | | 792,859 | | | | 0.000 | | | 02/11/30 | | | 793,628 | |
| | CQP Holdco LP (3 mo. USD Term SOFR + 3.000%) | |
| | | | | 413,963 | | | | 8.302 | (i) | | 12/31/30 | | | 415,039 | |
| | Freeport LNG Investments LLLP (3 mo. USD Term SOFR + 3.000%) | |
| | | | | 1,110,331 | | | | 8.586 | (i) | | 11/17/26 | | | 1,100,149 | |
| | GIP Pilot Acquisition Partners LP (3 mo. USD Term SOFR + 3.000%) | |
| | | | | 1,496,250 | | | | 8.308 | (i) | | 10/04/30 | | | 1,501,487 | |
| | ITT Holdings LLC (1 mo. USD Term SOFR + 3.000%) | |
| | | | | 348,250 | | | | 8.421 | (i) | | 10/11/30 | | | 348,250 | |
| | M6 ETX Holdings II Midco LLC (1 mo. USD Term SOFR) | |
| | $ | | | 511,745 | | | | 0.000 | | | 09/19/29 | | | 512,068 | |
| | Medallion Midland Acquisition LP (3 mo. USD Term SOFR + 3.500%) | |
| | | | | 498,750 | | | | 8.830 | (i) | | 10/18/28 | | | 500,466 | |
| | Prairie ECI Acquiror LP (1 mo. USD Term SOFR + 4.750%) | |
| | | | | 807,382 | | | | 10.066 | (i) | | 08/01/29 | | | 807,584 | |
| | TransMontaigne Operating Co. LP (1 mo. USD Term SOFR + 3.500%) | |
| | | | | 440,000 | | | | 8.930 | (i) | | 11/17/28 | | | 440,158 | |
| | Traverse Midstream Partners LLC (3 mo. USD Term SOFR + 3.500%) | |
| | | | | 2,008,050 | | | | 8.830 | (i) | | 02/16/28 | | | 2,009,938 | |
| | | | | | | | | | | | | | | | |
| | | | | | | | | | | | | | | 8,428,767 | |
| | | |
| |
| | Real Estate(i) – 0.0% | |
| | Cushman & Wakefield U.S. Borrower LLC (1 mo. USD Term SOFR + 2.750%) | |
| | | | | 39,711 | | | | 8.180 | | | 08/21/25 | | | 39,632 | |
| | Forest City Enterprises LP (1 mo. USD Term SOFR + 3.500%) | |
| | | | | 624,681 | | | | 8.930 | | | 12/08/25 | | | 596,482 | |
| | | | | | | | | | | | | | | | |
| | | | | | | | | | | | | | | 636,114 | |
| | | |
| |
| | Retailing – 0.7% | |
| | 1011778 B.C. Unlimited Liability Co. | |
| | | | | 470,000 | | | | 0.000 | | | 09/20/30 | | | 470,334 | |
| | (1 mo. USD Term SOFR + 2.250%) | |
| | | | | 103,966 | | | | 7.566 | (i) | | 09/20/30 | | | 104,040 | |
| | EG Finco Ltd. (3 mo. EUR EURIBOR + 5.500%) | |
| | EUR | | | 461 | | | | 9.402 | (i) | | 02/07/28 | | | 491 | |
| | IRB Holding Corp. (1 mo. USD Term SOFR + 2.750%) | |
| | $ | | | 816,375 | | | | 8.166 | (i) | | 12/15/27 | | | 817,313 | |
| | Kodiak Building Partners, Inc. (3 mo.USD Term SOFR + 3.750%) | |
| | | | | 500,000 | | | | 9.059 | (i) | | 03/17/28 | | | 501,565 | |
| | LBM Acquisition LLC (1 mo. USD Term SOFR + 3.750%) | |
| | | | | 537,531 | | | | 9.166 | (i) | | 12/17/27 | | | 537,757 | |
| | | |
| | |
| 52 | | The accompanying notes are an integral part of these financial statements. |
GOLDMAN SACHS MULTI-MANAGER NON-CORE FIXED INCOME FUND
| | | | | | | | | | | | | | | | |
| | | Principal Amount | | | Interest Rate | | | Maturity Date | | Value | |
| |
| | Bank Loans(n) – (continued) | |
| |
| | Retailing – (continued) | |
| | Les Schwab Tire Centers (3 mo. USD Term SOFR + 3.000%) | |
| | $ | | | 957,172 | | | | 8.317 | %(i) | | 04/23/31 | | $ | 958,665 | |
| | Specialty Building Products Holdings LLC (1 mo. USD Term SOFR + 3.750%) | |
| | | | | 646,700 | | | | 9.166 | (i) | | 10/15/28 | | | 646,545 | |
| | SRS Distribution, Inc. | |
| | (1 mo. USD Term SOFR + 3.250%) | |
| | | | | 1,501,501 | | | | 8.666 | (i) | | 06/02/28 | | | 1,510,855 | |
| | (1 mo. USD Term SOFR + 3.500%) | |
| | | | | 2,257,059 | | | | 8.930 | (i) | | 06/02/28 | | | 2,272,971 | |
| | Whatabrands LLC (1 mo. USD Term SOFR + 3.250%) | |
| | | | | 2,216,918 | | | | 8.680 | (i) | | 08/03/28 | | | 2,224,301 | |
| | | | | | | | | | | | | | | | |
| | | | | | | | | | | | | | | 10,044,837 | |
| | | |
| |
| | Semiconductors – 0.0% | |
| | Ultra Clean Holdings, Inc | |
| | | | | 568,814 | | | | 0.000 | | | 02/28/28 | | | 569,525 | |
| | | |
| |
| | Software – 3.3% | |
| | Applied Systems, Inc. | |
| | (3 mo. USD Term SOFR + 3.500%) | |
| | | | | 3,587,205 | | | | 8.809 | (i) | | 02/24/31 | | | 3,611,418 | |
| | (3 mo. USD Term SOFR + 5.250%) | |
| | | | | 3,975,000 | | | | 10.559 | (i) | | 02/23/32 | | | 4,102,518 | |
| | AppLovin Corp. (1 mo. USD Term SOFR + 2.500%) | |
| | | | | 365,000 | | | | 7.816 | (i) | | 08/16/30 | | | 364,697 | |
| | Avaya, Inc. (1 mo. USD Term SOFR + 1.500%) | |
| | | | | 1,584,872 | | | | 6.818 | (i) | | 08/01/28 | | | 1,367,618 | |
| | Banff Merger Sub, Inc. (1 mo. USD Term SOFR + 4.250%) | |
| | | | | 1,083,642 | | | | 9.566 | (i) | | 12/29/28 | | | 1,089,689 | |
| | Bracket Intermediate Holding Corp. (3 mo. USD Term SOFR + 5.000%) | |
| | | | | 880,915 | | | | 10.402 | (i) | | 05/08/28 | | | 883,117 | |
| | CCC Intelligent Solutions, Inc. (1 mo. USD Term SOFR + 2.250%) | |
| | | | | 776,665 | | | | 7.680 | (i) | | 09/21/28 | | | 775,974 | |
| | Cloud Software Group, Inc. (2 mo. USD Term SOFR + 4.500%) – (3 mo. USD Term SOFR + 4.500%) | |
| | | | | 782,134 | | | | 9.909 | (i) | | 03/30/29 | | | 781,805 | |
| | Cotiviti Corp. | |
| | | | | 1,125,000 | | | | 0.000 | | | 02/21/31 | | | 1,114,684 | |
| | Dun & Bradstreet Corp. | |
| | | | | 1,375,000 | | | | 8.068 | (i) | | 01/18/29 | | | 1,377,104 | |
| | Epicor Software Corp. | |
| | (1 mo. USD Term SOFR + 3.250%) | |
| | | | | 903,326 | | | | 8.680 | (i) | | 07/30/27 | | | 906,550 | |
| | (1 mo. USD Term SOFR + 3.750%) | |
| | | | | 1,992,500 | | | | 9.066 | (i) | | 07/30/27 | | | 2,002,223 | |
| | Flexera Software LLC (1 mo. USD Term SOFR + 3.750%) | |
| | | | | 462,591 | | | | 9.180 | (i) | | 03/03/28 | | | 463,553 | |
| | Genesys Cloud Services Holdings II LLC (1 mo. USD Term SOFR + 3.500%) | |
| | | | | 997,018 | | | | 8.816 | (i) | | 12/01/27 | | | 1,000,398 | |
| | Idera, Inc. (3 mo.USD Term SOFR + 6.750%) | |
| | | | | 550,000 | | | | 12.206 | (i) | | 03/02/29 | | | 530,750 | |
| | | |
| | | | | | | | | | | | | | | | |
| | | Principal Amount | | | Interest Rate | | | Maturity Date | | Value | |
| |
| | Bank Loans(n) – (continued) | |
| |
| | Software – (continued) | |
| | Instructure Holdings, Inc. (3 mo.USD Term SOFR + 2.750%) | |
| | $ | | | 577,056 | | | | 8.355 | %(i) | | 10/30/28 | | $ | 579,220 | |
| | Iron Mountain, Inc. (1 mo. USD Term SOFR + 2.250%) | |
| | | | | 498,750 | | | | 7.566 | (i) | | 01/31/31 | | | 496,880 | |
| | iSolved, Inc. (3 mo. USD Term SOFR + 3.500%) | |
| | | | | 833,787 | | | | 8.819 | (i) | | 10/14/30 | | | 835,105 | |
| | Marcel LUX IV SARL | |
| | | | | 99,750 | | | | 0.000 | (o) | | | | | 100,249 | |
| | (1 mo. USD Term SOFR + 4.500%) | |
| | $ | | | 523,687 | | | | 9.810 | (i) | | 11/11/30 | | | 525,871 | |
| | Mavenir Systems, Inc. (3 mo.USD Term SOFR + 4.750%) | |
| | | | | 736,685 | | | | 10.335 | (i) | | 08/18/28 | | | 547,387 | |
| | Modena Buyer LLC | |
| | | | | 60,000 | | | | 0.000 | | | 04/18/31 | | | 58,688 | |
| | Mosel Bidco SE (3 mo.USD Term SOFR + 4.750%) | |
| | | | | 820,000 | | | | 10.059 | (i) | | 09/16/30 | | | 823,075 | |
| | Motus LLC (3 mo.USD Term SOFR + 3.750%) | |
| | | | | 448,855 | | | | 9.159 | (i) | | 12/11/28 | | | 449,699 | |
| | Open Text Corp. (1 mo. USD Term SOFR + 2.750%) | |
| | | | | 590,174 | | | | 8.166 | (i) | | 01/31/30 | | | 591,495 | |
| | PointClickCare Technologies, Inc. | |
| | | | | 892,470 | | | | 0.000 | (k) | | 12/29/27 | | | 896,933 | |
| | Polaris Newco LLC | |
| | (3 mo. USD Term SOFR + 9.000%) | |
| | | | | 2,800,000 | | | | 14.443 | (i) | | 06/04/29 | | | 2,782,500 | |
| | (3 mo. USD Term SOFR + 4.000%) | |
| | | | | 623,593 | | | | 9.591 | (i) | | 06/02/28 | | | 619,359 | |
| | Project Boost Purchaser LLC (1 mo. USD Term SOFR + 3.500%) – (3 mo. USD Term SOFR + 3.500%) | |
| | | | | 1,000,000 | | | | 8.930 | – | | | | | | |
| | | | | | | | | 9.071 | (i) | | 05/30/26 | | | 1,001,670 | |
| | (1 mo. USD Term SOFR + 3.500%) | |
| | | | | 1,810,755 | | | | 8.930 | (i) | | 06/01/26 | | | 1,813,870 | |
| | Project Ruby Ultimate Parent Corp. (1 mo. USD Term SOFR + 3.500%) | |
| | | | | 500,000 | | | | 8.930 | (i) | | 03/10/28 | | | 500,415 | |
| | Quartz Acquireco LLC (3 mo. USD Term SOFR + 3.500%) | |
| | | | | 736,948 | | | | 8.809 | (i) | | 06/28/30 | | | 740,176 | |
| | Quest Software U.S. Holdings, Inc. (3 mo.USD Term SOFR + 4.250%) | |
| | | | | 1,154,240 | | | | 9.730 | (i) | | 02/01/29 | | | 807,610 | |
| | Quickbase, Inc. (3 mo. USD Term SOFR + 4.000%) | |
| | | | | 383,992 | | | | 9.302 | (i) | | 10/02/28 | | | 383,524 | |
| | RealPage, Inc. (1 mo. USD Term SOFR + 6.500%) | |
| | | | | 495,000 | | | | 11.930 | (i) | | 04/23/29 | | | 485,951 | |
| | Severin Acquisition LLC (3 mo. USD Term SOFR + 3.000%) | |
| | | | | 382,621 | | | | 8.330 | (i) | | 08/01/27 | | | 383,440 | |
| | Sophia LP | |
| | (1 mo. USD Term SOFR + 8.000%) | |
| | | | | 1,416,667 | | | | 13.416 | (i) | | 10/09/28 | | | 1,418,437 | |
| | (1 mo. USD Term SOFR + 3.500%) | |
| | | | | 1,577,886 | | | | 8.916 | (i) | | 10/09/29 | | | 1,582,114 | |
| | UKG, Inc. (3 mo. USD Term SOFR + 3.500%) | |
| | | | | 9,382,733 | | | | 8.814 | (i) | | 02/10/31 | | | 9,423,360 | |
| | | |
| | |
| The accompanying notes are an integral part of these financial statements. | | 53 |
GOLDMAN SACHS MULTI-MANAGER NON-CORE FIXED INCOME FUND
|
Schedule of Investments (continued) April 30, 2024 (Unaudited) |
| | | | | | | | | | | | | | | | |
| | | Principal Amount | | | Interest Rate | | | Maturity Date | | Value | |
| |
| | Bank Loans(n) – (continued) | |
| |
| | Software – (continued) | |
| | Waystar Technologies, Inc. (1 mo. USD Term SOFR + 4.000%) | |
| | $ | | | 450,783 | | | | 9.316 | %(i) | | 10/22/29 | | $ | 453,037 | |
| | Zelis Payments Buyer, Inc. (1 mo. USD Term SOFR + 2.750%) | |
| | | | | 1,301,000 | | | | 8.066 | (i) | | 09/28/29 | | | 1,302,158 | |
| | | | | | | | | | | | | | | | |
| | | | | | | | | | | | | | | 49,974,321 | |
| | | |
| |
| | Telecommunications – 0.4% | |
| | Altice France SA | |
| | (3 mo. USD LIBOR + 3.687%) | |
| | | | | 231,329 | | | | 9.278 | (i) | | 01/31/26 | | | 197,272 | |
| | (3 mo. USD LIBOR + 4.000%) | |
| | | | | 212,725 | | | | 9.569 | (i) | | 08/14/26 | | | 178,217 | |
| | (3 mo. USD Term SOFR + 5.500%) | |
| | | | | 343,208 | | | | 10.829 | (i) | | 08/15/28 | | | 256,441 | |
| | Crown Subsea Communications Holding, Inc. (3 mo.USD Term SOFR + 4.750%) | |
| | | | | 500,000 | | | | 10.080 | (i) | | 01/30/31 | | | 503,125 | |
| | Delta TopCo, Inc. | |
| | (3 mo. USD LIBOR + 7.250%) | |
| | | | | 460,000 | | | | 12.212 | (i) | | 12/01/28 | | | 460,000 | |
| | $ | | | 231,000 | | | | 0.000 | | | 12/24/30 | | | 232,732 | |
| | (6 mo. USD Term SOFR + 3.750%) | |
| | | | | 460,894 | | | | 9.121 | (i) | | 12/01/27 | | | 460,894 | |
| | Ensono LP (1 mo. USD Term SOFR + 4.000%) | |
| | | | | 926,222 | | | | 9.430 | (i) | | 05/26/28 | | | 911,866 | |
| | EOS Finco SARL (3 mo. USD Term SOFR + 6.000%) | |
| | | | | 283,957 | | | | 11.309 | (i) | | 10/08/29 | | | 200,900 | |
| | Iridium Satellite LLC (1 mo. USD Term SOFR + 2.500%) | |
| | | | | 748,125 | | | | 7.816 | (i) | | 09/20/30 | | | 748,357 | |
| | Level 3 Financing, Inc. (1 mo. USD Term SOFR + 6.560%)(i) | |
| | | | | 229,159 | | | | 11.875 | | | 04/15/29 | | | 224,863 | |
| | | | | 230,841 | | | | 11.875 | | | 04/15/30 | | | 225,744 | |
| | Lumen Technologies, Inc. | |
| | (1 mo. USD Term SOFR + 2.350%) | |
| | | | | 57,497 | | | | 7.780 | (i) | | 04/15/30 | | | 40,152 | |
| | (3 mo. USD Term SOFR + 2.350%) | |
| | | | | 56,236 | | | | 7.780 | (i) | | 04/15/29 | | | 40,377 | |
| | Numericable Group SA (3 mo. USD LIBOR + 2.750%) | |
| | | | | 56,998 | | | | 8.341 | (i) | | 07/31/25 | | | 50,765 | |
| | Nuuday AS (1 mo. EUR EURIBOR + 6.500%) | |
| | EUR | | | 400,000 | | | | 10.352 | (i) | | 02/03/28 | | | 427,324 | |
| | Zayo Group Holdings, Inc. (1 mo. USD Term SOFR + 3.000%) | |
| | $ | | | 985,000 | | | | 8.317 | (i) | | 03/09/27 | | | 850,025 | |
| | | | | | | | | | | | | | | | |
| | | | | | | | | | | | | | | 6,009,054 | |
| | | |
| |
| | Transportation(i) – 0.2% | |
| | ASP LS Acquisition Corp. (3 mo.USD Term SOFR + 7.000%) | |
| | | | | 249,375 | | | | 12.571 | (k) | | 09/29/27 | | | 250,622 | |
| | Genesee & Wyoming, Inc. (New) (2 mo. USD Term SOFR + 6.000%) | |
| | | | | 275,000 | | | | 7.301 | | | 04/10/31 | | | 275,016 | |
| | Kenan Advantage Group, Inc. (1 mo. USD Term SOFR + 3.750%) | |
| | | | | 994,319 | | | | 9.066 | | | 01/25/29 | | | 992,192 | |
| | | |
| | | | | | | | | | | | | | | | |
| | | Principal Amount | | | Interest Rate | | | Maturity Date | | Value | |
| |
| | Bank Loans(n) – (continued) | |
| |
| | Transportation(i) – (continued) | |
| | LaserShip, Inc. (3 mo. USD Term SOFR + 4.500%) | |
| | $ | | | 1,897,248 | | | | 10.071 | % | | 05/07/28 | | $ | 1,773,927 | |
| | | | | | | | | | | | | | | | |
| | | | | | | | | | | | | | | 3,291,757 | |
| | | |
| | |
| | TOTAL BANK LOANS (Cost $350,501,180) | | $ | 349,355,304 | |
| | | |
| | | | | | | | | | | | | | | | |
| | | | | | | | | | | | | | |
| | | Shares | | | Description | | | | Value | |
| |
| | Common Stocks – 0.3% | |
| |
| | Broadline Retail(f)(k) – 0.0% | |
| | | | | 68 | | | Belk, Inc. | | | | $ | 612 | |
| | | |
| |
| | Chemicals(f)(k) – 0.1% | |
| | | | | 80,232 | | | Crnrch Dummy Eqt | | | | | 1,515,582 | |
| | | |
| |
| | Commerical Services & Supplies(f)(k) – 0.0% | |
| | | | | 1,565 | | | Monitronics | | | | | — | |
| | | |
| |
| | Diversified Consumer Services(f) – 0.0% | |
| | | | | 7,679 | | | Premier Brands Group
Holding | | | | | 9,599 | |
| | | |
| |
| | Energy Equipment & Services(f) – 0.0% | |
| | | | | 17,933 | | | Parker Drilling Co. | | | | | 192,780 | |
| | | |
| |
| | Entertainment(f) – 0.1% | |
| | | | | 28,924 | | | Cineworld Group PLC | | | | | 547,387 | |
| | | |
| |
| | Financial Services(f)(k) – 0.0% | |
| | | | | 240 | | | Voyager Aviation
Holdings LLC | | | | | — | |
| | | |
| |
| | Health Care Equipment & Supplies(f) – 0.0% | |
| | | | | 47,389 | | | Envision Parent, Inc. | | | | | 308,028 | |
| | | |
| |
| | Health Care Providers & Services(f) – 0.0% | |
| | | | | 3,315 | | | Air Methods Corp.(k) | | | | | 74,587 | |
| | | | | 802 | | | Air Methods Corp. | | | | | — | |
| | | | | | | | | | | | | | |
| | | | | | | | | | | | | 74,587 | |
| | | |
| |
| | Metals & Mining(f) – 0.0% | |
| | | | | 627 | | | Arctic Canadian
Diamond Co. Ltd.(k) | | | | | 124,853 | |
| | | | | 1,239,530 | | | Burgundy Diamond
Mines Ltd.(l) | | | | | 152,564 | |
| | | | | 1,229,764 | | | Tacora Resources, Inc.(k) | | | | | — | |
| | | | | | | | | | | | | | |
| | | | | | | | | | | | | 277,417 | |
| | | |
| |
| | Pharmaceuticals – 0.0% | |
| | | | | 6,187 | | | Endo, Inc.(f) | | | | | 143,839 | |
| | | | | 65,267 | | | Lannett Co., Inc.(f)(k) | | | | | 138,366 | |
| | | | | 6 | | | Mallinckrodt PLC | | | | | 311 | |
| | | | | | | | | | | | | | |
| | | | | | | | | | | | | 282,516 | |
| | | |
| |
| | Professional Services(f) – 0.0% | |
| | | | | 61,506 | | | Avaya Holdings Corp.(l) | | | | | 253,713 | |
| | | |
| | |
| 54 | | The accompanying notes are an integral part of these financial statements. |
GOLDMAN SACHS MULTI-MANAGER NON-CORE FIXED INCOME FUND
| | | | | | | | | | | | | | |
| | |
Shares | | | Description | | Value | |
| |
| | Common Stocks – (continued) | |
| |
| | Professional Services(f) – (continued) | |
| | | | | 865 | | | Skillsoft Corp. | | $ | 6,219 | |
| | | | | | | | | | | | | | |
| | | | | | | | | | | | | 259,932 | |
| | | |
| |
| | Real Estate – 0.0% | |
| | | | | 36,246 | | | Copper Property CTL | | | | |
| | | | | | | | Pass-Through Trust | | | 354,486 | |
| | | |
| |
| | Semiconductors & Semiconductor Equipment(f) – 0.0% | |
| | | | | 18,377 | | | Bright Bidco BV | | | 5,458 | |
| | | |
| |
| | Specialty Retail(f)(k) – 0.1% | |
| | | | | 7,504 | | | GTRC Reorg Equity | | | 911,211 | |
| | | |
| |
| | Wireless Telecommunication Services(f) – 0.0% | |
| | | | | 5,606 | | | IQOR US, Inc. | | | 5,141 | |
| | | | | 14,518 | | | Windstream Corp. | | | 177,845 | |
| | | | | | | | | | | | | | |
| | | | | | | | | | | | | 182,986 | |
| | | |
| | |
| | TOTAL COMMON STOCKS (Cost $8,920,066) | | $ | 4,922,581 | |
| | | |
| | | | | | | | | | | | | | | | |
| | | Principal Amount | | | Interest
Rate | | | Maturity Date | | Value | |
| |
| | Asset-Backed Securities(b)(c)(i) – 0.1% | |
| |
| | Collateralized Loan Obligations – 0.1% | |
| | Atrium XV Series 15A, Class D (3 mo. USD Term SOFR + 3.262%) | |
| | $ | | | 250,000 | | | | 8.588 | % | | 01/23/31 | | $ | 250,182 | |
| | Benefit Street Partners CLO XXXIII Ltd. Series 2023-33A,
Class E (3 mo. USD Term SOFR + 6.980%) | |
| | | | | 250,000 | | | | 12.292 | | | 01/25/36 | | | 253,850 | |
| | Carlyle U.S. CLO Ltd. Series 2021-4A, Class E (3 mo. USD
Term SOFR + 6.862%) | |
| | | | | 250,000 | | | | 12.186 | | | 04/20/34 | | | 249,988 | |
| | KKR CLO 43 Ltd. Series 2022-43A, Class ER (3 mo. USD Term SOFR + 7.970%) | |
| | | | | 250,000 | | | | 13.299 | | | 01/15/36 | | | 258,237 | |
| | Madison Park Funding LIX Ltd. Series 2021-59A, Class E (3 mo. USD Term SOFR + 6.862%) | |
| | | | | 250,000 | | | | 12.189 | | | 01/18/34 | | | 250,168 | |
| | OHA Credit Funding 11 Ltd. Series 2022-11A, Class E (3 mo. USD Term SOFR + 7.250%) | |
| | | | | 250,000 | | | | 12.577 | | | 07/19/33 | | | 250,545 | |
| | OHA Credit Funding 17 Ltd. Series 2024-17A, Class D1 (3 mo. USD Term SOFR + 3.300%) | |
| | | | | 250,000 | | | | 8.613 | | | 04/20/37 | | | 250,272 | |
| | Palmer Square CLO Ltd. Series 2015-2A, Class DR2 (3 mo. USD Term SOFR + 6.012%) | |
| | | | | 250,000 | | | | 11.336 | | | 07/20/30 | | | 249,683 | |
| | | | | | | | | | | | | | | | |
| | | | | | | | | | | | | | | 2,012,925 | |
| | | |
| | |
| | TOTAL ASSET-BACKED SECURITIES (Cost $1,969,651) | | $ | 2,012,925 | |
| | | |
| | | | | | | | | | | | |
| | | Units | | | Expiration
Date | | Value | |
| |
| | Warrants(f) – 0.0% | |
| |
| | Avation PLC | |
| | | | | 20,510 | | | 10/31/26 | | $ | 3,844 | |
| | GTRC WT TR I(k) | |
| | | | | 1,825 | | | 12/31/99 | | | 102,437 | |
| | GTRC WT TR II(k) | |
| | | | | 1,986 | | | 12/31/99 | | | 59,699 | |
| | GTRC WT TR III(k) | |
| | | | | 161 | | | 12/31/99 | | | 4,840 | |
| | Intelsat SA | |
| | | | | 1 | | | 02/17/27 | | | 1 | |
| | | |
| |
| | TOTAL WARRANTS | |
| | (Cost $379,841) | | $ | 170,821 | |
| | | |
| | | | | | | | | | | | | | | | |
| | | Shares | | | | | | Dividend Rate | | Value | |
| |
| | Preferred Stocks(f)(k) – 0.0% | |
| |
| | Financial Services – 0.0% | |
| | Voyager Aviation Holdings LLC | |
| | | | | 1,441 | | | | | | | 0.000% | | $ | — | |
| | | |
| |
| | Specialty Retail – 0.0% | |
| | GTRC JRPFD EQ | |
| | | | | 103 | | | | | | | 0.000 | | | 9,504 | |
| | | |
| | |
| | TOTAL PREFERRED STOCKS (Cost $84,145) | | $ | 9,504 | |
| | | |
| | | | | | | | | | | | | | | | | | |
| | | Shares | | | | | | Description | | Value | |
| |
| | Exchange Traded Funds – 0.3% | |
| | | | | | | | | 66,596 | | | iShares iBoxx $ High Yield Corporate Bond ETF | | $ | 5,080,609 | |
| | |
| | (Cost $5,004,167) | | | | |
| | | |
| | | | | | | | | | | | | | | | |
| | | Shares | | | Dividend Rate | | Value | |
| |
| | Investment Company – 8.4% | |
| |
| | Goldman Sachs Financial Square Government Fund — Institutional Shares(p) | |
| | | | | 126,579,537 | | | | | | | 5.223% | | $ | 126,579,537 | |
| |
| | (Cost $126,579,537) | |
| | | |
| | |
| | TOTAL INVESTMENTS – 98.4% (Cost $1,530,915,900) | | $ | 1,491,105,630 | |
| | | |
| | OTHER ASSETS IN EXCESS OF
LIABILITIES – 1.6% | | | 24,958,174 | |
| | | |
| | |
| | NET ASSETS – 100.0% | | $ | 1,516,063,804 | |
| | | |
| | |
| The accompanying notes are an integral part of these financial statements. | | 55 |
GOLDMAN SACHS MULTI-MANAGER NON-CORE FIXED INCOME FUND
|
Schedule of Investments (continued) April 30, 2024 (Unaudited) |
| | |
| The percentage shown for each investment category reflects the value of investments in that category as a percentage of net assets. |
| |
| (a) | | Issued with a zero coupon. Income is recognized through the accretion of discount. |
| |
| (b) | | Exempt from registration under Rule 144A of the Securities Act of 1933. |
| |
| (c) | | Security with “Call” features with resetting interest rates. Maturity dates disclosed are the final maturity dates. |
| |
| (d) | | Coupon changes periodically based upon a predetermined schedule. Interest rate disclosed is that which is in effect on April 30, 2024. |
| |
| (e) | | Actual maturity date is April 03, 2120. |
| |
| (f) | | Security is currently in default and/or non-income producing. |
| |
| (g) | | Actual maturity date is July 28, 2121. |
| |
| (h) | | Pay-in-kind securities. |
| |
| (i) | | Variable rate security. Except for floating rate notes (for which final maturity is disclosed), maturity date disclosed is the next interest reset date. Interest rate disclosed is that which is in effect on April 30, 2024. |
| |
| (j) | | Security with “Put” features and resetting interest rates. Maturity dates disclosed are the puttable dates. Interest rate disclosed is that which is in effect on April 30, 2024. |
| |
| (k) | | Significant unobservable inputs were used in the valuation of this portfolio security; i.e., Level 3. |
| |
| (l) | | Restricted securities are not registered under the Securities Act of 1933, as amended, and are subject to legal restrictions on resale. These securities generally may be resold in transactions exempt from registration or to the public if the securities are subsequently registered. Disposal of these securities may involve time consuming negotiations and prompt sale at an acceptable price may be difficult. Total market value of Restricted securities amounts to $84,284, which represents approximately 0.0% of the Fund’s net assets as of April 30, 2024. See additional details below: |
| | | | | | |
| Restricted Security | | Acquisition
Date | | Cost | |
|
| |
Avaya Holdings Corp. | | 05/01/23 | | $ | 132,475 | |
Avaya Holdings Corp. | | 05/01/23 | | | 668,883 | |
Burgundy Diamond Mines Ltd. | | 06/30/23 | | | 207,714 | |
Chesapeake Energy Corp. | | 12/06/19 | | | 42,991 | |
Chesapeake Energy Corp. | | 06/21/19 | | | 316,924 | |
Endo Design LLC | | 04/23/24 | | | — | |
Endo Finance LLC | | 11/06/23 | | | — | |
Entorian Technologies, Inc. | | 04/23/24 | | | — | |
Neiman Marcus Group Ltd. LLC | | 04/23/18 | | | 605,000 | |
|
| |
| | |
| |
| (m) | | Guaranteed by a foreign government until maturity. Total market value of these securities amounts to $1,045,720, which represents approximately 0.1% of the Fund’s net assets as of April 30, 2024. |
| |
| (n) | | Bank Loans often require prepayments from excess cash flows or permit the borrower to repay at its election. The degree to which borrowers repay, whether as a contractual requirement or at their election, cannot be predicted with accuracy. As a result, the actual remaining maturity may be substantially less than the stated maturities shown. As bank loan positions may involve multiple underlying tranches for which the aggregate position is presented, the stated interest rate represents the weighted average interest rate of all contracts on April 30, 2024. Bank Loans typically have rates of interest which are predetermined either daily, monthly, quarterly or semi-annually by reference to a base lending rate, plus a premium. These base lending rates are primarily the Secured Overnight Financing Rate (“SOFR”), and secondarily the prime rate offered by one or more major United States banks (the “Prime Rate”) and the certificate of deposit (“CD”) rate or other base lending rates used by commercial lenders. |
| |
| (o) | | This position represents an unsettled loan commitment at period end. Certain details associated with this purchase are not known prior to the settlement date, including coupon rate. |
| |
| (p) | | Represents an Affiliated Issuer. |
|
|
ADDITIONAL INVESTMENT INFORMATION |
UNFUNDED LOAN COMMITMENTS — At April 30, 2024, the Fund had unfunded loan commitments which could be extended at the option of the borrowers, pursuant to the following loan agreements:
| | | | | | | | | | | | |
| Borrower | | Principal
Amount | | | Current
Value | | | Unrealized
Gain (Loss) | |
|
| |
| | | |
Enviva Partners LP/Fin C, due 12/13/24 | | | $ 90,904 | | | | $103,328 | | | | $19,469 | |
Enviva Partners LP/Fin C, due 12/13/24 | | | 227,259 | | | | 228,016 | | | | 18,369 | |
Enviva Partners LP/Fin C, due 12/13/24 | | | 780 | | | | 742 | | | | 3 | |
Groundworks LLC, due 03/14/31 | | | 64,596 | | | | 64,051 | | | | 101 | |
Touchdown Acquirer, Inc., due 02/21/31 | | | 72,754 | | | | 73,121 | | | | 251 | |
|
| |
| | | |
| TOTAL | | | $456,293 | | | | $469,258 | | | | $38,193 | |
|
| |
| | |
| 56 | | The accompanying notes are an integral part of these financial statements. |
GOLDMAN SACHS MULTI-MANAGER NON-CORE FIXED INCOME FUND
|
|
ADDITIONAL INVESTMENT INFORMATION (continued) |
FORWARD FOREIGN CURRENCY EXCHANGE CONTRACTS — At April 30, 2024, the Fund had the following forward foreign currency exchange contracts:
FORWARD FOREIGN CURRENCY EXCHANGE CONTRACTS WITH UNREALIZED GAIN
| | | | | | | | | | | | | | | | | | | | |
| Counterparty | | Currency Purchased | | | Currency Sold | | | Settlement
Date | | | Unrealized
Gain | |
|
| |
| | | | | | |
Barclays Bank PLC | | CZK | | | 18,988,971 | | | USD | | | 803,500 | | | | 09/18/24 | | | $ | 3,870 | |
| | EUR | | | 22,607,000 | | | USD | | | 24,200,183 | | | | 07/25/24 | | | | 18,768 | |
| | GBP | | | 485,000 | | | USD | | | 600,928 | | | | 07/25/24 | | | | 5,399 | |
| | TRY | | | 72,309,472 | | | USD | | | 1,879,941 | | | | 09/18/24 | | | | 31,126 | |
| | TRY | | | 56,055,000 | | | USD | | | 1,424,324 | | | | 10/15/24 | | | | 13,014 | |
| | TRY | | | 168,702,593 | | | USD | | | 4,029,500 | | | | 10/28/24 | | | | 235,123 | |
| | USD | | | 264,791 | | | AUD | | | 400,000 | | | | 06/13/24 | | | | 5,327 | |
| | USD | | | 5,975,700 | | | PEN | | | 22,283,409 | | | | 05/17/24 | | | | 57,805 | |
| | USD | | | 6,348,974 | | | THB | | | 232,734,278 | | | | 05/20/24 | | | | 58,677 | |
BNP Paribas SA | | BRL | | | 3,383,401 | | | USD | | | 642,800 | | | | 06/12/24 | | | | 6,180 | |
| | MXN | | | 7,186,574 | | | USD | | | 412,325 | | | | 07/24/24 | | | | 1,411 | |
| | TRY | | | 88,072,673 | | | USD | | | 1,835,096 | | | | 03/03/25 | | | | 145,325 | |
| | USD | | | 3,719,100 | | | EUR | | | 3,385,432 | | | | 06/12/24 | | | | 99,777 | |
BofA Securities LLC | | CLP | | | 1,323,789,303 | | | USD | | | 1,365,900 | | | | 06/13/24 | | | | 12,355 | |
| | CLP | | | 3,225,899,688 | | | USD | | | 3,330,993 | | | | 07/22/24 | | | | 26,857 | |
| | TRY | | | 59,044,380 | | | USD | | | 1,500,000 | | | | 09/18/24 | | | | 60,484 | |
| | USD | | | 894,300 | | | EUR | | | 835,117 | | | | 06/12/24 | | | | 1,487 | |
| | USD | | | 470,790 | | | KRW | | | 636,079,200 | | | | 06/07/24 | | | | 11,023 | |
| | USD | | | 1,117,900 | | | PEN | | | 4,192,013 | | | | 06/13/24 | | | | 4,960 | |
| | USD | | | 19,632,516 | | | THB | | | 720,513,337 | | | | 05/20/24 | | | | 158,622 | |
| | ZAR | | | 46,142,465 | | | USD | | | 2,414,256 | | | | 07/15/24 | | | | 22,122 | |
Citibank NA | | EUR | | | 1,289,848 | | | USD | | | 1,380,000 | | | | 07/17/24 | | | | 1,257 | |
| | GBP | | | 67,382 | | | USD | | | 83,000 | | | | 07/17/24 | | | | 1,234 | |
| | USD | | | 1,102,634 | | | CAD | | | 1,486,198 | | | | 07/17/24 | | | | 21,631 | |
| | USD | | | 6,034,346 | | | EUR | | | 5,556,635 | | | | 07/17/24 | | | | 83,924 | |
| | USD | | | 521,475 | | | GBP | | | 411,602 | | | | 07/17/24 | | | | 6,935 | |
JPMorgan Securities, Inc. | | CLP | | | 7,186,788,840 | | | USD | | | 7,438,200 | | | | 06/13/24 | | | | 44,282 | |
| | TRY | | | 106,426,676 | | | USD | | | 2,682,800 | | | | 10/28/24 | | | | 7,554 | |
| | TRY | | | 50,927,692 | | | USD | | | 1,071,711 | | | | 03/03/25 | | | | 73,461 | |
| | USD | | | 4,280,867 | | | BRL | | | 22,048,820 | | | | 06/12/24 | | | | 51,616 | |
| | USD | | | 1,781,524 | | | EGP | | | 88,357,360 | | | | 12/11/24 | | | | 58,916 | |
| | USD | | | 9,232,818 | | | KRW | | | 12,600,949,855 | | | | 06/07/24 | | | | 124,676 | |
| | USD | | | 7,438,200 | | | PEN | | | 27,428,363 | | | | 06/13/24 | | | | 156,231 | |
| | USD | | | 5,889,755 | | | THB | | | 216,139,218 | | | | 05/20/24 | | | | 47,986 | |
| | ZAR | | | 155,221,955 | | | USD | | | 8,096,851 | | | | 07/15/24 | | | | 99,055 | |
MS & Co. Int. PLC | | GBP | | | 160,564 | | | USD | | | 200,000 | | | | 05/15/24 | | | | 649 | |
| | USD | | | 36,000,000 | | | THB | | | 1,310,040,000 | | | | 05/02/24 | | | | 645,331 | |
| | USD | | | 5,889,755 | | | THB | | | 215,947,860 | | | | 05/20/24 | | | | 53,158 | |
|
| |
| | | | | | |
| TOTAL | | | | | | | | | | | | | | | | | | $ | 2,457,608 | |
|
| |
|
| FORWARD FOREIGN CURRENCY EXCHANGE CONTRACTS WITH UNREALIZED LOSS | |
| Counterparty | | Currency Purchased | | | Currency Sold | | | Settlement
Date | | | Unrealized
Loss | |
|
| |
| | | | | | |
Barclays Bank PLC | | CLP | | | 1,723,122,000 | | | USD | | | 1,800,000 | | | | 07/22/24 | | | $ | (6,397 | ) |
| | THB | | | 1,310,040,000 | | | USD | | | 35,803,225 | | | | 05/02/24 | | | | (448,556 | ) |
| | THB | | | 107,650,515 | | | USD | | | 2,950,000 | | | | 07/11/24 | | | | (28,426 | ) |
| | TRY | | | 83,327,162 | | | USD | | | 2,160,000 | | | | 10/28/24 | | | | (53,577 | ) |
| | |
| The accompanying notes are an integral part of these financial statements. | | 57 |
GOLDMAN SACHS MULTI-MANAGER NON-CORE FIXED INCOME FUND
|
Schedule of Investments (continued) April 30, 2024 (Unaudited) |
|
|
ADDITIONAL INVESTMENT INFORMATION (continued) |
FORWARD FOREIGN CURRENCY EXCHANGE CONTRACTS WITH UNREALIZED LOSS (continued)
| | | | | | | | | | | | | | | | | | | | |
| Counterparty | | Currency Purchased | | | Currency Sold | | | Settlement
Date | | | Unrealized
Loss | |
|
| |
| | | | | | |
Barclays Bank PLC (continued) | | TRY | | | 118,859,100 | | | USD | | | 2,683,000 | | | | 03/03/25 | | | $ | (10,308 | ) |
| | USD | | | 10,630,635 | | | ZAR | | | 201,364,420 | | | | 07/15/24 | | | | (1,649 | ) |
BNP Paribas SA | | BRL | | | 18,665,419 | | | USD | | | 3,719,100 | | | | 06/12/24 | | | | (138,829 | ) |
| | CZK | | | 65,845,578 | | | USD | | | 2,827,300 | | | | 09/18/24 | | | | (27,688 | ) |
| | PLN | | | 12,042,000 | | | USD | | | 3,072,725 | | | | 06/11/24 | | | | (105,559 | ) |
BofA Securities LLC | | CLP | | | 626,183,876 | | | USD | | | 661,900 | | | | 06/13/24 | | | | (9,952 | ) |
| | CZK | | | 18,902,006 | | | USD | | | 804,900 | | | | 09/18/24 | | | | (1,227 | ) |
| | EGP | | | 37,688,825 | | | USD | | | 781,439 | | | | 12/11/24 | | | | (46,661 | ) |
| | KRW | | | 8,550,000,000 | | | USD | | | 6,531,454 | | | | 06/07/24 | | | | (351,395 | ) |
| | MXN | | | 65,803,805 | | | USD | | | 3,881,200 | | | | 07/15/24 | | | | (86,926 | ) |
| | PEN | | | 2,388,389 | | | USD | | | 648,208 | | | | 06/13/24 | | | | (14,114 | ) |
| | THB | | | 329,218,433 | | | USD | | | 9,034,658 | | | | 07/11/24 | | | | (99,856 | ) |
| | USD | | | 4,921,006 | | | THB | | | 182,372,500 | | | | 05/20/24 | | | | (8,122 | ) |
Citibank NA | | CAD | | | 1,464,705 | | | USD | | | 1,080,739 | | | | 07/17/24 | | | | (15,370 | ) |
| | EUR | | | 7,678,014 | | | USD | | | 8,338,811 | | | | 07/17/24 | | | | (116,673 | ) |
| | GBP | | | 942,537 | | | USD | | | 1,191,721 | | | | 07/17/24 | | | | (13,464 | ) |
| | USD | | | 266,969 | | | EUR | | | 250,000 | | | | 07/17/24 | | | | (748 | ) |
JPMorgan Securities, Inc. | | EGP | | | 68,510,408 | | | USD | | | 1,406,591 | | | | 12/11/24 | | | | (70,917 | ) |
| | KRW | | | 4,687,029,056 | | | USD | | | 3,521,906 | | | | 06/07/24 | | | | (134,057 | ) |
| | PLN | | | 20,093,298 | | | USD | | | 5,113,970 | | | | 06/11/24 | | | | (162,953 | ) |
| | TRY | | | 73,770,400 | | | USD | | | 2,020,000 | | | | 09/18/24 | | | | (70,322 | ) |
| | USD | | | 327,074 | | | EGP | | | 17,841,873 | | | | 12/11/24 | | | | (20,770 | ) |
MS & Co. Int. PLC | | CAD | | | 951,265 | | | USD | | | 695,608 | | | | 05/15/24 | | | | (4,436 | ) |
| | EUR | | | 2,420,011 | | | USD | | | 2,595,668 | | | | 05/15/24 | | | | (11,462 | ) |
| | GBP | | | 751,960 | | | USD | | | 943,935 | | | | 05/15/24 | | | | (4,251 | ) |
| | MXN | | | 25,120,904 | | | USD | | | 1,502,571 | | | | 07/15/24 | | | | (54,090 | ) |
| | MYR | | | 12,398,611 | | | USD | | | 2,658,364 | | | | 06/20/24 | | | | (63,970 | ) |
| | PLN | | | 4,890,044 | | | USD | | | 1,207,400 | | | | 09/18/24 | | | | (4,009 | ) |
| | TRY | | | 51,124,770 | | | USD | | | 1,402,600 | | | | 09/18/24 | | | | (51,423 | ) |
| | USD | | | 690,614 | | | CAD | | | 951,265 | | | | 05/15/24 | | | | (558 | ) |
| | USD | | | 3,000,000 | | | EUR | | | 2,816,373 | | | | 05/15/24 | | | | (7,458 | ) |
| | USD | | | 925,000 | | | GBP | | | 743,772 | | | | 05/15/24 | | | | (4,453 | ) |
|
| |
| | | | | | |
| TOTAL | | | | | | | | | | | | | | | | | | $ | (2,250,626 | ) |
|
| |
SWAP CONTRACTS — At April 30, 2024, the Fund had the following swap contracts:
OVER-THE-COUNTER CREDIT DEFAULT SWAP CONTRACTS
| | | | | | | | | | | | | | | | | | | | | | | | |
| Reference Obligation/Index | | Financing Rate
Received/(Paid)
by the Fund(a) | | Credit
Spread
at April 30,
2024(b) | | Counterparty | | Termination
Date | | | Notional
Amount
(000s) | | | Value | | | Upfront
Premiums
(Received)
Paid | | | Unrealized
Appreciation/
(Depreciation) |
|
|
| | | | | | | | |
Protection Sold: | | | | | | | | | | | | | | | | | | | | | | | | |
American Airlines Group, Inc., 3.750%, 03/01/25 | | 5.000% | | 4.139% | | Citibank NA | | | 06/20/28 | | | | $630 | | | | $22,205 | | | | $ | (41,099) | | $63,304 |
|
|
| | (a) | Payments made quarterly. |
| | (b) | Credit spread on the referenced obligation, together with the term of the swap contract, are indicators of payment/performance risk. The likelihood of a credit event occurring which would require a fund or its counterparty to make a payment or otherwise be required to perform under the swap contract is generally greater as the credit spread and the term of the swap contract increase. |
| | |
| 58 | | The accompanying notes are an integral part of these financial statements. |
GOLDMAN SACHS MULTI-MANAGER NON-CORE FIXED INCOME FUND
|
|
ADDITIONAL INVESTMENT INFORMATION (continued) |
CENTRALLY CLEARED CREDIT DEFAULT SWAP CONTRACTS
| | | | | | | | | | | | | | | | | | | | | | | | |
| Referenced Obligation/Index | | Financing Rate
Received/(Paid)
by the Fund(a) | | Credit
Spread at
April 30,
2024(b) | | Termination
Date | | | Notional
Amount
(000s) | | | Value | | | Upfront
Premiums
(Received)
Paid | | | Unrealized
Appreciation/
(Depreciation) | |
|
| |
| | | | | | | |
Protection Sold: | | | | | | | | | | | | | | | | | | | | | | | | |
CDX.NA.HY Index 42 | | 5.000% | | 3.555% | | | 06/20/29 | | | $ | 38,020 | | | $ | 2,458,518 | | | $ | 2,592,453 | | | $ | (133,935 | ) |
|
| |
| | (a) | Payments made quarterly. |
| | (b) | Credit spread on the referenced obligation, together with the term of the swap contract, are indicators of payment/performance risk. The likelihood of a credit event occurring which would require a fund or its counterparty to make a payment or otherwise be required to perform under the swap contract is generally greater as the credit spread and the term of the swap contract increase. |
PURCHASED AND WRITTEN OPTIONS CONTRACTS — At April 30, 2024, the Fund had the following purchased and written options:
OVER-THE-COUNTER OPTIONS ON FOREIGN CURRENCY
| | | | | | | | | | | | | | | | | | | | | | | | | | | | | | |
| Description | | Counterparty | | Exercise
Price | | | Expiration
Date | | | Number of
Contracts | | | Notional
Amount | | | Market
Value | | | Premiums Paid
(Received)
by Fund | | | Unrealized
Appreciation/
(Depreciation) | |
|
| |
| | | | | | | |
Purchased option contract | | | | | | | | | | | | | | | | | | | | | | | | | | | | |
Puts | | | | | | | | | | | | | | | | | | | | | | | | | | | | | | |
| Put EUR/Call USD | | Barclays Bank PLC | | $ | 1.070 | | | | 07/11/2024 | | | | 29,250,000 | | | $ | 29,250,000 | | | $ | 304,434 | | | $ | 262,744 | | | $ | 41,690 | |
| | | | | |
Written option contract | | | | | | | | | | | | | | | | | | | | | |
Puts | | | | | | | | | | | | | | | | | | | | | | | | | | | | | | |
| Put EUR/Call USD | | Barclays Bank PLC | | | 1.040 | | | | 07/11/2024 | | | | (29,250,000 | ) | | | (29,250,000 | ) | | | (76,986 | ) | | | (73,924 | ) | | | (3,062 | ) |
|
| |
| | | | | | | | |
| TOTAL | | | | | | | | | | | | | — | | | $ | — | | | $ | 227,448 | | | $ | 188,820 | | | $ | 38,628 | |
|
| |
| | | | |
| | |
| |
| Currency Abbreviations: | | |
| AUD | | —Australian Dollar | | |
| BRL | | —Brazil Real | | |
| CAD | | —Canadian Dollar | | |
| CLP | | —Chilean Peso | | |
| COP | | —Colombia Peso | | |
| CZK | | —Czech Republic Koruna | | |
| EGP | | —Egypt Pound | | |
| EUR | | —Euro | | |
| GBP | | —British Pound | | |
| HUF | | —Hungarian Forint | | |
| IDR | | —Indonesia Rupiah | | |
| INR | | —Indian Rupee | | |
| KRW | | —South Korean Won | | |
| MXN | | —Mexican Peso | | |
| MYR | | —Malaysia Ringgit | | |
| PEN | | —Peru Nuevo Sol | | |
| PLN | | —Polish Zloty | | |
| RON | | —Romania New Leu | | |
| THB | | —Thailand Baht | | |
| TRY | | —Turkish Lira | | |
| USD | | —U.S. Dollar | | |
| ZAR | | —South African Rand | | |
| |
| | |
| | |
| The accompanying notes are an integral part of these financial statements. | | 59 |
GOLDMAN SACHS MULTI-MANAGER NON-CORE FIXED INCOME FUND
|
Schedule of Investments (continued) April 30, 2024 (Unaudited) |
|
|
ADDITIONAL INVESTMENT INFORMATION (continued) |
| | | | |
| | |
| |
| Investment Abbreviations: | | |
| CLO | | —Collateralized Loan Obligation | | |
| CMT | | —Constant Maturity Treasury Indexes | | |
| ETF | | —Exchange Traded Fund | | |
| EURIBOR | | —Euro Interbank Offered Rate | | |
| ICE | | —Inter-Continental Exchange | | |
| LIBOR | | —London Interbank Offered Rate | | |
| LLC | | —Limited Liability Company | | |
| LP | | —Limited Partnership | | |
| PIK | | —Payment in kind | | |
| PLC | | —Public Limited Company | | |
| REIT | | —Real Estate Investment Trust | | |
| SOFR | | —Secured Overnight Financing Rate | | |
| |
| | |
| | | | |
| | |
| |
| Abbreviations: | | |
| BofA Securities LLC | | —Bank of America Securities LLC | | |
| CDX.NA.HY Ind 42 | | —CDX North America High Yield Index 42 | | |
| MS & Co. Int. PLC | | —Morgan Stanley & Co. International PLC | | |
| |
| | |
| | |
| 60 | | The accompanying notes are an integral part of these financial statements. |
GOLDMAN SACHS MULTI-MANAGER REAL ASSETS STRATEGY FUND
|
Schedule of Investments April 30, 2024 (Unaudited) |
| | | | | | | | |
| | | Shares | | Description | | Value | |
| |
| | Common Stocks – 96.7% | |
| |
| | Australia – 3.9% | |
| | 389,045 | | APA Group (Gas Utilities) | | $ | 2,076,131 | |
| | 538,877 | | Cleanaway Waste Management Ltd. (Commerical Services & Supplies) | | | 932,242 | |
| | 539,983 | | Goodman Group (Industrial REITs) | | | 10,907,455 | |
| | 888,073 | | National Storage REIT (Specialized REITs) | | | 1,224,588 | |
| | 301,821 | | NEXTDC Ltd.* (IT Services) | | | 3,203,976 | |
| | 329,614 | | Qube Holdings Ltd. (Transportation Infrastructure) | | | 701,176 | |
| | 2,667,863 | | Scentre Group (Retail REITs) | | | 5,402,555 | |
| | 1,978,146 | | Stockland (Diversified REITs) | | | 5,604,318 | |
| | 79,177 | | Transurban Group (Transportation Infrastructure) | | | 635,669 | |
| | | | | | | | |
| | | | | | | 30,688,110 | |
| | | |
| |
| | Belgium – 0.4% | |
| | 59,995 | | Shurgard Self Storage Ltd. (Specialized REITs) | | | 2,458,666 | |
| | 27,827 | | Warehouses De Pauw CVA (Industrial REITs) | | | 735,867 | |
| | | | | | | | |
| | | | | | | 3,194,533 | |
| | | |
| |
| | Brazil – 0.3% | |
| | 946,051 | | Santos Brasil Participacoes SA (Transportation Infrastructure) | | | 2,474,170 | |
| | | |
| |
| | Canada – 7.2% | |
| | 116,505 | | Allied Properties Real Estate Investment Trust (Office REITs) | | | 1,432,775 | |
| | 16,357 | | Boardwalk Real Estate Investment Trust (Residential REITs) | | | 842,059 | |
| | 87,209 | | Canadian Apartment Properties REIT (Residential REITs) | | | 2,714,492 | |
| | 161,154 | | Chartwell Retirement Residences (Health Care Providers & Services) | | | 1,462,110 | |
| | 435,520 | | Enbridge, Inc. (Oil, Gas & Consumable Fuels) | | | 15,485,929 | |
| | 86,538 | | First Capital Real Estate Investment Trust (Retail REITs) | | | 929,090 | |
| | 82,690 | | GFL Environmental, Inc. (Commerical Services & Supplies) | | | 2,637,811 | |
| | 1,789 | | Granite Real Estate Investment Trust (Industrial REITs) | | | 88,433 | |
| | 74,340 | | Hydro One Ltd.(a) (Electric Utilities) | | | 2,082,265 | |
| | 112,968 | | InterRent Real Estate Investment Trust (Residential REITs) | | | 983,080 | |
| | 141,200 | | Keyera Corp. (Oil, Gas & Consumable Fuels) | | | 3,622,695 | |
| | 108,324 | | Killam Apartment Real Estate Investment Trust (Residential REITs) | | | 1,352,624 | |
| | 352,435 | | Pembina Pipeline Corp. (Oil, Gas & Consumable Fuels) | | | 12,401,083 | |
| | 315,584 | | TC Energy Corp. (Oil, Gas & Consumable Fuels) | | | 11,306,144 | |
| | | | | | | | |
| | | | | | | 57,340,590 | |
| | | |
| | | | | | | | |
| | | Shares | | Description | | Value | |
| |
| | Common Stocks (continued) | |
| |
| | China – 1.0% | |
| | 614,000 | | China Merchants Port Holdings Co. Ltd. (Transportation Infrastructure) | | $ | 810,858 | |
| | 13,474,000 | | China Tower Corp. Ltd. Class H(a) (Diversified Telecommunication Services) | | | 1,577,257 | |
| | 555,800 | | ENN Energy Holdings Ltd. (Gas Utilities) | | | 4,735,631 | |
| | 326,000 | | Guangdong Investment Ltd. (Water Utilities) | | | 170,291 | |
| | 1,177,319 | | Zhejiang Expressway Co. Ltd. Class H (Transportation Infrastructure) | | | 769,768 | |
| | | | | | | | |
| | | | | | | 8,063,805 | |
| | | |
| |
| | France – 4.6% | |
| | 68,227 | | Eiffage SA (Construction & Engineering) | | | 7,279,714 | |
| | 113,610 | | Engie SA* (Multi-Utilities) | | | 1,972,339 | |
| | 16,891 | | Gecina SA (Office REITs) | | | 1,724,601 | |
| | 232,247 | | Klepierre SA (Retail REITs) | | | 6,236,391 | |
| | 51,126 | | Unibail-Rodamco-Westfield* (Retail REITs) | | | 4,260,481 | |
| | 128,413 | | Vinci SA (Construction & Engineering) | | | 15,046,935 | |
| | | | | | | | |
| | | | | | | 36,520,461 | |
| | | |
| |
| | Germany – 1.4% | |
| | 99,955 | | E.ON SE (Multi-Utilities) | | | 1,323,601 | |
| | 12,404 | | Fraport AG Frankfurt Airport Services Worldwide* (Transportation Infrastructure) | | | 621,045 | |
| | 314,421 | | Vonovia SE (Real Estate | | | | |
| | | | Management & Development) | | | 9,085,517 | |
| | | | | | | | |
| | | | | | | 11,030,163 | |
| | | |
| |
| | Hong Kong – 2.2% | |
| | 195,800 | | China Gas Holdings Ltd. (Gas Utilities) | | | 183,334 | |
| | 445,900 | | China Resources Gas Group Ltd. (Gas Utilities) | | | 1,401,451 | |
| | 1,662,200 | | Hong Kong & China Gas Co. Ltd. (Gas Utilities) | | | 1,263,857 | |
| | 928,000 | | Kunlun Energy Co. Ltd. (Gas Utilities) | | | 899,583 | |
| | 1,295,800 | | Link REIT (Retail REITs) | | | 5,552,233 | |
| | 158,500 | | Power Assets Holdings Ltd. (Electric Utilities) | | | 909,180 | |
| | 669,094 | | Sun Hung Kai Properties Ltd. (Real Estate Management & Development) | | | 6,172,363 | |
| | 40 | | Swire Properties Ltd. (Real Estate Management & Development) | | | 83 | |
| | 346,705 | | Wharf Real Estate Investment Co. Ltd. (Real Estate Management & Development) | | | 1,075,657 | |
| | | | | | | | |
| | | | | | | 17,457,741 | |
| | | |
| | |
| The accompanying notes are an integral part of these financial statements. | | 61 |
GOLDMAN SACHS MULTI-MANAGER REAL ASSETS STRATEGY FUND
|
Schedule of Investments (continued) April 30, 2024 (Unaudited) |
| | | | | | | | |
| | | Shares | | Description | | Value | |
| |
| | Common Stocks (continued) | |
| |
| | Italy – 0.8% | |
| | 872,764 | | Snam SpA (Gas Utilities) | | $ | 3,993,132 | |
| | 336,783 | | Terna - Rete Elettrica Nazionale (Electric Utilities) | | | 2,698,275 | |
| | | | | | | | |
| | | | | | | 6,691,407 | |
| | | |
| |
| | Japan – 6.4% | |
| | 885 | | Daiwa House REIT Investment Corp. (Diversified REITs) | | | 1,486,602 | |
| | 3,093 | | GLP J-Reit (Industrial REITs) | | | 2,515,574 | |
| | 664 | | Industrial & Infrastructure Fund Investment Corp. (Industrial REITs) | | | 549,048 | |
| | 5,826 | | Invincible Investment Corp. (Hotel & Resort REITs) | | | 2,610,284 | |
| | 53,800 | | Japan Airport Terminal Co. Ltd. (Transportation Infrastructure) | | | 1,901,249 | |
| | 7,270 | | Japan Hotel REIT Investment Corp. (Hotel & Resort REITs) | | | 3,820,366 | |
| | 194,385 | | Mitsubishi Estate Co. Ltd. (Real Estate Management & Development) | | | 3,562,048 | |
| | 1,054,694 | | Mitsui Fudosan Co. Ltd. (Real Estate Management & Development) | | | 10,733,686 | |
| | 706 | | Nippon Accommodations Fund, Inc. (Residential REITs) | | | 2,940,144 | |
| | 1,308 | | Nippon Building Fund, Inc. (Office REITs) | | | 4,997,599 | |
| | 1,673 | | Nippon Prologis REIT, Inc. (Industrial REITs) | | | 2,891,670 | |
| | 1,689 | | Nomura Real Estate Master Fund, Inc. (Diversified REITs) | | | 1,614,549 | |
| | 2,839 | | Sekisui House Reit, Inc. (Diversified REITs) | | | 1,454,702 | |
| | 144,624 | | Sumitomo Realty & Development Co. Ltd. (Real Estate Management & Development) | | | 5,004,555 | |
| | 205,900 | | Tokyo Gas Co. Ltd. (Gas Utilities) | | | 4,617,771 | |
| | 687 | | Tokyu Fudosan Holdings Corp. (Real Estate Management & Development) | | | 5,033 | |
| | 25,500 | | West Japan Railway Co. (Ground Transportation) | | | 484,027 | |
| | | | | | | | |
| | | | | | | 51,188,907 | |
| | | |
| |
| | Luxembourg – 0.1% | |
| | 74,115 | | SES SA (Media) | | | 359,568 | |
| | | |
| |
| | Mexico – 0.6% | |
| | 3,220 | | Grupo Aeroportuario del Pacifico SAB de CV (Transportation Infrastructure) | | | 585,493 | |
| | 54,358 | | Grupo Aeroportuario del Sureste SAB de CV Class B (Transportation Infrastructure) | | | 1,867,225 | |
| | 4,434 | | Grupo Aeroportuario del Sureste SAB de CV (Transportation Infrastructure) | | | 1,527,513 | |
| | 139,624 | | Prologis Property Mexico SA de CV (Industrial REITs) | | | 550,647 | |
| | | | | | | | |
| | | | | | | 4,530,878 | |
| | | |
| | | | | | | | |
| | | Shares | | Description | | Value | |
| |
| | Common Stocks (continued) | |
| |
| | Netherlands – 0.5% | |
| | 64,085 | | Ferrovial SE (Construction & Engineering) | | $ | 2,304,840 | |
| | 46,012 | | Koninklijke Vopak NV (Oil, Gas & Consumable Fuels) | | | 1,827,208 | |
| | | | | | | | |
| | | | | | | 4,132,048 | |
| | | |
| |
| | Philippines – 0.2% | |
| | 273,090 | | International Container Terminal Services, Inc. (Transportation Infrastructure) | | | 1,564,742 | |
| | | |
| |
| | Singapore – 1.6% | |
| | 1,233,938 | | CapitaLand Ascendas REIT (Industrial REITs) | | | 2,337,352 | |
| | 2,632,599 | | CapitaLand Ascott Trust (Hotel & Resort REITs) | | | 1,748,551 | |
| | 1,269,301 | | CapitaLand Integrated Commercial Trust (Retail REITs) | | | 1,809,382 | |
| | 1,411,561 | | CapitaLand Investment Ltd.* (Real Estate Management & Development) | | | 2,729,750 | |
| | 1,540,997 | | Frasers Logistics & Commercial Trust (Industrial REITs) | | | 1,116,274 | |
| | 1,305,100 | | Mapletree Industrial Trust (Industrial REITs) | | | 2,161,031 | |
| | 1,125,339 | | Mapletree Logistics Trust (Industrial REITs) | | | 1,104,297 | |
| | | | | | | | |
| | | | | | | 13,006,637 | |
| | | |
| |
| | Spain – 3.2% | |
| | 45,570 | | Aena SME SA(a) (Transportation Infrastructure) | | | 8,304,657 | |
| | 328,469 | | Cellnex Telecom SA*(a) (Diversified Telecommunication Services) | | | 10,857,443 | |
| | 425,176 | | Merlin Properties Socimi SA (Diversified REITs) | | | 4,782,868 | |
| | 107,561 | | Redeia Corp. SA (Electric Utilities) | | | 1,795,581 | |
| | | | | | | | |
| | | | | | | 25,740,549 | |
| | | |
| |
| | Sweden – 1.0% | |
| | 133,245 | | Castellum AB* (Real Estate Management & Development) | | | 1,583,211 | |
| | 48,368 | | Catena AB (Real Estate Management & Development) | | | 2,116,815 | |
| | 92,818 | | Sagax AB Class B (Real Estate Management & Development) | | | 2,324,354 | |
| | 236,523 | | Wihlborgs Fastigheter AB (Real Estate Management & Development) | | | 1,981,031 | |
| | | | | | | | |
| | | | | | | 8,005,411 | |
| | | |
| |
| | United Kingdom – 5.2% | |
| | 75,630 | | Big Yellow Group PLC (Specialized REITs) | | | 1,017,399 | |
| | 360,448 | | British Land Co. PLC (Diversified REITs) | | | 1,738,133 | |
| | 647,593 | | Grainger PLC (Real Estate Management & Development) | | | 2,075,598 | |
| | 248,144 | | Great Portland Estates PLC (Office REITs) | | | 1,215,468 | |
| | | |
| | |
| 62 | | The accompanying notes are an integral part of these financial statements. |
GOLDMAN SACHS MULTI-MANAGER REAL ASSETS STRATEGY FUND
| | | | | | | | |
| | | Shares | | Description | | Value | |
| |
| | Common Stocks (continued) | |
| |
| | United Kingdom (continued) | |
| | 1,436,121 | | National Grid PLC (Multi-Utilities) | | $ | 18,837,820 | |
| | 277,377 | | Pennon Group PLC (Water Utilities) | | | 2,306,599 | |
| | 179,348 | | Safestore Holdings PLC (Specialized REITs) | | | 1,728,531 | |
| | 492,891 | | Segro PLC (Industrial REITs) | | | 5,184,288 | |
| | 11,200 | | Severn Trent PLC (Water Utilities) | | | 345,232 | |
| | 1,381,067 | | Tritax Big Box REIT PLC (Industrial REITs) | | | 2,608,608 | |
| | 329,747 | | UNITE Group PLC (Residential REITs) | | | 3,812,053 | |
| | 27,397 | | United Utilities Group PLC (Water Utilities) | | | 357,124 | |
| | | | | | | | |
| | | | | | | 41,226,853 | |
| | | |
| |
| | United States – 56.1% | |
| | 61,264 | | Agree Realty Corp. (Retail REITs) | | | 3,505,526 | |
| | 79,203 | | Alexandria Real Estate Equities, Inc. (Office REITs) | | | 9,177,252 | |
| | 137,223 | | American Healthcare REIT, Inc. (Health Care REITs) | | | 1,884,072 | |
| | 250,203 | | American Homes 4 Rent Class A (Residential REITs) | | | 8,957,267 | |
| | 167,196 | | American Tower Corp. (Specialized REITs) | | | 28,684,146 | |
| | 207,492 | | Americold Realty Trust, Inc. (Industrial REITs) | | | 4,558,599 | |
| | 36,302 | | Apartment Income REIT Corp. (Residential REITs) | | | 1,393,271 | |
| | 57,528 | | Atmos Energy Corp. (Gas Utilities) | | | 6,782,551 | |
| | 43,284 | | AvalonBay Communities, Inc. (Residential REITs) | | | 8,205,348 | |
| | 86,935 | | Brixmor Property Group, Inc. (Retail REITs) | | | 1,921,264 | |
| | 271,260 | | Broadstone Net Lease, Inc. (Diversified REITs) | | | 3,949,546 | |
| | 556 | | Camden Property Trust (Residential REITs) | | | 55,422 | |
| | 123,719 | | CareTrust REIT, Inc. (Health Care REITs) | | | 3,058,334 | |
| | 139,746 | | CenterPoint Energy, Inc. (Multi-Utilities) | | | 4,072,198 | |
| | 71,905 | | Cheniere Energy, Inc. (Oil, Gas & Consumable Fuels) | | | 11,348,047 | |
| | 60,269 | | Community Healthcare Trust, Inc. (Health Care REITs) | | | 1,598,937 | |
| | 54,177 | | Consolidated Edison, Inc. (Multi-Utilities) | | | 5,114,309 | |
| | 72,927 | | Cousins Properties, Inc. (Office REITs) | | | 1,672,945 | |
| | 102,719 | | Crown Castle, Inc. (Specialized REITs) | | | 9,632,988 | |
| | 85,683 | | Digital Realty Trust, Inc. (Specialized REITs) | | | 11,891,087 | |
| | 65,693 | | DT Midstream, Inc. (Oil, Gas & Consumable Fuels) | | | 4,086,105 | |
| | 8,257 | | Duke Energy Corp. (Electric Utilities) | | | 811,333 | |
| | 63,070 | | Edison International (Electric Utilities) | | | 4,481,754 | |
| | | |
| | | | | | | | |
| | | Shares | | Description | | Value | |
| |
| | Common Stocks (continued) | |
| |
| | United States (continued) | |
| | 2,004 | | EPR Properties (Specialized REITs) | | $ | 81,342 | |
| | 26,876 | | Equinix, Inc. (Specialized REITs) | | | 19,111,792 | |
| | 153,716 | | Equity Residential (Residential REITs) | | | 9,899,310 | |
| | 186,632 | | Essential Properties Realty Trust, Inc. (Diversified REITs) | | | 4,915,887 | |
| | 18,014 | | Essex Property Trust, Inc. (Residential REITs) | | | 4,435,947 | |
| | 106,767 | | Eversource Energy (Electric Utilities) | | | 6,472,216 | |
| | 172,617 | | Exelon Corp. (Electric Utilities) | | | 6,486,947 | |
| | 60,484 | | Extra Space Storage, Inc. (Specialized REITs) | | | 8,121,792 | |
| | 91,885 | | First Industrial Realty Trust, Inc. (Industrial REITs) | | | 4,173,417 | |
| | 63,754 | | Gaming & Leisure Properties, Inc. (Specialized REITs) | | | 2,724,208 | |
| | 109,223 | | Healthcare Realty Trust, Inc. (Health Care REITs) | | | 1,554,243 | |
| | 72,918 | | Healthpeak Properties, Inc. (Health Care REITs) | | | 1,357,004 | |
| | 209,723 | | Host Hotels & Resorts, Inc. (Hotel & Resort REITs) | | | 3,957,473 | |
| | 42,366 | | InvenTrust Properties Corp. (Retail REITs) | | | 1,073,554 | |
| | 212,383 | | Invitation Homes, Inc. (Residential REITs) | | | 7,263,499 | |
| | 36,303 | | Iron Mountain, Inc. (Specialized REITs) | | | 2,814,209 | |
| | 66,037 | | Kilroy Realty Corp. (Office REITs) | | | 2,232,051 | |
| | 193,664 | | Kinder Morgan, Inc. (Oil, Gas & Consumable Fuels) | | | 3,540,178 | |
| | 34,427 | | Kinetik Holdings, Inc. (Oil, Gas & Consumable Fuels) | | | 1,319,931 | |
| | 151,426 | | Kite Realty Group Trust (Retail REITs) | | | 3,301,087 | |
| | 9,863 | | Marriott Vacations Worldwide Corp. (Hotels, Restaurants & Leisure) | | | 947,933 | |
| | 34,560 | | Mid-America Apartment Communities, Inc. (Residential REITs) | | | 4,492,800 | |
| | 11,198 | | NextEra Energy, Inc. (Electric Utilities) | | | 749,930 | |
| | 344,766 | | NiSource, Inc. (Multi-Utilities) | | | 9,605,181 | |
| | 167,532 | | NNN REIT, Inc. (Retail REITs) | | | 6,790,072 | |
| | 12,882 | | Norfolk Southern Corp. (Ground Transportation) | | | 2,966,982 | |
| | 164,364 | | ONEOK, Inc. (Oil, Gas & Consumable Fuels) | | | 13,004,480 | |
| | 919,958 | | PG&E Corp. (Electric Utilities) | | | 15,740,481 | |
| | 29,250 | | Pinnacle West Capital Corp. (Electric Utilities) | | | 2,154,262 | |
| | 186,607 | | PPL Corp. (Electric Utilities) | | | 5,124,228 | |
| | 207,621 | | Prologis, Inc. (Industrial REITs) | | | 21,187,723 | |
| | 13,168 | | Public Service Enterprise Group, Inc. (Multi-Utilities) | | | 909,645 | |
| | 31,376 | | Public Storage (Specialized REITs) | | | 8,140,503 | |
| | 11,209 | | Realty Income Corp. (Retail REITs) | | | 600,130 | |
| | | |
| | |
| The accompanying notes are an integral part of these financial statements. | | 63 |
GOLDMAN SACHS MULTI-MANAGER REAL ASSETS STRATEGY FUND
|
Schedule of Investments (continued) April 30, 2023 (Unaudited) |
| | | | | | | | |
| | |
Shares | | Description | | Value | |
| |
| | Common Stocks (continued) | |
| |
| | United States (continued) | |
| | 124,164 | | Regency Centers Corp. (Retail REITs) | | $ | 7,352,992 | |
| | 175,409 | | Retail Opportunity Investments Corp. (Retail REITs) | | | 2,152,268 | |
| | 101,036 | | Rexford Industrial Realty, Inc. (Industrial REITs) | | | 4,325,351 | |
| | 19,797 | | Ryman Hospitality Properties, Inc. (Hotel & Resort REITs) | | | 2,088,188 | |
| | 177,498 | | Sabra Health Care REIT, Inc. (Health Care REITs) | | | 2,470,772 | |
| | 24,433 | | SBA Communications Corp. (Specialized REITs) | | | 4,547,470 | |
| | 208,872 | | Sempra (Multi-Utilities) | | | 14,961,501 | |
| | 35,708 | | Simon Property Group, Inc. (Retail REITs) | | | 5,018,045 | |
| | 8,502 | | SITE Centers Corp. (Retail REITs) | | | 114,692 | |
| | 57,417 | | SL Green Realty Corp. (Office REITs) | | | 2,861,089 | |
| | 7,122 | | Southwest Gas Holdings, Inc. (Gas Utilities) | | | 531,444 | |
| | 90,964 | | STAG Industrial, Inc. (Industrial REITs) | | | 3,128,252 | |
| | 52,670 | | Sun Communities, Inc. (Residential REITs) | | | 5,863,224 | |
| | 88,178 | | Targa Resources Corp. (Oil, Gas & Consumable Fuels) | | | 10,057,583 | |
| | 29,095 | | Terreno Realty Corp. (Industrial REITs) | | | 1,581,313 | |
| | 27,032 | | UDR, Inc. (Residential REITs) | | | 1,029,379 | |
| | 6,044 | | Union Pacific Corp. (Ground Transportation) | | | 1,433,395 | |
| | 184,386 | | Ventas, Inc. (Health Care REITs) | | | 8,164,612 | |
| | 310,999 | | Veris Residential, Inc. (Residential REITs) | | | 4,481,496 | |
| | 307,944 | | VICI Properties, Inc. (Specialized REITs) | | | 8,791,801 | |
| | 206,707 | | Welltower, Inc. (Health Care REITs) | | | 19,695,043 | |
| | 327,408 | | Williams Cos., Inc. (Oil, Gas & Consumable Fuels) | | | 12,559,371 | |
| | | | | | | | |
| | | | | | | 447,302,019 | |
| | | |
| | TOTAL COMMON STOCKS (Cost $743,118,362) | | $ | 770,518,592 | |
| | | |
| | | | | | | | |
| | | Shares | | Dividend
Rate | | Value | |
| |
| | Investment Company(b) – 2.6% | |
| |
| | Goldman Sachs Financial Square Government Fund — Institutional Shares | |
| | 20,870,161 | | 5.223% | | $ | 20,870,161 | |
| | (Cost $ 20,870,161) | |
| | | |
| | TOTAL INVESTMENTS – 99.3% (Cost $ 763,988,523) | | $ | 791,388,753 | |
| | | |
| | OTHER ASSETS IN EXCESS OF
LIABILITIES – 0.7% | | | 5,500,919 | |
| | | |
| | NET ASSETS – 100.0% | | $ | 796,889,672 | |
| | | |
| | |
| The percentage shown for each investment category reflects the value of investments in that category as a percentage of net assets. |
| |
| * | | Non-income producing security. |
| |
| (a) | | Exempt from registration under Rule 144A of the Securities Act of 1933. |
| |
| (b) | | Represents an Affiliated Issuer. |
|
|
SECTOR ALLOCATION AS OF APRIL 30, 2024 |
| | | | |
| |
Sector | | % of Total
Market Value |
| |
Real Estate | | | 58.2 | % |
| |
Utilities | | | 17.2 | |
| |
Energy | | | 12.7 | |
| |
Industrials | | | 7.0 | |
| |
Investment Company | | | 2.6 | |
| |
Communication Services | | | 1.6 | |
| |
Information Technology | | | 0.4 | |
| |
Health Care | | | 0.2 | |
| |
Consumer Discretionary | | | 0.1 | |
| |
| | | | 100.0 | % |
|
|
ADDITIONAL INVESTMENT INFORMATION |
FORWARD FOREIGN CURRENCY EXCHANGE CONTRACTS — At April 30, 2024, the Fund had the following forward foreign currency exchange contracts:
FORWARD FOREIGN CURRENCY EXCHANGE CONTRACTS WITH UNREALIZED GAIN
| | | | | | | | | | | | | | | | | | |
| Counterparty | | Currency
Purchased | | | Currency Sold | | | Settlement
Date | | Unrealized
Gain | |
|
| |
| | | | | | |
State Street Bank and Trust | | USD | | | 210,909 | | | JPY | | | 33,079,719 | | | 05/01/24 | | | $1,134 | |
|
| |
| | |
| 64 | | The accompanying notes are an integral part of these financial statements. |
GOLDMAN SACHS MULTI-MANAGER REAL ASSETS STRATEGY FUND
|
|
ADDITIONAL INVESTMENT INFORMATION (continued) |
FUTURES CONTRACTS — At April 30, 2024, the Fund had the following futures contracts:
| | | | | | | | | | | | |
| Description | | Number of
Contracts | | Expiration
Date | | Notional
Amount | | | Unrealized
Appreciation/
(Depreciation) | |
|
| |
| | | | |
Long position contracts: | | | | | | | | | | | | |
Dow Jones U.S. Real Estate Index | | 496 | | 06/21/24 | | $ | 15,772,800 | | | $ | (1,447,517 | ) |
|
| |
| | | | |
| | |
| |
| Currency Abbreviations: | | |
| JPY | | —Japanese Yen | | |
| USD | | —U.S. Dollar | | |
| |
| | |
| | | | |
| | |
| |
| Investment Abbreviations: | | |
| PLC | | —Public Limited Company | | |
| REIT | | —Real Estate Investment Trust | | |
| |
| | |
| | |
| The accompanying notes are an integral part of these financial statements. | | 65 |
GOLDMAN SACHS STRATEGIC MULTI-ASSET CLASS FUNDS
|
Statements of Assets and Liabilities April 30, 2024 (Unaudited) |
| | | | | | | | | | | | | | | | |
| | | | | Goldman Sachs
Multi-Manager
Global Equity Fund | | Goldman Sachs
Multi-Manager
Non-Core Fixed
Income Fund | | Goldman Sachs
Multi-Manager
Real Assets
Strategy Fund | | |
| | | | | |
| | | Assets: | | | | | | | | | | | | | | |
| | | | | |
| | Investments in unaffiliated issuers, at value (cost $861,300,592, $1,404,336,363 and $743,118,362, respectively) | | $ | 1,000,097,141 | | | $ | 1,364,526,093 | | | $ | 770,518,592 | | | |
| | Investments in affiliated issuers, at value (cost $82,444,361, $126,579,537 and $20,870,161, respectively) | | | 82,444,361 | | | | 126,579,537 | | | | 20,870,161 | | | |
| | Purchased options, at value (premium paid $0, $262,744 and $0, respectively) | | | — | | | | 304,434 | | | | — | | | |
| | Cash | | | 1,810,528 | | | | 14,890,884 | | | | 541,542 | | | |
| | Foreign currencies, at value (cost $271,465, $2,549,761 and $730,375, respectively) | | | 243,546 | | | | 2,552,347 | | | | 726,544 | | | |
| | Unrealized gain on swap contracts | | | — | | | | 63,304 | | | | — | | | |
| | Unrealized gain on forward foreign currency exchange contracts | | | 3,576,584 | | | | 2,457,608 | | | | 1,134 | | | |
| | Unrealized gain on unfunded loan commitment | | | — | | | | 38,193 | | | | — | | | |
| | Receivables: | | | | | | | | | | | | | | |
| | Fund shares sold | | | 6,065,000 | | | | 146,900,000 | | | | 4,500,000 | | | |
| | Collateral on certain derivative contracts(a) | | | 4,940,503 | | | | 5,020,257 | | | | 1,145,760 | | | |
| | Interest and dividends | | | 1,778,328 | | | | 21,055,418 | | | | 1,419,165 | | | |
| | Investments sold | | | 1,482,199 | | | | 37,285,324 | | | | 2,441,074 | | | |
| | Foreign tax reclaims | | | 617,702 | | | | 275,465 | | | | 113,513 | | | |
| | Investments sold on an extended-settlement basis | | | 388,145 | | | | 2,197,142 | | | | 569,825 | | | |
| | Reimbursement from investment adviser | | | 82,167 | | | | — | | | | — | | | |
| | Other assets | | | 52,830 | | | | 31,587 | | | | 21,696 | | | |
| | |
| | | | | |
| | Total assets | | | 1,103,579,034 | | | | 1,724,177,593 | | | | 802,869,006 | | | |
| | |
| | | | | | | | | | | | | | | | |
| | | | | |
| | Liabilities: | | | | | | | | | | | | | | |
| | | | | |
| | Variation margin on futures contracts | | | 1,256,539 | | | | — | | | | 287,663 | | | |
| | Unrealized loss on forward foreign currency exchange contracts | | | 636,268 | | | | 2,250,626 | | | | — | | | |
| | Variation margin on swaps contracts | | | — | | | | 192,115 | | | | — | | | |
| | Written option contracts, at value (premium received $0, $73,924 and $0, respectively) | | | — | | | | 76,986 | | | | — | | | |
| | Payables: | | | | | | | | | | | | | | |
| | Fund shares redeemed | | | 14,830,000 | | | | 20,430,000 | | | | 2,020,000 | | | |
| | Investments purchased | | | 3,801,222 | | | | 148,896,590 | | | | 1,878,797 | | | |
| | Investments purchased on an extended-settlement basis | | | 561,953 | | | | 33,654,375 | | | | 898,094 | | | |
| | Management fees | | | 284,784 | | | | 422,401 | | | | 311,056 | | | |
| | Transfer Agency fees | | | 18,207 | | | | 22,391 | | | | 12,243 | | | |
| | Upfront payments received on swap contracts | | | — | | | | 41,099 | | | | — | | | |
| | Due to Custodian | | | — | | | | 219,060 | | | | — | | | |
| | Due to broker | | | — | | | | 780,000 | | | | — | | | |
| | Accrued expenses | | | 1,919,755 | | | | 1,128,146 | | | | 571,481 | | | |
| | |
| | | | | |
| | Total liabilities | | | 23,308,728 | | | | 208,113,789 | | | | 5,979,334 | | | |
| | |
| | | | | | | | | | | | | | | | |
| | | | | |
| | Net Assets: | | | | | | | | | | | | | | |
| | | | | |
| | Paid-in capital | | | 937,843,686 | | | | 1,739,061,642 | | | | 804,011,969 | | | |
| | Total distributable earnings (loss) | | | 142,426,620 | | | | (222,997,838 | ) | | | (7,122,297 | ) | | |
| | |
| | | | | |
| | NET ASSETS | | $ | 1,080,270,306 | | | $ | 1,516,063,804 | | | $ | 796,889,672 | | | |
| | |
| | Shares Outstanding $0.001 par value (unlimited number of shares authorized): | | | 99,659,244 | | | | 203,010,185 | | | | 89,451,925 | | | |
| | Net asset value, offering and redemption price per share: | | $ | 10.84 | | | $ | 7.47 | | | $ | 8.91 | | | |
| | |
| | (a) | Segregated for initial margin and/or collateral as follows: |
| | | | | | | | | | | | | | | | | | |
| Fund | | Futures | | | Swaps | | | Forwards | | | TBA | | | |
Multi-Manager Global Equity Fund | | $ | 4,510,503 | | | $ | 430,000 | | | $ | — | | | $ | — | | | |
Multi-Manager Non-Core Fixed Income Fund | | | — | | | | 4,730,257 | | | | 270,000 | | | | 20,000 | | | |
Multi-Manager Real Assets Strategy Fund | | | 1,145,760 | | | | — | | | | — | | | | — | | | |
| | |
| 66 | | The accompanying notes are an integral part of these financial statements. |
GOLDMAN SACHS STRATEGIC MULTI-ASSET CLASS FUNDS
|
Statements of Operations For the Six Months Ended April 30, 2024 (Unaudited) |
| | | | | | | | | | | | | | | | |
| | | | | Goldman Sachs
Multi-Manager
Global Equity
Fund | | | Goldman Sachs
Multi-Manager
Non-Core Fixed
Income Fund | | | Goldman Sachs
Multi-Manager
Real Assets
Strategy Fund | | | |
| | | | | |
| | Investment Income: | | | | | | | | | | | | | | |
| | | | | |
| | Dividends — unaffiliated issuers (net of tax withholding of $469,680, $0 and $628,924, respectively) | | $ | 6,589,842 | | | $ | 122,881 | | | $ | 11,431,893 | | | |
| | Dividends — affiliated issuers | | | 1,798,930 | | | | 2,229,328 | | | | 493,368 | | | |
| | Interest (net of foreign withholding taxes of $3, $213,391 and $0, respectively) | | | — | | | | 47,150,698 | | | | 21,725 | | | |
| | |
| | Total investment income | | | 8,388,772 | | | | 49,502,907 | | | | 11,946,986 | | | |
| | |
| | | | | | | | | | | | | | | | |
| | | | | |
| | Expenses: | | | | | | | | | | | | | | |
| | | | | |
| | Management fees | | | 4,742,059 | | | | 5,233,818 | | | | 3,388,519 | | | |
| | Custody, accounting and administrative services | | | 761,763 | | | | 603,518 | | | | 307,231 | | | |
| | Professional fees | | | 152,003 | | | | 127,767 | | | | 90,034 | | | |
| | Transfer Agency fees | | | 92,268 | | | | 123,149 | | | | 67,770 | | | |
| | Registration fees | | | 20,785 | | | | 20,039 | | | | 15,008 | | | |
| | Trustee fees | | | 19,621 | | | | 20,966 | | | | 19,015 | | | |
| | Printing and mailing costs | | | 18,005 | | | | 23,495 | | | | 17,882 | | | |
| | Prime broker fees | | | 4,077 | | | | 165 | | | | — | | | |
| | Shareholder meeting expense | | | 2,577 | | | | 2,558 | | | | 2,561 | | | |
| | Other | | | 27,294 | | | | 20,167 | | | | 7,716 | | | |
| | |
| | Total expenses | | | 5,840,452 | | | | 6,175,642 | | | | 3,915,736 | | | |
| | |
| | Less — expense reductions | | | (3,509,902 | ) | | | (2,895,347 | ) | | | (1,572,527 | ) | | |
| | |
| | Net expenses | | | 2,330,550 | | | | 3,280,295 | | | | 2,343,209 | | | |
| | |
| | NET INVESTMENT INCOME | | | 6,058,222 | | | | 46,222,612 | | | | 9,603,777 | | | |
| | |
| | | | | | | | | | | | | | | | |
| | | | | |
| | Realized and unrealized gain (loss): | | | | | | | | | | | | | | |
| | | | | |
| | Net realized gain (loss) from: | | | | | | | | | | | | | | |
| | Investments — unaffiliated issuers (including commission recapture of $16,927, $0 and $7,740, respectively) | | | 13,870,844 | | | | (14,839,475 | ) | | | (1,808,719 | ) | | |
| | Purchased options | | | — | | | | (100,373 | ) | | | — | | | |
| | Futures contracts | | | 7,458,358 | | | | (52,196 | ) | | | 734,345 | | | |
| | Written options | | | — | | | | 68,596 | | | | — | | | |
| | Swap contracts | | | — | | | | 2,858,840 | | | | — | | | |
| | Forward foreign currency exchange contracts | | | 441,172 | | | | 351,649 | | | | 22,195 | | | |
| | Foreign currency transactions | | | (761,549 | ) | | | 57,063 | | | | (3,747 | ) | | |
| | Net change in unrealized gain (loss) on: | | | | | | | | | | | | | | |
| | Investments — unaffiliated issuers (including the effects of foreign capital gains tax of $(457,989), $594 and $0, respectively) | | | 109,807,323 | | | | 36,329,470 | | | | 51,542,513 | | | |
| | Unfunded loan commitment | | | — | | | | 38,193 | | | | — | | | |
| | Purchased options | | | — | | | | 167,429 | | | | — | | | |
| | Futures contracts | | | 1,930,674 | | | | 80,178 | | | | (118,011 | ) | | |
| | Written options | | | — | | | | (59,027 | ) | | | — | | | |
| | Swap contracts | | | — | | | | (113,269 | ) | | | — | | | |
| | Forward foreign currency exchange contracts | | | 1,909,721 | | | | 1,103,433 | | | | 1,134 | | | |
| | Foreign currency translation | | | (63,938 | ) | | | (107,863 | ) | | | (2,328 | ) | | |
| | |
| | Net realized and unrealized gain | | | 134,592,605 | | | | 25,782,648 | | | | 50,367,382 | | | |
| | |
| | NET INCREASE IN NET ASSETS RESULTING FROM OPERATIONS | | $ | 140,650,827 | | | $ | 72,005,260 | | | $ | 59,971,159 | | | |
| | |
| | |
| The accompanying notes are an integral part of these financial statements. | | 67 |
GOLDMAN SACHS STRATEGIC MULTI-ASSET CLASS FUNDS
|
Statements of Changes in Net Assets |
| | | | | | | | | | | | | | | | | | | | |
| | | | | Multi-Manager Global Equity Fund | | | Multi-Manager Non-Core Fixed Income Fund | | | |
| | | | | | |
| | | | | For the
Six Months Ended
April 30, 2024
(Unaudited) | | | For the Fiscal
Year Ended
October 31, 2023 | | | For the
Six Months Ended
April 30, 2024
(Unaudited) | | | For the Fiscal Year Ended
October 31, 2023 | | | |
| | | | | | |
| | From operations: | | | | | | | | | | | | | | | | | | |
| | | | | | |
| | Net investment income | | $ | 6,058,222 | | | $ | 8,347,911 | | | | $ 46,222,612 | | | | $ 83,044,960 | | | |
| | Net realized gain (loss) | | | 21,008,825 | | | | (8,743,420 | ) | | | (11,655,896 | ) | | | (64,556,135 | ) | | |
| | Net change in unrealized gain | | | 113,583,780 | | | | 30,341,779 | | | | 37,438,544 | | | | 81,014,697 | | | |
| | |
| | | | | | |
| | Net increase in net assets resulting from operations | | | 140,650,827 | | | | 29,946,270 | | | | 72,005,260 | | | | 99,503,522 | | | |
| | |
| | | | | | | | | | | | | | | | | | | | |
| | | | | | |
| | Distributions to shareholders: | | | | | | | | | | | | | | | | | | |
| | | | | | |
| | From distributable earnings | | | (10,768,945 | ) | | | (39,162,975 | ) | | | (47,452,391 | ) | | | (81,470,590 | ) | | |
| | From return of capital | | | — | | | | — | | | | — | | | | (3,475,605 | ) | | |
| | |
| | | | | | |
| | Total distributions to shareholders | | | (10,768,945 | ) | | | (39,162,975 | ) | | | (47,452,391 | ) | | | (84,946,195 | ) | | |
| | |
| | | | | | | | | | | | | | | | | | | | |
| | | | | | |
| | From share transactions: | | | | | | | | | | | | | | | | | | |
| | | | | | |
| | Proceeds from sales of shares | | | 373,880,396 | | | | 511,675,000 | | | | 586,806,000 | | | | 424,368,538 | | | |
| | Reinvestment of distributions | | | 10,768,945 | | | | 39,162,975 | | | | 47,341,161 | | | | 84,946,195 | | | |
| | Cost of shares redeemed | | | (195,731,362 | ) | | | (152,480,805 | ) | | | (213,311,496 | ) | | | (438,813,157 | ) | | |
| | |
| | | | | | |
| | Net increase in net assets resulting from share transactions | | | 188,917,979 | | | | 398,357,170 | | | | 420,835,665 | | | | 70,501,576 | | | |
| | |
| | | | | | |
| | TOTAL INCREASE | | | 318,799,861 | | | | 389,140,465 | | | | 445,388,534 | | | | 85,058,903 | | | |
| | |
| | | | | | | | | | | | | | | | | | | | |
| | | | | | |
| | Net assets: | | | | | | | | | | | | | | | | | | |
| | | | | | |
| | Beginning of period | | | 761,470,445 | | | | 372,329,980 | | | | 1,070,675,270 | | | | 985,616,367 | | | |
| | |
| | | | | | |
| | End of period | | $ | 1,080,270,306 | | | $ | 761,470,445 | | | | $1,516,063,804 | | | | $1,070,675,270 | | | |
| | |
| | |
| 68 | | The accompanying notes are an integral part of these financial statements. |
GOLDMAN SACHS STRATEGIC MULTI-ASSET CLASS FUNDS
|
Statements of Changes in Net Assets (continued) |
| | | | | | | | | | | | | | |
| | | | | Multi-Manager Real Assets Strategy Fund | | | | |
| | | | | For the
Six Months Ended
April 30, 2024
(Unaudited) | | | For the Fiscal Year Ended
October 31, 2023 | | | | |
| | | | |
| | From operations: | | | | | | | | | | | | |
| | | | |
| | Net investment income | | | $ 9,603,777 | | | | $ 12,539,205 | | | | | |
| | Net realized loss | | | (1,055,926 | ) | | | (17,572,776 | ) | | | | |
| | Net change in unrealized gain (loss) | | | 51,423,308 | | | | (20,639,834 | ) | | | | |
| | | |
| | | | |
| | Net increase (decrease) in net assets resulting from operations | | | 59,971,159 | | | | (25,673,405 | ) | | | | |
| | | |
| | | | | | | | | | | | | | |
| | | | |
| | Distributions to shareholders: | | | | | | | | | | | | |
| | | | |
| | From distributable earnings | | | (15,471,294 | ) | | | (25,978,821 | ) | | | | |
| | | |
| | | | | | | | | | | | | | |
| | | | |
| | From share transactions: | | | | | | | | | | | | |
| | | | |
| | Proceeds from sales of shares | | | 207,777,999 | | | | 205,108,061 | | | | | |
| | Reinvestment of distributions | | | 15,471,294 | | | | 25,890,049 | | | | | |
| | Cost of shares redeemed | | | (43,389,161 | ) | | | (22,035,027 | ) | | | | |
| | | |
| | | | |
| | Net increase in net assets resulting from share transactions | | | 179,860,132 | | | | 208,963,083 | | | | | |
| | | |
| | | | |
| | TOTAL INCREASE | | | 224,359,997 | | | | 157,310,857 | | | | | |
| | | |
| | | | | | | | | | | | | | |
| | | | |
| | Net assets: | | | | | | | | | | | | |
| | | | |
| | Beginning of period | | | 572,529,675 | | | | 415,218,818 | | | | | |
| | | |
| | | | |
| | End of period | | | $796,889,672 | | | | $572,529,675 | | | | | |
| | | |
| | |
| The accompanying notes are an integral part of these financial statements. | | 69 |
GOLDMAN SACHS MULTI-MANAGER GLOBAL EQUITY FUND
|
Financial Highlights Selected Share Data for a Share Outstanding Throughout Each Period |
| | | | | | | | | | | | | | | | | | | | | | | | | | | | | | | | | | |
| | | | | Multi-Manager Global Equity Fund | | |
| | | |
| | | | | Class R6 Shares | | |
| | | | | | | | |
| | | | | Six Months Ended | | | | | | | | | | | | |
| | | | | April 30, 2024 | | Year Ended October 31, | | |
| | | | | | | | |
| | | | | (Unaudited) | | 2023 | | 2022 | | 2021 | | 2020 | | 2019 | | |
| | | | | | | | |
| | Per Share Data | | | | | | | | | | | | | | | | | | | | | | | | | | | | | | | | |
| | | | | | | | |
| | Net asset value, beginning of period | | | $ | 9.22 | | | | $ | 9.09 | | | | $ | 14.91 | | | | $ | 10.64 | | | | $ | 10.97 | | | | $ | 10.62 | | | |
| | |
| | | | | | | | |
| | Net investment income(a) | | | | 0.07 | | | | | 0.14 | | | | | 0.13 | | | | | 0.14 | | | | | 0.14 | | | | | 0.19 | | | |
| | | | | | | | |
| | Net realized and unrealized gain (loss) | | | | 1.68 | | | | | 0.74 | | | | | (2.39 | ) | | | | 4.37 | | | | | 0.15 | | | | | 0.91 | | | |
| | |
| | | | | | | | |
| | Total from investment operations | | | | 1.75 | | | | | 0.88 | | | | | (2.26 | ) | | | | 4.51 | | | | | 0.29 | | | | | 1.10 | | | |
| | |
| | | | | | | | |
| | Distributions to shareholders from net investment income | | | | (0.13 | ) | | | | (0.31 | ) | | | | (0.18 | ) | | | | (0.09 | ) | | | | (0.33 | ) | | | | (0.19 | ) | | |
| | | | | | | | |
| | Distributions to shareholders from net realized gains | | | | — | | | | | (0.44 | ) | | | | (3.38 | ) | | | | (0.15 | ) | | | | (0.29 | ) | | | | (0.56 | ) | | |
| | |
| | | | | | | | |
| | Total distributions | | | | (0.13 | ) | | | | (0.75 | ) | | | | (3.56 | ) | | | | (0.24 | ) | | | | (0.62 | ) | | | | (0.75 | ) | | |
| | |
| | | | | | | | |
| | Net asset value, end of period | | | $ | 10.84 | | | | $ | 9.22 | | | | $ | 9.09 | | | | $ | 14.91 | | | | $ | 10.64 | | | | $ | 10.97 | | | |
| | |
| | | | | | | | |
| | Total return(b) | | | | 19.07 | % | | | | 10.10 | % | | | | (19.61 | )% | | | | 42.93 | % | | | | 2.60 | % | | | | 11.39 | % | | |
| | |
| | | | | | | | |
| | Net assets, end of period (in 000s) | | | $ | 1,080,270 | | | | $ | 761,470 | | | | $ | 372,330 | | | | $ | 526,397 | | | | $ | 527,449 | | | | $ | 462,441 | | | |
| | | | | | | | |
| | Ratio of net expenses to average net assets | | | | 0.51 | %(c) | | | | 0.53 | % | | | | 0.52 | % | | | | 0.51 | % | | | | 0.46 | % | | | | 0.72 | % | | |
| | | | | | | | |
| | Ratio of total expenses to average net assets | | | | 1.27 | %(c) | | | | 1.40 | % | | | | 1.48 | % | | | | 1.31 | % | | | | 1.53 | % | | | | 1.42 | % | | |
| | | | | | | | |
| | Ratio of net investment income to average net assets | | | | 1.31 | %(c) | | | | 1.43 | % | | | | 1.19 | % | | | | 1.07 | % | | | | 1.34 | % | | | | 1.81 | % | | |
| | | | | | | | |
| | Portfolio turnover rate(d) | | | | 35 | % | | | | 60 | % | | | | 90 | % | | | | 83 | % | | | | 79 | % | | | | 91 | % | | |
| | |
| | (a) | Calculated based on the average shares outstanding methodology. |
| | (b) | Assumes investment at the NAV at the beginning of the period, reinvestment of all dividends and distributions, a complete redemption of the investment at the NAV at the end of the period and no sales or redemption charges (if any). Total returns would be reduced if a sales or redemption charge was taken into account. Returns do not reflect the impact of taxes to shareholders relating to Fund distributions or the redemption of Fund shares. Total returns for periods less than one full year are not annualized. |
| | (d) | The Fund’s portfolio turnover rate is calculated in accordance with regulatory requirements, without regard to transactions involving short term investments and certain derivatives. If such transactions were included, the Fund’s portfolio turnover rate may be higher. |
| | |
| 70 | | The accompanying notes are an integral part of these financial statements. |
GOLDMAN SACHS MULTI-MANAGER NON-CORE FIXED INCOME FUND
|
Financial Highlights (continued) Selected Share Data for a Share Outstanding Throughout Each Period |
| | | | | | | | | | | | | | | | | | | | | | | | | | | | | | | | | | |
| | | | | Multi-Manager Non-Core Fixed Income Fund | | |
| | | |
| | | | | Class R6 Shares | | |
| | | | | | | | |
| | | | | Six Months Ended | | | | | | | | | | | | |
| | | | | April 30, 2024 | | Year Ended October 31, | | |
| | | | | | | | |
| | | | | (Unaudited) | | 2023 | | 2022 | | 2021 | | 2020 | | 2019 | | |
| | | | | | | | |
| | Per Share Data | | | | | | | | | | | | | | | | | | | | | | | | | | | | | | | | |
| | | | | | | | |
| | Net asset value, beginning of period | | | $ | 7.26 | | | | $ | 7.13 | | | | $ | 8.91 | | | | $ | 8.70 | | | | $ | 9.06 | | | | $ | 8.83 | | | |
| | |
| | | | | | | | |
| | Net investment income(a) | | | | 0.28 | | | | | 0.56 | | | | | 0.43 | | | | | 0.43 | | | | | 0.45 | | | | | 0.54 | | | |
| | | | | | | | |
| | Net realized and unrealized gain (loss) | | | | 0.22 | | | | | 0.14 | | | | | (1.77 | ) | | | | 0.22 | | | | | (0.35 | ) | | | | 0.31 | | | |
| | |
| | | | | | | | |
| | Total from investment operations | | | | 0.50 | | | | | 0.70 | | | | | (1.34 | ) | | | | 0.65 | | | | | 0.10 | | | | | 0.85 | | | |
| | |
| | | | | | | | |
| | Distributions to shareholders from net investment income | | | | (0.29 | ) | | | | (0.55 | ) | | | | (0.24 | ) | | | | (0.41 | ) | | | | (0.40 | ) | | | | (0.55 | ) | | |
| | | | | | | | |
| | Distributions to shareholders from return of capital | | | | — | | | | | (0.02 | ) | | | | (0.20 | ) | | | | (0.03 | ) | | | | (0.06 | ) | | | | (0.07 | ) | | |
| | |
| | | | | | | | |
| | Total distributions | | | | (0.29 | ) | | | | (0.57 | ) | | | | (0.44 | ) | | | | (0.44 | ) | | | | (0.46 | ) | | | | (0.62 | ) | | |
| | |
| | | | | | | | |
| | Net asset value, end of period | | | $ | 7.47 | | | | $ | 7.26 | | | | $ | 7.13 | | | | $ | 8.91 | | | | $ | 8.70 | | | | $ | 9.06 | | | |
| | |
| | | | | | | | |
| | Total return(b) | | | | 6.91 | % | | | | 9.89 | % | | | | (15.42 | )% | | | | 7.47 | % | | | | 1.21 | % | | | | 9.03 | % | | |
| | |
| | | | | | | | |
| | Net assets, end of period (in 000s) | | | $ | 1,516,064 | | | | $ | 1,070,675 | | | | $ | 985,616 | | | | $ | 1,425,079 | | | | $ | 940,024 | | | | $ | 820,164 | | | |
| | | | | | | | |
| | Ratio of net expenses to average net assets | | | | 0.53 | %(c) | | | | 0.57 | % | | | | 0.56 | % | | | | 0.55 | % | | | | 0.60 | % | | | | 0.61 | % | | |
| | | | | | | | |
| | Ratio of total expenses to average net assets | | | | 1.00 | %(c) | | | | 1.02 | % | | | | 1.02 | % | | | | 0.98 | % | | | | 1.04 | % | | | | 1.05 | % | | |
| | | | | | | | |
| | Ratio of net investment income to average net assets | | | | 7.51 | %(c) | | | | 7.47 | % | | | | 5.32 | % | | | | 4.69 | % | | | | 5.20 | % | | | | 6.01 | % | | |
| | | | | | | | |
| | Portfolio turnover rate(d) | | | | 61 | % | | | | 101 | % | | | | 78 | % | | | | 96 | % | | | | 102 | % | | | | 150 | % | | |
| | |
| | (a) | Calculated based on the average shares outstanding methodology. |
| | (b) | Assumes investment at the NAV at the beginning of the period, reinvestment of all dividends and distributions, a complete redemption of the investment at the NAV at the end of the period and no sales or redemption charges (if any). Total returns would be reduced if a sales or redemption charge was taken into account. Returns do not reflect the impact of taxes to shareholders relating to Fund distributions or the redemption of Fund shares. Total returns for periods less than one full year are not annualized. |
| | (d) | The Fund’s portfolio turnover rate is calculated in accordance with regulatory requirements, without regard to transactions involving short term investments and certain derivatives. If such transactions were included, the Fund’s portfolio turnover rate may be higher. |
| | |
| The accompanying notes are an integral part of these financial statements. | | 71 |
GOLDMAN SACHS MULTI-MANAGER REAL ASSETS STRATEGY FUND
|
Financial Highlights (continued) Selected Share Data for a Share Outstanding Throughout Each Period |
| | | | | | | | | | | | | | | | | | | | | | | | | | | | | | | | | | |
| | | | | Multi-Manager Real Assets Strategy Fund | | |
| | | |
| | | | | Class R6 Shares | | |
| | | | | | | | |
| | | | | Six Months Ended | | | | | | | | | | | | |
| | | | | April 30, 2024 | | Year Ended October 31, | | |
| | | | | | | | |
| | | | | (Unaudited) | | 2023 | | 2022 | | 2021 | | 2020 | | 2019 | | |
| | | | | | | | |
| | Per Share Data | | | | | | | | | | | | | | | | | | | | | | | | | | | | | | | | |
| | | | | | | | |
| | Net asset value, beginning of period | | | $ | 8.21 | | | | $ | 8.95 | | | | $ | 11.76 | | | | $ | 8.93 | | | | $ | 10.78 | | | | $ | 9.24 | | | |
| | |
| | | | | | | | |
| | Net investment income(a) | | | | 0.13 | | | | | 0.23 | | | | | 0.20 | | | | | 0.22 | | | | | 0.19 | | | | | 0.22 | | | |
| | | | | | | | |
| | Net realized and unrealized gain (loss) | | | | 0.79 | | | | | (0.44 | ) | | | | (2.40 | ) | | | | 2.76 | | | | | (1.51 | ) | | | | 1.57 | | | |
| | |
| | | | | | | | |
| | Total from investment operations | | | | 0.92 | | | | | (0.21 | ) | | | | (2.20 | ) | | | | 2.98 | | | | | (1.32 | ) | | | | 1.79 | | | |
| | |
| | | | | | | | |
| | Distributions to shareholders from net investment income | | | | (0.22 | ) | | | | (0.11 | ) | | | | (0.35 | ) | | | | (0.15 | ) | | | | (0.35 | ) | | | | (0.20 | ) | | |
| | | | | | | | |
| | Distributions to shareholders from net realized gains | | | | — | | | | | (0.42 | ) | | | | (0.26 | ) | | | | — | | | | | (0.18 | ) | | | | (0.05 | ) | | |
| | |
| | | | | | | | |
| | Total distributions | | | | (0.22 | ) | | | | (0.53 | ) | | | | (0.61 | ) | | | | (0.15 | ) | | | | (0.53 | ) | | | | (0.25 | ) | | |
| | |
| | | | | | | | |
| | Net asset value, end of period | | | $ | 8.91 | | | | $ | 8.21 | | | | $ | 8.95 | | | | $ | 11.76 | | | | $ | 8.93 | | | | $ | 10.78 | | | |
| | |
| | | | | | | | |
| | Total return(b) | | | | 11.15 | % | | | | (2.88 | )% | | | | (19.78 | )% | | | | 33.70 | % | | | | (12.86 | )% | | | | 20.04 | % | | |
| | |
| | | | | | | | |
| | Net assets, end of period (in 000s) | | | $ | 796,890 | | | | $ | 572,530 | | | | $ | 415,219 | | | | $ | 733,307 | | | | $ | 459,950 | | | | $ | 449,938 | | | |
| | | | | | | | |
| | Ratio of net expenses to average net assets | | | | 0.69 | %(c) | | | | 0.76 | % | | | | 0.74 | % | | | | 0.69 | % | | | | 0.77 | % | | | | 0.81 | % | | |
| | | | | | | | |
| | Ratio of total expenses to average net assets | | | | 1.16 | %(c) | | | | 1.22 | % | | | | 1.21 | % | | | | 1.16 | % | | | | 1.21 | % | | | | 1.24 | % | | |
| | | | | | | | |
| | Ratio of net investment income to average net assets | | | | 2.83 | %(c) | | | | 2.56 | % | | | | 1.87 | % | | | | 2.08 | % | | | | 2.02 | % | | | | 2.23 | % | | |
| | | | | | | | |
| | Portfolio turnover rate(d) | | | | 39 | % | | | | 73 | % | | | | 104 | % | | | | 96 | % | | | | 92 | % | | | | 97 | % | | |
| | |
| | (a) | Calculated based on the average shares outstanding methodology. |
| | (b) | Assumes investment at the NAV at the beginning of the period, reinvestment of all dividends and distributions, a complete redemption of the investment at the NAV at the end of the period and no sales or redemption charges (if any). Total returns would be reduced if a sales or redemption charge was taken into account. Returns do not reflect the impact of taxes to shareholders relating to Fund distributions or the redemption of Fund shares. Total returns for periods less than one full year are not annualized. |
| | (d) | The Fund’s portfolio turnover rate is calculated in accordance with regulatory requirements, without regard to transactions involving short term investments and certain derivatives. If such transactions were included, the Fund’s portfolio turnover rate may be higher. |
| | |
| 72 | | The accompanying notes are an integral part of these financial statements. |
GOLDMAN SACHS STRATEGIC MULTI-ASSET CLASS FUNDS
|
Notes to Financial Statements April 30, 2024 (Unaudited) |
Goldman Sachs Trust II (the “Trust”) is a Delaware statutory trust registered under the Investment Company Act of 1940, as amended (the “Act”), as an open-end management investment company. The following table lists those series of the Trust that are included in this report (collectively, the “Funds” or individually a “Fund”), along with their corresponding share classes and respective diversification status under the Act:
| | | | |
| Fund | | Share Classes Offered | | Diversified/ Non-diversified |
| | |
| Goldman Sachs Multi-Manager Global Equity Fund | | Class R6 | | Diversified |
| | |
| Goldman Sachs Multi-Manager Non-Core Fixed Income Fund | | Class R6 | | Diversified |
| | |
| Goldman Sachs Multi-Manager Real Assets Strategy Fund | | Class R6 | | Diversified |
Goldman Sachs Asset Management, L.P. (“GSAM”), an affiliate of Goldman Sachs & Co. LLC (“Goldman Sachs”), serves as investment adviser to the Funds pursuant to management agreements (each, an “Agreement”) with the Trust. As of April 30, 2024, GSAM had sub-advisory agreements (the “Sub-Advisory Agreements”) for the Multi-Manager Global Equity Fund with Axiom Investors LLC, Boston Partners Global Investors, Inc., Causeway Capital Management LLC, Diamond Hill Capital Management Inc., GW&K Investment Management, LLC, Massachusetts Financial Services Company, doing business as MFS Investment Management, Principal Global Investors, LLC, T. Rowe Price Associates, Inc., Vaughan Nelson Investment Management, L.P., Vulcan Value Partners, LLC, WCM Investment Management, LLC and Wellington Management Company LLP; for the Multi-Manager Non-Core Fixed Income Fund with Ares Capital Management II LLC, Aristotle Pacific Capital, LLC (formerly Pacific Asset Management LLC), Brigade Capital Management, LP, Marathon Asset Management, L.P., Nuveen Asset Management, LLC, RBC Global Asset Management (UK) Limited, doing business as RBC BlueBay Asset Management (formerly BlueBay Asset Management LLP), RBC Global Asset Management (U.S.) Inc., doing business as RBC Global Asset Management and TCW Investment Management Company LLC; and for the Multi-Manager Real Assets Strategy Fund with Cohen & Steers Capital Management, Inc., Principal Real Estate Investors, LLC, PGIM Real Estate, a business unit of PGIM, Inc., and RREEF America L.L.C. (the “Underlying Managers”). Pursuant to the terms of the Sub-Advisory Agreements, the Underlying Managers are responsible for making investment decisions and managing the investments of the Fund. GSAM compensates the Underlying Managers directly in accordance with the terms of the Sub-Advisory Agreements. The Funds are not charged any separate or additional investment advisory fees by the Underlying Managers.
|
|
2. SIGNIFICANT ACCOUNTING POLICIES |
The financial statements have been prepared in accordance with accounting principles generally accepted in the United States of America (“GAAP”) and require management to make estimates and assumptions that may affect the reported amounts and disclosures. Actual results may differ from those estimates and assumptions. Each Fund is an investment company under GAAP and follows the accounting and reporting guidance applicable to investment companies.
A. Investment Valuation — The Funds’ valuation policy is to value investments at fair value.
B. Investment Income and Investments — Investment income includes interest income, dividend income and securities lending income, if any. Interest income is accrued daily and adjusted for amortization of premiums and accretion of discounts. Dividend income is recognized on ex-dividend date or, for certain foreign securities, as soon as such information is obtained subsequent to the ex-dividend date. Non-cash dividends, if any, are recorded at the fair market value of the securities received. Investment transactions are reflected on trade date. Realized gains and losses are calculated using identified cost. Investment transactions are recorded on the following business day for daily net asset value (“NAV”) calculations.
Investment income is recorded net of any foreign withholding taxes, less any amounts reclaimable. The Funds may file withholding tax reclaims in certain jurisdictions to recover a portion of amounts previously withheld. These reclaims, if any, are recorded when the amount is known and there are no significant uncertainties on collectability. Such amounts recovered, if any, are reflected as other income in the Statements of Operations. Any foreign capital gains tax is accrued daily based upon net unrealized
GOLDMAN SACHS STRATEGIC MULTI-ASSET CLASS FUNDS
|
Notes to Financial Statements (continued) April 30, 2024 (Unaudited) |
|
|
2. SIGNIFICANT ACCOUNTING POLICIES ( continued) |
gains, and is payable upon sale of such investments. Distributions received from the Funds’ investments in U.S. real estate investment trusts (“REITs”) may be characterized as ordinary income, net capital gain and/ or a return of capital. A return of capital is recorded by the Funds as a reduction to the cost basis of the REIT. For derivative contracts, unrealized gains and losses are recorded daily and become realized gains and losses upon disposition or termination of the contract. Upfront payments, if any, are made or received upon entering into a swap agreement and are reflected in the Statements of Assets and Liabilities. Upfront payments are recognized over the contract’s term/event as realized gains or losses, with the exception of forward starting swap contracts whose realized gains or losses are recognized from the effective start date.
C. Expenses — Expenses incurred directly by a Fund are charged to the Fund, and certain expenses incurred by the Trust are allocated across the applicable Funds on a straight-line and/or pro-rata basis, depending upon the nature of the expenses, and are accrued daily.
D. Federal Taxes and Distributions to Shareholders — It is each Fund’s policy to comply with the requirements of the Internal Revenue Code of 1986, as amended (the “Code”), applicable to regulated investment companies and to distribute each year substantially all of its investment company taxable income and capital gains to its shareholders. Accordingly, each Fund is not required to make any provisions for the payment of federal income tax. Distributions to shareholders are recorded on the ex-dividend date. Income and capital gains distributions, if any, are declared and paid according to the following schedule:
| | | | |
| Fund | | Income Distributions Declared/Paid | | Capital Gains Distributions Declared/Paid |
| | |
| Multi-Manager Global Equity Fund, Multi-Manager Real Assets Strategy Fund | | Annually | | Annually |
| | |
| Multi-Manager Non-Core Fixed Income Fund | | Daily/Monthly | | Annually |
Net capital losses, if any, are carried forward to future fiscal years and may be used to the extent allowed by the Code to offset any future capital gains. Losses that are carried forward will retain their character as either short-term or long-term capital losses. Utilization of capital loss carryforwards will reduce the requirement of future capital gains distributions.
The characterization of distributions to shareholders for financial reporting purposes is determined in accordance with federal income tax rules, which may differ from GAAP. The source of each Fund’s distributions may be shown in the accompanying financial statements as either from distributable earnings or capital. Certain components of the Funds’ net assets on the Statements of Assets and Liabilities reflect permanent GAAP/tax differences based on the appropriate tax character.
E. Foreign Currency Translation — The accounting records and reporting currency of a Fund are maintained in U.S. dollars. Assets and liabilities denominated in foreign currencies are translated into U.S. dollars using the current exchange rates at the close of each business day. The effect of changes in foreign currency exchange rates on investments is included within net realized and unrealized gain (loss) on investments. Changes in the value of other assets and liabilities as a result of fluctuations in foreign exchange rates are included in the Statements of Operations within net change in unrealized gain (loss) on foreign currency translation. Transactions denominated in foreign currencies are translated into U.S. dollars on the date the transaction occurred, the effects of which are included within net realized gain (loss) on foreign currency transactions.
F. Commission Recapture — GSAM, on behalf of certain Funds, may direct portfolio trades, subject to seeking best execution, to various brokers who have agreed to rebate a portion of the commissions generated. Such rebates are made directly to a Fund as cash payments and are included in net realized gain (loss) from investments on the Statements of Operations.
|
|
3. INVESTMENTS AND FAIR VALUE MEASUREMENTS |
U.S. GAAP defines the fair value of a financial instrument as the amount that would be received to sell an asset or paid to transfer a liability in an orderly transaction between market participants at the measurement date (i.e., the exit price); the Funds’ policy is to use the market approach. GAAP establishes a fair value hierarchy that prioritizes the inputs to valuation techniques used to measure fair value. The hierarchy gives the highest priority to unadjusted quoted prices in active markets for identical assets or
GOLDMAN SACHS STRATEGIC MULTI-ASSET CLASS FUNDS
|
|
3. INVESTMENTS AND FAIR VALUE MEASUREMENTS (continued) |
liabilities (Level 1 measurements) and the lowest priority to unobservable inputs (Level 3 measurements). The level in the fair value hierarchy within which the fair value measurement in its entirety falls shall be determined based on the lowest level input that is significant to the fair value measurement in its entirety. The levels used for classifying investments are not necessarily an indication of the risk associated with investing in these investments. The three levels of the fair value hierarchy are described below:
Level 1 — Unadjusted quoted prices in active markets that are accessible at the measurement date for identical, unrestricted assets or liabilities;
Level 2 — Quoted prices in markets that are not active or financial instruments for which significant inputs are observable (including, but not limited to, quoted prices for similar investments, interest rates, foreign exchange rates, volatility and credit spreads), either directly or indirectly;
Level 3 — Prices or valuations that require significant unobservable inputs (including GSAM’s assumptions in determining fair value measurement).
The Board of Trustees (“Trustees”) has approved Valuation Procedures that govern the valuation of the portfolio investments held by the Funds, including investments for which market quotations are not readily available. With respect to the Funds’ investments that do not have readily available market quotations, the Trustees have designated GSAM as the valuation designee to perform fair valuations pursuant to Rule 2a-5 under the Investment Company Act of 1940 (the “Valuation Designee”). GSAM has day-to-day responsibility for implementing and maintaining internal controls and procedures related to the valuation of the Funds’ investments. To assess the continuing appropriateness of pricing sources and methodologies, GSAM regularly performs price verification procedures and issues challenges as necessary to third party pricing vendors or brokers, and any differences are reviewed in accordance with the Valuation Procedures.
A. Level 1 and Level 2 Fair Value Investments — The valuation techniques and significant inputs used in determining the fair values for investments classified as Level 1 and Level 2 are as follows:
Equity Securities — Equity securities traded on a United States (“U.S.”) securities exchange or the NASDAQ system, or those located on certain foreign exchanges, including but not limited to the Americas, are valued daily at their last sale price or official closing price on the principal exchange or system on which they are traded. If there is no sale or official closing price or such price is believed by GSAM to not represent fair value, equity securities will be valued at the valid closing bid price for long positions and at the valid closing ask price for short positions (i.e., where there is sufficient volume, during normal exchange trading hours). If no valid bid/ask price is available, the equity security will be valued pursuant to the Valuation Procedures and consistent with applicable regulatory guidance. To the extent these investments are actively traded, they are classified as Level 1 of the fair value hierarchy, otherwise they are generally classified as Level 2. Certain equity securities containing unique attributes may be classified as Level 2.
Unlisted equity securities for which market quotations are available are valued at the last sale price on the valuation date, or if no sale occurs, at the last bid price for long positions or the last ask price for short positions, and are generally classified as Level 2. Securities traded on certain foreign securities exchanges are valued daily at fair value determined by an independent fair value service (if available) under the Valuation Procedures and consistent with applicable regulatory guidance. The independent fair value service takes into account multiple factors including, but not limited to, movements in the securities markets, certain depositary receipts, futures contracts and foreign currency exchange rates that have occurred subsequent to the close of the foreign securities exchange. These investments are generally classified as Level 2 of the fair value hierarchy.
Underlying Funds (including Money Market Funds) — Underlying funds (“Underlying Funds”) include exchange-traded funds (“ETFs”) and other investment companies. Investments in the Underlying Funds (except ETFs) are valued at the NAV per share on the day of valuation. ETFs are valued daily at the last sale price or official closing price on the principal exchange or system on which the investment is traded. Because the Funds invest in Underlying Funds that fluctuate in value, the Funds’ shares will correspondingly fluctuate in value. Underlying Funds are generally classified as Level 1 of the fair value hierarchy. To the extent that underlying ETFs are actively traded, they are classified as Level 1 of the fair value hierarchy, otherwise they are
GOLDMAN SACHS STRATEGIC MULTI-ASSET CLASS FUNDS
|
Notes to Financial Statements (continued) April 30, 2024 (Unaudited) |
|
|
3. INVESTMENTS AND FAIR VALUE MEASUREMENTS (continued) |
generally classified as Level 2. For information regarding an Underlying Fund’s accounting policies and investment holdings, please see the Underlying Fund’s shareholder report.
Debt Securities — Debt securities for which market quotations are readily available are valued daily on the basis of quotations supplied by dealers or an independent pricing service. The pricing services may use valuation models or matrix pricing, which consider: (i) yield or price with respect to bonds that are considered comparable in characteristics such as rating, interest rate and maturity date or (ii) quotations from securities dealers to determine current value. With the exception of treasury securities of G7 countries, which are generally classified as Level 1, these investments are generally classified as Level 2 of the fair value hierarchy.
i. Bank Loans — Bank loans (“Loans”) are interests in amounts owed by corporate, governmental, or other borrowers to lenders or lending syndicates. Loans are arranged through private negotiations between the borrower and one or more financial institutions (“Lenders”). A Fund’s investments in Loans are in the form of either participations in Loans (“Participations”) or assignments of all or a portion of Loans from third parties (“Assignments”). With respect to Participations, a Fund has the right to receive payments of principal, interest and any fees to which it is entitled from the Lender selling the Participations and only upon receipt by the Lender of the payments from the borrower. A Fund generally has no right to enforce compliance by the borrower with the terms of the loan agreement with respect to Participations. Conversely, assignments result in a Fund having a direct contractual relationship with the borrower, and the Fund may be permitted to enforce compliance by the borrower with the terms of the loan agreement.
Derivative Contracts — A derivative is an instrument whose value is derived from underlying assets, indices, reference rates or a combination of these factors. A Fund enters into derivative transactions to hedge against changes in interest rates, securities prices, and/or currency exchange rates, to increase total return, or to gain access to certain markets or attain exposure to other underliers. For financial reporting purposes, cash collateral that has been pledged to cover obligations of a Fund and cash collateral received, if any, is reported separately on the Statements of Assets and Liabilities as either due to broker/receivable for collateral on certain derivative contracts. Non-cash collateral pledged by a Fund, if any, is noted in the Schedules of Investments.
Exchange-traded derivatives, including futures and options contracts, are generally valued at the last sale or settlement price on the exchange where they are principally traded. Exchange-traded options without settlement prices are generally valued at the midpoint of the bid and ask prices on the exchange where they are principally traded (or, in the absence of two-way trading, at the last bid price for long positions and the last ask price for short positions). Exchange-traded derivatives typically fall within Level 1 of the fair value hierarchy. Over-the-counter (“OTC”) and centrally cleared derivatives are valued using market transactions and other market evidence, including market-based inputs to models, calibration to market-clearing transactions, broker or dealer quotations, or other alternative pricing sources. Where models are used, the selection of a particular model to value OTC and centrally cleared derivatives depends upon the contractual terms of, and specific risks inherent in, the instrument, as well as the availability of pricing information in the market. Valuation models require a variety of inputs, including contractual terms, market prices, yield curves, credit curves, measures of volatility, voluntary and involuntary prepayment rates, loss severity rates and correlations of such inputs. For OTC and centrally cleared derivatives that trade in liquid markets, model inputs can generally be verified and model selection does not involve significant management judgment. OTC and centrally cleared derivatives are classified within Level 2 of the fair value hierarchy when significant inputs are corroborated by market evidence.
i. Forward Contracts — A forward contract is a contract between two parties to buy or sell an asset at a specified price on a future date. A forward contract settlement can occur on a cash or delivery basis. Forward contracts are marked-to-market daily using independent vendor prices, and the change in value, if any, is recorded as an unrealized gain or loss. Cash and certain investments may be used to collateralize forward contracts.
A forward foreign currency exchange contract is a forward contract in which a Fund agrees to receive or deliver a fixed quantity of one currency for another, at a pre-determined price at a future date. All forward foreign currency exchange contracts are marked to market daily by using the outright forward rates or interpolating based upon maturity dates, where available. Non-deliverable forward foreign currency exchange contracts are settled with the counterparty in cash without the delivery of foreign currency.
GOLDMAN SACHS STRATEGIC MULTI-ASSET CLASS FUNDS
|
|
3. INVESTMENTS AND FAIR VALUE MEASUREMENTS (continued) |
ii. Futures Contracts — Futures contracts are contracts to buy or sell a standardized quantity of a specified commodity or security. Upon entering into a futures contract, a Fund deposits cash or securities in an account on behalf of the broker in an amount sufficient to meet the initial margin requirement. Subsequent payments are made or received by a Fund equal to the daily change in the contract value and are recorded as variation margin receivable or payable with a corresponding offset to unrealized gains or losses.
iii. Options — When a Fund writes call or put options, an amount equal to the premium received is recorded as a liability and is subsequently marked-to-market to reflect the current value of the option written. Swaptions are options on swap contracts.
Upon the purchase of a call option or a put option by a Fund, the premium paid is recorded as an investment and subsequently marked-to-market to reflect the current value of the option. Certain options may be purchased with premiums to be determined on a future date. The premiums for these options are based upon implied volatility parameters at specified terms.
iv. Swap Contracts — Bilateral swap contracts are agreements in which a Fund and a counterparty agree to exchange periodic payments on a specified notional amount or make a net payment upon termination. Bilateral swap transactions are privately negotiated in the OTC market and payments are settled through direct payments between a Fund and the counterparty. By contrast, certain swap transactions are subject to mandatory central clearing. These swaps are executed through a derivatives clearing member (“DCM”), acting in an agency capacity, and submitted to a central counterparty (“CCP”) (“centrally cleared swaps”), in which case all payments are settled with the CCP through the DCM. Swaps are marked-to-market daily using pricing vendor quotations, counterparty or clearinghouse prices or model prices, and the change in value, if any, is recorded as an unrealized gain or loss. Upon entering into a swap contract, a Fund is required to satisfy an initial margin requirement by delivering cash or securities to the counterparty (or in some cases, segregated in a triparty account on behalf of the counterparty), which can be adjusted by any mark-to-market gains or losses pursuant to bilateral or centrally cleared arrangements. For centrally cleared swaps the daily change in valuation, if any, is recorded as a receivable or payable for variation margin.
A credit default swap is an agreement that involves one party (the buyer of protection) making a stream of payments to another party (the seller of protection) in exchange for the right to receive protection on a reference security or obligation, including a group of assets or exposure to the performance of an index. A Fund’s investment in credit default swaps may involve greater risks than if the Fund had invested in the referenced obligation directly. Credit events are contract specific but may include bankruptcy, failure to pay, restructuring and obligation acceleration. If a Fund buys protection through a credit default swap and no credit event occurs, its payments are limited to the periodic payments previously made to the counterparty. Upon the occurrence of a specified credit event, a Fund, as a buyer of credit protection, is entitled to receive an amount equal to the notional amount of the swap and deliver to the seller the defaulted reference obligation in a physically settled trade. A Fund may also receive a net settlement amount in the form of cash or securities equal to the notional amount of the swap reduced by the recovery value of the reference obligation in a cash settled trade.
As a seller of protection, a Fund generally receives a payment stream throughout the term of the swap, provided that there is no credit event. In addition, if a Fund sells protection through a credit default swap, the Fund could suffer a loss because the value of the referenced obligation and the premium payments received may be less than the notional amount of the swap paid to the buyer of protection. Upon the occurrence of a specified credit event, a Fund, as a seller of credit protection, may be required to take possession of the defaulted reference obligation and pay the buyer an amount equal to the notional amount of the swap in a physically settled trade. A Fund may also pay a net settlement amount in the form of cash or securities equal to the notional amount of the swap reduced by the recovery value of the reference obligation in a cash settled trade. Recovery values are at times established through the credit event auction process in which market participants are ensured that a transparent price has been set for the defaulted security or obligation. In addition, a Fund is entitled to a return of any assets, which have been pledged as collateral to the counterparty upon settlement.
GOLDMAN SACHS STRATEGIC MULTI-ASSET CLASS FUNDS
|
Notes to Financial Statements (continued) April 30, 2024 (Unaudited) |
|
|
3. INVESTMENTS AND FAIR VALUE MEASUREMENTS (continued) |
The maximum potential amount of future payments (undiscounted) that a Fund as seller of protection could be required to make under a credit default swap would be an amount equal to the notional amount of the agreement. These potential amounts would be partially offset by any recovery values of the respective referenced obligations or net amounts received from a settlement of a credit default swap for the same reference security or obligation where a Fund bought credit protection.
B. Level 3 Fair Value Investments — To the extent that significant inputs to valuation models and other alternative pricing sources are unobservable, or if quotations are not readily available, or if GSAM believes that such quotations do not accurately reflect fair value, the fair value of a Fund’s investments may be determined under the Valuation Procedures. GSAM, consistent with its procedures and applicable regulatory guidance, may make an adjustment to the most recent valuation prices of either domestic or foreign securities in light of significant events to reflect what it believes to be the fair value of the securities at the time of determining a Fund’s NAV. To the extent investments are valued using single source broker quotations obtained directly from the broker or passed through from third party pricing vendors, such investments are classified as Level 3 investments.
C. Fair Value Hierarchy — The following is a summary of the Funds’ investments and derivatives classified in the fair value hierarchy as of April 30, 2024:
| | | | | | | | | | | | |
| MULTI-MANAGER GLOBAL EQUITY FUND | | | | | | | | | | | | |
| | | |
| Investment Type | | Level 1 | | | Level 2 | | | Level 3 | |
|
| |
| | | |
Assets | | | | | | | | | | | | |
| | | |
Common Stock and/or Other Equity Investments(a) | | | | | | | | | | | | |
| | | |
Africa | | $ | 488,155 | | | $ | 415,510 | | | $ | — | |
| | | |
Asia | | | 16,141,088 | | | | 130,453,647 | | | | — | |
| | | |
Australia and Oceania | | | — | | | | 2,453,664 | | | | — | |
| | | |
Europe | | | 32,612,071 | | | | 184,171,498 | | | | — | |
| | | |
North America | | | 619,803,578 | | | | 278,088 | | | | — | |
| | | |
South America | | | 7,104,646 | | | | — | | | | — | |
| | | |
Preferred Stocks | | | — | | | | 3,220,352 | | | | — | |
| | | |
Exchange Traded Funds | | | 2,954,844 | | | | — | | | | — | |
| | | |
Investment Companies | | | 82,444,361 | | | | — | | | | — | |
|
| |
| | | |
Total | | $ | 761,548,743 | | | $ | 320,992,759 | | | $ | — | |
|
| |
| | | |
| Derivative Type | | | | | | | | | |
|
| |
| | | |
Assets(b) | | | | | | | | | | | | |
| | | |
Forward Foreign Currency Exchange Contracts | | $ | — | | | $ | 3,576,584 | | | $ | — | |
|
| |
| | | |
Liabilities(b) | | | | | | | | | | | | |
| | | |
Forward Foreign Currency Exchange Contracts | | $ | — | | | $ | (636,268 | ) | | $ | — | |
| | | |
Futures Contracts | | | (2,254,531 | ) | | | — | | | | — | |
|
| |
| | | |
Total | | $ | (2,254,531 | ) | | $ | (636,268 | ) | | $ | — | |
|
| |
| | (a) | Amounts are disclosed by continent to highlight the impact of time zone differences between local market close and the calculation of net asset value. Security valuations are based on the principal exchange or system on which they are traded, which may differ from country of domicile. The Funds utilize fair value model prices provided by an independent fair value service for international equities, resulting in a Level 2 classification. |
| | (b) | Amount shown represents unrealized gain (loss) at period end. |
GOLDMAN SACHS STRATEGIC MULTI-ASSET CLASS FUNDS
|
|
3. INVESTMENTS AND FAIR VALUE MEASUREMENTS (continued) |
| | | | | | | | | | | | |
| Multi-Manager Non-Core Fixed Income Fund | | | | | | | | | | | | |
| | | |
| Investment Type | | Level 1 | | | Level 2 | | | Level 3 | |
|
| |
| | | |
Assets | | | | | | | | | | | | |
| | | |
Fixed Income | | | | | | | | | | | | |
| | | |
Sovereign Debt Obligations | | $ | — | | | $ | 549,075,533 | | | $ | — | |
| | | |
Corporate Obligations | | | — | | | | 448,820,130 | | | | 5,078,686 | |
| | | |
Bank Loans | | | — | | | | 342,665,123 | | | | 6,690,181 | |
| | | |
Asset-Backed Securities | | | — | | | | 2,012,925 | | | | — | |
| | | |
Unfunded Loan Committments(a) | | | — | | | | 38,193 | | | | — | |
| | | |
Common Stock and/or Other Equity Investments(b) | | | | | | | | | | | | |
| | | |
Europe | | | 152,564 | | | | — | | | | — | |
| | | |
North America | | | 360,705 | | | | 1,644,101 | | | | 2,765,211 | |
| | | |
Warrants | | | — | | | | 3,845 | | | | 166,976 | |
| | | |
Preferred Stocks | | | — | | | | — | | | | 9,504 | |
| | | |
Exchange Traded Funds | | | 5,080,609 | | | | — | | | | — | |
| | | |
Investment Company | | | 126,579,537 | | | | — | | | | — | |
|
| |
| | | |
Total | | $ | 132,173,415 | | | $ | 1,344,259,850 | | | $ | 14,710,558 | |
|
| |
| | | |
| Derivative Type | | | | | | | | | |
|
| |
| | | |
Assets | | | | | | | | | | | | |
| | | |
Forward Foreign Currency Exchange Contracts(a) | | $ | — | | | $ | 2,457,608 | | | $ | — | |
| | | |
Credit Default Swap Contracts(a) | | | — | | | | 63,304 | | | | — | |
| | | |
Purchased Option Contracts | | | — | | | | 304,434 | | | | — | |
|
| |
| | | |
Total | | $ | — | | | $ | 2,825,346 | | | $ | — | |
|
| |
| | | |
Liabilities | | | | | | | | | | | | |
| | | |
Forward Foreign Currency Exchange Contracts(a) | | $ | — | | | $ | (2,250,626 | ) | | $ | — | |
| | | |
Credit Default Swap Contracts(a) | | | — | | | | (133,935 | ) | | | — | |
| | | |
Written Option Contracts | | | — | | | | (76,986 | ) | | | — | |
|
| |
| | | |
Total | | $ | — | | | $ | (2,461,547 | ) | | $ | — | |
|
| |
| | (a) | Amount shown represents unrealized gain (loss) at period end. |
| | (b) | Amounts are disclosed by continent to highlight the impact of time zone differences between local market close and the calculation of net asset value. Security valuations are based on the principal exchange or system on which they are traded, which may differ from country of domicile. The Funds utilize fair value model prices provided by an independent fair value service for international equities, resulting in a Level 2 classification. |
GOLDMAN SACHS STRATEGIC MULTI-ASSET CLASS FUNDS
|
Notes to Financial Statements (continued) April 30, 2024 (Unaudited) |
|
|
3. INVESTMENTS AND FAIR VALUE MEASUREMENTS (continued) |
| | | | | | | | | | | | |
| Multi-Manager Real Assets Strategy Fund | | | | | | | | | | | | |
| | | |
| Investment Type | | Level 1 | | | Level 2 | | | Level 3 | |
|
| |
| | | |
Assets | | | | | | | | | | | | |
| | | |
Common Stock and/or Other Equity Investments(a) | | | | | | | | | | | | |
| | | |
Asia | | $ | 4,456,412 | | | $ | 86,825,420 | | | $ | — | |
| | | |
Australia and Oceania | | | — | | | | 30,688,110 | | | | — | |
| | | |
Europe | | | 5,597,665 | | | | 131,303,328 | | | | — | |
| | | |
North America | | | 509,173,487 | | | | — | | | | — | |
| | | |
South America | | | 2,474,170 | | | | — | | | | — | |
| | | |
Investment Company | | | 20,870,161 | | | | — | | | | — | |
|
| |
| | | |
Total | | $ | 542,571,895 | | | $ | 248,816,858 | | | $ | — | |
|
| |
| | | |
| Derivative Type | | | | | | | | | |
|
| |
| | | |
Assets | | | | | | | | | | | | |
| | | |
Forward Foreign Currency Exchange Contracts | | $ | — | | | $ | 1,134 | | | $ | — | |
|
| |
| | | |
Liabilities(b) | | | | | | | | | | | | |
| | | |
Futures Contracts | | $ | (1,447,517 | ) | | $ | — | | | $ | — | |
|
| |
| | (a) | Amounts are disclosed by continent to highlight the impact of time zone differences between local market close and the calculation of net asset value. Security valuations are based on the principal exchange or system on which they are traded, which may differ from country of domicile. The Funds utilize fair value model prices provided by an independent fair value service for international equities, resulting in a Level 2 classification. |
| | (b) | Amount shown represents unrealized gain (loss) at period end. |
For further information regarding security characteristics, see the Schedules of Investments.
|
|
4. INVESTMENTS IN DERIVATIVES |
The following tables set forth, by certain risk types, the gross value of derivative contracts (not considered to be hedging instruments for accounting disclosure purposes) as of April 30, 2024. These instruments were used as part of the Funds’ investment strategies and to obtain and/or manage exposure related to the risks below. The values in the table below excludes the effects of cash collateral received or posted pursuant to these derivative contracts, and therefore are not representative of the Funds’ net exposure.
| | | | | | | | | | | | |
| Multi-Manager Global Equity Fund | | | | | | | | | | |
| | | | |
| Risk | | Statements of Assets and Liabilities | | Assets | | | Statements of Assets and Liabilities | | Liabilities | |
| | | | |
| Currency | | Receivable for unrealized gain on forward foreign currency exchange contracts | | $ | 3,576,584 | | | Payable for unrealized loss on forward foreign currency exchange contracts | | $ | (636,268 | ) |
| | | | |
| Equity | | — | | | — | | | Variation margin on futures contracts | | | (2,254,531 | )(a) |
| | | | |
Total | | | | $ | 3,576,584 | | | | | $ | (2,890,799 | ) |
GOLDMAN SACHS STRATEGIC MULTI-ASSET CLASS FUNDS
|
|
4. INVESTMENTS IN DERIVATIVES ( continued) |
| | | | | | | | | | | | |
| Multi-Manager Non-Core Fixed Income Fund | | | | | | | | | | |
| | | | |
| Risk | | Statements of Assets and Liabilities | | Assets | | | Statements of Assets and Liabilities | | Liabilities | |
| | | | |
| Credit | | Variation margin on swap contracts | | $ | 63,304 | (a) | | Variation margin on swap contracts | | $ | (133,935 | )(a) |
| | | | |
| Currency | | Receivable for unrealized gain on forward foreign currency exchange contracts and purchased options | | | 2,762,042 | | | Payable for unrealized loss on forward foreign currency exchange contracts and written options | | | (2,327,612 | ) |
| | | | |
Total | | | | $ | 2,825,346 | | | | | $ | (2,461,547 | ) |
| | | |
| Multi-Manager Real Assets Strategy Fund | | | | | | | | | | |
| | | | |
| Risk | | Statements of Assets and Liabilities | | Assets | | | Statements of Assets and Liabilities | | Liabilities | |
| | | | |
| Currency | | Receivable for unrealized gain on forward foreign currency contracts | | $ | 1,134 | | | — | | $ | — | |
| | | | |
| Equity | | — | | | — | | | Variation margin on futures contracts | | | (1,447,517 | )(a) |
| | | | |
Total | | | | $ | 1,134 | | | | | $ | (1,447,517 | ) |
| | (a) | Includes unrealized gain (loss) on futures contracts and centrally cleared swaps described in the Additional Investment Information sections of the Schedules of Investments. Only current day’s variation margin is reported within the Statements of Assets and Liabilities. |
The following table sets forth, by certain risk types, the Funds’ gains (losses) related to these derivatives and their indicative volumes for the six months ended April 30, 2024. These gains (losses) should be considered in the context that these derivative contracts may have been executed to create investment opportunities and/or economically hedge certain investments, and accordingly, certain gains (losses) on such derivative contracts may offset certain (losses) gains attributable to investments. These gains (losses) are included in “Net realized gain (loss)” or “Net change in unrealized gain (loss)” on the Statements of Operations:
| | | | | | | | | | |
| Multi-Manager Global Equity Fund | | | | | | | | |
| | | |
| Risk | | Statements of Operations | | Net Realized Gain (Loss) | | | Net Change in
Unrealized
Gain (Loss) | |
| | | |
| Currency | | Net realized gain (loss) from forward foreign currency exchange contracts/Net unrealized gain (loss) on forward foreign currency exchange contracts | | | $ 441,172 | | | | $1,909,721 | |
| | | |
| Equity | | Net realized gain (loss) from futures contracts/Net change in unrealized gain (loss) on futures contracts | | | 7,458,358 | | | | 1,930,674 | |
| | | |
Total | | | | | $7,899,530 | | | | $3,840,395 | |
GOLDMAN SACHS STRATEGIC MULTI-ASSET CLASS FUNDS
|
Notes to Financial Statements (continued) April 30, 2024 (Unaudited) |
|
|
4. INVESTMENTS IN DERIVATIVES ( continued) |
| | | | | | | | | | | | |
| Multi-Manager Non-Core Fixed Income Fund | | | | | | | | | | |
| | | |
| Risk | | Statements of Operations | | Net Realized Gain (Loss) | | Net Change in
Unrealized
Gain (Loss) |
| | | |
| Credit | | Net realized gain (loss) from swap contracts/ Net change in unrealized gain (loss) on swap contracts | | | $ | 2,858,840 | | | | $ | (113,269 | ) |
| | | |
| Currency | | Net realized gain (loss) from purchased options, written options and forward foreign currency exchange contracts/ Net change in unrealized gain (loss) on purchased options, written options and forward foreign currency exchange contracts | | | | 319,872 | | | | | 1,211,835 | |
| | | |
| Interest rate | | Net realized gain (loss) from futures contracts / Net change in unrealized gain (loss) on futures contracts | | | | (52,196 | ) | | | | 80,178 | |
| | | |
Total | | | | | $ | 3,126,516 | | | | $ | 1,178,744 | |
| | |
| Multi-Manager Real Assets Strategy Fund | | | | | | | | | | |
| | | |
| Risk | | Statements of Operations | | Net Realized Gain (Loss) | | Net Change in
Unrealized
Gain (Loss) |
| | | |
| Currency | | Net realized gain (loss) from forward foreign currency exchange contracts | | | $ | 22,195 | | | | $ | 1,134 | |
| | | |
| Equity | | Net realized gain (loss) from futures contracts/Net change in unrealized gain (loss) on futures contracts | | | | 734,345 | | | | | (118,011 | ) |
| | | |
Total | | | | | $ | 756,540 | | | | $ | (116,877 | ) |
For the six months ended April 30, 2024, the relevant values for each derivative type were as follows:
| | | | | | | | | | | | | | | | | | | | |
| | | Average Number of Contracts(a) | |
| |
| | | | |
| | | | | |
| Fund | | Futures Contracts | | | Forward Contracts | | | Swap Agreements | | | Purchased Options | | | Written Options | |
|
| |
| | | | | |
Multi-Manager Global Equity Fund | | | 348 | | | $ | 331,051,305 | | | $ | — | | | | — | | | | — | |
|
| |
| | | | | |
Multi-Manager Non-Core Fixed Income Fund | | | 4 | | | | 223,621,598 | | | | 36,139,000 | | | | 29,841,000 | | | | 37,066,000 | |
|
| |
| | | | | |
Multi-Manager Real Assets Strategy Fund | | | 411 | | | | 2,022,250 | | | | — | | | | — | | | | — | |
|
| |
| | (a) | Amounts disclosed represent average number of contracts for futures contracts, notional amounts for forward contracts, swaptions, swap agreements, purchased and written swaptions, or shares/units outstanding for purchased options and written options, based on absolute values, which is indicative of volume for this derivative type, for the months that the Fund held such derivatives during the six months ended April 30, 2024. |
|
|
5. AGREEMENTS AND AFFILIATED TRANSACTIONS |
A. Management Agreement — Under the Agreement, GSAM manages the Funds, subject to the general supervision of the Trustees.
As compensation for the services rendered pursuant to the Agreement, the assumption of the expenses related thereto and administration of the Funds’ business affairs, including providing facilities, GSAM is entitled to a management fee, accrued daily and paid monthly, equal to an annual percentage rate of each Fund’s average daily net assets.
GOLDMAN SACHS STRATEGIC MULTI-ASSET CLASS FUNDS
|
|
5. AGREEMENTS AND AFFILIATED TRANSACTIONS ( continued) |
For the six months ended April 30, 2024, contractual and effective net management fees with GSAM were at the following rates:
| | | | | | | | | | | | | | | | | | | | | | | | | | | | |
| | | | | | | |
| Fund | | First
$1 billion | | | Next
$1 billion | | | Next
$3 billion | | | Next
$3 billion | | | Over
$8 billion | | | Effective
Rate | | | Effective Net
Management
Rate^* | |
|
| |
| | | | | | | |
Multi-Manager Global Equity Fund | | | 1.03 | % | | | 0.93 | % | | | 0.89 | % | | | 0.87 | % | | | 0.84 | % | | | 1.03 | % | | | 0.38% | |
|
| |
| | | | | | | |
Multi-Manager Non-Core Fixed Income Fund | | | 0.85 | | | | 0.85 | | | | 0.77 | | | | 0.73 | | | | 0.71 | | | | 0.85 | | | | 0.38 | |
|
| |
| | | | | | | |
Multi-Manager Real Assets Strategy Fund | | | 1.00 | | | | 0.90 | | | | 0.86 | | | | 0.84 | | | | 0.82 | | | | 1.00 | | | | 0.54 | |
|
| |
| | * | GSAM has agreed to waive a portion of its management fee for each Fund in order to achieve an effective net management fee rate that is equal to the actual cost of fees paid to the Fund’s Underlying Managers. These arrangements will remain in effect through at least February 28, 2025, and prior to such date GSAM may not terminate the arrangements without the approval of the Board of Trustees. |
| | ^ | Effective Net Management Rate includes the impact of management fee waivers of affiliated underlying funds, if any. |
The Funds invest in Institutional Shares and/or Class R6 Shares of the Goldman Sachs Financial Square Government Fund, which is an affiliated Underlying Fund. GSAM has agreed to waive a portion of its management fee payable by the Funds in an amount equal to the management fee it earns as an investment adviser to the affiliated Underlying Fund in which the Funds invest. For the six months ended April 30, 2024, GSAM waived $54,717, $68,026 and $14,918 of the Multi-Manager Global Equity, Multi-Manager Non-Core Fixed Income and Multi-Manager Real Assets Strategy Funds’ management fees, respectively.
B. Transfer Agency Agreement — Goldman Sachs also serves as the transfer agent of the Funds for a fee pursuant to the Transfer Agency Agreement. The fees charged for such transfer agency services are accrued daily and paid monthly at annual rates of 0.02% of the average daily net assets of Class R6 Shares.
C. Other Expense Agreements and Affiliated Transactions — GSAM has agreed to reduce or limit each Fund’s “Total Annual Operating Expenses” (excluding acquired fund fees and expenses, taxes, interest, brokerage fees, expenses of shareholder meetings, litigation and indemnification, and extraordinary expenses) to the extent such expenses exceed, on an annual basis, a percentage rate of the average daily net assets of each Fund. Such Total Annual Operating Expense reimbursements, if any, are accrued daily and paid monthly. In addition, the Funds are not obligated to reimburse GSAM for prior fiscal year expense reimbursements, if any. The Total Annual Operating Expense limitations as an annual percentage rate of average daily net assets for the Multi-Manager Global Equity Fund, Multi-Manager Non-Core Fixed Income Fund and Multi-Manager Real Assets Strategy Fund are 0.75%, 0.70%, and 0.90%, respectively. In addition, GSAM has agreed to reduce or limit certain “Other Expenses” of the Multi-Manager Global Equity Fund (excluding acquired fund fees and expenses, transfer agency fees and expenses, service fees, taxes, interest, brokerage fees, expenses of shareholder meetings, litigation and indemnification, and extraordinary expenses) to 0.10% of its average daily net assets. The Total Annual Operating Expenses and Other Expense limitations will remain in place through at least February 28, 2025, and prior to such date GSAM may not terminate the arrangements without the approval of the Trustees. In addition, the Funds have entered into certain offset arrangements with the transfer agent, which may result in a reduction of the Funds’ expenses and are received irrespective of the application of the “Other Expense” limitations described above.
GOLDMAN SACHS STRATEGIC MULTI-ASSET CLASS FUNDS
|
Notes to Financial Statements (continued) April 30, 2024 (Unaudited) |
|
|
5. AGREEMENTS AND AFFILIATED TRANSACTIONS (continued) |
For the six months ended April 30, 2024, these expense reductions, including any fee waivers and Other Expense reimbursements, were as follows:
| | | | | | | | | | | | |
| Fund | | Management
Fee Waiver | | | Other Expense
Reimbursements | | | Total Expense
Reductions | |
|
| |
| | | |
Multi-Manager Global Equity Fund | | | $2,971,772 | | | | $538,130 | | | | $3,509,902 | |
|
| |
| | | |
Multi-Manager Non-Core Fixed Income Fund | | | 2,895,347 | | | | — | | | | 2,895,347 | |
|
| |
| | | |
Multi-Manager Real Assets Strategy Fund | | | 1,572,527 | | | | — | | | | 1,572,527 | |
|
| |
D. Line of Credit Facility — As of April 30, 2024, the Funds participated in a $1,150,000,000 committed, unsecured revolving line of credit facility (the “facility”) together with other funds of the Trust and certain registered investment companies having management agreements with GSAM or its affiliates. This facility is to be used for temporary emergency purposes, or to allow for an orderly liquidation of securities to meet redemption requests. The interest rate on borrowings is based on the federal funds rate. The facility also requires a fee to be paid by the Funds based on the amount of the commitment that has not been utilized. For the six months ended April 30, 2024, the Funds did not have any borrowings under the facility. Prior to April 16, 2024, the facility was $1,110,000,000.
E. Other Transactions with Affiliates — For the six months ended April 30, 2024, Goldman Sachs earned $350, $29, and $2,226 in brokerage commissions from portfolio transactions, including futures transactions executed with Goldman Sachs as the Futures Commission Merchant, on behalf of the Multi-Manager Global Equity Fund, Multi-Manager Non-Core Fixed Income Fund and Multi-Manager Real Assets Strategy Fund, respectively.
The following table provides information about the Funds’ investments in the Goldman Sachs Financial Square Government Fund as of and for the six months ended April 30, 2024:
| | | | | | | | | | | | | | | | | | | | | | | | | | |
| Fund | | Underlying Fund | | Market Value as of
October 31, 2023 | | | Purchases at Cost | | | Proceeds from Sales | | | Market Value as of April 30, 2024 | | | Shares as of
April 30, 2024 | | | Dividend
Income | |
|
| |
| | | | | | | |
Multi-Manager Global Equity Fund | | Goldman Sachs Financial Square Government Fund — Class R6 | | | $24,443,593 | | | $ | 62,308,233 | | | $ | (46,478,266 | ) | | $ | 40,273,560 | | | | 40,273,560 | | | $ | 849,128 | |
|
| |
| | | | | | | |
| | Goldman Sachs Financial Square Government Fund — Institutional Shares | | | 35,857,520 | | | | 277,870,301 | | | | (271,557,020 | ) | | | 42,170,801 | | | | 42,170,801 | | | | 949,802 | |
|
| |
| | | | | | | |
Multi-Manager Non-Core Fixed Income Fund | | Goldman Sachs Financial Square Government Fund — Institutional Shares | | | 78,435,092 | | | | 981,875,492 | | | | (933,731,047 | ) | | | 126,579,537 | | | | 126,579,537 | | | | 2,229,328 | |
|
| |
| | | | | | | |
Multi-Manager Real Assets Strategy Fund | | Goldman Sachs Financial Square Government Fund — Institutional Shares | | | 12,559,159 | | | | 255,228,474 | | | | (246,917,472 | ) | | | 20,870,161 | | | | 20,870,161 | | | | 493,368 | |
|
| |
GOLDMAN SACHS STRATEGIC MULTI-ASSET CLASS FUNDS
|
|
6. PORTFOLIO SECURITIES TRANSACTIONS |
The cost of purchases and proceeds from sales and maturities of long-term securities for the six months ended April 30, 2024, were as follows:
| | | | | | | | | | | | | | | | |
| Fund | | Purchases of
Government
Securities | | | Purchases
Excluding
Government
Securities | | | Sales of
Government
Securities | | | Sales Excluding
Government
Securities | |
|
| |
| | | | |
Multi-Manager Global Equity Fund | | | $ — | | | | $ 484,279,570 | | | | $ — | | | | $299,460,173 | |
|
| |
| | | | |
Multi-Manager Non-Core Fixed Income Fund | | | 4,920,664 | | | | 1,018,576,813 | | | | 4,918,105 | | | | 699,660,804 | |
|
| |
| | | | |
Multi-Manager Real Assets Strategy Fund | | | — | | | | 442,947,272 | | | | — | | | | 261,051,125 | |
|
| |
As of the Funds’ most recent fiscal year end, October 31, 2023, the Funds’ capital loss carryforwards and certain timing differences on a tax basis were as follows:
| | | | | | | | | | | | |
| | | Multi-Manager
Global Equity | | | Multi-Manager
Non-Core
Fixed Income | | | Multi-Manager
Real Assets
Strategy | |
|
| |
| | | |
Capital loss carryforwards: | | | | | | | | | | | | |
| | | |
Perpetual Short-Term | | | $(3,017,248 | ) | | | $ (75,953,624 | ) | | | $ (7,189,135 | ) |
| | | |
Perpetual Long-Term | | | (2,351,950 | ) | | | (83,294,538 | ) | | | (8,747,023 | ) |
|
| |
| | | |
Total capital loss carryforwards | | | (5,369,198 | ) | | | (159,248,162 | ) | | | (15,936,158 | ) |
|
| |
| | | |
Timing differences (Straddle Loss Deferral) | | | $ (8,263 | ) | | | $ (2,883,303 | ) | | | $ — | |
|
| |
As of April 30, 2024, the Funds’ aggregate security unrealized gains and losses based on cost for U.S. federal income tax purposes were as follows:
| | | | | | | | | | | | |
| | | Multi-Manager
Global Equity | | | Multi-Manager
Non-Core Fixed Income | | | Multi-Manager
Real Assets
Strategy | |
|
| |
| | | |
Tax Cost | | $ | 960,000,716 | | | $ | 1,539,148,075 | | | $ | 785,381,484 | |
|
| |
| | | |
Gross unrealized gain | | | 163,636,450 | | | | 17,679,157 | | | | 77,838,193 | |
| | | |
Gross unrealized loss | | | (41,095,664 | ) | | | (65,721,602 | ) | | | (71,830,924 | ) |
|
| |
| | | |
Net unrealized gain (loss) on securities | | $ | 122,540,786 | | | $ | (48,042,445 | ) | | $ | 6,007,269 | |
|
| |
The difference between GAAP-basis and tax basis unrealized gains (losses) is attributable primarily to wash sales, net mark to market gains (losses) on regulated futures contracts, net mark to market gains (losses) on foreign currency contracts, partnership investments, and differences in the tax treatment of swap transactions, material modification of debt securities, market discount accretion and premium amortization, and passive foreign investment company investments.
GSAM has reviewed the Funds’ tax positions for all open tax years (the current and prior three years, as applicable) and have concluded that no provision for income tax is required in the Funds’ financial statements. Such open tax years remain subject to examination and adjustment by tax authorities.
GOLDMAN SACHS STRATEGIC MULTI-ASSET CLASS FUNDS
|
Notes to Financial Statements (continued) April 30, 2024 (Unaudited) |
The Funds’ risks include, but are not limited to, the following:
Asset Allocation Risk — The Funds’ allocations to the various asset classes and to the Underlying Managers may cause the Funds to underperform other funds with a similar investment objective.
Derivatives Risk — The Funds’ use of derivatives and other similar instruments (collectively referred to in this paragraph as “derivatives”) may result in loss, including due to adverse market movements. Derivatives, which may pose risks in addition to and greater than those associated with investing directly in securities, currencies or other assets and instruments, may increase market exposure and be illiquid or less liquid, volatile, difficult to price and leveraged so that small changes in the value of the underlying assets or instruments may produce disproportionate losses to the Funds. Certain derivatives are also subject to counterparty risk, which is the risk that the other party in the transaction will not, or lacks the capacity or authority to, fulfill its contractual obligations, liquidity risk, which includes the risk that the Funds will not be able to exit the derivative when it is advantageous to do so, and risks arising from margin requirements, which include the risk that the Funds will be required to pay additional margin or set aside additional collateral to maintain open derivative positions. The use of derivatives is a highly specialized activity that involves investment techniques and risks different from those associated with investments in more traditional securities and instruments. Losses from derivatives can also result from a lack of correlation between changes in the value of derivative instruments and the portfolio assets (if any) being hedged.
Floating and Variable Rate Obligations Risk — Floating rate and variable rate obligations are debt instruments issued by companies or other entities with interest rates that reset periodically (typically, daily, monthly, quarterly, or semiannually) in response to changes in the market rate of interest on which the interest rate is based. Such market rates are generally the Secured Overnight Financing Rate, (“SOFR”), a term SOFR rate published by CME Group Benchmark Administration Limited (CBA) calculated using certain derivatives markets (“Term SOFR”), the Prime Rate of a designated U.S. bank, the Federal Funds Rate, or another base lending rate used by commercial lenders. For floating and variable rate obligations, there may be a lag between an actual change in the underlying interest rate benchmark and the reset time for an interest payment of such an obligation, which could harm or benefit a Fund, depending on the interest rate environment or other circumstances. In a rising interest rate environment, for example, a floating or variable rate obligation that does not reset immediately would prevent a Fund from taking full advantage of rising interest rates in a timely manner. However, in a declining interest rate environment, the Fund may benefit from a lag due to an obligation’s interest rate payment not being immediately impacted by a decline in interest rates.
Some floating or variable rate obligations or investments of a Fund may reference (or may have previously referenced) the London Interbank Offered Rate (“LIBOR”). As a result of benchmark reforms, publication of most LIBOR settings has ceased. Some LIBOR settings continue to be published but only on a temporary, synthetic and non-representative basis and are expected to cease being published in September 2024. Regulated entities have generally ceased entering into new LIBOR contracts in connection with regulatory guidance or prohibitions. Public and private sector actors have worked to establish alternative reference rates, like SOFR or Term SOFR, to be used in place of LIBOR. There is no assurance that any such alternative reference rate will be similar to or produce the same value or economic equivalence as LIBOR or that it will have the same volume or liquidity as did LIBOR which may affect the value, volatility, liquidity or return on certain of a Fund’s floating and variable rate obligations and investments and result in costs incurred in connection with changing reference rates used for positions, closing out positions and entering into new trades. Certain of a Fund’s obligations or investments may have transitioned from LIBOR or may transition from LIBOR in the future. The transition from LIBOR to alternative reference rates may result in operational issues for a Fund or its obligations or investments. Any pricing adjustments to a Fund’s obligations or investments resulting from use of an alternative reference rate may also adversely affect the Fund’s performance and/or NAV. No assurances can be given as to the impact of the LIBOR transition (and the timing of any such impact) on a Fund and its obligations and investments.
Foreign and Emerging Countries Risk — Investing in foreign markets may involve special risks and considerations not typically associated with investing in the U.S. Foreign securities may be subject to risk of loss because of more or less foreign government regulation; less public information; less stringent investor protections; less stringent accounting, corporate governance, financial reporting and disclosure standards; and less economic, political and social stability in the countries in which a Fund invests. The imposition of sanctions, exchange controls (including repatriation restrictions), confiscation of assets and property,
GOLDMAN SACHS STRATEGIC MULTI-ASSET CLASS FUNDS
|
|
8. OTHER RISKS (continued) |
trade restrictions (including tariffs) and other government restrictions by the U.S. or other governments, or from problems in registration, settlement or custody, may also result in losses. The type and severity of sanctions and other similar measures, including counter sanctions and other retaliatory actions, that may be imposed could vary broadly in scope, and their impact is impossible to predict. For example, the imposition of sanctions and other similar measures could, among other things, cause a decline in the value and/or liquidity of securities issued by the sanctioned country or companies located in or economically tied to the sanctioned country and increase market volatility and disruption in the sanctioned country and throughout the world. Sanctions and other similar measures could limit or prevent a Fund from buying and selling securities (in the sanctioned country and other markets), significantly delay or prevent the settlement of securities transactions, and significantly impact a Fund’s liquidity and performance. Foreign risk also involves the risk of negative foreign currency exchange rate fluctuations, which may cause the value of securities denominated in such foreign currency (or other instruments through which a Fund has exposure to foreign currencies) to decline in value. Currency exchange rates may fluctuate significantly over short periods of time. To the extent that a Fund also invests in securities of issuers located in, or economically tied to, emerging markets, these risks may be more pronounced.
Geographic Risk — If a Fund focuses its investments in securities of issuers located in a particular country or geographic region, the Fund may be subjected, to a greater extent than if its investments were less focused, to the risks of volatile economic cycles and/or conditions and developments that may be particular to that country or region, such as: adverse securities markets; adverse exchange rates; adverse social, political, regulatory, economic, business, environmental or other developments; or natural disasters.
Index/Tracking Error Risk — To the extent that an index-tracking strategy or implementation of a sub-strategy by a transition manager is used with respect to a portion of a Fund’s assets, including through investment in an ETF that seeks to track an index or implementation of an index-tracking strategy, the Fund will be negatively affected by general declines in the securities and asset classes represented in the relevant index. There is no guarantee that the Fund, or relevant portion of the Fund, will achieve a high degree of correlation to the relevant index. Market disruptions and regulatory restrictions could have an adverse effect on the Fund’s ability, or the ability of an ETF in which it invests, to adjust its exposure to the required levels in order for the relevant portion of the Fund to track the relevant index. In addition, because that portion of the Fund is not “actively” managed, unless a specific security is removed from the relevant index, the Fund or an ETF in which it invests generally would not sell a security because the security’s issuer was in financial trouble. At times when an index-tracking strategy is used with respect to a portion of the Fund’s assets, the Fund’s performance could be lower than funds that may actively shift all of their portfolio assets to take advantage of market opportunities or to lessen the impact of a market decline or a decline in the value of one or more issuers.
Interest Rate Risk — When interest rates increase, fixed income securities or instruments held by a Fund will generally decline in value. Long-term fixed income securities or instruments will normally have more price volatility because of this risk than short-term fixed income securities or instruments. A wide variety of market factors can cause interest rates to rise, including central bank monetary policy, rising inflation and changes in general economic conditions. Changing interest rates may have unpredictable effects on the markets, may result in heightened market volatility and may detract from Fund performance. In addition, changes in monetary policy may exacerbate the risks associated with changing interest rates. Funds with longer average portfolio durations will generally be more sensitive to changes in interest rates than funds with a shorter average portfolio duration. Fluctuations in interest rates may also affect the liquidity of fixed income securities and instruments held by the Funds. A sudden or unpredictable increase in interest rates may cause volatility in the market and may decrease the liquidity of a Fund’s investments, which would make it harder for the Fund to sell its investments at an advantageous time.
Large Shareholder Transactions Risk — A Fund may experience adverse effects when certain large shareholders, such as other funds, institutional investors (including those trading by use of non-discretionary mathematical formulas), financial intermediaries (who may make investment decisions on behalf of underlying clients and/or include a Fund in their investment model), individuals, accounts and Goldman Sachs affiliates, purchase or redeem large amounts of shares of a Fund. Such large shareholder redemptions, which may occur rapidly or unexpectedly, may cause a Fund to sell portfolio securities at times when it would not otherwise do so, which may negatively impact a Fund’s NAV and liquidity. These transactions may also accelerate the realization of taxable income to shareholders if such sales of investments resulted in gains, and may also increase transaction costs. In
GOLDMAN SACHS STRATEGIC MULTI-ASSET CLASS FUNDS
|
Notes to Financial Statements (continued) April 30, 2024 (Unaudited) |
|
|
8. OTHER RISKS (continued) |
addition, a large redemption could result in a Fund’s current expenses being allocated over a smaller asset base, leading to an increase in a Fund’s expense ratio. Similarly, large Fund share purchases may adversely affect a Fund’s performance to the extent that the Fund is delayed in investing new cash or otherwise maintains a larger cash position than it ordinarily would.
Liquidity Risk — A Fund may make investments that are illiquid or that may become less liquid in response to market developments or adverse investor perceptions. Illiquid investments may be more difficult to value. Liquidity risk may also refer to the risk that a Fund will not be able to pay redemption proceeds within the allowable time period or without significant dilution to remaining investors’ interests because of unusual market conditions, declining prices of the securities sold, an unusually high volume of redemption requests, or other reasons. To meet redemption requests, a Fund may be forced to sell investments at an unfavorable time and/or under unfavorable conditions. If a Fund is forced to sell securities at an unfavorable time and/or under unfavorable conditions, such sales may adversely affect a Fund’s NAV and dilute remaining investors’ interests. Liquidity risk may be the result of, among other things, the reduced number and capacity of traditional market participants to make a market in fixed income securities or the lack of an active market. The potential for liquidity risk may be magnified by a rising interest rate environment or other circumstances where investor redemptions from fixed income funds may be higher than normal, potentially causing increased supply in the market due to selling activity. These risks may be more pronounced in connection with the Funds’ investments in securities of issuers located in emerging market countries. Redemptions by large shareholders may have a negative impact on a Fund’s liquidity.
Loan-Related Investments Risk — In addition to risks generally associated with debt investments (e.g., interest rate risk and default risk), loan-related investments such as loan participations and assignments are subject to other risks. Although a loan obligation may be fully collateralized at the time of acquisition, the collateral may decline in value, be or become illiquid or less liquid, or lose all or substantially all of its value subsequent to investment. Many loan investments are subject to legal or contractual restrictions on resale and certain loan investments may be or become illiquid or less liquid and more difficult to value, particularly in the event of a downgrade of the loan or the borrower. There is less readily available, reliable information about most loan investments than is the case for many other types of securities. Substantial increases in interest rates may cause an increase in loan obligation defaults. With respect to loan participations, a Fund may not always have direct recourse against a borrower if the borrower fails to pay scheduled principal and/or interest; may be subject to greater delays, expenses and risks than if a Fund had purchased a direct obligation of the borrower; and may be regarded as the creditor of the agent lender (rather than the borrower), subjecting a Fund to the creditworthiness of that lender as well. Investors in loans, such as a Fund, may not be entitled to rely on the anti-fraud protections of the federal securities laws, although they may be entitled to certain contractual remedies. The market for loan obligations may be subject to irregular trading activity, wide bid/ask spreads and extended trade settlement periods. Because transactions in many loans are subject to extended trade settlement periods, a Fund may not receive the proceeds from the sale of a loan for a period after the sale. As a result, sale proceeds related to the sale of loans may not be available to make additional investments or to meet a Fund’s redemption obligations for a period after the sale of the loans, and, as a result, a Fund may have to sell other investments or engage in borrowing transactions, such as borrowing from its credit facility, if necessary to raise cash to meet its obligations.
Senior Loans hold the most senior position in the capital structure of a business entity, and are typically secured with specific collateral, but are nevertheless usually rated below investment grade. Because Second Lien Loans are subordinated or unsecured and thus lower in priority of payment to Senior Loans, they are subject to the additional risk that the cash flow of the borrower and property securing the loan or debt, if any, may be insufficient to meet scheduled payments after giving effect to the senior secured obligations of the borrower. Second Lien Loans generally have greater price volatility than Senior Loans and may be less liquid.
Market and Credit Risks — In the normal course of business, a Fund trades financial instruments and enters into financial transactions where risk of potential loss exists due to changes in the market (market risk). The value of the securities in which a Fund invests may go up or down in response to the prospects of individual companies, particular sectors or governments and/or general economic conditions throughout the world due to increasingly interconnected global economies and financial markets. Events such as war, military conflict, acts of terrorism, social unrest, natural disasters, recessions, inflation, rapid interest rate changes, supply chain disruptions, sanctions, the spread of infectious illness or other public health threats could also significantly
GOLDMAN SACHS STRATEGIC MULTI-ASSET CLASS FUNDS
|
|
8. OTHER RISKS (continued) |
impact a Fund and its investments. Additionally, a Fund may also be exposed to credit risk in the event that an issuer or guarantor fails to perform or that an institution or entity with which a Fund has unsettled or open transactions defaults.
Multi-Manager Approach Risk — The Funds’ performance depends on the ability of the Investment Adviser in selecting, overseeing, and allocating Fund assets to the Underlying Managers. The Underlying Managers’ investment styles may not always be complementary. The Funds’ multi-manager approach may result in the Fund investing a significant percentage of its assets in certain types of investments, which could be beneficial or detrimental to the Funds’ performance depending on the performance of those investments and the overall market environment. The Funds’ Underlying Managers may underperform the market generally or underperform other investment managers that could have been selected for the Funds. Because the Funds’ Underlying Managers may trade with counterparties, prime brokers, clearing brokers or futures commission merchants on terms that are different than those on which the Investment Adviser would trade, and because each Underlying Manager applies its own risk analysis in evaluating potential counterparties for the Funds, the Funds may be subject to greater counterparty risk than if they were managed directly by the Investment Adviser.
Under the Trust’s organizational documents, its Trustees, officers, employees and agents are indemnified, to the extent permitted by the Act and state law, against certain liabilities that may arise out of performance of their duties to the Funds. Additionally, in the course of business, the Funds enter into contracts that contain a variety of indemnification clauses. The Funds’ maximum exposure under these arrangements is unknown, as this would involve future claims that may be made against the Funds that have not yet occurred. However, GSAM believes the risk of loss under these arrangements to be remote.
Subsequent events after the Statements of Assets and Liabilities date have been evaluated, and GSAM concluded that there is no impact requiring adjustment or disclosure in the financial statements.
|
|
11. SUMMARY OF SHARE TRANSACTIONS |
Share activity is as follows:
| | | | | | | | | | | | | | | | |
| | | Multi-Manager Global Equity Fund | |
| | |
| | | For the Six Months Ended April 30, 2024 (Unaudited) | | | For the Fiscal Year Ended October 31, 2023 | |
| |
| | | | |
| | | | |
| | | Shares | | | Dollars | | | Shares | | | Dollars | |
| |
| | | | |
| | | | |
Class R6 Shares | | | | | | | | | | | | | | | | |
| | | | |
Shares sold | | | 34,113,286 | | | $ | 373,880,396 | | | | 53,170,599 | | | $ | 511,675,000 | |
| | | | |
Reinvestment of distributions | | | 1,057,853 | | | | 10,768,945 | | | | 4,380,658 | | | | 39,162,975 | |
| | | | |
Shares redeemed | | | (18,131,669 | ) | | | (195,731,362 | ) | | | (15,911,348 | ) | | | (152,480,805 | ) |
|
| |
| | | | |
NET INCREASE | | | 17,039,470 | | | $ | 188,917,979 | | | | 41,639,909 | | | $ | 398,357,170 | |
|
| |
GOLDMAN SACHS STRATEGIC MULTI-ASSET CLASS FUNDS
|
Notes to Financial Statements (continued) April 30, 2024 (Unaudited) |
|
|
11. SUMMARY OF SHARE TRANSACTIONS (continued) |
| | | | | | | | | | | | | | | | |
| | | Multi-Manager Non-Core Fixed Income Fund | |
| | |
| | | For the Six Months Ended April 30, 2024 (Unaudited) | | | For the Fiscal Year Ended October 31, 2023 | |
| |
| | | | |
| | | | |
| | | Shares | | | Dollars | | | Shares | | | Dollars | |
| |
| | | | |
| | | | |
Class R6 Shares | | | | | | | | | | | | | | | | |
| | | | |
Shares sold | | | 77,505,806 | | | $ | 586,806,000 | | | | 56,584,724 | | | $ | 424,368,538 | |
| | | | |
Reinvestment of distributions | | | 6,240,058 | | | | 47,341,161 | | | | 11,392,098 | | | | 84,946,195 | |
| | | | |
Shares redeemed | | | (28,120,996 | ) | | | (213,311,496 | ) | | | (58,849,100 | ) | | | (438,813,157 | ) |
|
| |
| | | | |
NET INCREASE | | | 55,624,868 | | | $ | 420,835,665 | | | | 9,127,722 | | | $ | 70,501,576 | |
|
| |
| | | | | | | | | | | | | | | | |
| | | Multi-Manager Real Assets Strategy Fund | |
| | |
| | | For the Six Months Ended April 30, 2024 (Unaudited) | | | For the Fiscal Year Ended October 31, 2023 | |
| |
| | | | |
| | | | |
| | | Shares | | | Dollars | | | Shares | | | Dollars | |
| |
| | | | |
| | | | |
Class R6 Shares | | | | | | | | | | | | | | | | |
| | | | |
Shares sold | | | 22,833,898 | | | $ | 207,777,999 | | | | 22,983,417 | | | $ | 205,108,061 | |
| | | | |
Reinvestment of distributions | | | 1,692,702 | | | | 15,471,294 | | | | 2,825,332 | | | | 25,890,049 | |
| | | | |
Shares redeemed | | | (4,770,521 | ) | | | (43,389,161 | ) | | | (2,520,809 | ) | | | (22,035,027 | ) |
|
| |
| | | | |
NET INCREASE | | | 19,756,079 | | | $ | 179,860,132 | | | | 23,287,940 | | | $ | 208,963,083 | |
|
| |
GOLDMAN SACHS STRATEGIC MULTI-ASSET CLASS FUNDS
Fund Expenses — Six Month Period Ended April 30, 2024 (Unaudited)
As a shareholder of Class R6 Shares of a Fund, you incur two types of costs: (1) transaction costs, including sales charges on purchase payments, and (2) ongoing costs, including management fees and other Fund expenses. This example is intended to help you understand your ongoing costs (in dollars) of investing in the Funds and to compare these costs with the ongoing costs of investing in other mutual funds.
The example is based on an investment of $1,000 invested at the beginning of the period and held for the entire period from November 1, 2023 through April 30, 2024, which represents a period of 182 days of a 366-day year. This projection assumes that annualized expense ratios were in effect during the period.
Actual Expenses — The first line under each share class in the table below provides information about actual account values and actual expenses. You may use the information in this line, together with the amount you invested, to estimate the expenses that you paid over the period. Simply divide your account value by $1,000 (for example, an $8,600 account value divided by $1,000=8.6), then multiply the result by the number in the first line under the heading entitled “Expenses Paid” to estimate the expenses you paid on your account during this period.
Hypothetical Example for Comparison Purposes — The second line under each share class in the table below provides information about hypothetical account values and hypothetical expenses based on the Funds’ actual net expense ratios and an assumed rate of return of 5% per year before expenses, which is not the Funds’ actual return. The hypothetical account values and expenses may not be used to estimate the actual ending account balance or expenses you paid for the period. You may use this information to compare the ongoing costs of investing in the Funds and other funds. To do so, compare this 5% hypothetical example with the 5% hypothetical examples that appear in the shareholder reports of the other funds.
Please note that the expenses shown in the table are meant to highlight your ongoing costs only and do not reflect any transactional costs, such as sales charges, redemption fees, or exchange fees. Therefore, the second line of the table is useful in comparing ongoing costs only, and will not help you determine the relative total costs of owning different funds. In addition, if these transactional costs were included, your costs would have been higher.
| | | | | | | | | | | | | | | | | | | | | | | | | | | | | | | | | | | | |
| | | Multi-Manager Global Equity Fund | | | Multi-Manager Non-Core Fixed Income Fund | | | Multi-Manager Real Assets Strategy
Fund | |
| Share Class | | Beginning
Account
Value
11/1/23 | | | Ending
Account
Value
4/30/24 | | | Expenses
Paid for the
6 months ended
4/30/24* | | | Beginning
Account
Value 11/1/23 | | | Ending
Account
Value
4/30/24 | | | Expenses
Paid for the
6 months ended
4/30/24* | | | Beginning
Account
Value
11/1/23 | | | Ending
Account
Value
4/30/24 | | | Expenses
Paid for the
6 months ended
4/30/24* | |
| Class R6 | | | | | | | | | | | | | | | | | | | | | | | | | | | | | | | | | | | | |
Actual | | | $ 1,000.00 | | | | $ 1,190.70 | | | | $ 2.75 | | | | $ 1,000.00 | | | | $ 1,069.10 | | | | $ 2.74 | | | | $ 1,000.00 | | | | $ 1,111.50 | | | | $ 3.63 | |
Hypothetical 5% return | | | 1,000.00 | | | | 1,022.30 | + | | | 2.54 | | | | 1,000.00 | | | | 1,022.20 | + | | | 2.68 | | | | 1,000.00 | | | | 1,021.40 | + | | | 3.47 | |
| * | Expenses for each share class are calculated using each Fund’s annualized net expense ratio for each class, which represents the ongoing expenses as a percentage of net assets for the six months ended April 30, 2024. Expenses are calculated by multiplying the annualized net expense ratio by the average account value for the period; then multiplying the result by the number of days in the most recent fiscal half year; and then dividing that result by the number of days in the fiscal year. The annualized net expense ratios for the period were as follows: |
| | | | | | |
Fund | | Class R6 | | | |
Multi-Manager Global Equity Fund | | | 0.51 | % | | |
Multi-Manager Non-Core Fixed Income Fund | | | 0.53 | | | |
Multi-Manager Real Assets Strategy Fund | | | 0.69 | | | |
| + | Hypothetical expenses are based on each Fund’s actual annualized net expense ratios and an assumed rate of return of 5% per year before expenses. |
91
GOLDMAN SACHS STRATEGIC MULTI-ASSET CLASS FUNDS
Liquidity Risk Management Program (Unaudited)
Each Fund has adopted and implemented a liquidity risk management program (the “Program”) in accordance with Rule 22e-4 under the 1940 Act. The Program seeks to assess and manage each Fund’s liquidity risk, i.e., the risk that a Fund is unable to satisfy redemption requests without significantly diluting remaining investors’ interests in the Fund. The Board of Trustees of the Trust has designated GSAM, each Fund’s investment adviser, to administer the Program. Certain aspects of the Program rely on third parties to perform certain functions, including the provision of market data and application of models.
The Program is comprised of various components designed to support the assessment and/or management of liquidity risk, including: (1) the periodic assessment (no less frequently than annually) of certain factors that influence a Fund’s liquidity risk; (2) the periodic classification (no less frequently than monthly) of a Fund’s investments into one of four liquidity categories that reflect an estimate of their liquidity under current market conditions; (3) a 15% limit on the acquisition of “illiquid investments” (as defined under Rule 22e-4); (4) for a Fund that does not invest primarily in “highly liquid investments” (as defined under Rule 22e-4), the determination of a minimum percentage of the Fund’s assets that will generally be invested in highly liquid investments (a “Highly Liquid Investment Minimum”); and (5) periodic reporting to the Board of Trustees.
At a meeting of the Board of Trustees on February 13-14, 2024, GSAM provided a written report to the Board addressing the operation, and the adequacy and effectiveness of the implementation, of the Program, including, as applicable, the operation of any Highly Liquid Investment Minimum and any material changes to the Program, for the period from January 1, 2023 through December 31, 2023 (the “Reporting Period”). Among other things, the annual report discussed: (1) the results of stress tests designed to assess liquidity under a hypothetical stressed scenario involving elevated redemptions; (2) an assessment of the methodologies used to classify investments into one of four liquidity categories; and (3) the impact of local holidays in non-U.S. jurisdictions. The report concluded that the Program continues to be reasonably designed to assess and manage liquidity risk and was adequately and effectively implemented during the Reporting Period.
There can be no assurance that the Program will achieve its objectives under all circumstances in the future. Please refer to your Fund’s prospectus for more information regarding the Fund’s exposure to liquidity risk and other risks to which it may be subject.
GOLDMAN SACHS STRATEGIC MULTI-ASSET CLASS FUNDS
Voting Results of Annual Meeting of Shareholders (Unaudited)
A Special Meeting of Shareholders (the “Meeting”) of the Goldman Sachs Trust II (the “Trust”) was held on November 16, 2023 to consider and elect nominees to the Trust’s Board of Trustees. At the Meeting, Gregory G. Weaver, Dwight L. Bush, Kathryn A. Cassidy, John G. Chou, Joaquin Delgado, Eileen H. Dowling and Paul C. Wirth were elected to the Trust’s Board of Trustees. In electing the nominees, the Trust’s shareholders voted as follows:
| | | | | | | | |
| Proposal | | | | | | |
| | |
| Election of Trustees | | For | | | Withheld | |
| | |
Gregory G. Weaver | | | 1,292,078,725 | | | | 63,531,552 | |
| | |
Dwight L. Bush | | | 1,339,529,258 | | | | 16,081,019 | |
| | |
Kathryn A. Cassidy | | | 1,340,407,606 | | | | 15,202,670 | |
| | |
John G. Chou | | | 1,351,547,930 | | | | 4,062,346 | |
| | |
Joaquin Delgado | | | 1,340,312,893 | | | | 15,297,383 | |
| | |
Eileen H. Dowling | | | 1,351,944,019 | | | | 3,666,258 | |
| | |
Paul C. Wirth | | | 1,350,994,736 | | | | 4,615,540 | |
FUNDS PROFILE
Goldman Sachs Funds
Goldman Sachs is a premier financial services firm, known since 1869 for creating thoughtful and customized investment solutions in complex global markets.
Today, the Asset Management Division of Goldman Sachs serves a diverse set of clients worldwide, including private institutions, public entities and individuals. With approximately $2.56 trillion in assets under supervision as of March 31, 2024, Goldman Sachs Asset Management has portfolio management teams located around the world and our investment professionals bring firsthand knowledge of local markets to every investment decision. Assets under supervision includes assets under management and other client assets for which Goldman Sachs does not have full discretion. Goldman Sachs Asset Management leverages the resources of Goldman Sachs & Co. LLC subject to legal, internal and regulatory restrictions.
Money Market
Financial Square FundsSM
| ∎ | Financial Square Treasury Solutions Fund1 |
| ∎ | Financial Square Government Fund1 |
| ∎ | Financial Square Money Market Fund2 |
| ∎ | Financial Square Prime Obligations Fund2 |
| ∎ | Financial Square Treasury Instruments Fund1 |
| ∎ | Financial Square Treasury Obligations Fund1 |
| ∎ | Financial Square Federal Instruments Fund1 |
Investor FundsSM
| ∎ | Investor Money Market Fund3 |
| ∎ | Investor Tax-Exempt Money Market Fund3 |
Fixed Income
Short Duration and Government
| ∎ | Short-Term Conservative Income Fund |
| ∎ | Short Duration Government Fund |
| ∎ | Short Duration Bond Fund |
| ∎ | Inflation Protected Securities Fund |
Multi-Sector
| ∎ | Global Core Fixed Income Fund |
Municipal and Tax-Free
| ∎ | High Yield Municipal Fund |
| ∎ | Dynamic Municipal Income Fund |
| ∎ | Short Duration Tax-Free Fund |
| ∎ | Municipal Income Completion Fund |
Single Sector
| ∎ | Investment Grade Credit Fund |
| ∎ | High Yield Floating Rate Fund |
| ∎ | Emerging Markets Debt Fund |
| ∎ | Emerging Markets Credit Fund |
Fixed Income Alternatives
| ∎ | Short Duration High Yield Fund4 |
Fundamental Equity
| ∎ | Small/Mid Cap Value Fund |
| ∎ | Small/Mid Cap Growth Fund |
| ∎ | Enhanced Core Equity Fund5 |
| ∎ | Technology Opportunities Fund |
| ∎ | Rising Dividend Growth Fund |
Tax-Advantaged Equity
| ∎ | U.S. Tax-Managed Equity Fund |
| ∎ | International Tax-Managed Equity Fund |
| ∎ | U.S. Equity Dividend and Premium Fund |
| ∎ | International Equity Dividend and Premium Fund |
Equity Insights
| ∎ | Small Cap Equity Insights Fund |
| ∎ | U.S. Equity Insights Fund |
| ∎ | Small Cap Growth Insights Fund |
| ∎ | Large Cap Growth Insights Fund |
| ∎ | Large Cap Value Insights Fund |
| ∎ | Small Cap Value Insights Fund |
| ∎ | International Small Cap Insights Fund |
| ∎ | International Equity Insights Fund |
| ∎ | Emerging Markets Equity Insights Fund |
Fundamental Equity International
| ∎ | International Equity Income Fund |
| ∎ | International Equity ESG Fund |
| ∎ | Emerging Markets Equity Fund |
| ∎ | Emerging Markets Equity ex. China Fund |
| ∎ | ESG Emerging Markets Equity Fund |
Alternative
| ∎ | Clean Energy Income Fund |
| ∎ | Real Estate Securities Fund |
| ∎ | Global Real Estate Securities Fund |
| ∎ | Absolute Return Tracker Fund |
| ∎ | Managed Futures Strategy Fund |
| ∎ | MLP Energy Infrastructure Fund |
| ∎ | Energy Infrastructure Fund |
| ∎ | Multi-Strategy Alternatives Fund |
| ∎ | Global Infrastructure Fund |
Total Portfolio Solutions
| ∎ | Global Managed Beta Fund |
| ∎ | Multi-Manager Non-Core Fixed Income Fund |
| ∎ | Multi-Manager Global Equity Fund |
| ∎ | Multi-Manager International Equity Fund |
| ∎ | Tactical Tilt Overlay Fund |
| ∎ | Balanced Strategy Portfolio |
| ∎ | Multi-Manager U.S. Small Cap Equity Fund |
| ∎ | Multi-Manager Real Assets Strategy Fund |
| ∎ | Growth and Income Strategy Portfolio |
| ∎ | Growth Strategy Portfolio |
| ∎ | Dynamic Global Equity Fund |
| ∎ | Enhanced Dividend Global Equity Portfolio |
| ∎ | Tax-Advantaged Global Equity Portfolio |
| ∎ | Strategic Factor Allocation Fund |
| ∎ | Strategic Volatility Premium Fund |
| ∎ | Goldman Sachs GQG Partners International Opportunities Fund |
| 1 | You could lose money by investing in the Fund. Although the Fund seeks to preserve the value of your investment at $1.00 per share, it cannot guarantee it will do so. An investment in the Fund is not a bank account or a deposit of a bank and is not insured or guaranteed by the Federal Deposit Insurance Corporation or any other government agency. The Fund’s sponsor is not required to reimburse the Fund for losses, and you should not expect that the sponsor will provide financial support to the Fund at any time, including during periods of market stress. |
| 2 | You could lose money by investing in the Fund. Because the share price of the Fund will fluctuate, when you sell your shares they may be worth more or less than what you originally paid for them. The Fund may impose a fee upon sale of your shares. Effective October 2, 2024, the Fund generally must impose a fee when net sales of Fund shares exceed certain levels. An investment in the Fund is not a bank account or a deposit of a bank and is not insured or guaranteed by the Federal Deposit Insurance Corporation or any other government agency. The Fund’s sponsor is not required to reimburse the Fund for losses, and you should not expect that the sponsor will provide financial support to the Fund at any time, including during periods of market stress. |
| 3 | You could lose money by investing in the Fund. Although the Fund seeks to preserve the value of your investment at $1.00 per share, it cannot guarantee it will do so. The Fund may impose a fee upon sale of your shares. An investment in the Fund is not a bank account or a deposit of a bank and is not insured or guaranteed by the Federal Deposit Insurance Corporation or any other government agency. The Fund’s sponsor is not required to reimburse the Fund for losses, and you should not expect that the sponsor will provide financial support to the Fund at any time, including during periods of market stress. |
| 4 | Effective after the close of business on April 17, 2024, the Goldman Sachs Long Short Credit Strategies Fund was renamed the Goldman Sachs Short Duration High Yield Fund. |
| 5 | Effective after the close of business on February 13, 2024, the Goldman Sachs Flexible Cap Fund was renamed the Goldman Sachs Enhanced Core Equity Fund. |
| 6 | Effective after the close of business on June 17, 2024, the Goldman Sachs Strategic Income Fund was renamed the Goldman Sachs Dynamic Bond Fund. |
| | Financial Square FundsSM and Investor FundsSM are registered service marks of Goldman Sachs & Co. LLC. |
| * | This list covers open-end funds only. Please visit our website at www.GSAMFUNDS.com to learn more about our closed-end funds and exchange-traded funds. |
TRUSTEES OFFICERS Gregory G. Weaver, Chair James A. McNamara, President Cheryl K. Beebe Joseph F. DiMaria, Principal Financial Officer, Principal Dwight L. Bush Accounting Officer and Treasurer Kathryn A. Cassidy Robert Griffith, Secretary John G. Chou Joaquin Delgado Eileen H. Dowling Lawrence Hughes John F. Killian Steven D. Krichmar Michael Latham James A. McNamara Lawrence W. Stranghoener PaulC.Wirth GOLDMAN SACHS & CO. LLC GOLDMAN SACHS ASSET MANAGEMENT, L.P. Distributor and Transfer Agent Investment Adviser Visit our website at www.GSAMFUNDS.com to obtain the most recent month-end returns. Goldman Sachs Asset Management, L.P., 200 West Street, New York, New York 10282 Neither MSCI nor any other party involved in or related to compiling, computing, or creating the MSCI data makes any express or implied warranties or representations with respect to such data (or the results to be obtained by the use thereof), and all such parties hereby expressly disclaim all warranties of originality, accuracy, completeness, merchantability, or fitness for a particular purpose with respect to any of such data. Without limiting any of the foregoing, in no event shall MSCI, any of its affiliates or any third party involved in or related to compiling, computing or creating the data have any liability for any direct, indirect, special, punitive, consequential or any other damages (including lost profits) even if notified of the possibility of such damages. No further distribution or dissemination of the MSCI data is permitted without MSCI's express written consent. The reports concerning the Funds included in this shareholder report may contain certain forward-looking statements about the factors that may affect the performance of the Funds in the future. These statements are based on Fund management's predictions and expectations concerning certain future events and their expected impact on the Funds, such as performance of the economy as a whole and of specific industry sectors, changes in the levels of interest rates, the impact of developing world events, and other factors that may influence the future performance of the Funds. Management believes these forward-looking statements to be reasonable, although they are inherently uncertain and difficult to predict. Actual events may cause adjustments in portfolio management strategies from those currently expected to be employed. A description of the policies and procedures that the Funds use to determine how to vote proxies relating to portfolio securities and information regarding how Funds voted proxies relating to portfolio securities during the most recent 12-month period ended June 30 are available (I) without charge, upon request by calling 1-800-621-2550; and (II) on the Securities and Exchange Commission (''SEC'') web site at http://www.sec.gov. The Funds will file their portfolio holdings information for each month in a fiscal quarter within 60 days after the end of the relevant fiscal quarter on Form N-PORT. Portfolio holdings information for the third month of each fiscal quarter will be made available on the SEC's web site at http://www.sec.gov. Portfolio holdings information may be obtained upon request and without charge by calling 1-800-526-7384 (for Retail Shareholders) or 1-800-621-2550 (for Institutional Shareholders). Goldman Sachs & Co. LLC (''Goldman Sachs'') does not provide legal, tax or accounting advice. Any statement contained in this communication (including any attachments) concerning U.S. tax matters was not intended or written to be used, and cannot be used, for the purpose of avoiding penalties under the Internal Revenue Code, and was written to support the promotion or marketing of the transaction(s) or matter(s) addressed. Clients of Goldman Sachs should obtain their own independent tax advice based on their particular circumstances. Economic and market forecasts presented herein reflect our judgment as of the date of this presentation and are subject to change without notice. These forecasts do not take into account the specific investment objectives, restrictions, tax and financial situation or other needs of any specific client. Actual data will vary and may not be reflected here. These forecasts are subject to high levels of uncertainty that may affect actual performance. Accordingly, these forecasts should be viewed as merely representative of a broad range of possible outcomes. These forecasts are estimated, based on assumptions, and are subject to significant revision and may change materially as economic and market conditions change. Goldman Sachs has no obligation to provide updates or changes to these forecasts. Case studies and examples are for illustrative purposes only. The Global Industry Classification Standard (GICS) was developed by and is the exclusive property and a service mark of Morgan Stanley Capital International Inc. (MSCI) and Standard & Poor's, a division of The McGraw-Hill Companies, Inc. (S&P) and is licensed for use by Goldman Sachs. Neither MSCI, S&P nor any other party involved in making or compiling the GICS or any GICS classifications makes any express or implied warranties or representations with respect to such standard or classification (or the results to be obtained by the use thereof), and all such parties hereby expressly disclaim all warranties of originality, accuracy, completeness, merchantability or fitness for a particular purpose with respect to any of such standard or classification. Without limiting any of the foregoing, in no event shall MSCI, S&P, any of their affiliates or any third party involved in making or compiling the GICS or any GICS classifications have any liability for any direct, indirect, special, punitive, consequential or any other damages (including lost profits) even if notified of the possibility of such damages. The portfolio risk management process includes an effort to monitor and manage risk, but does not imply low risk. Diversification does not protect an investor from market risk and does not ensure a profit. Past correlations are not indicative of future correlations, which may vary. Fund holdings and allocations shown are unaudited, and may not be representative of current or future investments. Fund holdings and allocations may not include the Fund's entire investment portfolio, which may change at any time. Fund holdings should not be relied on in making investment decisions and should not be construed as research or investment advice regarding particular securities. Current and future holdings are subject to risk. This material is not authorized for distribution to prospective investors unless preceded or accompanied by a current Prospectus or summary prospectus, if applicable. Investors should consider each Fund's objective, risks, and charges and expenses, and read the summary prospectus, if available, and/orthe Prospectus carefully before investing or sending money. The summary prospectus, if available, and the Prospectus contain this and other information about each Fund and may be obtained from your authorized dealer or from Goldman Sachs & Co. LLC by calling 1-800-621-2550 (C) 2024 Goldman Sachs. All rights reserved. 374621-OTU-06/2024 SMACSAR-24
(a) As of the end of the period covered by this report, the registrant has adopted a code of ethics that applies to the registrant’s principal executive officer, principal financial officer, principal accounting officer or controller, or persons performing similar functions, regardless of whether these individuals are employed by the registrant or a third party (the “Code of Ethics”).
(b) Not applicable.
(c) During the period covered by this report, no amendments were made to the provisions of the Code of Ethics.
(d) During the period covered by this report, the registrant did not grant any waivers, including an implicit waiver, from any provision of the Code of Ethics.
(e) Not applicable.
(f) A copy of the Code of Ethics is available as provided in Item 14(a)(1) of this report.
| ITEM 3. | AUDIT COMMITTEE FINANCIAL EXPERT. |
The registrant’s board of trustees has determined that the registrant has at least one “audit committee financial expert” (as defined in Item 3 of Form N-CSR) serving on its audit committee. Kathryn A. Cassidy and Michael Latham are each an “audit committee financial expert” and “independent” (as each term is defined in Item 3 of Form N-CSR).
| ITEM 4. | PRINCIPAL ACCOUNTANT FEES AND SERVICES. |
The information required by this Item is only required in an annual report on this Form N-CSR.
| ITEM 5. | AUDIT COMMITTEE OF LISTED REGISTRANTS. |
| ITEM 6. | SCHEDULE OF INVESTMENTS. |
| | Schedule of Investments is included as part of the Report to Shareholders filed under Item 1. |
| ITEM 7. | DISCLOSURE OF PROXY VOTING POLICIES AND PROCEDURES FOR CLOSED-END MANAGEMENT INVESTMENT COMPANIES. |
| ITEM 8. | PORTFOLIO MANAGERS OF CLOSED-END MANAGEMENT INVESTMENT COMPANIES. |
| ITEM 9. | PURCHASES OF EQUITY SECURITIES BY CLOSED-END MANAGEMENT INVESTMENT COMPANY AND AFFILIATED PURCHASERS. |
| ITEM 10. | SUBMISSION OF MATTERS TO A VOTE OF SECURITY HOLDERS. |
| | There have been no material changes to the procedures by which shareholders may recommend nominees to the registrant’s board of trustees. |
| ITEM 11. | CONTROLS AND PROCEDURES. |
| | (a) | The registrant’s principal executive and principal financial officers, or persons performing similar functions have concluded that the registrant’s disclosure controls and procedures (as defined in Rule 30a-3(c) under the Investment Company Act of 1940, as amended (the “1940 Act”)) are effective as of a date within 90 days of the filing of this report that includes the disclosure required by this paragraph, based on the evaluation of these controls and procedures required by Rule 30a-3(b) under the 1940 Act and 15d-15(b) under the Securities Exchange Act of 1934, as amended. |
| | (b) | There were no changes in the registrant’s internal control over financial reporting (as defined in Rule 30a-3(d) under the 1940 Act) that occurred during the period covered by this report that have materially affected, or are reasonably likely to materially affect, the registrant’s internal control over financial reporting. |
| ITEM 12. | DISCLOSURE OF SECURITIES LENDING ACTIVITIES FOR CLOSED-END MANAGEMENT INVESTMENT COMPANIES. |
| ITEM 13. | RECOVERY OF ERRONEOUSLY AWARDED COMPENSATION. |
SIGNATURES
Pursuant to the requirements of the Securities Exchange Act of 1934 and the Investment Company Act of 1940, the registrant has duly caused this report to be signed on its behalf by the undersigned, thereunto duly authorized.
| | | | |
| | | | Goldman Sachs Trust II |
| | |
| By: | | | | /s/ James A. McNamara |
| | |
| | | | James A. McNamara |
| | | | President/Chief Executive Officer |
| | | | Goldman Sachs Trust II |
| | |
| Date: | | | | June 28, 2024 |
Pursuant to the requirements of the Securities Exchange Act of 1934 and the Investment Company Act of 1940, this report has been signed below by the following persons on behalf of the registrant and in the capacities and on the dates indicated.
| | | | |
| | |
| By: | | | | /s/ James A. McNamara |
| | |
| | | | James A. McNamara |
| | | | President/Chief Executive Officer |
| | | | Goldman Sachs Trust II |
| | |
| Date: | | | | June 28, 2024 |
| | |
| By: | | | | /s/ Joseph F. DiMaria |
| | |
| | | | Joseph F. DiMaria |
| | | | Principal Financial Officer |
| | | | Goldman Sachs Trust II |
| | |
| Date: | | | | June 28, 2024 |