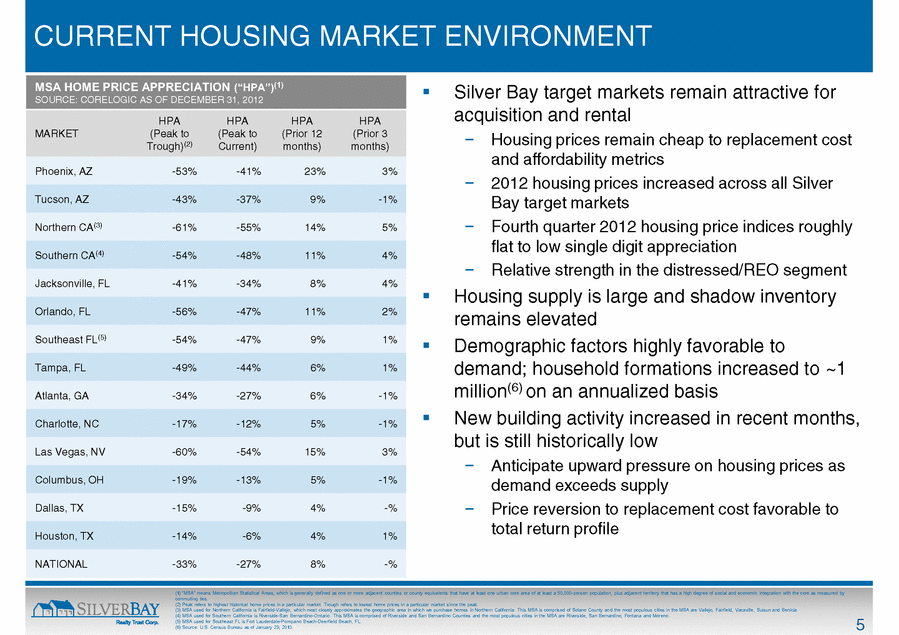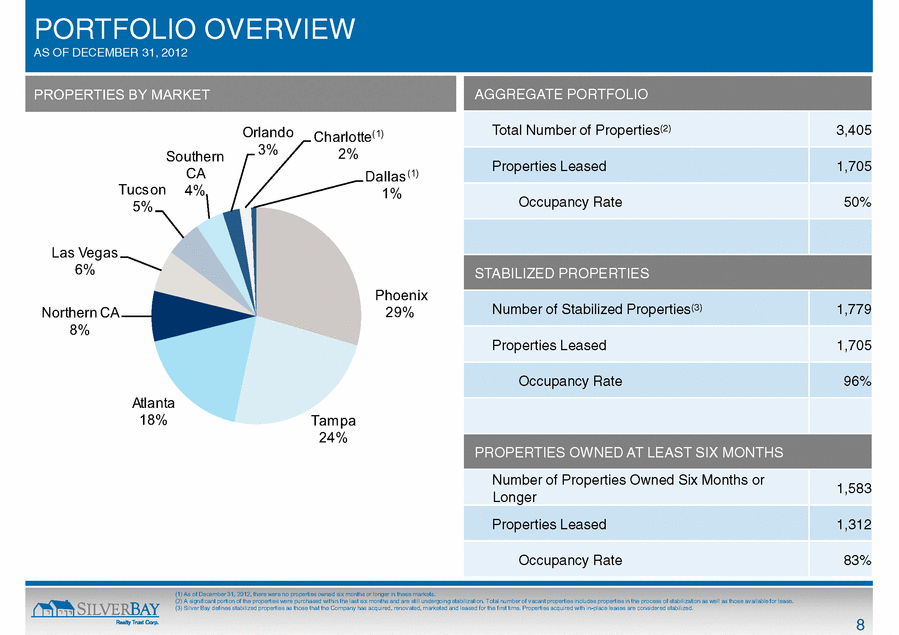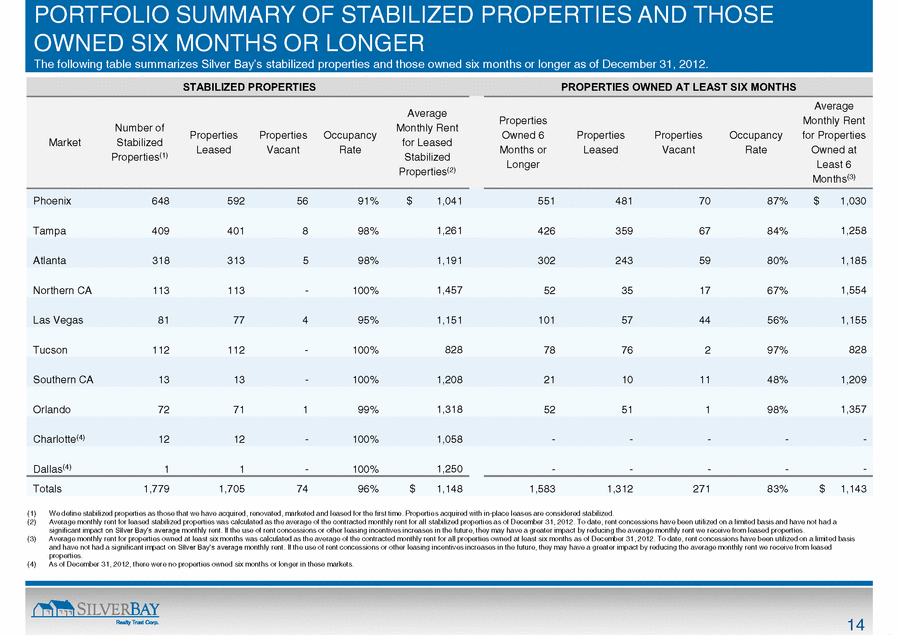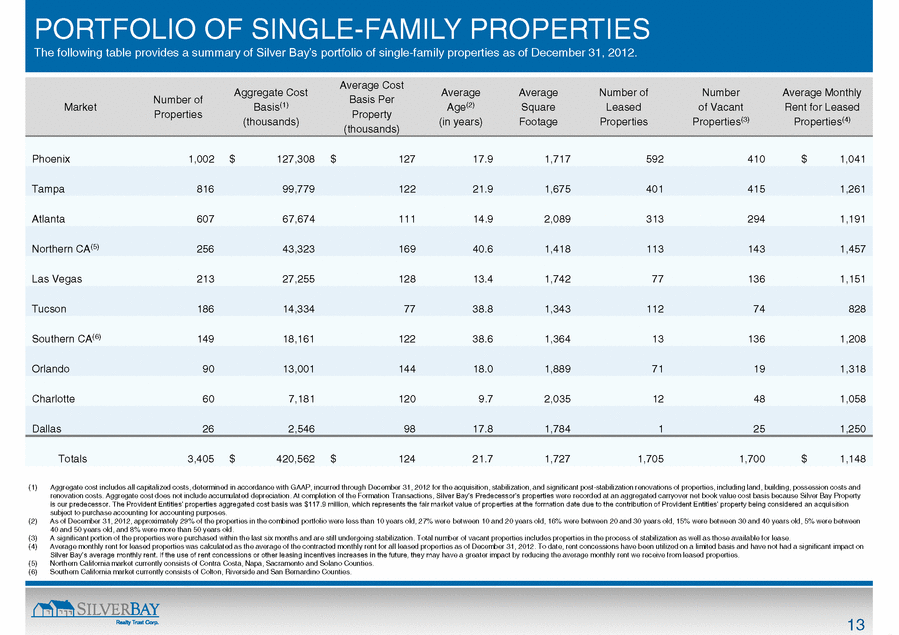
| 13 PORTFOLIO OF SINGLE-FAMILY PROPERTIES The following table provides a summary of of single-family properties as of December 31, 2012. Market Number of Properties Aggregate Cost Basis(1) (thousands) Average Cost Basis Per Property (thousands) Average Age(2) (in years) Average Square Footage Number of Leased Properties Number of Vacant Properties(3) Average Monthly Rent for Leased Properties(4) Phoenix 1,002 $ 127,308 $ 127 17.9 1,717 592 410 $ 1,041 Tampa 816 99,779 122 21.9 1,675 401 415 1,261 Atlanta 607 67,674 111 14.9 2,089 313 294 1,191 Northern CA(5) 256 43,323 169 40.6 1,418 113 143 1,457 Las Vegas 213 27,255 128 13.4 1,742 77 136 1,151 Tucson 186 14,334 77 38.8 1,343 112 74 828 Southern CA(6) 149 18,161 122 38.6 1,364 13 136 1,208 Orlando 90 13,001 144 18.0 1,889 71 19 1,318 Charlotte 60 7,181 120 9.7 2,035 12 48 1,058 Dallas 26 2,546 98 17.8 1,784 1 25 1,250 Totals 3,405 $ 420,562 $ 124 21.7 1,727 1,705 1,700 $ 1,148 (1) Aggregate cost includes all capitalized costs, determined in accordance with GAAP, incurred through December 31, 2012 for the acquisition, stabilization, and significant post-stabilization renovations of properties, including land, building, possession costs and renovation costs. Aggregate cost does not include accumulated depreciation. At completion of the Formation Transactions, were recorded at an aggregated carryover net book value cost basis because Silver Bay Property rkesition subject to purchase accounting for accounting purposes. (2) As of December 31, 2012, approximately 29% of the properties in the combined portfolio were less than 10 years old, 27% were between 10 and 20 years old, 16% were between 20 and 30 years old, 15% were between 30 and 40 years old, 5% were between 40 and 50 years old, and 8% were more than 50 years old. (3) A significant portion of the properties were purchased within the last six months and are still undergoing stabilization. Total number of vacant properties includes properties in the process of stabilization as well as those available for lease. (4) Average monthly rent for leased properties was calculated as the average of the contracted monthly rent for all leased properties as of December 31, 2012. To date, rent concessions have been utilized on a limited basis and have not had a significant impact on ay have a greater impact by reducing the average monthly rent we receive from leased properties. (5) Northern California market currently consists of Contra Costa, Napa, Sacramento and Solano Counties. (6) Southern California market currently consists of Colton, Riverside and San Bernardino Counties. |
