
SILVER BAY REALTY TRUST CORP. F o u r t h Q u a r t e r 2 0 1 3 E a r n i n g s P r e s e n t a t i o n

2 S A F E H A R B O R S T A T E M E N T F O R W A R D - L O O K I N G S T A T E M E N T S This presentation includes “forward-looking statements” within the meaning of the safe harbor provisions of the United States Private Securities Litigation Reform Act of 1995. Actual results may differ from expectations, estimates and projections and, consequently, readers should not rely on these forward-looking statements as predictions of future events. Words such as “expect,” “target,” “assume,” “estimate,” “project,” “budget,” “forecast,” “anticipate,” “intend,” “plan,” “may,” “will,” “could,” “should,” “believe,” “predicts,” “potential,” “continue,” and similar expressions are intended to identify such forward-looking statements. These forward-looking statements involve significant risks and uncertainties that could cause actual results to differ materially from expected results. Factors that could cause actual results to differ include: Silver Bay’s ability to execute share repurchases upon terms acceptable to the company; adverse economic or real estate developments in Silver Bay’s markets; defaults on, early terminations of or non-renewal of leases by residents; difficulties in identifying properties to acquire and completing acquisitions; increased time and/or expense to gain possession and renovate properties; increased vacancy, resident turnover , or turnover costs; Silver Bay’s ability to control or reduce operating expenses, including repairs and maintenance expense and other costs such as real estate taxes, homeowners’ association fees, insurance and other costs outside the Company’s control; Silver Bay’s failure to successfully operate its properties; Silver Bay’s ability to obtain financing arrangements; Silver Bay’s failure to meet the conditions to draw under the credit facility; general volatility of the markets in which it participates; interest rates and the market value of Silver Bay’s assets; the impact of changes in governmental regulations, tax law and rates, and similar matters. Readers are cautioned not to place undue reliance upon any forward-looking statements, which speak only as of the date made. Silver Bay does not undertake or accept any obligation to release publicly any updates or revisions to any forward-looking statement to reflect any change in its expectations or any change in events, conditions or circumstances on which any such statement is based. Additional information concerning these and other risk factors is contained in Silver Bay’s most recent filings with the Securities and Exchange Commission. All subsequent written and oral forward looking statements concerning Silver Bay or matters attributable to Silver Bay or any person acting on its behalf are expressly qualified in their entirety by the cautionary statements above.
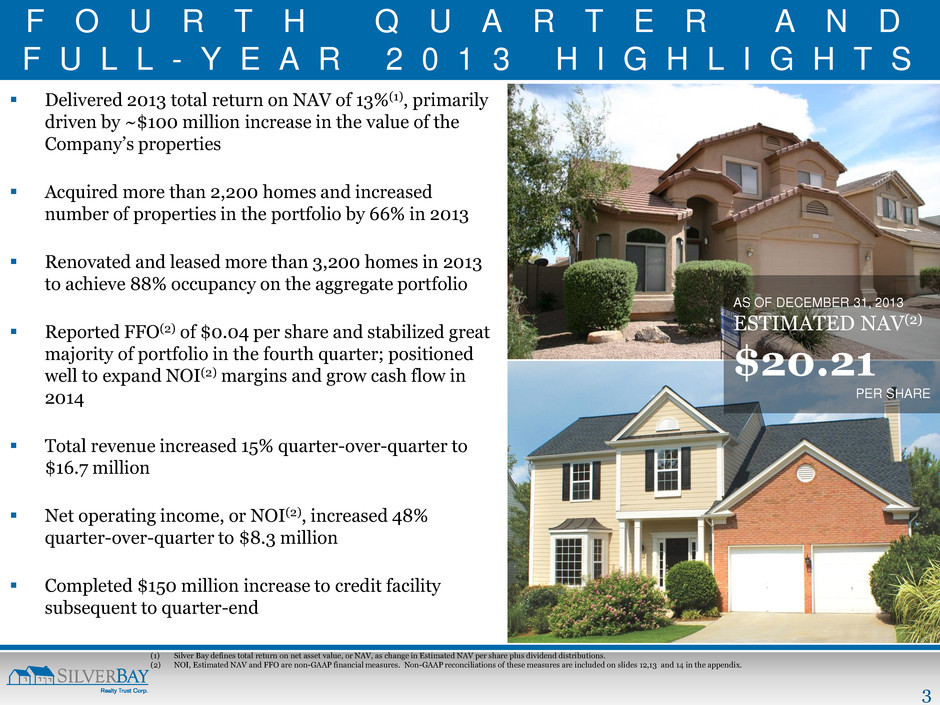
3 F O U R T H Q U A R T E R A N D F U L L - Y E A R 2 0 1 3 H I G H L I G H T S Delivered 2013 total return on NAV of 13%(1), primarily driven by ~$100 million increase in the value of the Company’s properties Acquired more than 2,200 homes and increased number of properties in the portfolio by 66% in 2013 Renovated and leased more than 3,200 homes in 2013 to achieve 88% occupancy on the aggregate portfolio Reported FFO(2) of $0.04 per share and stabilized great majority of portfolio in the fourth quarter; positioned well to expand NOI(2) margins and grow cash flow in 2014 Total revenue increased 15% quarter-over-quarter to $16.7 million Net operating income, or NOI(2), increased 48% quarter-over-quarter to $8.3 million Completed $150 million increase to credit facility subsequent to quarter-end (1) Silver Bay defines total return on net asset value, or NAV, as change in Estimated NAV per share plus dividend distributions. (2) NOI, Estimated NAV and FFO are non-GAAP financial measures. Non-GAAP reconciliations of these measures are included on slides 12,13 and 14 in the appendix. AS OF DECEMBER 31, 2013 ESTIMATED NAV(2) $20.21 PER SHARE
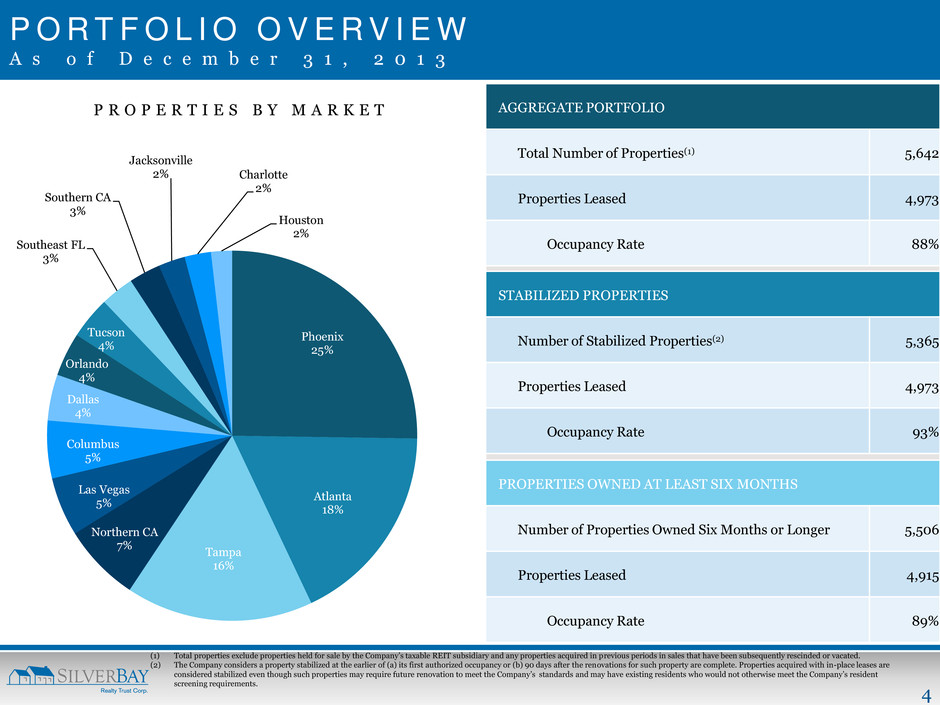
4 P O R T F O L I O O V E R V I E W A s o f D e c e m b e r 3 1 , 2 0 1 3 AGGREGATE PORTFOLIO Total Number of Properties(1) 5,642 Properties Leased 4,973 Occupancy Rate 88% STABILIZED PROPERTIES Number of Stabilized Properties(2) 5,365 Properties Leased 4,973 Occupancy Rate 93% PROPERTIES OWNED AT LEAST SIX MONTHS Number of Properties Owned Six Months or Longer 5,506 Properties Leased 4,915 Occupancy Rate 89% P R O P E R T I E S B Y M A R K E T (1) Total properties exclude properties held for sale by the Company’s taxable REIT subsidiary and any properties acquired in previous periods in sales that have been subsequently rescinded or vacated. (2) The Company considers a property stabilized at the earlier of (a) its first authorized occupancy or (b) 90 days after the renovations for such property are complete. Properties acquired with in-place leases are considered stabilized even though such properties may require future renovation to meet the Company’s standards and may have existing residents who would not otherwise meet the Company’s resident screening requirements. Phoenix 25% Atlanta 18% Tampa 16% Northern CA 7% Las Vegas 5% Columbus 5% Dallas 4% Orlando 4% Tucson 4% Southeast FL 3% Southern CA 3% Jacksonville 2% Charlotte 2% Houston 2%
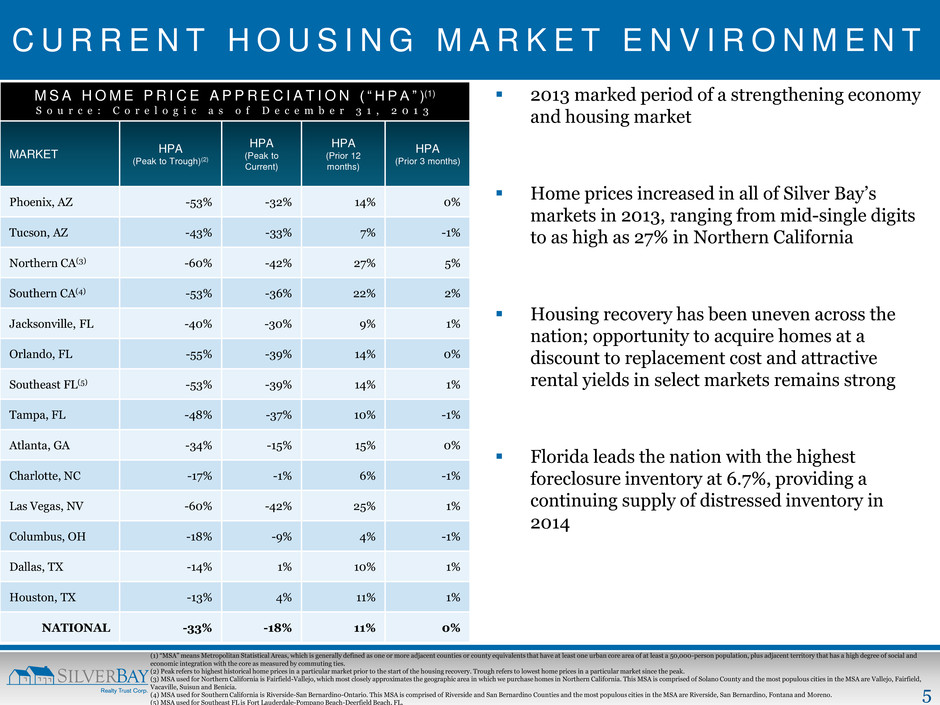
5 C U R R E N T H O U S I N G M A R K E T E N V I R O N M E N T 2013 marked period of a strengthening economy and housing market Home prices increased in all of Silver Bay’s markets in 2013, ranging from mid-single digits to as high as 27% in Northern California Housing recovery has been uneven across the nation; opportunity to acquire homes at a discount to replacement cost and attractive rental yields in select markets remains strong Florida leads the nation with the highest foreclosure inventory at 6.7%, providing a continuing supply of distressed inventory in 2014 (1) “MSA” means Metropolitan Statistical Areas, which is generally defined as one or more adjacent counties or county equivalents that have at least one urban core area of at least a 50,000-person population, plus adjacent territory that has a high degree of social and economic integration with the core as measured by commuting ties. (2) Peak refers to highest historical home prices in a particular market prior to the start of the housing recovery. Trough refers to lowest home prices in a particular market since the peak. (3) MSA used for Northern California is Fairfield-Vallejo, which most closely approximates the geographic area in which we purchase homes in Northern California. This MSA is comprised of Solano County and the most populous cities in the MSA are Vallejo, Fairfield, Vacaville, Suisun and Benicia. (4) MSA used for Southern California is Riverside-San Bernardino-Ontario. This MSA is comprised of Riverside and San Bernardino Counties and the most populous cities in the MSA are Riverside, San Bernardino, Fontana and Moreno. (5) MSA used for Southeast FL is Fort Lauderdale-Pompano Beach-Deerfield Beach, FL. M S A H O M E P R I C E A P P R E C I A T I O N ( “ H P A ” )(1) S o u r c e : C o r e l o g i c a s o f D e c e m b e r 3 1 , 2 0 1 3 MARKET HPA (Peak to Trough)(2) HPA (Peak to Current) HPA (Prior 12 months) HPA (Prior 3 months) Phoenix, AZ -53% -32% 14% 0% Tucson, AZ -43% -33% 7% -1% Northern CA(3) -60% -42% 27% 5% Southern CA(4) -53% -36% 22% 2% Jacksonville, FL -40% -30% 9% 1% Orlando, FL -55% -39% 14% 0% Southeast FL(5) -53% -39% 14% 1% Tampa, FL -48% -37% 10% -1% Atlanta, GA -34% -15% 15% 0% Charlotte, NC -17% -1% 6% -1% Las Vegas, NV -60% -42% 25% 1% Columbus, OH -18% -9% 4% -1% Dallas, TX -14% 1% 10% 1% Houston, TX -13% 4% 11% 1% NATIONAL -33% -18% 11% 0%
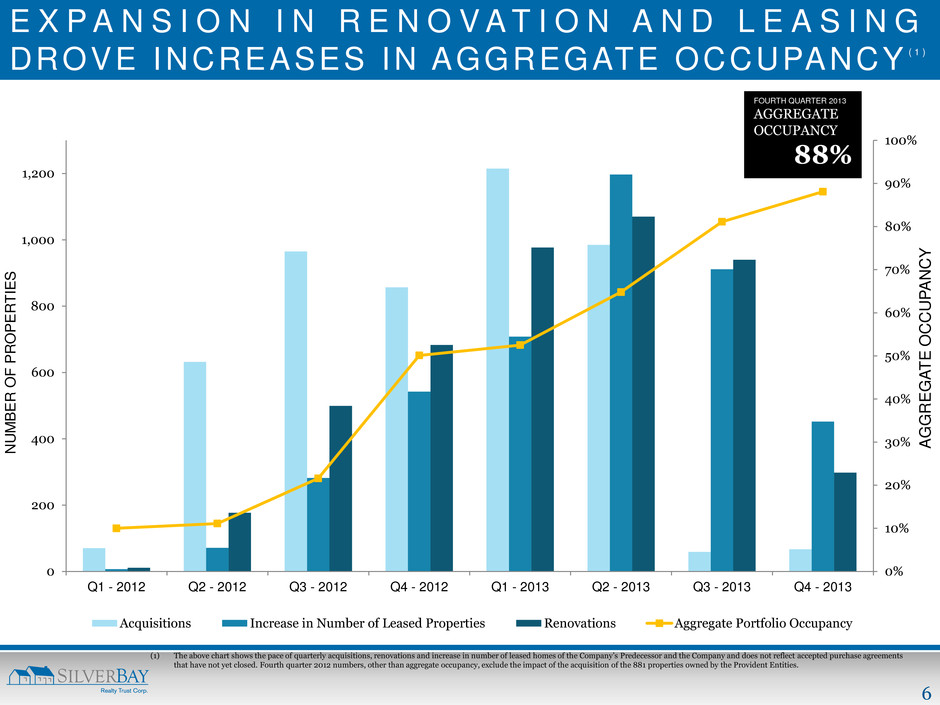
6 0% 10% 20% 30% 40% 50% 60% 70% 80% 90% 100% 0 200 400 600 800 1,000 1,200 Q1 - 2012 Q2 - 2012 Q3 - 2012 Q4 - 2012 Q1 - 2013 Q2 - 2013 Q3 - 2013 Q4 - 2013 AG G RE G AT E OCC UP AN CY NU M BE R O F PR O PE RT IE S Acquisitions Increase in Number of Leased Properties Renovations Aggregate Portfolio Occupancy E X P A N S I O N I N R E N O V A T I O N A N D L E A S I N G DROVE INCREASES IN AGGREGATE OCCUPANCY ( 1 ) (1) The above chart shows the pace of quarterly acquisitions, renovations and increase in number of leased homes of the Company’s Predecessor and the Company and does not reflect accepted purchase agreements that have not yet closed. Fourth quarter 2012 numbers, other than aggregate occupancy, exclude the impact of the acquisition of the 881 properties owned by the Provident Entities. FOURTH QUARTER 2013 AGGREGATE OCCUPANCY 88%
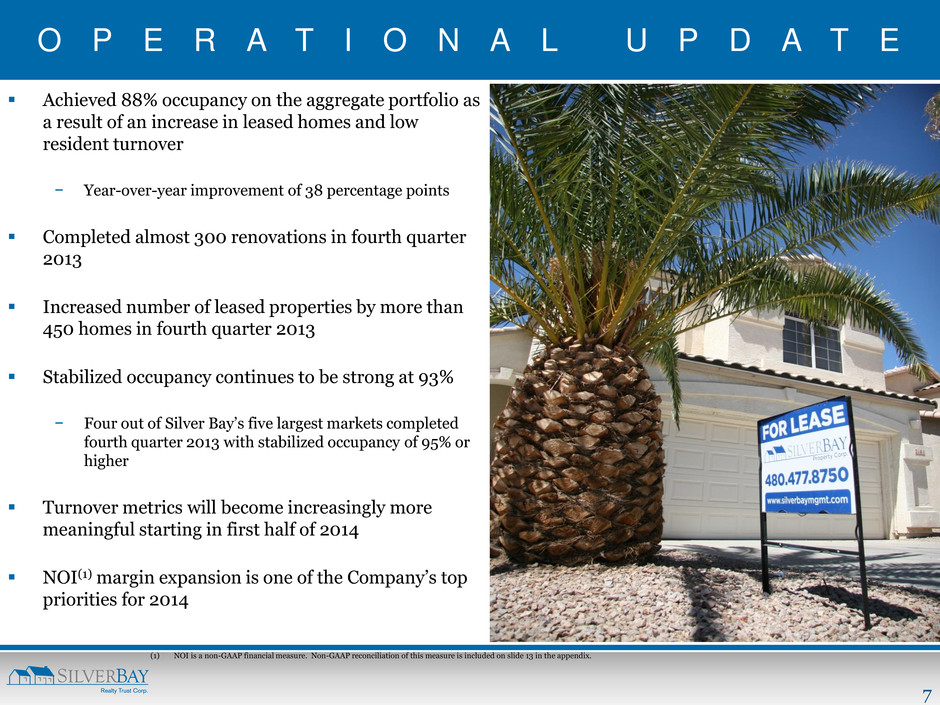
7 O P E R A T I O N A L U P D A T E Achieved 88% occupancy on the aggregate portfolio as a result of an increase in leased homes and low resident turnover − Year-over-year improvement of 38 percentage points Completed almost 300 renovations in fourth quarter 2013 Increased number of leased properties by more than 450 homes in fourth quarter 2013 Stabilized occupancy continues to be strong at 93% − Four out of Silver Bay’s five largest markets completed fourth quarter 2013 with stabilized occupancy of 95% or higher Turnover metrics will become increasingly more meaningful starting in first half of 2014 NOI(1) margin expansion is one of the Company’s top priorities for 2014 (1) NOI is a non-GAAP financial measure. Non-GAAP reconciliation of this measure is included on slide 13 in the appendix.
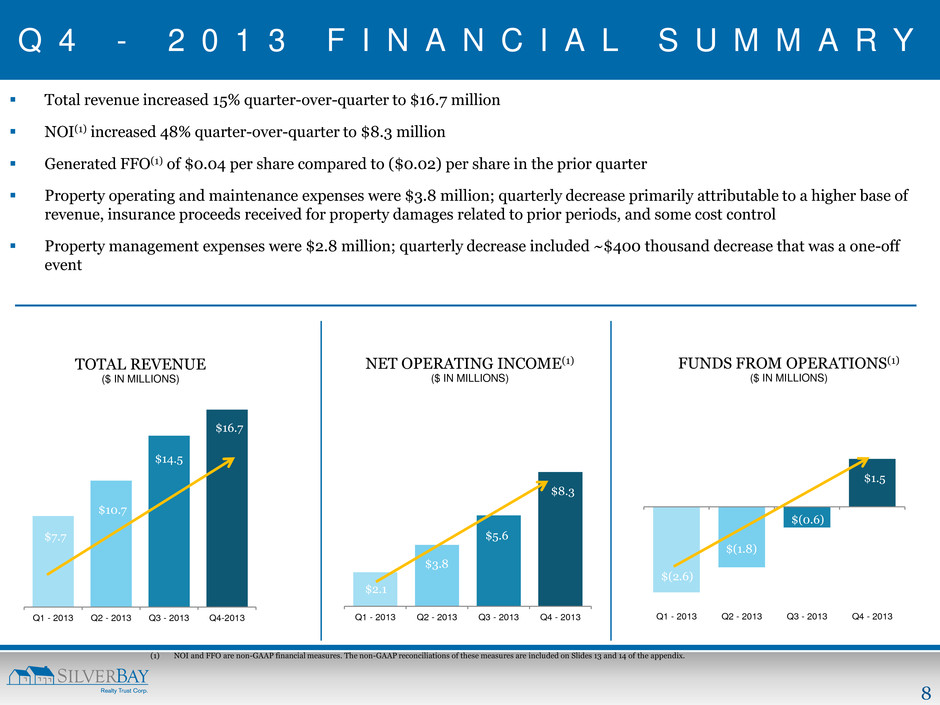
8 $7.7 $10.7 $14.5 $16.7 Q1 - 2013 Q2 - 2013 Q3 - 2013 Q4-2013 TOTAL REVENUE ($ IN MILLIONS) Q 4 - 2 0 1 3 F I N A N C I A L S U M M A R Y Total revenue increased 15% quarter-over-quarter to $16.7 million NOI(1) increased 48% quarter-over-quarter to $8.3 million Generated FFO(1) of $0.04 per share compared to ($0.02) per share in the prior quarter Property operating and maintenance expenses were $3.8 million; quarterly decrease primarily attributable to a higher base of revenue, insurance proceeds received for property damages related to prior periods, and some cost control Property management expenses were $2.8 million; quarterly decrease included ~$400 thousand decrease that was a one-off event $2.1 $3.8 $5.6 $8.3 Q1 - 2013 Q2 - 2013 Q3 - 2013 Q4 - 2013 NET OPERATING INCOME(1) ($ IN MILLIONS) (1) NOI and FFO are non-GAAP financial measures. The non-GAAP reconciliations of these measures are included on Slides 13 and 14 of the appendix. $(2.6) $(1.8) $(0.6) $1.5 Q1 - 2013 Q2 - 2013 Q3 - 2013 Q4 - 2013 FUNDS FROM OPERATIONS(1) ($ IN MILLIONS)
9 A P P E N D I X
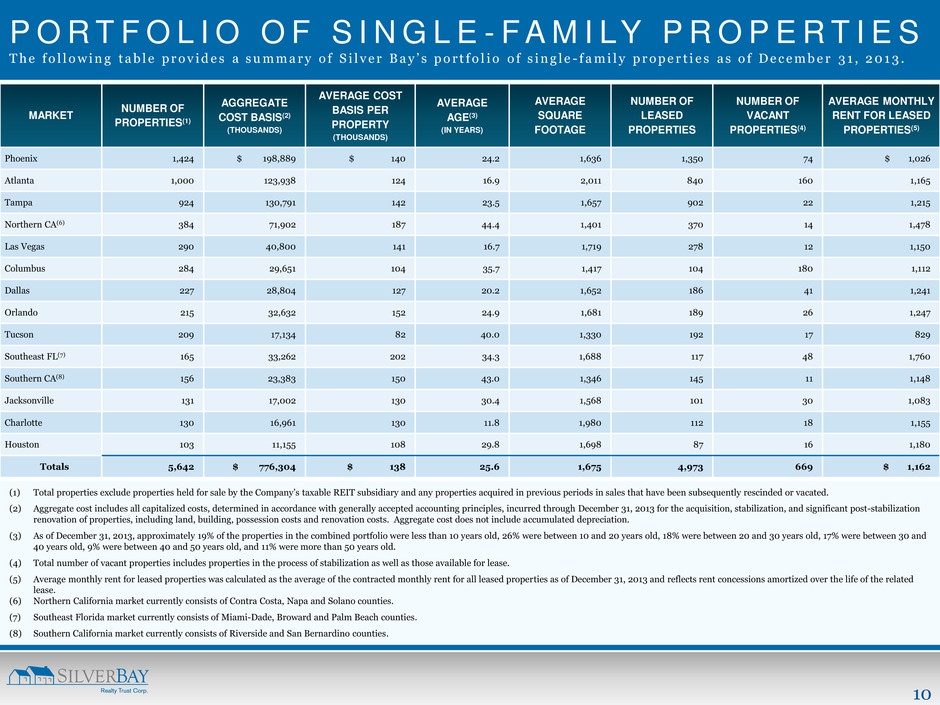
10 P O R T F O L I O O F S I N G L E - F A M I LY P R O P E R T I E S T h e f o l l o w i n g t a b l e p r o v i d e s a s u m m a r y o f S i l v e r Bay ’ s po r t f o l i o o f s i n g l e - f a m i l y p r o p e r t i e s a s o f D e c e m b e r 3 1 , 2 0 1 3 . (1) Total properties exclude properties held for sale by the Company’s taxable REIT subsidiary and any properties acquired in previous periods in sales that have been subsequently rescinded or vacated. (2) Aggregate cost includes all capitalized costs, determined in accordance with generally accepted accounting principles, incurred through December 31, 2013 for the acquisition, stabilization, and significant post-stabilization renovation of properties, including land, building, possession costs and renovation costs. Aggregate cost does not include accumulated depreciation. (3) As of December 31, 2013, approximately 19% of the properties in the combined portfolio were less than 10 years old, 26% were between 10 and 20 years old, 18% were between 20 and 30 years old, 17% were between 30 and 40 years old, 9% were between 40 and 50 years old, and 11% were more than 50 years old. (4) Total number of vacant properties includes properties in the process of stabilization as well as those available for lease. (5) Average monthly rent for leased properties was calculated as the average of the contracted monthly rent for all leased properties as of December 31, 2013 and reflects rent concessions amortized over the life of the related lease. (6) Northern California market currently consists of Contra Costa, Napa and Solano counties. (7) Southeast Florida market currently consists of Miami-Dade, Broward and Palm Beach counties. (8) Southern California market currently consists of Riverside and San Bernardino counties. MARKET NUMBER OF PROPERTIES(1) AGGREGATE COST BASIS(2) (THOUSANDS) AVERAGE COST BASIS PER PROPERTY (THOUSANDS) AVERAGE AGE(3) (IN YEARS) AVERAGE SQUARE FOOTAGE NUMBER OF LEASED PROPERTIES NUMBER OF VACANT PROPERTIES(4) AVERAGE MONTHLY RENT FOR LEASED PROPERTIES(5) Phoenix 1,424 $ 198,889 $ 140 24.2 1,636 1,350 74 $ 1,026 Atlanta 1,000 123,938 124 16.9 2,011 840 160 1,165 Tampa 924 130,791 142 23.5 1,657 902 22 1,215 Northern CA(6) 384 71,902 187 44.4 1,401 370 14 1,478 Las Vegas 290 40,800 141 16.7 1,719 278 12 1,150 Columbus 284 29,651 104 35.7 1,417 104 180 1,112 Dallas 227 28,804 127 20.2 1,652 186 41 1,241 Orlando 215 32,632 152 24.9 1,681 189 26 1,247 Tucson 209 17,134 82 40.0 1,330 192 17 829 Southeast FL(7) 165 33,262 202 34.3 1,688 117 48 1,760 Southern CA(8) 156 23,383 150 43.0 1,346 145 11 1,148 Jacksonville 131 17,002 130 30.4 1,568 101 30 1,083 Charlotte 130 16,961 130 11.8 1,980 112 18 1,155 Houston 103 11,155 108 29.8 1,698 87 16 1,180 Totals 5,642 $ 776,304 $ 138 25.6 1,675 4,973 669 $ 1,162
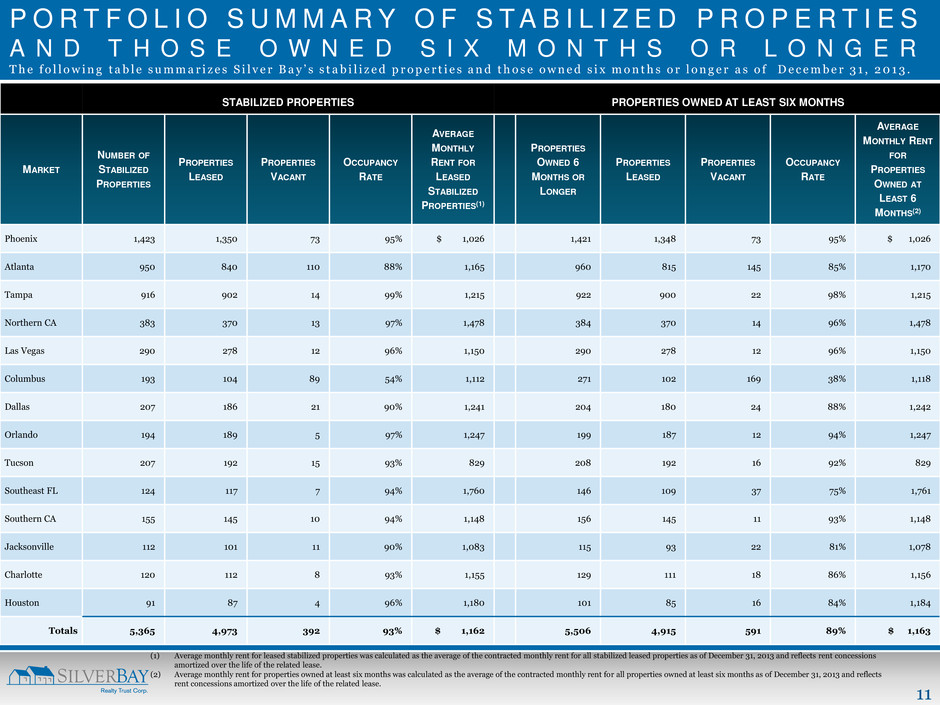
11 STABILIZED PROPERTIES PROPERTIES OWNED AT LEAST SIX MONTHS MARKET NUMBER OF STABILIZED PROPERTIES PROPERTIES LEASED PROPERTIES VACANT OCCUPANCY RATE AVERAGE MONTHLY RENT FOR LEASED STABILIZED PROPERTIES(1) PROPERTIES OWNED 6 MONTHS OR LONGER PROPERTIES LEASED PROPERTIES VACANT OCCUPANCY RATE AVERAGE MONTHLY RENT FOR PROPERTIES OWNED AT LEAST 6 MONTHS(2) Phoenix 1,423 1,350 73 95% $ 1,026 1,421 1,348 73 95% $ 1,026 Atlanta 950 840 110 88% 1,165 960 815 145 85% 1,170 Tampa 916 902 14 99% 1,215 922 900 22 98% 1,215 Northern CA 383 370 13 97% 1,478 384 370 14 96% 1,478 Las Vegas 290 278 12 96% 1,150 290 278 12 96% 1,150 Columbus 193 104 89 54% 1,112 271 102 169 38% 1,118 Dallas 207 186 21 90% 1,241 204 180 24 88% 1,242 Orlando 194 189 5 97% 1,247 199 187 12 94% 1,247 Tucson 207 192 15 93% 829 208 192 16 92% 829 Southeast FL 124 117 7 94% 1,760 146 109 37 75% 1,761 Southern CA 155 145 10 94% 1,148 156 145 11 93% 1,148 Jacksonville 112 101 11 90% 1,083 115 93 22 81% 1,078 Charlotte 120 112 8 93% 1,155 129 111 18 86% 1,156 Houston 91 87 4 96% 1,180 101 85 16 84% 1,184 Totals 5,365 4,973 392 93% $ 1,162 5,506 4,915 591 89% $ 1,163 P O R T F O L I O S U M M A R Y O F S T A B I L I Z E D P R O P E R T I E S A N D T H O S E O W N E D S I X M O N T H S O R L O N G E R T h e f o l l o w i n g t a b l e s u m m a r i z e s S i l v e r B a y ’ s s t a b i l i z e d p r o p e r t i e s a n d t h o s e o w n e d s i x m o n t h s o r l o n g e r a s o f D e c e m b e r 3 1 , 2 0 1 3 . (1) Average monthly rent for leased stabilized properties was calculated as the average of the contracted monthly rent for all stabilized leased properties as of December 31, 2013 and reflects rent concessions amortized over the life of the related lease. (2) Average monthly rent for properties owned at least six months was calculated as the average of the contracted monthly rent for all properties owned at least six months as of December 31, 2013 and reflects rent concessions amortized over the life of the related lease.
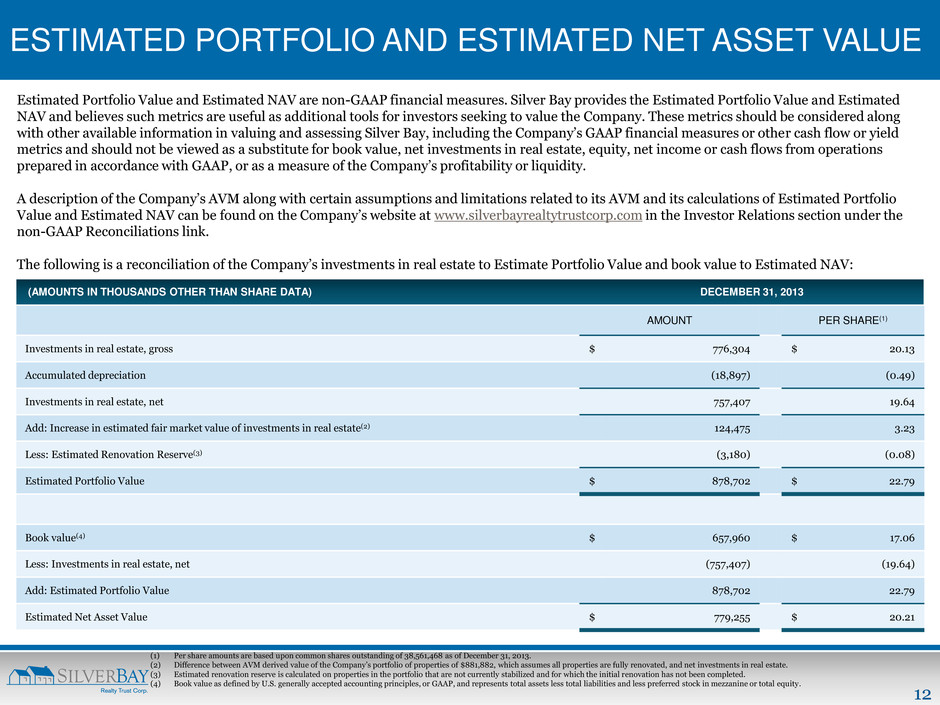
12 ESTIMATED PORTFOLIO AND ESTIMATED NET ASSET VALUE Estimated Portfolio Value and Estimated NAV are non-GAAP financial measures. Silver Bay provides the Estimated Portfolio Value and Estimated NAV and believes such metrics are useful as additional tools for investors seeking to value the Company. These metrics should be considered along with other available information in valuing and assessing Silver Bay, including the Company’s GAAP financial measures or other cash flow or yield metrics and should not be viewed as a substitute for book value, net investments in real estate, equity, net income or cash flows from operations prepared in accordance with GAAP, or as a measure of the Company’s profitability or liquidity. A description of the Company’s AVM along with certain assumptions and limitations related to its AVM and its calculations of Estimated Portfolio Value and Estimated NAV can be found on the Company’s website at www.silverbayrealtytrustcorp.com in the Investor Relations section under the non-GAAP Reconciliations link. The following is a reconciliation of the Company’s investments in real estate to Estimate Portfolio Value and book value to Estimated NAV: (1) Per share amounts are based upon common shares outstanding of 38,561,468 as of December 31, 2013. (2) Difference between AVM derived value of the Company’s portfolio of properties of $881,882, which assumes all properties are fully renovated, and net investments in real estate. (3) Estimated renovation reserve is calculated on properties in the portfolio that are not currently stabilized and for which the initial renovation has not been completed. (4) Book value as defined by U.S. generally accepted accounting principles, or GAAP, and represents total assets less total liabilities and less preferred stock in mezzanine or total equity. (AMOUNTS IN THOUSANDS OTHER THAN SHARE DATA) DECEMBER 31, 2013 AMOUNT PER SHARE(1) Investments in real estate, gross $ 776,304 $ 20.13 Accumulated depreciation (18,897) (0.49) Investments in real estate, net 757,407 19.64 Add: Increase in estimated fair market value of investments in real estate(2) 124,475 3.23 Less: Estimated Renovation Reserve(3) (3,180) (0.08) Estimated Portfolio Value $ 878,702 $ 22.79 Book value(4) $ 657,960 $ 17.06 Less: Investments in real estate, net (757,407) (19.64) Add: Estimated Portfolio Value 878,702 22.79 Estimated Net Asset Value $ 779,255 $ 20.21
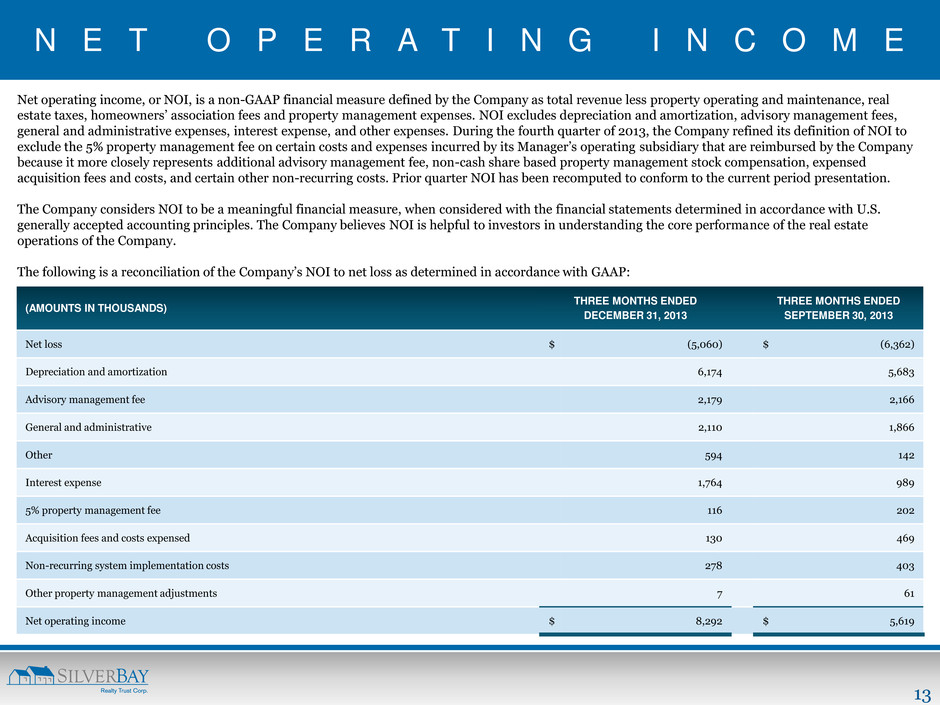
13 N E T O P E R A T I N G I N C O M E Net operating income, or NOI, is a non-GAAP financial measure defined by the Company as total revenue less property operating and maintenance, real estate taxes, homeowners’ association fees and property management expenses. NOI excludes depreciation and amortization, advisory management fees, general and administrative expenses, interest expense, and other expenses. During the fourth quarter of 2013, the Company refined its definition of NOI to exclude the 5% property management fee on certain costs and expenses incurred by its Manager’s operating subsidiary that are reimbursed by the Company because it more closely represents additional advisory management fee, non-cash share based property management stock compensation, expensed acquisition fees and costs, and certain other non-recurring costs. Prior quarter NOI has been recomputed to conform to the current period presentation. The Company considers NOI to be a meaningful financial measure, when considered with the financial statements determined in accordance with U.S. generally accepted accounting principles. The Company believes NOI is helpful to investors in understanding the core performance of the real estate operations of the Company. The following is a reconciliation of the Company’s NOI to net loss as determined in accordance with GAAP: (AMOUNTS IN THOUSANDS) THREE MONTHS ENDED DECEMBER 31, 2013 THREE MONTHS ENDED SEPTEMBER 30, 2013 Net loss $ (5,060) $ (6,362) Depreciation and amortization 6,174 5,683 Advisory management fee 2,179 2,166 General and administrative 2,110 1,866 Other 594 142 Interest expense 1,764 989 5% property management fee 116 202 Acquisition fees and costs expensed 130 469 Non-recurring system implementation costs 278 403 Other property management adjustments 7 61 Net operating income $ 8,292 $ 5,619
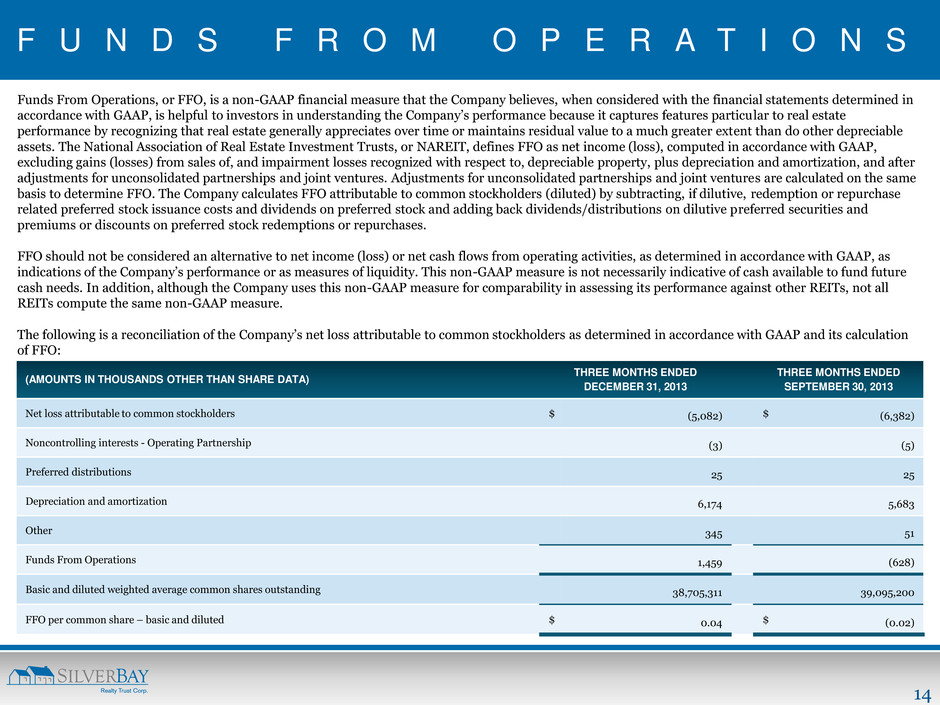
14 F U N D S F R O M O P E R A T I O N S Funds From Operations, or FFO, is a non-GAAP financial measure that the Company believes, when considered with the financial statements determined in accordance with GAAP, is helpful to investors in understanding the Company’s performance because it captures features particular to real estate performance by recognizing that real estate generally appreciates over time or maintains residual value to a much greater extent than do other depreciable assets. The National Association of Real Estate Investment Trusts, or NAREIT, defines FFO as net income (loss), computed in accordance with GAAP, excluding gains (losses) from sales of, and impairment losses recognized with respect to, depreciable property, plus depreciation and amortization, and after adjustments for unconsolidated partnerships and joint ventures. Adjustments for unconsolidated partnerships and joint ventures are calculated on the same basis to determine FFO. The Company calculates FFO attributable to common stockholders (diluted) by subtracting, if dilutive, redemption or repurchase related preferred stock issuance costs and dividends on preferred stock and adding back dividends/distributions on dilutive preferred securities and premiums or discounts on preferred stock redemptions or repurchases. FFO should not be considered an alternative to net income (loss) or net cash flows from operating activities, as determined in accordance with GAAP, as indications of the Company’s performance or as measures of liquidity. This non-GAAP measure is not necessarily indicative of cash available to fund future cash needs. In addition, although the Company uses this non-GAAP measure for comparability in assessing its performance against other REITs, not all REITs compute the same non-GAAP measure. The following is a reconciliation of the Company’s net loss attributable to common stockholders as determined in accordance with GAAP and its calculation of FFO: (AMOUNTS IN THOUSANDS OTHER THAN SHARE DATA) THREE MONTHS ENDED DECEMBER 31, 2013 THREE MONTHS ENDED SEPTEMBER 30, 2013 Net loss attributable to common stockholders $ (5,082) $ (6,382) Noncontrolling interests - Operating Partnership (3) (5) Preferred distributions 25 25 Depreciation and amortization 6,174 5,683 Other 345 51 Funds From Operations 1,459 (628) Basic and diluted weighted average common shares outstanding 38,705,311 39,095,200 FFO per common share – basic and diluted $ 0.04 $ (0.02)

601 CARLSON PARKWAY | SUITE 250 | MINNETONKA | MN | 55305 P: 952.358.4400 | E: INVES TO RS@ SILVERBAYMGMT .C OM


