
SILVER BAY REALTY TRUST CORP. J u l y 2 0 1 4
2 S A F E H A R B O R S T A T E M E N T F O R W A R D - L O O K I N G S T A T E M E N T S This presentation includes “forward-looking statements” within the meaning of the safe harbor provisions of the United States Private Securities Litigation Reform Act of 1995. Actual results may differ from expectations, estimates and projections and, consequently, readers should not rely on these forward-looking statements as predictions of future events. Words such as “expect,” “target,” “assume,” “estimate,” “project,” “budget,” “forecast,” “anticipate,” “intend,” “plan,” “may,” “will,” “could,” “should,” “believe,” “predicts,” “potential,” “continue,” and similar expressions are intended to identify such forward-looking statements. These forward-looking statements involve significant risks and uncertainties that could cause actual results to differ materially from expected results. Factors that could cause actual results to differ include: Silver Bay’s ability to execute share repurchases upon terms acceptable to the company; adverse economic or real estate developments in Silver Bay’s markets; defaults on, early terminations of or non-renewal of leases by residents; difficulties in identifying properties to acquire and completing acquisitions; increased time and/or expense to gain possession and renovate properties; increased vacancy, resident turnover , or turnover costs; Silver Bay’s ability to control or reduce operating expenses, including repairs and maintenance expense and other costs such as real estate taxes, homeowners’ association fees, insurance and other costs outside the Company’s control; Silver Bay’s failure to successfully operate its properties; Silver Bay’s ability to obtain financing arrangements; Silver Bay’s failure to meet the conditions to draw under the credit facility; general volatility of the markets in which it participates; interest rates and the market value of Silver Bay’s assets; the impact of changes in governmental regulations, tax law and rates, and similar matters. Readers are cautioned not to place undue reliance upon any forward-looking statements, which speak only as of the date made. Silver Bay does not undertake or accept any obligation to release publicly any updates or revisions to any forward-looking statement to reflect any change in its expectations or any change in events, conditions or circumstances on which any such statement is based. Additional information concerning these and other risk factors is contained in Silver Bay’s most recent filings with the Securities and Exchange Commission. All subsequent written and oral forward looking statements concerning Silver Bay or matters attributable to Silver Bay or any person acting on its behalf are expressly qualified in their entirety by the cautionary statements above.
3 S I L V E R B A Y R E A L T Y T R U S T C O R P . First publicly traded single-family residential REIT formed in 2012 − Combination of Provident Entities and Two Harbors portfolio(1) Mission of bringing institutional experience to the single-family rental market Capitalize on generational opportunity created by dislocations in U.S. housing market − Acquire single-family properties at significant discount to replacement cost − Focus on markets with strong demographic and macroeconomic indicators − Satisfy growing demand for high quality home rentals Diversified portfolio of more than 5,800(2) single-family properties in Arizona, California, Florida, Georgia, Nevada, North Carolina, Ohio and Texas Total cost basis of more than $795 million and total market capitalization of $614 million(2) (1) Silver Bay acquired five limited liability companies managed by Provident Real Estate Advisors LLC that the Company refers to as the Provident Entities. Silver Bay acquired Silver Bay Property Investment LLC (formerly Two Harbors Property Investment LLC), a wholly owned subsidiary of Two Harbors Investment Corp. The Company refers to Silver Bay Property Investment LLC as its Predecessor. (2) As of April 30, 2014, Silver Bay owned a portfolio of more than 5,800 single-family properties. Total cost basis of portfolio as of March 31, 2014. Market capitalization calculated as of market close on July 15, 2014. Ticker NYSE: SBY Board Board with broad public company and real estate experience Management Seasoned team with extensive public company and investing knowledge as well as single-family residential and real estate experience Portfolio As of March 31, 2014, more than $795 million invested in 5,748 homes in 8 states; as of April 30, 2014, Silver Bay owned more than 5,800 homes Objective Focused on the acquisition, renovation, leasing and management of single-family properties for rental income and long-term capital appreciation Capital Availability under $350 million credit facility allows for continued acquisitions
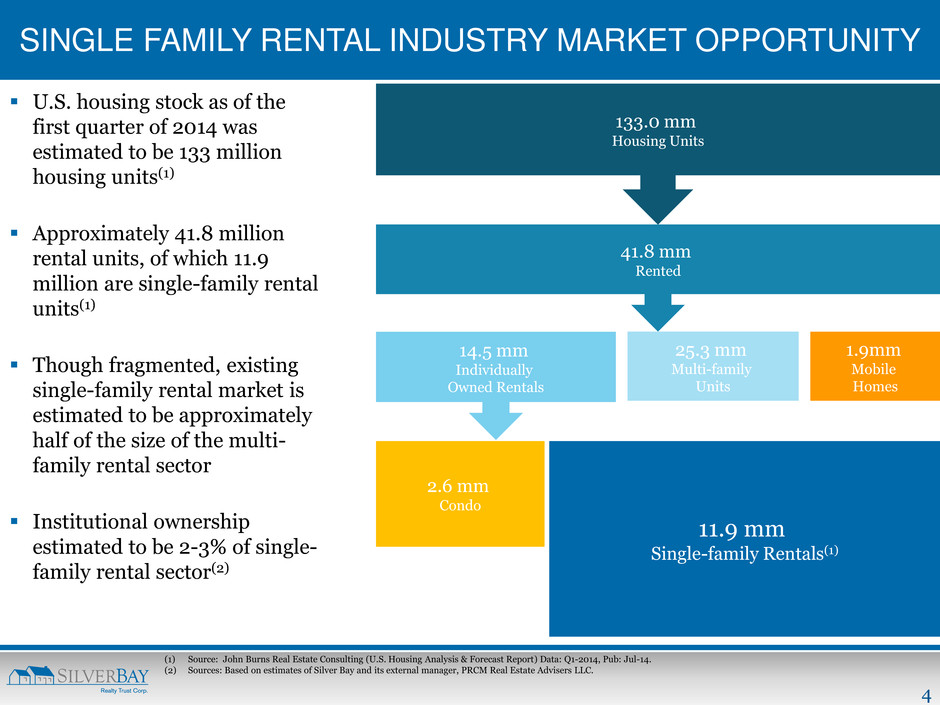
4 (1) Source: John Burns Real Estate Consulting (U.S. Housing Analysis & Forecast Report) Data: Q1-2014, Pub: Jul-14. (2) Sources: Based on estimates of Silver Bay and its external manager, PRCM Real Estate Advisers LLC. SINGLE FAMILY RENTAL INDUSTRY MARKET OPPORTUNITY U.S. housing stock as of the first quarter of 2014 was estimated to be 133 million housing units(1) Approximately 41.8 million rental units, of which 11.9 million are single-family rental units(1) Though fragmented, existing single-family rental market is estimated to be approximately half of the size of the multi- family rental sector Institutional ownership estimated to be 2-3% of single- family rental sector(2) 133.0 mm Housing Units 41.8 mm Rented 14.5 mm Individually Owned Rentals 25.3 mm Multi-family Units 2.6 mm Condo 11.9 mm Single-family Rentals(1) 1.9mm Mobile Homes
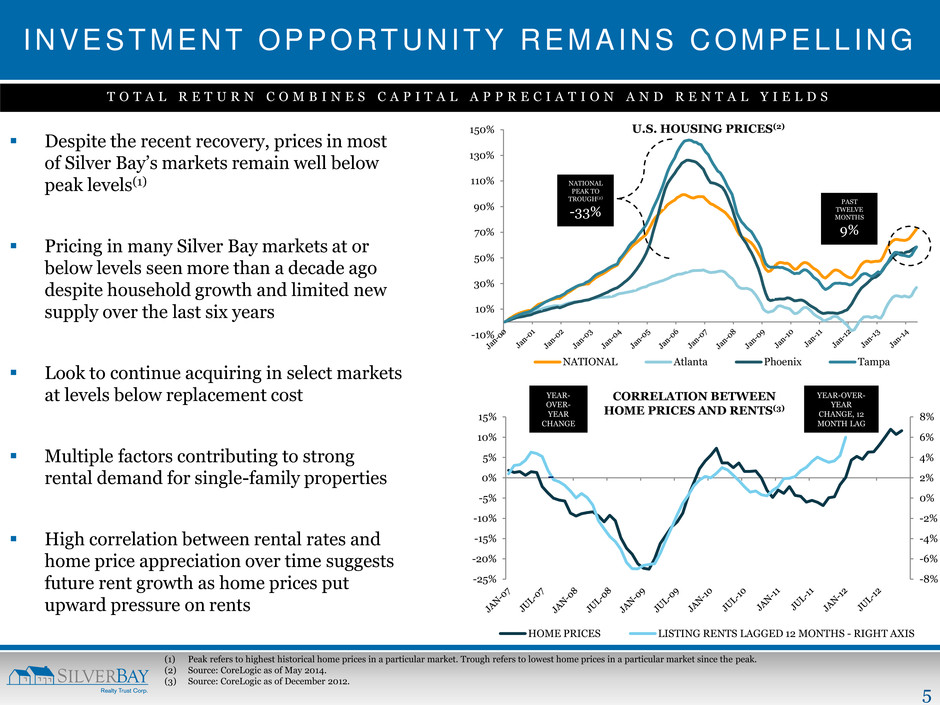
5 -8% -6% -4% -2% 0% 2% 4% 6% 8% -25% -20% -15% -10% -5% 0% 5% 10% 15% HOME PRICES LISTING RENTS LAGGED 12 MONTHS - RIGHT AXIS -10% 10% 30% 50% 70% 90% 110% 130% 150% NATIONAL Atlanta Phoenix Tampa INVESTMENT OPPORTUNITY REMAINS COMPELL ING Despite the recent recovery, prices in most of Silver Bay’s markets remain well below peak levels(1) Pricing in many Silver Bay markets at or below levels seen more than a decade ago despite household growth and limited new supply over the last six years Look to continue acquiring in select markets at levels below replacement cost Multiple factors contributing to strong rental demand for single-family properties High correlation between rental rates and home price appreciation over time suggests future rent growth as home prices put upward pressure on rents T O T A L R E T U R N C O M B I N E S C A P I T A L A P P R E C I A T I O N A N D R E N T A L Y I E L D S NATIONAL PEAK TO TROUGH(2) -33% PAST TWELVE MONTHS 9% (1) Peak refers to highest historical home prices in a particular market. Trough refers to lowest home prices in a particular market since the peak. (2) Source: CoreLogic as of May 2014. (3) Source: CoreLogic as of December 2012. U.S. HOUSING PRICES(2) YEAR- OVER- YEAR CHANGE YEAR-OVER- YEAR CHANGE, 12 MONTH LAG CORRELATION BETWEEN HOME PRICES AND RENTS(3)
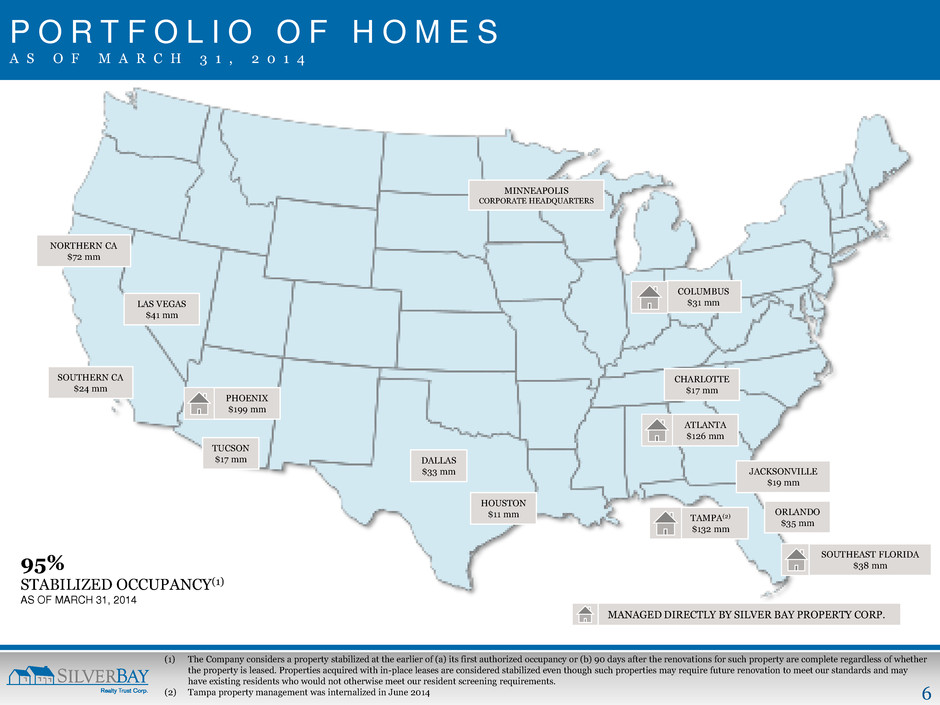
6 (1) The Company considers a property stabilized at the earlier of (a) its first authorized occupancy or (b) 90 days after the renovations for such property are complete regardless of whether the property is leased. Properties acquired with in-place leases are considered stabilized even though such properties may require future renovation to meet our standards and may have existing residents who would not otherwise meet our resident screening requirements. (2) Tampa property management was internalized in June 2014 95% STABILIZED OCCUPANCY(1) AS OF MARCH 31, 2014 P O R T F O L I O O F H O M E S A S O F M A R C H 3 1 , 2 0 1 4 NORTHERN CA $72 mm SOUTHERN CA $24 mm LAS VEGAS $41 mm PHOENIX $199 mm TUCSON $17 mm DALLAS $33 mm HOUSTON $11 mm TAMPA(2) $132 mm ORLANDO $35 mm JACKSONVILLE $19 mm ATLANTA $126 mm CHARLOTTE $17 mm COLUMBUS $31 mm MINNEAPOLIS CORPORATE HEADQUARTERS SOUTHEAST FLORIDA $38 mm MANAGED DIRECTLY BY SILVER BAY PROPERTY CORP.
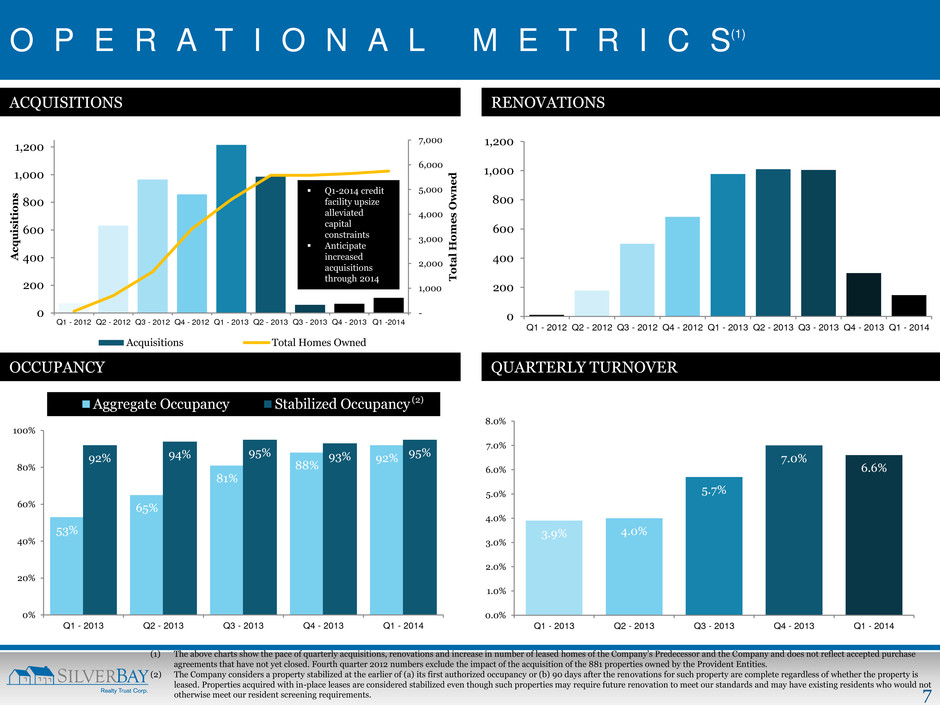
7 O P E R A T I O N A L M E T R I C S(1) RENOVATIONS 0 200 400 600 800 1,000 1,200 Q1 - 2012 Q2 - 2012 Q3 - 2012 Q4 - 2012 Q1 - 2013 Q2 - 2013 Q3 - 2013 Q4 - 2013 Q1 - 2014 - 1,000 2,000 3,000 4,000 5,000 6,000 7,000 0 200 400 600 800 1,000 1,200 Q1 - 2012 Q2 - 2012 Q3 - 2012 Q4 - 2012 Q1 - 2013 Q2 - 2013 Q3 - 2013 Q4 - 2013 Q1 -2014 T o tal H o m e s O w n e d A c q u is it io n s Acquisitions Total Homes Owned ACQUISITIONS QUARTERLY TURNOVER OCCUPANCY (1) The above charts show the pace of quarterly acquisitions, renovations and increase in number of leased homes of the Company’s Predecessor and the Company and does not reflect accepted purchase agreements that have not yet closed. Fourth quarter 2012 numbers exclude the impact of the acquisition of the 881 properties owned by the Provident Entities. (2) The Company considers a property stabilized at the earlier of (a) its first authorized occupancy or (b) 90 days after the renovations for such property are complete regardless of whether the property is leased. Properties acquired with in-place leases are considered stabilized even though such properties may require future renovation to meet our standards and may have existing residents who would not otherwise meet our resident screening requirements. 53% 65% 81% 88% 92% 92% 94% 95% 93% 95% 0% 20% 40% 60% 80% 100% Q1 - 2013 Q2 - 2013 Q3 - 2013 Q4 - 2013 Q1 - 2014 Aggregate Occupancy Stabilized Occupancy 3.9% 4.0% 5.7% 7.0% 6.6% 0.0% 1.0% 2.0% 3.0% 4.0% 5.0% 6.0% 7.0% 8.0% Q1 - 2013 Q2 - 2013 Q3 - 2013 Q4 - 2013 Q1 - 2014 Q1-2014 credit facility upsize alleviated capital constraints Anticipate increased acquisitions through 2014 (2)
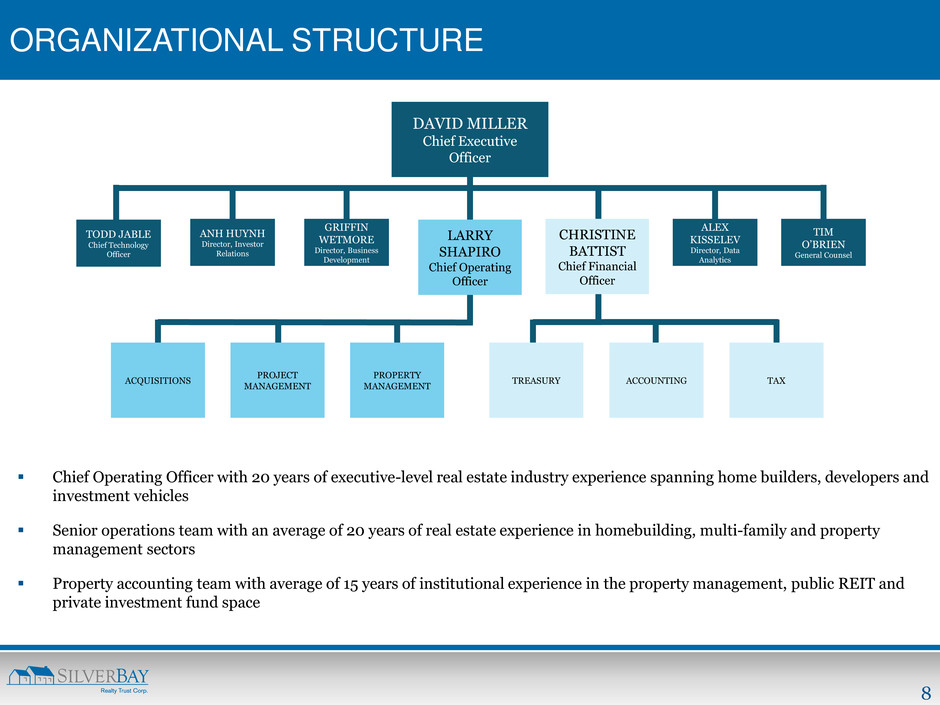
8 ORGANIZATIONAL STRUCTURE DAVID MILLER Chief Executive Officer ANH HUYNH Director, Investor Relations GRIFFIN WETMORE Director, Business Development LARRY SHAPIRO Chief Operating Officer CHRISTINE BATTIST Chief Financial Officer ALEX KISSELEV Director, Data Analytics TIM O’BRIEN General Counsel ACQUISITIONS PROPERTY MANAGEMENT PROJECT MANAGEMENT ACCOUNTING TODD JABLE Chief Technology Officer Chief Operating Officer with 20 years of executive-level real estate industry experience spanning home builders, developers and investment vehicles Senior operations team with an average of 20 years of real estate experience in homebuilding, multi-family and property management sectors Property accounting team with average of 15 years of institutional experience in the property management, public REIT and private investment fund space TAX TREASURY

9 S T R A T E G I C I N I T I A T I V E S NOI(2) margin expansion will be a key driver of cash flow generation goals − Achieve revenue growth and reduce expenses through increased operational efficiency − 3.0-3.5% rent increase on a same property basis − Centralize certain property management functions, such as resident application processing and marketing − Centralized service call center Continued growth through disciplined acquisitions − Focused on unit growth primarily in Florida, Texas and Georgia − Continued portfolio growth to enable further scale efficiencies, leverage G&A and increase FFO(2) − Leverage renovation and leasing experience gained since Silver Bay’s inception Completion of a securitization transaction − Capital structure optimization − Reduction in financing costs will benefit FFO(2) (1) As of March 31, 2014. (2) NOI, Estimated NAV and FFO are non-GAAP financial measures. Non-GAAP reconciliations of these measures are included in the appendix. (3) Silver Bay defines total return on net asset value, or NAV, as change in Estimated NAV per share plus dividend distributions. As of March 31, 2014, NAV was estimated to be $20.35 per share. $7.7 $10.7 $14.5 $16.7 $18.1 Q1 - 2013 Q2 - 2013 Q3 - 2013 Q4 - 2013 Q1 - 2014 TOTAL REVENUE ($ IN MILLIONS) $2.1 $3.8 $5.6 $8.3 $9.2 Q1 - 2013 Q2 - 2013 Q3 - 2013 Q4 - 2013 Q1 - 2014 NET OPERATING INCOME(2) ($ IN MILLIONS) $(2.6) $(1.8) $(0.6) $1.5 $2.1 Q1 - 2013 Q2 - 2013 Q3 - 2013 Q4 - 2013 Q1 - 2014 FUNDS FROM OPERATIONS(2) ($ IN MILLIONS) INITIATIVES ACCOMPLISHMENTS Acquired more than 2,500 homes and increased number of properties in the portfolio by 72% since IPO(1) Renovated and leased more than 3,400 homes since IPO(1) Upsized credit facility to $350 million in 2014 Delivered 2013 total return on NAV of 13%(2), primarily driven by ~$100 million increase in the value of the Company’s properties Internalized property management in Columbus in December 2013 Internalized property management in Tampa for a total one-time expense of $775,000 in June 2014, increasing the total portfolio of internally managed properties to over 65%
10 ACQUISITION AND PROPERTY MANAGEMENT
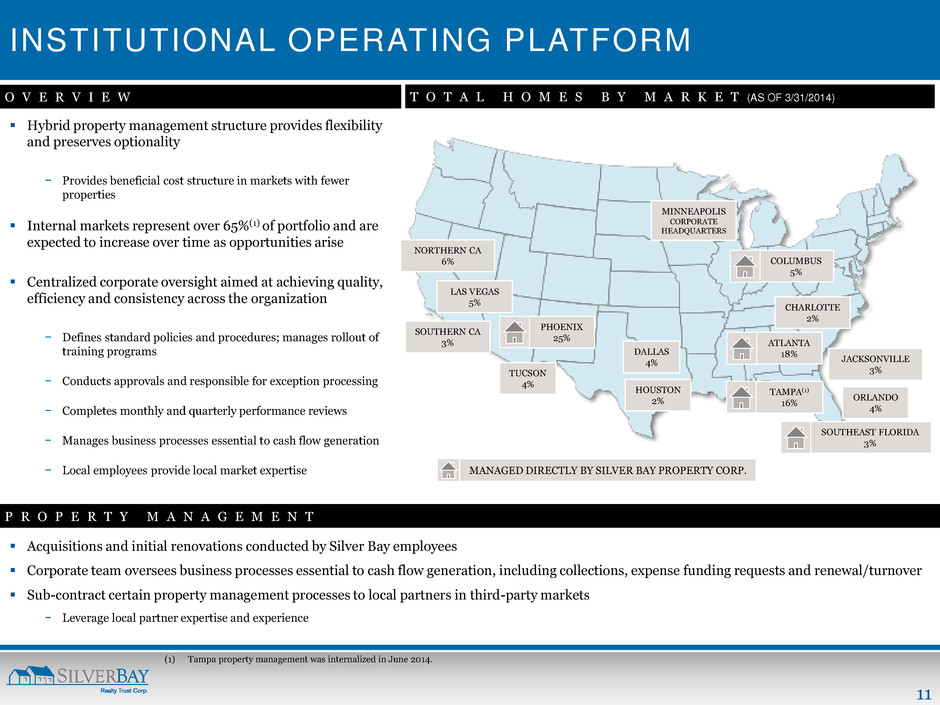
11 INSTITUTIONAL OPERATING PLATFORM Hybrid property management structure provides flexibility and preserves optionality − Provides beneficial cost structure in markets with fewer properties Internal markets represent over 65%(1) of portfolio and are expected to increase over time as opportunities arise Centralized corporate oversight aimed at achieving quality, efficiency and consistency across the organization − Defines standard policies and procedures; manages rollout of training programs − Conducts approvals and responsible for exception processing − Completes monthly and quarterly performance reviews − Manages business processes essential to cash flow generation − Local employees provide local market expertise Acquisitions and initial renovations conducted by Silver Bay employees Corporate team oversees business processes essential to cash flow generation, including collections, expense funding requests and renewal/turnover Sub-contract certain property management processes to local partners in third-party markets − Leverage local partner expertise and experience O V E R V I E W P R O P E R T Y M A N A G E M E N T NORTHERN CA 6% SOUTHERN CA 3% LAS VEGAS 5% PHOENIX 25% TUCSON 4% DALLAS 4% HOUSTON 2% SOUTHEAST FLORIDA 3% TAMPA(1) 16% ORLANDO 4% JACKSONVILLE 3% ATLANTA 18% CHARLOTTE 2% COLUMBUS 5% MINNEAPOLIS CORPORATE HEADQUARTERS (1) Tampa property management was internalized in June 2014. T O T A L H O M E S B Y M A R K E T (AS OF 3/31/2014) MANAGED DIRECTLY BY SILVER BAY PROPERTY CORP.
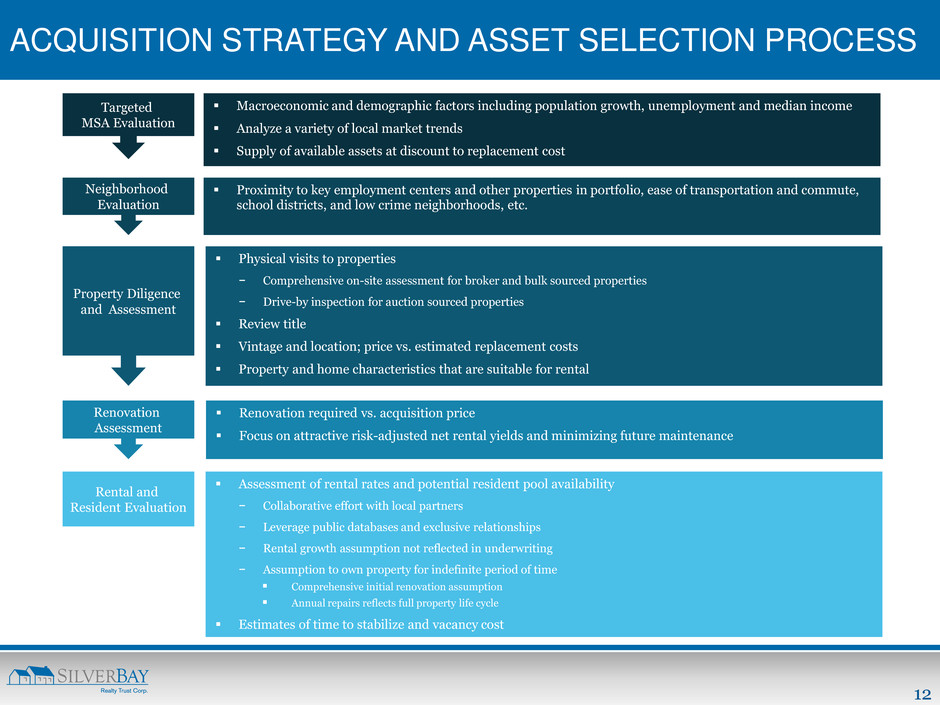
12 ACQUISITION STRATEGY AND ASSET SELECTION PROCESS Targeted MSA Evaluation Neighborhood Evaluation Property Diligence and Assessment Renovation Assessment Rental and Resident Evaluation Macroeconomic and demographic factors including population growth, unemployment and median income Analyze a variety of local market trends Supply of available assets at discount to replacement cost Physical visits to properties − Comprehensive on-site assessment for broker and bulk sourced properties − Drive-by inspection for auction sourced properties Review title Vintage and location; price vs. estimated replacement costs Property and home characteristics that are suitable for rental Proximity to key employment centers and other properties in portfolio, ease of transportation and commute, school districts, and low crime neighborhoods, etc. Renovation required vs. acquisition price Focus on attractive risk-adjusted net rental yields and minimizing future maintenance Assessment of rental rates and potential resident pool availability − Collaborative effort with local partners − Leverage public databases and exclusive relationships − Rental growth assumption not reflected in underwriting − Assumption to own property for indefinite period of time Comprehensive initial renovation assumption Annual repairs reflects full property life cycle Estimates of time to stabilize and vacancy cost

13 - 1,000 2,000 3,000 4,000 5,000 6,000 7,000 0 200 400 600 800 1,000 1,200 Q1 - 2012 Q2 - 2012 Q3 - 2012 Q4 - 2012 Q1 - 2013 Q2 - 2013 Q3 - 2013 Q4 - 2013 Q1 -2014 T o tal H o m e s O w n e d A c q u is it io n s Acquisitions Total Homes Owned ACQUISITION EXPERIENCE AND OUTLOOK Average total estimated cost / sq. ft. suggests ability to source properties at substantial discounts to replacement cost despite tightening projected net yields Range of replacement cost estimates by leading industry organizations support Silver Bay’s investment thesis; estimated Silver Bay acquisitions significantly below replacement cost Florida, Texas and Atlanta markets represent the most compelling acquisition opportunities (1) Data as of April 2014. Excludes Silver Bay’s acquisition of Provident Entities. ACQUISITION ACTIVITY BY QUARTER ACQUISITION OUTLOOK ACQUISITIONS BY CHANNEL TO DATE(1) Auction 54% Bulk 7% MLS 39% MLS Relationship-driven channel Ability to walk through home prior to purchasing BULK Facilitated strategic growth in majority of the Company’s markets Observing increasing number of portfolios trade AUCTION Inventory of distressed properties meeting SBY criteria Institutionalized process to efficiently evaluate target bid lists Q1-2014 credit facility upsize alleviated capital constraints Anticipate increased acquisitions through 2014
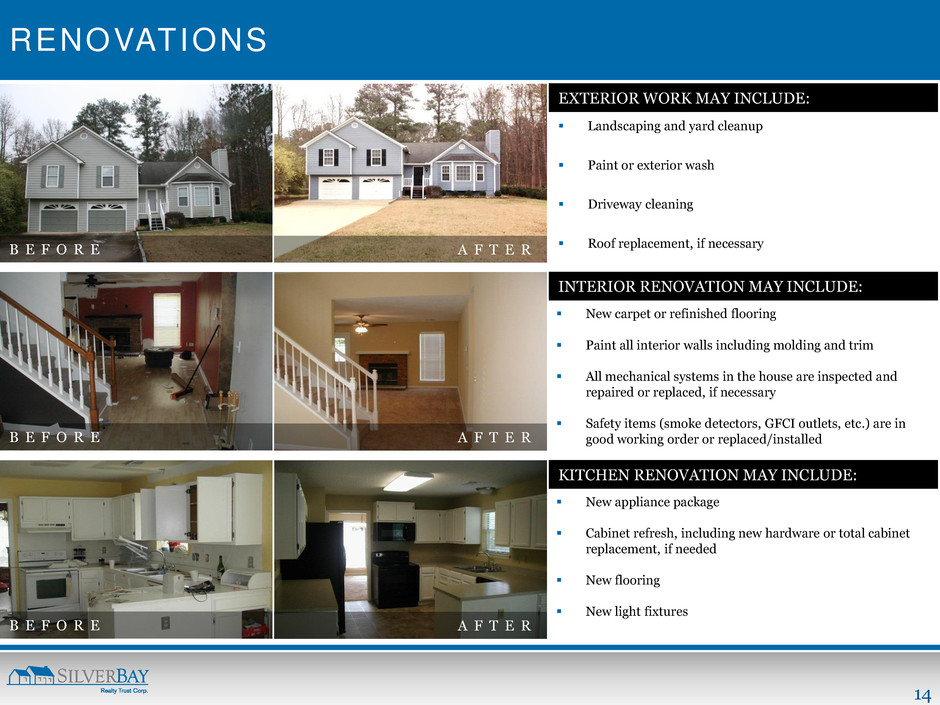
14 New appliance package Cabinet refresh, including new hardware or total cabinet replacement, if needed New flooring New light fixtures RENOVATIONS B E F O R E A F T E R Landscaping and yard cleanup Paint or exterior wash Driveway cleaning Roof replacement, if necessary New carpet or refinished flooring Paint all interior walls including molding and trim All mechanical systems in the house are inspected and repaired or replaced, if necessary Safety items (smoke detectors, GFCI outlets, etc.) are in good working order or replaced/installed B E F O R E A F T E R B E F O R E A F T E R KITCHEN RENOVATION MAY INCLUDE: INTERIOR RENOVATION MAY INCLUDE: EXTERIOR WORK MAY INCLUDE:
15 M A R K E T I N G A N D L E A S I N G(1) Local market knowledge and MLS broker relationships help drive leasing process Yard signage displayed once a property nears renovation completion to start driving traffic Web presence includes featured listing relationships with major online listing services Focus on establishing and growing Silver Bay’s brand through increased advertising presence Standardization of renovations and amenities aimed at attracting prospective residents to an institutional grade rental home Silver Bay Management website is updated on an ongoing basis and refined for ease of users Existing satisfied residents are encouraged to provide referrals MARKETING LEASING Prospective residents are directed to a national call center (locally in third-party markets) to schedule showings for homes that best meet their needs Online rental application process for resident convenience and increased processing speed Resident screening process critical to reducing evictions, future turnover and associated costs and includes a review of a prospect’s credit, criminal background, residential history and verification of minimum income of 3x the monthly rent (1) Representative of marketing and leasing processes for Silver Bay internal markets. Third-party partners are contracted to adhere to Silver Bay corporate guidelines, which may be modified to conform to local market conventions.
16 A P P E N D I X
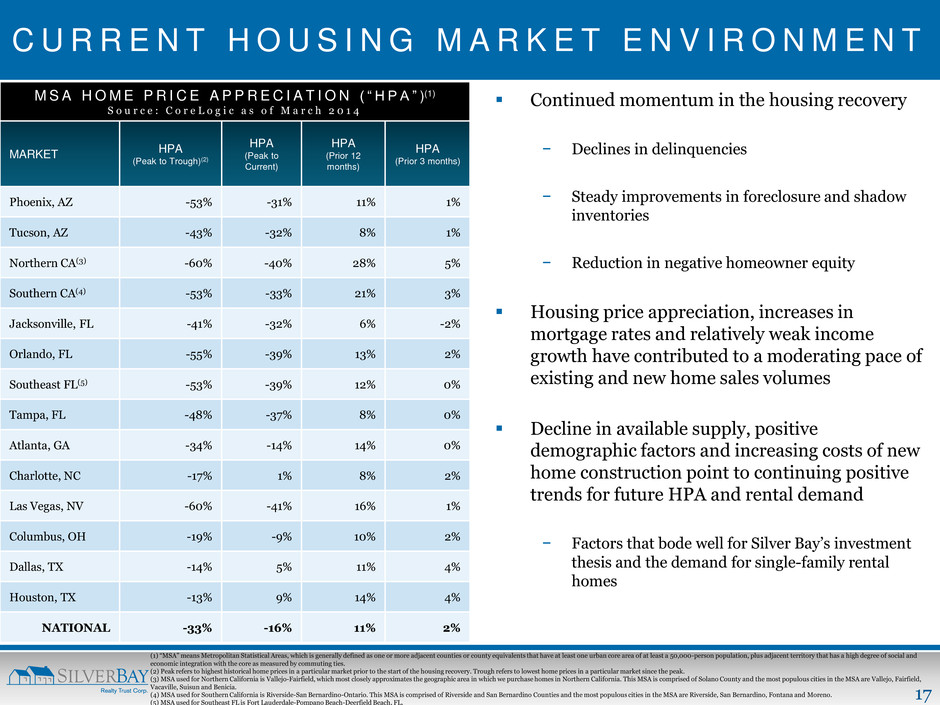
17 C U R R E N T H O U S I N G M A R K E T E N V I R O N M E N T Continued momentum in the housing recovery − Declines in delinquencies − Steady improvements in foreclosure and shadow inventories − Reduction in negative homeowner equity Housing price appreciation, increases in mortgage rates and relatively weak income growth have contributed to a moderating pace of existing and new home sales volumes Decline in available supply, positive demographic factors and increasing costs of new home construction point to continuing positive trends for future HPA and rental demand − Factors that bode well for Silver Bay’s investment thesis and the demand for single-family rental homes (1) “MSA” means Metropolitan Statistical Areas, which is generally defined as one or more adjacent counties or county equivalents that have at least one urban core area of at least a 50,000-person population, plus adjacent territory that has a high degree of social and economic integration with the core as measured by commuting ties. (2) Peak refers to highest historical home prices in a particular market prior to the start of the housing recovery. Trough refers to lowest home prices in a particular market since the peak. (3) MSA used for Northern California is Vallejo-Fairfield, which most closely approximates the geographic area in which we purchase homes in Northern California. This MSA is comprised of Solano County and the most populous cities in the MSA are Vallejo, Fairfield, Vacaville, Suisun and Benicia. (4) MSA used for Southern California is Riverside-San Bernardino-Ontario. This MSA is comprised of Riverside and San Bernardino Counties and the most populous cities in the MSA are Riverside, San Bernardino, Fontana and Moreno. (5) MSA used for Southeast FL is Fort Lauderdale-Pompano Beach-Deerfield Beach, FL. M S A H O M E P R I C E A P P R E C I A T I O N ( “ H P A ” )(1) S o u r c e : C o r e L o g i c a s o f M a r c h 2 0 1 4 MARKET HPA (Peak to Trough)(2) HPA (Peak to Current) HPA (Prior 12 months) HPA (Prior 3 months) Phoenix, AZ -53% -31% 11% 1% Tucson, AZ -43% -32% 8% 1% Northern CA(3) -60% -40% 28% 5% Southern CA(4) -53% -33% 21% 3% Jacksonville, FL -41% -32% 6% -2% Orlando, FL -55% -39% 13% 2% Southeast FL(5) -53% -39% 12% 0% Tampa, FL -48% -37% 8% 0% Atlanta, GA -34% -14% 14% 0% Charlotte, NC -17% 1% 8% 2% Las Vegas, NV -60% -41% 16% 1% Columbus, OH -19% -9% 10% 2% Dallas, TX -14% 5% 11% 4% Houston, TX -13% 9% 14% 4% NATIONAL -33% -16% 11% 2%
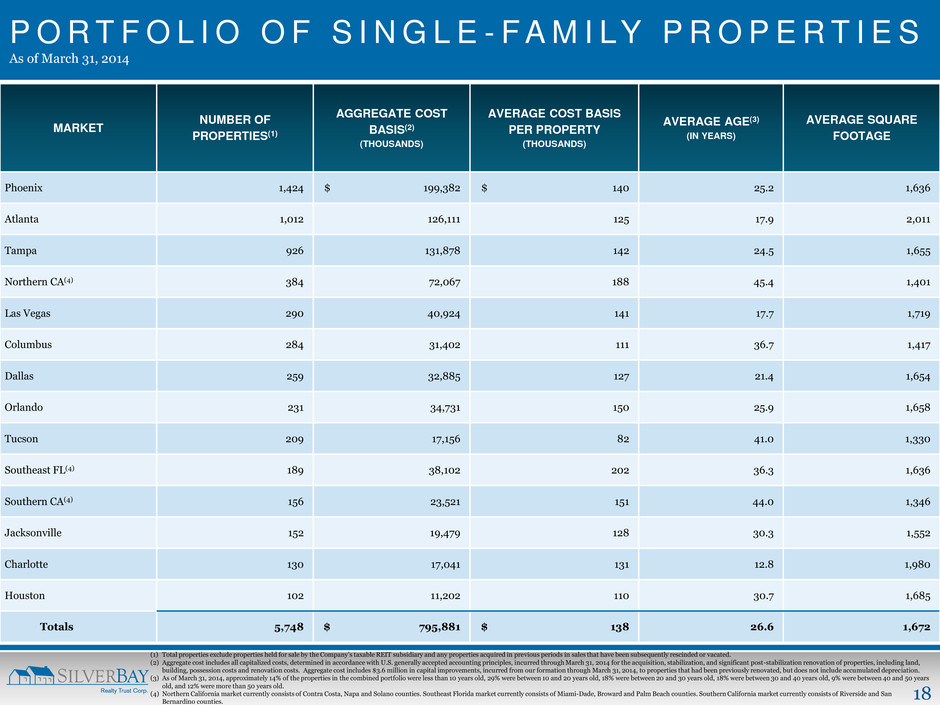
18 P O R T F O L I O O F S I N G L E - F A M I LY P R O P E R T I E S As of March 31, 2014 MARKET NUMBER OF PROPERTIES(1) AGGREGATE COST BASIS(2) (THOUSANDS) AVERAGE COST BASIS PER PROPERTY (THOUSANDS) AVERAGE AGE(3) (IN YEARS) AVERAGE SQUARE FOOTAGE Phoenix 1,424 $ 199,382 $ 140 25.2 1,636 Atlanta 1,012 126,111 125 17.9 2,011 Tampa 926 131,878 142 24.5 1,655 Northern CA(4) 384 72,067 188 45.4 1,401 Las Vegas 290 40,924 141 17.7 1,719 Columbus 284 31,402 111 36.7 1,417 Dallas 259 32,885 127 21.4 1,654 Orlando 231 34,731 150 25.9 1,658 Tucson 209 17,156 82 41.0 1,330 Southeast FL(4) 189 38,102 202 36.3 1,636 Southern CA(4) 156 23,521 151 44.0 1,346 Jacksonville 152 19,479 128 30.3 1,552 Charlotte 130 17,041 131 12.8 1,980 Houston 102 11,202 110 30.7 1,685 Totals 5,748 $ 795,881 $ 138 26.6 1,672 (1) Total properties exclude properties held for sale by the Company’s taxable REIT subsidiary and any properties acquired in previous periods in sales that have been subsequently rescinded or vacated. (2) Aggregate cost includes all capitalized costs, determined in accordance with U.S. generally accepted accounting principles, incurred through March 31, 2014 for the acquisition, stabilization, and significant post-stabilization renovation of properties, including land, building, possession costs and renovation costs. Aggregate cost includes $3.6 million in capital improvements, incurred from our formation through March 31, 2014, to properties that had been previously renovated, but does not include accumulated depreciation. (3) As of March 31, 2014, approximately 14% of the properties in the combined portfolio were less than 10 years old, 29% were between 10 and 20 years old, 18% were between 20 and 30 years old, 18% were between 30 and 40 years old, 9% were between 40 and 50 years old, and 12% were more than 50 years old. (4) Northern California market currently consists of Contra Costa, Napa and Solano counties. Southeast Florida market currently consists of Miami-Dade, Broward and Palm Beach counties. Southern California market currently consists of Riverside and San Bernardino counties.
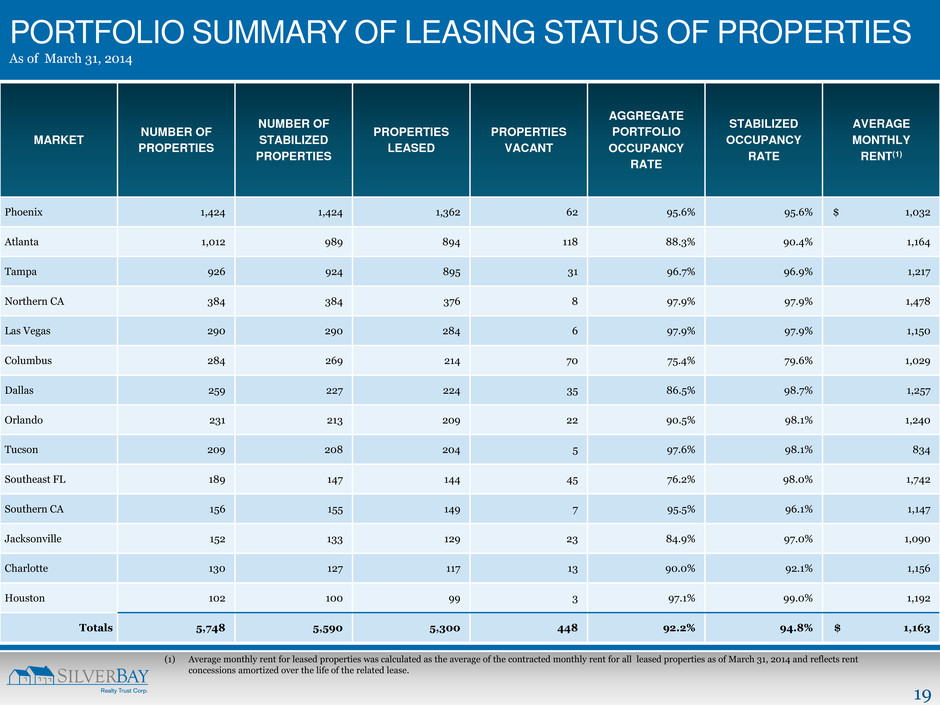
19 MARKET NUMBER OF PROPERTIES NUMBER OF STABILIZED PROPERTIES PROPERTIES LEASED PROPERTIES VACANT AGGREGATE PORTFOLIO OCCUPANCY RATE STABILIZED OCCUPANCY RATE AVERAGE MONTHLY RENT(1) Phoenix 1,424 1,424 1,362 62 95.6% 95.6% $ 1,032 Atlanta 1,012 989 894 118 88.3% 90.4% 1,164 Tampa 926 924 895 31 96.7% 96.9% 1,217 Northern CA 384 384 376 8 97.9% 97.9% 1,478 Las Vegas 290 290 284 6 97.9% 97.9% 1,150 Columbus 284 269 214 70 75.4% 79.6% 1,029 Dallas 259 227 224 35 86.5% 98.7% 1,257 Orlando 231 213 209 22 90.5% 98.1% 1,240 Tucson 209 208 204 5 97.6% 98.1% 834 Southeast FL 189 147 144 45 76.2% 98.0% 1,742 Southern CA 156 155 149 7 95.5% 96.1% 1,147 Jacksonville 152 133 129 23 84.9% 97.0% 1,090 Charlotte 130 127 117 13 90.0% 92.1% 1,156 Houston 102 100 99 3 97.1% 99.0% 1,192 Totals 5,748 5,590 5,300 448 92.2% 94.8% $ 1,163 PORTFOLIO SUMMARY OF LEASING STATUS OF PROPERTIES As of March 31, 2014 (1) Average monthly rent for leased properties was calculated as the average of the contracted monthly rent for all leased properties as of March 31, 2014 and reflects rent concessions amortized over the life of the related lease.
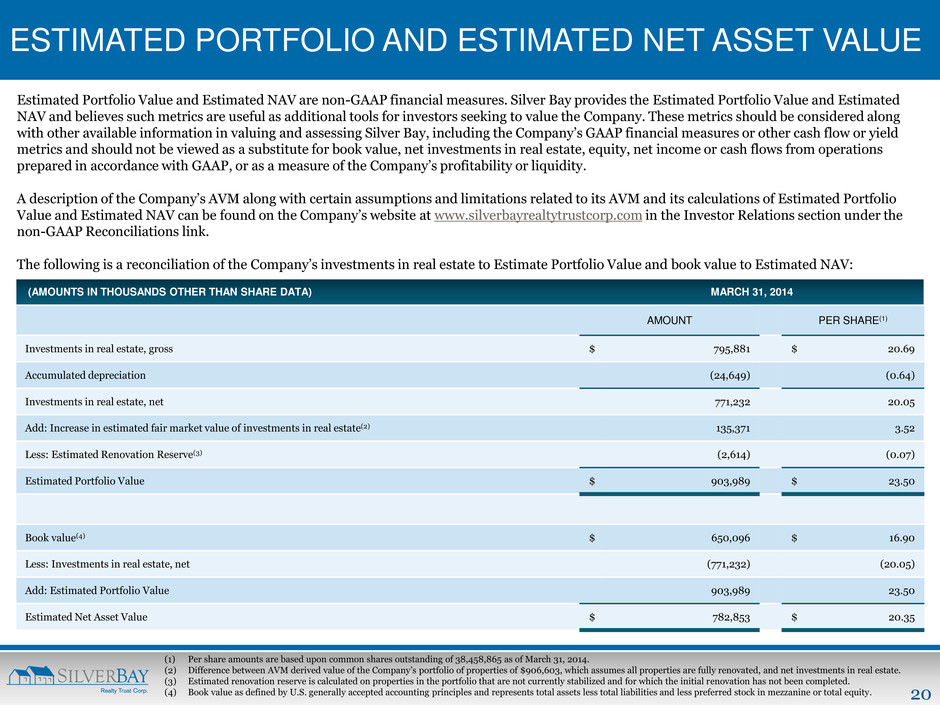
20 ESTIMATED PORTFOLIO AND ESTIMATED NET ASSET VALUE Estimated Portfolio Value and Estimated NAV are non-GAAP financial measures. Silver Bay provides the Estimated Portfolio Value and Estimated NAV and believes such metrics are useful as additional tools for investors seeking to value the Company. These metrics should be considered along with other available information in valuing and assessing Silver Bay, including the Company’s GAAP financial measures or other cash flow or yield metrics and should not be viewed as a substitute for book value, net investments in real estate, equity, net income or cash flows from operations prepared in accordance with GAAP, or as a measure of the Company’s profitability or liquidity. A description of the Company’s AVM along with certain assumptions and limitations related to its AVM and its calculations of Estimated Portfolio Value and Estimated NAV can be found on the Company’s website at www.silverbayrealtytrustcorp.com in the Investor Relations section under the non-GAAP Reconciliations link. The following is a reconciliation of the Company’s investments in real estate to Estimate Portfolio Value and book value to Estimated NAV: (1) Per share amounts are based upon common shares outstanding of 38,458,865 as of March 31, 2014. (2) Difference between AVM derived value of the Company’s portfolio of properties of $906,603, which assumes all properties are fully renovated, and net investments in real estate. (3) Estimated renovation reserve is calculated on properties in the portfolio that are not currently stabilized and for which the initial renovation has not been completed. (4) Book value as defined by U.S. generally accepted accounting principles and represents total assets less total liabilities and less preferred stock in mezzanine or total equity. (AMOUNTS IN THOUSANDS OTHER THAN SHARE DATA) MARCH 31, 2014 AMOUNT PER SHARE(1) Investments in real estate, gross $ 795,881 $ 20.69 Accumulated depreciation (24,649) (0.64) Investments in real estate, net 771,232 20.05 Add: Increase in estimated fair market value of investments in real estate(2) 135,371 3.52 Less: Estimated Renovation Reserve(3) (2,614) (0.07) Estimated Portfolio Value $ 903,989 $ 23.50 Book value(4) $ 650,096 $ 16.90 Less: Investments in real estate, net (771,232) (20.05) Add: Estimated Portfolio Value 903,989 23.50 Estimated Net Asset Value $ 782,853 $ 20.35
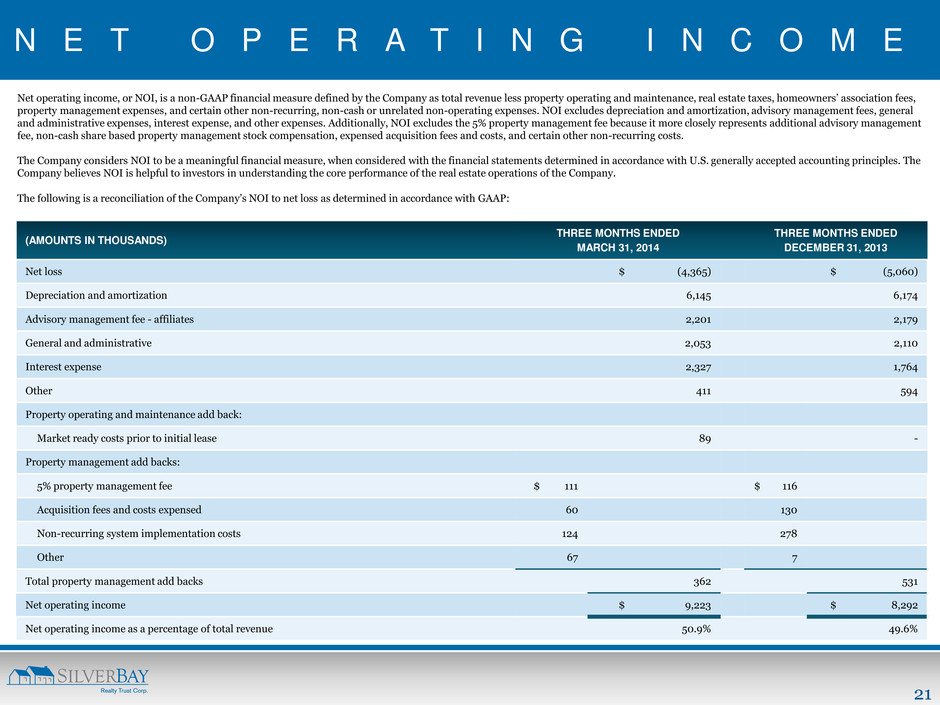
21 N E T O P E R A T I N G I N C O M E Net operating income, or NOI, is a non-GAAP financial measure defined by the Company as total revenue less property operating and maintenance, real estate taxes, homeowners’ association fees, property management expenses, and certain other non-recurring, non-cash or unrelated non-operating expenses. NOI excludes depreciation and amortization, advisory management fees, general and administrative expenses, interest expense, and other expenses. Additionally, NOI excludes the 5% property management fee because it more closely represents additional advisory management fee, non-cash share based property management stock compensation, expensed acquisition fees and costs, and certain other non-recurring costs. The Company considers NOI to be a meaningful financial measure, when considered with the financial statements determined in accordance with U.S. generally accepted accounting principles. The Company believes NOI is helpful to investors in understanding the core performance of the real estate operations of the Company. The following is a reconciliation of the Company’s NOI to net loss as determined in accordance with GAAP: (AMOUNTS IN THOUSANDS) THREE MONTHS ENDED MARCH 31, 2014 THREE MONTHS ENDED DECEMBER 31, 2013 Net loss $ (4,365) $ (5,060) Depreciation and amortization 6,145 6,174 Advisory management fee - affiliates 2,201 2,179 General and administrative 2,053 2,110 Interest expense 2,327 1,764 Other 411 594 Property operating and maintenance add back: Market ready costs prior to initial lease 89 - Property management add backs: 5% property management fee $ 111 $ 116 Acquisition fees and costs expensed 60 130 Non-recurring system implementation costs 124 278 Other 67 7 Total property management add backs 362 531 Net operating income $ 9,223 $ 8,292 Net operating income as a percentage of total revenue 50.9% 49.6%
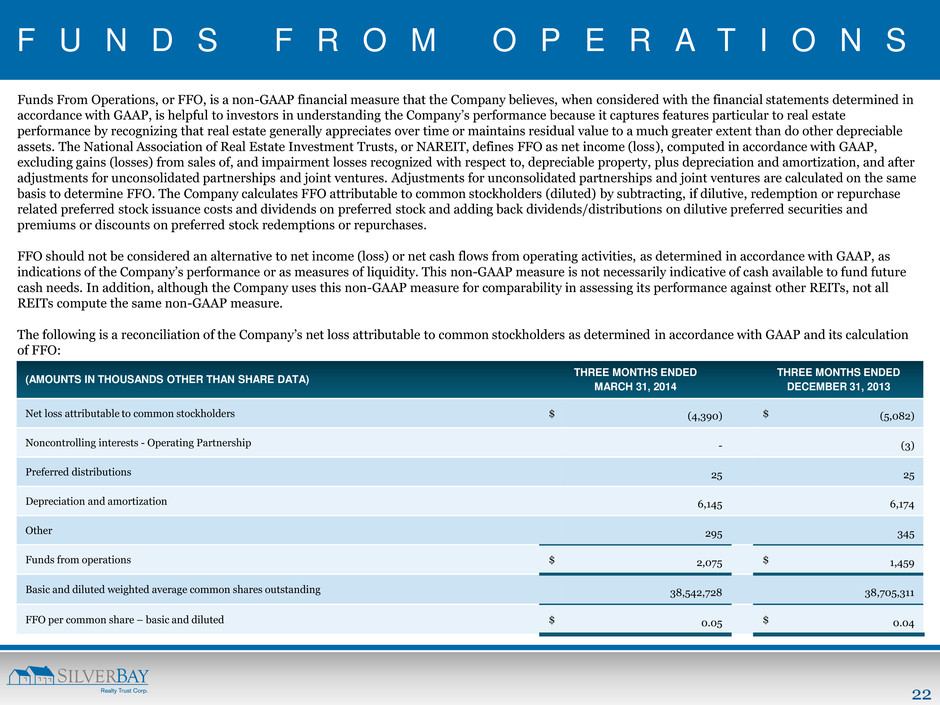
22 F U N D S F R O M O P E R A T I O N S Funds From Operations, or FFO, is a non-GAAP financial measure that the Company believes, when considered with the financial statements determined in accordance with GAAP, is helpful to investors in understanding the Company’s performance because it captures features particular to real estate performance by recognizing that real estate generally appreciates over time or maintains residual value to a much greater extent than do other depreciable assets. The National Association of Real Estate Investment Trusts, or NAREIT, defines FFO as net income (loss), computed in accordance with GAAP, excluding gains (losses) from sales of, and impairment losses recognized with respect to, depreciable property, plus depreciation and amortization, and after adjustments for unconsolidated partnerships and joint ventures. Adjustments for unconsolidated partnerships and joint ventures are calculated on the same basis to determine FFO. The Company calculates FFO attributable to common stockholders (diluted) by subtracting, if dilutive, redemption or repurchase related preferred stock issuance costs and dividends on preferred stock and adding back dividends/distributions on dilutive preferred securities and premiums or discounts on preferred stock redemptions or repurchases. FFO should not be considered an alternative to net income (loss) or net cash flows from operating activities, as determined in accordance with GAAP, as indications of the Company’s performance or as measures of liquidity. This non-GAAP measure is not necessarily indicative of cash available to fund future cash needs. In addition, although the Company uses this non-GAAP measure for comparability in assessing its performance against other REITs, not all REITs compute the same non-GAAP measure. The following is a reconciliation of the Company’s net loss attributable to common stockholders as determined in accordance with GAAP and its calculation of FFO: (AMOUNTS IN THOUSANDS OTHER THAN SHARE DATA) THREE MONTHS ENDED MARCH 31, 2014 THREE MONTHS ENDED DECEMBER 31, 2013 Net loss attributable to common stockholders $ (4,390) $ (5,082) Noncontrolling interests - Operating Partnership - (3) Preferred distributions 25 25 Depreciation and amortization 6,145 6,174 Other 295 345 Funds from operations $ 2,075 $ 1,459 Basic and diluted weighted average common shares outstanding 38,542,728 38,705,311 FFO per common share – basic and diluted $ 0.05 $ 0.04
23 601 CARLSON PARKWAY | SUITE 250 | MINNETONKA | MN | 55305 P: 952.358.4400 | E: INVES TO RS@ SILVERBAYMGMT .C OM


