
SILVER BAY REALTY TRUST CORP. S e c o n d Q u a r t e r 2 0 1 4 E a r n i n g s P r e s e n t a t i o n

2 S A F E H A R B O R S T A T E M E N T F O R W A R D - L O O K I N G S T A T E M E N T S This presentation includes “forward-looking statements” within the meaning of the safe harbor provisions of the United States Private Securities Litigation Reform Act of 1995. Actual results may differ from expectations, estimates and projections and, consequently, readers should not rely on these forward-looking statements as predictions of future events. Words such as “expect,” “target,” “assume,” “estimate,” “project,” “budget,” “forecast,” “anticipate,” “intend,” “plan,” “may,” “will,” “could,” “should,” “believe,” “predicts,” “potential,” “continue,” and similar expressions are intended to identify such forward-looking statements. These forward-looking statements involve significant risks and uncertainties that could cause actual results to differ materially from expected results. Factors that could cause actual results to differ include: adverse economic or real estate developments in Silver Bay’s markets; defaults on, early terminations of or non-renewal of leases by residents; difficulties in identifying properties to acquire and completing acquisitions; increased time and/or expense to gain possession and renovate properties; increased vacancy, resident turnover, or turnover costs; Silver Bay’s ability to control or reduce operating expenses, including repairs and maintenance expense and other costs such as real estate taxes, homeowners’ association fees, insurance and other costs outside the Company’s control; Silver Bay’s failure to successfully operate its properties; Silver Bay’s ability to obtain financing arrangements; Silver Bay’s failure to meet the conditions to draw under the credit facility; failure to obtain stockholder approval of the internalization transaction; failure to successfully manage integration of the manager into the Company; the Company’s ability to hire Manager personnel currently providing services to the Company; the Company’s ability to close the securitization transaction and perform under its covenants; general volatility of the markets in which it participates; interest rates and the market value of Silver Bay’s assets; the impact of changes in governmental regulations, tax law and rates, and similar matters. Readers are cautioned not to place undue reliance upon any forward-looking statements, which speak only as of the date made. Silver Bay does not undertake or accept any obligation to release publicly any updates or revisions to any forward-looking statement to reflect any change in its expectations or any change in events, conditions or circumstances on which any such statement is based. Additional information concerning these and other risk factors is contained in Silver Bay’s most recent filings with the Securities and Exchange Commission. All subsequent written and oral forward looking statements concerning Silver Bay or matters attributable to Silver Bay or any person acting on its behalf are expressly qualified in their entirety by the cautionary statements above.
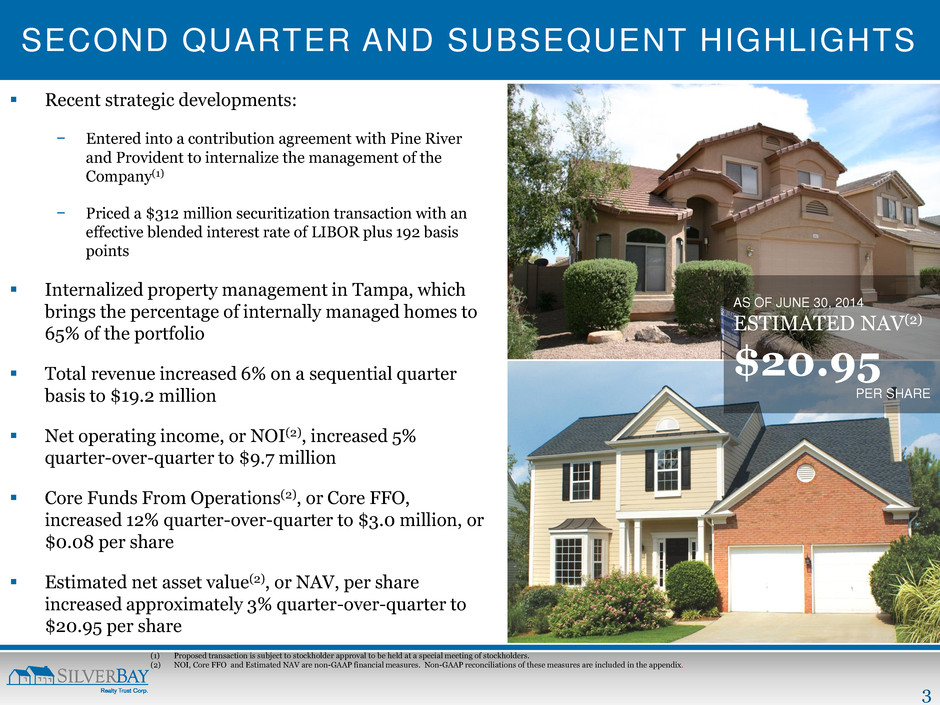
3 SECOND QUARTER AND SUBSEQUENT HIGHLIGHTS Recent strategic developments: − Entered into a contribution agreement with Pine River and Provident to internalize the management of the Company(1) − Priced a $312 million securitization transaction with an effective blended interest rate of LIBOR plus 192 basis points Internalized property management in Tampa, which brings the percentage of internally managed homes to 65% of the portfolio Total revenue increased 6% on a sequential quarter basis to $19.2 million Net operating income, or NOI(2), increased 5% quarter-over-quarter to $9.7 million Core Funds From Operations(2), or Core FFO, increased 12% quarter-over-quarter to $3.0 million, or $0.08 per share Estimated net asset value(2), or NAV, per share increased approximately 3% quarter-over-quarter to $20.95 per share (1) Proposed transaction is subject to stockholder approval to be held at a special meeting of stockholders. (2) NOI, Core FFO and Estimated NAV are non-GAAP financial measures. Non-GAAP reconciliations of these measures are included in the appendix. AS OF JUNE 30, 2014 ESTIMATED NAV(2) $20.95 PER SHARE
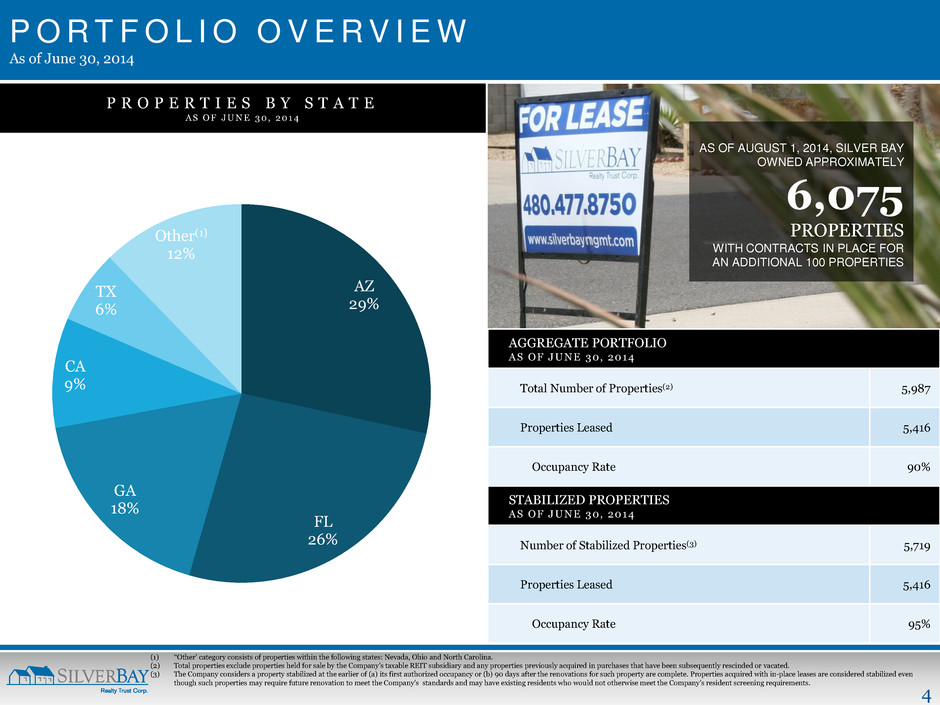
4 P O R T F O L I O O V E R V I E W As of June 30, 2014 AGGREGATE PORTFOLIO AS OF J U NE 30, 2014 Total Number of Properties(2) 5,987 Properties Leased 5,416 Occupancy Rate 90% STABILIZED PROPERTIES AS OF J U NE 30, 2014 Number of Stabilized Properties(3) 5,719 Properties Leased 5,416 Occupancy Rate 95% P R O P E R T I E S B Y S T A T E A S O F J U N E 3 0 , 2 0 1 4 (1) ‘‘Other’ category consists of properties within the following states: Nevada, Ohio and North Carolina. (2) Total properties exclude properties held for sale by the Company’s taxable REIT subsidiary and any properties previously acquired in purchases that have been subsequently rescinded or vacated. (3) The Company considers a property stabilized at the earlier of (a) its first authorized occupancy or (b) 90 days after the renovations for such property are complete. Properties acquired with in-place leases are considered stabilized even though such properties may require future renovation to meet the Company’s standards and may have existing residents who would not otherwise meet the Company’s resident screening requirements. AZ 29% FL 26% GA 18% CA 9% TX 6% Other(1) 12% AS OF AUGUST 1, 2014, SILVER BAY OWNED APPROXIMATELY 6,075 PROPERTIES WITH CONTRACTS IN PLACE FOR AN ADDITIONAL 100 PROPERTIES
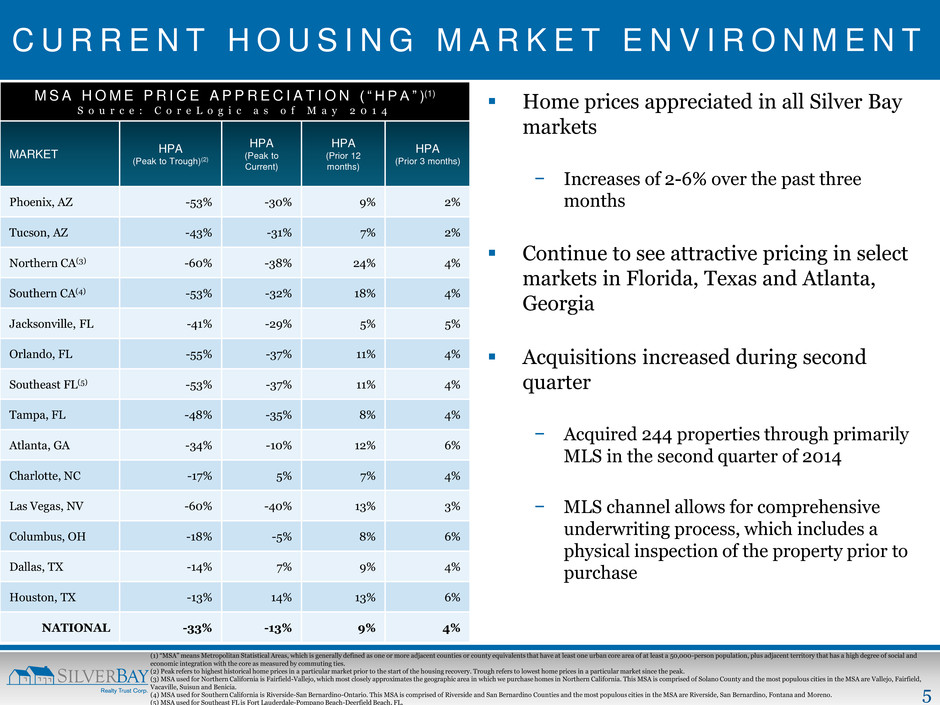
5 C U R R E N T H O U S I N G M A R K E T E N V I R O N M E N T Home prices appreciated in all Silver Bay markets − Increases of 2-6% over the past three months Continue to see attractive pricing in select markets in Florida, Texas and Atlanta, Georgia Acquisitions increased during second quarter − Acquired 244 properties through primarily MLS in the second quarter of 2014 − MLS channel allows for comprehensive underwriting process, which includes a physical inspection of the property prior to purchase (1) “MSA” means Metropolitan Statistical Areas, which is generally defined as one or more adjacent counties or county equivalents that have at least one urban core area of at least a 50,000-person population, plus adjacent territory that has a high degree of social and economic integration with the core as measured by commuting ties. (2) Peak refers to highest historical home prices in a particular market prior to the start of the housing recovery. Trough refers to lowest home prices in a particular market since the peak. (3) MSA used for Northern California is Fairfield-Vallejo, which most closely approximates the geographic area in which we purchase homes in Northern California. This MSA is comprised of Solano County and the most populous cities in the MSA are Vallejo, Fairfield, Vacaville, Suisun and Benicia. (4) MSA used for Southern California is Riverside-San Bernardino-Ontario. This MSA is comprised of Riverside and San Bernardino Counties and the most populous cities in the MSA are Riverside, San Bernardino, Fontana and Moreno. (5) MSA used for Southeast FL is Fort Lauderdale-Pompano Beach-Deerfield Beach, FL. M S A H O M E P R I C E A P P R E C I A T I O N ( “ H P A ” )(1) S o u r c e : C o r e L o g i c a s o f M a y 2 0 1 4 MARKET HPA (Peak to Trough)(2) HPA (Peak to Current) HPA (Prior 12 months) HPA (Prior 3 months) Phoenix, AZ -53% -30% 9% 2% Tucson, AZ -43% -31% 7% 2% Northern CA(3) -60% -38% 24% 4% Southern CA(4) -53% -32% 18% 4% Jacksonville, FL -41% -29% 5% 5% Orlando, FL -55% -37% 11% 4% Southeast FL(5) -53% -37% 11% 4% Tampa, FL -48% -35% 8% 4% Atlanta, GA -34% -10% 12% 6% Charlotte, NC -17% 5% 7% 4% Las Vegas, NV -60% -40% 13% 3% Columbus, OH -18% -5% 8% 6% Dallas, TX -14% 7% 9% 4% Houston, TX -13% 14% 13% 6% NATIONAL -33% -13% 9% 4%
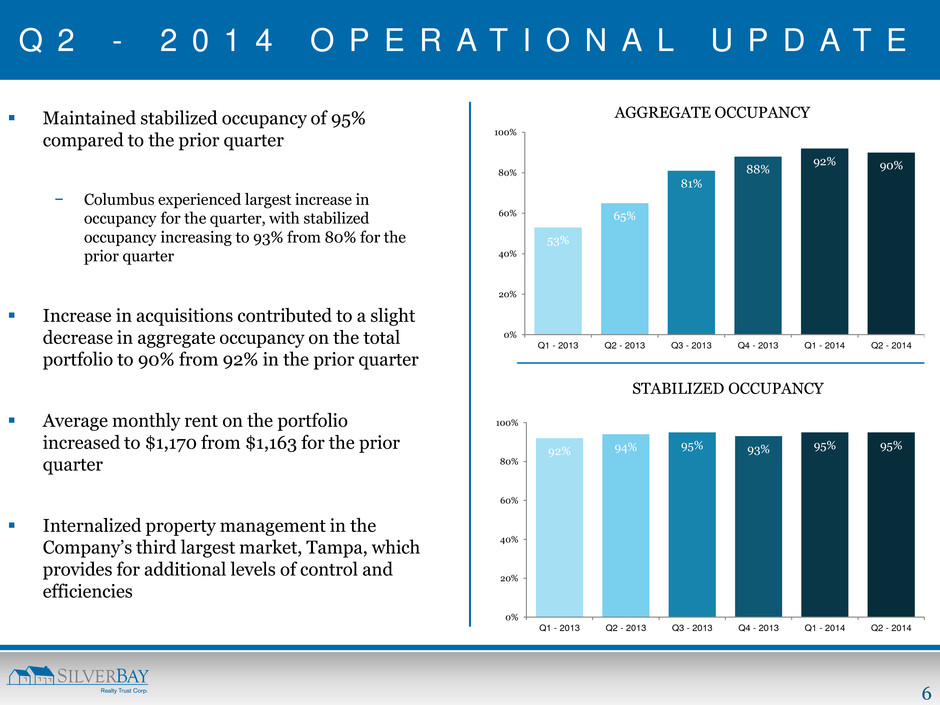
6 Q 2 - 2 0 1 4 O P E R A T I O N A L U P D A T E Maintained stabilized occupancy of 95% compared to the prior quarter − Columbus experienced largest increase in occupancy for the quarter, with stabilized occupancy increasing to 93% from 80% for the prior quarter Increase in acquisitions contributed to a slight decrease in aggregate occupancy on the total portfolio to 90% from 92% in the prior quarter Average monthly rent on the portfolio increased to $1,170 from $1,163 for the prior quarter Internalized property management in the Company’s third largest market, Tampa, which provides for additional levels of control and efficiencies 53% 65% 81% 88% 92% 90% 0% 20% 40% 60% 80% 100% Q1 - 2013 Q2 - 2013 Q3 - 2013 Q4 - 2013 Q1 - 2014 Q2 - 2014 AGGREGATE OCCUPANCY 92% 94% 95% 93% 95% 95% 0% 20% 40% 60% 80% 100% Q1 - 2013 Q2 - 2013 Q3 - 2013 Q4 - 2013 Q1 - 2014 Q2 - 2014 STABILIZED OCCUPANCY
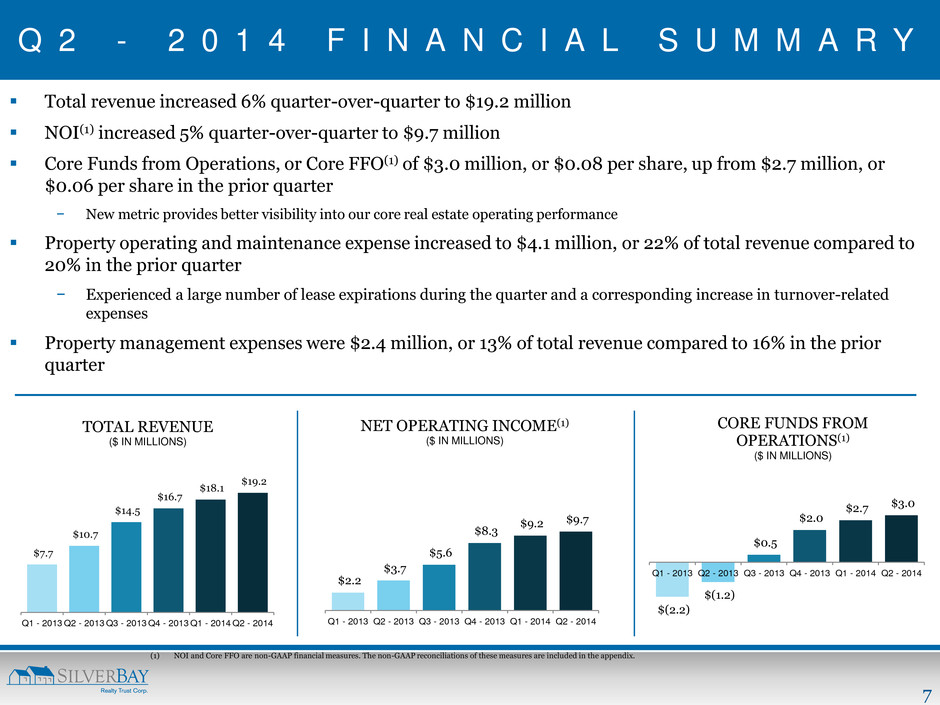
7 $7.7 $10.7 $14.5 $16.7 $18.1 $19.2 Q1 - 2013 Q2 - 2013 Q3 - 2013 Q4 - 2013 Q1 - 2014 Q2 - 2014 TOTAL REVENUE ($ IN MILLIONS) Q 2 - 2 0 1 4 F I N A N C I A L S U M M A R Y Total revenue increased 6% quarter-over-quarter to $19.2 million NOI(1) increased 5% quarter-over-quarter to $9.7 million Core Funds from Operations, or Core FFO(1) of $3.0 million, or $0.08 per share, up from $2.7 million, or $0.06 per share in the prior quarter − New metric provides better visibility into our core real estate operating performance Property operating and maintenance expense increased to $4.1 million, or 22% of total revenue compared to 20% in the prior quarter − Experienced a large number of lease expirations during the quarter and a corresponding increase in turnover-related expenses Property management expenses were $2.4 million, or 13% of total revenue compared to 16% in the prior quarter $2.2 $3.7 $5.6 $8.3 $9.2 $9.7 Q1 - 2013 Q2 - 2013 Q3 - 2013 Q4 - 2013 Q1 - 2014 Q2 - 2014 NET OPERATING INCOME(1) ($ IN MILLIONS) (1) NOI and Core FFO are non-GAAP financial measures. The non-GAAP reconciliations of these measures are included in the appendix. $(2.2) $(1.2) $0.5 $2.0 $2.7 $3.0 Q1 - 2013 Q2 - 2013 Q3 - 2013 Q4 - 2013 Q1 - 2014 Q2 - 2014 CORE FUNDS FROM OPERATIONS(1) ($ IN MILLIONS)
8 A P P E N D I X
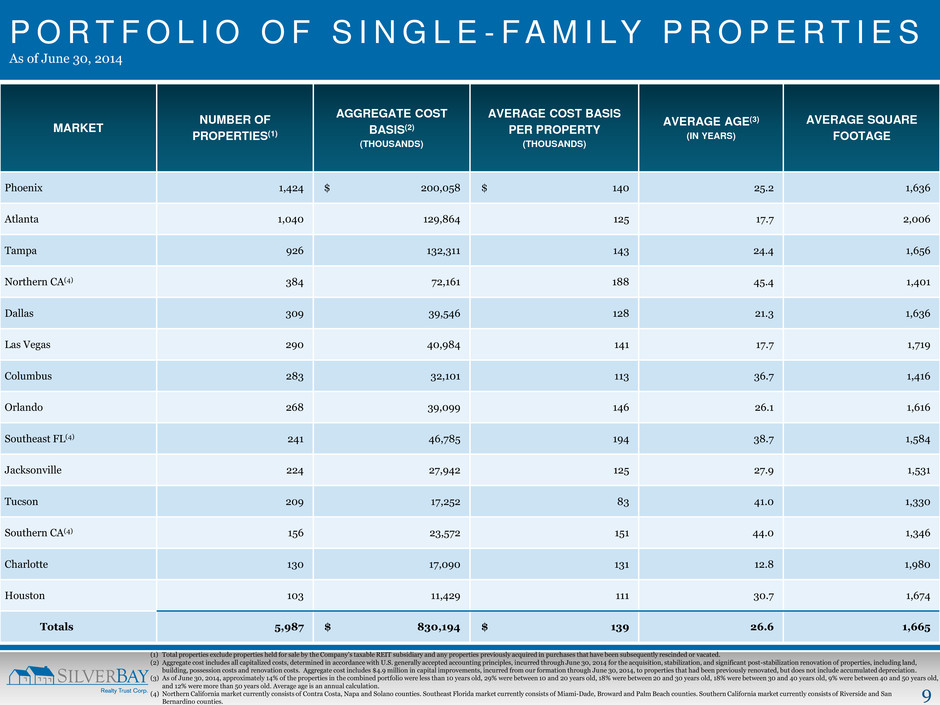
9 P O R T F O L I O O F S I N G L E - F A M I LY P R O P E R T I E S As of June 30, 2014 MARKET NUMBER OF PROPERTIES(1) AGGREGATE COST BASIS(2) (THOUSANDS) AVERAGE COST BASIS PER PROPERTY (THOUSANDS) AVERAGE AGE(3) (IN YEARS) AVERAGE SQUARE FOOTAGE Phoenix 1,424 $ 200,058 $ 140 25.2 1,636 Atlanta 1,040 129,864 125 17.7 2,006 Tampa 926 132,311 143 24.4 1,656 Northern CA(4) 384 72,161 188 45.4 1,401 Dallas 309 39,546 128 21.3 1,636 Las Vegas 290 40,984 141 17.7 1,719 Columbus 283 32,101 113 36.7 1,416 Orlando 268 39,099 146 26.1 1,616 Southeast FL(4) 241 46,785 194 38.7 1,584 Jacksonville 224 27,942 125 27.9 1,531 Tucson 209 17,252 83 41.0 1,330 Southern CA(4) 156 23,572 151 44.0 1,346 Charlotte 130 17,090 131 12.8 1,980 Houston 103 11,429 111 30.7 1,674 Totals 5,987 $ 830,194 $ 139 26.6 1,665 (1) Total properties exclude properties held for sale by the Company’s taxable REIT subsidiary and any properties previously acquired in purchases that have been subsequently rescinded or vacated. (2) Aggregate cost includes all capitalized costs, determined in accordance with U.S. generally accepted accounting principles, incurred through June 30, 2014 for the acquisition, stabilization, and significant post-stabilization renovation of properties, including land, building, possession costs and renovation costs. Aggregate cost includes $4.9 million in capital improvements, incurred from our formation through June 30, 2014, to properties that had been previously renovated, but does not include accumulated depreciation. (3) As of June 30, 2014, approximately 14% of the properties in the combined portfolio were less than 10 years old, 29% were between 10 and 20 years old, 18% were between 20 and 30 years old, 18% were between 30 and 40 years old, 9% were between 40 and 50 years old, and 12% were more than 50 years old. Average age is an annual calculation. (4) Northern California market currently consists of Contra Costa, Napa and Solano counties. Southeast Florida market currently consists of Miami-Dade, Broward and Palm Beach counties. Southern California market currently consists of Riverside and San Bernardino counties.
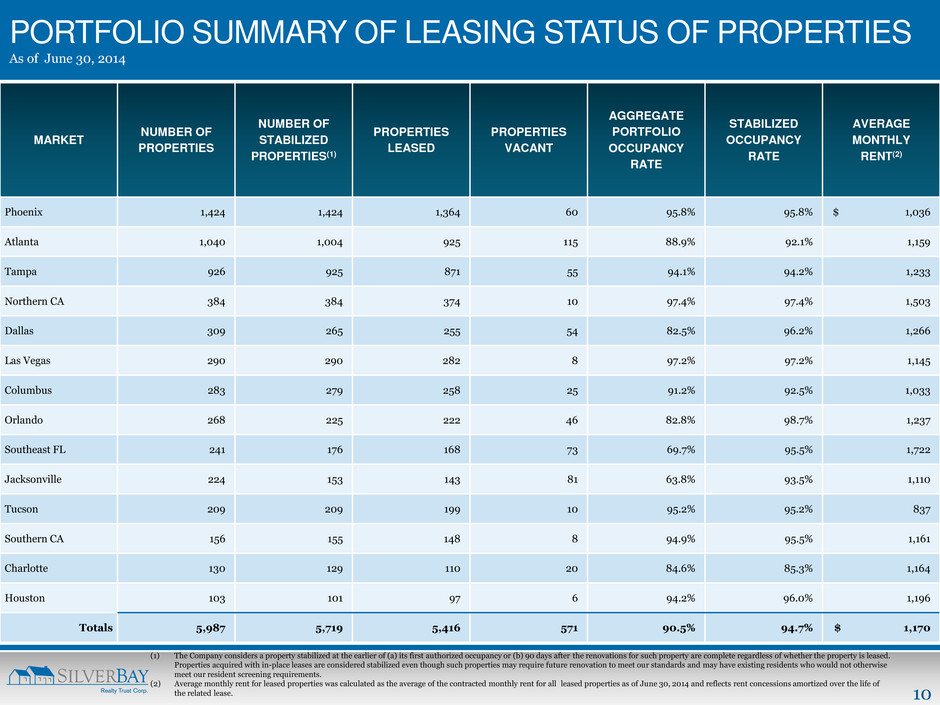
10 MARKET NUMBER OF PROPERTIES NUMBER OF STABILIZED PROPERTIES(1) PROPERTIES LEASED PROPERTIES VACANT AGGREGATE PORTFOLIO OCCUPANCY RATE STABILIZED OCCUPANCY RATE AVERAGE MONTHLY RENT(2) Phoenix 1,424 1,424 1,364 60 95.8% 95.8% $ 1,036 Atlanta 1,040 1,004 925 115 88.9% 92.1% 1,159 Tampa 926 925 871 55 94.1% 94.2% 1,233 Northern CA 384 384 374 10 97.4% 97.4% 1,503 Dallas 309 265 255 54 82.5% 96.2% 1,266 Las Vegas 290 290 282 8 97.2% 97.2% 1,145 Columbus 283 279 258 25 91.2% 92.5% 1,033 Orlando 268 225 222 46 82.8% 98.7% 1,237 Southeast FL 241 176 168 73 69.7% 95.5% 1,722 Jacksonville 224 153 143 81 63.8% 93.5% 1,110 Tucson 209 209 199 10 95.2% 95.2% 837 Southern CA 156 155 148 8 94.9% 95.5% 1,161 Charlotte 130 129 110 20 84.6% 85.3% 1,164 Houston 103 101 97 6 94.2% 96.0% 1,196 Totals 5,987 5,719 5,416 571 90.5% 94.7% $ 1,170 PORTFOLIO SUMMARY OF LEASING STATUS OF PROPERTIES As of June 30, 2014 (1) The Company considers a property stabilized at the earlier of (a) its first authorized occupancy or (b) 90 days after the renovations for such property are complete regardless of whether the property is leased. Properties acquired with in-place leases are considered stabilized even though such properties may require future renovation to meet our standards and may have existing residents who would not otherwise meet our resident screening requirements. (2) Average monthly rent for leased properties was calculated as the average of the contracted monthly rent for all leased properties as of June 30, 2014 and reflects rent concessions amortized over the life of the related lease.
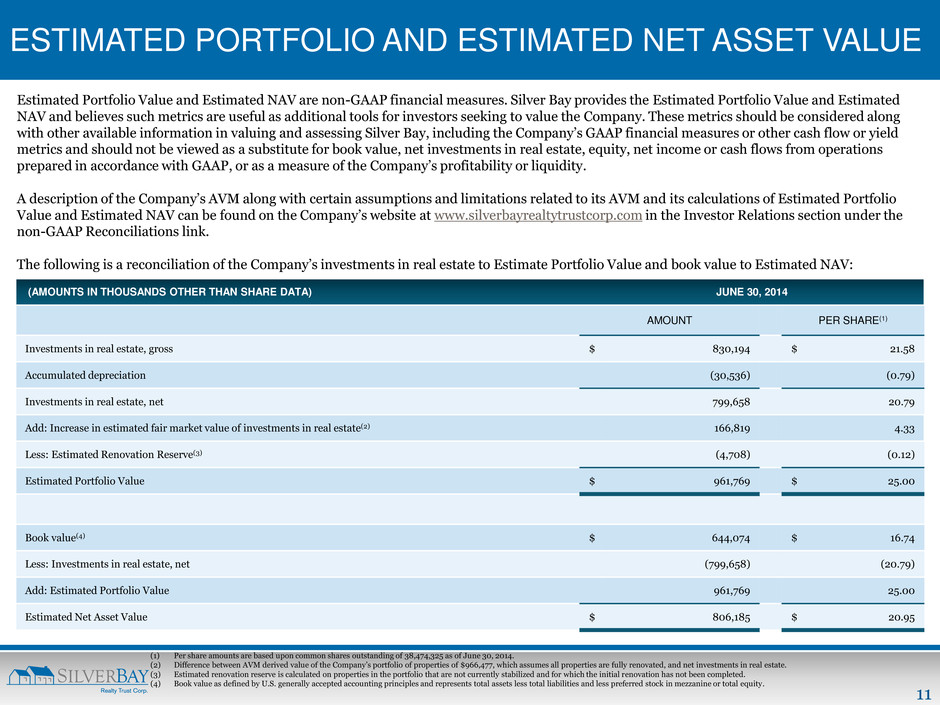
11 ESTIMATED PORTFOLIO AND ESTIMATED NET ASSET VALUE Estimated Portfolio Value and Estimated NAV are non-GAAP financial measures. Silver Bay provides the Estimated Portfolio Value and Estimated NAV and believes such metrics are useful as additional tools for investors seeking to value the Company. These metrics should be considered along with other available information in valuing and assessing Silver Bay, including the Company’s GAAP financial measures or other cash flow or yield metrics and should not be viewed as a substitute for book value, net investments in real estate, equity, net income or cash flows from operations prepared in accordance with GAAP, or as a measure of the Company’s profitability or liquidity. A description of the Company’s AVM along with certain assumptions and limitations related to its AVM and its calculations of Estimated Portfolio Value and Estimated NAV can be found on the Company’s website at www.silverbayrealtytrustcorp.com in the Investor Relations section under the non-GAAP Reconciliations link. The following is a reconciliation of the Company’s investments in real estate to Estimate Portfolio Value and book value to Estimated NAV: (1) Per share amounts are based upon common shares outstanding of 38,474,325 as of June 30, 2014. (2) Difference between AVM derived value of the Company’s portfolio of properties of $966,477, which assumes all properties are fully renovated, and net investments in real estate. (3) Estimated renovation reserve is calculated on properties in the portfolio that are not currently stabilized and for which the initial renovation has not been completed. (4) Book value as defined by U.S. generally accepted accounting principles and represents total assets less total liabilities and less preferred stock in mezzanine or total equity. (AMOUNTS IN THOUSANDS OTHER THAN SHARE DATA) JUNE 30, 2014 AMOUNT PER SHARE(1) Investments in real estate, gross $ 830,194 $ 21.58 Accumulated depreciation (30,536) (0.79) Investments in real estate, net 799,658 20.79 Add: Increase in estimated fair market value of investments in real estate(2) 166,819 4.33 Less: Estimated Renovation Reserve(3) (4,708) (0.12) Estimated Portfolio Value $ 961,769 $ 25.00 Book value(4) $ 644,074 $ 16.74 Less: Investments in real estate, net (799,658) (20.79) Add: Estimated Portfolio Value 961,769 25.00 Estimated Net Asset Value $ 806,185 $ 20.95
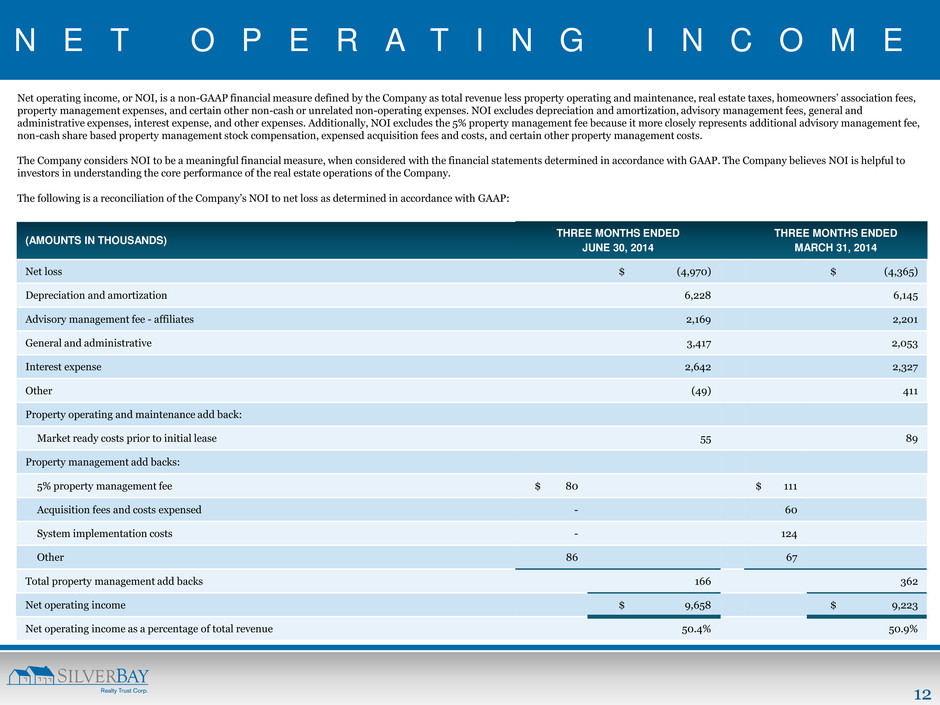
12 N E T O P E R A T I N G I N C O M E Net operating income, or NOI, is a non-GAAP financial measure defined by the Company as total revenue less property operating and maintenance, real estate taxes, homeowners’ association fees, property management expenses, and certain other non-cash or unrelated non-operating expenses. NOI excludes depreciation and amortization, advisory management fees, general and administrative expenses, interest expense, and other expenses. Additionally, NOI excludes the 5% property management fee because it more closely represents additional advisory management fee, non-cash share based property management stock compensation, expensed acquisition fees and costs, and certain other property management costs. The Company considers NOI to be a meaningful financial measure, when considered with the financial statements determined in accordance with GAAP. The Company believes NOI is helpful to investors in understanding the core performance of the real estate operations of the Company. The following is a reconciliation of the Company’s NOI to net loss as determined in accordance with GAAP: (AMOUNTS IN THOUSANDS) THREE MONTHS ENDED JUNE 30, 2014 THREE MONTHS ENDED MARCH 31, 2014 Net loss $ (4,970) $ (4,365) Depreciation and amortization 6,228 6,145 Advisory management fee - affiliates 2,169 2,201 General and administrative 3,417 2,053 Interest expense 2,642 2,327 Other (49) 411 Property operating and maintenance add back: Market ready costs prior to initial lease 55 89 Property management add backs: 5% property management fee $ 80 $ 111 Acquisition fees and costs expensed - 60 System implementation costs - 124 Other 86 67 Total property management add backs 166 362 Net operating income $ 9,658 $ 9,223 Net operating income as a percentage of total revenue 50.4% 50.9%
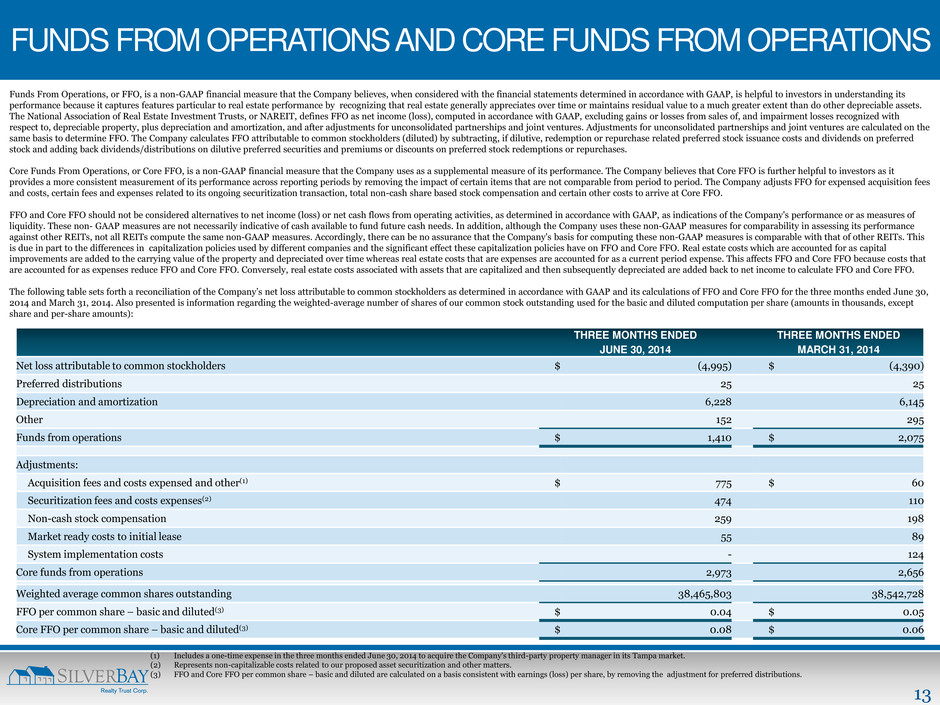
13 FUNDS FROM OPERATIONS AND CORE FUNDS FROM OPERATIONS Funds From Operations, or FFO, is a non-GAAP financial measure that the Company believes, when considered with the financial statements determined in accordance with GAAP, is helpful to investors in understanding its performance because it captures features particular to real estate performance by recognizing that real estate generally appreciates over time or maintains residual value to a much greater extent than do other depreciable assets. The National Association of Real Estate Investment Trusts, or NAREIT, defines FFO as net income (loss), computed in accordance with GAAP, excluding gains or losses from sales of, and impairment losses recognized with respect to, depreciable property, plus depreciation and amortization, and after adjustments for unconsolidated partnerships and joint ventures. Adjustments for unconsolidated partnerships and joint ventures are calculated on the same basis to determine FFO. The Company calculates FFO attributable to common stockholders (diluted) by subtracting, if dilutive, redemption or repurchase related preferred stock issuance costs and dividends on preferred stock and adding back dividends/distributions on dilutive preferred securities and premiums or discounts on preferred stock redemptions or repurchases. Core Funds From Operations, or Core FFO, is a non-GAAP financial measure that the Company uses as a supplemental measure of its performance. The Company believes that Core FFO is further helpful to investors as it provides a more consistent measurement of its performance across reporting periods by removing the impact of certain items that are not comparable from period to period. The Company adjusts FFO for expensed acquisition fees and costs, certain fees and expenses related to its ongoing securitization transaction, total non-cash share based stock compensation and certain other costs to arrive at Core FFO. FFO and Core FFO should not be considered alternatives to net income (loss) or net cash flows from operating activities, as determined in accordance with GAAP, as indications of the Company's performance or as measures of liquidity. These non- GAAP measures are not necessarily indicative of cash available to fund future cash needs. In addition, although the Company uses these non-GAAP measures for comparability in assessing its performance against other REITs, not all REITs compute the same non-GAAP measures. Accordingly, there can be no assurance that the Company's basis for computing these non-GAAP measures is comparable with that of other REITs. This is due in part to the differences in capitalization policies used by different companies and the significant effect these capitalization policies have on FFO and Core FFO. Real estate costs which are accounted for as capital improvements are added to the carrying value of the property and depreciated over time whereas real estate costs that are expenses are accounted for as a current period expense. This affects FFO and Core FFO because costs that are accounted for as expenses reduce FFO and Core FFO. Conversely, real estate costs associated with assets that are capitalized and then subsequently depreciated are added back to net income to calculate FFO and Core FFO. The following table sets forth a reconciliation of the Company’s net loss attributable to common stockholders as determined in accordance with GAAP and its calculations of FFO and Core FFO for the three months ended June 30, 2014 and March 31, 2014. Also presented is information regarding the weighted-average number of shares of our common stock outstanding used for the basic and diluted computation per share (amounts in thousands, except share and per-share amounts): THREE MONTHS ENDED JUNE 30, 2014 THREE MONTHS ENDED MARCH 31, 2014 Net loss attributable to common stockholders $ (4,995) $ (4,390) Preferred distributions 25 25 Depreciation and amortization 6,228 6,145 Other 152 295 Funds from operations $ 1,410 $ 2,075 Adjustments: Acquisition fees and costs expensed and other(1) $ 775 $ 60 Securitization fees and costs expenses(2) 474 110 Non-cash stock compensation 259 198 Market ready costs to initial lease 55 89 System implementation costs - 124 Core funds from operations 2,973 2,656 Weighted average common shares outstanding 38,465,803 38,542,728 FFO per common share – basic and diluted(3) $ 0.04 $ 0.05 Core FFO per common share – basic and diluted(3) $ 0.08 $ 0.06 (1) Includes a one-time expense in the three months ended June 30, 2014 to acquire the Company's third-party property manager in its Tampa market. (2) Represents non-capitalizable costs related to our proposed asset securitization and other matters. (3) FFO and Core FFO per common share – basic and diluted are calculated on a basis consistent with earnings (loss) per share, by removing the adjustment for preferred distributions.

14 601 CARLSON PARKWAY | SUITE 250 | MINNETONKA | MN | 55305 P: 952.358.4400 | E: INVES TO RS@ SILVERBAYMGMT .C OM


