Table of Contents
CONFIDENTIAL TREATMENT REQUESTED
As confidentially submitted to the Securities and Exchange Commission on December 3, 2012 (Amendment No. 1).
Registration No. 333-
UNITED STATES
SECURITIES AND EXCHANGE COMMISSION
Washington, D.C. 20549
Form F-1
REGISTRATION STATEMENT
UNDER
THE SECURITIES ACT OF 1933
NW18 HSN Holdings Plc
(Exact name of Registrant as specified in its charter)
| Cyprus | 8900 | Not Applicable | ||
| (State or other jurisdiction of incorporation or organization) | (Primary Standard Industrial Classification Code Number) | (I.R.S. Employer Identification Number) |
FC-24, 7th Floor, Sector 16A, Film City
Noida-201301, Uttar Pradesh
India
Tel (91 120) 469-1704
(Address, including zip code, and telephone number, including area code, of Registrant’s principal executive offices)
Corporation Service Company
1180 Avenue of the Americas
Suite 210
New York, NY 10036-8401
United States of America
(800) 927-9800
(Name, address, including zip code, and telephone number, including area code, of agent for service)
Copies to:
Prabhat K. Mehta, Esq. Michael Hyatte, Esq. Sidley Austin LLP | Rajiv Gupta, Esq. Michael W. Sturrock, Esq. Latham & Watkins LLP | |
6 Battery Road, Suite 40-01 Singapore 049909 (65) 6230-3900 | 9 Raffles Place #42-02 Republic Plaza Singapore 048619 (65) 6536-1161 |
Approximate date of commencement of proposed sale to the public:As soon as practicable after the effective date of this registration statement.
If any of the securities being registered on this Form are to be offered on a delayed or continuous basis pursuant to Rule 415 under the Securities Act of 1933, check the following box. ¨
If this Form is filed to register additional securities for an offering pursuant to Rule 462(b) under the Securities Act, check the following box and list the Securities Act registration statement number of the earlier effective registration statement for the same offering. ¨
If this Form is a post-effective amendment filed pursuant to Rule 462(c) under the Securities Act, check the following box and list the Securities Act registration statement number of the earlier effective registration statement for the same offering. ¨
If this Form is a post-effective amendment filed pursuant to Rule 462(d) under the Securities Act, check the following box and list the Securities Act registration statement number of the earlier effective registration statement for the same offering. ¨
CALCULATION OF REGISTRATION FEE
| ||||
Title of Each Class of Securities to be Registered(1) | Proposed Maximum Aggregate Offering Price(2) | Amount of Registration Fee | ||
Ordinary shares, nominal value $0.04 per share | $86,250,000 | $11,764.50 | ||
| ||||
| ||||
| (1) | Includes (a) ordinary shares initially offered and sold outside the United States that may be resold from time to time in the United States either as part of the distribution or within 40 days after the later of the effective date of this registration statement and the date the shares are first bona fide offered to the public and (b) additional ordinary shares that are issuable upon the exercise of the underwriters’ option to purchase additional ordinary shares to cover over-allotments, if any. |
| (2) | Estimated solely for the purposes of computing the amount of the registration fee pursuant to Rule 457(o) under the Securities Act of 1933, as amended. |
The registrant hereby amends this registration statement on such date or dates as may be necessary to delay its effective date until the registrant shall file a further amendment which specifically states that this registration statement shall thereafter become effective in accordance with Section 8(a) of the Securities Act of 1933 or until the registration statement shall become effective on such date as the Securities and Exchange Commission acting pursuant to said Section 8(a), may determine.
Table of Contents
The information in this preliminary prospectus is not complete and may be changed. We may not sell these securities until the registration statement filed with the Securities and Exchange Commission is effective. This preliminary prospectus is not an offer to sell these securities and is not soliciting an offer to buy these securities in any jurisdiction where the offer or sale is not permitted.
SUBJECT TO COMPLETION, DATED , 2012
PRELIMINARY PROSPECTUS

Shares
NW18 HSN Holdings Plc
Ordinary Shares
$ per Ordinary Share
This is the initial public offering of our ordinary shares. We are selling ordinary shares, and the selling shareholders named in this prospectus are selling ordinary shares. We will not receive any proceeds from the sale of ordinary shares by the selling shareholders. We currently expect the initial public offering price to be between $ and $ per ordinary share.
We and some of the selling shareholders have granted the underwriters an option to purchase up to additional ordinary shares to cover over-allotments.
Our ordinary shares have been approved for listing on the under the symbol “ .” We are an “emerging growth company” under federal securities laws and may elect to comply with reduced public company reporting requirements.
Investing in our ordinary shares involves risks. See “Risk Factors” beginning on page 14.
Neither the Securities and Exchange Commission nor any state securities commission has approved or disapproved of these securities or determined if this prospectus is truthful or complete. Any representation to the contrary is a criminal offense.
| Per Share $ | Total $ | |||||||||
Public Offering Price | $ | $ | ||||||||
Underwriting Discount | $ | $ | ||||||||
Proceeds to NW18 HSN Holdings Plc (before expenses) | $ | $ | ||||||||
Proceeds to the selling shareholders (before expenses) | $ | $ | ||||||||
The underwriters expect to deliver the ordinary shares to purchasers on or about , 2012, through the book-entry facilities of The Depository Trust Company.
Citigroup
, 2012
Table of Contents
We are responsible for the information contained in this prospectus. We have not authorized anyone to provide you with different information, and we take no responsibility for any other information others may give you. We are not, and the underwriters are not, making an offer to sell these securities in any jurisdiction where the offer or sale is not permitted. You should not assume that the information contained in this prospectus is accurate as of any date other than its date.
| Page | ||||
| ii | ||||
| 1 | ||||
| 14 | ||||
| 41 | ||||
| 42 | ||||
| 45 | ||||
| 46 | ||||
| 48 | ||||
| 50 | ||||
| 52 | ||||
| 53 | ||||
Management’s Discussion and Analysis of Financial Condition and Results of Operations | 56 | |||
| 83 | ||||
| 101 | ||||
| 105 | ||||
| 119 | ||||
| 121 | ||||
| 124 | ||||
| 148 | ||||
| 151 | ||||
| 160 | ||||
| 166 | ||||
| 167 | ||||
| 168 | ||||
| F-1 | ||||
i
Table of Contents
CONVENTIONS THAT APPLY TO THIS PROSPECTUS
We conduct our business principally through our sole subsidiary, TV18 Home Shopping Network Limited, an Indian corporation. In this prospectus, unless otherwise stated or unless the context otherwise requires, references to “we,” “us,” “our,” or “our company” are to NW18 HSN Holdings Plc and its sole subsidiary collectively, and references to “our holding company” are to NW18 HSN Holdings Plc on a standalone basis.
In this prospectus, references to “U.S.,” the “United States” or “USA” are to the United States of America, its territories and its possessions. References to “India” are to the Republic of India, and references to “Cyprus” are to the Republic of Cyprus. References to “$,” “dollars” or “US dollars” are to the legal currency of the United States and references to “ ,” “Rs.,” “rupees” or “Indian rupees” are to the legal currency of India.
Solely for the convenience of the reader, this prospectus contains translations of certain Indian rupee amounts into U.S. dollars at specified rates. Except as otherwise stated in this prospectus, all translations from Indian rupees to U.S. dollars are based on the noon buying rate of 50.89 per $1.00 in the City of New York for cable transfers of Indian rupees, as certified for customs purposes by the Federal Reserve Bank of New York on March 30, 2012. No representation is made that the Indian rupee amounts referred to in this prospectus could have been or could be converted into U.S. dollars at such rates or any other rates. Any discrepancies in any table between totals and sums of the amounts listed are due to rounding.
The consolidated statement of financial position as of April 1, 2009 and the consolidated financial statements and related notes as of and for the fiscal years ended March 31, 2010, 2011 and 2012 included elsewhere in this prospectus have been prepared in accordance with International Financial Reporting Standards, or IFRS, as issued by the International Accounting Standards Board, or IASB. References to a particular “fiscal year” are to our fiscal year ended March 31 of that year. Our fiscal quarters end on June 30, September 30, December 31 and March 31. References to a year other than a “fiscal” year are to the calendar year ended December 31.
In this prospectus, we refer to the distributors and manufacturers that offer and sell products through our digital commerce platform as our Sourcing Partners. Our use of the term “Sourcing Partner” does not mean that we have formed any legal partnerships with any of our Sourcing Partners.
In this prospectus, references to “compound annual growth rate” and “CAGR” are to an annualized measure of growth of a metric over a particular period of time (typically more than one year) that is calculated by annualizing and compounding the net change in the metric from the beginning to the end of the period. As such, CAGR is not a depiction of actual growth over the period but rather a smoothed annualization of such period’s net change.
In this prospectus, references to “SKUs” are to stock-keeping units, which are numbers or codes used to identify products or items for sale. A particular product may have more than one SKU ascribed to it, such as when the product may be sold in different colors or with other varying unique features. SKUs are often used by businesses to track inventory or availability of products with identical features.
In this prospectus, we refer to information regarding the digital commerce industry and our competitors from market research reports, analyst reports, news articles and other publicly available sources, including the United States Central Intelligence Agency World Factbook, or the CIA World Factbook and Internet World Stats. See “Business” for further details.
In this prospectus, we refer to various key metrics that we use to evaluate aspects of overall transaction activity in our channels and the financial performance of our business and to aid our strategic planning. These key metrics include cumulative consumer base, gross transaction value, average gross commission, average order value and repeat business rate. See “Management’s Discussion and Analysis of Financial Condition and Results of Operations — Key Operating Metrics” for definitions of these metrics.
ii
Table of Contents
In this prospectus, references to the return rate for products are tothe percentage of products that have been returned by consumers as a percentage of the total value of products shipped to consumers in any given period. For the purposes of this metric, we track individual product shipments and assess returns for a particular period even after the end of such period. This assessment of returns differs from that used in gross transaction value.
Data presented in this prospectus on the number of unique visitors to our website and traffic to our website being direct to our website are sourced from Google Analytics, a service offered by Google Inc. that provides digital marketing intelligence. We use monthly Google Analytics data to track unique user statistics, which measure the total number of unique visitors who have visited our website at least once in a given month.
iii
Table of Contents
The following summary is qualified in its entirety by the more detailed information and consolidated financial statements and notes thereto appearing elsewhere in this prospectus. You should read the following summary together with the more detailed information regarding our company and the ordinary shares being sold in this offering and our consolidated financial statements and notes thereto appearing elsewhere in this prospectus. This prospectus includes forward looking statements that involve risks and uncertainties. See “Forward Looking Statements.”
Mission
Our mission is to transform the way consumers across
India discover and purchase high quality consumer products.
Overview
We operate a leading digital commerce platform in India, with the ability to access over 250 million consumers through the Internet, television and mobile devices. Since the launch of our service in 2008, we have built an end-to-end digital commerce platform providing Indian consumers access to over 500 brands. International and domestic brands such as Canon, Godrej, Micromax, Reebok, Samsung and Whirlpool are able to efficiently and effectively demonstrate, market and sell their products to consumers across India through our platform. Our multi-channel approach has allowed us to establish a trusted brand in the Indian market. Since our launch, over 4.5 million consumers across India have placed orders through our platform. We added over 470,000 consumers in the quarter ended June 30, 2012. We believe that our strategy provides us with a platform that is well suited to address the large and relatively untapped digital commerce opportunity in India.
The Indian market has certain unique market dynamics and infrastructure challenges, which require a technological and commercial solution that is different from that in other parts of the world. Because of the lack of large organized vendors across the country, infrastructure constraints, and rising costs for physical retail space that currently characterize the local consumer retail market in India, manufacturers and distributors are increasingly looking at digital commerce as a critical component of their respective strategies to reach and sell their products to Indian consumers on a national basis. However, India’s Internet landscape is still at an early stage of development, with 132 million users as of 2011, according to the FICCI-KPMG India Media and Entertainment Industry Report 2012, implying an Internet penetration of only approximately 10.8% (based on India’s population estimate by The Economist Intelligence Unit). Thus, an Internet-only platform does not fully address India’s market potential and need. On the other hand, India already has the world’s third largest television market, with a viewership base of over 539 million in 2011, according to the FICCI-KPMG report, thus enabling mass reach and scale. Even with this large base, India’s viewership is expected to increase to 789 million through 2016. According to the FICCI-KPMG report, at the end of 2011, there were approximately 119 million pay television households in India. By 2016, the number of pay television households is projected to grow to approximately 176 million, thus significantly increasing the potential reach of our television channel. As of March 31, 2012 our television channel, which is carried on pay television systems, reached more than 55 million households across India.
To reach the broadest possible consumer base in India, we have developed a customized digital commerce platform that combines the reach of the Internet, television and mobile devices. Our scale and distribution strategy make us an important relationship for the distributors and manufacturers that sell products through our platform, who we also refer to as our Sourcing Partners, providing us with the ability to showcase a broad range
1
Table of Contents
of products across multiple categories at competitive prices. During fiscal year 2012, we began showcasing new product categories including books and baby & kids products on our platform. We have developed a technology-enabled logistics network that allows our Sourcing Partners to deliver products to the consumer’s doorstep in over 3,000 towns and cities across India. We believe that our platform provides consumers with a differentiated and user-friendly experience, service and value.
Since the launch of our service in 2008, over 6.5 million transactions have been executed through our platform. Through our combined Internet, television and mobile presence we have become one of India’s best known brands in the digital commerce industry, with over 45% of June 2012 traffic to our website being direct to our site, as measured by Google Analytics, a product that provides Internet marketing intelligence.
The total value of all products sold through our platform, net of related returns, which we refer to as “gross transaction value,” was $44.2 million, $62.6 million and $108.5 million in fiscal years 2010, 2011 and 2012, respectively. Our revenue from operations comes primarily from commissions we charge for products sold through our platform and reimbursement of some of our freight and collection expenses from certain Sourcing Partners. We had revenue in fiscal years 2010, 2011 and 2012 of $14.6 million, $19.2 million and $24.5 million, respectively, and loss after tax in those years of $15.1 million, $12.6 million and $23.7 million, respectively.
Market Landscape
A Large, Fast-Growing and Urbanizing Consumer Market
India is the world’s second most populous country, with an estimated population of approximately 1.2 billion as of March 2012, which equates to 19.0% of the world population, according to The Economist Intelligence Unit. India also has one of the highest youth populations among major developed and developing countries, with a median age of 26.2 years as of 2011, according to the CIA World Factbook, which is expected to drive the addition of almost 270 million workers to the labor pool between 2005 and 2025, fueling India’s economic growth for the next two decades, according to McKinsey Global Institute’s 2007 report The “Bird of Gold”: The Rise of India’s Consumer Market.
Over the past decade, India has been one of the fastest-growing economies globally with overall real gross domestic product, or GDP, almost tripling since 2001 and projected to continue to grow at an annual rate of 6.7% between fiscal years 2011 and 2025, according to The Economist Intelligence Unit. India’s GDP on a purchasing power parity basis was $4.95 trillion in fiscal year 2012, according to The Economist Intelligence Unit, making India the third largest economy in the world after the United States and China and one of the largest global consumer markets – with private consumption contributing 57.2% of overall GDP. Driven by these economic developments, Indian society is rapidly evolving from a mostly rural and agricultural society into a more urban and consumption-oriented society.
A Large, Growing and Underserved Retail Market
Overall economic development in India is expected to drive significant growth of the Indian retail market.
While India is a large retail market by global standards, it has remained a highly fragmented market with very limited penetration for organized retail outside the large cities. Furthermore, even in these large cities, organized retail penetration is significantly lower than in developed as well as many developing markets. As a result, the Indian retail market is dominated by traditional stores that provide their local communities with limited product choices and lack the sophistication typically found at organized retail outlets.
2
Table of Contents
Rapidly Increasing Internet, Television and Mobile Penetration
Over the past decade, India has seen a rapid growth in Internet, television and mobile penetration, driven by demand by consumers and aggressive private sector investments that have resulted in innovative consumer-facing offerings.
| • | Television. India is the world’s third largest television market, according to FICCI-KPMG, and is expected to grow to 789 million viewers by 2016, representing a CAGR of 7.9% from 2011, while pay television is projected to grow to 176 million households by 2016, representing a CAGR of 8.1% from 2011. |
| • | Internet. According to FICCI-KPMG and Internet World Stats, in 2011, India had the third largest population of Internet users after China and the United States. FICCI-KPMG and The Economist Intelligence Unit estimate Internet penetration will reach 42.2%, or approximately 546 million users, by 2016, representing a CAGR of 32.8% since 2011. |
| • | Mobile Internet. Expanding 3G networks and broadband wireless access on mass-market smartphones are expected to transform India’s Internet user base, with the number of wireless Internet connections expected to grow from 65 million in 2011 to 392 million by 2016, representing a CAGR of 43.2%, and active Internet enabled smartphones increasing from 10 million in 2011 to 264 million in 2016, according to FICCI-KPMG. |
Our Opportunity
Digital commerce has a number of benefits which are highly relevant to the Indian consumer market, given its characteristics and challenges, including a larger selection and availability of products, ease and comfort of shopping, competitive pricing and multiple payment options. Through our multi-channel end-to-end digital commerce platform, our operational efficiency and our value proposition for consumers and Sourcing Partners, we are well-suited to address the large and relatively untapped digital commerce opportunity in India.
Our Value Proposition for Consumers
We believe that Indian consumers are looking to transact through a trusted digital commerce platform with highly reliable service that provides them with a superior shopping experience. Our digital commerce platform leverages our scale, reach and deep industry know-how to offer them a comprehensive solution that has the following attributes:
| • | Trust. Our presence across multiple channels has helped us gain consumer familiarity and trust. |
| • | Reach.Our multi-channel platform provides our Sourcing Partners access to over 250 million consumers. This is supported by our technology-enabled delivery and logistics network, which enables us to deliver products to consumers in over 3,000 towns and cities across India. |
| • | Selection and Quality.We have one of the largest selections of brands comprising over 500 global and local brands across all major product categories such as books, mobile phones, cameras, computers, electronics, apparel, jewelry, home & kitchen, appliances, toys, health & beauty, baby, office stationery and gifts & flowers. |
| • | Value. We are able to leverage our reach and logistics network to drive higher volumes for our Sourcing Partners, enabling them to derive economies of scale and remove inefficiencies in their sourcing and manufacturing, and ultimately enhancing the value proposition for consumers. |
3
Table of Contents
| • | Payment Choices and Flexibility. We offer consumers multiple payment options, ranging from credit cards, debit cards, net banking, cash on delivery, or COD, demand drafts and gift certificates, helping us facilitate consumer acceptance of digital commerce. |
Our Value Proposition for Sourcing Partners
Our digital commerce platform offers Sourcing Partners a single point of access to consumers throughout India and across various demographics by providing them the following advantages:
| • | Nationwide Reach. Through our platform, we are able to expand the addressable market for our Sourcing Partners by providing access to markets that may not be reachable through traditional marketing and distribution channels. |
| • | New Distribution Platform. Our digital commerce platform provides our Sourcing Partners a new distribution channel and enables them to bypass the multi-layer supply chain and deliver their products directly to consumers. This enables them to save costs, improve efficiencies and thereby offer more competitive prices to consumers. |
| • | Multi-channel Approach. We provide a single point of access for our Sourcing Partners to showcase their products on multiple channels which we believe enhances product and brand recognition among consumers. |
| • | Branding and Visibility. We offer valuable marketing and product demonstration opportunities for our Sourcing Partners and the brands they carry. We believe that television allows our Sourcing Partners to showcase their products and create awareness and visibility for them at a national level. In addition, our website offers our Sourcing Partners the opportunity for detailed consumer education through consumer reviews and product videos, tools for selecting desired products and interactive product evaluation. |
| • | Real-time Consumer Feedback.Our digital commerce platform enables an efficient and cost-effective means for product testing, consumer analytics, online product reviews and consumer feedback. This enables our Sourcing Partners to obtain real-time consumer feedback on their products, helping them to improve their product selection and marketing strategies. |
Our Strengths
We believe that the Indian digital commerce opportunity, our multi-channel solution to address this and our strong execution have resulted in the following key strengths for us:
Untapped Market Opportunity
We are addressing India’s large and growing retail market, estimated to be 23 trillion ($450 billion) for fiscal year 2012, and estimated to grow at a CAGR of 15.0% to reach 47 trillion ($920 billion) by fiscal year 2017, according to Crisil Research.
An Established Brand
Through our combined Internet, television and mobile presence we have become one of India’s best known brands in the digital commerce industry and have gained consumer familiarity and trust.
4
Table of Contents
Large, Engaged and Loyal Consumer Base
Since our launch, over 4.5 million consumers have placed orders through our platform, and over 6.5 million transactions have been executed through our platform. Our repeat business rate in the fourth quarter of fiscal 2012 reached 39.9%, demonstrating the value of our service and the loyalty of the consumer base.
Scale Benefits
The scale and reach of our operations make us an important relationship for our Sourcing Partners. We are able to expand the addressable market for our Sourcing Partners by providing them access to markets that may not be reachable through traditional marketing and distribution channels.
Extensive Selection
We are able to offer consumers a wide selection of products across multiple categories. As of June 30, 2012, our digital commerce platform showcased over 12 million different SKUs and over 500 international and domestic brands, including Canon, Fabindia, Godrej, Micromax, Reebok, Samsung and Whirlpool.
Speed to Market
Our direct-to-consumer solution enables brands and Sourcing Partners to launch new products quickly and efficiently on a nationwide basis, by-passing the multi-layer supply chain. Introduction of new products is also facilitated by the ability to demonstrate and explain these products through our digital commerce platform.
Consumer Data and Analytics
Our digital commerce platform enables an efficient and cost-effective means for product testing, consumer analytics, online product reviews and consumer feedback. This enables our Sourcing Partners to obtain real-time consumer feedback on their products, helping them to improve their product selection and marketing strategies.
Experienced Management Team with Proven Track Record
Our management team successfully launched our business in 2008, and has helped it grow to become one of India’s leading digital commerce platforms. With diverse yet complementary backgrounds, the team benefits from deep industry expertise across media, digital commerce, consumer products, retail, logistics and IT. We believe that our management team’s collective experience and strong execution capabilities has and will enable us to continue to realize significant growth opportunities.
Our Growth Strategy
We intend to grow our business by focusing on following our key growth strategies, which include growing the consumer base, growing our Sourcing Partner base, expanding the catalog of products showcased on our platform, expanding delivery infrastructure, further leveraging our scale, extending our mobile channel and pursuing strategic alliances and potential acquisitions.
5
Table of Contents
Risk Factors
Our business is subject to numerous risks and uncertainties that may materially affect our business, financial condition, results of operations and prospects, as more fully described in the section entitled “Risk Factors,” immediately following this prospectus summary. These include risks and uncertainties related to:
| • | our significant operating losses in the past, our short operating history and uncertainties regarding the growth and profitability of digital commerce in India; |
| • | any harm to our HomeShop18 brand or our reputation as well as our ability to respond to changing consumer preferences; |
| • | our relationships with third parties, including cable and direct-to-home, or DTH, operators, our Sourcing Partners, courier companies and call center operators; |
| • | impediments to the execution and success of our growth strategy; |
| • | our susceptibility to adverse changes in the political, economic and regulatory environment in India that could materially harm our business; |
| • | competition from new and existing companies that may cause us to lose market share and depress our margins; |
| • | our dependence on our relationship with Network18 Media & Investments Limited, or Network18, and its affiliates for financial support and various important aspects of our business; and |
| • | continued control over us by our principal shareholders. |
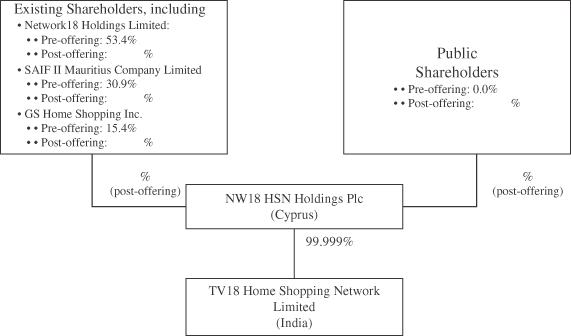
Corporate Structure
The following diagram illustrates our corporate structure and ownership in our holding company and our sole subsidiary.
6
Table of Contents
Relationship with Network18
We were formed by Network18 Media & Investments, or Network18, an Indian media and entertainment company whose shares are listed on India’s Bombay Stock Exchange and National Stock Exchange. Network18 is controlled by Mr. Raghav Bahl, who is also one of our directors. Network18 and Mr. Bahl beneficially own a majority of our ordinary shares. Upon completion of this offering, their beneficial ownership in us will be %, and they will continue to have four of their nominees on our board of directors. See “Principal and Selling Shareholders” for more information on beneficial ownership of our ordinary shares, and “Management” and “Description of Share Capital” for more information on our directors, executive officers and corporate governance structure.
We have received, and continue to receive, considerable financial support from Network18 and its affiliates. Network18, through certain subsidiaries, has been our largest single investor. In addition, Network18 has issued a letter to our Indian subsidiary assuring continued financial support as necessary for our Indian subsidiary to fulfill its business obligations in all material respects for the 12-month period beginning August 16, 2012, and our consolidated financial statements have been prepared on a going concern basis on the basis of this support. Network18 and Mr. Bahl have also provided guarantees in respect of certain credit facilities under which we had outstanding borrowings of Rs. 346.9 million ($6.8 million) as of July 31, 2012, although we intend to fully repay all outstanding borrowings under these facilities with the proceeds from this offering.
We have also entered into various commercial arrangements with Network18 and its affiliates, including:
| • | licensing of the use and appearance of “18” in our trade names and logos; |
| • | Sourcing Partner relationships; |
| • | purchases of television airtime and advertising; |
| • | use of satellite uplinking facilities; and |
| • | negotiation of carriage arrangements with third parties. |
See “Related Party Transactions” and “Risk Factors — Risks Related to Us and Our Industry” for more information on the relationship with Network18, Mr. Bahl and their affiliates and the transactions we have entered into with them.
Corporate Information
We are a public company limited by shares incorporated in Cyprus. We were incorporated as 18 Holdings Cyprus Limited, a private company limited by shares, on April 29, 2006. On September 4, 2006, we changed our name to TV18 HSN Holdings Limited. On , 2012, we further changed our name to NW18 HSN Holdings Plc. Our registered office is located at 10 Diomidous Street, Alphamega Akropolis Building, 3rd Floor, Office 401, 2024 Nicosia, Cyprus. Our executive offices are located at FC-24, 7th Floor, Sector 16A, Film City, Noida-201301, Uttar Pradesh, India, and the telephone number at this location is (91 120) 469-1704. Our website address is www.HomeShop18.com. The information contained on our website does not form part of this prospectus. Our agent for service of process in the United States is Corporation Service Company, located at 1180 Avenue of the Americas, Suite 210, New York, NY 10036-8401.
7
Table of Contents
Implications of Being an Emerging Growth Company
As a company with less than $1.0 billion in revenue during our last fiscal year, we are an “emerging growth company,” as defined in the Jumpstart Our Business Startups Act of 2012, or the JOBS Act, and for as long as we continue to be an “emerging growth company,” we may choose to take advantage of exemptions from various reporting requirements applicable to other public companies but not to “emerging growth companies,” including, but not limited to, not being required to comply with the auditor attestation requirements of Section 404 of the Sarbanes-Oxley Act of 2002, or the Sarbanes-Oxley Act. We could be an “emerging growth company” for up to five years, although, if our annual revenue exceeds $1.0 billion, we issue more than $1.0 billion in non-convertible debt over a three-year period or the market value of our ordinary shares that is held by non-affiliates exceeds $700 million before the end of that five-year period, we could cease to be an “emerging growth company” earlier. We cannot predict if investors will find our ordinary shares less attractive if we choose to rely on these exemptions. If some investors find our ordinary shares less attractive as a result of any choices to reduce future disclosure, there may be a less active trading market for our ordinary shares and our stock price may be more volatile.
In addition, Section 107 of the JOBS Act provides that an “emerging growth company” can take advantage of the extended transition period provided in Section 7(a)(2)(B) of the Securities Act of 1933, or the Securities Act, for complying with new or revised accounting standards. In other words, an “emerging growth company” can delay the adoption of certain accounting standards until those standards would otherwise apply to private companies. However, we are choosing to “opt out” of such extended transition period, and as a result, we will comply with new or revised accounting standards on the relevant dates on which adoption of such standards is required for non-emerging growth companies. Section 107 of the JOBS Act provides that our decision to opt out of the extended transition period for complying with new or revised accounting standards is irrevocable.
8
Table of Contents
The Offering
Offering price | We currently anticipate that the initial public offering price will be between $ and $ per ordinary share. |
Ordinary shares offered:
By us | shares |
By the selling shareholders | shares |
Total | shares |
Ordinary shares outstanding before this offering | shares |
Ordinary shares to be outstanding after this offering(1) | shares |
Over-allotment option | shares |
Voting rights | Ordinary shares are entitled to one vote per share. |
Use of proceeds | We expect that the net proceeds we will receive from the sale of the ordinary shares offered by us will be approximately $ million, assuming an initial public offering price of $ per ordinary share, which is the midpoint of the price range on the cover page of this prospectus, and after deducting the underwriting discounts and commissions and estimated offering expenses payable by us. |
| We intend to use the net proceeds received by us from this offering for general corporate purposes, including working capital, brand-building initiatives to increase brand awareness among consumers and capital expenditures such as the expansion of our television studio infrastructure and the introduction of programming in regional languages on our television channel. We also intend to use a portion of these proceeds to repay a bank loan. We may use a portion of the proceeds for the acquisition of, or investment in, technologies, solutions or businesses that complement our business. See “Use of Proceeds.” |
| We will not receive any of the proceeds from the sale of ordinary shares by the selling shareholders. |
Lock-up | We, our offices and directors, certain of our employees and the selling shareholders and our other principal shareholders have agreed with the underwriters, with certain exceptions, not to sell or transfer any ordinary shares or securities convertible into or exercisable for ordinary shares for a period of 180 days after the date of this prospectus. See “Underwriting.” |
9
Table of Contents
Risk factors | See “Risk Factors” and other information included in this prospectus for a discussion of the risks you should carefully consider before deciding to invest in our ordinary shares. |
Payment and settlement | The ordinary shares are expected to be delivered against payment on , 2012. The ordinary shares will be deposited with a custodian for, and registered in the name of a nominee of, The Depository Trust Company, or DTC, in New York, New York. In general, beneficial interests in the ordinary shares will be shown on, and transfers of those beneficial interests will be effected only through, records maintained by DTC and its direct and indirect participants. |
Listing | Our ordinary shares will be listed on . |
Stock exchange symbol | “ ” |
Note:
| (1) | The total number of ordinary shares outstanding after the offering is based on 41,923,401 ordinary shares outstanding as of March 31, 2012 and: |
| • | does not take into account the possible issuance of additional ordinary shares to the underwriters pursuant to their option to purchase additional ordinary shares to cover over-allotments; |
| • | assumes the conversion of all preference shares and warrants into 54,233,549 ordinary shares in connection with this offering; |
| • | excludes 2,177,000 ordinary shares issuable upon the exercise of share options outstanding as of March 31, 2012. These options were all granted under our share option plan and have a weighted average exercise price of $0.12 per share. Of the 2,177,000 options outstanding as of March 31, 2012, 3,750 were subsequently exercised; |
| • | excludes 202,000 ordinary shares issuable under options for which as of March 31, 2012 the exercise process has been commenced but was not completed until after that date. 92,000 of these ordinary shares were issued at an exercise price of $0.11 per share, 70,000 of these ordinary shares were issued at an exercise price of $0.09 per share and the remaining 40,000 of these ordinary shares were issued at an exercise price of $0.10 per share; and |
| • | excludes ordinary shares issuable at our election upon the exercise of the 2,260,000 outstanding stock appreciation rights, all of which were granted in November 2012. These stock appreciation rights were all granted under our stock appreciation rights scheme and have a weighted average exercise price of $0.88 per share. Stock appreciation rights may be settled in cash or ordinary shares, at our option. No more than 2,260,000 ordinary shares are issuable under these outstanding stock appreciation rights. See “Management — Share Incentive Plans — Stock Appreciation Rights Scheme” for more information. |
10
Table of Contents
Summary Consolidated Financial and Other Data
The following summary consolidated statement of comprehensive income and loss data for fiscal years ended March 31, 2010, 2011 and 2012, and the summary consolidated statement of financial position data as of March 31, 2012, have been derived from our audited consolidated financial statements included elsewhere in this prospectus. The financial data set forth below should be read in conjunction with, and are qualified by reference to, “Selected Consolidated Financial and Other Data,” “Management’s Discussion and Analysis of Financial Condition and Results of Operations” and the consolidated financial statements and notes thereto included elsewhere in this prospectus. Our consolidated financial statements are prepared and presented in accordance with IFRS as issued by the IASB. Our historical results do not necessarily indicate results expected for any future period.
| Fiscal Year Ended March 31 | ||||||||||||
| 2010 | 2011 | 2012 | ||||||||||
(in thousands, except per share data and number of shares) | ||||||||||||
Consolidated Statement of Comprehensive Income (Loss) Data: | ||||||||||||
Revenue from operations | $ | 14,641.7 | $ | 19,194.0 | $ | 24,457.7 | ||||||
Television | 14,641.7 | 18,842.5 | 20,494.2 | |||||||||
Internet | — | 351.5 | 3,963.5 | |||||||||
Employee benefit expense | (4,331.8 | ) | (6,250.1 | ) | (8,565.3 | ) | ||||||
Freight and collection expenses | (4,625.8 | ) | (6,614.5 | ) | (11,831.1 | ) | ||||||
Carriage fees | (4,278.6 | ) | (5,254.4 | ) | (6,196.8 | ) | ||||||
Airtime expenses | (293.2 | ) | (631.1 | ) | (264.8 | ) | ||||||
Call center expenses | (1,073.4 | ) | (2,027.0 | ) | (3,378.8 | ) | ||||||
Advertisement and business promotion expenses | (2,169.5 | ) | (3,854.7 | ) | (7,440.2 | ) | ||||||
Other operating expenses | (4,488.3 | ) | (7,357.8 | ) | (8,282.0 | ) | ||||||
Depreciation and amortization | (773.6 | ) | (989.6 | ) | (1,249.7 | ) | ||||||
Finance income | 730.2 | 1,159.5 | 1,092.8 | |||||||||
Finance costs | (8,412.8 | ) | (51.0 | ) | (884.3 | ) | ||||||
Income tax expense | (2.5 | ) | (1.5 | ) | — | |||||||
|
|
|
|
|
| |||||||
Loss after tax | (15,077.4 | ) | (12,678.2 | ) | (22,542.5 | ) | ||||||
|
|
|
|
|
| |||||||
Exchange differences on translating foreign operations | 870.2 | 37.4 | (1,152.1 | ) | ||||||||
|
|
|
|
|
| |||||||
Total comprehensive loss for the year attributable to our owners | $ | (14,207.2 | ) | $ | (12,640.8 | ) | $ | (23,694.6 | ) | |||
|
|
|
|
|
| |||||||
Loss per share (basic and diluted) | $ | (0.27 | ) | $ | (0.18 | ) | $ | (0.33 | ) | |||
Weighted average number of ordinary shares outstanding (basic and diluted) | 38,339,462 | 41,923,401 | 41,923,401 | |||||||||
Pro forma loss per share (basic and diluted)(1) (unaudited) | $ | (0.24) | ||||||||||
Pro forma weighted average number of ordinary shares outstanding (basic and diluted)(1) (unaudited) | 95,282,755 | |||||||||||
Note:
| (1) | Our pro forma loss per share (basic and diluted) and pro forma weighted average number of ordinary shares outstanding (basic and diluted) have been calculated assuming that the following all occurred on a “hypothetical basis” on April 1, 2011, except for the conversion of warrants, which are given effect as of the issuance dates of the warrants during fiscal year 2012: (i) our May 2012 share capital reorganization; (ii) the full funding of our partially paid warrants and the repayment of related subordinated loans from the warrant proceeds which will occur on or before the completion of this offering; (iii) the conversion of all our preference shares and warrants into 54,233,549 ordinary shares that will occur by the completion of this offering; and (iv) the issuance of 202,000 ordinary shares under options, for which the exercise process, as of March 31, 2012 had been commenced but was not yet complete by that date. For more information on our share capital, including our May 2012 share capital reorganization, see “Description of Share Capital.” |
11
Table of Contents
The following table sets forth a summary of our consolidated statement of financial position as of March 31, 2012:
| • | on an actual basis; and |
| • | on a pro forma as adjusted basis to reflect |
| (1) | our May 2012 share capital reorganization described in the third paragraph of “Description of Share Capital”; |
| (2) | the full funding of our partially paid warrants and the repayment of related subordinated loans from the warrant proceeds which will occur on or before the completion of this offering; |
| (3) | the conversion of all outstanding preference shares and warrants as of March 31, 2012 into 54,233,549 ordinary shares in connection with this offering; |
| (4) | the issuance of 202,000 ordinary shares under options for which the exercise process, as of March 31, 2012 had been commenced but was not yet complete by that date; and |
| (5) | the issuance and sale by us of ordinary shares offered in this offering at the assumed public offering price of $ per share, the midpoint of the estimated initial public offering price range set forth on the cover page of this prospectus, and after deducting the underwriting discounts and commissions and estimated offering expenses payable by us, and further assuming no exercise by the underwriters of the over-allotment option and no other change to the number of ordinary shares sold by us as set forth on the cover page of this prospectus. |
| As of March 31, 2012 | ||||||||
| Actual | Pro Forma As Adjusted(3) | |||||||
| (in thousands) | ||||||||
Consolidated Statement of Financial Position Data: | ||||||||
Goodwill | $ | 195.5 | $ | 195.5 | ||||
Other intangible assets | 234.6 | 234.6 | ||||||
Property, plant and equipment | 3,130.5 | 3,130.5 | ||||||
Security deposits | 482.7 | 482.7 | ||||||
Current tax assets | 2,162.3 | 2,162.3 | ||||||
Other non-current assets | 289.1 | 289.1 | ||||||
Trade receivables | 1,100.3 | 1,100.3 | ||||||
Bank deposits and short term investments | 680.2 | 680.2 | ||||||
Cash and cash equivalents | 1,449.1 | |||||||
Other current assets | 12,071.2 | 12,071.2 | ||||||
|
|
|
| |||||
Total assets | $ | 21,795.6 | $ | (4) | ||||
|
|
|
| |||||
Total equity (deficit) | $ | (1,304.2 | ) | $ | ||||
Employee benefits obligations (excluding current portion) | 108.8 | 108.8 | ||||||
Employee benefits obligations (current portion) | 251.7 | 251.7 | ||||||
Trade payables | 6,264.5 | 6,264.5 | ||||||
Loans and borrowings (current portion)(1) | 11,313.1 | 8.4 | ||||||
Derivative financial liabilities(2) | 180.0 | — | ||||||
Bank overdraft | 575.7 | 575.7 | ||||||
Other current liabilities | 4,405.9 | 4,405.9 | ||||||
|
|
|
| |||||
Total liabilities | 23,009.8 | 11,901.3 | ||||||
|
|
|
| |||||
Total equity (deficit) and liabilities | $ | 21,795.6 | $ | |||||
|
|
|
| |||||
12
Table of Contents
Notes:
| (1) | Some of the warrants issued by us are hybrid instruments with non-derivative and derivative liability components. This line item includes the non-derivative liability portion of these warrants of $0.6 million as of March 31, 2012. This line item also includes the $10.7 million liability as of March 31, 2012 of our subordinated loans that will be repaid from the proceeds of the funding of outstanding partially paid warrants, which will occur on or before the completion of this offering. The conversion of these warrants into ordinary shares in connection with this offering will result in the non-derivative liability portion of the warrants moving to our equity accounts. Accordingly, this amount has been excluded from our pro forma as adjusted column. As there will be no liability in respect of the subordinated loans after they are repaid, this amount has also been excluded from our pro forma as adjusted column. |
| (2) | Some of the warrants issued by us are hybrid instruments with non-derivative and derivative liability components. This line item represents the derivative liability portion of these warrants as of March 31, 2012. The conversion of these warrants into ordinary shares effective upon the completion of this offering will result in the derivative liability portion of the warrants moving to our equity accounts. Accordingly, this amount has been excluded from our pro forma as adjusted column. |
| (3) | A $1.00 increase/(decrease) in the assumed initial public offering price of $ per ordinary share in this offering would increase/(decrease) each of cash and cash equivalents, total assets, total equity (deficit) and total equity (deficit) and liabilities by $ . |
| (4) | Pro forma as adjusted total equity (deficit) includes the amount payable as of March 31, 2012 to fully fund our partially paid warrants, which was $10.7 million. |
Other Data:
The following table sets forth for the periods indicated, certain key metrics we use to evaluate aspects of overall transaction activity in our channels and the financial performance of our business and to aid our strategic planning. For details on how these metrics are calculated, see “Management’s Discussion and Analysis of Financial Condition and Results of Operations — Key Operating Metrics.”
| Fiscal Year | ||||||||||||
| 2010 | 2011 | 2012 | ||||||||||
| (in thousands, except percentages and average order values) | ||||||||||||
Consolidated: | ||||||||||||
Cumulative consumer base | 1,457.5 | 2,393.4 | 4,006.3 | |||||||||
Gross transaction value | $ | 44,186.9 | $ | 62,569.2 | $ | 108,547.0 | ||||||
Average gross commission | 33.0 | % | 30.5 | % | 22.5 | % | ||||||
Average order value | $ | 50.6 | $ | 49.3 | $ | 37.9 | ||||||
Repeat business rate | 27.5 | % | 34.9 | % | 39.9 | % | ||||||
Television: | ||||||||||||
Gross transaction value | $ | 44,186.9 | $ | 60,758.6 | $ | 77,740.3 | ||||||
Average gross commission | 33.0 | % | 30.8 | % | 26.3 | % | ||||||
Average order value | $ | 50.6 | $ | 49.5 | $ | 45.1 | ||||||
Internet: | ||||||||||||
Gross transaction value | — | $ | 1,810.6 | $ | 30,806.7 | |||||||
Average gross commission | — | 19.4 | % | 12.8 | % | |||||||
Average order value | — | $ | 44.1 | $ | 27.0 | |||||||
13
Table of Contents
An investment in our ordinary shares involves significant risks. You should carefully consider the risks described below before making an investment decision. Additional risks not presently known to us or that we currently deem immaterial may also impair our business operations. Our business, financial condition or results of operations could be materially and adversely affected by any of these risks. The trading price and value of our ordinary shares could decline due to any of these risks, and you may lose all or part of your investment.
This prospectus also contains forward-looking statements that involve risks and uncertainties. Our actual results could differ materially from those anticipated in these forward-looking statements as a result of certain factors, including the risks faced by us described below and elsewhere in this prospectus.
Risks Related to Us and Our Industry
We have incurred significant operating losses in the past, and we may not be able to generate sufficient revenue to achieve profitability.
Since our inception, we have incurred significant operating losses, and, as of March 31, 2012, we had an accumulated deficit of approximately $80.7 million. We also do not expect to achieve profitability in the near term. Although our revenue from operations has grown rapidly, our revenue growth in the future may be lower. You should not rely on the revenue growth of any prior quarterly or annual period as an indication of our future performance. We also expect our costs to increase in future periods as we continue to spend substantial financial resources on:
| • | growing the consumer base; |
| • | expanding into new product categories; |
| • | enhancing and growing our Internet and mobile channels; |
| • | continuing to build our logistics and delivery infrastructure; and |
| • | pursuing strategic alliances and potential acquisitions. |
These expenditures might not yield additional revenue that we anticipate or at all. If we are unable to achieve revenue growth that outpaces the growth in our expenses, we will not achieve profitability, our cash position will deteriorate and we may become insolvent.
Network18 Media & Investments Limited, or Network18, the parent company of our majority shareholder, has issued a letter to our Indian subsidiary assuring continued financial support as necessary for our subsidiary to fulfill its business obligations in all material respects for the 12-month period beginning August 16, 2012, and our consolidated financial statements have been prepared on a going concern basis on the basis of this support. We cannot assure you that Network18 will continue to provide this support in the future, in which event, we may become insolvent. Network18 and Mr. Raghav Bahl, who controls Network18, have also provided us with loan guarantees, without which banks may not be willing to lend to us on favorable terms or at all.
Our recent growth rate may not be sustainable, and a failure to manage our growth effectively would materially and adversely affect our business, financial condition and results of operations.
We have experienced high growth in recent years. From fiscal year 2011 to fiscal year 2012, the gross transaction value executed through our platform increased by 73.5% and our revenue from operations increased by 27.4%. Our total number of employees increased from 293 as of March 31, 2011 to 354 as of March 31, 2012. We expect this growth to place significant demands on us and require us to continuously evolve and improve operational, financial and internal controls across our company. Addressing the challenges arising from our growth entails substantial senior level management time and resources and puts significant demands on our
14
Table of Contents
management team and other resources. Further, we may not be able to sustain a similar rate of growth or manage our growth effectively. We may also not be able to hire, train, supervise and manage the new employees we require for the management and execution of our expansion plans in sufficient numbers or at all. Any failure to manage our growth effectively would materially and adversely affect our business, financial condition and results of operations.
We have a short operating history in an evolving industry, which makes it difficult to evaluate our future prospects.
We have a short operating history in an evolving industry that may not develop as expected. This short operating history makes it difficult to assess our future prospects. You should consider our business and prospects in light of the risks and difficulties we may encounter in this rapidly evolving industry. These risks and difficulties include our ability to, among other things:
| • | increase the number of consumers transacting on our digital commerce platform; |
| • | successfully compete with existing and future providers of digital commerce as well as physical stores and outlets; |
| • | hire, train and retain talented personnel; |
| • | effectively manage rapid growth in our personnel and operations; |
| • | react and adapt to price competition in the market, both from digital commerce service providers and physical stores and outlets; |
| • | achieve sufficient sales volume to realize economies of scale; and |
| • | develop and maintain our arrangements and relationships with current and future Sourcing Partners. |
Failure to adequately address these risks and difficulties could materially and adversely affect our business, financial condition and results of operations.
Uncertainties regarding the growth and profitability of the digital commerce industry in India could adversely affect our business and future prospects.
The digital commerce industry in India is in its growth stages. The growth of digital commerce in India is dependent on many factors, including a continued shift in India away from rural and agrarian society to a more urban, consumption-oriented one, an increasing need for a convenient and reliable user experience as consumer preferences evolve. Our future operating results will depend on numerous factors affecting the development of digital commerce, which may be beyond our control. These factors include:
| • | the growth of personal computer, tablets and mobile devices including smartphones, Internet and broadband usage and penetration in India, and the rate of any such growth; |
| • | the trust and confidence level of consumers in digital commerce, as well as changes in consumer demographics and consumers’ tastes and preferences; |
| • | the acceptability of alternative business models that better address the needs of consumers in India; |
| • | positive media publicity regarding digital commerce in India; |
| • | the development of fulfillment, payment and other services associated with online purchases; and |
| • | general economic conditions, particularly economic conditions affecting discretionary consumer spending. |
15
Table of Contents
If digital commerce does not develop as we expect, or if we fail to identify and anticipate the trends and preferences in the digital commerce industry or the demands and needs of consumers and address them in time or at all, our business, financial condition and results of operations and financial condition will be harmed.
Any harm to our HomeShop18 brand or failure to maintain our reputation may materially and adversely affect our business and growth prospects.
We believe that the recognition and reputation of our “HomeShop18” brand among consumers and Sourcing Partners have significantly contributed to the growth of our business. Maintaining and enhancing the recognition and reputation of our brand is critical to our business and competitiveness. This may require us to make substantial investments and these investments may not be successful. Many factors, some of which are beyond our control, may negatively impact our brand and reputation if not properly managed. These factors include our ability to:
| • | continue to provide a satisfactory consumer experience; |
| • | adapt to evolving consumer preferences and introduce new products and product categories; |
| • | develop new channels as consumers migrate to new technologies; |
| • | increase brand awareness among existing and potential consumers through various marketing and promotional activities; |
| • | maintain the popularity, attractiveness and quality of the products we showcase on our platform; and |
| • | preserve our reputation in the event of any negative media publicity on Internet security or product quality issues affecting us or other digital commerce businesses in India. |
We rely on several third parties as part of our business model. For example, we rely on our Sourcing Partners to ensure the availability and quality of products that consumers purchase through our digital commerce platform. In addition, we rely on courier companies to handle product deliveries, as well as payment collection for COD sales, and we outsource the staffing of our call center, which handles sales and consumer support for our platform. Any failure to perform adequately by any of these third parties may create an unfavorable impression of us on consumers which could negatively impact our brand and reputation.
Competition from new and existing companies may cause us to lose market share and consumers and depress our margins, which would adversely affect our business and results of operation.
Digital commerce is intensely competitive and rapidly changing and competition is likely to intensify even further in the future. We face competition for consumer attention, Sourcing Partners and attractive commercial terms. Our business faces direct competition from television-based companies, such as Star CJ Alive, and online commerce companies, such as flipkart.com and ebay.in. In addition, we indirectly compete for consumers with organized retail, including physical stores and outlets. Our television channel also competes for access to consumers and audience share with other conventional forms of entertainment and content.
We may not be able to effectively compete with current and future competitors who may have longer operating histories, superior strategy and execution, greater resources, greater name recognition and a larger consumer base than us. In addition, competitors may be acquired by, receive investment from or enter into strategic relationships with, well-established and well-financed companies or investors which would help enhance their competitive positions.
Organized retail, which includes supermarkets and other physical stores and outlets offering wider choice and is backed by larger companies, has low penetration in India with a majority of consumers transacting at local small retail stores. However, organized retail is growing rapidly, and we expect that growth to continue. In
16
Table of Contents
addition, an easing of the restrictions on foreign investment in multi-brand retail in India will likely also increase competition as international online commerce companies and traditional retailers will be able to enter the market.
We compete to establish and retain favorable commercial agreements with a wide range of Sourcing Partners for product distribution on our platform. Our competitors may have advantages that enable them to secure merchandise from suppliers on more favorable terms, offer products similar to those offered on our platform at lower prices, respond more quickly and effectively than we do to new or changing opportunities, technologies, standards or consumer preferences. These factors can attract consumers away from our platform, force price reductions and hence lower our margins and limit our growth potential, in which case our business, financial condition and results of operations will be harmed.
Our revenues depend heavily on transactions for digital products executed through our platform, and any event that adversely affects sales of these products on our platform or our ability to attract and retain consumers for these products could harm our business and results of operations.
We have historically focused on the sale of various digital products including mobile phones, cameras and camcorders through our platform. Gross transaction value from these products accounted for approximately 49.3%, 47.9% and 54.8% of our total gross transaction value in fiscal years 2010, 2011 and 2012, respectively. While we have increased the marketing of other products and will continue to expand product offerings to gradually diversify our revenue sources, sales of these new categories of products may not increase to a level that would reduce our dependence on digital products. In addition, consumers who purchase digital products may also account for significant levels of purchases of other items sold through our platform, which are generally higher margin items. Loss of these consumers through a reduction in their purchases of digital products may therefore cause significant reductions in purchases in other product categories, including those that yield higher margins. Any event that results in a reduction in our sales of digital products could materially and adversely affect our business, financial condition and results of operations.
We depend on certain cities for a significant portion of transactions executed through our platform.
Gross transaction value of total transactions executed through our platform from Delhi and certain surrounding suburban areas, the national capital region, or Delhi NCR, Mumbai, Bengaluru (formerly Bangalore), Chennai and Kolkata accounted for approximately 30.3% of our fiscal year 2012 gross transaction value. Delhi NCR and Mumbai accounted for approximately 17.3% and 4.8%, respectively, of our fiscal year 2012 gross transaction value.We believe that the number of consumers from these cities who transact with us depends on several factors, including the availability and pricing of various products in these cities and towns. Easier availability of products in these cities and towns — either due to expansion of organized retail or delivery of products through other platforms — could lead to a drop in the number of products sold through our platform, which could materially and adversely affect our business, financial condition and results of operations.
The Internet has very limited penetration in India and may not develop as necessary to sustain the growth of our Internet business.
In the fourth quarter of fiscal year 2011, when we started our Internet business, and fiscal year 2012, 7.9% and 16.2%, respectively, of our revenue came from our Internet business, and we expect the contribution of our Internet business to our total revenue to continue to increase. According to FICCI-KPMG and Internet World Stats, in 2011, India had the third largest population of Internet users after China and the United States. However, overall penetration is still relatively low in India, with 2011 Internet penetration at 10.8% (or approximately 132 million users), as compared to over 78.3% in the United States. Moreover, alternative methods of obtaining access to the Internet, such as through mobile devices, are not readily available in many parts of India.
We cannot assure you that the means of accessing the Internet will become widely available in India. As a result, it is uncertain whether Internet penetration in India will increase in the future. If the number of Internet
17
Table of Contents
users does not increase significantly in India, we may not be able to expand the consumer base, which may require us to make additional investments in alternative distribution channels and may adversely affect our business, results of operations and prospects.
Furthermore, to the extent Internet penetration does increase, the success of our business operations will remain highly dependent on the growth, performance and reliability of the telecommunications networks and Internet infrastructure in India, which are factors beyond our control. The increasing number of users, bandwidth requirements, problems caused by computer viruses and other system disruptions may harm the performance of the Internet, leading to a variety of outages and other delays.
Our long-term success depends, in large part, on our continued ability to attract new and retain existing consumers in a cost-effective manner.
In an effort to attract and retain consumers, we engage in various marketing and promotional initiatives, which involve the expenditure of considerable resources, particularly in the case of the production and distribution of our television programming and, to a lesser extent, online advertising. We have devoted, and expect to continue to devote, significant resources to certain of these initiatives, particularly in connection with the growth and maintenance of certain popular product categories and brands sold through our platform, and to increase the engagement of consumers with our platform. These initiatives, however, may not become popular with consumers and may not be cost-effective. In addition, we believe that costs associated with the production and distribution of our television programming and costs associated with online marketing, including search engine marketing (primarily the purchase of relevant keywords) are likely to increase in the foreseeable future and, if significant, could have a material adverse effect on our business, financial condition and results of operations to the extent that they do not result in corresponding increases in revenues.
We do not own parts of our trade name and logo and are subject to related risks.
We license the use and appearance of “18” in our trade names and logos from Network18 for 10 per year. The license is non-exclusive and revocable. The license agreement is valid until August 31, 2016 and may also be terminated by Network18 in case of a material breach by us of the terms of the license agreement, in which event we would no longer be able to operate our business using the trade name and logo under which consumers have come to know us.
We also cannot assure you that there will not be some conflict or confusion associated with our use of the “18” logo in connection with our businesses and Network18’s use of it in connection with its businesses. Additionally, as a license-holder, we do not enjoy the statutory protections accorded to the owner of a registered trademark. Under the license agreement, Network18 is permitted to allow the trademarks to expire, and we are not permitted to commence any action to protect them. In the event a third party infringes on our trade name and logo, Network18 may not be willing to protect our rights through litigation, and this, or any other, failure by Network18 to maintain its trademarks or protect our use of them in a meaningful manner could cause erosion of our brand value.
We are also required by the license agreement to alter or modify the color and size of our trade names and logos at the direction of Network18, which could limit our ability to control our marketing initiatives.
Any of these developments on its own, or in the aggregate, could have a material adverse effect on our business.
We depend on relationships with cable and DTH operators and adverse changes in these relationships could result in an interruption, material decrease or even the cessation of carriage of our television channel.
We deliver our television channel through cable and DTH operators who provide the “last mile” cable link to the homes of subscribers. As of June 30, 2012, our television channel was available on most Indian DTH
18
Table of Contents
operators, including Reliance Big TV, Videocon d2h, Dish TVand Airtel DTH. The cessation of carriage of our television channel by a major cable or DTH operator or a significant number of smaller cable or DTH operators for a prolonged period of time could adversely affect our business, financial condition and results of operations. While we believe that we will be able to continue to successfully manage the distribution process in the future, certain changes in distribution levels, as well as increases in carriage fees, could occur notwithstanding these efforts.
We typically seek to enter into long-term distribution agreements with DTH operators and year-long agreements with cable operators; however, in some cases, renewals are not agreed upon prior to the expiration of a given agreement. No assurance can be given that we will be successful in negotiating renewals with all these operators or that the financial and other terms of renewal will be on acceptable terms. The failure to successfully renew or negotiate new distribution and affiliation agreements covering a material portion of these existing cable and DTH households on acceptable terms could have a material adverse effect on our business, financial condition and results of operations.
Increases in carriage fees could adversely affect our operations, business and financial results.
Historically, television channels in India have paid substantial carriage fees to obtain the right to air a channel on a distribution network to cable or DTH operators to ensure proper distribution of their channels. With limited bandwidth available to cable operators, these fees have increased in recent years. In fiscal years 2010, 2011 and 2012, our carriage fees were $4.3 million, $5.3 million and $6.2 million, respectively, or 29.2%, 27.4% and 25.3%, respectively, of revenue from operations for those periods. The number of new television channels is growing and therefore carriage fees may continue to increase. If carriage fees continue to increase, our business, financial condition and results of operations could be materially and adversely affected.
The failure to secure suitable channel placement for our television channel would adversely affect our ability to attract and retain television viewers and could result in a decrease in revenue.
We are dependent upon our continued ability to attract and retain television viewers. Effectively competing for television viewers is dependent, in substantial part, on our ability to secure suitable placement of our televisionchannel. The advent of digital compression technologies and the adoption of digital cable have resulted in increased channel capacity, which together with other changing laws, rules and regulations regarding cable television ownership, impacts our ability to secure suitable channel placement. While increased channel capacity could provide a means through which our television channel could be more widely distributed, it could also adversely affect our ability to attract television viewers to our television channel and cause a reduction in our growth rate to the extent it results in:
| • | placement of our television channel in add-on programming tiers, which generally have lower levels of television viewer penetration than basic or expanded basic programming tiers; |
| • | more competitors entering the marketplace; or |
| • | more programming options being available to the viewing public in the form of new television networks and time-shifted viewing (e.g., personal video recorders, video-on-demand, interactive television and streaming video over broadband Internet connections). |
If our television channel is carried exclusively in a system on an add-on programming tier, we will experience a reduction in revenue to the extent that the digital programming tier has less television viewerpenetration. In addition, we may experience a further reduction in revenue due to increased television viewing audience fragmentation and to the extent that not all television sets within a digital cable home are equipped to receive television programming in a digital format. Our future success will also depend, in part, on our ability to
19
Table of Contents
anticipate and adapt to technological changes and to offer elements of our television channel via new technologies in a cost-effective manner that meet consumer demands and evolving industry standards.
If we fail to manage our relationships with our Sourcing Partners or attract new Sourcing Partners, our business and growth prospects may suffer.
Our platform showcases products of the various distributors and manufacturers with which we have agreements, who we also refer to as our Sourcing Partners. Most of our Sourcing Partners are local or nationwide distributors of various products, including products sold by well-known international and Indian brands.Our business is dependent on our ability to maintain relationships and favorable commercial arrangements with existing Sourcing Partners, as well as our ability to attract and develop relationships with new Sourcing Partners.
Substantially all of our revenue comes from the gross commissions we receive on sales of products by our Sourcing Partners through our platform. Our current arrangements with Sourcing Partners do not obligate them to sell through our platform and hence do not ensure the long-term availability of merchandise or the continuation of particular pricing or commission practices.
If our efforts to market, advertise and promote products from our existing Sourcing Partners are not successful, or if our existing Sourcing Partners do not believe that utilizing our services provides them with a long-term increase in customers, revenue or profit, we may not be able to retain or attract Sourcing Partners in sufficient numbers to grow our business, or we may be required to accept lower margins in order to attract new Sourcing Partners.
Adverse changes in our Sourcing Partner base or relationships with Sourcing Partners could adversely affect the quality, quantity, pricing and variety of the products that are offered through our digital commerce platform, which may in turn materially and adversely affect our business prospects, financial condition and results of operations.
In addition, we extend credit to certain of our Sourcing Partners and are entitled to receive reimbursements of freight and collection expenses from certain Sourcing Partners,and a bankruptcy of one or more of these Sourcing Partners may cause material losses to us as a result of write-downs of these extensions of credit or any receivables owed to us. Furthermore, we do not have formal written agreements for these extensions of credit, and there can be no assurance that our Sourcing Partners will repay us or otherwise fulfill their obligations under these arrangements. See “Management’s Discussion and Analysis of Financial Condition and Results of Operations — Exposure to Counterparty Credit Risk” for additional details on our credit exposure to Sourcing Partners.
If our Sourcing Partners are unable to maintain inventory for sale through our digital commerce platform, our business could be harmed.
We do not carry any inventory of products and are dependent on our Sourcing Partners who operate their own facilities, including inventory for sale through our platform. Therefore, there can be no assurance that products showcased on our platform will be available when they are ordered by consumers. If our Sourcing Partners do not adequately predict customer demand, suffer any loss to their inventory whether by fire, accident, rain or other such events or otherwise fail to optimize and operate their facilities successfully, their inventory and fulfillment capacity may be insufficient for our needs, limiting our ability to grow sales and materially harming our brand and reputation among consumers. Our Sourcing Partners may also suffer from excess capacity, the costs of which they may then seek to pass on to us by paying us lower commission rates. As we continue to add new products and expand consumer reach, inventory requirements will become more complex and challenging. Failure by our Sourcing Partners to procure adequate and appropriate levels of inventory for sale on our platform could result in business disruptions and additional costs, which may in turn materially and adversely affect our business, financial condition and results of operations.
20
Table of Contents
The unanticipated loss of certain larger Sourcing Partners could negatively impact our sales and profitability.
We source products showcased on our platform from over 450 Sourcing Partners across India. For fiscal years 2010, 2011 and 2012, our top 10 Sourcing Partners accounted for approximately 59.1%, 65.8% and 77.4%, respectively, of our gross transaction value. For those years, the number of Sourcing Partners that each accounted for over 5% of our gross transaction value was three, five and two, respectively. For fiscal years, 2010, 2011 and 2012, North India Top Company Private Limited, or North India Top, accounted for 1.0%, 23.4% and 47.6% of our gross transaction value, respectively. It is possible that one or more of our larger Sourcing Partners could experience financial difficulties, including bankruptcy, or otherwise could elect to cease doing business with us. If a number of our larger Sourcing Partners ceased doing business with us, this could materially and adversely impact our revenue and profitability.
Returns of products may reduce our liquidity and profitability.
A substantial majority of the orders made through our platform are on a COD basis, wherein the consumer can make a return simply by refusing to accept delivery of the product. We are liable to pay courier charges for the return of these rejected products. For fiscal year 2012, the return rate for transactions shipped for orders placed through our platform was approximately 20.0%. The return rates for such COD and non-COD transactions was approximately 23.0% and 2.4%, respectively. Our Sourcing Partners are only contractually bound to accept returns of products that are in their original packaging. We are liable for the full price of the products if our Sourcing Partners refuse to accept returned merchandise that they are not contractually bound to take back. In addition, under our courier agreements, courier liability for en route damage per shipment is typically capped at 5,000 to 10,000 ($100 to $200) per shipment, and we are obligated to pay all shipping costs related to damage-related returns. An increase in the number of returns for which we are liable would adversely affect our liquidity and profitability.
Our existing principal shareholders will continue to have significant control over us after this offering and may have interests that are different from those of our other shareholders.
After the completion of this offering, Network18 Holdings Limited, a subsidiary of Network18, which in turn is controlled by Mr. Raghav Bahl, will own % of our outstanding ordinary shares, and our other two principal shareholders, SAIF II Mauritius Company Limited, an affiliate of SAIF Partners II L.P., or SAIF, and GS Home Shopping Inc., are expected to own an aggregate of % of our outstanding ordinary shares. In addition, these three shareholders have agreed to the nomination and election of seven of the 10 directors that we expect to have within one year from the completion of this offering, with Network18 initially determining four nominees, SAIF determining two nominees and GS Home Shopping determining one nominee.
By virtue of their share ownership and their agreement on nomination and election of our directors, our principal shareholders and their controlling persons, including Network18 and Mr. Bahl, will be able to exercise dominant control over our company and its affairs and business. They will have the ability to determine the outcome of elections of directors, the timing and payment of dividends and other actions requiring majority approval of our shareholders, as well as matters requiring supermajority approval, including amendments to our Articles of Association, approval of a merger or a significant disposition of assets. The interests of Network18, Mr. Bahl and our other current beneficial owners may be different from or conflict with your interests as a shareholder in our company, and their control may result in the delay or prevention of a change of management or control of our company, even if such a transaction may be beneficial to our other shareholders.
21
Table of Contents
We depend on our relationship with Network18 and its affiliates for financial support and in certain commercial arrangements, and any potential conflicts of interest could have a material adverse effect on our financial condition and results of operations.
We depend on our relationship with Network18 and its affiliates for financial support and in certain commercial arrangements.
Network18, through certain subsidiaries, has been our largest single investor, having made investments totaling $33.4 million in us to date. In addition, Network18 has issued a letter to our Indian subsidiary assuring continued financial support as necessary for our Indian subsidiary to fulfill its business obligations in all material respects for the 12-month period beginning August 16, 2012, and our consolidated financial statements have been prepared on a going concern basis on the basis of this support. Network18 and Mr. Bahl have also provided us with guarantees in respect of certain credit facilities under which we had outstanding borrowings of 346.9 million ($6.8 million) as of July 31, 2012.
We license certain intellectual property, in particular the use and appearance of “18” in our trade names and logos, from Network18. See “— We do not own parts of our trade name and logo and are subject to related risks” for more details.
We have various agreements with other Network18 affiliates, some of which are related to important aspects of our business, such as the uplinking of our television channel and the negotiation of carriage fees with local cable operators. We also share the costs of various administrative and back-office services, such as legal and finance, with other Network18 affiliates. If these agreements were to be terminated or associated costs were to rise, we may not be able to replace them on comparable terms. Please see “Related Party Transactions” for more information on our agreements with Network18 and its affiliates.
After the completion of this offering, Network18 will continue to be able to exercise dominant control over our company and its affairs and business. Network18’s control of us means it can determine the allocation of business opportunities among us, itself and its other subsidiaries.Network18 may determine to have other affiliates, instead of us, pursue business opportunities or cause such companies or us to undertake corporate strategies, the effect of which would be to benefit such companies instead of us and which could be detrimental to our interests.
Some of our directors and executive officers own Network18 shares and options to purchase Network18 shares, including through their participation in the employee share option plan set up by Network18. In addition, some of our directors and executive officers are directors or executive officers of Network18. Ownership of Network18 shares and options to purchase Network18 shares and the presence of an executive officer of Network18 on our board of directors could create, or appear to create, potential conflicts of interest and other issues with respect to their fiduciary duties to us when our directors and officers are faced with decisions that could have different implications for Network18 than for us.
It is possible that disputes may arise between Network18 or its affiliates and us in a number of areas, including sales or distributions by Network18 of all or any portion of its ownership interest in us; or business opportunities that may be attractive to us and Network18, or its other affiliates. We may not be able to resolve any potential conflicts, and even if we do, the resolution may be less favorable than if we were dealing with an unaffiliated party. Our agreements with Network18 and its affiliates may be amended upon agreement between the parties. As we are controlled by Network18, Network18 may require us to agree to amendments to these agreements that may be less favorable to us than the original terms of the agreements. Any such event could materially and adversely affect our business, financial condition and results of operations.
Although following the completion of this offering, our directors, officers and other employees will be subject to our Code of Business Conduct and Ethics governing conflicts of interest, and all related party transactions will be subject to our audit committee’s review and approval, we have historically not had a policy governing conflicts of interest.
22
Table of Contents
The prospects of our business may be adversely impacted by certain restrictions on foreign investment under Indian laws that could prevent us from making beneficial future acquisitions or investments.
India regulates ownership of Indian companies by foreigners, although some restrictions on foreign investment have been relaxed in recent years. These regulations and restrictions may apply to acquisitions of shares in Indian companies by us or our affiliates or the provision of funding by us. For example, under its consolidated foreign direct investment policy, the Government of India has specific requirements with respect to downstream investments by Indian companies, owned or controlled by foreign entities, and the transfer of ownership or control of Indian companies in sectors with caps on foreign investment from resident Indian persons or entities to foreigners in India. Foreign direct investment is restricted in “retail trading” business, with 51% foreign direct investment permitted in multi-brand retail trading and 100% foreign direct investment permitted in single brand retail trading, subject to, in each case, prior approval from the Government of India and certain other conditions specified in the consolidated foreign direct investment policy. While the term “retail trading” has not been defined under the FDI policy, based on judicial guidance from the Indian courts, “retail trade” has generally been interpreted to mean “direct sales to the ultimate consumer.”
These and other requirements, which currently include restrictions on valuations and sources of funding for such investments and may include prior approval from the Foreign Investment Promotion Board, may adversely affect our ability to make investments in India. As we do not and will not engage in “retail trading” so long as these restrictions remain in place, we may be unable to develop our business or take advantage of acquisition or other growth opportunities in ways that would be well suited to our existing business platform, which would adversely affect our business prospects. For further discussion on “retail trading” and restrictions applicable to “retail trading” in India, see “Regulation — Foreign Investment Regulations.”
We may not be able to reduce or control keywords search advertisement and other costs associated with new consumer acquisition.
A portion of consumers are currently directed to our website through keywords search advertisement and banner advertisement. We purchase banner advertisements, keyword search advertisements and other forms of advertisements on various portals and other websites we believe are visited by Internet users who may be potential consumers. The pricing and operating dynamics of these campaigns can change rapidly, and we cannot assure you that our arrangements with such Internet search engines will not change adversely, or, in the event that such changes occur, that it will be on commercially acceptable terms. Continued or escalating costs associated with acquisition of new consumers could have a material adverse effect on our business, financial condition and results of operations.
If we are unable to continue to drive and increase visitors to our website and convert these visitors into repeat consumers cost-effectively, our business, revenue, financial condition and results of operations could be adversely affected.
The primary method that we use to attract traffic to our website and convert these visitors into repeat consumers is the content created by our in-house team. We may not be able to create pertinent content in a cost-effective manner or content that meets rapidly changing consumer demand in a timely manner, if at all. Another method we employ to attract and acquire new, and retain existing, consumers is commonly referred to as search engine optimization, or SEO. SEO involves developing websites to rank well in search engine results. Our ability to successfully manage SEO efforts across our website is dependent on the timely modification of SEO efforts in response to periodic changes in search engine algorithms, search query trends and related efforts by providers of search services designed to ensure the display of unique offerings in search results. Our failure to successfully manage our SEO strategy could result in a substantial decrease in traffic to our website which would result in substantial decreases in conversion rates and repeat business, as well as increased costs if we were to replace free traffic with more paid traffic. Even if we succeed in driving traffic to our website, we may not be able to monetize this traffic or otherwise retain consumers. Any or all of these results would adversely affect our business, revenue, financial condition and results of operations.
23
Table of Contents
Our results of operations are subject to fluctuations in currency exchange rates.
Our presentation currency is the U.S. dollar. However, the functional currency of our operating subsidiary is the Indian rupee. As our business is situated in India, we receive our revenue in Indian rupees and most of our costs are borne in Indian rupees. Any fluctuation in the value of the Indian rupee against the U.S. dollar, such as the approximately 5.3% drop in the average value of the Indian rupee as compared to the U.S. dollar in fiscal year 2012 vis-a-vis the average value of the Indian rupee in fiscal year 2011, will affect the value of our results of operations. For example, our revenue from operations declined by 4.9% from $6.3 million in the second quarter of fiscal year 2012 to $6.0 million in the third quarter of fiscal year 2012, even though in terms of the underlying rupee results, our revenue from operations increased by 5.5% over that same period. Fluctuation in the rupee-dollar exchange rate could have a material adverse effect on our business and our financial condition and results of operations as reported in U.S. dollars and the market price of our ordinary shares, which will be quoted in U.S. dollars on . See “Management’s Discussion and Analysis of Financial Condition and Results of Operation — General Factors Affecting Our Results of Operations — U.S. Dollar-Indian Rupee Exchange Rate.”
We outsource a significant portion of our call center and delivery services and if third party service providers fail to meet our requirements or face operational or system disruptions, our business may be adversely affected.
We outsource the staffing of our call center, which handles sales as well as consumer support for our platform. Magus Customer Dialog Private Limited, or Magus, provides call center staffing for our television platform while iEnergizer Limited, or iEnergizer, provides our web call center staffing and hosts these operators at their Noida facilities. We have issued a termination notice to iEnergizer and are in the process of shifting all of our call center staffing to Magus. In addition, we use courier companies such as Aramex India Private Limited, Blue Dart Express Limited and First Flight Couriers Limited to handle most of our product delivery, as well as payment collection for COD sales.
If our third party service providers experience difficulty meeting our requirements for quality and customer service standards, our reputation could suffer and our business and prospects could be adversely affected. Our operations and business could also be materially and adversely affected if our service providers face operational or system interruptions.
If our third party service providers fail to comply with applicable laws, rules and regulations in India, our business may be adversely affected, and we may be exposed to liability for their failures. Although these service providers are generally required to have insurance cover or provide security deposits or guarantees, such security may not be sufficient to cover the risks to which we are exposed. If we are unable to find alternative service providers in a timely and reliable manner, our business operations will be adversely affected.
If our courier companies fail to provide reliable delivery services, our business and reputation may be materially and adversely affected.
Our delivery services may be subject to interruptions due to events that are beyond our control or the control of courier companies, such as inclement weather, natural disasters, transportation interruptions or labor unrest or shortage. If products are not delivered on time or are delivered in a damaged state, consumers may refuse to accept products. If, as a result, consumer confidence in the reliability of our services is damaged we may lose consumers, and our financial condition and market reputation could suffer. Delivery of products could also be affected or interrupted by the merger, acquisition, insolvency or government shut-down of the couriers we engage to make deliveries, especially those couriers with relatively small business scales. If products are not delivered in proper condition or on a timely basis, our business and reputation could suffer.
As competition intensifies in the future, we expect that we will be required to ensure faster delivery times, which could place increasing pressure on our delivery network. In addition, to ensure growth, we may be required to expand our delivery to newer towns across India which could place additional pressure on our delivery network.
24
Table of Contents
Increased delivery costs will adversely affect our margins.
We generally bear the costs of shipping products to consumers, including the costs of return shipping for undeliverable or rejected products, tax deducted at source, sales taxes, state entry charges and service charges. Shipping rates have been increasing, due in part to the rise in global fuel prices. For fiscal years 2010, 2011 and 2012, these costs, indicated as freight and collection expenses on our consolidated financial statements, were $4.6 million, $6.6 million and $11.8 million, respectively.
As we are building the consumer base in part through favorable pricing, we have not been able to pass these increased costs on to consumers by levying shipping charges on consumers. As a result, we expect that increases in shipping costs will continue to directly and adversely impact our margins.
We may not be able to respond in a timely and cost effective manner to changes in consumer preferences.
Our future growth depends on our ability to continue to attract new consumers to our platform as well as to increase the spending and repeat purchase rate of existing consumers. Constantly changing consumer preferences have historically affected, and will continue to affect the digital commerce industry. It is difficult to predict consistently and successfully the products consumers will demand. A shift in consumer preferences away from the products showcased on our platform could have a material adverse effect on our financial condition and results of our operations. Our future success depends in part on our ability to anticipate and respond to changes in consumer preferences and there can be no assurance that we will respond in a timely or effective manner. Failure to anticipate and respond to changing consumer preferences and evolving trends in demographics could lead to lower gross transaction value and lower margins, which would have a material adverse effect on our financial condition and results of operations.
The success of our mobile device applications strategy depends on the growth of mobile devices and other supporting infrastructure in India, as well as other risks.
In August 2012, we launched our first mobile site, m.HomeShop18.com. We are currently working on developing this further. The growth and success of mobile applications we may develop in the future will depend in part on the expansion of 3G networks and broadband wireless access on mass-market smartphones and other mobile devices. In addition, Indian consumers have not used mobile applications to make purchases in substantial amounts yet, so the growth potential of this market is difficult to forecast. As with our other channels, we expect to incur significant costs in introducing and supporting digital commerce through mobile device applications. We may lose a substantial portion of our investment in this platform, which may have material adverse effect on our business, financial condition and results of operations.
Our wide variety of accepted non-cash payment methods subjects us to related risks.
We accept payments using a variety of non-cash methods, including bank transfers and online payments with credit cards and debit cards issued by major banks in India. For certain payment methods, including credit and debit cards, we pay interchange and other fees, which may increase over time and raise our operating costs and lower our profit margins. We are also subject to various rules, regulations and requirements, regulatory or otherwise, governing electronic funds transfers, which could change or be reinterpreted to make it difficult or impossible for us to comply. If we fail to comply with these rules or requirements, we may be subject to fines and higher transaction fees and lose our ability to accept credit and debit card payments from consumers, process electronic funds transfers or facilitate other types of online payments, and our business, financial condition and results of operations could be materially and adversely affected.
Our heavy reliance on COD transactions subjects us to a number of risks.
Most of the transactions executed through our platform are made on a COD basis, and we expect that we will continue to rely on COD transactions to drive order growth in the near future. In fiscal year 2012, 83.3% of
25
Table of Contents
our gross transaction value was from COD transactions. COD exposes us to several risks, including exposure to the credit risk of the courier companies that collect these cash payments and are obligated to periodically remit net amounts back to us, typically every 10 days. In addition, because of the lag between ordering a product on our platform and paying for it, COD transactions entail higher working capital costs for us and our Sourcing Partners. Our Sourcing Partners may seek to recover these higher working capital costs from us by paying us lower commissions. Furthermore, COD orders generally bear a significantly higher risk of return, as consumers can reject delivery without having to recover payment from us. We are also responsible for the freight and collection expenses associated with such returns. To limit our exposure to consumers, we generally limit COD sales to orders of 10,000 ($200) or less. COD payments are also vulnerable to theft and fraud, including by the courier’s collection agents. Any such events that affect the number of our COD transactions could lead to fewer sales through our platform generally and could have a material adverse effect on our financial condition and results of operations.
We are exposed to risks associated with online security and credit card fraud.
The secure transmission of confidential information over the Internet and telephone is essential in maintaining consumer confidence in us. Security breaches, whether instigated internally or externally on our system or other Internet-based systems, could significantly harm our business. In fiscal year 2012, 9.9% of our gross transaction value were made by credit card, debit card or other methods requiring sensitive account information from the consumer. We rely on licensed encryption and authentication technology to effect secure transmission of confidential consumer information, including credit card numbers, over the Internet.We also rely on interactive voice response, or IVR, solutions which provide fast authorization for major credit and debit cards over telephone lines.However, advances in technology or other developments could result in a compromise or breach of the technology that we use to protect consumer and transaction data. We incur substantial expense to protect against and remedy security breaches and their consequences. However, our security measures may not prevent security breaches and we may be unsuccessful in or incur additional costs by implementing a remediation plan to address these potential exposures.
We also have agreements with banks and certain companies that process credit card transactions for consumers. In addition, the online payment gateway for certain of our sales made through international credit cards is secured by “Verified by VISA” or “MasterSecure.” However, under certain circumstances we may be liable for accepting fraudulent credit cards. We may also be subject to other payment disputes with consumers for such sales. If we are unable to combat the use of fraudulent credit cards, our revenue from such sales would be susceptible to demands from the relevant banks and credit card processing companies, and our financial condition and results of operations could be adversely affected.
Apart from our own activities, general concerns over the security of transactions conducted on the Internet and commercial online services, the increase in identity theft and the privacy of users may limit or inhibit the growth of the Internet and commercial online services, particularly as a means of conducting commercial transactions.
We may not be successful in pursuing strategic partnerships and acquisitions, and future partnerships and acquisitions may not bring us anticipated benefits.
Part of our growth strategy is the pursuit of strategic partnerships. We cannot assure you that we will succeed in implementing this strategy as it is subject to many factors which are beyond our control, including our ability to identify, attract and successfully execute suitable acquisition opportunities and partnerships.
This strategy may also subject us to other risks, costs and uncertainties including acquisition and financing costs, potential ongoing and unforeseen or hidden liabilities, diversion of management resources and the cost of integrating acquired businesses. We could face difficulties integrating the technology of acquired businesses with our existing technology, and employees of the acquired business into various departments and ranks in our
26
Table of Contents
company, and it could take substantial time and effort to integrate the business processes being used in the acquired businesses with our existing business processes. Moreover, there can be no assurance that any partnerships or acquisitions will achieve their intended business objectives or enhance our revenue.
In 2011 we acquired the book selling website coinjoos.com from On Graph Technologies Private Limited. We are in the process of integrating the operations of coinjoos.com with our business operations. We cannot assure you that we will succeed in fully integrating the coinjoos.com business.
Our success depends substantially on our senior management and other skilled personnel, and we may be adversely affected if we lose their services and fail to find equally skilled replacements.
Our success depends largely on the efforts, expertise and abilities of our senior management, as well as other skilled personnel, including operations and programming personnel. Our senior management, some of whom have been with us since our inception, are important to our business because of their experience and knowledge of the industry. In particular, our success depends upon the continued efforts of Mr. Sundeep Malhotra, our founder and chief executive officer, who has been instrumental in our growth and development. Further, our employment agreements with these key personnel do not obligate them to work for us for any specified period, and generally do not contain non-solicitation clauses in the event of termination of employment. In addition, our employment agreements with Mr. Malhotra and Mr. Raman Kumar Gulati do not contain non-compete clauses in the event of termination of employment. If one or more of our key personnel are unwilling or unable to continue in their present positions, we may not be able to replace them with persons of comparable skill and expertise promptly or at all, which could have a material adverse effect on our business, operations and financial results. We do not maintain key-man insurance for any of our key personnel.
The labor market for skilled employees is extremely competitive, and the process of hiring employees with the necessary skills is time-consuming and requires the diversion of significant resources. We may not be able to retain existing personnel or identify, hire and successfully integrate additional qualified personnel in the future. The loss of the services of key personnel or the inability to attract additional or replacement qualified personnel, could impair the growth of our business.
Our business experiences seasonal fluctuations and quarter-to-quarter comparisons of our results may not be meaningful.
Our business experiences seasonal fluctuations to a certain extent due to different calendar events, national and religious holidays. We tend to experience relatively higher revenue in the third quarter of our fiscal year, which coincides with several festivals such as Dusshera, Diwali and Christmas. We believe that we will continue to be subject to the effects of seasonality. As our business matures, the impact of this seasonality in our quarterly results may become more apparent.
Seasonality may also cause working capital cash flow requirements to vary from quarter to quarter depending on the variability in the volume and timing of sales made through our platform.
Seasonality makes forecasting more difficult and may adversely affect our ability to manage working capital and to predict financial results accurately, which could adversely affect the market price of our ordinary shares. You should take into account seasonal impacts when comparing our quarterly results.
Our financial statements could be materially affected if actual results differ significantly from our management’s estimates and judgments.
The preparation of our financial statements requires us to make estimates and judgments that affect the reported amounts of our assets, liabilities, revenues and expenses, and related disclosure of our contingent assets and liabilities. We continually evaluate these estimates and judgment based on our own historical experience,
27
Table of Contents
knowledge and assessment of current business and other conditions, our expectations regarding the future based on available information, and reasonable assumptions, which together form our basis for making judgments about matters that are not readily apparent from other sources. If actual results differ significantly from our management’s estimates and judgments, there could be a material effect on our financial statements and we may be required to make adjustments in future financial statements. See “Management’s Discussion and Analysis of Financial Condition and Results of Operations — Critical Accounting Policies” for additional information regarding estimates and judgments made in the preparation of our financial statements.
Accounting treatment of our stock appreciation rights may increase the volatility of our earnings and may result in significant additional charges for grants made prior to the listing of our ordinary shares.
We intend to initially treat our stock appreciation rights as “equity-settled” instruments under applicable accounting standards, which would result in our stock appreciation rights receiving the same accounting treatment as our employee share options. However, if we determine at any stage after initial recognition that we are more likely than not to settle these rights in cash, we may be required to reclassify these instruments as “cash-settled” awards. Such reclassification would require the liability to be revalued at each reporting period after reclassification, with a corresponding increase in value reported as a loss in our profit and loss account and a corresponding decrease in value reported as a gain therein. A requirement to treat our stock appreciation rights as cash-settled and hence subject to ongoing profit and loss accounting will have the effect of increasing the volatility of our earnings and may result in significant additional charges for grants made prior to the listing of our ordinary shares.
Certain market and our company information used in this prospectus is based on estimates, and real or perceived inaccuracies in such information may make it more difficult for us or our investors to evaluate our business.
Certain market and our company information used in this prospectus, such as the number of consumers we are able to reach through the Internet, television and mobile devices and the number of households we are able to reach through our television channel, is based on estimates, such as those contained in industry publications and reports, data provided by third parties and our management’s estimates, judgments and assumptions. We are not able to independently verify the accuracy and completeness of this information. Accordingly, there can be no assurance that this information is reliable, and real or perceived inaccuracies in such information may make it more difficult for us or our investors to evaluate our business.
We have entered into, and expect to continue to enter into, related party transactions.
We have entered into transactions with related parties that include our principal shareholders and entities affiliated with our principal shareholders. For example, we have entered into various transactions with the Network18 and its affiliates. While we believe that all such transactions have been conducted on an arm’s length basis, there can be no assurance that we could not have achieved more favorable terms had such transactions been entered into with un-related parties. Furthermore, it is likely that we may enter into related party transactions in the future. There can be no assurance that such transactions, individually or in the aggregate, will not have an adverse effect on our financial condition and results of operations. See “Related Party Transactions” for additional information on our related party transactions.
We could be held liable to third parties for the products purchased through our digital commerce platform and this may also impact our reputation among consumers.
We could be subject to product liability claims if any of the products sold or offered through our platform are defective, fail to perform as expected or injure a consumer. Although our agreements with Sourcing Partners whose products are displayed on our platform typically contain provisions stating that any liability for such claims lies solely with manufacturers and distributors, those provisions may not be sufficient to limit all of our potential liability. Product warranties are the responsibility of those who sell products through our platform, but
28
Table of Contents
our reputation could be adversely affected if a user is not satisfied with a purchase. Liability claims could require us to spend a considerable amount of time and money and other resources in litigation and to pay significant damages. Poor service and defective products provided by manufacturers and distributors could damage our reputation and brand name, disrupt our ongoing business, distract our management and employees, reduce our revenues and increase our expenses, any of which could materially and adversely impact us.
We are occasionally subject to consumer complaints in various forums in India for similar reasons. See “Business — Legal Proceedings” for more details.
There have been recent news reports regarding sales of products on Indian online commerce websites, including our website, that have not been authorized by the brand owner or manufacturer. Unauthorized sales of merchandise by our Sourcing Partners on our platform may cause us to incur liability, damage our reputation and limit future marketing opportunities with brand owners, manufacturers and Sourcing Partners.
Further, we are required to comply with the program and advertising codes under the Cable Television Network Rules, 1994 and other legislations in India which regulate the broadcast and publication of programs and advertisements which are offensive, indecent or promote sale or consumption of certain restricted products. Any failure to comply with such laws may result in imposition of penalties which may include fines, imprisonment of officials or cancellation of our license to broadcast our television channel.
Substantially all of our business and operations are located in India, and we are subject to regulatory, economic, social and political uncertainties in India.
Substantially all of our business and employees are located in India, and we intend to continue to develop and expand our business in India. Our financial performance and the market price of our ordinary shares will be affected by changes in exchange rates and controls, interest rates, changes in government policies, including taxation policies, social and civil unrest and other political, social and economic developments in or affecting India.
The Government of India has exercised and continues to exercise significant influence over many aspects of the Indian economy. Since 1991, successive Indian governments have sought to pursue policies of economic liberalization and financial sector reforms, including by relaxing restrictions on the private sector. Nevertheless, the role of the Indian central and state governments in the Indian economy as producers, consumers and regulators has remained significant, and we cannot assure you that liberalization policies will continue. Recent governments have been multiparty coalitions and have often faced difficulty in generating sufficient cross-party support to implement reform-oriented policies or initiatives. The rate of economic liberalization could change, and specific laws and policies affecting digital commerce companies, foreign investments, currency exchange rates and other matters affecting investments in India could change as well. A significant change in India’s policy of economic liberalization and deregulation or any social or political uncertainties could adversely affect business and economic conditions in India generally and our business and prospects.
Our business and results of operations could be adversely affected by the impact of economic conditions in India.
Consumer purchases of discretionary items generally decline during recessionary periods and other periods in which disposable income is adversely affected. As a substantial portion of retail expenditure, especially for items of leisure, is discretionary, the retail industry tends to experience weak or reduced demand during economic downturns. While adverse economic and business conditions are harmful to all companies, companies such as ours are particularly sensitive to such conditions, particularly rising unemployment and declining consumer confidence, because of their direct impact on discretionary consumer spending. Consumers anticipate and respond to adverse changes in economic conditions and adjust their consumption patterns accordingly, which has a direct impact on sales made through our platform and our revenues.
29
Table of Contents
Economic growth in India has slowed considerably in the past year. At the same time, global economic growth has also slowed, which has adversely impacted the Indian economy and may delay and dampen recovery in India. Unfavorable changes in business and economic conditions affecting consumers in India could result in fewer transactions made through our platform or lower our profit margins, and have a material adverse effect on our financial condition and results of operations.
Indian economic conditions may be materially and adversely affected by political instability or regional conflicts, economic slowdown elsewhere in the world or otherwise. The Indian economy also remains largely driven by the performance of the agriculture sector, which is subject to the annual uncertainty over the quality of the monsoon. Trade deficits could also adversely affect our business and the price of our ordinary shares. India’s trade relationships with other countries and its trade deficit, driven to a major extent by global crude oil prices, may adversely affect Indian economic conditions. India faces major challenges in sustaining its growth, which include the need for substantial infrastructure development and improving access to healthcare and education.
Higher and fluctuating inflation in India can adversely affect our costs.
India has recently experienced fluctuating wholesale price inflation. The CIA World Factbook estimates that consumer inflation in India was 6.4% in 2007, 8.3% in 2008, 10.9% in 2009, 12.0% in 2010 and 8.9% in 2011. Continued fluctuation in inflation rates may make it more difficult for us to accurately estimate or control our costs, which may adversely impact our business prospects. An increase in inflation in India would be expected to increase the rupee value of certain of our expenses. An inability to pass increased costs on to consumers or Sourcing Partners could have a material adverse effect on our financial condition and results of operations.
We may fail to protect our intellectual property rights within the full scope and manner available to us under applicable law or statute or may be accused of infringing upon the intellectual property rights of third parties.
We regard our intellectual property rights such as trademarks and domain names as important to our success. We rely heavily upon software codes, information databases and other systemic components that are necessary to manage and support our business operations. We use a proprietary order management system which was developed by us in-house.
We may be subject to legal proceedings and claims in the ordinary course of business, including claims of alleged infringement of the trademarks, copyrights, patents and other intellectual property rights of third parties. In addition, litigation may be necessary in the future to enforce our intellectual property rights, protect trade secrets or to determine the validity and scope of proprietary rights claimed by others. Any litigation of this nature, regardless of outcome or merit, could result in substantial costs and diversion of management and technical resources, any of which could adversely affect our business, financial condition and results of operations. Patent litigation tends to be particularly protracted and expensive. In addition, intellectual property may not receive the same level of protection in India as it does in the United States and certain other countries. Our failure to protect our intellectual property rights in a meaningful manner or challenges to related contractual rights could result in erosion of brand value and limit our ability to control marketing on or through the Internet using our various domain names or otherwise, which could adversely affect our business, financial condition and results of operations.
Any disruptions in our television channel operations due to technological failure could adversely affect our business.
We rely on sophisticated production and broadcast equipment, communications equipment and other information technology to operate our television channel. We also use online and automatic backup equipment to ensure continuous broadcasting of our television channel. Although we have backup equipment to protect us in case our primary broadcasting systems fail, if we were to experience significant damage to our primary and
30
Table of Contents
backup equipment or other technological breakdowns to equipment or systems, it could disrupt our ability to produce or broadcast our programming. We uplink our broadcasting to a single satellite. If this satellite ceases to be available to us for any reason (including signal blockage by any third party), we would have to secure access to an alternative satellite, and we cannot assure you that such access would be available on equally favorable terms or at all or the time frame within which such access would be available. Further, if we move to an alternative satellite, each cable or DTH operator that receives our signal for distribution will need to make arrangements for downlinking from this alternative satellite. Though we do maintain insurance, inadequacy of such insurance for our assets or any equipment or technological failure or damage that results in a disruption of our programs could have a material adverse effect on our business, financial condition and results of operations.
Our Internet operations depend on the performance and reliability of the telecommunications networks and Internet infrastructure and a technological failure could adversely affect our business.
Our ability to collect, process and disseminate data using the Internet in a secure and efficient manner is dependent on our information technology systems. Technical failure of our hardware or software, breakdowns in the services on which our website is hosted, changes in our technical systems, difficulties in linkages with third party systems, any corruption or loss of our electronically stored data, presence of computer viruses or disruption in Internet infrastructure or Internet access or in the Internet generally could lead to interruptions in the functioning of our website and could result in corruption of our data or security breaches. Disruptions in telecommunications and in the functioning of such network service providers for this aspect of our business could lead to client dissatisfaction. We are not insured against such losses. Also, our website is hosted with a service provider with provisions for electronic back-ups and any breakdown at the service provider’s level would interrupt our website-based services for indeterminate periods of time, which could create consumer dissatisfaction and damage our reputation.
Failure to successfully adopt new technologies or adapt our website and systems to consumer requirements or emerging industry standards could adversely affect our business.
To remain competitive, we must continue to enhance and improve the responsiveness, functionality and features of our website. The Internet and the digital commerce industry are characterized by rapid technological evolution, changes in user requirements and preferences, frequent introductions of new products and services embodying new technologies and the emergence of new industry standards and practices that could render our existing technologies and systems obsolete. Our success will depend, in part, on our ability to identify, develop, acquire or license leading technologies useful in our business, enhance our existing services, develop new services and technologies that address the increasingly sophisticated and varied needs of our existing and prospective consumers, and respond to technological advances and emerging industry standards and practices on a cost-effective and timely basis. We cannot assure that we will be able to use new technologies effectively or adapt our website, technologies and transaction-processing systems to consumer requirements or emerging industry standards. If we are unable to adapt in a cost-effective and timely manner in response to changing market conditions or consumer requirements, whether for technical, legal, financial or other reasons, our business, prospects, financial condition and results of operations would be materially and adversely affected.
Our processing, storage, use and disclosure of consumer data or data of visitors to our website could give rise to liabilities as a result of governmental regulation, conflicting legal requirements, differing views of personal privacy rights or data security breaches.
In the processing of consumer transactions, we receive and store a large volume of consumer information. Such information is increasingly subject to legislation and regulations in various jurisdictions and governments are increasingly acting to protect the privacy and security of personal information that is collected, processed and transmitted in or from the governing jurisdiction. We could be adversely affected if legislation or regulations are expanded or amended to require changes in our business practices or if governing jurisdictions interpret or implement their legislation or regulations in ways that negatively affect our business, financial condition and
31
Table of Contents
results of operations. As privacy and data protection become more sensitive issues in India, we may also become exposed to potential liabilities. For example, under the Information Technology Act, 2000, as amended, we are subject to civil liability for wrongful loss or gain arising from any negligence by us in implementing and maintaining reasonable security practices and procedures with respect to sensitive personal data or information on our computer systems, networks, databases and software.
We cannot assure you that our security measures will prevent data breaches. Companies that handle such information have also been subject to investigations, lawsuits and adverse publicity due to allegedly improper disclosure of personally identifiable information. Security breaches could damage our reputation, cause interruptions in our operations, expose us to a risk of loss or litigation and possible liability, and could also cause consumers and potential consumers to lose confidence in the security of our transactions, which would have a negative effect on the demand for products sold through our platform. Moreover, public perception concerning security and privacy on the Internet could adversely affect consumers’ willingness to use our website. A publicized breach of security in India, even if it only affects other companies conducting business over the Internet, could inhibit the growth of the Internet as a means of conducting commercial transactions, and, therefore, the prospects of our business.
In May 2012, our website was subject to cyber attacks that resulted in consumers being unable to place online orders for several hours until we were able to restore service. Any such attacks in the future as well as the unavailability of our website to consumers for any other reasons could significantly impact consumer confidence in our platform.
We allow users to post reviews and ratings of products on our website. The Indian government has notified the Information Technology (Intermediaries Guidelines) Rules, 2011, or the Intermediaries Rules, requiring persons receiving, storing, transmitting or providing any service with respect to electronic messages to, among other things, not host, publish, transmit or share any information prohibited under the Intermediaries Rules and to disable such information after obtaining knowledge of it.
You may be subject to Indian taxes on income arising through the sale of our ordinary shares.
Pursuant to recent amendments to the Indian Income Tax Act, 1961, as amended, income arising directly or indirectly through the sale of a capital asset, including any share or interest in a company or entity registered or incorporated outside India, will be liable to tax in India, if such share or interest derives, directly or indirectly, its value substantially from assets located in India and whether or not the seller of such share or interest has a residence, place of business, business connection, or any other presence in India. All of our assets are located in India. The amendments do not deal with the interplay between the Indian Income Tax Act, 1961, as amended, and the double taxation avoidance agreements that India has entered into with countries such as the United States, in case of an indirect transfer. Accordingly, the implications of the recent amendments are presently unclear.
We may be deemed to be tax resident outside of Cyprus.
According to the provisions of the Cyprus Income Tax Law, a company is considered to be a resident of Cyprus for tax purposes if its management and control is exercised in Cyprus. Although the concept of “management and control” is not defined in the Cypriot tax legislation, it is considered that a company is managed and controlled in Cyprus through the decision-making power of its board of directors being exercised in Cyprus. Where the majority of our board of directors comprises tax residents or citizens of a country other than Cyprus, this may increase the risk that we are not considered to be managed and controlled in Cyprus and so not tax resident in Cyprus. This may result in our holding company not being subject to the Cypriot tax regime other than in respect of Cyprus sourced income and being subject to the tax regime of the country in which it is tax resident. Further, our holding company would not be eligible for benefits under the tax treaties entered into between Cyprus and other countries.
32
Table of Contents
Where the majority of our board of directors comprises tax residents or citizens of a country other than Cyprus, our holding company, even if managed and controlled in Cyprus and so tax resident in Cyprus, may be considered to have a permanent establishment in that country or elsewhere. Such a permanent establishment could be subject to taxation of the jurisdiction of the permanent establishment on the profits allocable to the permanent establishment. If our holding company becomes tax resident or has a permanent establishment in any jurisdiction other than Cyprus, this could have a material adverse effect on our business, results of operations, financial condition and prospects.
As we conduct all of our operations in India and all of our executive officers and most of our directors will be located in India, the most likely alternate tax residence for our holding company would be India. In that circumstance, our holding company would be liable to pay taxes on its income in India.
Changing laws, rules and regulations and legal uncertainties, including adverse application of tax laws and regulations, may adversely affect our business and financial performance.
Our business and financial performance could be adversely affected by unfavorable changes in or interpretations of existing, or the promulgation of new, laws, rules and regulations applicable to us and our business, including those relating to broadcasting, the Internet and online commerce, consumer protection and privacy. Such unfavorable changes could decrease demand for our services, increase costs and/or subject us to additional liabilities. For example, there may continue to be an increasing number of laws and regulations pertaining to the Internet and digital commerce, which may relate to liability for information retrieved from or transmitted over the Internet or mobile networks, user privacy, taxation and the quality of services and products sold or provided through the Internet. Furthermore, the growth and development of online commerce may result in more stringent consumer protection laws that may impose additional burdens on Internet businesses generally.
The application of various Indian sales, value-added and other tax laws, rules and regulations to products sold through our platform is subject to interpretation by the applicable taxing authorities. Many of the statutes and regulations that impose these taxes were established before the growth of the Internet, mobile networks and digital commerce. If such tax laws, rules and regulations are amended, new adverse laws, rules or regulations are adopted or current laws are interpreted adversely to our interests, particularly with respect to occupancy or value-added or other taxes, the results could increase our tax payments (prospectively or retrospectively) and/or subject us to penalties and, if we pass on such costs to consumers, decrease the demand for our services. As a result, any such changes or interpretations could have an adverse effect on our business and financial performance.
Natural disasters, epidemics, terrorist attacks and other acts of violence or war could adversely affect the financial markets, result in a loss of business confidence and adversely affect our business, prospects, financial condition and results of operations.
Numerous countries, including India, have recently experienced community disturbances, strikes, terrorist attacks, riots, epidemics and natural disasters. These acts and occurrences may result in a loss of business confidence and could cause a temporary suspension of our operations and could have an adverse effect on the financial markets and economies of India and other countries. Such closures have previously and could in the future have a material adverse effect on our business, prospects, financial condition and results of operations.
Risks Related to Investments in Cypriot Companies
As our shareholder, you may have greater difficulties in protecting your interests than as a shareholder of a United States corporation.
We are incorporated under the laws of Cyprus. The laws generally applicable to United States corporations and their shareholders may provide shareholders of United States corporations with rights and protection for which there may be no corresponding or similar provisions under the Cyprus Companies Law. As such, if you
33
Table of Contents
invest in our ordinary shares, you may or may not be accorded the same level of shareholder rights and protection that a shareholder of a United States corporation may be accorded under the laws generally applicable to United States corporations and their shareholders. Taken together with the provisions of our Articles of Association, some of these differences may result in your having greater difficulties in protecting your interests as our shareholder than you would have as a shareholder of a United States corporation. This affects, among other things, the circumstances under which transactions involving an interested director are voidable, whether an interested director can be held accountable for any benefit realized in a transaction with us, what rights you may have as a shareholder to enforce specified provisions of the companies law in Cyprus or our Articles of Association, and the circumstances under which we may indemnify our directors and officers.
We may be subject to defense tax in Cyprus.
A special contribution for the defense of the Republic of Cyprus, or defense tax, at a rate of 20% is payable by a Cypriot company on deemed dividend distributions to the extent that its shareholders are Cypriot tax residents. A Cypriot company which does not distribute at least 70% of its after tax profits within two years of the end of the year in which the profits arose, is deemed to have distributed this amount as a dividend two years after that year end. The amount of this deemed dividend distribution (subject to defense tax) is reduced by any actual dividend paid out of the profits of the relevant year at any time up to the date of the deemed distribution and the resulting balance of profits will be subject to defense tax of 20% to the extent of the proportion of shares held in the company at that time by Cyprus tax residents. The profits to be taken into account in determining the deemed dividend do not include fair value adjustments to movable or immovable property (if any).
The defense tax payable as a result of a deemed dividend distribution is paid in the first instance by the company which may recover such payment from its Cypriot shareholders by deducting the amount from an actual dividend paid to such shareholders from the relevant profits. To the extent that the company is unable to recover such amount due to a change in shareholders or no actual dividend is ever paid out of the relevant profits, the company will suffer the cost of this defense tax. Imposition of such a tax could have a material adverse effect on our business, results of operations, financial condition and prospects where the tax cannot be recovered from shareholders as described above. In the case where a person who is not tax resident in Cyprus receives a dividend from a Cypriot tax resident company and that dividend is paid out of profits which at any stage gave rise to a liability to defense tax in accordance with the deemed dividend distribution provisions described above, then the defense tax paid in respect of the deemed distribution which relates to the dividends received by such person is refundable upon application to the Cypriot tax authorities by the recipient of the dividend.
Certain interest expenses may not be deductible under Cyprus law.
According to Cyprus tax law, interest expenses are tax deductible if they are incurred wholly and exclusively for the production of taxable income. However, no deduction is allowed for interest applicable or deemed to be applicable to the cost of purchasing assets not used for business purposes. Under a recent amendment to Cyprus tax law, in cases where shares are acquired directly or indirectly in a wholly owned subsidiary and if the subsidiary does not own any assets not used in the business, there will be no interest expense restriction. In cases where the subsidiary holds assets both used and not used in the business, then the interest restriction will be applied as a percentage of assets not used in business to total assets. This amendment in Cyprus tax law is effective for interest paid for the acquisition of shares after January 1, 2012. For interest paid prior to January 1, 2012, investment in a subsidiary will be considered a non-business asset in Cyprus and any interest expense that relates (or is deemed to relate) to the acquisition or financing of such asset (even if the subsidiary distributes dividends on a regular basis) is not considered tax deductible in Cyprus. Consequently, if our holding company holds assets that are deemed not to be used in the business, then all or part of the interest incurred by our holding company on loans for the acquisition or financing of such assets should be considered non-deductible for tax purposes in Cyprus.
34
Table of Contents
Risks Related to Our Ordinary Shares and this Offering
Investors may have difficulty enforcing judgments against us, our directors and management.
We are incorporated under the laws of Cyprus. Further, we conduct substantially all of our operations in India through our key operating subsidiary in India. The majority of our directors and officers reside outside the United States, and substantially all of our assets and some or all of the assets of such persons are located outside the United States. As a result, it may be difficult or impossible to effect service of process within the United States upon us or those persons, or to recover against us or them on judgments of United States courts, including judgments predicated upon the civil liability provisions of the United States federal securities laws. An award of punitive damages under a United States court judgment based upon United States federal securities laws is likely to be construed by Cypriot and Indian courts to be penal in nature and therefore unenforceable in both Cyprus and India. Further, no claim may be brought in Cyprus or India against us or our directors and officers in the first instance for violation of United States federal securities laws because these laws have no extraterritorial application under Cypriot or Indian law and do not have force of law in Cyprus or India. However, a Cypriot or Indian court may impose civil liability, including the possibility of monetary damages, on us or our directors and officers if the facts alleged in a complaint constitute or give rise to a cause of action under Cypriot or Indian law. Moreover, it is unlikely that a court in Cyprus or India would award damages on the same basis as a foreign court if an action were brought in Cyprus or India or that a Cyprus or Indian court would enforce foreign judgments if it viewed the amount of damages as excessive or inconsistent with Cyprus or Indian practice or public policy.
The courts of Cyprus or India would not automatically enforce judgments of United States courts obtained in actions against us or our directors and officers, or some of the experts named herein, predicated upon the civil liability provisions of the United States federal securities laws, or entertain actions brought in Cyprus or India against us or such persons predicated solely upon United States federal securities laws. Further, there is no treaty in effect between the United States and Cyprus providing for the enforcement of judgments of United States courts in civil and commercial matters, and the United States has not been declared by the Government of India to be a reciprocating territory for the purposes of enforcement of foreign judgments, and there are grounds upon which Cyprus or Indian courts may decline to enforce the judgments of United States courts. Some remedies available under the laws of United States jurisdictions, including remedies available under the United States federal securities laws, may not be allowed in Cyprus or Indian courts if contrary to public policy in Cyprus or India (as the case may be). Because judgments of United States courts are not automatically enforceable in Cyprus or India, it may be difficult for you to recover against us or our directors and officers or some experts named in this prospectus based upon such judgments. In India, prior approval of the Reserve Bank of India is required in order to repatriate any amount recovered pursuant to such judgments. See “Enforcement of Civil Liabilities.”
As a foreign private issuer, we are permitted to, and we will, follow certain home country corporate governance practices in lieu of certain stock exchange requirements applicable to U.S. issuers. This may afford less protection to holders of our ordinary shares.
As a foreign private issuer whose ordinary shares are listed on , we are permitted to follow certain home country corporate governance practices in lieu of certain requirements. A foreign private issuer must disclose in its annual reports filed with the Securities and Exchange Commission, or the SEC, each requirement with which it does not comply followed by a description of its applicable home country practice. As a company incorporated in Cyprus and listed on , we expect to follow our home country practice with respect to the composition of our board of directors and executive sessions. Unlike the requirements of , the corporate governance practice and requirements in Cyprus do not require us to have a majority of our board of directors to be independent or hold regular executive sessions where only independent directors are present. See “Management — Stock Exchange Requirements That Are Not Applicable to Us” for more information.
35
Table of Contents
Holders of our ordinary shares in certain jurisdictions, including the United States, may not be able to exercise their pre-emptive rights in relation to future issues of ordinary shares.
In order to raise funding in the future, our holding company may issue additional ordinary shares. Generally, existing holders of ordinary shares in Cyprus public companies are in certain circumstances entitled to pre-emptive rights on the issue of new ordinary shares, as described in “Description of Share Capital — Pre-emption Rights.” Holders of our ordinary shares in certain jurisdictions including the United States, but not Cyprus, may not be able to exercise pre-emptive rights for ordinary shares unless we comply with applicable registration and other securities law requirements related to public offerings, or if an exemption from such requirements is available and utilized. If we opt not to comply with such requirements and an exemption is not available or utilized, holders in such jurisdictions will not be able to exercise their pre-emptive rights on future issuances of ordinary shares, and, as a result, their percentage ownership interest in our holding company would be reduced and economic value associated with such rights may be lost.
An active trading market for our ordinary shares may not develop and the trading price for our ordinary shares may fluctuate significantly.
Prior to this offering, there has been no public market for our ordinary shares. If an active public market for our ordinary shares does not develop after this offering, the market price and liquidity of our ordinary shares may be adversely affected. Although our ordinary shares have been approved for listing on , a liquid public market for our ordinary shares may not develop or be sustained after this offering. The initial public offering price for our ordinary shares was determined by negotiation among us, the selling shareholders and the underwriters and the price at which the ordinary shares are traded after this offering may decline below the initial public offering price, which means you may experience a decrease in the value of your ordinary shares regardless of our operating performance or prospects. In the past, following periods of volatility in the market price of a company’s securities, shareholders have often instituted securities class action litigation against that company. If we were involved in a class action suit, it could divert the attention of senior management, and, if adversely determined, could have a material adverse effect on our results of operations and financial condition.
If securities or industry analysts do not publish research or publish unfavorable or inaccurate research about our business, our share price and trading volume could decline.
The trading market for our ordinary shares will depend, in part, on the research and reports that securities or industry analysts publish about us or our business. We may be unable to sustain coverage by well regarded securities and industry analysts. If either none or only a limited number of securities or industry analysts maintain coverage of our company, or if these securities or industry analysts are not widely respected within the general investment community, the trading price for our ordinary shares would be negatively impacted. In the event we obtain securities or industry analyst coverage, if one or more of the analysts who cover us downgrade our ordinary shares or publish inaccurate or unfavorable research about our business, our share price would likely decline. If one or more of these analysts cease coverage of our company or fail to publish reports on us regularly, demand for our ordinary shares could decrease, which might cause our share price and trading volume to decline.
Because the initial public offering price is substantially higher than our book value per share, you will incur immediate and substantial dilution.
Purchasers of our ordinary shares will experience immediate and substantial dilution in net tangible book value per share from the initial public offering price per share. After giving effect to the conversion of all our preference shares and warrants into ordinary shares on or before the completion of this offering and the sale of ordinary shares offered by this prospectus at the assumed public offering price of $ per share, the midpoint of the estimated initial public offering price range set forth on the cover page of this prospectus, and after deducting the underwriting discounts and commissions and the estimated offering expenses payable by us in this offering, our net tangible book value as of March 31, 2012 would have been approximately $ million, or
36
Table of Contents
$ per share. This represents an immediate dilution in net tangible book value of $ per share to investors in this offering. For a calculation of the dilution purchasers in this offering will incur, see “Dilution.”
The sale or availability for sale of substantial amounts of our ordinary shares could adversely affect their market price.
Sales of substantial amounts of ordinary shares in the public market after the completion of this offering, or the perception that such sales could occur, could adversely affect the market price of our ordinary shares and could materially impair our future ability to raise capital through offerings of our ordinary shares.
We will have ordinary shares outstanding immediately after this offering or ordinary shares if the underwriters exercise their option to purchase additional ordinary shares in full. All of the ordinary shares sold in this offering will be freely tradable without restriction or further registration under the Securities Act, unless held by our “affiliates” as that term is defined in Rule 144 under the Securities Act. Subject to the 180-day lock-up restrictions described below and other applicable restrictions and limitations under Rule 144 of the Securities Act, all of our shares outstanding prior to this offering (as well as those to be issued upon conversion of our preference shares and warrants) will be eligible for sale in the public market. If these shares are sold, or if it is perceived that they will be sold, in the public market, the trading price of our ordinary shares could decline.
In connection with this offering, we, the selling shareholders, our directors and executive officers and our other principal shareholders have agreed with the underwriters, with certain exceptions, not to sell or transfer any ordinary shares or securities convertible into or exercisable for ordinary shares for a period of 180 days after the date of this prospectus. We cannot predict what effect, if any, market sales of ordinary shares held by our significant shareholders or any other shareholder or the availability of these ordinary shares for future sale will have on the market price of our ordinary shares.
Future issuances of any equity securities may decrease the trading price of our ordinary shares.
Any issuance of equity securities after this offering could dilute the interests of our shareholders and could substantially decrease the trading price of our ordinary shares. We may issue equity or equity-linked securities in the future for a number of reasons, including to finance our operations and business strategy (including in connection with acquisitions and other transactions), to adjust our ratio of debt to equity, to satisfy our obligations upon the exercise of then-outstanding options, stock appreciation rights or other equity-linked instruments, if any, or for other reasons.
Our management will have broad discretion over the use of the net proceeds we receive in this offering, and might not apply the proceeds in ways that increase the value of your investment.
Our management will have considerable discretion in applying the net proceeds we receive in this offering. We currently intend to use these proceeds primarily for general corporate purposes, including working capital, brand-building initiatives to increase brand awareness among consumers and capital expenditures such as the expansion of our television studio infrastructure and introduction of programming in regional languages on our television channel, as well as the repayment of a bank loan. If appropriate opportunities arise, we may use a portion of these proceeds to acquire or invest in technologies, solutions or businesses that complement our business. We have not allocated these proceeds for any specific purposes. Until these proceeds are used, we plan to invest them in short-term, interest-bearing bank deposits and money market funds, and these investments may not yield a favorable rate of return. If we do not invest or apply these proceeds in ways that enhance shareholder value, we may fail to achieve expected financial results, which could cause our stock price to decline.
37
Table of Contents
Our holding company will have to rely principally on dividends and other distributions on equity paid by our operating subsidiary and limitations on its ability to pay dividends to our holding company could adversely impact your ability to receive dividends on our ordinary shares.
Dividends and other distributions on equity paid by our Indian operating subsidiary will be our holding company’s principal source for cash in order for us to be able to pay any dividends and other cash distributions to our shareholders. As of the date of this prospectus, our subsidiary has not paid any cash dividends on its equity shares. If our operating subsidiary incurs debt on its own behalf in the future, the instruments governing the debt may restrict their ability to pay dividends or make other distributions to our holding company. As our subsidiary is established in India, it is also subject to certain limitations with respect to dividend payments. See “Dividend Policy” for further information.
We are an “emerging growth company,” and any decision on our part to comply only with certain reduced disclosure and governance requirements applicable to emerging growth companies could make our ordinary shares less attractive to investors.
As a company with less than $1.0 billion in revenue during our last fiscal year, we are an “emerging growth company,” as defined in the JOBS Act, and for as long as we continue to be an “emerging growth company,” we may choose to take advantage of exemptions from various reporting requirements applicable to other public companies but not to “emerging growth companies,” including, but not limited to, not being required to comply with the auditor attestation requirements of Section 404 of the Sarbanes-Oxley Act. We could be an “emerging growth company” for up to five years, although, if our annual revenue exceeds $1.0 billion, we issue more than $1.0 billion in non-convertible debt over a three-year period or the market value of our ordinary shares that is held by non-affiliates exceeds $700 million before the end of that five-year period, we could cease to be an “emerging growth company” earlier. We cannot predict if investors will find our ordinary shares less attractive if we choose to rely on these exemptions. If some investors find our ordinary shares less attractive as a result of any choices to reduce future disclosure, there may be a less active trading market for our ordinary shares and our stock price may be more volatile.
As a result of becoming a public company, we will be obligated to develop and maintain proper and effective internal control over financial reporting. We may not complete our analysis of our internal control over financial reporting in a timely manner, or these internal controls may not be determined to be effective, which may adversely affect investor confidence in our company and, as a result, the value of our ordinary shares.
Upon the completion of this offering, we will become a public company in the United States that is subject to certain requirements under the Sarbanes-Oxley Act and will become subject to additional requirements under the Sarbanes-Oxley Act when we cease to qualify as an “emerging growth company” under the JOBS Act. Section 404 of the Sarbanes-Oxley Act will require that we include a report from management on our internal control over financial reporting in our Annual Report on Form 20-F beginning as early as our annual report for the fiscal year ending March 31, 2013. In addition, our independent registered public accounting firm must attest to and report on management’s assessment of the effectiveness of our internal control over financial reporting. For as long as we are an “emerging growth company” under the recently enacted JOBS Act, our independent registered public accounting firm will not be required to attest to the effectiveness of our internal control over financial reporting pursuant to Section 404 of the Sarbanes-Oxley Act. We could be an emerging growth company for up to five years. See “Summary — Implications of Being an Emerging Growth Company.” Furthermore, after the date we are no longer an emerging growth company, our independent registered public accounting firm will only be required to attest to the effectiveness of our internal control over financial reporting depending on our market capitalization. Even if our management concludes that our internal controls over financial reporting are effective, our independent registered public accounting firm may still decline to attest to our management’s assessment or may issue a report that is qualified if it is not satisfied with our controls or the level at which our controls are documented, designed, operated or reviewed, or if it interprets the relevant requirements differently from us.
38
Table of Contents
In addition, in connection with the implementation of the necessary procedures and practices related to internal control over financial reporting, we may identify deficiencies that we may not be able to remediate in time to meet the deadline imposed by the Sarbanes-Oxley Act for compliance with the requirements of Section 404. Failure to comply with Section 404 could subject us to regulatory scrutiny and sanctions, impair our ability to raise revenue, cause investors to lose confidence in the accuracy and completeness of our financial reports and negatively affect our share price.
The requirements of being a public company may strain our resources, divert management’s attention and affect our ability to attract and retain executive management and qualified board members.
As a public company, we will incur legal, accounting and other expenses that we did not previously incur. We will be subject to the reporting requirements of the Securities Exchange Act of 1934, or the Exchange Act, the Sarbanes-Oxley Act, the Dodd-Frank Act, the listing requirements and other applicable securities rules and regulations. Compliance with these rules and regulations will increase our legal and financial compliance costs, make some activities more difficult, time-consuming or costly and increase demand on our systems and resources, particularly after we are no longer an “emerging growth company.” The Exchange Act requires, among other things, that we file annual and current reports with respect to our business and operating results. The Sarbanes-Oxley Act requires, among other things, that we maintain effective disclosure controls and procedures and internal control over financial reporting. Furthermore, the need to establish the corporate infrastructure demanded of a public company may divert management’s attention from implementing our growth strategy, which could prevent us from improving our business, financial condition and results of operations. We have made, and will continue to make, changes to our internal controls and procedures for financial reporting and accounting systems to meet our reporting obligations as a public company. However, the measures we take may not be sufficient to satisfy our obligations as a public company. In addition, these rules and regulations will increase our legal and financial compliance costs and will make some activities more time-consuming and costly. For example, we expect these rules and regulations to make it more difficult and more expensive for us to obtain director and officer liability insurance, and we may be required to incur substantial costs to maintain the same or similar coverage. These additional obligations could have a material adverse effect on our business, financial condition, results of operations and cash flow. Although we plan to hire additional employees to comply with these requirements, we may need to hire more employees than planned or engage outside consultants, which will further increase our costs and expenses.
In addition, changing laws, regulations and standards relating to corporate governance and public disclosure are creating uncertainty for public companies, increasing legal and financial compliance costs and making some activities more time-consuming. These laws, regulations and standards are subject to varying interpretations, in many cases due to their lack of specificity, and, as a result, their application in practice may evolve over time as new guidance is provided by regulatory and governing bodies. This could result in continuing uncertainty regarding compliance matters and higher costs necessitated by ongoing revisions to disclosure and governance practices. We intend to invest resources to comply with evolving laws, regulations and standards, and this investment may result in increased general and administrative expenses and a diversion of management’s time and attention from revenue-generating activities to compliance activities. If our efforts to comply with new laws, regulations and standards differ from the activities intended by regulatory or governing bodies due to ambiguities related to their application and practice, regulatory authorities may initiate legal proceedings against us and our business may be adversely affected.
We also expect that being a public company and these new rules and regulations will make it more expensive for us to obtain director and officer liability insurance, and we may be required to accept reduced coverage or incur substantially higher costs to obtain coverage. These factors could also make it more difficult for us to attract and retain qualified members of our board of directors, particularly to serve on our audit committee and compensation committee, and qualified executive officers.
39
Table of Contents
As a result of disclosure of information in this prospectus and in filings required of a public company, our business and financial condition will become more visible, which we believe may result in threatened or actual litigation, including by competitors and other third parties. If such claims are successful, our business and operating results could be adversely affected, and, even if the claims do not result in litigation or are resolved in our favor, these claims, and the time and resources necessary to resolve them, could cause an adverse effect on our business and operating results.
We may be classified as a passive foreign investment company, or PFIC, under United States tax law, which could result in adverse United States federal income tax consequences to U.S. investors.
Based upon the past and projected composition of our income and valuation of our assets, we do not believe we were a PFIC for our taxable year ending March 31, 2012 and do not expect to be a PFIC for our taxable year ending March 31, 2013 and we do not expect to become one in the future, although there can be no assurance in this regard. The determination of whether or not we are a PFIC for any taxable year is made on an annual basis and will depend on the composition of our income and assets from time to time. Specifically, we will be classified as a PFIC for United States federal income tax purposes if either:
| • | 75% or more of our gross income in a taxable year is passive income, or |
| • | 50% or more of the average quarterly value of our gross assets in a taxable year is attributable to assets that produce passive income or are held for the production of passive income. |
The calculation of the value of our assets will be based, in part, on the then market value of our ordinary shares, which is subject to change. We cannot assure you that we were not a PFIC for fiscal year 2012 or that we will not be a PFIC for this or any future taxable year. Moreover, the determination of our PFIC status is based on an annual determination that cannot be made until the close of a taxable year and involves extensive factual investigation. This investigation includes ascertaining the fair market value of all of our assets on a quarterly basis and the character of each item of income we earn, which cannot be completed until the close of a taxable year, and therefore, our U.S. counsel expresses no opinion with respect to our PFIC status. If we were to be or become classified as a PFIC, a U.S. Holder (as defined in “Taxation — U.S. Federal Income Taxation”) may be subject to burdensome reporting requirements and may incur significantly increased United States income tax on gain recognized on the sale or other disposition of the shares and on the receipt of distributions on the shares to the extent such gain or distribution is treated as an “excess distribution” under the United States federal income tax rules. Further, if we were a PFIC for any year during which a U.S. Holder held our shares, we would continue to be treated as a PFIC for all succeeding years during which such U.S. Holder held our shares unless we cease to be a PFIC and such U.S. Holder made a “deemed sale” election with respect to our ordinary shares. Each U.S. Holder is urged to consult its tax advisors concerning the United States federal income tax consequences of acquiring, holding and disposing of shares if we are or become classified as a PFIC. See “Taxation — U.S. Federal Income Taxation — Passive Foreign Investment Company” for a more detailed description of the PFIC rules.
40
Table of Contents
This prospectus contains forward-looking statements that relate to our current expectations and views of future events. These forward-looking statements are contained principally in the sections entitled “Summary,” “Risk Factors,” “Use of Proceeds,” “Management’s Discussion and Analysis of Financial Condition and Results of Operations” and “Business.” These statements relate to events that involve known and unknown risks, uncertainties and other factors, including those listed under “Risk Factors,” which may cause our actual results, performance or achievements to be materially different from any future results, performance or achievements expressed or implied by the forward-looking statements.
In some cases, these forward-looking statements can be identified by words or phrases such as “may,” “will,” “expect,” “anticipate,” “aim,” “estimate,” “intend,” “plan,” “believe,” “potential,” “continue,” “is/are likely to” or other similar expressions.
These forward-looking statements are subject to risks, uncertainties and assumptions, some of which are beyond our control. In addition, these forward-looking statements reflect our current views with respect to future events and are not a guarantee of future performance. Actual outcomes may differ materially from the information contained in the forward-looking statements as a result of a number of factors, including, without limitation, the risk factors set forth in “Risk Factors” and the following:
| • | our ability to expand our business, implement our strategy and effectively manage our growth; |
| • | increasing competition in the Indian digital commerce industry; |
| • | our reliance on technology; |
| • | our ability to maintain and expand relationships with our Sourcing Partners; |
| • | our continued receipt of financial support from Network18; |
| • | political and economic stability in India; |
| • | our ability to attract, train and retain executives and other qualified employees; and |
| • | risks associated with digital commerce security. |
The forward-looking statements made in this prospectus relate only to events or information as of the date on which the statements are made in this prospectus. Except as required by law, we undertake no obligation to update or revise publicly any forward-looking statements, whether as a result of new information, future events or otherwise, after the date on which the statements are made or to reflect the occurrence of unanticipated events. You should read this prospectus and the documents that we reference in this prospectus and have filed as exhibits to the registration statement, of which this prospectus is a part, completely and with the understanding that our actual future results or performance may be materially different from what we expect.
41
Table of Contents
ENFORCEMENT OF CIVIL LIABILITIES
Our holding company is incorporated in Cyprus and our sole subsidiary, TV18 Home Shopping Network Limited, is incorporated in India. The majority of our directors and executive officers are not residents of the United States and substantially all of our assets and the assets of such persons are located outside the United States. As a result, it may not be possible for you to effect service of process within the United States upon such persons or us. In addition, you may be unable to enforce judgments obtained in courts of the United States against such persons outside the jurisdiction of their residence, including judgments predicated solely upon U.S. securities laws.
Cyprus
Neither the United States nor Cyprus currently has a bilateral or other treaty with the other providing for the reciprocal recognition and enforcement of judgments (other than arbitration awards) in civil and commercial matters. A final and conclusive judgment for the payment of money rendered by any federal or state court in the United States based on civil liability, whether or not predicated solely upon U.S. federal securities laws, would not be automatically recognized or enforceable in Cyprus. In order to obtain a judgment that is enforceable in Cyprus, the party in whose favor a final and conclusive judgment of a U.S. court has been rendered must file, under principles of common law, its claim as a fresh action with a court of competent jurisdiction of Cyprus to be adjudicated. Under current practice, this party may submit, to the Cyprus court, under the fresh action, the final judgment rendered by the U.S. court. If and to the extent that the Cypriot court finds the jurisdiction of the U.S. court to have been based on internationally acceptable grounds and that legal procedures comparable with Cypriot concepts of due process have been followed, the Cypriot court will, in principle, grant the same judgment as the judgment of the U.S. court, unless such judgment would contravene Cypriot principles of public order.
Subject to the foregoing and service of process in accordance with applicable treaties, a final and conclusive judgment for a definite sum by a U.S. state or federal court having jurisdiction to give that judgment against us may be recognized and enforced in the courts of Cyprus if not impeachable on any of the grounds set out below. A judgment may be final and conclusive though it is subject to an appeal and though an appeal against it is actually pending in the foreign country where it was given.
A foreign judgment is impeachable in Cyprus on any of the following grounds:
| • | if the judgment was obtained by fraud (such fraud may be either fraud on the part of the party in whose favor the judgment is given or fraud on the part of the court pronouncing the judgment); |
| • | its enforcement or, as the case may be, recognition would be contrary to or manifestly incompatible with the public policy of Cyprus; |
| • | if the proceedings in which the judgment was obtained were opposed to natural justice; or |
| • | if the courts of the foreign country did not, in the circumstances of the case, have jurisdiction to give the judgment in view of the Cyprus law in accordance with the principles set out below. |
The Cyprus courts recognize that a foreign court has jurisdiction to give a judgment capable of enforcement or recognition in the following cases:
| • | if the judgment debtor was, at the time the proceedings were instituted, resident (or present) in the foreign country; |
| • | if the judgment debtor was plaintiff in, or counterclaimed, in the proceedings in the foreign court; |
| • | if the judgment debtor, being a defendant in the foreign court, submitted to the jurisdiction of that court by voluntarily appearing in the proceedings; or |
42
Table of Contents
| • | if the judgment debtor, being a defendant in the original court, had before the commencement of the proceedings agreed, in respect of the subject matter of the proceedings, to submit to the jurisdiction of the courts of that country. |
A judgment obtained by default shall neither be recognized nor enforced unless the defaulting party received notice of the institution of the proceedings in accordance with the law of the state in which the proceedings were instituted in sufficient time to enable it to defend the proceedings.
An original action can be brought in Cyprus against us based on U.S. securities or other laws upon proof of the relevant provisions of these laws. However, even if a Cypriot court has jurisdiction, it is uncertain whether such court will impose civil liability in an original action commenced in Cyprus and predicated solely upon U.S. federal securities laws. A court in Cyprus may stay proceedings if concurrent proceedings in respect of the same subject matter are being brought elsewhere. The courts in Cyprus may not treat as conclusive any calculation or matter which by the terms of a contract are to be determined by a party thereto or are otherwise to be conclusive, but may inquire into such calculations or matter. Where a contract vests a discretion in any person the courts in Cyprus may require such discretion to be exercised reasonably and objectively. A court in Cyprus would be prepared to render judgment for a monetary amount in a foreign currency, but the amount may have to be converted into Euro for the purposes of enforcement of such judgment within Cyprus. Additionally, foreign currency amounts for which a creditor proves in the event we are wound up must be converted into Euro at the rate prevailing at the date of the winding up order or resolution. We may be able to raise defenses and claims available to sureties notwithstanding the terms of the guarantee in that regard. Claims and obligations may become subject to set-off or counterclaim in legal actions being brought in Cyprus notwithstanding any provision of the guarantee to the contrary.
A contract may under the laws of Cyprus be void if entered into on the basis of a mistake as to fact or if a party thereto was induced to enter into it by a misrepresentation as to fact or by fraud.
India
Irrespective of any jurisdictional issues, Indian courts may not enforce a provision of the U.S. federal securities laws that is either penal in nature or contrary to public policy. An action brought pursuant to a public or penal law, the purpose of which is the enforcement of a sanction, power or right at the instance of the state in its sovereign capacity, is unlikely to be entertained by Indian courts. Specified remedies available under the laws of U.S. jurisdictions, including specified remedies under U.S. federal securities laws, would not be available under Indian law or enforceable in an Indian court, if they are considered to be contrary to Indian public policy (as the case may be). An award of punitive damages under a United States court judgment based upon United States federal securities laws is likely to be construed by Indian courts to be penal in nature and therefore unenforceable in India. Further, no claim may be brought in India against us or our directors and officers, as well as the experts named herein, in the first instance for a violation of U.S. federal securities laws because these laws have no extraterritorial application under Indian law and do not have force of law in India.
Section 44A of the Indian Code of Civil Procedure, 1908, as amended, or the Civil Procedure Code, provides that where a foreign judgment has been rendered by a superior court in any country or territory outside of India which the Government of India has by notification declared to be a reciprocating territory, such foreign judgment may be enforced in India by proceedings in execution as if the judgment had been rendered by an appropriate court in India. However, the enforceability of such judgments is subject to the exceptions set forth in Section 13 of the Civil Procedure Code. This section, which is the statutory basis for the recognition of foreign judgments, states that a foreign judgment is conclusive as to any matter directly adjudicated upon except:
| • | where the judgment has not been pronounced by a court of competent jurisdiction; |
| • | where the judgment has not been given on the merits of the case; |
43
Table of Contents
| • | where the judgment appears on the face of the proceedings to be founded on an incorrect view of international law or a refusal to recognize the law of India in cases where such law is applicable; |
| • | where the proceedings in which the judgment was obtained were opposed to natural justice; |
| • | where the judgment has been obtained by fraud; or |
| • | where the judgment sustains a claim founded on a breach of any law in force in India. |
Section 44A of the Civil Procedure Code is applicable only to decrees or judgments under which a sum of money is payable not being in the nature of amounts payable in respect of taxes or other charges of a similar nature or in respect of fines or other penalties and does not include arbitration awards. It is unlikely that a court in India would award damages on the same basis as a foreign court if an action were brought in India. Furthermore, it is unlikely that an Indian court would enforce a foreign judgment if it viewed the amount of damages awarded as excessive or inconsistent with public policy or practice in India.
If a judgment of a foreign court is not enforceable under Section 44A of the Civil Procedure Code as described above, it may be enforced in India only by a suit filed upon the judgment, subject to Section 13 of the Civil Procedure Code, and not by proceedings in execution. The United States has not been declared by the Government of India to be a reciprocating territory for the purposes of Section 44A of the Civil Procedure Code. Further, the United States and India do not currently have a treaty providing for reciprocal recognition and enforcement of judgments in civil and commercial matters. Accordingly, a judgment of a court in the United States may be enforced only by filing a fresh suit on the basis of the judgment and not by proceedings in execution.
The suit must be brought in India within three years from the date of the judgment in the same manner as any other suit filed to enforce a civil liability in India. It is difficult to predict whether a suit brought in an Indian court will be disposed of in a timely manner or be subject to untimely delay.
A party seeking to enforce a foreign judgment in India is required to obtain prior approval from the Reserve Bank of India under the Foreign Exchange Management Act, 1999, as amended, or FEMA, to repatriate any amount recovered pursuant to such enforcement. Any judgment in a foreign currency would be converted into Indian rupees on the date of judgment and not on the date of payment.
44
Table of Contents
We expect that the net proceeds we will receive from the sale of the ordinary shares offered by us will be approximately $ million, based on an assumed initial public offering price of $ per ordinary share, which is the midpoint of the price range set forth on the cover page of this prospectus, and after deducting the underwriting discounts and commissions and estimated offering expenses payable by us. If the underwriters exercise their option to purchase additional ordinary shares in full, our net proceeds from the sale of the ordinary shares offered by us will be approximately $ million after deducting the underwriting discounts and commissions and estimated offering expenses payable by us. A $1.00 increase/(decrease) in the assumed initial public offering price of $ per ordinary share would increase/(decrease) the net proceeds to us from this offering by approximately $ million, or approximately $ million if the underwriters exercise their option to purchase additional ordinary shares in full, assuming the number of ordinary shares offered by us, as set forth on the cover page of this prospectus, remains the same, and after deducting the underwriting discounts and commissions and estimated offering expenses payable by us.
The principal purposes of this offering are to increase our financial flexibility, increase our visibility in the marketplace and create a public market for our ordinary shares. As of the date of this prospectus, we cannot specify with certainty all of the particular uses for these proceeds or the amounts that we plan to use for any particular purpose. Accordingly, our management team will have broad discretion in using these proceeds. However, we currently expect to use these proceeds primarily for general corporate purposes, which may include working capital, brand-building initiatives to increase brand awareness among consumers and capital expenditures such as the expansion of our television studio infrastructure and introduction of programming in regional languages on our television channel. We also intend to use a portion of these proceeds to repay all outstanding borrowings under our credit facilities from The Ratnakar Bank Limited. As of July 31, 2012, we had outstanding borrowings of 346.9 million ($6.8 million) at a weighted average interest rate of 14.0% per annum, which we have used to meet our working capital requirements and pay operating expenses. The principal amount under both these facilities is repayable on demand. Our obligations under these credit facilities have been guaranteed by Network18 and Mr. Raghav Bahl. We may use a portion of the net proceeds from this offering for the acquisition of, or investment in, technologies, solutions or businesses that complement our business, although we have no present commitments or agreements to enter into any acquisitions or investments. Pending use of the net proceeds as described above, we intend to invest the net proceeds of this offering in short-term, interest-bearing bank deposits or money market funds.
We will not receive any proceeds from the sale of ordinary shares by the selling shareholders.
45
Table of Contents
The following table sets forth our indebtedness and capitalization as of March 31, 2012:
| • | on an actual basis; |
| • | on a pro forma basis to reflect (i) our May 2012 share capital reorganization described in the third paragraph of “Description of Share Capital,” (ii) the conversion of all outstanding preference shares and warrants into 54,233,549 ordinary shares on or before the completion of this offering, (iii) the full funding of our partially paid warrants and the repayment of related subordinated loans from the warrant proceeds which will occur on or before the completion of this offering and (iv) the issuance of 202,000 ordinary shares under options for which the exercise process, as of March 31, 2012, had been commenced but was not yet complete by that date; and |
| • | on a pro forma as adjusted basis to reflect the pro forma adjustments described above as well as the issuance and sale by us of ordinary shares offered in this offering at the assumed public offering price of $ per share, the midpoint of the estimated initial public offering price range set forth on the cover page of this prospectus, and after deducting the underwriting discounts and commissions and estimated offering expenses payable by us, and further assuming no exercise by the underwriters of the over-allotment option and no other change to the number of ordinary shares sold by us as set forth on the cover page of this prospectus. |
The as adjusted information below is illustrative only, and our capitalization following the completion of this offering is subject to adjustment based on the actual initial public offering price of our ordinary shares in this offering and other terms of this offering to be determined at pricing. You should read this table in conjunction with “Use of Proceeds,” “Selected Consolidated Financial and Other Data,” “Management’s Discussion and Analysis of Financial Condition and Results of Operations” and our consolidated financial statements and related notes included elsewhere in this prospectus.
| As of March 31, 2012 | ||||||||||||
| Actual | Pro forma | Pro forma As Adjusted | ||||||||||
| (in thousands) | ||||||||||||
Loans and borrowings (including current portion) and related derivative financial liabilities (1) (2) | $ | 11,493.1 | $ | 8.4 | $ | 8.4 | ||||||
Bank overdraft | 575.7 | 575.7 | 575.7 | |||||||||
Equity/(deficit): | ||||||||||||
Ordinary shares of nominal value $0.04 per share, issued: 41,923,401, actual; 100,744,214, pro forma; , pro forma as adjusted(3) | 5,390.3 | 4,029.8 | ||||||||||
Share premium(4) | 62,601.4 | 84,379.5 | ||||||||||
Convertible warrants(5) | 7,077.9 | — | — | |||||||||
Accumulated deficit | (80,674.4 | ) | (80,674.4 | ) | (80,674.4 | ) | ||||||
Employee share based payment reserve | 4,523.2 | 4,127.8 | 4,127.8 | |||||||||
Currency translation reserve | (244.5 | ) | (244.5 | ) | (244.5 | ) | ||||||
Advance against share capital | 22.2 | — | — | |||||||||
|
|
|
|
|
| |||||||
Total equity/(deficit)(4) | (1,303.9 | ) | 11,618.2 | |||||||||
|
|
|
|
|
| |||||||
Total capitalization(4) | $ | 10,764.9 | $ | 12,202.3 | $ | |||||||
|
|
|
|
|
| |||||||
Notes:
| (1) | Some of the warrants issued by us are hybrid instruments with non-derivative and derivative liability components. This line item includes the non-derivative and derivative liability portions of the warrants as of March 31, 2012, which were $0.6 million and $0.2 million, respectively. The conversion of these warrants |
46
Table of Contents
into ordinary shares on or before the completion of this offering will result in the liability portions of our warrants moving to our equity accounts. Accordingly, the liability portions of our warrants have been excluded from our pro forma and pro forma as adjusted columns. |
| (2) | This line item includes the $10.7 million liability as of March 31, 2012 of subordinated loans that will be repaid from the proceeds of the funding of outstanding partially paid warrants, which will occur on or before the completion of this offering. The repayment of these subordinated loans will result in the liability in respect of our subordinated loans moving to our equity accounts. Accordingly, liability in respect of our subordinated loans has been excluded from our pro forma and pro forma as adjusted columns. |
| (3) | The actual and pro forma ordinary shares stated in the table above exclude 2,177,000 ordinary shares issuable upon the exercise of outstanding options granted under our share option plan as of March 31, 2012, and no more than 2,260,000 ordinary shares issuable at our election upon exercise of the outstanding stock appreciation rights, all of which were granted in November 2012 under our stock appreciation rights scheme. See “Management — Share Incentive Plans.” |
| (4) | A $1.00 increase/(decrease) in the assumed initial public offering price of $ per share in this offering would increase/(decrease) each of share premium, total equity/(deficit) and total capitalization by $ million. |
| (5) | By the completion of this offering, the warrants will be converted into 12,990,793 ordinary shares. At such time, the $7.1 million on this line will be moved to our share accounts. |
47
Table of Contents
If you invest in our ordinary shares, your interest will be diluted to the extent of the difference between the initial public offering price per share and our net tangible book value per share after this offering. Dilution results from the fact that the initial public offering price per share is substantially in excess of the book value per share attributable to the existing shareholders. Our net tangible book value is determined by subtracting the value of our intangible assets and total liabilities from our total assets.
As of March 31, 2012, we had pro forma net tangible book value of $10.1 million, or $0.10 per share outstanding, after giving effect to:
| • | our May 2012 share capital reorganization described in the third paragraph of “Description of Share Capital”; |
| • | the conversion of all outstanding preference shares and warrants into ordinary shares that will occur by the completion of this offering; |
| • | the full funding of our partially paid warrants and the repayment of the related subordinated loans that will occur by the completion of this offering; and |
| • | the issuance of 202,000 ordinary shares under options for which the exercise process, as of March 31, 2012, had been commenced but was not yet complete by that date. |
As of March 31, 2012, our pro forma as adjusted net tangible book value would have been approximately $ , or $ per share, after:
| • | giving effect to the transactions described in the four bullet points above; |
| • | giving effect to our sale in this offering of ordinary shares at an assumed initial public offering price of $ per share, the midpoint of the price range on the cover page of this prospectus; and |
| • | deducting estimated underwriting discounts and commissions and estimated offering expenses payable by us; |
This represents an immediate increase in pro forma as adjusted net tangible book value of $ per share to our existing shareholders and an immediate dilution of $ per share to investors purchasing shares in this offering.
The following table illustrates such dilution per share:
Assumed initial public offering price per share | $ | |||
Net tangible book value per share as of March 31, 2012(1) | $ | (0.02 | ) | |
Pro forma net tangible book value per share as of March 31, 2012 | $ | 0.10 | ||
Increase in pro forma net tangible book value per share attributable to investors purchasing shares in this offering | $ | |||
Pro forma net tangible book value per share after this offering | $ | |||
Dilution in pro forma net tangible book value per share to investors in this offering | $ |
Note:
| (1) | Calculated after giving effect to the share capital reorganization described in the third paragraph of “Description of Share Capital.” |
A $1.00 increase/decrease in the assumed initial public offering price of $ per share would increase/decrease our pro forma net tangible book value per share after this offering by $ , assuming that the number of ordinary shares offered by us as set forth on the cover page of this prospectus remains the same and after deducting the underwriting discounts and commissions and estimated offering expenses payable by us.
48
Table of Contents
If the underwriters’ option to purchase additional ordinary shares to cover over-allotments is exercised in full, the pro forma net tangible book value per share after giving effect to this offering would be approximately $ per share, and the dilution in pro forma net tangible book value per share to investors in this offering would be approximately $ per share.
The pro forma information discussed above is illustrative only. Our net tangible book value following the completion of this offering is subject to adjustment based on the actual initial public offering price of our ordinary shares and other terms of this offering determined at pricing.
The following table summarizes, on a pro forma basis as of March 31, 2012 after giving effect to the transactions described in the first four bullet points in the second paragraph of the prior page, the differences between the number of shares of our share capital purchased from us, the total cash consideration paid, and the average price per share paid by our existing shareholders and by our new investors purchasing shares in this offering at the assumed initial public offering price of the ordinary shares of $ per share, the midpoint of the price range on the cover page of this prospectus, before deducting estimated underwriting discounts and commissions and estimated offering expenses payable by us:
| Shares Purchased | Total Consideration | Average Price per Share | ||||||||||||||||||
| Number | Percent | Amount | Percent | |||||||||||||||||
Existing shareholders(1) | 100,744,214 | % | $ | 86,923,931 | % | $ | 0.86 | |||||||||||||
New investors | ||||||||||||||||||||
|
|
|
|
|
|
|
|
|
| |||||||||||
Total | % | $ | % | $ | ||||||||||||||||
|
|
|
|
|
|
|
|
|
| |||||||||||
Note:
| (1) | Assuming the transactions described in the first four bullet points in the second paragraph of the prior page occurred as of March 31, 2012. |
A $1.00 increase/decrease in the assumed initial public offering price of $ per share, which is the midpoint of the price range set forth on the cover page of this prospectus, would increase/decrease total consideration paid by new investors in this offering, total consideration paid by all shareholders and the average price per share by $ million, $ million and $ million, respectively, assuming the number of ordinary shares offered by us, as set forth on the cover page of this prospectus, remains the same, and before deducting the underwriting discounts and commissions and estimated offering expenses payable by us.
Assuming that the underwriters’ over-allotment option is exercised in full, the new investors will own % of our outstanding ordinary shares and will have provided % of the total amount paid to fund our company.
The discussion and tables above assume no exercise of any outstanding share options or stock appreciation rights other than options for 202,000 ordinary shares for which the exercise process, as of March 31, 2012, had been commenced but was not completed until after that date. As of March 31, 2012, there were 2,177,000 ordinary shares issuable upon exercise of outstanding share options at a weighted average exercise price of $0.12 per share, and there were 354,482 ordinary shares available for future issuance upon the exercise of future grants under our share option plan. No stock appreciation rights were outstanding on March 31, 2012. Thereafter, in November 2012, 2,260,000 stock appreciation rights were granted and the fair value of these stock appreciation rights (measured as of grant date) amounted to $2.7 million. Stock appreciation rights may be settled in cash or ordinary shares, at our option. No more than 2,260,000 ordinary shares are issuable under these outstanding stock appreciation rights. In addition, 473,482 additional stock appreciation rights may be granted under the stock appreciation rights scheme. To the extent that any of these options is exercised or we elect to issue ordinary shares to settle exercises of stock appreciation rights, there will be further dilution to new investors.
49
Table of Contents
Since our incorporation, we have not declared or paid any dividends on any of our ordinary shares. We currently intend to retain our earnings to finance the development and growth of our business and operations as well as expand our business and do not currently anticipate paying dividends on our ordinary shares in the near future.
Under Cypriot law and our Articles of Association, dividends may only be paid out of net accumulated profits. Dividends may be declared at a general meeting of shareholders, but no dividend may exceed the amount recommended by the directors. In addition, the directors may on their own declare and pay interim dividends. The directors may, before recommending any dividend, set aside out of our profits such sums as they think proper as a reserve or reserves.
No distribution of dividends may be made when on the closing date of the last fiscal year, the net assets, as set out in our annual accounts are, or following such a distribution would become, lower than the amount of the subscribed share capital plus those reserves which may not be distributed under law or our Articles of Association.
Interim dividends can only be paid if interim accounts are prepared showing that funds available for distribution are sufficient and the amount to be distributed may not exceed the total profits made since the end of the most recent completed fiscal year for which the annual accounts have been prepared, plus any profits brought forward and sums drawn from reserves available for this purpose, minus any losses brought forward and sums to be placed to reserve pursuant to the requirements of the law and our Articles of Association.
As NW18 HSN Holding Plc is a holding company, our ability to pay dividends to our shareholders will depend on the availability of dividends from our subsidiary. As of the date of this prospectus, our subsidiary has not paid any cash dividends on its equity shares. Dividends other than in cash are not permitted under Indian law. Our subsidiary is liable to pay dividend distribution tax in India at an effective rate of 16.6% (including applicable tax, which is an Indian education tax, and surcharge).
Under Indian law, a company declares dividends upon a recommendation by its board of directors and approval by a majority of the shareholders at the annual general meeting of shareholders. However, while final dividends can be paid out by a company only after such dividends have been recommended by the board of directors and approved by shareholders, interim dividends can be paid out with only a recommendation by the board of directors. The shareholders have the right to decrease but not to increase any dividend amount recommended by the board of directors. Under Indian law, shares of a company belonging to the same class must receive equal dividend treatment.
Under Indian law, a company is permitted to declare or pay dividends in any year from profits for that year only if it transfers a specified percentage of profits for that year or previous years to the reserves of the company as prescribed by the Indian Companies Act, 1956, as amended, or the Companies Act, and applicable rules under the Companies Act.
If profits for a particular year are insufficient for our Indian subsidiary to declare dividends (including interim dividends), the dividends for that year may be declared and paid out from accumulated profits if the following conditions are fulfilled:
| • | the rate of dividend to be declared shall not exceed the average of the rates at which dividends were declared in the five years immediately preceding that year or 10.0% of our paid-up share capital, whichever is less; |
| • | the total amount to be drawn from the accumulated profits earned in previous years and transferred to the reserves shall not exceed an amount equal to one-tenth of the sum of our paid-up share capital and |
50
Table of Contents
net reserves, and the amount so drawn shall first be utilized to set off the losses incurred in the financial year before any dividend in respect of preference or equity shares is declared; and |
| • | the balance of the reserves after such withdrawal shall not fall below 15.0% of our paid-up share capital. |
Because our Indian subsidiary did not have accumulated or current profits in fiscal year 2012, it would not have been able to pay a dividend to our holding company.
Under the terms of our subsidiary’s current credit facility from The Ratnakar Bank Limited, our subsidiary will be required to obtain the bank’s written consent prior to declaring and paying any dividends. We intend to repay the bank loan fully out of the proceeds of this offering, and thereafter our subsidiary will not be subject to this restriction on dividends.
51
Table of Contents
Our consolidated financial statements and other financial data included in this prospectus are presented in US dollars. Our business and operations are primarily conducted in India through our subsidiary, TV18 Home Shopping Network Limited. The functional currency of our subsidiary is Indian rupees and its revenues and expenses are denominated in that currency. We report our consolidated financial results in US dollars. The conversion of Indian rupees into US dollars in this prospectus is based on the noon buying rate in The City of New York for cable transfers of Indian rupees as certified for customs purposes by the Federal Reserve Bank of New York. For your convenience, unless otherwise noted, all translations from Indian rupees to US dollars and from US dollars to Indian rupees in this prospectus were made at a rate of 50.89 to $1.00, the noon buying rate in effect as of March 30, 2012. We make no representation that any Indian rupee or US dollar amounts referred to in this prospectus could have been or could be converted into US dollars or Indian rupees, as the case may be, at any particular rate or at all. The effects of foreign currency translation adjustments are included as a component of other comprehensive income in our shareholders’ equity.
The following table sets forth, for each of the periods indicated, the low, average, high and period-end noon buying rates in The City of New York for cable transfers, in Indian rupees per US dollar, as certified for customs purposes by the Federal Reserve Bank of New York. These rates are provided solely for your convenience and are not necessarily the exchange rates that we used in this prospectus or will use in the preparation of our periodic reports or any other information to be provided to you.
Period(1) | Period End | Average(2) | High | Low | ||||||||||||
| (Rs. per $1.00) | ||||||||||||||||
Fiscal Year: | ||||||||||||||||
2008 | 40.02 | 40.00 | 43.05 | 38.48 | ||||||||||||
2009 | 50.87 | 46.32 | 51.96 | 39.73 | ||||||||||||
2010 | 44.95 | 47.18 | 50.48 | 44.94 | ||||||||||||
2011 | 44.54 | 45.46 | 47.49 | 43.90 | ||||||||||||
April | 44.24 | 44.30 | 44.51 | 44.00 | ||||||||||||
May | 45.04 | 44.90 | 45.33 | 44.27 | ||||||||||||
June | 44.59 | 44.81 | 45.00 | 44.59 | ||||||||||||
July | 44.20 | 44.40 | 44.62 | 44.03 | ||||||||||||
August | 45.79 | 45.31 | 46.15 | 44.06 | ||||||||||||
September | 49.05 | 47.69 | 49.47 | 45.66 | ||||||||||||
October | 48.67 | 49.20 | 49.86 | 48.63 | ||||||||||||
November | 52.12 | 50.68 | 52.48 | 48.94 | ||||||||||||
December | 53.01 | 52.38 | 53.71 | 50.50 | ||||||||||||
2012 | ||||||||||||||||
January | 49.54 | 51.00 | 53.11 | 49.39 | ||||||||||||
February | 48.99 | 49.18 | 49.48 | 48.65 | ||||||||||||
March | 50.89 | 50.36 | 51.38 | 49.14 | ||||||||||||
April | 52.65 | 51.69 | 52.65 | 50.64 | ||||||||||||
May | 56.38 | 54.33 | 56.38 | 52.50 | ||||||||||||
June | 55.57 | 56.01 | 57.13 | 55.26 | ||||||||||||
July | 56.10 | 55.41 | 56.22 | 54.31 | ||||||||||||
August | 55.52 | 55.49 | 55.84 | 55.06 | ||||||||||||
September | 52.92 | 54.35 | 55.88 | 52.92 | ||||||||||||
October | 53.80 | 53.09 | 54.10 | 51.74 | ||||||||||||
Notes:
| (1) | For all dates through December 31, 2008, exchange rates between Indian rupees and U.S. dollars are presented at the noon buying rate in the City of New York for cable transfers in Indian rupees per U.S. dollars as certified for customs purposes by the Federal Reserve Bank of New York. For January 1, 2009 and all later dates and periods, the exchange rate refers to the noon buying rate as set forth in the H.10 statistical release of the U.S. Federal Reserve Board. |
| (2) | Annual averages are calculated using the average of the noon buying rates on the last business day of each month during the relevant year. Monthly averages are calculated using the average of the daily noon buying rates during the relevant month. |
52
Table of Contents
SELECTED CONSOLIDATED FINANCIAL AND OTHER DATA
The following selected consolidated statement of comprehensive income and loss data for the fiscal years 2010, 2011 and 2012, and the selected consolidated statement of financial position data as of March 31, 2010, 2011 and 2012, have been derived from our audited consolidated financial statements included elsewhere in this prospectus. The financial data set forth below should be read in conjunction with, and are qualified by reference to, “Management’s Discussion and Analysis of Financial Condition and Results of Operations” and the consolidated financial statements and notes thereto included elsewhere in this prospectus. Our consolidated financial statements are prepared and presented in accordance with IFRS as issued by the IASB. Our historical results do not necessarily indicate results expected for any future period.
These are our first consolidated financial statements prepared in accordance with IFRS as issued by the IASB. Prior to initiation of this offering, we had not prepared such consolidated financial statements. Our India-incorporated operating subsidiary prepares financial statements in accordance with Indian Generally Accepted Accounting Principles, or Indian GAAP. We have adopted IFRS as issued by the IASB with a transition date of April 1, 2009 and have prepared consolidated financial statements in accordance with IFRS as issued by the IASB with effect from that date.
| Fiscal Year | ||||||||||||
| 2010 | 2011 | 2012 | ||||||||||
| (in thousands, except per share data and number of shares) | ||||||||||||
Consolidated Statement of Comprehensive Income (Loss) Data: | ||||||||||||
Revenue from operations | $ | 14,641.7 | $ | 19,194.0 | $ | 24,457.7 | ||||||
Television | 14,641.7 | 18,842.5 | 20,494.2 | |||||||||
Internet | — | 351.5 | 3,963.5 | |||||||||
Employee benefit expense | (4,331.8 | ) | (6,250.1 | ) | (8,565.3 | ) | ||||||
Freight and collection expenses | (4,625.7 | ) | (6,614.5 | ) | (11,831.2 | ) | ||||||
Carriage fees | (4,278.6 | ) | (5,254.4 | ) | (6,196.8 | ) | ||||||
Airtime expenses | (293.2 | ) | (631.1 | ) | (264.8 | ) | ||||||
Call center expenses | (1073.4 | ) | (2,027.0 | ) | (3,378.8 | ) | ||||||
Advertisement and business promotion expenses | (2,169.5 | ) | (3,854.7 | ) | (7,440.2 | ) | ||||||
Other operating expenses | (4,488.3 | ) | (7,357.8 | ) | (8,282.0 | ) | ||||||
Depreciation and amortization | (773.6 | ) | (989.6 | ) | (1,249.7 | ) | ||||||
Finance income | 730.2 | 1,159.5 | 1,092.8 | |||||||||
Finance costs | (8,412.8 | ) | (51.0 | ) | (884.3 | ) | ||||||
Income tax expense | (2.5 | ) | (1.5 | ) | — | |||||||
|
|
|
|
|
| |||||||
Loss after tax | (15,077.4 | ) | (12,678.2 | ) | (22,542.5 | ) | ||||||
|
|
|
|
|
| |||||||
Exchange differences on translating foreign operations | 870.2 | 37.4 | (1,152.1 | ) | ||||||||
|
|
|
|
|
| |||||||
Total comprehensive loss for the year attributable to our owners | $ | (14,207.2 | ) | $ | (12,640.8 | ) | $ | (23,694.6 | ) | |||
|
|
|
|
|
| |||||||
Loss per share (basic and diluted) | $ | (0.27 | ) | $ | (0.18 | ) | $ | (0.33 | ) | |||
Weighted average number of ordinary shares outstanding (basic and diluted) | 38,339,462 | 41,923,401 | 41,923,401 | |||||||||
Pro forma loss per ordinary share (basic and diluted)(1) (unaudited) | $ | (0.24) | ||||||||||
Pro forma weighted average number of ordinary shares outstanding (basic and diluted)(1) (unaudited) | 95,282,755 | |||||||||||
Note:
| (1) | Our pro forma loss per share (basic and diluted) and pro forma weighted average number of ordinary shares outstanding (basic and diluted) have been calculated assuming that the following all occurred on a “hypothetical basis” on April 1, 2011, except for the conversion of warrants, which are given effect as of the issuance dates of the warrants during fiscal year 2012: (i) our May 2012 share capital reorganization; (ii) the |
53
Table of Contents
full funding of our partially paid warrants and the repayment of related subordinated loans from the warrant proceeds which will occur on or before the completion of this offering; (iii) the conversion of all our preference shares and warrants into 58,618,813 ordinary shares that will occur by the completion of this offering; and (iii) the issuance of 202,000 ordinary shares under options for which the exercise process, as of March 31, 2012, had been commenced but was not yet complete by that date. For more information on our share capital, including our May 2012 share capital reorganization, see “Description of Share Capital.” |
The following table sets forth a summary of our consolidated statement of financial position as of March 31, 2010, 2011 and 2012:
| Fiscal Year | ||||||||||||
| 2010 | 2011 | 2012 | ||||||||||
| (in thousands) | ||||||||||||
Consolidated Statement of Financial Position Data: | ||||||||||||
Goodwill | $ | — | $ | — | $ | 195.5 | ||||||
Other intangible assets | 67.7 | 182.6 | 234.6 | |||||||||
Property, plant and equipment | 3,485.8 | 3,986.8 | 3,130.5 | |||||||||
Security deposits | 488.6 | 511.9 | 482.7 | |||||||||
Current tax assets | 714.7 | 1,616.1 | 2,162.3 | |||||||||
Other non-current assets | 120.8 | 174.7 | 289.1 | |||||||||
Trade receivables | 893.4 | 639.1 | 1,100.3 | |||||||||
Bank deposits and short term investments | 22,302.2 | 5,900.1 | 680.2 | |||||||||
Cash and cash equivalents | 1,317.1 | 1,873.1 | 1,449.1 | |||||||||
Other current assets | 5,699.7 | 7,486.6 | 12,071.2 | |||||||||
|
|
|
|
|
| |||||||
Total assets | $ | 35,089.9 | $ | 22,371.0 | $ | 21,795.6 | ||||||
|
|
|
|
|
| |||||||
Total equity (deficit) | $ | 26,006.9 | $ | 14,721.9 | $ | (1,304.2 | )(3) | |||||
Employee benefits obligations (excluding current portion) | $ | 33.1 | $ | 62.1 | $ | 108.8 | ||||||
Loans and borrowings (excluding current portion) | 21.6 | 21.7 | — | |||||||||
Employee benefits obligations (current portion) | 103.4 | 216.0 | 251.7 | |||||||||
Trade payables | 4,642.6 | 2,669.0 | 6,264.5 | |||||||||
Loans and borrowings (current portion)(2) | 10.8 | — | 11,313.1 | |||||||||
Derivative financial liabilities(1) | — | — | 180.0 | |||||||||
Bank overdraft | 1,160.1 | 565.6 | 575.7 | |||||||||
Current tax liabilities | — | 1.5 | — | |||||||||
Other current liabilities | 3,111.3 | 4,113.2 | 4,405.9 | |||||||||
|
|
|
|
|
| |||||||
Total liabilities | 9,083.0 | 7,649.1 | 23,099.8 | |||||||||
|
|
|
|
|
| |||||||
Total equity (deficit) and liabilities | $ | 35,089.9 | $ | 22,371.0 | $ | 21,795.6 | ||||||
|
|
|
|
|
| |||||||
Notes:
| (1) | Some of the warrants issued by us are hybrid instruments with non-derivative and derivative liability components. This line item represents the derivative liability portion of the warrants as of March 31, 2012. The conversion of these warrants into ordinary shares on or before the completion of this offering will result in the derivative liability portion of the warrants moving to our equity accounts. |
| (2) | Some of the warrants issued by us are hybrid instruments with non-derivative and derivative liability components. This line item includes the non-derivative liability portion of the warrants of $0.6 million as of March 31, 2012. This line item also includes the $10.7 million liability as of March 31, 2012 of our subordinated loans that will be repaid from the proceeds of the funding of outstanding partially paid warrants, which will occur on or before the completion of this offering. The conversion of these warrants into ordinary shares on or before the completion of this offering will result in the non-derivative liability portion of the warrants moving to our equity accounts. |
54
Table of Contents
| (3) | Total equity (deficit) as of March 31, 2012 does not include the amount receivable as of March 31, 2012 to fully fund our partially paid warrants, which was $10.7 million. Our partially paid warrants will be fully funded on or before the completion of this offering. |
Other Data:
The following table sets forth for the periods indicated, certain key metrics we use to evaluate aspects of overall transaction activity in our channels and the financial performance of our business and to aid our strategic planning. For details on how these metrics are calculated, see “Management’s Discussion and Analysis of Financial Condition and Results of Operations — Key Operating Metrics.”
| Fiscal Year | ||||||||||||
| 2010 | 2011 | 2012 | ||||||||||
(in thousands, except percentages and average order values) | ||||||||||||
Consolidated: | ||||||||||||
Cumulative consumer base | 1,457.5 | 2,393.4 | 4,006.3 | |||||||||
Gross transaction value | $ | 44,186.9 | $ | 62,569.2 | $ | 108,547.0 | ||||||
Average gross commission | 33.0 | % | 30.5 | % | 22.5 | % | ||||||
Average order value | $ | 50.6 | $ | 49.3 | $ | 37.9 | ||||||
Repeat business rate | 27.5 | % | 34.9 | % | 39.9 | % | ||||||
Television: | ||||||||||||
Gross transaction value | $ | 44,186.9 | $ | 60,758.6 | $ | 77,740.3 | ||||||
Average gross commission | 33.0 | % | 30.8 | % | 26.3 | % | ||||||
Average order value | $ | 50.6 | $ | 49.5 | $ | 45.1 | ||||||
Internet: | ||||||||||||
Gross transaction value | — | $ | 1,810.6 | $ | 30,806.7 | |||||||
Average gross commission | — | 19.4 | % | 12.8 | % | |||||||
Average order value | — | $ | 44.1 | $ | 27.0 | |||||||
55
Table of Contents
MANAGEMENT’S DISCUSSION AND ANALYSIS OF FINANCIAL CONDITION
AND RESULTS OF OPERATIONS
You should read the following discussion and analysis of our financial condition and results of operations in conjunction with the section entitled “Selected Consolidated and Other Financial Data,” and our consolidated financial statements and the related notes included elsewhere in this prospectus. This discussion contains forward-looking statements and involves numerous risks and uncertainties, including, but not limited to, those described in the “Risk Factors” section of this prospectus. Actual results could differ materially from those contained in any forward-looking statements.
Overview
We operate a leading digital commerce platform in India, with the ability to access over 250 million consumers through the Internet, television and mobile devices. Since the launch of our service in 2008, we have built an end-to-end digital commerce platform providing Indian consumers access to over 500 brands. International and domestic brands such as Canon, Godrej, Micromax, Reebok, Samsung and Whirlpool are able to efficiently and effectively demonstrate, market and sell their products to consumers across India through our platform. Our multi-channel approach has allowed us to establish a trusted brand identity in the Indian market. Since our launch, over 6.5 million transactions have been executed through our platform. Our scale and distribution strategy make us an important relationship for our Sourcing Partners, providing us with the ability to showcase a broad range of products across multiple categories at competitive prices. We have developed a technology-enabled logistics network that allows our Sourcing Partners to deliver products to the consumer’s doorstep in over 3,000 towns and cities across India. We believe that our platform provides consumers with a differentiated and user-friendly experience, service and value. Through our combined web, television and mobile presence we have become one of India’s best known brands in the digital commerce industry.
Key highlights of our history are as follows:
| • | In April 2008, we launched our HomeShop18 television channel. |
| • | By October 2009, we had served over one million cumulative consumers. |
| • | By December 2010, we had served over two million cumulative consumers. |
| • | In January 2011, we launched our Internet channel. |
| • | By September 2011, we had served over three million cumulative consumers. |
| • | By January 2012, we scaled up the book catalog on our website following the Coinjoos.com acquisition in June 2011. |
| • | By March 2012, we had served over four million cumulative consumers. |
| • | In August 2012, we launched our mobile website. |
Our revenue from operations comes primarily from commissions we charge for products sold through our platform and reimbursement of some of our freight and collection expenses from certain Sourcing Partners. In addition, we receive revenue from sponsorship and subscription income, which comes from advertising and other promotional activities for third parties on our digital commerce platform. Our revenue from operations has grown from $14.6 million for fiscal year 2010 to $19.2 million for fiscal year 2011 and $24.5 million for fiscal year 2012.
We currently report our results in two business segments — (i) our television business, which includes commission income generated from our Sourcing Partners based on sales through the broadcast of our
56
Table of Contents
“HomeShop18” television channel and (ii) our Internet business, which includes commission income generated from our Sourcing Partners based on sales through our website, www.HomeShop18.com, and our mobile website, m.HomeShop18.com. The following table shows revenue by business segment and consolidated revenue from operations for the past three fiscal years:
| Fiscal Year | ||||||||||||||||||||||||
| 2010 | 2011 | 2012 | ||||||||||||||||||||||
| Revenue | Revenue | Revenue | ||||||||||||||||||||||
| (in thousands, except percentages) | ||||||||||||||||||||||||
Television | $ | 14,641.7 | 100.0 | % | $ | 18,842.5 | 98.2 | % | $ | 20,494.2 | 83.8 | % | ||||||||||||
Internet(1) | — | 0.0 | $ | 351.5 | 1.8 | $ | 3,963.5 | 16.2 | ||||||||||||||||
|
|
|
|
|
|
|
|
|
|
|
| |||||||||||||
Total | $ | 14,641.7 | 100.0 | % | $ | 19,194.0 | 100.0 | % | $ | 24,457.7 | 100.0 | % | ||||||||||||
|
|
|
|
|
|
|
|
|
|
|
| |||||||||||||
Note:
| (1) | As our Internet business was launched in January 2011, results for fiscal year 2011 include only one quarter of Internet operations while results for fiscal year 2012 include the first full year of Internet operations. |
We refer to the total value of all products sold by Sourcing Partners through our platform during a particular period, net of related returns, as gross transaction value for such period. We believe that gross transaction value is an important metric for our business as it demonstrates the overall scale of our operations. The following table shows gross transaction value by business segment and consolidated gross transaction value for the past three fiscal years:
| Fiscal Year | % Change Between Fiscal Years | |||||||||||||||||||
| 2010 | 2011 | 2012 | 2010-2011 | 2011-2012 | ||||||||||||||||
| (in thousands) | ||||||||||||||||||||
Television | $ | 44,186.9 | $ | 60,758.6 | $ | 77,740.3 | 37.5 | 27.9 | ||||||||||||
Internet(1) | — | $ | 1,810.6 | $ | 30,806.7 | — | NM | |||||||||||||
|
|
|
|
|
| |||||||||||||||
Consolidated gross transaction value | $ | 44,186.9 | $ | 62,569.2 | $ | 108,547.0 | 41.6 | 73.5 | ||||||||||||
|
|
|
|
|
| |||||||||||||||
Note:
| (1) | As our Internet business was launched in January 2011, results for fiscal year 2011 include only one quarter of Internet operations while results for fiscal year 2012 include the first full year of Internet operations. Where a figure is not meaningful as a result of limited period of operations, we have replaced the figure in the table with “NM” for not meaningful. |
The following table shows the contribution of our television channel and website to gross transaction value over the past three fiscal years:
| Fiscal Year | ||||||||||||
| 2010 | 2011 | 2012 | ||||||||||
| Gross Transaction Value | Gross Transaction Value(1) | Gross Transaction Value(1) | ||||||||||
Television | 100.0 | % | 97.1 | % | 71.6 | % | ||||||
Internet(1) | 0.0 | 2.9 | 28.4 | |||||||||
Note:
| (1) | Our Internet business was launched in January 2011 and results for fiscal year 2011 include one quarter of Internet operations while results for fiscal year 2012 include results for the first full year of Internet operations. |
57
Table of Contents
Consumer Cohort Analysis
To analyze progress in executing our growth strategy, we compile certain financial and operating data regarding digital and non-digital products sold through our platform. Digital products comprise mobile phones, cameras, computers and electronics that generally yield lower margins but that have helped us to attract new consumers to our platform. This is because digital products are usually standardized products that do not require a physical “see or touch” experience to enable a purchase decision by a consumer. Non-digital products comprise all other products sold through our platform, including but not limited to apparel, jewelry, home & kitchen and appliances, which often yield higher margins.
We believe an important gauge for measuring our success in migrating consumers from lower margin digital products to higher margin non-digital products is quarterly cohort analysis. A “cohort” for a given quarter consists of the new consumers that have executed transactions with us in that quarter. Based on their phone numbers (in the case of call center orders) and email addresses (in the case of orders placed over the Internet), consumers in these cohorts are tracked by us over subsequent quarters to study the nature of their repeat business with us.
Based on our cohort analysis, we believe that we have succeeded in driving repeat consumer interest to our platform and have leveraged this interest to migrate consumers to products with higher margins. As we continue to attract new consumers to our platform, we believe they will follow a similar pattern as in the past, transitioning their purchases over time to include more non-digital products. However, the behavior of consumers in past cohorts is not necessarily indicative of the behavior of consumers in future cohorts.
The graphs below depict cohort trends beginning with the consumer cohort for the fourth quarter of fiscal year 2011 (the first quarter that had results for both television and Internet). The graphs split total value of orders (which is equivalent to gross transaction value without netting off returns or cancellation of orders) attributable to a particular consumer cohort between digital and non-digital products, for both the quarter in which we believe consumers in this cohort first placed an order through us and the first quarter of fiscal year 2013, which is our most recently completed quarter:
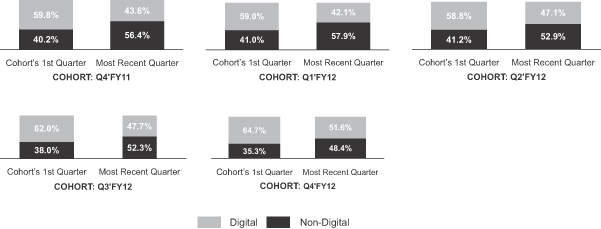
Key Operating Metrics
We regularly review a number of key metrics, including those described below, to evaluate aspects of overall transaction activity of our channels and the financial performance of our business and to aid our strategic planning. Please note that the definitions we employ may differ from definitions used by other companies, including those in the digital commerce industry.
58
Table of Contents
Cumulative consumer base is the aggregation of all unique caller phone numbers for call center orders and unique email addresses for orders that have been placed through our platform. We view cumulative consumer base as an indicator for our overall consumer reach, our penetration of the Indian consumer market and the target consumer base for various targeted promotions aimed at generating repeat orders.
Gross transaction valuerefers to the total value of all products sold by Sourcing Partners through our platform during the relevant period, net of related returns. Related returns are only measured in the relevant period, so that subsequent returns are not netted against gross transaction value. However, based on historical subsequent return experience, we charge a provision for estimated future returns against gross transaction value. We believe gross transaction value is an important measure in addition to revenue from operations as it is indicative of the overall scale of our operations.
Average gross commissionrefers to the sum of our revenue from commissions and reimbursement of freight and collection expenses as a percentage of gross transaction value for the relevant period. We believe that average gross commission is an important indicator as it serves as a proxy for gross margin in our business, reflecting the impact of product mix, pricing ability and sourcing scale in our business as well as overall pricing trends.
Average order value is obtained by dividing gross transaction value by the corresponding number of orders executed through our platform in the relevant period. We monitor our average order value as it is an important indicator relating to product mix as well as order profitability.
Repeat business rate refers to the total value of orders (which is equivalent to gross transaction value without netting out returns or cancellation of orders) placed by consumers through our platform in a relevant period who also placed at least one order in the prior 12-month period, expressed as a percentage of the total value of orders placed through our platform during the same relevant period. Our repeat business rate provides us with an indication for overall customer satisfaction as well as lifetime value of the consumer.
Unique visitors to our website refers to the average number of monthly unique visitors over a given three-month period. We define monthly unique visitors as the total number of unique visitors who have visited our website at least once in a given month, and we average the number of monthly unique visitors in each month of a given three-month period to calculate average monthly unique visitors. We track unique visitors based on the number of visitors with unique cookies who have visited our website, as measured by Google Analytics, a service offered by Google Inc. that provides digital marketing intelligence. We view unique visitors as a key indicator of our brand awareness among consumers and whether we are providing consumers with useful services and features, thereby increasing their usage of our platform.
Please see “Selected Consolidated Financial and Other Data” and “— Quarterly Financial Information” for annual and quarterly figures for these metrics.
General Factors Affecting Our Results of Operations
Developments in the Indian Economy and with Indian Policies
Our business and operating results are affected by general economic factors in India, including economic growth, per capita disposable income and consumer discretionary spending, growth of Internet penetration and digital commerce, and government policies and initiatives affecting the retail industry. Our business strategy and planning are premised on continued favorable economic and industry trends. Indian economic growth has slowed considerably in the past year, which has dampened consumer discretionary spending. However, we believe the underlying trends of growing urbanization and strong growth in consumer discretionary spending remain in place.
59
Table of Contents
U.S. Dollar-Indian Rupee Exchange Rate
The currency of presentation of our financial statements is the U.S. dollar. However, the functional currency of our operating subsidiary is the Indian rupee, as our business is situated in India.We receive our revenue in Indian rupees and substantially all of our costs are borne in Indian rupees. Substantially all of our assets and liabilities are also denominated in Indian rupees. Transactions in currencies other than the U.S. dollar are translated at the exchange rate prevailing at the date of the transaction. Monetary assets and liabilities in currencies other than the U.S. dollar are translated into U.S. dollars at the exchange rates at the applicable
balance sheet date. Foreign exchange gains and losses resulting from the settlement of transactions and from the remeasurement of monetary items at year-end exchange rates are recognized in the profit or loss of the period in which they arise. For the purposes of consolidation, all income and expenses are translated at the average rate of exchange during the period covered by the applicable statement of income and assets and liabilities are translated at the exchange rate prevailing on the balance sheet date. When the U.S. dollar strengthens against the Indian rupee, our revenue and costs in Indian rupees converted to U.S. dollars decreases. When the U.S. dollar weakens, our revenue and costs in Indian rupees converted to U.S. dollars increases.
Recently, there have been periods of higher volatility in the Indian rupee and U.S. dollar exchange rate. In fiscal year 2012, the average value of the rupee depreciated 5.3% against the dollar vis-a-vis the average value of the rupee in fiscal year 2011. This volatility is illustrated in the table below for the periods indicated:
Fiscal Year | Period End | Average(1) | High | Low | ||||||||||||
| (Rs. per $1.00) | ||||||||||||||||
2010 | 45.14 | 47.36 | 50.48 | 44.94 | ||||||||||||
2011 | 44.65 | 45.59 | 47.49 | 43.90 | ||||||||||||
2012 | 51.16 | 48.12 | 53.71 | 44.00 | ||||||||||||
Note:
| (1) | Represents the average of the exchange rates on the last day of each month during each period presented. |
The following table shows the percentage changes in revenue from operations, operating expenses and loss after tax between fiscal year 2010 and fiscal year 2011 and between fiscal year 2011 and fiscal year 2012, based on the U.S. dollar results as reported in our financial statements as well as on the underlying rupee amounts:
| % Change Between Fiscal Years | ||||||||||||||||
| 2010-2011 | 2011-2012 | |||||||||||||||
(Dollar | (Rupee | (Dollar | (Rupee | |||||||||||||
Revenue from operations | 31.1 | % | 26.2 | % | 27.4 | % | 34.5 | % | ||||||||
Operating expenses | 50.5 | 44.8 | 43.7 | 51.6 | ||||||||||||
Loss after tax | (15.9 | ) | (19.1 | ) | 77.8 | 87.7 | ||||||||||
In addition to the impact on loss after tax, the volatility during fiscal year 2012 also led to a foreign exchange translation adjustment that increased our comprehensive loss in fiscal year 2012 by $1.2 million. For further information on changes in the underlying rupee value of our income statement line items, see “— Results of Operations” below.
All of the net proceeds we receive from this offering will be in U.S. dollars. We expect to convert a substantial amount of these net proceeds into Indian rupees. An appreciation of the Indian rupee against the U.S. dollar between the time we receive the dollar net proceeds and when we convert them into rupees will reduce the total value of the offering to us. See “Risk Factors — Risks Related to Us and Our Industry — Our results of operations are subject to fluctuations in currency exchange rates.”
60
Table of Contents
Competitive Forces
Digital commerce is intensely competitive and rapidly changing and competition is likely to intensify even further in the future. Our business faces direct competition from other product distribution and retail channels, including television shopping companies, other digital commerce companies as well as physical stores and outlets. Some of our competitors may be better financed and willing to use their funds to drive down prices and margins. We believe competitive forces have a significant impact on consumer demand and pricing of products. This can adversely impact our access to products from Sourcing Partners, commission rates offered by them and certain operating costs.
Company-specific Factors Affecting Our Results of Operations
Gross Commissions
Both the commission rates for products sold through our platform and the reimbursements of freight and collection expenses are set through individual negotiations with Sourcing Partners, often on a product-by-product basis, and hence vary over time and may include full or partial reimbursements of our actual freight and collection expenses. The commission rates on products and reimbursements of freight and collection expenses we are able to negotiate with our Sourcing Partners, and ultimately our gross commissions, depend on a number of factors, including the reach of our platform, coverage of our logistics network, as well as the product category and brands that our Sourcing Partners showcase on our platform. The table below sets forth the average gross commission rates on all products, broken down by business segment, for the past three fiscal years:
| Fiscal Year | ||||||||||||
| 2010 | 2011 | 2012 | ||||||||||
Television | 33.0 | % | 30.8 | % | 26.3 | % | ||||||
Internet | — | 19.4 | 12.8 | |||||||||
We typically enter into framework agreements with our Sourcing Partners under which we agree to showcase their products on our platform in exchange for a commission. To date, we have not entered into contracts with our Sourcing Partners that guarantee the availability of merchandise with them or that obligate us to purchase or offer merchandise on a long-term or short-term basis. These contracts are generally terminable by us upon 30 days’ notice.
We source products showcased on our platform from over 450 Sourcing Partners across India. For fiscal years 2010, 2011 and 2012, our top 10 Sourcing Partners accounted for approximately 59.1%, 65.8% and 77.4%, respectively, of our gross transaction value. For those years, the number of Sourcing Partners that each accounted for over 5% of our gross transaction value was three, five, and two, respectively. For fiscal years, 2010, 2011 and 2012, North India Top Company Private Limited, or North India Top, accounted for 1.0%, 23.4% and 47.6% of our gross transaction value, respectively. We attribute this increased concentration among Sourcing Partners to the success of a few companies such as North India Top in achieving economies and other benefits of scale and in developing high quality information technology and other infrastructure to support their operations and our platform. These attributes may also give them a competitive advantage in the Indian market, which continues to suffer from a lack of large organized vendors and infrastructure constraints. Although a larger portion of our gross transaction value has come from our top Sourcing Partners, this trend has not had an adverse impact on our average gross commissions, and given the competitive nature of the Indian market, we currently do not expect such concentration to adversely impact our margins. However, it is possible that one or more of our larger Sourcing Partners could experience financial difficulties, including bankruptcy, or otherwise could elect to cease doing business with us. If a number of our larger Sourcing Partners ceased doing business with us, this could materially and adversely impact our revenue and profitability.
61
Table of Contents
Share-Based Payment Expenses
Under our share option plan, we have granted share options to certain of our executive officers and other employees. For fiscal years 2010, 2011 and 2012, we granted a total of 98,000, 619,000 and 45,000 share options under our share option plan, respectively, and the fair value of the grants in those years (measured as of grant date) amounted to $0.1 million, $1.2 million and $0.1 million, respectively. In August 2012 our board of directors adopted a stock appreciation rights scheme. In November 2012, we granted a total of 2,260,000 stock appreciation rights to certain executive officers and other employees under this scheme, and the fair value of these stock appreciation rights (measured as of grant date) amounted to $2.7 million. We may continue to make option and other share-based compensation grants in the future, either through the existing plans or new ones.
The fair value of these grants is expensed over the vesting period of the grants. For fiscal years 2010, 2011 and 2012, these expenses amounted to $0.9 million, $1.4 million and $0.6 million, respectively. With respect to option grants made on or prior to March 31, 2012, a total of $0.2 million in expense remains to be charged in accordance with the vesting schedule for those options. We expect to record total compensation expense for the November 2012 stock appreciation rights grants of $1.7 million. For more information on our fair value accounting of these share options and stock appreciation rights, see “— Critical Accounting Policies — Share-Based Employee Remuneration” and note 17.1 to our consolidated financial statements appearing elsewhere in this prospectus.
The “intrinsic value” of an option or stock appreciation right is the amount by which the value of the share or shares underlying the option or right exceeds the exercise price of the option or right. When measured against the initial public offering price range of $ to $ per share, the intrinsic value of all outstanding vested share options outstanding as of March 31, 2012 would be between $ and $ , and the intrinsic value of all outstanding unvested options as of that date would be between $ and $ ; the intrinsic value of all outstanding vested stock appreciation rights would be between $ and $ , and the intrinsic value of all outstanding unvested stock appreciation rights would be between $ and $ .
A change in the accounting treatment of our stock appreciation rights may have the effect of increasing the volatility of our earnings and may result in significant additional charges for grants made prior to the listing of our ordinary shares. See “Risk Factors — Risks Related to Us and Our Industry” for more information.
Cost of Delivery
We currently bear most of the costs of shipping products to consumers, although we also receive reimbursements of freight and collection expenses from certain Sourcing Partners. Freight and collection expenses have been increasing, primarily on account of growth in transactions executed through our platform and also in part due to the rise in global fuel prices.
COD transactions, which comprised 87.4%, 88.5% and 85.8% of our total transactions in fiscal years 2010, 2011 and 2012, respectively, are typically costlier to us than non-COD transactions in which payments are made directly to us. Freight and collection expenses can be higher in COD transactions as a result of the significantly higher risk of return. COD transactions also entail higher working capital costs and expose us to credit and other risks of our courier companies and their collection agents.
Income Taxation
As we are loss-making, our income tax expense to date has been negligible, and we expect this to be the case so long as we continue to be loss-making. We have not recognized deferred tax assets on our tax losses because, as of March 31, 2012, we concluded, based on our latest approved budget forecast, that it was not probable that future taxable profit will be available against which we can utilize the benefits of such tax losses.
62
Table of Contents
Components of Expenses
Operating Expenses
The following items comprise the components of our expenses:
| • | Employee benefits expense. Employee benefits expense includes salaries, wages, allowances, bonuses, share-based payment expenses, staff welfare expenses and expenses related to employee benefit plans. |
| • | Freight and collection expenses.Freight and collection expenses include the amounts payable to courier companies for delivery (including returns) and (in the case of COD sales) payment collection services for products sold through our platform. Freight and collection expenses also include payment gateway charges, toll and state entry charges and packing and forwarding expenses. |
| • | Carriage fees. We pay DTH and cable television operators to carry our television channel. We pay either a flat fee or, in some cases with DTH operators, the greater of a minimum fee or a commission, which is based on a percentage of the revenue generated and realized by us on products sold through our platform to the carrier’s subscriber base. Our distribution and affiliation agreements in effect as of March 31, 2012 generally had terms of one to three years. |
| • | Airtime charges. In addition to our own television channel, we air television programs on other television channels. Airtime charges consist of fees paid to these television channels for showing our programs. |
| • | Call center expenses.Call center expenses have comprised largely of payments made under outsourcing agreements to third parties and managerial staff employed by us to manage third parties to whom we have outsourced call center operations. Some third parties operate out of facilities rented and maintained by us. We are in the process of shifting to a new facility to provide for future requirements. |
| • | Advertisement and business promotion expenses. Advertisement and business promotion expenses include search engine marketing costs, redemptions of gift coupons that we issue to consumers from time to time as part of our promotional activities, and advertising and other costs associated with building our brand. |
| • | Other operating expenses. The significant components of other operating expenses include various production and programming costs associated with our television programs, as well as more general expenses such as rent, rates and taxes; communication expenses; travelling and conveyance; and repairs and maintenance. |
| • | Depreciation and amortization. Depreciation and amortization expenses are taken against property, plant and equipment and intangible assets. Property, plant and equipment consist of leasehold improvements; information technology and office equipment; plant and machinery and electrical installations; furniture and fixtures; and vehicles. Our amortizable intangible assets consist of computer software. |
Other Expenses, Income
| • | Finance income and finance costs. Finance income consists of interest income from bank deposits and other financial assets, as well as gains from fair valuation of assets classified as held for trading. Finance costs consists of interest expenses for borrowings and defined benefit obligations and bank charges. Finance costs for fiscal year 2010 included the change in the fair value of our preference shares as a result of the change that year of the conversion rate formula for the conversion of our Class B preference shares from a variable to a fixed rate. |
| • | Income tax expense. Income tax expense comprises current tax and deferred tax. |
63
Table of Contents
Results of Operations
The following tables set forth a summary of our consolidated results of operations, as well as consolidated gross transaction value, for the periods indicated. This information should be read together with our consolidated financial statements and related notes included elsewhere in this prospectus. The results of operations in any period are not necessarily indicative of the results that may be expected for any future period.
The first table below sets forth results of operations data, as well as consolidated gross transaction value, on an actual basis. This table also shows the year-to-year percentage increase in this data, based on the U.S. dollar results as reported in our financial statements as well as based on the underlying rupee amounts that eliminates the impact of exchange rate volatility:
| Fiscal Year | % Increase Between Fiscal Years(3) | |||||||||||||||||||||||||||
| 2010 | 2011 | 2012 | 2010-2011 | 2011-2012 | ||||||||||||||||||||||||
| (in thousands) | (dollar based) | (rupee based) | (dollar based) | (rupee based) | ||||||||||||||||||||||||
Gross transaction value | $ | 44,186.9 | $ | 62,569.2 | $ | 108,547.0 | 41.6 | % | 36.3 | % | 73.5 | % | 83.1 | % | ||||||||||||||
Revenue from operations | 14,641.7 | 19,194.0 | 24,457.7 | 31.1 | 26.2 | 27.4 | 34.5 | |||||||||||||||||||||
Television | 14,641.7 | 18,842.5 | 20,494.2 | 28.7 | 23.9 | 8.8 | 14.8 | |||||||||||||||||||||
Internet(2) | — | 351.5 | 3,963.5 | — | NM | NM | ||||||||||||||||||||||
Employee benefit expense | (4,331.8 | ) | (6,250.1 | ) | (8,565.3 | ) | 44.3 | 38.9 | 37.0 | 44.6 | ||||||||||||||||||
Freight and collection expenses | (4,625.7 | ) | (6,614.5 | ) | (11,831.2 | ) | 43.0 | 37.7 | 78.9 | 88.8 | ||||||||||||||||||
Carriage fees | (4,278.6 | ) | (5,254.4 | ) | (6,196.8 | ) | 22.8 | 18.2 | 17.9 | 24.5 | ||||||||||||||||||
Airtime expenses | (293.2 | ) | (631.1 | ) | (264.8 | ) | 115.3 | 107.2 | (58.0 | ) | (55.7 | ) | ||||||||||||||||
Call center expenses | (1,073.4 | ) | (2,027.0 | ) | (3,378.8 | ) | 88.8 | 81.8 | 66.7 | 75.9 | ||||||||||||||||||
Advertisement and business promotion expenses | (2,169.5 | ) | (3,854.7 | ) | (7,440.2 | ) | 77.7 | 71.0 | 93.0 | 103.7 | ||||||||||||||||||
Other operating expenses | (4,488.3 | ) | (7,357.8 | ) | (8,282.0 | ) | 63.9 | 57.8 | 12.6 | 18.8 | ||||||||||||||||||
Depreciation and amortization | (773.6 | ) | (989.6 | ) | (1,249.7 | ) | 27.9 | 23.2 | 26.3 | 33.3 | ||||||||||||||||||
Finance income | 730.2 | 1,159.5 | 1,092.8 | 58.8 | 52.9 | (5.8 | ) | (0.5 | ) | |||||||||||||||||||
Finance costs | (8,412.8 | ) | (51.0 | ) | (884.3 | ) | (99.4 | ) | (99.4 | ) | 1,633.1 | 1,729.2 | ||||||||||||||||
Income tax expense | (2.5 | ) | (1.5 | ) | 0.0 | (40.2 | ) | (42.4 | ) | (100.0 | ) | (100.0 | ) | |||||||||||||||
|
|
|
|
|
| |||||||||||||||||||||||
Loss after tax | $ | (15,077.4 | ) | $ | (12,678.2 | ) | $ | (22,542.5 | ) | (15.9 | ) | (19.1 | ) | 77.8 | 87.7 | |||||||||||||
|
|
|
|
|
| |||||||||||||||||||||||
Notes:
| (1) | As our Internet business was launched in January 2011, results for fiscal year 2011 include only one quarter of Internet operations while results for fiscal year 2012 include the first full year of Internet operations. Where a figure is not meaningful as a result of limited period of operations, we have replaced the figure in the table with “NM” for not meaningful. |
| (2) | The percentage increase figures in Indian rupees are based on the underlying rupee figures for the various line items in our results of operations, as well as gross transaction value, for the past three fiscal years. These rupee figures are calculated from the dollar figures by multiplying each corresponding U.S. dollar line item by the average rupee/dollar exchange rate for the relevant fiscal year. We believe that the rupee percentage increase figures are useful in showing organic trends in our results of operations, as well as gross transaction value, across the past three fiscal years, as sales through our platform are denominated in Indian rupees, we receive all our revenue in Indian rupees and substantially all of our costs are denominated in Indian rupees. The rupee percentage increase figures, however, do not reflect the impact of changes in the rupee/dollar exchange rate. See “— General Factors Affecting Our Results of Operations — U.S. Dollar-Indian Rupee Exchange Rate” above for the average rupee/dollar exchange rates for the past three fiscal years and for more information regarding the implications of volatility in the exchange rate between the U.S. dollar and Indian rupee on our financial results. |
64
Table of Contents
The following table sets forth results of operation data as a percentage of revenue from operations:
| Fiscal Year | ||||||||||||
| 2010 | 2011 | 2012 | ||||||||||
Revenue from operations | 100.0 | % | 100.0 | % | 100.0 | % | ||||||
Television | 100.0 | 98.2 | 83.8 | |||||||||
Internet | — | 1.8 | 16.2 | |||||||||
Employee benefit expense | (29.6 | ) | (32.6 | ) | (35.0 | ) | ||||||
Freight and collection expenses | (31.6 | ) | (34.5 | ) | (48.4 | ) | ||||||
Carriage fees | (29.2 | ) | (27.4 | ) | (25.3 | ) | ||||||
Airtime expenses | (2.0 | ) | (3.3 | ) | (1.1 | ) | ||||||
Call center expenses | (7.3 | ) | (10.6 | ) | (13.8 | ) | ||||||
Advertisement and business promotion expenses | (14.8 | ) | (20.1 | ) | (30.4 | ) | ||||||
Other operating expenses | (30.7 | ) | (38.3 | ) | (33.9 | ) | ||||||
Depreciation and amortization | (5.3 | ) | (5.2 | ) | (5.1 | ) | ||||||
Finance income | 5.0 | 6.0 | 4.5 | |||||||||
Finance costs | (57.5 | ) | (0.3 | ) | (3.6 | ) | ||||||
Income tax expense | (0.0 | ) | (0.0 | ) | — | |||||||
|
|
|
|
|
| |||||||
Loss after tax | (103.0 | )% | (66.1 | )% | (92.2 | )% | ||||||
|
|
|
|
|
| |||||||
Fiscal Year 2012 Compared to Fiscal Year 2011
Revenue from operations. Revenue from operations reached $24.5 million in fiscal year 2012 on gross transaction value of $108.5 million, compared to revenue of $19.2 million in fiscal year 2011 on gross transaction value of $62.6 million, an increase of 27.4% for revenue and 73.5% for gross transaction value. In rupee terms, the increase in our revenue was 34.5% in this period, and the increase in gross transaction value was 83.1%.
Most of this revenue growth and gross transaction value growth was attributable to growth in our Internet business, which recorded revenue of $4.0 million on gross transaction value of $30.8 million in fiscal year 2012, compared with revenue of $0.4 million on gross transaction value of $1.8 million in fiscal year 2011. Much of the growth in our Internet business reflected the fact that fiscal year 2012 was the first year with a full year of activity, compared with only a single quarter of activity in fiscal year 2011 as our Internet business commenced only in January 2011. Revenue and gross transaction value from our television business reached $20.5 million and $77.7 million, respectively in fiscal year 2012, compared to $18.8 million and $60.8 million, respectively, in fiscal year 2011, driven largely by growth in purchases for lifestyle products including apparel and jewelry. The growth in both of our business segments also reflected the growing acceptance of our platform, which has been driving growth in the consumer base, and transactions executed through our platform. The reimbursement of freight and collection expenses by our Sourcing Partners as a percentage of our revenue decreased from 28.4% in fiscal year 2011 to 23.9% in fiscal year 2012 as a result of increased competition and various factors that affect our negotiations with our Sourcing Partners, including the reach of our platform, coverage of our logistics network, as well as the product categories and brands that our Sourcing Partners showcase on our platform.
The higher rate of increase in gross transaction value as compared to revenue from operations was due to lower gross commission rates for our Internet business, which faces greater competition and which had its first full year of operations in fiscal year 2012.
Operating expenses. Our operating expenses have grown principally as a result of the following factors:
| • | A 37.0% increase in our employee benefit expense from $6.3 million in fiscal year 2011 to $8.6 million in fiscal year 2012. The increase is principally due to the growth in the total number of our employees |
65
Table of Contents
from 293 to 354 and a 67.0% increase in salaries, wages allowances and bonuses from $4.4 million to $7.3 million. |
| • | A 78.9% increase in freight and collection expenses from $6.6 million in fiscal year 2011 to $11.8 million in fiscal year 2012, principally due to growth in the number of transactions executed through our platform and higher fuel costs. |
| • | A 17.9% increase in our carriage fees expense from $5.3 million in fiscal year 2011 to $6.2 million in fiscal year 2012, principally due to higher payments to existing DTH operators and the addition of new DTH operators. |
| • | A 66.7% increase in our call center expense from $2.0 million in fiscal year 2011 to $3.4 million in fiscal year 2012, principally due to higher call volumes arising from an increase in the number of transactions executed through our platform. |
| • | A 93.0% increase in our advertisement and business promotion expenses from $3.9 million in fiscal year 2011 to $7.4 million in fiscal year 2012, primarily reflecting a full year of expenses incurred in operating our Internet business, including for driving traffic from search engines to our website and higher redemption costs of gift coupons. |
| • | A 12.6% increase in our other operating expenses from $7.4 million in fiscal year 2011 to $8.3 million in fiscal year 2012, principally due to expenses associated with the expansion of our Bengaluru (formerly Bangalore) office to accommodate our Internet business. |
Other expenses, income. We had other income of $0.2 million in fiscal year 2012, compared to other income of $1.1 million in fiscal year 2011. The change was largely attributable to lower interest income on bank deposits in fiscal year 2011, reflecting our significantly higher average cash position in fiscal year 2011. For fiscal year 2012, much of our interest income was attributable to amounts accruing under the partially paid warrants issued to our existing Network18 affiliated shareholder, and much of our interest expense for that fiscal year was attributable to amounts accruing under related subordinated loans extended to us by Network18. These amounts, and the underlying obligations, are roughly equal, and all amounts payable to us under the partially paid warrants and all amounts payable by us under the subordinated loans will be settled at or prior to the completion of this offering. See “Description of Share Capital — History of Share Issuances — Warrants and Related Subordinated Loans.”
Loss after tax. Given our expenses increased more than our revenues in fiscal year 2012 compared to fiscal year 2011, loss after tax increased by 77.8% to $22.5 million in fiscal year 2012 from $12.7 million in fiscal year 2011. In rupee terms, our loss after tax increased by 87.7% in this period.
Fiscal Year 2011 Compared to Fiscal Year 2010
Revenue from operations. Revenue from operations reached $19.2 million in fiscal year 2011 on gross transaction value of $62.6 million, compared to revenue of $14.6 million in fiscal year 2010 on gross transaction value of $44.2 million, an increase of 31.1% for revenue and 41.6% for gross transaction value.
Most of this revenue and gross transaction value growth was attributable to growth in our television business, which recorded revenue of $18.8 million on gross transaction value of $60.8 million in fiscal year 2011, compared with revenue of $14.6 million on gross transaction value of $44.2 million in fiscal year 2010. Revenue and gross transaction value for the period were supplemented by a quarter of results from our Internet business that commenced only in January 2011. In fiscal year 2011, revenue and gross transaction value from our Internet business were $0.4 million and $1.8 million, respectively. The growth in revenue and gross transaction value reflected our growing consumer base and growth in the number of transactions executed through our platform. The reimbursement of freight and collection expenses by our Sourcing Partners as a percentage of our revenue increased from 26.6% in fiscal year 2010 to 28.4% in fiscal year 2011 as a result of various factors that affect our
66
Table of Contents
negotiations with our Sourcing Partners, including the reach of our platform, coverage of our logistics network, as well as the product categories and brands that our Sourcing Partners showcase on our platform.
The higher rate of increase in gross transaction value as compared to revenue from operations was due to lower gross commission rates for our Internet business, which faces greater competition.
Operating expenses. Our operating expenses have grown principally as a result of the following factors:
| • | A 44.3% increase in our employee benefit expense from $4.3 million in fiscal year 2010 to $6.3 million in fiscal year 2011, principally due to the growth in the total number of our employees from 191 to 293. |
| • | A 43.0% increase in our freight and collection expenses from $4.6 million in fiscal year 2010 to $6.6 million in fiscal year 2011, principally due to an increase in the number of transactions executed through our platform and an increase in fuel costs. |
| • | A 22.8% increase in our carriage fees expense from $4.3 million in fiscal year 2010 to $5.3 million in fiscal year 2011, principally due to the full-year impact in fiscal year 2011 of the addition of new DTH operators in the second half of fiscal year 2010. |
| • | A 88.8% increase in our call center charges to $2.0 million in fiscal year 2011 from $1.1 million in fiscal year 2010, reflecting growth in call volumes due to an increase in the reach of our platform and in the number of transactions executed through our platform, as well as the introduction of call center services for our Internet channel. |
| • | A 77.7% increase in our advertisement and business promotion expenses from $2.2 million in fiscal year 2010 to $3.9 million in fiscal year 2011, mainly due to higher redemption costs of gift coupons and expenses associated with the promotion of our Internet channel. |
| • | A 63.9% increase in other operating expenses from $4.5 million in fiscal year 2010 to $7.4 million in fiscal year 2011. The main drivers of this growth were an increase in various professional and administrative cost items, reflecting the build-up in our scale for the launch of our Internet business. There was a 54.4% increase in rent, rate and taxes from $0.9 million in fiscal year 2010 to $1.5 million in fiscal year 2011. |
Other expenses, income. We had other income of $1.1 million in fiscal year 2011, compared to other expenses of $7.7 million in fiscal year 2010. The change was principally attributable to change in the conversion rate formula for our Class B preference shares from a variable to a fixed rate during fiscal year 2010. In connection with this conversion rate change, we recorded a non-cash charge of $4.8 million reflecting the change in the fair value of the derivative component of these preference shares as a result of the change in conversion rate. In addition, the Class B preference shares had been bearing an interest expense accrual ($3.2 million in fiscal year 2010), which was terminated at the time the conversion rate was changed.
Loss after tax. Given our revenues increased more than our expenses in fiscal year 2011 compared to fiscal year 2010, loss after tax decreased by 15.9% to $12.7 million in fiscal year 2011 from $15.1 million in fiscal year 2010. In rupee terms, our loss after tax decreased by 19.1% in this period.
Quarterly Financial Information
The tables below set forth a summary of our unaudited quarterly results of operations for the eight quarters in the period ended March 31, 2012. This information should be read together with our consolidated financial statements and related notes included elsewhere in this prospectus. We have prepared the unaudited financial data for the quarters presented on the same basis as our audited consolidated financial statements. We have included, in our opinion, all adjustments, consisting only of normal recurring adjustments, which we consider necessary for a fair presentation of the financial information set forth in those statements. These quarterly results are not necessarily indicative of the results that may be expected for a full year or for any future quarters.
67
Table of Contents
The following table contains consolidated statement of comprehensive income (loss) data for the eight quarters in the period ended March 31, 2012:
| Three Months Ended | ||||||||||||||||||||||||||||||||
| June 30, 2010 | September 30, 2010 | December 31, 2010 | March 31, 2011 | June 30, 2011 | September 30, 2011 | December 31, 2011 | March 31, 2012 | |||||||||||||||||||||||||
| (unaudited) | (unaudited) | (unaudited) | (unaudited) | (unaudited) | (unaudited) | (unaudited) | (unaudited) | |||||||||||||||||||||||||
| (in thousands, except per share data) | ||||||||||||||||||||||||||||||||
Revenue from operations | $ | 4,572.5 | $ | 4,926.5 | $ | 5,252.1 | $ | 4,442.9 | $ | 5,459.9 | $ | 6,288.5 | $ | 5,981.5 | $ | 6,727.7 | ||||||||||||||||
Television | 4,572.5 | 4,926.5 | 5,252.1 | 4,091.5 | 4,820.6 | 5,372.6 | 4,927.5 | 5,373.6 | ||||||||||||||||||||||||
Internet | — | — | — | 351.5 | 639.3 | 915.9 | 1,054.1 | 1,354.2 | ||||||||||||||||||||||||
Employee benefit expense | (890.7 | ) | (1,187.0 | ) | (2,503.9 | ) | (1,668.4 | ) | (1,822.5 | ) | (2,644.0 | ) | (2,090.2 | ) | (2,008.6 | ) | ||||||||||||||||
Freight and collection expenses | (1,507.7 | ) | (1,336.2 | ) | (1,947.2 | ) | (1,823.4 | ) | (2,368.4 | ) | (3,092.2 | ) | (2,938.4 | ) | (3,432.2 | ) | ||||||||||||||||
Carriage fees | (1,219.0 | ) | (1,236.5 | ) | (1,498.7 | ) | (1,300.3 | ) | (1,578.9 | ) | (1,785.0 | ) | (1,436.1 | ) | (1,396.7 | ) | ||||||||||||||||
Airtime expenses | (189.8 | ) | (166.2 | ) | (137.4 | ) | (137.6 | ) | (65.2 | ) | (87.4 | ) | (9.7 | ) | (102.5 | ) | ||||||||||||||||
Call center expenses | (366.7 | ) | (536.8 | ) | (474.3 | ) | (649.2 | ) | (861.9 | ) | (872.2 | ) | (827.1 | ) | (817.6 | ) | ||||||||||||||||
Advertisement and business promotion expenses | (496.8 | ) | (628.2 | ) | (790.5 | ) | (1,939.2 | ) | (1,679.1 | ) | (2,264.4 | ) | (2,056.9 | ) | (1,439.7 | ) | ||||||||||||||||
Other operating expenses | (1,539.2 | ) | (1,802.4 | ) | (1,849.2 | ) | (2,167.0 | ) | (1,923.0 | ) | (2,133.1 | ) | (1,979.5 | ) | (2,246.4 | ) | ||||||||||||||||
Depreciation and amortization | (217.3 | ) | (243.7 | ) | (260.1 | ) | (268.5 | ) | (309.5 | ) | (313.9 | ) | (305.1 | ) | (321.2 | ) | ||||||||||||||||
Finance income | 365.9 | 313.1 | 270.0 | 210.5 | 150.4 | 257.1 | 370.2 | 315.0 | ||||||||||||||||||||||||
Finance costs | (5.0 | ) | (18.1 | ) | (1.2 | ) | (26.7 | ) | (12.8 | ) | (226.1 | ) | (268.5 | ) | (376.9 | ) | ||||||||||||||||
Income tax expense | — | — | (1.2 | ) | (0.3 | ) | — | — | — | — | ||||||||||||||||||||||
|
|
|
|
|
|
|
|
|
|
|
|
|
|
|
| |||||||||||||||||
Loss after tax | (1,493.9 | ) | (1,915.6 | ) | (3,941.5 | ) | (5,327.1 | ) | (5,011.0 | ) | (6,872.8 | ) | (5,559.7 | ) | (5,099.0 | ) | ||||||||||||||||
|
|
|
|
|
|
|
|
|
|
|
|
|
|
|
| |||||||||||||||||
Exchange differences on translating foreign operations | (759.6 | ) | 807.2 | 32.2 | (42.5 | ) | (12.6 | ) | (755.0 | ) | (568.5 | ) | 184.0 | |||||||||||||||||||
|
|
|
|
|
|
|
|
|
|
|
|
|
|
|
| |||||||||||||||||
Total comprehensive loss for the year attributable to our owners | $ | (2,253.6 | ) | $ | (1,108.3 | ) | $ | (3,909.3 | ) | $ | (5,369.6 | ) | $ | (5,023.6 | ) | $ | (7,627.7 | ) | $ | (6,128.3 | ) | $ | (4,915.0 | ) | ||||||||
|
|
|
|
|
|
|
|
|
|
|
|
|
|
|
| |||||||||||||||||
Loss per share: | ||||||||||||||||||||||||||||||||
Basic | $ | (0.02 | ) | $ | (0.03 | ) | $ | (0.06 | ) | $ | (0.08 | ) | $ | (0.07 | ) | $ | (0.10 | ) | $ | (0.08 | ) | $ | (0.07 | ) | ||||||||
Diluted | $ | (0.02 | ) | $ | (0.03 | ) | $ | (0.06 | ) | $ | (0.08 | ) | $ | (0.07 | ) | $ | (0.10 | ) | $ | (0.08 | ) | $ | (0.07 | ) | ||||||||
68
Table of Contents
The following table presents statement of operations data as a percentage of our revenue from operations for the eight quarters in the period ended March 31, 2012:
| Three Months Ended | ||||||||||||||||||||||||||||||||
| June 30, 2010 | September 30, 2010 | December 31, 2010 | March 31, 2011 | June 30, 2011 | September 30, 2011 | December 31, 2011 | March 31, 2012 | |||||||||||||||||||||||||
| (unaudited) | (unaudited) | (unaudited) | (unaudited) | (unaudited) | (unaudited) | (unaudited) | (unaudited) | |||||||||||||||||||||||||
Revenue from operations | 100.0 | % | 100.0 | % | 100.0 | % | 100.0 | % | 100.0 | % | 100.0 | % | 100.0 | % | 100.0 | % | ||||||||||||||||
Television | 100.0 | 100.0 | 100.0 | 92.1 | 88.3 | 85.4 | 82.4 | 79.9 | ||||||||||||||||||||||||
Internet | — | — | — | 7.9 | 11.7 | 14.6 | 17.6 | 20.1 | ||||||||||||||||||||||||
Employee benefit expense | (19.5 | ) | (24.1 | ) | (47.7 | ) | (37.6 | ) | (33.4 | ) | (42.0 | ) | (34.9 | ) | (29.9 | ) | ||||||||||||||||
Freight and collection expenses | (33.0 | ) | (27.1 | ) | (37.1 | ) | (41.0 | ) | (43.4 | ) | (49.2 | ) | (49.1 | ) | (51.0 | ) | ||||||||||||||||
Carriage fees | (26.7 | ) | (25.1 | ) | (28.5 | ) | (29.3 | ) | (28.9 | ) | (28.4 | ) | (24.0 | ) | (20.8 | ) | ||||||||||||||||
Airtime expenses | (4.2 | ) | (3.4 | ) | (2.6 | ) | (3.1 | ) | (1.2 | ) | (1.4 | ) | (0.2 | ) | (1.5 | ) | ||||||||||||||||
Call center expenses | (8.0 | ) | (10.9 | ) | (9.0 | ) | (14.6 | ) | (15.8 | ) | (13.9 | ) | (13.8 | ) | (12.2 | ) | ||||||||||||||||
Advertisement and business promotion expenses | (10.9 | ) | (12.8 | ) | (15.1 | ) | (43.6 | ) | (30.8 | ) | (36.0 | ) | (34.4 | ) | (21.4 | ) | ||||||||||||||||
Other operating expenses | (33.7 | ) | (36.6 | ) | (35.2 | ) | (48.8 | ) | (35.2 | ) | (33.9 | ) | (33.1 | ) | (33.4 | ) | ||||||||||||||||
Depreciation and amortization | (4.8 | ) | (4.9 | ) | (5.0 | ) | (6.0 | ) | (5.7 | ) | (5.0 | ) | (5.1 | ) | (4.8 | ) | ||||||||||||||||
Finance income | 8.0 | 6.4 | 5.1 | 4.7 | 2.8 | 4.1 | 6.2 | 4.7 | ||||||||||||||||||||||||
Finance costs | (0.1 | ) | (0.4 | ) | (0.0 | ) | (0.6 | ) | (0.2 | ) | (3.6 | ) | (4.5 | ) | (5.6 | ) | ||||||||||||||||
Income tax expense | — | — | (0.0 | ) | (0.0 | ) | — | — | — | — | ||||||||||||||||||||||
|
|
|
|
|
|
|
|
|
|
|
|
|
|
|
| |||||||||||||||||
Loss after tax | (32.7 | )% | (38.9 | )% | (75.0 | )% | (119.9 | )% | (91.8 | )% | (109.3 | )% | (92.9 | )% | (75.8 | )% | ||||||||||||||||
|
|
|
|
|
|
|
|
|
|
|
|
|
|
|
| |||||||||||||||||
69
Table of Contents
The following two tables contain business segment-wise operating results data for the eight quarters in the period ended March 31, 2012:
| Three Months Ended | ||||||||||||||||||||||||||||||||||||||||||||||||||||||||||||||||||||||||
Fiscal Year 2011 | June 30, 2010 | September 30, 2010 | December 31, 2010 | March 31, 2011 | ||||||||||||||||||||||||||||||||||||||||||||||||||||||||||||||||||||
| TV | Internet | Common | Total | TV | Internet | Common | Total | TV | Internet | Common | Total | TV | Internet | Common | Total | |||||||||||||||||||||||||||||||||||||||||||||||||||||||||
| (unaudited) | (unaudited) | (unaudited) | (unaudited) | |||||||||||||||||||||||||||||||||||||||||||||||||||||||||||||||||||||
| (in thousands) | ||||||||||||||||||||||||||||||||||||||||||||||||||||||||||||||||||||||||
Revenue | $ | 4,572.5 | — | — | $ | 4,572.5 | $ | 4,926.5 | — | — | $ | 4,926.5 | $ | 5,252.1 | — | — | $ | 5,252.1 | $ | 4,091.5 | $ | 351.5 | — | $ | 4,442.9 | |||||||||||||||||||||||||||||||||||||||||||||||
Direct operating expenses | 3,283.2 | — | — | 3,283.2 | 3,275.7 | — | — | 3,275.7 | 4,057.6 | — | — | 4,057.6 | 3,583.1 | 327.4 | — | 3,910.5 | ||||||||||||||||||||||||||||||||||||||||||||||||||||||||
Freight and collection expenses | 1,507.7 | — | — | 1,507.7 | 1,336.2 | — | — | 1,336.2 | 1,947.2 | — | — | 1,947.2 | 1,690.5 | 132.9 | — | 1,823.4 | ||||||||||||||||||||||||||||||||||||||||||||||||||||||||
Call center expenses | 366.7 | — | — | 366.7 | 536.8 | — | — | 536.8 | 474.3 | — | — | 474.3 | 454.7 | 194.5 | — | 649.2 | ||||||||||||||||||||||||||||||||||||||||||||||||||||||||
Carriage fees | 1,219.0 | — | — | 1,219.0 | 1,236.5 | — | — | 1,236.5 | 1,498.7 | — | — | 1,498.7 | 1,300.3 | — | — | 1,300.3 | ||||||||||||||||||||||||||||||||||||||||||||||||||||||||
Airtime expenses | 189.8 | — | — | 189.8 | 166.2 | — | — | 166.2 | 137.4 | — | — | 137.4 | 137.6 | — | — | 137.6 | ||||||||||||||||||||||||||||||||||||||||||||||||||||||||
Contribution | 1,289.3 | — | — | 1,289.3 | 1,650.8 | — | — | 1,650.8 | 1,194.5 | — | — | 1,194.5 | 508.3 | 24.0 | — | 532.4 | ||||||||||||||||||||||||||||||||||||||||||||||||||||||||
Operating expenses — fixed | 2,063.6 | — | 250.1 | 2,313.7 | 2,555.8 | — | 250.0 | 2,805.8 | 2,809.8 | — | 663.7 | 3,473.6 | 2,859.8 | 512.2 | 288.0 | 3,660.0 | ||||||||||||||||||||||||||||||||||||||||||||||||||||||||
Employee benefits expenses(1) | 592.2 | — | 182.2 | 774.4 | 786.2 | — | 217.1 | 1,003.3 | 1,060.9 | — | 563.5 | 1,624.4 | 829.4 | 349.8 | 313.8 | 1,493.0 | ||||||||||||||||||||||||||||||||||||||||||||||||||||||||
Production and programming costs(2) | 348.5 | — | — | 348.5 | 441.8 | — | — | 441.8 | 413.0 | — | — | 413.0 | 475.8 | — | — | 475.8 | ||||||||||||||||||||||||||||||||||||||||||||||||||||||||
Other operating expense(3) | 1,122.8 | — | 67.9 | 1,190.7 | 1,327.8 | — | 32.9 | 1,360.7 | 1,336.0 | — | 100.2 | 1,436.2 | 1,554.5 | 162.4 | (25.8 | ) | 1,691.1 | |||||||||||||||||||||||||||||||||||||||||||||||||||||||
Operating EBITDA | (774.2 | ) | — | (250.1 | ) | (1,024.3 | ) | (904.9 | ) | — | (250.0 | ) | (1,154.9 | ) | (1,615.4 | ) | — | (663.7 | ) | (2,279.1 | ) | (2,351.4 | ) | (488.1 | ) | (288.0 | ) | (3,127.6 | ) | |||||||||||||||||||||||||||||||||||||||||||
Customer acquisition cost:(4) | ||||||||||||||||||||||||||||||||||||||||||||||||||||||||||||||||||||||||
Search engine marketing cost | — | — | — | — | — | — | — | — | 34.8 | — | — | 34.8 | — | 385.3 | — | 385.3 | ||||||||||||||||||||||||||||||||||||||||||||||||||||||||
Redemption of gift coupons | 388.4 | — | — | 388.4 | 572.3 | — | — | 572.3 | 596.5 | — | — | 596.5 | 511.5 | 56.2 | — | 567.7 | ||||||||||||||||||||||||||||||||||||||||||||||||||||||||
Branding | 108.4 | — | — | 108.4 | 55.9 | — | — | 55.9 | 159.3 | — | — | 159.3 | 986.1 | — | — | 986.1 | ||||||||||||||||||||||||||||||||||||||||||||||||||||||||
Segment loss | (1,271.1 | ) | — | (250.1 | ) | (1,521.1 | ) | (1,533.1 | ) | — | (250.0 | ) | (1,783.1 | ) | (2,405.9 | ) | — | (663.7 | ) | (3,069.6 | ) | (3,849.1 | ) | (929.6 | ) | (288.0 | ) | (5,066.7 | ) | |||||||||||||||||||||||||||||||||||||||||||
Notes:
| (1) | This item comprises all of the “employee benefit expense” item appearing on our statements of comprehensive income (loss) other than non-cash expenses for share-based remuneration. See note 17 to our consolidated financial statements appearing elsewhere in this prospectus. |
| (2) | Production and programming costs comprise contracted media professionals fees, show production expenses, production consumables, studio equipment and costume hire charges, uplinking expenses and website development expenses included in the “other operating expenses” item that appears on our statements of comprehensive income (loss). See note 18 to our consolidated financial statements appearing elsewhere in this prospectus. |
| (3) | This item comprises all of the “other operating expenses” item appearing on our statements of comprehensive income (loss) other than the “production and programming costs” line item appearing in the two tables above. See the immediately preceding note and note 18 to our consolidated financial statements appearing elsewhere in this prospectus. |
| (4) | Customer acquisition cost comprises all of the “advertisement and business promotion expenses” item appearing on our statements of comprehensive income (loss). |
70
Table of Contents
| Three Months Ended | ||||||||||||||||||||||||||||||||||||||||||||||||||||||||||||||||||||||||
Fiscal Year 2012 | June 30, 2011 | September 30, 2011 | December 31, 2011 |
| March 31, 2012 | |||||||||||||||||||||||||||||||||||||||||||||||||||||||||||||||||||
| TV | Internet | Common | Total | TV | Internet | Common | Total | TV | Internet | Common | Total | TV | Internet | Common | Total | |||||||||||||||||||||||||||||||||||||||||||||||||||||||||
| (unaudited) | (unaudited) | (unaudited) | (unaudited) | |||||||||||||||||||||||||||||||||||||||||||||||||||||||||||||||||||||
| (in thousands) | ||||||||||||||||||||||||||||||||||||||||||||||||||||||||||||||||||||||||
Revenue | $ | 4,820.6 | $ | 639.3 | — | $ | 5,459.9 | $ | 5,372.6 | $ | 915.9 | — | $ | 6,288.5 | $ | 4,927.5 | $ | 1,054.1 | — | $ | 5,981.5 | $ | 5,373.6 | $ | 1,354.2 | — | $ | 6,727.7 | ||||||||||||||||||||||||||||||||||||||||||||
Direct operating expenses | 4,395.7 | 478.7 | — | 4,874.4 | 4,940.8 | 896.0 | — | 5,836.9 | 3,828.2 | 1,383.1 | — | 5,211.3 | 4,023.6 | 1,725.3 | — | 5,748.9 | ||||||||||||||||||||||||||||||||||||||||||||||||||||||||
Freight and collection expenses | 2,037.9 | 330.5 | — | 2,368.4 | 2,424.6 | 667.6 | — | 3,092.2 | 1,873.8 | 1,064.6 | — | 2,938.4 | 2,057.2 | 1,375.0 | — | 3,432.2 | ||||||||||||||||||||||||||||||||||||||||||||||||||||||||
Call center expenses | 713.6 | 148.3 | — | 861.9 | 643.8 | 228.4 | — | 872.2 | 508.6 | 318.5 | — | 827.1 | 467.3 | 350.3 | — | 817.6 | ||||||||||||||||||||||||||||||||||||||||||||||||||||||||
Carriage fees | 1,578.9 | — | — | 1,578.9 | 1,785.0 | — | — | 1,785.0 | 1,436.1 | — | — | 1,436.1 | 1,396.7 | — | — | 1,396.7 | ||||||||||||||||||||||||||||||||||||||||||||||||||||||||
Airtime expenses | 65.2 | — | — | 65.2 | 87.4 | — | — | 87.4 | 9.7 | — | — | 9.7 | 102.5 | — | — | 102.5 | ||||||||||||||||||||||||||||||||||||||||||||||||||||||||
Contribution | 424.9 | 160.6 | — | 585.5 | 431.8 | 19.8 | — | 451.6 | 1,099.3 | (329.0 | ) | — | 770.2 | 1,349.9 | (371.1 | ) | — | 978.8 | ||||||||||||||||||||||||||||||||||||||||||||||||||||||
Operating expenses — fixed | 2,571.4 | 570.0 | 428.4 | 3,569.8 | 2,853.2 | 1,117.3 | 506.7 | 4,477.2 | 2,427.8 | 904.9 | 469.2 | 3,801.9 | 2,676.5 | 1,045.8 | 395.2 | 4,117.5 | ||||||||||||||||||||||||||||||||||||||||||||||||||||||||
Employee benefits expenses(1) | 869.7 | 422.7 | 354.4 | 1,646.7 | 948.1 | 927.0 | 469.0 | 2,344.1 | 813.6 | 608.9 | 400.0 | 1,822.5 | 837.1 | 687.3 | 346.8 | 1,871.2 | ||||||||||||||||||||||||||||||||||||||||||||||||||||||||
Production and programming costs(2) | 461.1 | — | — | 461.1 | 478.8 | — | — | 478.8 | 388.9 | — | — | 388.9 | 316.4 | 95.0 | — | 411.4 | ||||||||||||||||||||||||||||||||||||||||||||||||||||||||
Other operating expenses(3) | 1,240.0 | 147.3 | 74.0 | 1,461.4 | 1,426.4 | 190.3 | 37.7 | 1,654.3 | 1,225.3 | 296.1 | 69.2 | 1,590.6 | 1,523.1 | 263.6 | 48.4 | 1,835.1 | ||||||||||||||||||||||||||||||||||||||||||||||||||||||||
Operating EBITDA | (2,146.4 | ) | (409.4 | ) | (428.4 | ) | (2,984.2 | ) | (2,421.5 | ) | (1,097.4 | ) | (506.7 | ) | (4,025.6 | ) | (1,328.5 | ) | (1,233.9 | ) | (469.2 | ) | (3,031.7 | ) | (1,326.6 | ) | (1,417.0 | ) | (395.2 | ) | (3,138.7 | ) | ||||||||||||||||||||||||||||||||||||||||
Customer acquisition cost:(4) | ||||||||||||||||||||||||||||||||||||||||||||||||||||||||||||||||||||||||
Search engine marketing cost | — | 548.4 | — | 548.4 | — | 815.6 | — | 815.6 | — | 788.3 | — | 788.3 | — | 519.2 | — | 519.2 | ||||||||||||||||||||||||||||||||||||||||||||||||||||||||
Redemption of gift coupons | 521.4 | 118.7 | — | 640.1 | 342.8 | 287.9 | — | 630.7 | 334.5 | 482.8 | — | 817.3 | 203.2 | 533.0 | — | 736.2 | ||||||||||||||||||||||||||||||||||||||||||||||||||||||||
Branding | 412.4 | 78.1 | — | 490.5 | (65.8 | ) | 883.9 | — | 818.1 | 160.1 | 291.2 | — | 451.3 | 74.3 | 110.0 | — | 184.4 | |||||||||||||||||||||||||||||||||||||||||||||||||||||||
Segment loss | (3,080.3 | ) | (1,154.7 | ) | (428.4 | ) | (4,663.3 | ) | (2,698.5 | ) | (3,084.8 | ) | (506.7 | ) | (6,290.0 | ) | (1,823.1 | ) | (2,796.3 | ) | (469.2 | ) | (5,088.6 | ) | (1,604.1 | ) | (2,579.2 | ) | (395.2 | ) | (4,578.5 | ) | ||||||||||||||||||||||||||||||||||||||||
Notes:
| (1) | This item comprises all of the “employee benefit expense” item appearing on our statements of comprehensive income (loss) other than non-cash expenses for share-based remuneration. See note 17 to our consolidated financial statements appearing elsewhere in this prospectus. |
| (2) | Production and programming costs comprise contracted media professionals fees, show production expenses, production consumables, studio equipment and costume hire charges, uplinking expenses and website development expenses included in the “other operating expenses” item that appears on our statements of comprehensive income (loss). See note 18 to our consolidated financial statements appearing elsewhere in this prospectus. |
| (3) | This item comprises all of the “other operating expenses” item appearing on our statements of comprehensive income (loss) other than the “production and programming costs” line item appearing in the two tables above. See the immediately preceding note and note 18 to our consolidated financial statements appearing elsewhere in this prospectus. |
| (4) | Customer acquisition cost comprises all of the “advertisement and business promotion expenses” item appearing on our statements of comprehensive income (loss). |
71
Table of Contents
The following table presents certain key operating metrics for the eight fiscal quarters in the period ended March 31, 2012:
| Three Months Ended | ||||||||||||||||||||||||||||||||
| June 30, 2010 | September 30, 2010 | December 31, 2010 | March 31, 2011 | June 30, 2011 | September 30, 2011 | December 31, 2011 | March 31, 2012 | |||||||||||||||||||||||||
| (unaudited) | (unaudited) | (unaudited) | (unaudited) | (unaudited) | (unaudited) | (unaudited) | (unaudited) | |||||||||||||||||||||||||
| (in thousands, except percentages and average order values) | ||||||||||||||||||||||||||||||||
Cumulative consumer base: | ||||||||||||||||||||||||||||||||
Consolidated | 1,664.7 | 1,883.9 | 2,130.8 | 2,393.4 | 2,699.6 | 3,096.1 | 3,532.0 | 4,006.3 | ||||||||||||||||||||||||
Gross transaction value (in dollars): | ||||||||||||||||||||||||||||||||
Television | $ | 13,598.3 | $ | 15,051.5 | $ | 16,335.8 | $ | 15,794.7 | $ | 17,313.8 | $ | 18,653.2 | $ | 19,843.0 | $ | 21,649.0 | ||||||||||||||||
Internet | — | — | — | 1,823.8 | 3,757.8 | 7,290.4 | 9,274.9 | 9,999.3 | ||||||||||||||||||||||||
|
|
|
|
|
|
|
|
|
|
|
|
|
|
|
| |||||||||||||||||
Consolidated | $ | 13,598.3 | $ | 15,051.5 | $ | 16,335.8 | $ | 17,618.5 | $ | 21,071.6 | $ | 25,943.6 | $ | 29,117.9 | $ | 31,648.3 | ||||||||||||||||
|
|
|
|
|
|
|
|
|
|
|
|
|
|
|
| |||||||||||||||||
Gross transaction value (in Rs.)(1): | ||||||||||||||||||||||||||||||||
Television | | 623,208.0 | | 694,676.7 | | 737,232.4 | | 714,867.8 | | 774,507.0 | | 864,884.8 | | 1,020,617.8 | | 1,080,862.5 | ||||||||||||||||
Internet | — | — | — | 82,544.8 | 168,096.1 | 338,032.8 | 477,050.4 | 499,230.6 | ||||||||||||||||||||||||
|
|
|
|
|
|
|
|
|
|
|
|
|
|
|
| |||||||||||||||||
Consolidated | | 623,208.0 | | 694,676.7 | | 737,232.4 | | 797,412.6 | | 942,603.1 | | 1,202,917.6 | | 1,497,668.2 | | 1,580,093.0 | ||||||||||||||||
|
|
|
|
|
|
|
|
|
|
|
|
|
|
|
| |||||||||||||||||
Average gross commission: | ||||||||||||||||||||||||||||||||
Television | 33.5 | % | 32.5 | % | 31.8 | % | 25.8 | % | 27.8 | % | 28.8 | % | 24.7 | % | 24.8 | % | ||||||||||||||||
Internet | — | — | — | 19.3 | 17.0 | 12.6 | 11.4 | 13.4 | ||||||||||||||||||||||||
Consolidated | 33.5 | 32.5 | 31.8 | 25.2 | 25.9 | 24.2 | 20.4 | 21.2 | ||||||||||||||||||||||||
Average order value (in dollars): | ||||||||||||||||||||||||||||||||
Television | $ | 45.8 | $ | 52.6 | $ | 51.0 | $ | 48.7 | $ | 47.6 | $ | 47.7 | $ | 41.3 | $ | 44.5 | ||||||||||||||||
Internet | — | — | — | 44.4 | 36.2 | 28.1 | 26.3 | 23.5 | ||||||||||||||||||||||||
Consolidated | 45.8 | 52.6 | 51.0 | 48.2 | 45.0 | 39.9 | 35.0 | 34.7 | ||||||||||||||||||||||||
Average order value (in Rs.)(1): | ||||||||||||||||||||||||||||||||
Television | | 2,097 | | 2,427 | | 2,303 | | 2,204 | | 2,128 | | 2,211 | | 2,123 | | 2,220 | ||||||||||||||||
Internet | — | — | — | 2,011 | 1,617 | 1,302 | 1,355 | 1,174 | ||||||||||||||||||||||||
Consolidated | 2,097 | 2,427 | 2,303 | 2,182 | 2,015 | 1,848 | 1,798 | 1,733 | ||||||||||||||||||||||||
Repeat business rate: | ||||||||||||||||||||||||||||||||
Consolidated | 32.3 | % | 30.8 | % | 34.0 | % | 34.9 | % | 34.1 | % | 35.9 | % | 41.4 | % | 39.9 | % | ||||||||||||||||
Unique visitors to our website(2) | — | — | — | 998 | 1,661 | 2,745 | 3,000 | 3,291 | ||||||||||||||||||||||||
Notes:
| (1) | The rupee figures for gross transaction value and average order value in this table can be calculated from the dollar figures by multiplying each corresponding quarterly U.S. dollar gross transaction value or average order value figure, as the case may be, by the average rupee/dollar exchange rate for the relevant quarter. The following table sets forth the average rupee/dollar exchange rates for the eight fiscal quarters in the period ended March 31, 2012: |
Three Months Ended | ||||||||||||||
June 30, 2010 | September 30, | December 31, | March 31, | June 30, 2011 | September 30, | December 31, | March 31, | |||||||
| (Rs. per $1.00) | ||||||||||||||
45.83 | 46.15 | 45.13 | 45.26 | 44.73 | 46.37 | 51.43 | 49.93 | |||||||
72
Table of Contents
We believe that the rupee figures for quarterly gross transaction value and average order value are useful in showing organic trends in gross transaction value and average order value, as sales of products through our platform are all made in rupees. The rupee figures, however, do not reflect the impact of changes in the rupee/dollar exchange rate. See “— General Factors Affecting Our Results of Operations — U.S. Dollar-Indian Rupee Exchange Rate” above for more information regarding the implications of volatility in the exchange rate between the U.S. dollar and Indian rupee on our financial results.
| (2) | This data is sourced from Google Analytics. |
We have experienced consolidated revenue growth through the eight fiscal quarters in the period ended March 31, 2012, except in the fourth quarter of fiscal year 2011 and the third quarter of fiscal year 2012. In each case, the revenue decline was due to reduced revenue in our television segment. With respect to the fourth quarter of fiscal year 2011, the decline was principally due to our decision to demonstrate more high quality branded goods and a related lag in consumer acceptance of these products due to higher average order value. The increase in high quality branded products has also contributed to a reduction in our average gross commission. With respect to the third quarter of fiscal year 2012, the decline was principally due to the adverse impact of the significant depreciation of the Indian rupee against the U.S. dollar during that period. The average order value for our Internet business declined in fiscal year 2012 due to an increase in the number of transactions for sales of books on our website, after the acquisition of Coinjoos.com. In rupee terms, our television revenue for that quarter had increased by 1.7% compared to the prior quarter. Our consolidated revenue growth has been driven by the steady increase in commissions earned from sales by our Sourcing Partners through our digital commerce platform. In each of the six periods in which our revenue grew, we experienced increases in new and repeat business and orders.
Our operating expenses have also increased during these eight quarters along with our revenues. This growth in our operating expenses has been primarily due to increases in the volume of products sold through our platform and the costs associated with the build-up of our two business lines. Significant quarterly fluctuation in our employee benefits expense is mainly due to changes in the level of share-based compensation expenses associated with share option grants to our employees.
Since the inception of our Internet business in the fourth quarter of fiscal year 2011, this business segment has had continued revenue growth driven by an increase in the size of the catalog of products showcased on our platform and increase in consumer traffic to our website. At the same time, operating costs have generally increased with this sales growth due to start-up and ramp up costs associated with this new business segment.
Seasonality
Our business experiences seasonal fluctuations to a certain extent due to different calendar events and national and religious holidays. We tend to experience relatively higher revenue in the third quarter of our financial year, which coincides with several festivals such as Dusshera, Diwali and Christmas. We believe that we will continue to be subject to the effects of seasonality. As our business matures, the impact of this seasonality in our quarterly results may become more apparent.
Liquidity and Capital Resources
We have had negative net cash flows from operations and expect these cash flows to continue to be negative at least for the near term, as we incur expenditures to build out our digital commerce platform and attract consumers and to make advances to Sourcing Partners. Network18 has issued a letter to our Indian subsidiary assuring continued financial support as necessary for our subsidiary to fulfill its business obligations in all material respects for the 12-month period beginning August 16, 2012, and our consolidated financial statements have been prepared on a going concern basis on the basis of this support. We cannot assure you that Network18 will continue to provide this support in the future.
73
Table of Contents
Our principal sources of funds have been the commissions and freight cost reimbursements from our Sourcing Partners and the net proceeds from capital raising transactions. We have raised capital principally from the sale of our ordinary shares, preferred shares and warrants and to a lesser extent borrowings. Incoming funds have been used to finance our operations and capital expenditures. We believe that our current cash and cash equivalents, cash flow from operations and the proceeds from this offering will be sufficient to meet our anticipated regular working capital requirements and our needs for capital expenditures for the next 12 months. We expect to address near-term external funding requirements through the proceeds of this offering, as well as possible future issuances of our equity securities and borrowings. Failure to raise external funds while we have negative cash flows from operations will have a material adverse effect on our liquidity and business prospects.
In April 2012, in order to meet our working capital requirements and pay operating expenses, our Indian subsidiary entered into a credit facility agreement with The Ratnakar Bank Limited providing for short-term secured borrowings of up to 400.0 million ($7.7 million) under working capital and cash credit facilities. As of July 31, 2012, we had outstanding borrowings of 346.9 million ($6.8 million) under these facilities at a weighted average interest rate of 14.0% per annum. We intend to use a portion of the net proceeds from this offering to repay our outstanding borrowings under these facilities in full. For more information on these facilities and our borrowings under them, see “— Contractual Obligations, Including Indebtedness” below.
Cash Flows
The following table summarizes our cash flows and cash position for fiscal years 2010, 2011 and 2012:
| Fiscal Year | ||||||||||||
| 2010 | 2011 | 2012 | ||||||||||
| (in thousands) | ||||||||||||
Net cash from (used in) operations | $ | (7,857.3 | ) | $ | (13,784.2 | ) | $ | (22,196.8 | ) | |||
Net proceeds from the sale of short term investments | 1,088.4 | 830.1 | — | |||||||||
Net cash from (used in) operating activities | (7,143.1 | ) | (13,815.8 | ) | (22,997.8 | ) | ||||||
Net cash from (used in) investing activities | (20,329.4 | ) | 15,020.9 | 3,858.4 | ||||||||
Net cash from (used in) financing activities | 22,317.6 | (61.1 | ) | 18,378.0 | ||||||||
Cash and cash equivalents at the end of the year (net of bank overdraft) | 157.0 | 1,307.5 | 873.3 | |||||||||
Negative net cash flows from operations have trended upward mainly due to the increased start-up costs associated with the launch in January 2011 of our Internet channel, further developing both of our channels and growing the consumer base.
Among the most significant contributors to the growth in our operating expenses from fiscal year 2010 to fiscal year 2012 have been the following items:
| • | Freight and collection expenses, which increased by $7.2 million, or 155.8%, from $4.6 million in fiscal year 2010 to $11.8 million in fiscal year 2012; |
| • | Advertisement and business promotion expenses, which increased by $5.3 million, or 242.9%, from $2.2 million in fiscal year 2010 to $7.4 million in fiscal year 2012; |
| • | Employee benefits expense, which increased by $4.2 million, or 97.7%, from $4.3 million in fiscal year 2010 to reach $8.6 million in fiscal year 2012; and |
| • | Other operating expenses, which increased by $3.8 million, or 84.5%, from $4.5 million in fiscal year 2010 to reach $8.3 million in fiscal year 2012. |
For information on the factors driving the growth of the foregoing items, see “— Results of Operations” above in this section.
74
Table of Contents
Additional significant changes to our cash flow from operations have included:
| • | An increase in advances recoverable that we have made, principally to our Sourcing Partners, from $0.4 million in fiscal year 2010, to $1.3 million in fiscal year 2011 and $3.6 million in fiscal year 2012. These advances, which are payable on demand and do not bear interest, are part of our platform development efforts. We extend this credit, generally for a period of 30 to 45 days, to our Sourcing Partners primarily to provide working capital to facilitate their growing sales through our platform. |
| • | An increase of $1.4 million in receivables due from courier companies from fiscal year 2011 to fiscal year 2012 mainly due to the growth in our gross transaction value. |
| • | An increase in trade receivables from $0.6 million in fiscal year 2011 to $1.1 million in fiscal year 2012. This has had the effect of increasing our working capital and hence increasing the cash used in operations. This increase generally tracks the rise in gross transaction value for this period. Our trade receivables represent amounts due from Sourcing Partners for commissions. |
| • | Significant fluctuation in our trade payables balance. Trade payables decreased from $4.6 million in fiscal year 2010 to $2.7 million in fiscal year 2011, but then increased significantly to $6.3 million in fiscal year 2012. The decline from fiscal year 2010 to fiscal year 2011 was driven by a decrease in our average payment cycle arising from changes in payment terms with our Sourcing Partners. The increase from fiscal year 2011 to fiscal year 2012 was mainly due to the growth in gross transaction value, as well as changes in payment terms, which were extended from a 15-30 day period to a 30-45 day period, with Sourcing Partners that had the effect of increasing our average payment cycle. |
The primary use of cash in investing activities has been term deposits placed with banks and capital expenditures in respect of property, plant and equipment, as well as acquisition of intangible assets, including from the Coinjoos acquisition and computer software purchases. See “— Capital Expenditures” and “— Coinjoos Acquisition” below for additional detail. The primary source of cash from investing activities has been principal and interest from the aforementioned bank deposits.
Our net cash from financing activities has come principally from proceeds from the sale of our ordinary shares, preferred shares and warrants, as well as borrowings. We have recorded proceeds from borrowings of $10.7 million for fiscal year 2012 principally as a result of the subordinated loans we took from Network18 in connection with our issuance of partially paid warrants in fiscal year 2012 to our Network18 group shareholder. Our Network18 affiliated shareholder will fully fund these warrants before the completion of this offering. The proceeds we receive from the funding of these warrants will be used to repay the subordinated loans. See “Description of Share Capital — History of Share Issuances — Warrants and Related Subordinated Loans.” As indicated above, cash flows from financing activities have been used to fund our operations and capital expenditures. Through March 31, 2012, there had not been significant outgoing cash flows from financing activities, principally as a result of the low amount of our borrowings we had that required cash interest payments. See “— Contractual Obligations, Including Loans and Borrowings” below.
Capital Expenditures
In fiscal years 2010, 2011 and 2012, we had capital expenditures of $0.4 million, $1.6 million and $1.2 million, respectively, for leasehold improvements, information technology and office equipment, plant and machinery and electrical installations, furniture and fixtures, vehicles and computer software. Specifically, a significant portion of these expenditures for fiscal year 2012 related to the expansion of our television studio infrastructure. We have budgeted for capital expenditures of approximately $4.0 million for fiscal year 2013, principally for IT systems upgrades and the development of our mobile business. We intend to use a portion of the net proceeds received by us from this offering for capital expenditures such as the further expansion of our television studio infrastructure and the introduction of programming in regional languages on our television channel.
75
Table of Contents
Coinjoos Acquisition
In June 2011 we acquired the business and assets of On Graph Technologies Private Limited, an Indian corporation, which operated an online books business under the name “Coinjoos.com,” for immediate cash payment of $195,465 and future amounts of up to $831,255, payable to certain employees who joined us from Coinjoos, upon the achievement of certain milestones on or before June 30, 2013. As we believe these milestones and related conditions are likely to be satisfied, we have recorded additional payment obligations totaling $311,720 as employee benefits expenses in fiscal year 2012 and expect to record the balance of these obligations in fiscal years 2013 and 2014.
Contractual Obligations, Including Indebtedness
We have commitments under certain firm contractual arrangements, or firm commitments, to make future payments. These firm commitments secure future rights to various assets and services to be used in the normal course of our operations. The following table summarizes our firm commitments as of March 31, 2012.
| Payment Due by Period | |||||||||||||||||||
| Total | Less than 1 year | 1-3 years | 3-5 years | More than 5 years | ||||||||||||||||
| (in thousands) | ||||||||||||||||||||
Loans and borrowings | $11,313.1 | $11,313.1 | — | — | — | |||||||||||||||
Bank overdrafts | 575.7 | 575.7 | — | — | — | |||||||||||||||
Operating lease obligations | 1,885.0 | 1,134.3 | 750.7 | — | ||||||||||||||||
Contingent consideration — Coinjoos acquisition | 781.9 | 342.1 | 439.8 | — | — | |||||||||||||||
Of the $11.3 million in loans and borrowings indicated above, $0.6 million is attributable to the derivative liability portion of our warrants. No cash has been paid or is payable by us in respect of these warrants. Upon completion of this offering, these warrants will be converted into ordinary shares, at which time this liability amount will be extinguished. Almost all of the remaining $10.7 million in loans and borrowings comprises subordinated loans taken from Network18 in connection with our issuance of partially paid warrants in fiscal year 2012. The amount required to repay these subordinated loans will be received at the completion of this offering from proceeds we receive from our Network18 group shareholder when it fully funds the partially paid warrants it purchased from us in fiscal year 2012. See “Description of Share Capital — History of Share Issuances — Warrants and Related Subordinated Loans.”
As of March 31, 2010 and 2011, our total loans and borrowings and bank overdrafts were $1.2 million and $0.6 million, respectively.
In April 2012 our Indian subsidiary entered into a credit facility agreement with The Ratnakar Bank Limited for a working capital demand loan of 300.0 million ($5.7 million) with the rate of interest to be decided at the time of disbursement and cash credit of 100.0 million ($2.0 million) with an interest rate per annum of the bank’s minimum, or base, lending rate (currently 11.0%) plus 2.5%. The principal amount under both these facilities is repayable on demand, and interest under both facilities is payable on a monthly basis. Amounts owed under these facilities are secured by the fixed and movable assets of our subsidiary, a corporate guarantee by Network18 and a personal guarantee of Mr. Raghav Bahl. In connection with these facilities, we have made upfront payments totaling 6.0 million to the bank in the form of processing fees.
As of July 31, 2012, we had outstanding borrowings of 346.9 million ($6.8 million) under these facilities.
76
Table of Contents
Our Indian subsidiary has undertaken to furnish information as requested by the bank and to seek the prior written permission of the bank before, among others, the following:
| • | issuing further equity or raising any loan; |
| • | declaring and paying any dividends; or |
| • | entering into a merger, amalgamation or selling off any of its units or property. |
Failure to comply with any of these covenants would lead to an event of default. Other events of default include defaults under other obligations of our subsidiary or impairment of the security interest created in favor of the bank. We intend to use a portion of the net proceeds from this offering to repay our outstanding borrowings under these facilities in full.
Off-Balance Sheet Arrangements
We did not have any off-balance sheet arrangements in any of fiscal years 2010, 2011 and 2012.
Inflation
India has recently experienced fluctuating wholesale price inflation. The CIA World Factbook estimates that consumer inflation in India was 6.4% in 2007, 8.3% in 2008, 10.9% in 2009, 11.7% in 2010 and 6.8% in 2011. Continued fluctuation in inflation rates may make it more difficult for us to accurately estimate or control our costs, which may adversely impact our business prospects. An increase in inflation in India would be expected to increase the rupee value of certain of our expenses. An inability to pass increased costs on to consumers and Sourcing Partners could have a material adverse effect on our financial condition and results of operations.
Exposure to Counterparty Credit Risk
We are subject to concentrations of credit risk through our trade receivables and other receivables from courier companies and Sourcing Partners, loans, advances recoverable and cash and cash equivalents. By their nature, all these assets involve risks, including the credit risk of non-performance by counterparties.
Trade and other receivables are typically unsecured and arise mainly from gross payment amounts owed to us by courier companies in respect of COD sales and reimbursements of freight and collection expenses owed to us by our Sourcing Partners. For each of the three years ended March 31, 2012, our top three couriers accounted for over 95.0% of the total receivables owed to us by courier companies.
Advances recoverable are principally made to our Sourcing Partners to provide working capital to facilitate their growing sales through our platform. As of March 31, 2012, three Sourcing Partners accounted for the majority of the total amount owed to us under these advances.
We review the credit worthiness of courier companies and Sourcing Partners to which we have granted credit in the normal course of the business. In addition, we believe that our overall credit exposure to these Sourcing Partners is reduced by amounts payable by us to them in respect of the products they have sold through our platform.
Our cash and cash equivalents are placed with banks that management believes to be of high quality.
We believe that currently there is no significant risk of loss associated with counterparty credit default, other than amounts for which we already have provided for. See note 24 to our consolidated financial statements for additional information relating to our exposure to credit risk.
77
Table of Contents
Quantitative and Qualitative Disclosures about Market Risk
Exchange Rate Risk
We are exposed to movements in currency exchange rates, primarily those related to the U.S. dollar and the Indian Rupee. This is due primarily to the fact that while our reporting currency is the U.S. dollar, the functional currency of our operating subsidiary is the Indian rupee. As a result, when the U.S. dollar strengthens against the Indian rupee, the value of our sales and expenses in Indian rupees converted to U.S. dollars decreases. When the U.S. dollar weakens, the value of our sales and expenses in Indian rupees converted to U.S. dollars increases. Recently, there have been periods of higher volatility in the Indian rupee and U.S. dollar exchange rate. In fiscal year 2012, the average value of the rupee dropped 5.3% against the dollar as compared to fiscal year 2011. See “— General Factors Affecting Our Results of Operations – U.S. Dollar-Indian Rupee Exchange Rate” above and the section “Exchange Rates” for more information on recent trends in the U.S. dollar-Indian rupee exchange rate and their impact on our results of operations.
Interest Rate Risk
The interest rate on borrowings under our credit facility agreement, described above under “— Contractual Obligations, Including Borrowings,” have been made by reference to the minimum, or base, lending rate of The Ratnakar Bank Limited. For example, borrowings under the cash credit facility bear interest at the bank’s base rate plus 2.5%. Currently, the bank’s base rate is 11.0%. Under Indian banking regulations, the bank is required is review the base rate at least quarterly. As this base rate may change, interest rates chargeable on borrowings from Ratnakar Bank are subject to change. As of March 31, 2012, we had no borrowings under this facility agreement as it had not yet been entered into. As of July 31, 2012, we had outstanding borrowings of 346.9 million ($6.8 million) under this agreement at a weighted average interest rate of 14.0% per annum.
The subordinated loans related to our partially paid warrants also accrue interest at a variable rate. However, as these accruals are matched by accruals under our partially paid warrants, and as the principal and accrued interest on the subordinated loans will be paid off from the funding of these warrants on or before the completion of this offering, we do not believe the subordinated loans pose market risk. See “Description of Share Capital — History of Share Issuances — Warrants and Related Subordinated Loans” for more information.
Critical Accounting Policies
Our consolidated financial statements are prepared in accordance with IFRS as issued by the IASB, which requires management to make estimates, judgments and assumptions that affect the amounts reported in our consolidated financial statements and accompanying notes. Management considers the following accounting policies to be critical because they are important to our financial condition and results of operations and require significant judgment and estimates on the part of management in their application. For a summary of all our accounting policies, see note 3 to our consolidated financial statements appearing elsewhere in this prospectus.
Revenue
Our revenue primarily comprises commissions earned from the sales of products by our Sourcing Partners as well as reimbursements of freight and collection expenses from certain Sourcing Partners. Revenue is measured by reference to the fair value of consideration received or receivable for services provided.
Revenue is recognized when the amount of revenue can be measured reliably, collection is probable, the costs incurred or to be incurred can be measured reliably, and when the criteria of recognition have been met.
Commission revenue and reimbursement of freight and collection expenses are recognized at the time of delivery of products by the courier companies to consumers in accordance with contracted terms with our Sourcing Partners.
78
Table of Contents
Share-based Employee Remuneration
We are required to measure the fair value of the options and stock appreciation rights we have granted under our share option plan and stock appreciation rights scheme and expense this amount over the applicable vesting periods. The fair value is determined principally using the Black-Scholes model which requires assumptions regarding risk free interest rates, share value, share price volatility and the expected life of an employee equity instrument.
As there has not been a market price for our ordinary shares prior to this offering, the share price input into the Black-Scholes model has been based on our estimate of the value of our ordinary shares on the relevant grant date. We have used a discounted cash flow approach to valuing our ordinary shares, which relies on a number of critical estimates. Under the discounted cash flow approach, our ordinary share value is derived from a calculation of the net present value of our estimated future free cash flow attributable to equity. Estimates of our free cash flow for a discrete future period encompassing the next several years — typically the next 10 to 12 years — are based on projections of our future financial performance. These projections are in turn based on a financial model that our management has developed and maintains and which is subject to a number of assumptions, contingencies and other uncertainties. To estimate the value of cash flows beyond the discrete future period, we have used the Gordon growth model, which requires an estimate of our long-term growth rate beyond the discrete future period. Our estimated long-term growth rate is based on our assessment of the long-term potential for our industry in India, which is also subject to assumptions, contingencies and other uncertainties. We have discounted projected cash flows using a weighted average cost of capital figure based on economic, industry and company-specific factors. Following the completion of this offering, we expect that the market price of our shares will be used as an input in the Black-Scholes valuation of future share option and stock appreciation right grants and that therefore we will cease to use the discounted cash flow approach.
For further discussion of the basis and assumptions used to determine fair value, see note 17.1 to our consolidated financial statements appearing elsewhere in this prospectus.
Depreciable Assets
The assessment of the useful lives of our property, plant and equipment and our intangible assets requires judgment. Depreciation and amortization are charged on a straight-line basis to the statement of comprehensive income (loss) based on the useful life selected. This assessment requires estimation of the period over which we will benefit from the assets.
Acquired computer software licenses are capitalized on the basis of the costs incurred to acquire and install the specific software. Costs associated with maintaining computer software —i.e., expenditure relating to patches and other minor updates as well as their installation — are expensed as incurred.
Residual values and useful lives are reviewed periodically and are subject to impairment testing.
Assessing whether assets meet the required criteria for initial capitalization requires judgment. This requires a determination of whether the assets will result in future benefits to us.
Income Taxation
The assessment of the probability of future taxable income in which deferred tax assets can be utilized is based on our latest approved budget forecast, which is adjusted for significant non-taxable income and expenses and specific limits to the use of any unused tax loss or credit. If a positive forecast of taxable income indicates the probable use of a deferred tax asset, especially when it can be utilized without a time limit, that deferred tax asset is usually recognized in full.
79
Table of Contents
Defined Benefit Liability
Management estimates the defined benefit liability annually with the assistance of independent actuaries; however, the actual outcome may vary due to estimation uncertainties. The defined benefit liability is based on, among other things, standard rates of inflation, medical cost trends and mortality. The calculation of this liability also takes into account anticipated future salary increases. Discount factors are determined close to each year-end by reference to government bond rates that have terms to maturity approximating the terms of the related liability.
Fair Value Measurement Considerations
Fair value of financial instruments for which no active market exists are established using a valuation technique. Valuation techniques include, among other things, using recent arm’s length market transactions between knowledgeable, willing parties, if available, reference to the current fair value of another instrument that is substantially the same, discounted cash flow analysis and option pricing models.
Recent Accounting Pronouncements
The following new standards, amendments and interpretations to existing standards have been published but are not yet effective, and we have not adopted any of these pronouncements early. Management anticipates that all of the relevant pronouncements will be adopted in our accounting policy for the first period beginning after the effective date of the pronouncement. Other than as specified below, at present we are not able to reasonably estimate the impact of initial application of these pronouncements.
IFRS 9 Financial Instruments — Classification and Measurement (effective for annual periods beginning on or after January 1, 2015)
IFRS 9 seeks to reduce complexity of the current rules on financial instruments as mandated in IAS 39. IFRS 9 has fewer classification and measurement categories as compared to IAS 39 and has eliminated the categories of held to maturity, available for sale and loans and receivables. Further, it eliminates the rule-based requirement of segregating embedded derivatives and tainting rules pertaining to held to maturity investments. For an investment in an equity instrument which is not held for trading, IFRS 9 permits irrevocable election, on initial recognition, on an individual share-by-share basis, to present all fair value changes from the investment in other comprehensive income.
Further, IFRS 9 addresses the problem of volatility in profit and loss arising from an issuer choosing to measure its own debt at fair value. With the new requirements, an entity choosing to measure a liability at fair value will present the portion of the change in its fair value due to changes in the entity’s own credit risk in other comprehensive income rather than within profit or loss.
IFRS 10 Consolidated Financial Statements (effective for annual periods beginning on or after January 1, 2013)
IFRS 10 supersedes IAS 27 Consolidated and Separate Financial Statements and SIC-12 Consolidation – Special Purpose Entities. IFRS 10 introduces a new, principles-based definition of control which will apply to all investees to determine the scope of consolidation. IFRS 10 uses control as the single basis for consolidation, irrespective of the nature of the investee, eliminating the risks and rewards approach included in SIC-12. IFRS 10 identifies the following three elements of control:
| • | Power over the investee; |
80
Table of Contents
| • | Exposure, or rights, to variable returns from involvement with the investee; and |
| • | The ability to use power over the investee to affect the amount of the investor’s returns. |
An investor must possess all three elements to conclude it controls the investee. The assessment of control is based on all facts and circumstances and the conclusion is reassessed if there is an indication that there are changes to at least one of the three elements of control.
The new standard is not expected to cause any change to our consolidated financial reporting.
IFRS 12 Disclosure of Interests in Other Entities (effective for annual periods beginning on or after January 1, 2013)
IFRS 12 combines the disclosure requirements for subsidiaries, joint arrangements, associates and structured entities within a comprehensive disclosure standard. It aims to provide more transparency on “borderline” consolidation decisions and enhances disclosures about unconsolidated structured entities in which an investor or sponsor has involvement.
The application of this new standard will not have any impact on the recognition and measurement principles we apply and will only add or modify disclosures in the financial statements.
IFRS 13 Fair Valuation Measurement (effective for annual periods beginning on or after January 1, 2013)
IFRS 13 defines fair value, sets out in a single IFRS a framework for measuring fair value and requires disclosure about fair value measurement. IFRS 13 applies when another standard requires or permits fair value measurement or disclosure about fair value measurements, except for:
| • | Shares-based payment transactions within the scope of IFRS 2 Share Based Payment; |
| • | Leasing transactions within the scope of IAS 17 Leases; and |
| • | Measurements that have some similarities to fair value but that are not fair value, such as “net realizable value” of inventories under IAS 2 or “value in use” under IAS 36 Impairments of Assets. |
Amendment to IAS 1 Presentation of Financial statements
The amendments to IAS 1 require an entity to group items presented in the consolidated statement of other comprehensive income into those that, in accordance with other standards:
| 1. | will not be reclassified subsequently to profit or loss. |
| 2. | will be reclassified subsequently to profit or loss when specific conditions are met. |
The amendments are applicable for annual periods beginning on or after July 1, 2012.
IAS 19 Employee Benefits (effective for annual periods beginning on or after January 1, 2013)
The IASB has issued an amended version of IAS 19 Employee Benefits, which includes a number of targeted improvements throughout the standard. The main changes improve the comparability and understandability of changes arising from defined benefit plans by removing options and requiring entities to recognize changes immediately. This is intended to provide users of financial statements with a much clearer picture of an entity’s obligations resulting from the provision of defined benefit plans and how those obligations will affect the entity.
81
Table of Contents
The amended version does this by:
| • | Eliminating the “corridor method” which allowed entities the option to defer the recognition of actuarial gains and losses. |
| • | Streamlining the presentation of changes in assets and liabilities arising from defined benefit plans, including requiring remeasurement to be presented in other comprehensive income, thereby separating those changes from changes that many perceive to be the result of an entity’s day-to-day operations. |
| • | Enhancing the disclosure requirements for defined benefit plans, providing better information about the characteristics of defined benefit plans and the risks that entities are exposed to through participation in them. |
In addition to these major changes, the amended version of IAS 19 makes changes to a number of other areas.
IAS 27 (Revised) Separate Financial Statements (effective for annual periods beginning on or after January 1, 2013)
Consequential changes have been made to IAS 27 as a result of the publication of certain new standards described above. IAS 27 will now solely address separate financial statements, the requirements for which are substantially unchanged.
82
Table of Contents
Mission
Our mission is to transform the way consumers across
Indiadiscover and purchase high quality consumer products.
Overview
We operate a leading digital commerce platform in India, with the ability to access over 250 million consumers through the Internet, television and mobile devices. Since the launch of our service in 2008, we have built an end-to-end digital commerce platform providing Indian consumers access to over 500 brands. International and domestic brands such as Canon, Godrej, Micromax, Reebok, Samsung and Whirlpool are able to efficiently and effectively demonstrate, market and sell their products to consumers across India through our platform. Our multi-channel approach has allowed us to establish a trusted brand in the Indian market. Since our launch, over 4.5 million consumers across India have placed orders through our platform. We added over 470,000 consumers in the quarter ended June 30, 2012. We believe that our strategy provides us with a platform that is well suited to address the large and relatively untapped digital commerce opportunity in India.
The Indian market has certain unique market dynamics and infrastructure challenges, which require a technological and commercial solution that is different from that in other parts of the world. Because of the lack of large organized vendors across the country, infrastructure constraints, and rising costs for physical retail space that currently characterize the local consumer retail market in India, manufacturers and distributors are increasingly looking at digital commerce as a critical component of their respective strategies to reach and sell their products to Indian consumers on a national basis. However, India’s Internet landscape is still at an early stage of development, with 132 million users as of 2011, according to the FICCI-KPMG India Media and Entertainment Industry Report 2012, implying an Internet penetration of only approximately 10.8% (based on India’s population estimate by The Economist Intelligence Unit). Thus, an Internet-only platform does not fully address India’s market potential and need. On the other hand, India already has the world’s third largest television market, with a viewership base of over 539 million in 2011, according to the FICCI-KPMG report, thus enabling mass reach and scale. Even with this large base, India’s viewership is expected to increase to 789 million through 2016. According to the FICCI-KPMG report, at the end of 2011, there were approximately 119 million pay television households in India. By 2016, the number of pay television households is projected to grow to approximately 176 million, thus significantly increasing the potential reach of our television channel. As of March 31, 2012 our television channel, which is carried on pay television systems, reached more than 55 million households across India.
To reach the broadest possible consumer base in India, we have developed a customized digital commerce platform that combines the reach of the Internet, television and mobile devices. Our scale and distribution strategy make us an important relationship for our Sourcing Partners, providing us with the ability to showcase a broad range of products across multiple categories at competitive prices. During fiscal year 2012, we began showcasing new product categories including books and baby & kids products on our platform. We have developed a technology-enabled logistics network that allows our Sourcing Partners to deliver products to the consumer’s doorstep in over 3,000 towns and cities across India. We believe that our platform provides consumers with a differentiated and user-friendly experience, service and value.
Since the launch of our service in 2008, over 6.5 million transactions have been executed through our platform. Through our combined Internet, television and mobile presence we have become one of India’s best known brands in the digital commerce industry, with over 45% of June 2012 traffic to our website being direct to our site, as measured by Google Analytics, a product that provides Internet marketing intelligence.
83
Table of Contents
The total value of all products sold through our platform, net of related returns, which we refer to as “gross transaction value,” was $44.2 million, $62.6 million and $108.5 million in fiscal years 2010, 2011 and 2012, respectively. Our revenue from operations comes primarily from commissions we charge for products sold through our platform and reimbursement of some of our freight and collection expenses from certain Sourcing Partners. We had revenue in fiscal years 2010, 2011 and 2012 of $14.6 million, $19.2 million and $24.5 million, respectively, and loss after tax in those years of $15.1 million, $12.6 million and $23.7 million, respectively.
Market Landscape
A Large, Fast-Growing and Urbanizing Consumer Market
India is the world’s second most populous country, with an estimated population of approximately 1.2 billion as of March 2012, which equates to 19.0% of the world population, according to The Economist Intelligence Unit. India also has one of the highest youth populations among major developed and developing countries, with a median age of 26.2 years as of 2011, according to the CIA World Factbook, which is expected to drive the addition of almost 270 million workers to the labor pool between 2005 and 2025, fueling India’s economic growth for the next two decades, according to McKinsey Global Institute’s 2007 report The “Bird of Gold”: The Rise of India’s Consumer Market.
Over the past decade, India has been one of the fastest-growing economies globally with overall real gross domestic product, or GDP, almost tripling since 2001 and projected to continue to grow at an annual rate of 6.7% between fiscal years 2011 and 2025, according to The Economist Intelligence Unit. India’s GDP on a purchasing power parity basis was $4.95 trillion in fiscal year 2012, according to The Economist Intelligence Unit, making India the third largest economy in the world after the United States and China and one of the largest global consumer markets – with private consumption contributing 57.2% of overall GDP.
| Nominal GDP (purchasing power parity basis, trillions of dollars) | Calendar Year Ended December 31, 2011 Nominal GDP (purchasing power parity basis, trillions of dollars) |
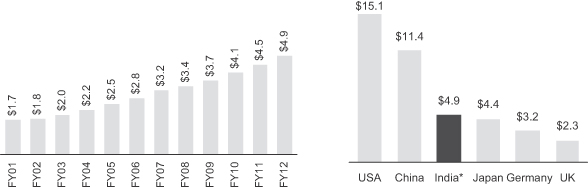
| Source: | The Economist Intelligence Unit |
| * | Data for India is for fiscal year ended March 31, 2012 |
According to the McKinsey Global Institute report, consumption is expected to increase 7.3% annually between 2005 and 2025, reaching more than $740 billion by 2015 and $1.5 trillion, by 2025, supported by income levels that are estimated to almost triple during that period. During the period from 2005 to 2025, McKinsey expects the percentage of Indians in the middle class to increase from 5% to 41% and the percentage of Indians living in urban areas to increase from 29% to 37%. As the income of Indian consumers rises, McKinsey expects the percentage of spending on discretionary items to grow from 54% as of 2005 to
84
Table of Contents
approximately 61% by 2015 and 72% by 2025. Driven by these economic developments, Indian society is rapidly evolving from a mostly rural and agricultural society into a more urban and consumption-oriented society. Economic liberalization in India, which began in 1991, has also contributed to the rising income levels and changing consumption patterns that are transforming the Indian consumer landscape.
Aggregate Private Consumption in India (US$ billion) | Share of Population in Each Income Bracket (millions of people, except percentages) | Increase in Urban Population (as a percentage of total population) | ||
|
|
|
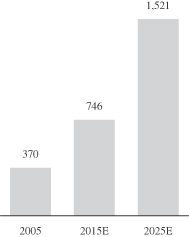
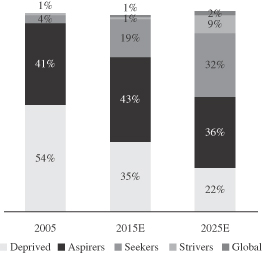
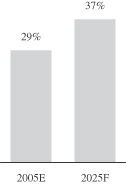
Note: Seekers and strivers are considered part of the Indian middle class. Annual Income in rupees: Deprived < 90,000, Aspirers 90,000-200,000, Seekers 200,000-500,000, Strivers 500,000-1,000,000, Global > 1,000,000
| Source: | McKinsey Global Institute |
A Large, Growing and Underserved Retail Market
Overall economic development in India is expected to drive significant growth of the Indian retail market. The overall size of the Indian retail market is estimated to be 23 trillion ($450 billion) for fiscal year 2012, and is estimated to grow at a CAGR of 15% to reach 47 trillion ($920 billion) by fiscal year 2017, according to Crisil Research.
While India is a large retail market by global standards, it has remained a highly fragmented market with very limited penetration for organized retail outside the large cities. Furthermore, even in large cities, organized retail penetration is significantly lower than in developed as well as many developing markets. As a result, the Indian retail market is dominated by traditional stores that provide their local communities with limited product choices and lack the sophistication typically found at organized retail outlets.
The growth of the Indian middle class and its exposure to global consumer trends and brands are expected to drive increased overall demand for western-style retail shopping. Organized retail as a percentage of the overall retail market is expected to grow from 7.1% in fiscal year 2012 to 10.1% in fiscal year 2017, according to Crisil Research, fueled by rising affluence among urban consumers, growing preference for branded products and higher levels of aspiration by younger consumers.
85
Table of Contents
Retail Market Size in India (trillions of rupees) | Organized Retail as a Percentage of Total Retail in India | |
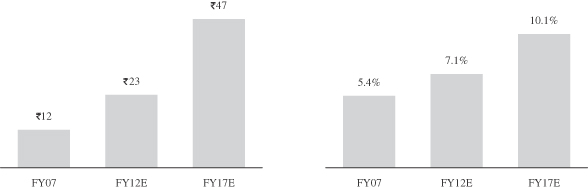 | ||
Source: CRISIL Research, India
Rapidly Increasing Internet, Television and Mobile Penetration
Over the past decade, India has seen a rapid growth in Internet, television and mobile penetration, driven by demand by consumers and aggressive private sector investments that have resulted in innovative consumer-facing offerings.
| • | Television. India is the world’s third largest television market, according to FICCI-KPMG, with 539 million television viewers in 2011 and is expected to grow to 789 million by 2016, representing a CAGR of 7.9%. In addition, India has approximately 97 million non-television viewing households, or 40.0% of all households in India, providing significant room for further growth, driven by the changing consumer landscape. According to the FICCI-KPMG report, at the end of 2011, there were approximately 119 million pay television households in India. By 2016 the number of pay television households is projected to grow to approximately 176 million, at a CAGR of 8.1%, thus significantly growing the potential coverage for our television channel. |
| Television Viewers (millions) | Pay television households (millions) | |
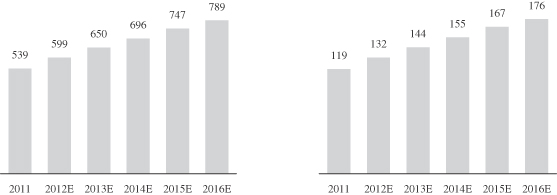 | ||
Source: FICCI-KPMG Report
| • | Internet. According to FICCI-KPMG and Internet World Stats, in 2011, India had the third largest population of Internet users after China and the United States. Overall penetration is still relatively low in India, with 2011 Internet penetration at 10.8%, or approximately 132 million users, as compared to over 78.3% in the United States. Growing income levels, a relatively young population and increasing broadband penetration are driving Internet growth. FICCI-KPMG and The Economist Intelligence |
86
Table of Contents
estimate Internet penetration will reach 42.2%, or approximately 546 million users, by 2016, representing a CAGR of 32.8% since 2011. In addition, the number of broadband wireline connections is expected to grow from 14 million in 2011 to 51 million by 2016. |
Internet Subscribers (millions) | Internet Subscribers in India (millions) | |
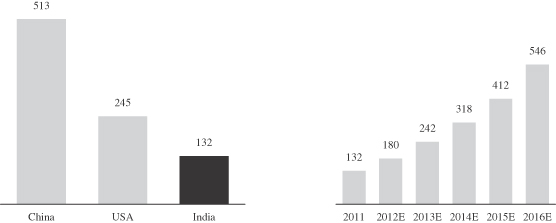 | ||
Source: Internet World Stats and FICCI-KPMG
| • | Mobile Internet. Expanding 3G networks and broadband wireless access on mass-market smartphones are expected to transform India’s Internet user base, with the number of wireless Internet connections expected to grow from 65.0 million in 2011 to 392.0 million by 2016, representing a CAGR of 43.2%, and active Internet enabled smartphones increasing from 10 million in 2011 to 264 million in 2016, according to FICCI-KPMG. |
| Wireless Internet Connections in India (millions) | Active Internet Based Smartphones in India (millions) | |
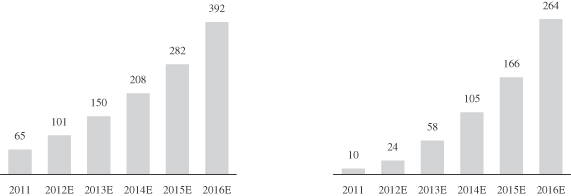 | ||
Source: FICCI-KPMG
Our Opportunity
Digital commerce has a number of benefits which are highly relevant to the Indian consumer market, given its characteristics and challenges:
| • | Selection and Availability. Our digital commerce platform provides Indian consumers with a wide variety of product choices that are typically unavailable to them in their local area due to the lack of organized retail in India. In addition, the growth of physical outlets is constrained by the expense and |
87
Table of Contents
limited availability of quality real estate in desirable locations, further limiting competition and consumer choice. |
| • | Ease and Comfort. For consumers in locations where goods are potentially available, high levels of traffic congestion, the lack of public transportation and the limited availability of shopping centers often result in a time-consuming and often unpleasant shopping experience. |
| • | Consumer Pricing. The Indian consumer is highly price sensitive, and focused on securing the “best deal.” Because of our scale and efficiency, our Sourcing Partners are able to provide competitive prices to consumers. |
| • | Payment Options. We offer Indian consumers the choice of making payments through multiple methods, including cash on delivery, or COD, effectively matching the experience at a typical retail outlet while providing consumers with the comfort of shopping from home. |
Our Value Proposition for Consumers
We believe that Indian consumers are looking to transact through a trusted digital commerce platform with highly reliable service that provides them with a superior shopping experience. Our digital commerce platform leverages our scale, reach and deep industry know-how to offer them a comprehensive solution that has the following attributes:
| • | Trust. Our presence across multiple channels has helped us gain consumer familiarity and trust. We believe that television with its mass reach and appeal is still the most popular medium to establish trust in India. The HomeShop18 brand has benefitted immensely from having a 24-hour television channel. We have further reinforced the trust in our brand with the launch and subsequent growth of our user-friendly Internet channel. Our credibility is further enhanced by our focus on customer service, driving overall consumer satisfaction. |
| • | Reach.Our multi-channel platform provides our Sourcing Partners access to over 250 million consumers. This is supported by our technology-enabled delivery and logistics network, which enables us to deliver products to consumers in over 3,000 towns and cities across India. |
| • | Selection and Quality.We showcase one of the largest selections of brands comprising over 500 global and local brands across all major product categories such as books, mobile phones, cameras, computers, electronics, apparel, jewelry, home & kitchen, appliances, toys, health & beauty, baby, office stationery and gifts & flowers. This enables us to provide consumers with a wide choice of high quality products including a number of unique and innovative products and offerings which may not be easily available otherwise. As of June 30, 2012 our digital commerce platform showcased over 12 million different SKUs. |
| • | Value. We are able to leverage our reach and logistics network to drive higher volumes for our Sourcing Partners, enabling them to derive economies of scale and remove inefficiencies in their sourcing and manufacturing, and ultimately enhancing the value proposition for consumers. Our Sourcing Partners typically offer benefits to consumers in the form of either attractive pricing or through other initiatives, which other shopping destinations or platforms may not be able to secure consistently. |
| • | Payment Choices and Flexibility. We offer consumers multiple payment options, ranging from credit cards, debit cards, net banking, COD, demand drafts and gift certificates, helping us facilitate consumer acceptance of digital commerce. |
88
Table of Contents
Our Value Proposition for Sourcing Partners
Our digital commerce platform offers Sourcing Partners a single point of access to consumers throughout India and across various demographics by providing them the following advantages:
| • | Nationwide Reach. Through our platform, our Sourcing Partners are able to reach over 250 million consumers. We are able to expand the addressable market for our Sourcing Partners by providing access to markets that may not be reachable through traditional marketing and distribution channels. For example, a regional manufacturer in India can potentially market and sell its products to consumers located throughout India without incurring prohibitively high advertising and distribution expenditure. |
| • | New Distribution Platform. Our digital commerce platform provides our Sourcing Partners a new distribution channel and enables them to bypass the multi-layer supply chain and deliver their products directly to consumers. This enables them to save costs, improve efficiencies and thereby offer more competitive prices to consumers. |
| • | Multi-channel Approach. We provide a single point of access for our Sourcing Partners to showcase their products through our Internet, television and mobile channels. We believe that showcasing the same products on multiple channels enhances product and brand recognition among consumers. |
| • | Branding and Visibility. We offer valuable marketing and product demonstration opportunities for our Sourcing Partners and the brands they carry. We believe that television is still the most effective brand building medium in India, with a viewership of over 500 million. We believe television allows our Sourcing Partners to showcase their products and create awareness and visibility for them at a national level. Our program hosts convey detailed information regarding featured products, sometimes with the assistance of a representative from the product vendor, manufacturer or brand. In addition to explaining the functionality of the product, we often highlight the value proposition of that product. Our website also hosts virtual brand “stores” that allow for theme merchandising of brands in a dedicated space on our website. In addition, our website offers our Sourcing Partners the opportunity for detailed consumer education through consumer reviews and product videos, tools for selecting desired products and interactive product evaluation. |
| • | Real-time Consumer Feedback.Our digital commerce platform enables an efficient and cost-effective means for product testing, consumer analytics, online product reviews and consumer feedback. This enables our Sourcing Partners to obtain real-time consumer feedback on their products, helping them to improve their product selection and marketing strategies. |
Our Strengths
We believe that the Indian digital commerce opportunity, our multi-channel solution to address this and our strong execution have resulted in the following key strengths for us:
Untapped Market Opportunity
We are addressing India’s large and growing retail market, estimated to be 23 trillion ($450 billion) for 2012, and estimated to grow at a CAGR of 15.0% to reach 47 trillion ($920 billion) by fiscal year 2017, according to Crisil Research. Our digital commerce platform addresses the growing consumer market through the Internet, television and mobile channels. India is the world’s third largest television market, according to FICCI-KPMG, with 539 million television viewers in 2011. FICCI-KPMG estimates Internet penetration will reach 42.3%, or approximately 546 million users, by 2016. Expanding 3G networks and broadband wireless access on mass-market smartphones are expected to transform India’s Internet user base, with the number of wireless Internet connections expected to grow from 65.0 million in 2011 to 392.0 million by 2016.
89
Table of Contents
An Established Brand
Through our combined Internet, television and mobile presence we have become one of India’s best known brands in the digital commerce industry. Our presence across multiple channels has helped us gain consumer familiarity and trust. We believe that television with its mass reach and appeal is still the most popular medium to establish trust in India. The HomeShop18 brand has benefitted from having a 24-hour television channel. We believe that the familiarity and trust gained from our television presence has facilitated the rapid recognition of our website, with over 45% of June 2012 Internet traffic coming directly to our website, according to Google Analytics.
Large, Engaged and Loyal Consumer Base
Since our launch, over 4.5 million consumers have placed orders through our platform, and over 6.5 million transactions have been executed through our platform. Our repeat business rate in the fourth quarter of fiscal 2012 reached 39.9%, demonstrating the value of our service and the loyalty of the consumer base.
Scale Benefits
The scale of our operations and our ability to access 250 million consumers in over 3,000 towns and cities across India make us an important relationship for our Sourcing Partners. We are able to expand the addressable market for our Sourcing Partners by providing them access to markets that may not be reachable through traditional marketing and distribution channels. Through our platform, Sourcing Partners are able to sell larger volumes of products across the country. Leveraging our multi-channel platform, we have developed merchandising and distribution capabilities in a market that is still dominated by smaller-scale competitors who operate at a local or regional level.
Extensive Selection
We are able to offer consumers a wide selection of products across multiple categories, such as books, mobile phones, cameras, computers, electronics, apparel, jewelry, home & kitchen, appliances, toys, health & beauty, baby, office stationery and gifts & flowers. As of June 30, 2012, our digital commerce platform showcased over 12 million different SKUs and over 500 international and domestic brands, including Canon, Fabindia, Godrej, Micromax, Reebok, Samsung and Whirlpool.
Speed to Market
Our direct-to-consumer solution enables brands and Sourcing Partners to launch new products quickly and efficiently on a nationwide basis, by-passing the multi-layer supply chain. Introduction of new products is also facilitated by the ability to demonstrate and explain these products through our digital commerce platform. These factors increase the attractiveness of our platform to brands and Sourcing Partners for the introduction of new products to the market.
Consumer Data and Analytics
Our digital commerce platform enables an efficient and cost-effective means for product testing, consumer analytics, online product reviews and consumer feedback. This enables our Sourcing Partners to obtain real-time consumer feedback on their products, helping them to improve their product selection and marketing strategies.
Experienced Management Team with Proven Track Record
Our management team successfully launched our business in 2008, and has helped it grow to become one of India’s leading digital commerce platforms. With diverse yet complementary backgrounds, the team benefits
90
Table of Contents
from deep industry expertise across media, digital commerce, consumer products, retail, logistics and IT. We believe that our management team’s collective experience and strong execution capabilities has and will enable us to continue to realize significant growth opportunities.
Our Growth Strategy
We intend to grow our business by focusing on the following growth strategies:
Grow Consumer Base
As we operate in a market that is enjoying rapid growth with many “first-time users,” we believe that we have a unique opportunity to leverage the strength of our platform and our brand in order to attract new consumers. We intend to continue to invest in our brand through marketing activities and by providing a superior consumer experience.
Grow Our Sourcing Partner Base
We aim to grow the number of key Sourcing Partners we have to facilitate the growth of our platform across geography and products and further diversify our Sourcing Partner relationships. We believe the quality of our Sourcing Partners has enhanced our business to date, and in evaluating future Sourcing Partners, we will focus on their product sourcing and manufacturing capabilities, infrastructure, use of technology and customer orientation.
Expand Product Catalog
We are continuously working with our Sourcing Partners to introduce new products and product categories to our platform. We have recently scaled up the book offerings on our Internet channel following our acquisition of the Coinjoos.com business. We rely on the insights we gather from analyzing the purchase behavior and shopping preferences of the existing consumer base. By expanding product offerings, we believe that we will be able to attract more consumers to our platform and improve repeat business from existing consumers.
Expand Our Delivery Infrastructure
We plan to continue to build our delivery capabilities to increase penetration into more cities and towns throughout India and to improve consumer experience. We will also continue to roll out a HomeShop18 branded and dedicated delivery network in more key towns and cities.
Leverage Our Scale
With the growth and expansion of our platform, we will seek to drive further benefits from scale. We intend to leverage our scale to secure better terms and lower prices for consumers. We believe the growth of our platform will also improve commercial terms for our Sourcing Partners.
Extend Our Mobile Channel
We recently introduced a mobile website and are developing mobile device applications for multiple mobile operating systems. We will continue to innovate in line with changing technology and consumer behavior in India to expand consumer access to our platform.
Strategic Alliances and Potential Acquisitions
In addition to growing our business organically, we may pursue selected strategic alliances and potential strategic acquisitions that are complementary to our business and operations, including opportunities that can help us expand our brand to new consumer segments, expand our product offerings and improve our technology infrastructure.
91
Table of Contents
Our Channels
Television
Our HomeShop18 television channel was launched in 2008 and broadcasts home shopping programs 24 hours a day, seven days a week, with both live and recorded content.

We enter into contracts with DTH and cable operators to carry our television channel on their pay television platforms. We also pay other television channels to air our multi-product promotional programs.Since commencing operations in 2008, we have formed strong relationships with DTH and cable operators. We have entered into multi-year distribution agreements with all of the DTH operators carrying our channel. Agreements with cable operators generally tend to be single-year contracts. As of March 31, 2012, our television channel was available across most Indian DTH operators, including Reliance Big TV, Videocon d2h, Dish TV and Airtel DTH. As of March 31, 2012, our television channel reached more than 55 million households across India.
All of our television programs are produced in our studios and production facilities located outside Delhi in the suburb of Noida. Our television programming is intended to promote sales and consumer loyalty through a combination of product quality, value, wide selection, coupled with product information and entertainment. Programming is divided into shows of varying duration. Each show has a host who presents and conveys information regarding featured products. The hosts are sometimes supported by expert representatives from the product vendor, manufacturer or brand to enable better presentation of products and features. Our programming is primarily in Hindi.
We also air longer, infomercial-type shows focused on a particular brand or category of products which may feature a celebrity personality. For example, we air cooking programs featuring renowned Indian chef Sanjeev Kapoor and the Sanjeev Kapoor-branded kitchenware is promoted during this show. We continually monitor the performance of our shows and sales to determine which products to feature and at what days and times. We make these adjustments to achieve a schedule of programs with content that we believe maximizes our overall revenue and profitability.
Internet and Mobile
Our HomeShop18.com Internet website was launched in January 2011, and our mobile website, m.HomeShop18.com, was launched in August 2012. Our Internet and mobile channels host a wide range of products, including all of the merchandise offered on our HomeShop18 television channel. Products listed for sale are generally accompanied by video demonstrations, photographs, summary descriptions, consumer ratings, consumer comments and reviews, together with any discounts or other promotions offered on the products.
92
Table of Contents
Our website features a consumer-friendly and intuitive user interface designed specifically to address Indian consumers’ purchase patterns. Our website enables consumers to conveniently discover search for, find and purchase the products they are looking for. We have designed our website to create a reliable, secure, enjoyable and convenient online shopping experience for consumers in order to promote brand loyalty and repeat purchases.
| • | Browsing. Our website provides consumers with useful information on the products for sale, such as a description of product features and images of the product. Our website gives us the functionality to promote selected products dynamically. |
| • | Searching and Sorting. Our HomeShop18.com website is organized into 15 main sections: Books, Mobile Phones, Cameras, Computers, Electronics, Apparel, Jewelry, Kitchen, Appliances, Toys, Health & Beauty, Baby, Brands, Office & Stationery and Gifts & Flowers. We provide search tools based on different criteria such as product category, price and brand to enable consumers to find desired products quickly and efficiently. |
| • | Recommendation Engine. Our website provides visitors with product recommendations based on their searches, navigation activity and previous purchases on our website. |
| • | Product Reviews and Online Community. We encourage consumers to write and post their reviews and comments on products on the relevant product page after each purchase. These provide valuable and independent information to other consumers who are interested in these products. |
| • | Checking Out. To purchase products, consumers click to add an item to their virtual shopping cart. Consumers can add or remove items in their shopping cart before making a final purchase decision. First-time purchasers need to set up an account and fill out contact information, shipping and payment details. Existing consumers can access their preferred checkout options by logging into their accounts. Our information system automatically confirms each order by mail shortly after the order is placed and updates consumers by mail or mobile phone text message, or SMS, shortly after orders are shipped. |

93
Table of Contents
Our Product Offerings
Product Categories
We showcase a selection of products from popular international and domestic brands. The following table describes the current product categories showcased on our platform.
Books | Books across various categories including a comprehensive range of Indian and international titles. |
Mobile Phones | Range of mobile phones from various international and domestic brands which are complemented by relevant accessories including fashion accessories for mobile phones. |
Cameras | Cameras from various international including both entry level and high end digital cameras as well as lenses and other accessories such as tripods, batteries. |
Computers | Laptops, desktops, tablets and a full range of accessories such as storage devices, USB drives etc. |
Electronics | LCD / LED TVs and other home entertainment products. |
Apparel | • | Womenswear — Women’s apparel, featuring a variety of apparel and styles for different age groups, including ethnic and traditional wear, casual wear, jeans, dresses, lingerie, pajamas and maternity clothes. |
| • | Menswear — Men’s apparel, featuring a variety of apparel and styles for different age groups, including ethnic and traditional wear, formal wear, casual and smart-casual T-shirts, innerwear, polo shirts, jackets and pants. |
| • | Shoes and accessories such as wallets, belts and handbags for women and men. |
Jewelry | Various domestic brands for semi-precious and precious jewelry; extensive range of ethnic non-precious jewelry; and work wear jewelry. |
Home & Kitchen | Extensive range of home and décor products such as serve ware, cook ware, bake ware, furnishings, cutlery and furniture items. |
Appliances | Kitchen and other home appliances such as microwave ovens and refrigerators. |
Toys | Toys and games for boys, girls, infants and toddlers of all age groups including traditional Indian toys and games. |
Health & Beauty | High quality, affordable skin care and cosmetic products from international and domestic brands, including cleansers, lotions, face and body creams, face masks, sunscreen, foundations, lipsticks, eye shadows and nail polish. |
94
Table of Contents
Baby | Quality range of products for various needs of toddlers and infants such as diapers, feeding bottles and other products. |
Office Stationery | Small office and school needs including products such as stationery and art supplies. |
Gifts & Flowers | Selection covers all major gift occasions in India — includes flowers for different occasions, traditional Indian sweets, gold coins, chocolates and third party gift vouchers. |
Product Mix
The pie chart below represents the mix of gross transaction value of products by category in fiscal year 2012.
 |
Note: Digital includes Mobile Phones, Cameras, Computers and Electronics categories. Home includes Home & Kitchen, Appliances, Toys and Baby categories. Lifestyle includes Apparel, Jewelry, Health & Beauty, Office Stationery and Gifts & Flowers categories.
Our Sourcing Partners
We refer to the distributors and manufacturers that offer and sell products through our platform as our Sourcing Partners. We source products showcased on our platform from over 450 Sourcing Partners across India. Our Sourcing Partners may offer and sell products across multiple brands and categories and the same brand may also be offered and sold by multiple Sourcing Partners. For fiscal years 2010, 2011 and 2012, our top 10 Sourcing Partners accounted for 59.1%, 65.8% and 77.4%, respectively, of our gross transaction value. Also, for fiscal years 2010, 2011 and 2012, our top 10 Sourcing Partners accounted for 61.1%, 65.2% and 79.6%, respectively, of our gross commission revenue. For those years, the number of Sourcing Partners that each accounted for over 5% of our gross transaction value was three, five and two, respectively. For fiscal year 2012, our five top Sourcing Partners by contribution to total gross transaction value were: North India Top, Spice Retail, Nakamichi Techno Private Limited, New Age and Aanya. North India Top is currently our largest Sourcing Partner. For fiscal years 2010, 2011 and 2012, North India Top accounted for 1.0%, 23.4% and 47.6%, respectively, of our gross transaction value. North India Top’s contribution to our gross transaction value has grown as it has expanded the categories of products that it showcases on our platform.
We have implemented a methodical selection process for our Sourcing Partners. We carefully select prospective Sourcing Partners, choosing to work only with those that have a strong reputation in the market and offer high quality and differentiated products at competitive prices. Once a potential Sourcing Partner is identified, we conduct due diligence reviews on its qualifications, including whether it holds the proper business operation licenses and trademark registration certificates or license agreements in relation to any branded products. This review process helps to ensure that we only enter into agreements with high quality Sourcing Partners that can meet our consumers’ expectations.
We are typically required to remit payments to our Sourcing Partners within 10 to 40 days from the date products are sold by them through our platform. We net out commissions and certain other amounts, such as
95
Table of Contents
sales taxes and refunds, and any freight and collection expenses agreed to be reimbursed by Sourcing Partners that are owed to us prior to remitting payment to our Sourcing Partners.
We extend credit to our Sourcing Partners from time to time to provide them with working capital to facilitate their growing sales through our platform. See “Management’s Discussion and Analysis of Financial Condition and Results of Operation” for more information. Our use of the term “Sourcing Partner” does not mean that we have formed any legal partnerships with any of our Sourcing Partners.
Logistics
Logistics are handled by our Sourcing Partners and courier companies appointed by us. Sourcing Partners provide us regular updates on the quantities of their products that are available for sale through our platform. Upon receipt of an order through our platform, Sourcing Partners pack and invoice products for shipment. Courier companies collect products from the Sourcing Partners’ premises and deliver to the consumers. Through our information technology systems, we disseminate order and delivery information to Sourcing Partners and courier companies. To ensure consumer satisfaction, we track these activities on a real-time basis. This modern and scalable logistics infrastructure is relatively new for India.
We continue to build our dedicated delivery team and infrastructure across key towns and cities through our agreements with third-parties. We offer free shipping to consumers for all products, though we receive reimbursements of some of these costs from certain Sourcing Partners.
Payment
We accept payments via COD, credit card, debit card, net banking, check, demand drafts and gift certificates.
In COD sales, consumers pay courier companies in cash upon receipt of their purchases. COD facilitates the growth of digital commerce in India in light of the low penetration of credit and debit cards in India. For fiscal years 2010, 2011 and 2012, 85.6%, 86.3% and 83.3%, respectively, of our gross transaction value was settled on a COD basis. We generally limit COD sales to orders of 10,000 ($200) or less.
In COD sales, the courier companies act as our collection agents. They are typically required to remit payments they have collected over 10-day periods within 10 days following the end of each such period. In addition to this remittance cycle, they invoice us at the end of every month separately for the freight and collection expenses taxes and other statutory dues for the products shipped during the month. For convenience and efficiency, these cycles are documented and administered separately from each other. Our couriers are reputable domestic or international companies and are also generally required under our agreements with them to procure bank guarantees to secure their obligation to collect and remit COD payments. Our couriers are also liable to pay interest to us for any delays in remittances of payments beyond the time period permitted under the agreements.
Non-COD payments are made directly to us, primarily through electronic payment gateways.
Call Center and Customer Service
Our call center operates 24 hours a day, seven days a week to execute sales and provide customer support. Consumers can call our call center toll-free in India or communicate with call center operators by email. We maintain separate phone numbers for our television and Internet channels. Our operators can converse with consumers in Hindi and English. These operators participate in a four- to five-week sales and customer service training program conducted by us before commencing work and are regularly updated to gain familiarity with new products, processes and systems.
96
Table of Contents
To achieve cost efficiency and scalability, we outsource call center operations to third parties. Magus provides call center staffing for our television platform. These operators are located at our leased premises in Noida, and the space and infrastructure used by them are owned or leased by us. We are in the process of shifting the call center staffing for our Internet business to Magus as well. Magus will replace existing call center staffing services provider iEnergizer, which has been providing our Internet call center staffing and has been hosting these operators at their Noida facilities and providing the necessary telecommunications and other infrastructure for their activities.
At HomeShop18.com, we provide consumers with an array of online self-service features. For example, a consumer can use the “my-account” website features to track the order and shipment status, review estimated delivery dates, cancel unshipped items as well as change delivery information.
Technology
We have implemented an end-to-end information technology, or IT, infrastructure system that integrates order placement, order notification to Sourcing Partners and couriers, automated inventory and shipment tracking, comprehensive billing and superior customer service and support capabilities. Our IT infrastructure provides us with the ability to process large transaction volumes, promote our broad selection of products and respond quickly to new product releases or inventory-related issues at our Sourcing Partners. Our IT systems are designed to ensure our ability to quickly and efficiently scale up our operations as our business continues to grow. Moreover, our customer relationship management and business intelligence systems enable us to effectively gather, analyze and make use of consumer behavior and transaction data. We utilize this information to guide our marketing initiatives and enable our Sourcing Partners to develop new product offerings for consumers. We provide our solutions through a combination of in-house and third party technology systems.
Our IT systems are hosted in a data center maintained by a third party in Mumbai which provides us with co-location services, advanced monitoring and management of applications.
Marketing
One of the principal means of marketing for our Internet and mobile channels is promotional activity, including prominent display of our website address, on our television channel. In addition, our marketing team frequently hosts product launches and conducts promotional events.We promote our platform through various marketing initiatives, including the following:
| • | Online advertising. We purchase keywords search advertisements on popular search engines, banner advertisements and other forms of advertisements on various portals and other websites we believe are visited by Internet users who may be potential consumers. |
| • | Promotion by Brands.Due to our scale and nationwide reach, many brands include HomeShop18 as a part of their promotional activities which we believe drives consumers to our platform. |
| • | Offline advertising. Our offline advertisements include television advertisements designed to increase public awareness of our brand and to attract new users to our platform. |
| • | Gift coupons. We offer gift coupons to consumers based on the value of the orders they make through our platform. |
Competition
We face competition for consumer attention, Sourcing Partners and attractive commercial terms. When competing for consumer attention, we compete on the basis of a number of factors including our brand recognition, the quality of the content on our channels, range, quality and pricing of products on our platform, the reliability and timing of delivery and customer service. When competing for attractive Sourcing Partners, we
97
Table of Contents
compete based on factors such as size of consumer base, reach of logistics network, scale of our multi-channel platform and our ability to showcase their products effectively. Our key competitors include:
| • | television shopping companies, such as Star CJ Alive; |
| • | digital commerce companies, such as flipkart.com and ebay.in; and |
| • | physical stores and outlets. |
Intellectual Property
We have applied for the registration of “HomeShop18” under several classes as a trademark in India and have received registration under one class. We have registered domain names in India, including for www.HomeShop18.com, www.HomeShop18.in, and www.HomeShop18.co.in, among others. We also license certain intellectual property, in particular the use and appearance of “18” in our trade names and logos, from Network18.
We protect our intellectual property in India through a combination of copyright, trademark and Internet/domain name statutes and laws and contract provisions. Despite our efforts to protect our proprietary information however, third parties may be able to obtain and use our proprietary information without authorization or to develop similar technology independently. Policing unauthorized use of our intellectual property is often difficult and the steps taken may not be sufficient to prevent the infringement by unauthorized third parties of our intellectual property. Piracy, including in the digital environment, continues to present a threat to revenues from products and services based on intellectual property.
Third parties may challenge the validity or scope of our intellectual property from time to time, and such challenges could result in the limitation or loss of intellectual property rights. Irrespective of their validity, such claims may result in substantial costs and diversion of resources that could have an adverse effect on our operations. We have not made any material intellectual property claims against any third parties.
Employees
As of March 31, 2010, 2011 and 2012, we had 191, 293 and 354 permanent employees, respectively. The following table shows a breakdown of our permanent employees as of March 31, 2012 by category of activity and geographic location.
| Number of Employees as of March 31 | ||||
Division/Function | 2012 | |||
Television broadcasting | 114 | |||
Sourcing | 94 | |||
Operations | 48 | |||
Website | 22 | |||
Technology | 44 | |||
Management, finance and administration | 27 | |||
Marketing and customer relationship management | 5 | |||
|
| |||
Total | 354 | |||
|
| |||
98
Table of Contents
| Number of Employees as of March 31 | ||||
Location | 2012 | |||
Noida | 263 | |||
Bengaluru (formerly Bangalore) | 78 | |||
Mumbai | 13 | |||
|
| |||
Total | 354 | |||
|
| |||
The steady increase in the number of employees is due to the expansion of our business over the period.
Separately, as of March 31, 2012, we had 83 consultants (on a contract basis) for various functions, and as of that date we employed 129 temporary employees. In addition, as of March 31, 2012, Magus had 529 call center operators dedicated for our television platform, and iEnergizer had 91 call center operators dedicated for our Internet platform.
None of our employees is represented by a labor union. We believe that our relations with our employees are good. We have not experienced any work stoppages and we consider our relations with our employees to be good.
Our future success will depend upon our ability to attract and retain qualified personnel. Competition for qualified personnel remains intense and we may not be successful in retaining our key employees or attracting skilled personnel.
We have strived to develop a culture that encourages creativity and individual thought and our compensation system matches our culture. We also provide share options and other share-based compensation to our management and certain other employees, which we believe has the effect of more closely aligning their personal interests with our overall financial performance. See “Management—Share Incentive Plans.”
Insurance
We maintain and annually renew insurance for losses (but not business interruption) arising from fire, burglaries well as terrorist activities for our Noida premises.
Facilities
Our primary facility is our premises in Noida, a suburb of Delhi which is in the Indian state of Uttar Pradesh, which serves as our corporate headquarters and houses our television studios and production facilities and the Magus call center operations. We lease this facility, which is approximately 70,000 square feet, under a six-year lease which commenced in July 2007. The lease may be renewed at the end of six years by both parties in writing on terms and conditions that are mutually decided.
We also lease another facility in Noida, which is approximately 38,600 square feet along with certain fixed and movable assets, under a three-year lease which commenced in September 2012. The lease may be renewed at the end of three years by both parties in writing on terms and conditions that are mutually decided. This facility is intended to house the Magus call center operations which are currently located at the primary Noida facility.
We also lease 27,995 square feet of office space in the city of Bengaluru (formerly Bangalore). Office space used by us in Mumbai is leased by Network18.
99
Table of Contents
Legal Proceedings
In August 2006, Mr. Victor Fernandes and certain others filed a lawsuit as a derivative action on behalf of e-Eighteen.com Limited, or e-Eighteen.com, before the High Court of Bombay against Mr. Raghav Bahl and several other Network18 affiliates, including our subsidiary, TV18 Home Shopping Network Limited.
The plaintiffs are minority shareholders of e-Eighteen.com and have alleged that Mr. Bahl, TV18 Broadcast Limited, or TV18, (formerly Television Eighteen India Limited which has since been merged with Network18) ICICI Global Opportunities Fund and e-Eighteen.com had entered into a subscription and shareholders agreement dated September 12, 2000 under which Mr. Bahl and TV18 had undertaken that any expansion, development or evolution of the activities of the e-Eighteen.com and the group companies and any opportunity offered to the promoters of TV18 would only be pursued or taken up through e-Eighteen.com or its wholly owned subsidiaries. The plaintiffs alleged that Mr. Bahl and TV18 promoted and developed various businesses through various companies which should have rightfully been undertaken by e-Eighteen.com or its wholly owned subsidiaries. The plaintiffs also alleged that by not adhering to the agreement Mr. Bahl and TV18 caused monetary loss to e-Eighteen.com as well as to the plaintiffs. The plaintiffs have valued their lawsuit at 30.1 billion for the purposes of calculating court fees and at 999.4 million in order to qualify for the jurisdiction of the High Court of Bombay. The plaintiffs have asked the court, amongst other things, to direct the defendants to transfer to e-Eighteen.com all their businesses, activities and ventures along with all assets and intellectual property, which transfer would include our subsidiary and its assets.
In 2006 the plaintiffs filed an application seeking temporary relief which was dismissed by the court in 2008. An appeal against the dismissal of the notice of motion was dismissed by the court in 2011. The original lawsuit is still pending and will be heard by the court in due course of time. Based on legal advice by legal counsel, we believe that the above claim made by the plaintiffs is without merit and unlikely to succeed and have accordingly made no provisions in our financial statements. We and the other defendants are vigorously defending the lawsuit.
Separately, we are involved in several consumer complaints which are pending at various forums in India where a consumer has made us a party to the complaint. In general, these complaints relate to products sold or offered through our platform that are allegedly defective or fail to perform as expected, even though the performance of these products is solely the responsibility of the Sourcing Partners who sold them or their respective manufacturers. In addition, from time to time we receive notices and complaints from consumers which are incidental to our ordinary course of business, some of which may result in cases being filed against us in various forums if we are unable to resolve or mediate to resolve such complaints satisfactorily.
Although the results of litigation and claims cannot be predicted with certainty, we currently believe that the final outcome of these matters will not have a material adverse effect on our business. Regardless of the outcome, litigation can have an adverse impact on us because of defense and settlement costs, diversion of management resources and other factors.
100
Table of Contents
We are subject to various laws and regulations in India arising from our operations in India, including the operation of our website, television channel and call center. The following description is a summary of various sector-specific laws and regulations applicable to us.
Foreign Investment Regulations
Foreign direct investment, or FDI, in Indian companies is regulated by the Government of India under the Consolidated FDI Policy issued by the Department of Industrial Policy and Promotion, Ministry of Commerce, Government of India from time to time, or the FDI Policy. FDI in the broadcasting sector relating to uplinking a non-news and current affairs television channel is permitted up to 100%, with prior approval from the Foreign Investment Promotion Board, or FIPB. Further, FDI is permitted up to 100% under the automatic route for information technology sector and other service providers providing services like call centers and registered with Department of Telecommunications.
We have received an approval from the FIPB dated May 31, 2007 for uplinking a television channel in the non-news and current affairs category. This approval is subject to compliance with conditions specified by the Ministry of Broadcasting, or the MIB, for obtaining permission to uplink the channels and compliance to provisions of Cable Television Networks (Regulation) Act, 1995 and rules framed thereunder as amended from time to time.
Further, we have been registered under the “Other Service Provider” or OSP category as defined under the New Telecom Policy, 1999 of the Department of Telecommunications, Ministry of Communications and Information Technology, Government of India, or the MCIT, to operate our domestic call center at Noida, India for captive use. The permission is valid for 20 years from October, 2007. The registration is subject to the terms and conditions applicable to OSP as specified by the Department of Telecommunications. The Department reserves the right to suspend the registration if, it is necessary or expedient to do so in public interest or in the interest of the security of the state or for the proper conduct of the telegraphs.
FDI is restricted in retail trading, with 51% FDI permitted in multi-brand retail trading and 100% FDI permitted in single brand retail trading, subject to, in each case, prior approval from the Government of India and certain other conditions specified in the FDI policy. While the term “retail trading” has not been defined under the FDI policy, based on judicial guidance from the Indian courts, “retail trade” has generally been interpreted to mean “direct sales to the ultimate consumer.” We operate a digital commerce platform that provides our Sourcing Partners a multi-channel approach to demonstrate, market and sell their products. We do not directly sell products to any customers. Hence, we believe that we do not engage in retail trading, and our company is not subject to the terms of the FDI policy in relation to retail trading.
Uplinking and Downlinking Guidelines
We are also subject to Uplinking and Downlinking Guidelines issued by the MIB, and we are required to obtain permission for uplinking and downlinking non-news and current affairs television channels. We have obtained permissions to uplink and downlink “HomeShop18” from India on November 23, 2007. The permission to uplink is valid for a period of ten years and to downlink for a period of five years from November 23, 2007. We have made an application dated November 20, 2012 to the MIB for renewal of our downlinking permission which is currently pending. Certain key features of the Uplinking and Downlinking Guidelines are provided below:
| • | The minimum net worth of the company should be as specified. |
| • | Registration must be obtained for each channel, in accordance with the procedure laid down under the Policy Guidelines for Downlinking of Television Channels, or the Downlinking Guidelines, issued by the MIB. |
101
Table of Contents
| • | The MIB has the right to suspend the permission of the company for a specified period or the remaining period of permission if the company violates any of the terms and conditions of the permission. The MIB may also in public interest or in the interest of national security revoke the permission granted and the company could be disqualified for a period of five years. |
| • | The Uplinking Guidelines require the applicant company (in our case, our Indian subsidiary) to take prior permission from the MIB before effecting any change in the chief operating officer or the board of directors. |
| • | The Downlinking Guidelines require the applicant company to inform the MIB regarding any change in the directorship, key executives or FDI in the company, within 15 days of such a change. The company is also required to obtain security clearance for changes in its directors and key executives. Further the applicant company must obtain the prior approval of the MIB before undertaking any upgradation, expansion or any other changes in the downlinking and distribution system or network configuration. |
The Telecom Regulatory Authority of India Act, 1997, as amended
Pursuant to a notification dated January 9, 2004, issued by the MCIT, the television industry was brought under the ambit of the Telecom Regulatory Authority of India, or TRAI, by classifying “broadcasting and cable services” as telecommunications services. Under the Telecom Regulatory Authority of India Act, 1997, as amended, or the TRAI Act, the TRAI is empowered to make recommendations to the central Government of India including in connection with the timing for the introduction of new service providers, the terms and conditions of licenses issued to service providers, revocation of licenses and the type of equipment to be used by the service providers and to monitor the quality of service and inspect the equipment used in the network.
The TRAI Act established the TRAI, and the Telecom Disputes Settlement and Appellate Tribunal, or the TDSAT. The TRAI is the regulatory body for telecommunication services in India and the TDSAT is a special court to adjudicate disputes relating to telecommunications and related services and to act as the appellate authority in respect of any directions, decisions and orders of the TRAI.
The Telecommunication (Broadcasting and Cable Services) Interconnection Regulation, 2004, as amended
The TRAI promulgated the Telecommunication (Broadcasting and Cable Services) Interconnection Regulation, 2004, as amended, or the Interconnection Regulation, which covers, among other things, arrangements among service providers for revenue sharing. A broadcaster of television channels or its designated distributor in India is not permitted to engage in any practice or enter into any understanding, including an exclusive contract, with any distributor of television channels that would prevent any other distributor from obtaining television channels for distribution. Every television channel owner is required, upon request, to provide signals of its television channels to all distributors, including local cable operators, multi-system operators and headend-in-the-sky operators. Headend-in-the-sky operators and multi-service operators are also required, upon request, to re-transmit signals received from a television channel owner on a non-discriminatory basis to local cable operators. Prior to disconnecting a television channel signal, channel owners, multi-service operators or headend-in-the-sky operators are required to give three weeks notice indicating the reasons for the proposed action. All channel owners and their designated distributors in India, multi-service operators and local cable operators are required to mutually negotiate and finalize affiliation agreements in respect of Conditional Access System notified areas, as notified by the Government of India from time to time.
Program and Advertising Codes
The program and advertising codes have been prescribed under the Cable Television Network Rules, 1994. The program code disallows programs carried through cable service that, among other things, (i) offend good taste or decency, (ii) contain criticism of friendly countries, (iii) contain attacks on religions or communities, (iv) contain anything obscene, defamatory, deliberate or false, (v) are likely to incite violence, (vi) contain content which amount to contempt of court or (vii) are not suitable for unrestricted public exhibition.
102
Table of Contents
The advertising code disallows advertisements that, among other things, (i) deride any race, caste, color, creed or nationality, (ii) tend to incite people to commit crimes or cause disorder or violence or (iii) promote, directly or indirectly, the production, sale or consumption of certain products, including cigarettes, tobacco products, wine, alcohol, liquor or other intoxicants.
The Indian Wireless Telegraphy Act, 1933, as amended
Under the Indian Wireless Telegraphy Act, 1933, as amended, or the Wireless Act, no person is permitted to possess a wireless telegraphy apparatus without obtaining a license. Any person held in possession of a wireless telegraphy apparatus, other than a wireless transmitter, without a license is liable to be punished under the Wireless Act.
The Information Technology Act, 2000, as amended
Our Internet business is governed by the Information Technology Act, 2000, as amended, or the Information Technology Act. Under the Information Technology Act, we are subject to civil liability to compensate for wrongful loss or gain to any person arising from negligence in implementing and maintaining reasonable security practices and procedures with respect to sensitive personal data or information that we possess, deal with or handle in our computer systems, networks, databases and software.
Information Technology (Reasonable Security Practices and Procedures and Sensitive Personal Data or Information) Rules 2011 and the Information Technology (Intermediaries Guidelines) Rules 2011, or the Reasonable Security Practices Rules
The MCIT issued the Reasonable Security Practices Rules in April 2011 which clarify the scope of Section 43A of the Information Technology Act, which provides for protection of personal data and information. The Reasonable Security Practices Rules define “sensitive personal data and information” as information relating to (a) passwords, (b) financial information such as bank accounts, credit and debit card details, (c) physiological and mental health condition, medical records, (d) biometric information, (e) information received by body corporate under lawful contract or otherwise, (f) user details as provided at the time of registration or thereafter, and (e) call data records. Information freely available in the public domain or accessible is not treated as sensitive personal data. Further, the Reasonable Security Practices Rules provide for standards with respect to reasonable security practices in relation to collection, disclosure and transfer of information, which have to be adopted by a body corporate possessing, dealing or handling any sensitive personal data or information in a computer resource which it owns, controls or operates.
Further, in April 2011 the MCIT has also issued the Information Technology (Intermediaries Guidelines) Rules 2011, which require intermediaries, such as Internet service providers, web-hosting service providers, search engines, online payment sites, online auction sites and online market places to take steps not to publish, display, host or transmit certain kinds of content or information, including any information that is grossly harmful, harassing, obscene, libelous or invasive of another’s privacy, that infringes any patent, copyright or trademark or that violates any law in force, and to disable such information within 36 hours of notification by an affected person, failing which such intermediary will be subject to civil and criminal liability under the Information Technology Act.
Other Legislation
The Trade Marks Act, 1999, as amended
The Trade Marks Act, 1999, as amended, or the Trade Marks Act, governs the statutory protection of trademarks in India. In India, trademarks enjoy protection under both statutory and common law. The trademark once applied for, is advertised in the trade marks journal and oppositions, if any are invited and after satisfactory
103
Table of Contents
conclusion of proceedings, a certificate of registration is issued. Indian law permits the registration of trademarks for goods and services, which is valid for a period of 10 years unless renewed further. Certification trademarks and collective marks can also be registered under the Trade Marks Act. The registration of certain types of trademarks is prohibited under the Trade Marks Act, including trademarks that are not distinctive and which indicate the kind or quality of the goods. The right to use a mark can be exercised either by the registered proprietor or a registered user.
The Copyright Act, 1957, as amended
The Copyright Act, 1957, as amended, or the Copyright Act, governs copyright protection in India. Under the Copyright Act, copyright may subsist in original literary, dramatic, musical or artistic works, cinematograph films, and sound recordings. Software, both in source and object code, constitutes a literary work under Indian law and thus is afforded copyright protection. Following the issuance of the International Copyright Order, 1999, subject to certain exceptions, the provisions of the Copyright Act apply to nationals of all member states of the World Trade Organization.
While copyright registration is not a prerequisite for acquiring or enforcing a copyright, registration creates a presumption favoring ownership of the copyright by the registered owner. Copyright registration may expedite infringement proceedings and reduce delay caused due to evidentiary considerations. Once registered, copyright protection of a work lasts for 60 years.
104
Table of Contents
Directors and Executive Officers
The following table sets forth information regarding our directors and executive officers upon completion of this offering.
Name | Age | Position/Title | ||||
Directors: | ||||||
Raghav Bahl | 51 | Director | ||||
| Independent Director | ||||||
Ravi Chandra Adusumalli | 36 | Director | ||||
Deepak Gaur | 35 | Director | ||||
Joon Shick Kim | 41 | Director | ||||
Raman Deep Singh Bawa | 61 | Director | ||||
Sarbvir Singh | 40 | Director | ||||
Saikumar Balasubramanian | 37 | Director | ||||
Executive Officers: | ||||||
Sundeep Malhotra | 50 | Chief Executive Officer | ||||
Sachin Rastogi | 37 | Chief Financial Officer | ||||
Vishwanath Magapu | 43 | Chief Technology Officer | ||||
Dhruva Sankarakrishnan Chandrie | 43 | Chief Operating Officer, Television | ||||
Narasimha Jayakumar | 39 | Chief Operating Officer, Internet | ||||
Atrash Aman | 42 | Chief Operating Officer, Mobile | ||||
Raman Kumar Gulati | 56 | Director, Operations | ||||
Girish Keswani | 40 | Vice President, Human Resources | ||||
Unless otherwise indicated, the business address of each director and executive officer is FC-24, 7th Floor, Sector 16A, Film City, Noida-201301, Uttar Pradesh, India.
A description of the business experience and present position of each director and executive officer is provided below:
Directors
Raghav Bahl was appointed to our board of directors on April 29, 2006 as a nominee of Network18 Holdings Limited. He founded the TV18 group (now called the Network18 group) and also serves as the managing director of Network18, the parent company of our majority shareholder. Mr. Bahl has over 25 years experience in television and journalism. He won the Sanskriti Award for Journalism in 1994. He was selected by Ernst & Young as Entrepreneur of the Year in 2007. Mr. Bahl has been awarded the AIMA Award for the Media Person of the Year in 2011 and BMA recognized him as the Entrepreneur of the Year in 2011. Mr. Bahl has set up joint ventures with companies like CNBC, for CNBC TV18 and CNBC Awaaz, Time Warner, for CNN IBN, Forbes Media, for Forbes India magazine, A&E Networks, for History — TV18, and Viacom for Viacom18, which houses Colors, MTV, VH1 and Nickelodeon operations in India. Mr. Bahl’s book “SUPERPOWER? The Amazing Race Between China’s Hare And India’s Tortoise” was published by Penguin Allen Lane in August 2010. Mr. Bahl holds a bachelor’s degree in economics from St. Stephen’s College, University of Delhi, a master’s degree in business administration from the University of Delhi and a doctor of philosophy, honoris causa, from Amity University, Uttar Pradesh. The business address for Mr. Bahl is Express Trade Tower, Plot No. 15 & 16, Sector 16A, Film City, Noida-201301, Uttar Pradesh, India.
105
Table of Contents
Ravi Chandra Adusumalliwas appointed to our board of directors on August 2, 2006 as a nominee of SAIF II Mauritius Company Limited. He has also served as a director of Network18, Makemytrip Limited, Just Dial Limited, One 97 Communications Limited, Amohoa Education Private Limited, Asian Agro Energy Plantations Limited, Ivision Media India Private Limited, Fatpip Networks Limited, Just Dial Global Private Limited, Fingerprints Fashions Private Limited, Brainbees Solutions Private Limited, Robemall Apparels Private Limited, Le Travenues Technology Private Limited, A2 Media Private Limited and Proptiger Realty Private Limited. He is a partner of SAIF Partners II L.P., or SAIF Partners, and has been engaged by SAIF Partners since 2002. Prior to that, Mr. Adusumalli worked with Credit Suisse First Boston as an associate and also with Wasatch Funds. Mr. Adusumalli has a bachelor of arts degree in economics and government from Cornell University, United States. The business address for Mr. Adusumalli is 1045 Quarry Mountain Lane, Park City, UT 84098, United States.
Deepak Gaurwill be appointed to our board of directors upon the completion of this offering as a nominee of SAIF II Mauritius Company Limited. Mr. Gaur has over six years of experience in private equity. He has served as the managing director for SAIF Advisors Private Limited, India since April 2012. Mr. Gaurholds a bachelor of technology degree in mechanical engineering from the Indian Institute of Technology, Kanpur and a post graduate diploma in management from the Indian Institute of Management, Lucknow. The business address for Mr. Gauris Unit 510-511, 5th Floor, Time Tower, M.G. Road, Gurgaon-122002, India.
Joon Shick Kimwas appointed to our board of directors in December 2009 as a nominee of GS Home Shopping Inc. He also serves as a director of Buzzni, Inc. (South Korea) and Nomad Connection, Inc. (South Korea). Mr. Kim has three years of experience in the digital commerce industry. He has served as the chief information officer of GS Home Shopping Inc. since 2009. From 2005 to 2009 Mr. Kim worked for CISCO Systems. Mr. Kim holds a bachelor of science degree in materials science and engineering and a doctor of philosophy in chemistry from the Korea Advanced Institute of Science and Technology. The business address for Mr. Kim is GS Home Shopping Inc., GS Gangses Tower, 10, 6-ga, Mullae-dong, Youngdeungpo-gu, Seoul, 150-096, Korea.
Raman Deep Singh Bawa will be appointed to our board of directors upon the completion of this offering as a nominee of Network18 Holdings Limited. He also serves as the group chief financial officer of Network18. He has 38 years of experience in corporate finance. He joined an affiliate of Network18 in 1995. Prior to that he worked for BHEL, Trackparts of India Limited, Weston Components Limited and Bestavision Electronics Limited. He is an honors graduate from the Shri Ram College of Commerce, University of Delhi and a member of the Institute of Chartered Accountants of India. The business address for Mr. Bawa is Express Trade Tower, Plot No. 15 & 16, Sector 16A, Film City, Noida-201301, Uttar Pradesh, India.
Sarbvir Singhwill be appointed to our board of directors upon the completion of this offering as a nominee of Network18 Holdings Limited. He also serves as a director of other affiliated companies and as the managing director of Capital18 Media Advisors, a division of Network18, the parent company of our controlling shareholder, and is responsible for making investments in media, entertainment, education and technology ventures. Mr. Singh has over 10 years of experience in investment management and business operations. From 1999 to 2004, Mr. Singh worked as a vice president for Citigroup Asset Management where he drove investments in the global consumer sector. From 1995 to 1999, he worked for Emerson Electric in Hong Kong. Mr. Singh holds an integrated master’s degree from the Indian Institute of Technology, New Delhi and a post graduate diploma in management from the Indian Institute of Management, Ahmedabad. The business address for Mr. Singh is Express Trade Tower, Plot 15 & 16, Sector 16A, Film City, Noida-201301, Uttar Pradesh, India.
Saikumar Balasubramanianwill be appointed to our board of directors upon the completion of this offering as a nominee of Network18 Holdings Limited. He is the group chief executive officer of Network18 and has been with Network18 since 2000. He oversees the group’s various portfolios such as news & entertainment broadcasting, web portals, publishing, digital commerce and broadcast & news media distribution. In connection with his role as the group chief executive officer of Network18, Mr. Balasubramanianalso serves as a director of
106
Table of Contents
other Network18 affiliated companies. Mr. Balasubramanian has 15 years of experience in media and entertainment. Mr. Balasubramanianholds a post graduate management degree in marketing. The business address for Mr. Balasubramanian is Empire Complex, 1st Floor, 414, Senapati Bapat Marg, Lower Parel, Mumbai-400013, India.
Executive Officers
Sundeep Malhotra is our founder and chief executive officer and has been with us since our inception. Mr. Malhotra has over 26 years of experience in the FMCG and retail sector. Prior to founding our company, Mr. Malhotra served as the executive vice president of sales for Pepsi Foods Private Limited from 2000 to 2006. He worked as the head of sales & marketing, for Benetton India Limited from 1995 to 2000 and between 1985 and 1995, he was the head of retail sales for the north India operations of Bata India Limited. Mr. Malhotra holds an undergraduate degree in commerce from the University of Delhi.
Sachin Rastogi is our chief financial officer and has been with our company since September 2010. Prior to that he was the chief financial officer at eClerx Services Limited between 2008 and 2010 and was the chief financial officer for the banking and financial services industry vertical at WNS Global Services Private Limited between 2006 and 2008. He was the segment controller at Microsoft India Limited from 2003 to 2006 and a regional manager at Gillette India Limited from 1998 to 2003. Mr. Rastogi holds an undergraduate degree in electronics from the University of Delhi and a post graduate diploma in management from the Indian Institute of Management, Bangalore.
Vishwanath Magapu has been our chief technology officer since October 2010. Prior to that he was a manager for software development at Amazon.com Inc. from 2007 to 2010 and worked as a senior engineering manager at Instantis Inc. between 2006 and 2007. He was a senior development manager at Visage Mobile Inc. between 2005 and 2006 and worked as a computer scientist at the NASA AMES Research Center between 2002 and 2005. He was part of the technology solutions staff at Charles Schwab Corporation from 1998 to 2001 and was a senior software engineer at Pacific Bell Inc. from 1997 to 1998. He worked with Birlasoft Inc. as a software engineer from 1995 to 1997 and as a software engineer at SQL Star International Limited between 1993 and 1995. Mr. Magapu holds an undergraduate degree in electronics and communication engineering from the University of Andhra Pradesh and a master’s degree in information systems from the University of San Francisco.
Dhruva Sankarakrishnan Chandrie has been our chief operating officer and business head for the television business since February 2012. Prior to that, Mr. Chandrie was the chief operating officer for the retail functions of Videocon Telecommunications Limited. Mr. Chandrie has over 19 years of experience, primarily in the retail and automotive sectors. He has worked as the national operations head for The Mobile Store Limited, a part of the Essar group, from 2009 to 2011 and was the chief operating officer of Next Retail India Limited from 2006 to 2009. Between 2001 and 2006 he worked as the vice president for Reliance Industries Limited in their petroleum retail division and with the Tata group of companies from 1993 to 2001. During this period, he worked with Tata Motors Limited and Tata Capital Limited in senior sales, marketing and strategy roles, including as the regional head (western India) of the commercial vehicle division. Mr. Chandrie holds a degree in electrical and electronic engineering from the Birla Institute of Technology and Science, Pilani and a post graduate diploma in management from the Indian Institute of Management, Lucknow.
Narasimha Jayakumarhas been our chief operating officer and business head for our Internet business since September 2011. Prior to that, he was the business head for Google India Limited between 2008 and 2010. He worked as a business development director and then an account director for Expedia Inc. from 2006 to 2008 and was the regional commercial manager for the United Kingdom and Ireland for Galileo International Limited from 2003 to 2006. Between 1997 and 2002, he worked with the Tata group of companies, as part of Tata Administrative Services. Mr. Jayakumar holds an undergraduate degree in computer engineering from the National Institute of Technology, Surathkal and a post graduate diploma in management from the Indian Institute of Management, Bangalore as well as an M.B.A. from the London Business School.
107
Table of Contents
Atrash Aman has been the chief operating officer for our mobile business since March 2012. Mr. Aman joined our company in March 2007 as our vice president of sales and marketing division and in August 2011 became director, marketing and strategy. Prior to that he was with Bharti Airtel Limited in various capacities between December 2003 and February 2007. His last assignment at Bharti Airtel Limited was as vice president & business head for media and services. Between 1997 and 2000, he worked at McCann Erikson India Private Limited, in the roles of a strategic planner and in account management. He worked at Mudra Communications Limited from 1995 to 1997. Between 1993 and 1995, he worked with Tata Consultancy Services Limited, initially in the management consultancy division in and later as an assistant systems analyst. Mr. Aman holds an undergraduate degree in economics from the University of Delhi and an M.B.A. from the Faculty of Management Studies, University of Delhi, New Delhi.
Raman Kumar Gulati has been our director of operations since September 2011. He joined our company in September 2006 as vice president of our operations and finance divisions. Prior to that, he was a general manager for the internet business at Times Internet Limited, a Times of India group company. He worked as the finance manager at Talbros Automotive Components Limited from 1991 to 1992 and as the manager for finance & accounts at Magnum Sales Private Limited from 1990 to 1991. He was a partner at Ray Malhotra & Co., an accounting firm, between 1989 and 1990. He worked as a senior executive for accounts at Union Carbide India Limited between 1986 and 1989 and as a senior manager at U.S. Sethi & Associates, an accounting firm, between 1985 and 1986. Mr. Gulati holds a bachelor’s degree in commerce from Guru Nanak Dev University, Amritsar and a post graduate degree in operations and human resources from the Indira Gandhi National Open University, New Delhi. He is also a qualified accountant from the Institute of Chartered Accountants of India, New Delhi.
Girish Keswani has been the vice president and head of human resources for our company since January 2011. Prior to that he was the head of human resources at Equinox Realty & Infrastructure Private Limited, a part of the Essar group, from 2008 to 2010 and was the vice president and head of human resources and training at HyperQuality India Private Limited from 2004 to 2008. He was the deputy general manager of human resources at Bharti Mobile Limited in 2004 and a senior manager for training and development at Heroites, an IT-enabled service division of Hero Corporate Service Limited between 2002 and 2004. He worked as a client manager at ABC Consultants Limited between 2000 and 2002 and was business head at National Institute of Sales from 1996 to 2000. He was a senior sales executive at Madura Accessories, a division of Coats Viyella India Limited, between 1994 and 1996 and worked as a sales territory supervisor at Colgate Palmolive India Limited from 1993 to 1994. Mr. Keswani holds a bachelor’s degree in commerce from Lucknow University and a post graduate diploma in sales and marketing from National Institute of Sales, New Delhi.
Board of Directors
Our company is managed and controlled by our board of directors. Our Articles of Association provide that the number of directors will not be less than four or more than 15, with the exact number to be set from time to time by ordinary resolution of our shareholders. Our board of directors currently has 10 directors, with two positions for independent directors currently vacant. Within one year from the completion of this offeringwe intend to fill these vacancies with two directors that satisfy the independence requirements of and the independence requirements of Rule 10A-3 under the Exchange Act. There are no family relationships between any of our directors and executive officers. A director is not required to hold any shares in our company by way of qualification. There are no severance benefits payable to our directors upon the termination of their directorships.
Terms of Directors and Executive Officers
By the completion of this offering our Articles of Association will provide that one-third of our directors (or, if their number is not a multiple of three, the number nearest to but not less than one-third) shall retire from office by rotation at each annual meeting of our holding company. A retiring director shall be eligible for
108
Table of Contents
re-election. The directors to retire in each year shall be those who have been longest in office since their last re-election or appointment and as between persons who became or were last re-elected directors on the same day, those to retire shall (unless they otherwise agree among themselves) be determined by lot.
Only shareholders are entitled to remove a director from office. Shareholders may remove any director before the expiration of his or her term by ordinary resolution, for which a 28 day prior written notice, or a special notice, has been given in accordance with the Cyprus Companies Law. Such removal shall be without prejudice to any claim such director may have for damages for breach of any contract of service.
A person vacates the office of director if such person:
| • | becomes bankrupt or makes any arrangement or composition with his creditors generally; |
| • | is prohibited from serving as a director under the Cyprus Companies Law as a result of fraudulent conduct by such person; |
| • | becomes of unsound mind; or |
| • | resigns as a director by advance notice in writing. |
Our board of directors may temporarily fill any vacancy on the board until the next annual general meeting or earlier if the shareholders vote to replace such director at an extraordinary general meeting.
Executive officers are selected by and serve at the discretion of the board of directors.
Agreement on Nomination and Election of Directors
Other than our independent director, each of the current members of our board of directors was nominated and elected according to the shareholders agreement among us, Network18, SAIF and GS Home Shopping. Under the shareholders agreement, Network18, SAIF and GS Home Shopping have nominated four candidates, two candidate and one candidate, respectively, to our board of directors, and each of these three shareholders has agreed to vote their respective shares to elect each of these seven nominees. These three shareholders have agreed to continue to elect nominees of each of them based on their relative ownership interests, so long as a shareholder’s beneficial ownership of our voting shares is at least 5%. As a result, following the completion of this offering, these three shareholders will be able to appoint seven of the 10 directors that we expect to have within one year from the completion of this offering. See “Description of Share Capital — Ordinary Shares — Agreement on Nomination and Election of Directors” for more information on this agreement, as well as “Risk Factors — Risks Related to Us and Our Industry.”
Stock Exchange Requirements That Are Not Applicable to Us
Our ordinary shares will be listed on and, for so long as our ordinary shares continue to be listed, we will remain subject to the rules and regulations established by as being applicable to listed companies. has adopted rules to impose various corporate governance requirements on listed securities. Those rules provide that foreign private issuers such as our company are required to comply with certain specific corporate governance requirements, but, as to the balance of those requirements, foreign private issuers are not required to comply if the laws of their home country do not otherwise require compliance.
We currently comply with the specifically mandated corporate governance provisions of . In addition, we have elected to voluntarily comply with certain other of those requirements, notwithstanding that our home country does not mandate compliance, although we may in the future determine to cease voluntary
109
Table of Contents
compliance with those provisions. However, we have determined not to comply with the following corporate governance requirements since the laws of Cyprus do not require such compliance:
| • | a majority of our directors is not independent; and |
| • | our independent directors do not hold regularly scheduled meetings in executive session. |
We may in the future determine to voluntarily comply with one or both of the foregoing provisions.
Committees of the Board of Directors
We have established three committees under our board of directors: an audit committee, a compensation committee and a nominating and corporate governance committee. Each committee’s members and functions are described below.
Audit Committee
Our audit committee consists of , Joon Shick Kim, Deepak Gaur and Sarbvir Singh. , Kim, Gaur and Singh satisfy the independence requirements of , and satisfies the independence requirements of Rule 10A-3 under the Exchange Act. Under the applicable rules of , a company listing in connection with its initial public offering is permitted to phase in its compliance with the independent audit committee requirements set forth in pursuant to Rule 10A-3 under the Exchange Act, that is, (1) one independent member at the time of listing; (2) a majority of independent members within 90 days of listing; and (3) all independent members within one year of listing. We intend to comply with the independent audit committee requirements in the future in accordance with the phase-in compliance rules described above. Our board of directors also has determined that qualifies as an audit committee financial expert within the meaning of the SEC rules. Under the audit committee charter to be effective upon the completion of this offering, our audit committee will be responsible for, among other things:
| • | selecting and hiring our independent auditors, and approving the audit and permitted non-audit services to be performed by our independent auditors; |
| • | evaluating the qualifications, performance and independence of our independent auditors; |
| • | monitoring the integrity of our financial statements and our compliance with legal and regulatory requirements as they relate to financial statements or accounting matters; |
| • | reviewing the adequacy and effectiveness of our internal control policies and procedures; |
| • | discussing the scope and results of the audit with the independent auditors and reviewing with management and the independent auditors our interim and year-end financial results; |
| • | reviewing all related party transactions on an ongoing basis; and |
| • | annually reviewing and reassessing the adequacy of our audit committee charter. |
Compensation Committee
Our compensation committee consists of Messrs. Ravi Chandra Adusumalli, Joon Shick Kim and Sarbvir Singh. Messrs. Adusumalli, Kim and Singh satisfy the independence requirements of . Under the compensation committee charter to be effective upon the completion of this offering, our compensation committee will be responsible for, among other things:
| • | reviewing and approving for our executive officers: the annual base salary, the annual incentive bonus, including the specific goals and amount, equity compensation, employment agreements, severance arrangements and change in control arrangements, and any other benefits, compensation or arrangements; |
110
Table of Contents
| • | reviewing the succession planning for our executive officers; |
| • | reviewing and recommending compensation goals and bonus and share compensation criteria for our employees; and |
| • | administering, reviewing and making recommendations with respect to our equity compensation plans. |
Nominating and Corporate Governance Committee
Our nominating and corporate governance committee consists of Messrs. Ravi Chandra Adusumalli, Joon Shick Kim and Sarbvir Singh. Messrs. Adusumalli, Kim and Singh satisfy the independence requirements of . Under the nominating and corporate governance committee charter to be effective upon the completion of this offering, our nominating and corporate governance committee will be responsible for, among other things:
| • | assisting our board of directors in identifying prospective director nominees and recommending nominees for each annual meeting of shareholders to the board of directors; |
| • | reviewing developments in corporate governance practices and developing and recommending governance principles applicable to our board of directors; |
| • | overseeing the evaluation of our board of directors and management; and |
| • | recommending members for each committee of our board of directors. |
Code of Business Conduct and Ethics
Effective upon the completion of this offering, we will adopt a Code of Business Conduct and Ethics that will apply to all of our directors, officers and other employees, including our chief executive officer, chief financial officer and others responsible for our accounting and financial reporting. Our code of business conduct and ethics provides that our directors, officers and other employees are expected to avoid any action, position or interest that conflicts with the interests of our company or gives the appearance of a conflict.
Directors, officers and other employees have an obligation under our code of business conduct and ethics to advance our company’s interests when the opportunity to do so arises.
Indemnification of Directors and Officers and Limitation on Their Liability
Under our Articles of Association, to the extent permitted under Cyprus Companies Law, we will indemnify each of our directors and officers out of our assets against any losses or liabilities which he or she may sustain or incur in or about the execution of his or her duties as a director or officer, including liability incurred by such person in defending any proceedings, whether civil or criminal, in which judgment is given in his or her favor or in which he or she is acquitted or otherwise relieved of liability by the court conducting such proceedings in accordance with the Cyprus Companies Law.
Under the articles of association of our subsidiary, which is an Indian corporation, our executive officers all of whom are also employees of our subsidiary are entitled to indemnification by our subsidiary against loss in defending any proceeding brought against them in their capacity as officers of the subsidiary, if the indemnified officer or director receives judgment in his favor or is acquitted or discharged in such proceeding as well as in connection with certain applications under Indian companies law in which relief is granted to him by the court.
Employment Agreements with Executive Officers
Each of our executive officers has entered into an employment agreement with our Indian subsidiary. These employment agreements do not have fixed terms of employment. The age of retirement for our company is
111
Table of Contents
60 years. Generally, either party may terminate employment at any time by giving the other party a written notice of one to three months or by paying an amount equal to the salary for the number of months for which they are required to give notice in lieu of such notice. Other than those optional severance payments, these employment agreements do not provide for any special termination benefits, nor do we have any other arrangements with our executive officers for special termination benefits.
Each executive officer has agreed to keep confidential any information regarding the operation, trade and business of our company that they may obtain during the course of employment with our company. Each executive officer has also agreed to surrender to our company all documents and property entrusted to them during the course of their employment with our company. Additionally, each executive officer has assigned all his or her right, title and interest to, and in, any property relating to our business (whether tangible or intangible) which is created during the term of its employment. In addition, some of our executive officers are bound by non-competition restrictions set forth in their employment agreements. Specifically, these executive officers have agreed, while employed by us and for a period of six months after termination of his or her employment, not to:
| • | engage in any job or assignment with any company or organization whose business operations are competitive to our company; and |
| • | use or utilize any information or material that was produced or acquired by them during the course of employment with our company for any purposes. |
Compensation of Directors and Executive Officers
For fiscal year 2012, the aggregate cash compensation (including director’s fees) that we paid to our directors and executive officers included in the list under the heading “— Directors and Executive Officers” was $1.4 million, which included $0.5 million in base salary, $0.3 million in housing and rent allowance, $0.2 million in special allowances and $0.4 million in bonuses (including the variable component of such bonuses). Beginning in fiscal year 2012, we have begun to provide our executive officers with annual performance-based bonuses determined with reference to individual and company performance targets. For fiscal year 2013, we expect to pay an aggregate cash compensation (including director’s fees) of up to $1.6 million to our directors and executive officers (excluding variable bonuses which will only be determined after the end of the fiscal year). These aggregate cash compensation amounts for fiscal years 2012 and 2013 do not include share compensation and employee benefits to our directors and executive officers. Share compensation to our directors and executive officers are disclosed separately in the table under “— Outstanding Options,” and employee benefits to our directors and executive officers are disclosed separately under “— Employee Benefit Plans.”
Share Incentive Plans
Share Option Plan
In 2008 our board of directors adopted an equity option plan named the TV18 HSN Holdings Limited Stock Option Plan 2008, which we also refer to as our share option plan, that allows us to issue share options to employees and directors. The following paragraphs describe the principal terms of our share option plan, as amended. Our share option plan is administered by the compensation committee of our board of directors.
Options Issuable Under the Plan and Shares Issuable Upon Exercise of Such Options
Under the terms of our share option plan, we may grant options for up to 2,733,482 ordinary shares. Currently, each share option is exercisable into one ordinary share. As of March 31, 2012, options for a total of 2,177,000 ordinary shares were outstanding, of which options for a total of 2,137,000 ordinary shares had vested and options for a total of 2,002,000 ordinary shares had become exercisable. As of March 31, 2012, no ordinary shares had been issued upon exercise of options granted under the plan, although 202,000 ordinary shares were issuable under options for which the exercise process had been commenced but was not completed until after that
112
Table of Contents
date. Of the 2,177,000 options outstanding as of March 31, 2012, 3,750 were subsequently exercised.
Share options that expire or for any reason are lapsed, cancelled, terminated, forfeited, fail to vest will be again available for subsequent grant under either our existing share option plan or a subsequent plan.
Employees and Directors Who May Receive Grants
We may grant awards to any of the directors and full-time managerial and other employees of our company, our Indian subsidiary and any company that controls us, including Network18, the parent company of our controlling shareholder. Our compensation committee determines the employees eligible to participate in our share option plan in accordance with various criteria, including performance, position and responsibility and nature of the employee’s services.
Vesting and Exercise Period
Our compensation committee is entitled to determine the vesting schedule for option grants as the committee deems fit. Our compensation committee has generally provided for vesting of options on the first anniversary of the date of grant. However, our compensation committee will be entitled to grant options with different provisions for vesting as it deems fit for different employees.
Options granted after October 22, 2010 are exercisable at any time during the 48-month period from the vesting date. Generally, these options vest one year from the grant date. As of March 31, 2012, options for a total of 307,000 ordinary shares were outstanding that had been granted after October 22, 2010.
All options issued on or before October 22, 2010 to Messrs. Sundeep Malhotra, Raman Kumar Gulati, Atrash Aman, Ashwini Sharma, Hemant Bishnoi and Shammi Arora vested upon grant and became exercisable at any time in four equal installments over a period of four years from the date of the first anniversary of the date of grant. Pursuant to an amendment, options granted to Messrs. Sundeep Malhotra, Raman Kumar Gulati, Atrash Aman and Shammi Arora on or before October 22, 2010 are exercisable by these employees within a period of 84 months from the date of each grant. As of March 31, 2012, options for a total of 1,600,000 ordinary shares were outstanding that had been granted to these employees on or before October 22, 2010.
All other options granted on or before October 22, 2010 vested at the time of grant and become exercisable in four equal instalments upon each anniversary of the grant, commencing with the first anniversary of the grant. Such options are exercisable during the 48-month period beginning on the date they became exercisable. As of March 31, 2012, options for a total of 270,000 ordinary shares were outstanding that were covered by this formulation.
Our share option plan also provides that in case an employee resigns prior to the completion of the fourth anniversary of the date of grant, the employee shall be entitled to partially exercise the options in the manner provided under the plan.
Options that are not exercised within the applicable exercise period will automatically lapse.
Non-transferability of Share Options
The share options granted under the terms of our share option plan shall not be sold, pledged, assigned, mortgaged, hypothecated, transferred or alienated in any manner, other than by execution of a will in case of death of the employee, and may be exercised, during the life time of the employee, only by the employee. An employee may designate any beneficiary or beneficiaries to whom the benefit under our share option plan is to be delivered in the case of death of the employee.
113
Table of Contents
Exercise Price
The exercise price in respect of the share options is determined by the compensation committee. The exercise price may be paid in cash or settled using a cashless option. In a cashless exercise, the holder of options exercises the share options by simultaneously selling the shares underlying the share options upon exercise.
Lapse of Options
Unvested options shall automatically lapse upon death, total or permanent disability, retirement, superannuation or resignation of a grantee or a or termination of such grantee’s service.
Vested options that have not been exercised shall also automatically terminate upon the resignation of a grantee or the termination of such grantee’s service, except that:
| • | If such termination results from a grantee’s total or permanent disability, vested options will remain exercisable for 12 months from the date of such disability; |
| • | If such termination results from a grantee’s death, the grantee’s legal heirs or beneficiaries will have 12 months from the date of death to exercise vested options; |
| • | If such resignation or termination results from a grantee’s attaining retirement age or superannuation, the grantee will have 12 months from such retirement or superannuation to exercise vested options. |
All vested and unvested options shall also terminate upon the grantee’s misconduct. All unvested and vested options will lapse if we are liquidated.
As indicated above, share options that expire or for any reason are lapsed, cancelled, terminated, forfeited, fail to vest will be again available for subsequent grant under either our existing share option plan or a subsequent plan.
Effect of Bonus Issue, Rights Issue, Stock Split, Merger or Other Corporate Action
In the event of any bonus issue, rights issue, stock split, merger, restructuring or any such event happening subsequent to the grant of share options, our compensation committee will have the discretion to make appropriate amendments to our share option plan, including changes in the number of share options, the exercise price or floating a new plan or extending the application of the existing plan or any other fair and just mechanism including acceleration of share options, if deemed essential, in accordance with law as it deems fit, while striving to ensure that the rights of the employees are not adversely affected. Any such change (being compensatory in nature) would not be deemed to be a change in the terms of the plan. Alternatively, if it is deemed necessary, our share option plan could be substituted by a new plan, while ensuring that the rights of the employees are not adversely affected. In respect of share options yet to be granted, the compensation committee shall make necessary adjustments to our share option plan as deemed fit.
Amendment or Termination
Our compensation committee may at any time revoke, add to or vary our share option plan or any grant under our share option plan. Amendments to any grant under our share option plan are subject to consent from the recipient of such grant, if such amendment would prejudice the rights of such recipient. In addition, according to Cyprus law any amendment that would increase the number of ordinary shares available for issuance with respect to grants made under our share option plan must be approved by shareholders and shareholders must also waive the pre-emption rights of existing shareholders with respect to such grants, in each case upon the approval of either two-thirds vote or a simple majority vote if at least half of the issued capital is represented at a general meeting.
114
Table of Contents
Stock Appreciation Rights Scheme
In August 2012 our board of directors adopted the TV18 HSN Holdings Limited Stock Appreciation Rights Scheme, which we also refer to as our stock appreciation rights scheme, that allows us to issue stock appreciation rights to employees and directors. A stock appreciation right allows the holder, upon exercise of the right, to receive, per right, the difference between the last closing price for our ordinary shares (or a per share valuation as determined by our compensation committee if our ordinary shares are not then listed) and the exercise price for such right. This difference is payable in cash or, at the election of our compensation committee, in our ordinary shares. In case our compensation committee decides to settle the stock appreciation rights by allotment of our ordinary shares, our employees shall be allotted our ordinary shares on a 1:1 basis upon the payment of the exercise price. The following paragraphs describe the principal terms of our stock appreciation rights scheme. Our stock appreciation rights scheme is administered by the compensation committee of our board of directors.
Stock Appreciation Rights Granted Under Scheme
Under the terms of our stock appreciation rights scheme, we may offer up to 2,733,482 stock appreciation rights. The maximum number of ordinary shares that may be issued under the stock appreciation rights scheme shall not exceed 2,733,482. On November 2, 2012, we granted a total of 2,260,000 stock appreciation rights, of which 310,000 were subject to immediate vesting.
Stock appreciation rights that expire or for any reason are lapsed, cancelled, terminated, forfeited, fail to vest will be again available for subsequent grant under either our stock appreciation rights scheme or a subsequent scheme.
Employees and Directors Who May Receive Grants
We may grant stock appreciation rights to any of the directors and full-time employees of our company, our Indian subsidiary and any company that controls us, including Network18, the parent company of our controlling shareholder. Our compensation committee determines the employees eligible to participate in our stock appreciation rights scheme in accordance with various criteria, including performance, position and responsibility and seniority.
Vesting and Exercise Period
As per our stock appreciation rights scheme, stock appreciation rights will vest with the employees as determined by our compensation committee. Of the 2,260,000 stock appreciation rights granted in November 2012, 310,000 were subject to immediate vesting, and the remaining 1,950,000 stock appreciation rights vest over the next four years, in most cases in equal numbers on each anniversary of the grant date beginning in November 2013.
The stock appreciation rights granted under the scheme can be exercised either upon an acquisition of our company (as defined in the stock appreciation rights scheme) or upon a listing following an initial public offering by our company. In case of an acquisition of our company, all rights vested in the hands of the employees on the date of such acquisition shall be mandatorily exercised. Further, all unvested rights on the date of such acquisition shall automatically lapse. In the event of our company completing an initial public offering, employees will be entitled to exercise all vested rights within a period of 48 months from the date our ordinary shares are first traded on a stock exchange pursuant to such an offering. Further, all unvested stock appreciation rights granted to the employees can be exercised within a period of 48 months from the vesting date and, in case of graded vesting, from each such vesting date.
Non-transferability of Stock Appreciation Rights
The stock appreciation rights granted under the terms of our stock appreciation rights scheme shall not be sold, pledged, assigned, mortgaged, hypothecated, transferred or alienated in any manner, other than by
115
Table of Contents
execution of a will in case of death of the employee, and may be exercised, during the life time of the employee, only by the employee. An employee may designate any beneficiary or beneficiaries to whom the benefit under our stock appreciation rights is to be delivered in the case of death of the employee.
Exercise Price
The exercise price in respect of the stock appreciation rights shall be determined by the compensation committee. However, the exercise price shall not be lower than the nominal par value of the ordinary shares of our company.
Lapse of Stock Appreciation Rights
Unvestedstock appreciation rights shall automatically lapse upon death, permanent incapacity, superannuation and misconduct while vested stock appreciation rights shall remain exercisable for specified time periods and in a manner described in the scheme. Vested stock appreciation rights of an employee shall also lapse upon termination of employment for misconduct. All unvested stock appreciation rights shall also lapse upon liquidation of our company.
Effect of Bonus Issue, Rights Issue, Stock Split, Merger or Other Corporate Action
In the event of any bonus issue, rights issue, stock split, merger, restructuring or any such event happening subsequent to the grant of the stock appreciation rights, the compensation committee shall have the discretion to make appropriate amendments to the stock appreciation rights scheme, including changes in the number of stock appreciation rights, the exercise price, floating a new scheme, extending the application of the existing stock appreciation rights scheme, acceleration of stock appreciation rights or any other fair and just mechanism if deemed essential, in accordance with law as it deems fit, while striving to ensure that the rights of the employees are not adversely affected. Any such change (being compensatory in nature) would not be deemed to be a change in the terms of the stock appreciation rights scheme. Alternatively, if it is deemed necessary, the stock appreciation rights scheme could be substituted by a new stock appreciation rights scheme, while ensuring that the rights of the employees are not adversely affected. In respect of stock appreciation rights yet to be granted, the compensation committee shall make necessary adjustments to stock appreciation rights scheme as deemed fit.
116
Table of Contents
Option Grants to Management
The following table summarizes, as of March 31, 2012, the share options granted to our directors and executive officers under our share option plan, without giving effect to share options that were exercised. As of March 31, 2012, all of these options had vested, and except as indicated in the note to the table, all of these options were exercisable.
Name | Shares Underlying Outstanding Options | Exercise Price | Date of Grant | Number of Options Expiring | Date of Expiration | |||||||||||||||
| (dollars per share) | ||||||||||||||||||||
Sundeep Malhotra | 1,275,000 | 0.11 | April 9, 2008 | 1,275,000 | April 8, 2013 | |||||||||||||||
Sachin Rastogi | 100,000 | 0.10 | January 4, 2011 | 100,000 | January 3, 2016 | |||||||||||||||
Vishwanath Magapu | 75,000 | 0.10 | January 4, 2011 | 75,000 | January 3, 2016 | |||||||||||||||
Narasimha Jayakumar(1) | 100,000 | 0.09 | August 4, 2010 | |||||||||||||||||
| 25,000 | August 3, 2015 | |||||||||||||||||||
| 25,000 | August 2, 2016 | |||||||||||||||||||
| 25,000 | August 2, 2017 | |||||||||||||||||||
| 25,000 | August 3, 2018 | |||||||||||||||||||
Atrash Aman | 80,000 | 0.11 | April 9, 2008 | 80,000 | April 8, 2013 | |||||||||||||||
| 70,000 | 0.09 | August 4, 2010 | 70,000 | August 13,2015 | ||||||||||||||||
Raman Kumar Gulati | 80,000 | 0.11 | April 9, 2008 | 80,000 | April 8, 2013 | |||||||||||||||
| 70,000 | 0.09 | August 4, 2010 | 70,000 | August 3, 2015 | ||||||||||||||||
Girish Keswani | 20,000 | 0.10 | January 4, 2011 | 20,000 | January 3, 2016 | |||||||||||||||
| 10,000 | 0.10 | April 29, 2011 | 10,000 | April 27, 2016 | ||||||||||||||||
Note:
| (1) | The 25,000 options expiring August 3, 2015 became exercisable on August 4, 2011, the 25,000 options expiring August 2, 2016 became exercisable on August 4, 2012, the 25,000 options expiring August 2, 2017 become exercisable on August 4, 2013 and the 25,000 options expiring August 3, 2018 become exercisable on August 4, 2014. |
117
Table of Contents
Stock Appreciation Right Grants to Management
On November 2, 2012, a total of 2,260,000 stock appreciation rights were granted under our stock appreciation rights scheme, including 1,840,000 stock appreciation rights to our directors and executive officers. Except for 300,000 stock appreciation rights granted to Mr. Sundeep Malhotra and 10,000 stock appreciation rights granted to Mr. Girish Keswani, none of these stock appreciation rights has vested.
Name | Shares Underlying Stock Appreciation Rights | Exercise Price | Date of Grant | Number of Stock Appreciation Rights Expiring | Date of Expiration | |||||||||||||||
| (dollars per share) | ||||||||||||||||||||
Sundeep Malhotra | 800,000 | 0.13 | November 2, 2012 | 800,000 | * | |||||||||||||||
Sundeep Malhotra | 400,000 | 1.37 | November 2, 2012 | 400,000 | * | |||||||||||||||
Sachin Rastogi | 75,000 | 1.37 | November 2, 2012 | 75,000 | * | |||||||||||||||
Vishwanath Magapu | 75,000 | 1.37 | November 2, 2012 | 75,000 | * | |||||||||||||||
Dhruva Sankararkrishnan Chandrie | 50,000 | 0.13 | November 2, 2012 | 50,000 | * | |||||||||||||||
Dhruva Sankararkrishnan Chandrie | 100,000 | 1.37 | November 2, 2012 | 100,000 | * | |||||||||||||||
Narasimha Jayakumar | 100,000 | 1.37 | November 2, 2012 | 100,000 | * | |||||||||||||||
Atrash Aman | 75,000 | 1.37 | November 2, 2012 | 75,000 | * | |||||||||||||||
Raman Kumar Gulati | 75,000 | 1.37 | November 2, 2012 | 75,000 | * | |||||||||||||||
Girish Keswani | 40,000 | 0.13 | November 2, 2012 | 40,000 | * | |||||||||||||||
Girish Keswani | 50,000 | 1.37 | November 2, 2012 | 50,000 | * | |||||||||||||||
| * | Under the terms of our stock appreciation rights scheme, these stock appreciation rights will expire 48 months from the date our ordinary shares are first traded on a stock exchange pursuant to an initial public offering. |
Employee Benefit Plans
We maintain employee benefit plans in the form of certain statutory and incentive plans covering substantially all of our employees. For fiscal year 2012, the aggregate amount set aside or accrued by us to provide for pension or retirement benefits for all our employees (including our directors and executive officers) was $406,621.
Provident Fund
In accordance with Indian law, all of our employees in India are entitled to receive benefits under the Employees’ Provident Fund Scheme, 1952, as amended, a retirement benefit scheme under which an equal amount of 12% of basic salary of an employee is contributed both by employer and employee in a fund with government/trust with company. Our company makes a monthly deposit to a government fund and we have contributed an aggregate of $121,421 in fiscal year 2010, an aggregate of $221,431 in fiscal year 2011 and an aggregate of $332,177 in fiscal year 2012.
Gratuity
In accordance with Indian law, we pay gratuity to our eligible employees in India. Under our gratuity plan, an employee is entitled to receive a gratuity payment on the termination of his or her employment if the employee has rendered continuous service to our company for not less than five years, or if the termination of employment is due to death or disability. The amount of gratuity payable to an eligible employee is equal to 15 days’ salary for every year of employment (or any portion of a year exceeding six months), and currently the aggregate amount of gratuity shall not exceed 1,000,000 ($19,650). We have provided for an aggregate of $15,796 in fiscal year 2010, an aggregate of $72,315 in fiscal year 2011 and an aggregate of $74,444 in fiscal year 2012 for our gratuity payments. The total accrual for gratuity as at March 31, 2012 was $211,246.
118
Table of Contents
We have conducted our related party transactions on commercial terms that are fair and reasonable to us and in the interests of our shareholders as a whole. We believe that the terms of our related party transactions are comparable to the terms we could obtain in transactions with independent third parties. Subsequent to this offering, we expect that our related party transactions will continue to be conducted on the same basis. Upon completion of this offering, our related party transactions will also be subject to the review and approval of the audit committee of our board of directors. The following is a summary of our related party transactions.
Equity Investments and Related Subordinated Loans
Network18, through certain subsidiaries, has been our largest single investor, having made investments in various forms totaling $33.4 millions in us to date. See “Description of Share Capital — History of Share Issuances.”
Shareholders Agreement
We and our principal shareholders entered into a shareholders agreement that contained various rights such as registration rights, pre-emption rights, rights of first refusal and co-sale rights, board nomination rights and information access rights as well as provided for matters which required special approval by certain of our shareholders. On , 2012, we and our principal shareholders agreed to amend the shareholders agreement and terminate the various rights contained in the shareholders agreement except for registration rights, which are described in greater detail in “Description of Share Capital — Registration Rights,” and our shareholders have agreed among themselves to continue to nominate and elect our directors, other than certain independent directors, as described in greater detail in “Description of Share Capital — Ordinary Shares — Agreement on Nomination and Election of Directors.”
Financial Support from Network18 and its Affiliates
Network18 has issued a letter assuring continued financial support as necessary for our subsidiary to fulfill its business obligations in all material respects for the 12-month period beginning on August 16, 2012 to our subsidiary, and our consolidated financial statements have been prepared on a going concern basis on the basis of this support.
In April 2012, Network18 and Mr. Raghav Bahl guaranteed the obligations of our subsidiary under a credit facility agreement with The Ratnakar Bank Limited providing for short-term secured borrowings of up to 400.0 million ($7.9 million) under working capital and cash credit facilities. We did not pay any amounts to Network18 or Mr. Raghav Bahl on account of these guarantees, the provision of which was a condition precedent to our entry into the facilities. As of July 31, 2012, we had outstanding borrowings of 346.9 million ($6.8 million) under these facilities, which was also the largest amount that had been outstanding upto that date, at a weighted average interest rate of 14.0% per annum. See “Management’s Discussion and Analysis of Financial Condition and Results of Operations — Contractual Obligations, Including Indebtedness” for more details on these facilities.
Commercial Arrangements with Network18 and its Affiliates
We source certain products, mainly digital products such as mobile phones, camcorders and tablets, from Wespro Digital Private Limited, or Wespro, and RVT Holdings Private Limited, or RVT, both affiliates of Network18. The amounts collected by us on behalf of Wespro and RVT were $7.4 million, $7.5 million and $0.4 million in each of the fiscal years 2010, 2011 and 2012, respectively, on account of products sold through our platform.
119
Table of Contents
We buy airtime and advertising from several television channels affiliated with Network18, including Colors and CNBC Awaaz. Under our arrangement with Colors, we pay a share, subject to a monthly minimum guarantee, of the commission revenue we generate from Colors viewers from airing infomercial-type shows focused on a particular brand or category of products.
We uplink our television channel to a satellite capable of broadcasting the signal to our DTH and local cable operators in India through teleport facilities provided by TV18 Broadcast Limited, or TV18, a subsidiary of Network18. In exchange for these services, we pay a fixed monthly fee.
We share certain operating costs such as employee compensation, advertisement, communication expenses, rent for shared office space, repair and maintenance, with other Network18 television channels. The amount of these costs allocated to us is determined pursuant to a cost sharing agreement with TV18.
We use Setpro18 Distribution Private Limited, or Setpro, an affiliate of Network18, to negotiate carriage agreements, including fees, with various cable operators on our behalf. Under our arrangements with Setpro, we pay it a flat annual fee, and Setpro is not a party to any of the agreements it negotiates on our behalf, the final terms of which are decided solely between us and the relevant cable operator. We also pay carriage fee to some cable operators through Setpro.
In fiscal years 2010, 2011 and 2012, we paid Network18 and its other affiliates an aggregate of $4.2 million, $3.5 million and $3.6 million, respectively in respect of the foregoing commercial arrangements, other than amounts collected by us on behalf of Wespro and RVT.
License Agreement
We license certain intellectual property, in particular the use and appearance of “18” in our trade names and logos. Please see “Risk Factors — Risks Related to us and Our Industry — We do not own parts of our trade name and logo and are subject to related risks” for more details.
Employment Agreements
See “Management — Employment Agreements with Executive Officers.”
Equity Option and Share Incentive Plans
See “Management — Share Incentive Plans.”
120
Table of Contents
PRINCIPAL AND SELLING SHAREHOLDERS
The following table sets forth information with respect to the beneficial ownership of our ordinary shares as of March 31, 2012 as adjusted to reflect the changes in our capitalization described below, and as further adjusted to reflect the sale of ordinary shares offered by us and the selling shareholders in this offering, for:
| • | each person known to us to own beneficially more than 5.0% of our ordinary shares; |
| • | each of our directors and executive officers; and |
| • | each other selling shareholder. |
Except as disclosed below, we are not aware of any other beneficial owners of 1% or more of our ordinary shares. As of March 31, 2012, none of our outstanding ordinary shares, preference shares or warrants were held by record holders in the United States. We are not aware of any arrangement that may, at a subsequent date, result in a change of control of our company. By the completion of this offering, none of our shareholders will have any special voting rights under our Articles of Association or otherwise from us. Our principal shareholders have agreed among themselves to continue to nominate and elect our directors, other than certain independent directors. See “Description of Share Capital — Ordinary Shares — Agreement on Nomination and Election of Directors.”
The beneficial ownership information in the table below has been adjusted to give effect to the following changes in our capitalization:
| • | the May 2012 reorganization of our share capital described in the third paragraph of the “Description of Share Capital” section; and |
| • | the conversion of all outstanding preference shares and warrants into 54,233,549 ordinary shares on or before the completion of this offering. |
As used in this table, beneficial ownership means the sole or shared power to vote or direct the voting or to dispose of or direct the sale of any security. A person is deemed to be the beneficial owner of securities that can be acquired within 60 days upon the exercise of any option, warrant or right. Shares subject to options, warrants or rights that are currently exercisable or exercisable within 60 days are deemed outstanding for computing the ownership percentage of the person holding the options, warrants or rights, but are not deemed outstanding for computing the ownership percentage of any other person, except that all of the percentages below also assume the conversion of all of our preference shares and warrants into ordinary shares.
121
Table of Contents
The percentage of ordinary shares beneficially owned after this offering further includes ordinary shares to be issued in this assuming that the underwriters do not exercise their over-allotment option. The underwriters may choose to exercise the over-allotment option in full, in part or not at all.
| Ordinary Shares Beneficially Owned Prior to Offering(1) | Number of Shares Being Offered | Ordinary Shares Beneficially Owned After Offering | ||||||||||||||
Name of Beneficial Owner | Number | Percent | Number | Percent | Number | Percent | ||||||||||
Principal shareholders: | ||||||||||||||||
Network18(2)(3)(6) | 53,820,189 | 53.5 | ||||||||||||||
SAIF(4)(6) | 31,170,025 | 31.0 | ||||||||||||||
GS Home Shopping(5)(6) | 15,552,000 | 15.5 | ||||||||||||||
Selling shareholders: | ||||||||||||||||
Directors and executive officers: | ||||||||||||||||
Raghav Bahl(3)(6) | 53,820,189 | 53.5 | ||||||||||||||
Sundeep Malhotra(7) | 1,275,000 | 1.3 | ||||||||||||||
Atrash Aman(7) | * | * | ||||||||||||||
Raman Kumar Gulati(7) | * | * | ||||||||||||||
Sachin Rastogi(7) | * | * | ||||||||||||||
Vishwanath Magapu(7) | * | * | ||||||||||||||
Narasimha Jayakumar(7) | * | * | ||||||||||||||
Girish Keswani(7) | * | * | ||||||||||||||
All our directors and executive officers as a group(7) | 55,650,189 | 54.4 | ||||||||||||||
Notes:
| * | Represents beneficial ownership of less than 1.0% of our ordinary shares after giving effect to the transactions referred to in note (1) below. |
| (1) | Gives effect to the conversion of all outstanding preference shares and warrants into ordinary shares and the May 2012 reorganization of our share capital described in the third paragraph of the “Description of Share Capital” section. |
| (2) | Consists of 46,308,665 ordinary shares, 2,500 Class A preference shares and warrants to purchase 7,509,024 Class A preference shares held by Network18 Holdings Limited, a wholly owned subsidiary of Network18. The address of Network18 Holdings Limited is International Proximity, 608, St. James Court, St. Denis Street, Port Louis, Republic of Mauritius, and the address of Network18 is 503, 504, 507, 5thFloor, Mercantile House, 15, K.G. Marg, New Delhi — 110001. Network18 is in turn controlled by Mr. Raghav Bahl, as explained in note (3) below. |
| (3) | Mr. Bahl’s beneficial ownership of these ordinary shares arises through his control of Network18. Mr. Bahl controls Network18 in part through entities controlled by him which we collectively refer to as the RB Companies. The RB Companies as of March 31, 2012 together had a 37.4% beneficial ownership interest in Network18 through ownership of equity shares. The business address of each RB Company is 403, Prabhat Kiran, 17 Rajendra Place, New Delhi — 110008, India. |
| (4) | Consists of 27,697,528 Class A preference shares and warrants to purchase 3,472,497 Class A preference shares held by SAIF II Mauritius Company Limited. Andrew Y. Yan is the sole shareholder of SAIF II GP Capital Ltd., the sole general partner of SAIF Partners II L.P., which is the sole general partner of SAIF II GP L.P., which is in turn the sole general partner of SB Asia Investment Fund II L.P., or SAIF, the sole shareholder of SAIF II Mauritius Company Limited, our shareholder. The address of SAIF II Mauritius Company Limited is 3rd Floor, Raffles Tower, 19 Cybercity, Ebène, Mauritius, and the address of SAIF is Ugland House, Grand Cayman, KY1-1104, Cayman Islands. |
122
Table of Contents
| (5) | Consists of 13,542,728 Class G preference shares and warrants to purchase 2,009,272 Class A preference shares. The address of GS Home Shopping is GS Gangseo Tower, 10, Mullae-Dong 6-Ga, Youngdungpo-Gu, Seoul, Republic of Korea, 150-096. |
| (6) | Through the agreement to nominate and elect directors on our board of directors, our principal shareholders may be deemed to be part of a group for beneficial ownership reporting purposes. Each member of such a group would be deemed to beneficially all ordinary shares held by all group members. Accordingly, each of our principal shareholders may be deemed to beneficially own 100,542,214, or 100%, of our ordinary shares prior to the completion of this offering and , or %, of our ordinary shares upon completion of this offering. See “Description of Share Capital — Ordinary Shares — Agreement on Nomination and Election of Directors” for more information on this agreement between our principal shareholders. |
| (7) | Includes ordinary shares underlying options that were exercisable within 60 days of March 31, 2012 pursuant to our share option plan. See “Management — Share Incentive Plans — Share Option Plan” for more information. |
Significant Changes in Percentage of Ownership
The following table sets forth the significant changes in the shareholding interests of our holding company by our principal shareholders in the last three fiscal years and in the period between April 1, 2012 and December 3, 2012. Except as disclosed below, there were no significant changes in the percentage of ownership in our holding company in the last three fiscal years prior to March 31, 2012. Percentages set forth below are based on the number of ordinary shares outstanding as of the dates set forth below, assuming that all preference shares and warrants outstanding as of such dates were converted into ordinary shares as of such dates.
| As of March 31 | As of December 3 | |||||||||||||||||||||||||||||||||||||||
| 2010 | 2011 | 2012 | 2012 | |||||||||||||||||||||||||||||||||||||
Name and Type of Shares | Number | Percent | Number | Percent | Number | Percent | Number | Percent | ||||||||||||||||||||||||||||||||
Network18(1) | ||||||||||||||||||||||||||||||||||||||||
Ordinary shares | 41,923,401 | 42.7% | 41,923,401 | 42.7 | % | 41,923,401 | 44.0 | % | 46,308,665 | 53.4 | % | |||||||||||||||||||||||||||||
Class A preference shares | 2,500 | 2,500 | 2,500 | 2,500 | ||||||||||||||||||||||||||||||||||||
Class B preference shares | 15,625,000 | 15,625,000 | 15,625,000 | — | ||||||||||||||||||||||||||||||||||||
Class G preference shares | — | — | — | — | ||||||||||||||||||||||||||||||||||||
Warrants (issued November 2011)(2) | — | — | 5,797,242 | 5,797,242 | ||||||||||||||||||||||||||||||||||||
Warrants (issued March 2012)(2) | — | — | 1,711,782 | 1,711,782 | ||||||||||||||||||||||||||||||||||||
SAIF(3) | ||||||||||||||||||||||||||||||||||||||||
Ordinary shares | — | 47.2% | — | 47.2 | % | — | 45.4 | % | — | 30.9 | % | |||||||||||||||||||||||||||||
Class A preference shares | 13,664,682 | 13,664,682 | 13,664,682 | 27,697,528 | ||||||||||||||||||||||||||||||||||||
Class B preference shares | 50,000,000 | 50,000,000 | 50,000,000 | — | ||||||||||||||||||||||||||||||||||||
Warrants (issued November 2011)(2) | — | — | 3,472,497 | 3,472,497 | ||||||||||||||||||||||||||||||||||||
Warrants (issued March 2012)(2) | — | — | — | — | ||||||||||||||||||||||||||||||||||||
GS Home Shopping | ||||||||||||||||||||||||||||||||||||||||
Ordinary shares | — | 10.0% | — | 10.0 | % | — | 10.5 | % | — | 15.4 | % | |||||||||||||||||||||||||||||
Class A preference shares | — | — | — | — | ||||||||||||||||||||||||||||||||||||
Class G preference shares | 13,542,728 | 13,542,728 | 13,542,728 | 13,542,728 | ||||||||||||||||||||||||||||||||||||
Warrants (issued November 2011)(2) | — | — | 1,696,040 | 1,696,040 | ||||||||||||||||||||||||||||||||||||
Warrants (issued March 2012)(2) | — | — | 313,232 | 313,232 | ||||||||||||||||||||||||||||||||||||
Notes:
| (1) | These shares are all held by Network18 Holdings Limited, a wholly owned subsidiary of Network18. |
| (2) | The numbers on this row are the numbers of Class A preference shares in which the warrants were/are convertible on the relevant dates. |
| (3) | These shares are all held by SAIF II Mauritius Company Limited, a wholly owned subsidiary of SAIF. |
123
Table of Contents
We are incorporated under the laws of Cyprus as a public company limited by shares. Our affairs are governed by our Memorandum and Articles of Association, the Companies Law, Cap. 113 of Cyprus, as amended, which we refer to as the Cyprus Companies Law, and other applicable laws of Cyprus and any rules or regulations made thereunder. Our registered office is located at 10 Diomidous Street, Alphamega Akropolis Building, 3rd Floor, Office 401, 2024 Nicosia, Cyprus.
Our Memorandum of Association states that the objects of our holding company include, among other things, the carrying on of investments and trade, and the carrying on of any business or activity which we consider expedient to further the objects of our holding company or calculated to enhance the value or profitability of our property or rights.
On March 31, 2012, our authorized share capital was $7,736,000 divided into 80,900,000 ordinary shares, 32,875,000 Class A preference shares, 65,625,000 Class B preference shares and 14,000,000 Class G preference shares, each with a nominal value per share of $0.04 per share. As of that date, our issued share capital was $5,390,332.44 divided into 41,923,401 ordinary shares, 13,667,182 Class A preference shares, 65,625,000 Class B preference shares and 13,542,728 Class G preference shares, each with a nominal value per share of $0.04 per share. In May 2012 we consummated a reorganization of our share capital, which included a reduction and subsequent increase in share capital. This resulted in an issued share capital of $3,502,056.84 divided into 46,308,665 ordinary shares, 27,700,028 Class A preference shares and 13,542,728 Class G preference shares, held as follows:
| • | 2,500 Class A preference shares and 46,308,665 ordinary shares being held by Network18 Holdings Limited; prior to the reorganization, Network18 Holdings Limited held 2,500 Class A preference shares, 15,625,000 Class B preference shares and 41,923,401 ordinary shares; |
| • | 27,697,528 Class A preference shares being held by SAIF II Mauritius Company Limited; prior to the reorganization, SAIF II Mauritius Company Limited held 13,664,682 Class A preference shares and 50,000,000 Class B preference shares; and |
| • | 13,542,728 Class G preference shares being held by GS Home Shopping Inc. |
This share capital reorganization was the final step in our corporate reorganization that commenced with GS Home Shopping’s initial investment in us in November 2009. Our outstanding Class A and Class G preference shares are convertible into ordinary shares one-for-one share basis.
On or before the completion of this offering, we will adopt new Articles of Association pursuant to which our authorized share capital will consist of $ divided into ordinary shares. On or before the completion of this offering, all of our outstanding preference shares and warrants will be converted into 54,233,549 ordinary shares. For details on the conversion ratios of our warrants, see “— History of Share Issuance — Warrants” below.
The following is a summary of certain provisions of the Articles of Association that will take effect by the completion of this offering and the Cyprus Companies Law insofar as they relate to the material terms of our ordinary shares. The term “shareholders” as used in these summaries in relation to our holding company refers to persons whose names are entered into the register of members of our holding company as the current holder of one or more shares of our holding company. These summaries do not purport to be complete and are subject to, and are qualified in their entirety by reference to, the provisions of our Articles of Association and the Cyprus Companies Law. Prospective investors are urged to read the complete form of our Articles of Association, which has been filed as an exhibit to our registration statement of which this prospectus is a part.
124
Table of Contents
Ordinary Shares
General
At the closing of this offering, our only outstanding shares will be ordinary shares, all of which will be fully paid. Each outstanding ordinary share ranks equally to all other outstanding ordinary shares. Our ordinary shares are issued in registered form, and can be issued without certificates.
There are no limitations on the rights to own our ordinary shares, including the rights of non-resident or foreign shareholders to hold or exercise voting rights on our ordinary shares under Cyprus Law or our Articles of Association.
Voting Rights
Holders of our ordinary shares are entitled to one vote per share.
Subject to any special rights or restrictions as to voting attached to shares, every shareholder:
| • | will have one vote on a show of hands (or oral declaration); and |
| • | one vote for each of such shareholder’s ordinary shares on a poll. |
Voting at any meeting of shareholders is by show of hands (or oral declaration for telephone or other telecommunication participants) unless a poll is demanded. A poll may be demanded by:
| • | the chairman of such meeting; |
| • | at least three shareholders having the right to vote at the meeting; |
| • | one or more shareholders representing at least 10% of the total voting rights of all shareholders having a right to vote at such meeting; or |
| • | one or more shareholders holding shares in the company that confer a right to vote at the meeting and on which the aggregate amount paid up is not less than 10% of the total amount paid up on all shares that confer that right. |
Each shareholder is entitled to attend general meetings, to address the meeting, and to exercise any voting rights such shareholder may have. One or more shareholders having at least 5% of the issued share capital and voting rights of our company may request that matters be added in the agenda of the annual general meeting and add resolutions in the agenda of any general meeting.
A corporate shareholder may, by resolution of its directors or other governing body, authorize a person to act as its representative at general meetings and that person may exercise the same powers as the corporate shareholder could exercise if it were an individual shareholder. No shareholder is entitled to vote at any general meeting unless all calls and other amounts payable by him in respect of shares have been fully paid.
Shareholders may attend meetings in person or be represented by proxy authorized in writing.
The instrument appointing a proxy shall be in writing under the hand of the appointer or of his attorney duly authorized in writing, or, if the appointer is a corporation, either under seal, or under the hand of an officer or attorney duly authorized. A duly notarized and legalized or apostilled power of attorney shall be at all times accepted by us, our corporate secretary and the board of directors as the appropriate and sufficient instrument appointing a proxy. A proxy does not need to be a shareholder.
The instrument appointing a proxy and the power of attorney or other authority, if any, under which it is signed or a notarially certified copy of that power or authority shall be deposited at our registered office or at
125
Table of Contents
such other place within Cyprus as is specified for that purpose in the notice convening the meeting at any time before the time for holding the meeting or adjourned meeting, at which the person named in the instrument proposes to vote, or, in the case of a poll, at any time before the time appointed for the taking of the poll, and in default the instrument of proxy shall not be treated as valid.
We have not provided for cumulative voting for the election of directors.
Agreement on Nomination and Election of Directors
Other than our independent director, each of the current members of our board of directors was nominated and elected according to our shareholders agreement. Under the shareholders agreement, Network18 Holdings Limited, SAIF II Mauritius Company Limited and GS Home Shopping Inc. have nominated four persons, two persons and one person to our board of directors, respectively, and each shareholder has agreed to vote to elect each of these nominees. These shareholders have agreed to continue to elect nominees of each of them based on their relative ownership interests. This agreement will cover all director positions other than those for our independent directors that satisfy the audit committee independence requirements of Rule 10A-3 under the Exchange Act, or seven of our eventual 10 directors. However, following the completion of this offering, we will not be a party to this agreement, and therefore the ability of these shareholders to achieve the election of their director nominees at any given time will likely depend upon the aggregate voting power of these three shareholders at such time or our management’s support of such director nominees or both of these factors. If the beneficial ownership of Network18, SAIF or GS Home Shopping in our voting shares at any time falls below 5%, then the relevant shareholder will permanently cease to be a party to this agreement on the nomination and election of directors, even if the beneficial ownership percentage of Network18, SAIF or GS Home Shopping, as the case may be, later increases to above the 5% threshold.
As a result of this agreement, following the completion of this offering, the agreement between these three shareholders will determine seven of our 10 directors. See “Risk Factors — Risks Related to Us and Our Industry.”
Dividends
Under the Cyprus Companies Law and our Articles of Association, dividends may only be paid out of net accumulated profits. Dividends may be declared at a general meeting of shareholders, but no dividend may exceed the amount recommended by the directors. In addition, the directors may on their own declare and pay interim dividends. The directors may, before recommending any dividend, set aside out of the profits of our Company such sums as they think proper as a reserve or reserves.
No distribution of dividends may be made when, on the closing date of the last fiscal year, the net assets, as set out in our Company’s annual accounts are, or following such a distribution would become, lower than the amount of the subscribed share capital plus those reserves which may not be distributed under law or our Articles of Association.
Interim dividends can only be paid if interim accounts are drawn up showing that funds available for distribution are sufficient and the amount to be distributed may not exceed the total profits made since the end of the fiscal year for which the annual accounts have been drawn up, plus any profits brought forward and sums drawn from reserves available for this purpose, minus any losses brought forward and sums to be placed to reserve pursuant to the requirements of the law and our Articles of Association.
Pre-emption Rights
Under the Cyprus Companies Law, each existing shareholder has a right of pre-emption to subscribe for any new shares to be issued by the Company in cash in proportion to the aggregate number of such shares of such
126
Table of Contents
shareholder, except that there are no pre-emption rights with respect to shares issued for non-cash consideration, and shares issuable upon exercise of any options issued under our share option plan and any shares that may be issued upon settlement of stock appreciation rights issued under our stock appreciation rights scheme.
Under Cyprus Companies Law, we have to notify all shareholders in writing of our intention to issue new shares and the price to be issued. Each individual notice is required to include the number of shares each shareholder is entitled to buy, the period during which a shareholder may exercise its pre-emption rights, and the offer price per share.
Each shareholder will have no less than 14 days following its receipt of the notice of the offer, which notice will identify the proposed terms and conditions of the offer, to notify us of its desire to exercise its pre-emption right on the same terms and conditions proposed in the notice. If all the shareholders do not fully exercise all their pre-emption rights, the board of directors may decide to offer and sell the remaining shares to third parties at a price and on terms as determined by the board of directors, if at all.
Shareholders’ pre-emption rights may be waived by a resolution adopted by a specified majority being over one-half of the votes cast if the attendance at the meeting represents the majority of the votes entitled to be cast and in all other cases two-thirds majority of the votes cast, or a Majority Resolution. In connection with such waiver, the board of directors must present a written report indicating the reasons why the right of pre-emption should be waived and justifying the proposed issue price.
Variation of Rights
Under the Cyprus Companies Law and our Articles of Association, generally any change to the amount of our share capital, the division of our share capital into additional classes, or any change to the rights attached to any class of shares must be approved by a separate vote of each class of shares affected. Variation of class rights requires sanction by a Majority Resolution. Members voting against the variation of that class, who between them hold or represent 15% of the issued shares of that class, may apply to the court to set aside the variation.
Alteration of Capital
The following alterations to our share capital may be effected by ordinary resolution at a general meeting of our shareholders:
| • | an increase in our authorized share capital; |
| • | the consolidation of any or all of our shares into shares representing a greater proportion of our share capital each; |
| • | the subdivision of all or part of our shares; and |
| • | the cancellation of unissued shares that are not subject to an agreement to transfer such shares. |
We may also, by special resolution of a general meeting of shareholders, reduce our share capital, any capital redemption reserve account or any share premium account. Following the adoption of a special resolution for the reduction of capital, a company must apply to the Cypriot court for ratification of such special resolution. The Cypriot court shall take into account the position of the creditors of the company in deciding whether to ratify the resolution. Once the court ratifies the resolution, the court order, together with the special resolution, are filed with the Cyprus Registrar of Companies.
Issuance of Shares
The Articles of Association provide for the issue of multiple classes of shares and the share capital of the company may be divided into multiple classes of shares. The general meeting may, pursuant to the Articles of
127
Table of Contents
Association, grant authority to the board of directors to offer, allot or grant options or otherwise deal with or dispose off any shares out of the authorized but unissued share capital of the company for a period of up to five years subject to any pre-emption rights in the Articles of Association. Such power may at any given time be revoked or extended or varied as the case may be, by a general meeting with the sanction of a special resolution. See “— Pre-emption Rights” above for more information regarding pre-emption rights of existing shareholders.
Buyback of Shares
The company may, subject to certain statutory requirements, terms and conditions, buyback shares in its issued share capital not exceeding 10% in nominal value of the entire issued share capital of the company.
Resolutions
Cyprus Companies Law names three types of resolutions that may be submitted to a shareholder vote: ordinary resolutions, extraordinary resolutions and special resolutions.
There is no definition in the Cyprus Companies Law of ordinary resolution. An ordinary resolution must be approved by a majority vote of shareholders having voting rights present at the meeting, voting in person or through a proxy and the company must provide 14-days advance notice of such meeting to shareholders.
The Cyprus Companies Law defines extraordinary resolutions and special resolutions. An extraordinary resolution must be approved by at least 75% of shareholders having voting rights present at the meeting, voting in person or through a proxy. A special resolution must be approved by at least 75% of shareholders having voting rights present at the meeting, voting in person or through a proxy and the company must provide 21-days advance notice of such meeting to shareholders.
A special resolution is required, among other things, to amend the Articles of Association, to change the name of the company, to reduce company’s share capital and to amend the objectives of the company.
Meetings of Shareholders
We are required to hold an annual general meeting of shareholders each year on such day and at such place as the directors may determine. The directors may, whenever they think fit, decide to convene an extraordinary general meeting. Extraordinary general meetings can also be convened by shareholders holding at least 10% of our issued share capital.
Annual general meetings and meetings where a special resolution will be proposed can be convened by the board of directors by issuing a notice specifying the matters to be discussed 21 days prior to the meeting. All other general meetings may be convened by the board by issuing a notice 14 days prior to the meeting. Meetings may be called by shorter notice and shall be deemed to have been duly called if it is so agreed:
| • | in the case of an annual general meeting, by all the shareholders entitled to attend and vote; and |
| • | in the case of any other meeting, by shareholders representing a majority in number of the shareholders entitled to attend and vote at the meeting and that hold at least 95% in nominal value of the shares entitled to vote at the meeting. |
We may give notice to a shareholder either personally or by sending it by post, fax, telex or any other means for transmitting text to such shareholder’s registered address, mailing address, electronic or other address or fax or telex number supplied to us for this purpose. Where a notice is sent by post, service of the notice shall be deemed to be effected at the expiration of 72 hours after the letter containing the same is posted, at the correct address and with the proper postage. Where a notice is sent by fax, telex or any other means of transmitting text,
128
Table of Contents
service of the notice shall be deemed to be effected one business day after the date of successful transmission or relay at the place of receipt.
We may give notice to the joint shareholders of a share by giving the notice to the joint shareholder first named in the register of members in respect of the share. We may give notice to the persons entitled to a share in consequence of the death or bankruptcy of a shareholder by sending it through the post in a prepaid letter addressed to them by name, or by the title of representative of the deceased, or trustee of the bankrupt, or by any like descriptions, at the address, if any, supplied for the propose by the persons claiming to be so entitled, or (until such an address has been so supplied) by giving the notice in any manner in which the same might have been given if the death or bankruptcy had not occurred.
Notice of every general meeting shall be given in any manner described above to:
| • | every shareholder except those shareholders who have not supplied us a registered address for the giving of notices to them; |
| • | every person upon whom the ownership of a share devolves by reason of his being a legal personal representative or a trustee in bankruptcy would be entitled to receive notice of the meeting; and |
| • | our auditor. |
No other person shall be entitled to receive notices of general meetings.
The quorum for a general meeting will consist of two or more shareholders representing more than one-third of our voting share capital, present in person or by proxy. If within half an hour from the time appointed for the meeting a quorum is not present, the meeting, if convened upon the requisition of shareholders, shall be dissolved. In any other case, it shall stand adjourned to the same day of the next week, at the same time and place or on such other day and at such other time and place as the directors may determine and if at the adjourned meeting a quorum is not formed within half an hour from the time appointed for the meeting, the shareholders present shall form a quorum. In the event of a separate vote of a particular class of shares as contemplated under “— Variation of Rights” above, these quorum requirements would be based on just the relevant share class, not all voting share capital.
Subject to the provisions of the Cyprus Companies Law, a resolution in writing signed by all the shareholders entitled to receive notice of and to attend and vote at general meetings (or being corporations by their duly authorized representatives) shall be as valid and effective as if the same had been passed at a general meeting duly convened and held.
Inspection of Books and Records
Under the Cyprus Companies Law, our directors are required to cause accounting books to be properly maintained with respect to:
| • | all sums of money received and expended by us and the matters in respect of which the receipt and expenditure takes place; |
| • | all sales and purchases of goods by us; and |
| • | our assets and liabilities. |
Proper books shall not be deemed to be kept if there are not kept such books of account as are adequate to give a true and fair view of our affairs and to explain our transactions.
The directors shall from time to time determine whether and to what extent and at what times and places and under what conditions or regulations all or some of our accounts and books will be open to the inspection of
129
Table of Contents
shareholders and no shareholder (other than a shareholder who is also a director) will have any right of inspecting any of our accounts or books or documents except as conferred by statute or authorized by the directors or by our shareholders in general meeting.
According to Cyprus Companies Law, every company shall keep at its registered office a register of directors and secretary, a register of its members, a register of debentures and a register of charges and mortgages. These registers shall, except when these are duly closed, during business hours (subject to such reasonable restrictions as the company may by its articles or in general meeting impose, so that not less than two hours in each day are allowed for inspection) be open to the inspection of any shareholder without any charge.
The books containing the minutes of proceedings of any general meeting of a company shall be kept at the registered office of the company, and shall during business hours (subject to such reasonable restrictions as the company may by its articles or in general meeting impose, so that not less than two hours in each day are allowed for inspection) be open to the inspection of any shareholder without charge.
Furthermore, any shareholder and any holder of debentures of a company are entitled to be furnished on demand, without charge, with a copy of the last balance sheet of the company, including every document required by law to be annexed thereto, together with a copy of the auditors’ report on the balance sheet.
Interested Directors
A director who is in any way directly or indirectly interested in a contract or proposed contract with us shall declare the nature of his interest at a meeting of the directors in accordance with the Cyprus Companies Law. Directors who have an interest in any contract, agreement or settlement proposed to be concluded with us may attend the meeting of the board of directors or committee at which the matter is discussed but shall not have the right to vote (and shall not be counted in the quorum). None of these restrictions shall apply in relation to:
| • | any arrangement for the provision to any director, of any security or guarantee in relation to money which he paid or obligations which he undertook in our favor; |
| • | any arrangement for the provision by us of any security to third parties in relation to a liability or obligation of us for which the director himself assumed responsibility whether wholly or in part pursuant to any guarantee or by the deposit of any security; |
| • | any contract by a director to subscribe for or underwrite our shares or debentures; or |
| • | any contract or arrangement with any other company in which he is interested only as an officer of the company or as holder of shares or other securities. |
Notification of Shareholdings by Directors and Substantial Shareholders
There is no requirement under the Articles of Association of our company or Cyprus Companies Law for the notification of shareholdings by our directors and substantial shareholders. As none of our securities are listed on a regulated market in Cyprus or the European Union, there are no notification requirements under relevant Cyprus and EU legislation. Applicability of Cyprus Takeover Law and European Union Takeover Directive.
As none of our securities are listed on a regulated market in Cyprus or the European Union, neither the Cyprus Takeover Law nor the European Union’s Takeover Directive apply to purchases of our shares. Under Cyprus law, there are no statutory requirements for a shareholder of a specified shareholding to make an offer to acquire any further shares in the capital of the company or make any reporting.
130
Table of Contents
Anti-takeover Provisions
As a result of its significant voting interest, Network18 may be able to control the outcome of matters submitted to shareholders for their approval, including any potential merger, takeover or other change of control transaction that other shareholders may view as beneficial.
Our Articles of Association include the following provisions which may be regarded as defensive measures: (i) staggered board of directors, (ii) the ability to issue preference shares, and (iii) requiring that amendments to the Articles of Association be approved by a special resolution of the shareholders of our company.
Differences in Corporate Law
The following chart summarizes certain material differences between the rights of holders of our ordinary shares and the rights of holders of the common stock of a typical corporation incorporated under the laws of the State of Delaware that result from differences in the laws of Cyprus and Delaware.
Cyprus Law | Delaware Law | |||
| General Meetings | We are required to hold an annual general meeting of shareholders each year on such day and at such place as the directors may determine. The directors may, whenever they think fit, decide to convene an extraordinary general meeting. Extraordinary general meetings may be convened by shareholders holding at least 10% of our issued share capital. If the company fails to hold its annual general meeting, it may be subject to fines and it may be ordered to hold a meeting by the Council of Ministers of Cyprus. | Shareholders of a Delaware corporation generally do not have the right to call meetings of shareholders unless that right is granted in the certificate of incorporation or bylaws. However, if a corporation fails to hold its annual meeting within a period of 30 days after the date designated for the annual meeting, or if no date has been designated for a period of 13 months after its last annual meeting, the Delaware Court of Chancery may order a meeting to be held upon the application of a shareholder. | ||
| Quorum Requirements for General Meetings | The Cyprus Companies Law provides that a quorum at a general meeting of shareholders may be fixed by the articles of association otherwise a quorum consists of three members. Our articles provide a quorum required for any general meeting consists of two or more shareholders representing more than one-third of our voting share capital, present in person or by proxy. | A Delaware corporation’s certificate of incorporation or bylaws can specify the number of shares that constitute the quorum required to conduct business at a meeting, provided that in no event will a quorum consist of less than one-third of the shares entitled to vote at a meeting. | ||
Resolutions | The Cyprus Companies Law names three types of resolutions that may be submitted to a shareholder vote: ordinary resolutions, extraordinary resolutions and special resolutions.
An ordinary resolution must be approved by a majority vote of shareholders having voting rights present at the meeting, voting in person | Under Delaware law, there is no generally applicable vote for valid stockholder action, however, certain types of action require a specific proportion of stockholder votes. The approval of a majority of the shares is required to amend the certificate of incorporation, to approve a merger or sale of assets, or to effect a dissolution.
| ||
131
Table of Contents
Cyprus Law | Delaware Law | |||
or through a proxy. An ordinary resolution is required to take any action other than those actions for which either an extraordinary resolution or a special resolution is required.
An extraordinary resolution must be approved by at least 75% of shareholders having voting rights present at the meeting, voting in person or through a proxy.
A special resolution must be approved by at least 75% of shareholders having voting rights present at the meeting, voting in person or through a proxy.
A special resolution is required for the following actions to be taken:
• Alteration of the objects of the company, subject to judicial confirmation;
• Alteration of the articles of association;
• Alteration of the name of the company, subject to the approval of the Registrar of Companies;
• Alteration of the memorandum of association;
• Creation of unissued share capital;
• Removing limits on the potential liability of directors, if authorized by the Articles of Association;
• Reduction of capital, subject to the consent of a court;
• To effect a winding up by a court;
• To wind up the company voluntarily;
• Reconstruction and amalgamation of a company; and
• Cross border merger. | A Delaware corporation’s certificate of incorporation can require a larger vote than as provided under Delaware law for any action. |
132
Table of Contents
Cyprus Law | Delaware Law | |||
An extraordinary resolution is required for the following actions to be taken:
• To wind up the company voluntarily because it cannot continue its business due to its liabilities;
• To sanction the exercise by the liquidator of its various powers provided for in Section 233;
• To sanction any arrangement with the company’s creditors; and
• In a member’s voluntary winding up, disposing off of the company’s and the liquidator’s books and papers. | ||||
| Removal of Directors | Under the Cyprus Companies Law, any director may be removed by an ordinary resolution, provided advance notice 28 days prior to the general meeting of the shareholders has been given. The director concerned must receive a copy of the notice of the intended resolution and that director is entitled to be heard on the resolution at the meeting. | Under Delaware Law, a director of a corporation with a classified board may be removed only for cause with the approval of a majority of the outstanding shares entitled to vote, unless the certificate of incorporation provides otherwise. | ||
The director concerned may make representations in writing to the company, not exceeding reasonable length, and require that the shareholders of the company be notified of such representations either via advance notice or at the shareholders’ meeting, unless a court in Cyprus determines that such rights are being abused to secure needless publicity for a defamatory matter.
Such removal shall be without prejudice to any claim such director may have for damages for breach of any contract of service between him and the company. | ||||
133
Table of Contents
Cyprus Law | Delaware Law | |||
| Directors’ Fiduciary Duties | Under Cyprus law, the directors of a company have certain duties towards the company and its shareholders. These duties consist of statutory duties and common law duties.
Statutory duties under the Cyprus Companies Law include, among others, the duty to cause the preparation of the financial accounts in accordance with International Accounting Standards and the disclosure of directors’ salaries and pensions in the company’s accounts or in a statement annexed thereto.
In general, the directors of a Cyprus company owe a duty to manage the company in accordance with the provisions of applicable law and within the regulations of the memorandum and articles of association of the company and failure to do so will lead to the directors being liable for breach of their fiduciary duties. In addition, directors must disclose any interests that they may have. They have a common law duty to avoid any conflict of interest. This duty is imposed on those directors, who are either directly or indirectly interested in a contract or proposed contract with the company. Failure to reveal the nature of their interest at a meeting of directors would result in the imposition of a fine. Directors also have a duty to conduct the affairs of the company in a manner that is not oppressive to some part of the members.
In addition, according to common law, directors must act in accordance with their duty of good faith and in the best interests of the company. They must exercise their powers for the particular purposes of which they were conferred and not for an extraneous purpose (for a proper purpose) and must display a reasonable degree of skill that may be expected from a person of his knowledge and experience. | Under Delaware corporate law, a director of a Delaware corporation has a fiduciary duty to the corporation and its shareholders. This duty has two components: the duty of care and the duty of loyalty. The duty of care requires that a director act in good faith, with the care that an ordinarily prudent person would exercise under similar circumstances. Under this duty, a director must inform himself of, and disclose to shareholders, all material information reasonably available regarding a significant transaction. The duty of loyalty requires that a director act in a manner he or she reasonably believes to be in the best interests of the corporation. He or she must not use his or her corporate position for personal gain or advantage. This duty prohibits self-dealing by a director and mandates that the best interest of the corporation and its shareholders take precedence over any interest possessed by a director, officer or controlling shareholder and not shared by the shareholders generally. In general, actions of a director are presumed to have been made on an informed basis, in good faith and in the honest belief that the action taken was in the best interests of the corporation. However, this presumption may be rebutted by evidence of a breach of one of the fiduciary duties. Should such evidence be presented concerning a transaction by a director, a director must prove the procedural fairness of the transaction, and that the transaction was of fair value to the corporation. |
134
Table of Contents
Cyprus Law | Delaware Law | |||
Cumulative Voting | The Cyprus Companies Law does not recognize the concept of cumulative voting. | Under Delaware Law, cumulative voting for elections of directors is not permitted unless the corporation’s certificate of incorporation specifically provides for it. | ||
| Shareholder Action by Written Consent | According to the Articles of Association of the Company, a resolution in writing signed by all the shareholder then entitled to receive notice of and to attend and vote at general meetings shall be as valid and effective as if the same had been passed at a general meeting of the Company duly convened and held. | Unless otherwise specified in a Delaware corporation’s certificate of incorporation, any action required or permitted to be taken by shareholders at an annual or special meeting may be taken by shareholders without a meeting, without notice and without a vote, if consents, in writing, setting forth the action, are signed by shareholders with not less than the minimum number of votes that would be necessary to authorize the action at a meeting at which all shares entitled to vote were present and voted. All consents must be dated. No consent is effective unless, within 60 days of the earliest dated consent delivered to the corporation, written consents signed by a sufficient number of holders to take the action are delivered to the corporation. | ||
Business Combinations | The Cyprus Companies Law provides for schemes of arrangement, which are arrangements or compromises between a company and any class of shareholder or creditors and used in certain types of reconstructions, amalgamations, capital reorganizations or takeovers.
Under Cyprus Companies Law, arrangements and reconstructions, require:
• the approval at a shareholders’ or creditors’ meeting convened by order of the court, of shareholders representing 75% in value of the capital held by shareholders, or a class thereof, present and voting, either in person or by proxy or creditors representing 75% in value of the debt owed to | Generally, under Delaware law, unless the certificate of incorporation provides for the vote of a higher percentage of the stock, completion of a merger, consolidation, sale, lease or exchange of all or substantially all of a corporation’s assets or dissolution requires:
• the approval of the board of directors; and
• approval by the vote of the holders of a majority of the outstanding stock or, if the certificate of incorporation provides for more or less than one vote per share, a majority of the votes of the outstanding stock of a corporation entitled to vote on the matter. | ||
135
Table of Contents
Cyprus Law | Delaware Law | |||
creditors, or a class thereof, present and voting, either in person or by proxy; and
• the approval of the court.
The Cyprus Companies Law allows for the merger of two Cyprus public companies into one consolidated public company, one company merging into another so as to form a single surviving company, the division of one company into parts and the acquisition of such parts by more than one existing or newly formed company. These transactions require: | ||||
• the approval at a shareholders’ meeting of shareholders representing 75% quarters in value of the capital held by shareholders, or class a thereof, present and voting, either in person or by proxy;
• the directors of the companies to enter into and to approve a written reorganization or division plan, as applicable; | ||||
• the directors of the companies to prepare a written report explaining the terms of the transaction; and
• the approval of the court.
The Cyprus Companies Law provides for the cross border merger between Cyprus companies and companies registered in another EU jurisdiction. In such a case the same requirements listed previously have to be complied with, as well as the requirement to comply with the applicable cross border rules of the other jurisdiction and the preparation of an independent expert report to be given to shareholders of each Cypriot company involved. |
136
Table of Contents
Cyprus Law | Delaware Law | |||
| Interested Shareholders | There are no equivalent provisions under the Cyprus Companies Law relating to transactions with interested shareholders. However, such transactions must be in the corporate interest of the company. | Delaware law generally prohibits a Delaware corporation from engaging in specified corporate transactions (such as mergers, stock and asset sales and loans) with an “interested shareholder” for three years following the time that the shareholder becomes an interested shareholder. Subject to specified exceptions, an interested shareholder is a person or a group that owns 15% or more of the corporation’s outstanding voting stock (including any rights to acquire stock pursuant to an option, warrant, agreement, arrangement or understanding, or upon the exercise of conversion or exchange rights, and stock with respect to which the person has voting rights only), or is an affiliate or associate of the corporation and was the owner of 15% of more of the corporation’s outstanding voting stock at any time within the previous three years. This has the effect of limiting the ability of a potential acquirer to make a two-tiered bid for the target in which all shareholders would not be treated equally. The statute does not apply if, among other things, prior to the date on which such shareholder becomes an interested shareholder, the board of | ||
directors approves either the business combination or the transaction which resulted in the person becoming an interested shareholder. This encourages any potential acquirer of a Delaware corporation to negotiate the terms of any acquisition transaction with the target’s board of directors.
A Delaware corporation may elect to “opt out” of, and not be governed by, this provision through a provision in either its original certificate of incorporation or its bylaws, or an amendment to its original certificate or bylaws that is approved by majority shareholder vote. Generally, this amendment would not become effective until 12 months following its adoption. |
137
Table of Contents
Cyprus Law | Delaware Law | |||
| Limitations on Personal Liability of Directors | Under the Cyprus Companies Law, a director who vacates office remains liable under any provisions of the Cyprus Companies Law that impose liabilities on a director in respect of any acts or omissions or decisions made while that person was a director. | A Delaware corporation may include in its certificate of incorporation provisions limiting the personal liability of its directors to the corporation or its shareholders for monetary damages for many types of breach of fiduciary duty. However, these provisions may not limit liability for any breach of the duty of loyalty, acts or omissions not in good faith or that involve intentional misconduct or a knowing violation of law, the authorization of unlawful dividends, shares repurchases or shares barring redemptions, or any transaction from which a director derived an improper personal benefit. A typical certificate of incorporation would also provide that if Delaware law is amended so as to allow further elimination of, or limitations on, director liability, then the liability of directors will be eliminated or limited to the fullest extent permitted by Delaware law as so amended. However, these provisions would not be likely to bar claims arising under U.S. federal securities laws. | ||
| Indemnification of Directors and Officers | Under the Cyprus Companies Law, a director shall be indemnified out of the assets of the company against any liability incurred by him in defending any proceedings, whether civil or criminal, in which judgment is given in his favor or in which he is acquitted or under a court application under which relief is granted to him by the court. | Under Delaware law, subject to specified limitations in the case of derivative suits brought by a corporation’s shareholders in its name, a corporation may indemnify any person who is made a party to any third party action, suit or proceeding on account of being a director, officer, employee or agent of the corporation (or was serving at the request of the corporation in such capacity for another corporation, partnership, joint venture, trust or other enterprise) against expenses, including attorney’s fees, judgments, fines and amounts paid in settlement actually and reasonably incurred by him or her in connection with the action, suit or proceeding through, among other things, a majority vote of directors who were not parties | ||
138
Table of Contents
Cyprus Law | Delaware Law | |||
to the suit or proceeding (even though less than a quorum), if the person:
• acted in good faith and in a manner he or she reasonably believed to be in or not opposed to the best interests of the corporation or, in some circumstances, at least not opposed to its best interests; and
• in a criminal proceeding, had no reasonable cause to believe his or her conduct was unlawful.
Delaware law permits indemnification by a corporation under similar circumstances for expenses (including attorneys’ fees) actually and reasonably incurred by such persons in connection with the defense or settlement of a derivative action or suit, except that no indemnification may be made in respect of any claim, issue or matter as to which the person is adjudged to be liable to the corporation unless the Delaware Court of Chancery or the court in which the action or suit was brought determines upon application that the person is fairly and reasonably entitled to indemnity for the expenses which the court deems to be proper. | ||||
To the extent a director, officer, employee or agent is successful in the defense of such an action, suit or proceeding, the corporation is required by Delaware law to indemnify such person for reasonable expenses incurred thereby. Expenses (including attorneys’ fees) incurred by such persons in defending any action, suit or proceeding may be paid in advance of the final disposition of such action, suit or proceeding upon receipt of an undertaking by or on behalf of that person to repay the amount if it is ultimately determined that that person is not entitled to be so indemnified. |
139
Table of Contents
Cyprus Law | Delaware Law | |||
| Appraisal Rights | There is no concept of appraisal rights under the Cyprus Companies Law. | A shareholder of a Delaware corporation participating in certain major corporate transactions may, under certain circumstances, be entitled to appraisal rights pursuant to which the shareholder may receive cash in the amount of the fair value of the shares held by that shareholder (as determined by a court) in lieu of the consideration the shareholder would otherwise receive in the transaction. | ||
| Shareholder Suits | Under the Cyprus Companies law, generally, the company, rather than its shareholders, is the proper claimant in an action in respect of a wrong done to the company or where there is an irregularity in the company’s internal management. Notwithstanding this general position, the Cyprus Companies Law provides that a court may allow a shareholder to bring a derivative claim (that is, an action in respect of and on behalf of the company) in respect of a cause of action arising from a director’s negligence, default, breach of duty or breach of trust. | Under Delaware law, a shareholder may bring a derivative action on behalf of the corporation to enforce the rights of the corporation, including for, among other things, breach of fiduciary duty, corporate waste and actions not taken in accordance with applicable law. An individual also may commence a class action suit on behalf of himself or herself and other similarly situated shareholders where the requirements for maintaining a class action under Delaware law have been met. A person may institute and maintain such a suit only if such person was a shareholder at the time of the transaction which is the subject of the suit or his or her shares thereafter devolved upon him or her by operation of law. Additionally, under established Delaware case law, the plaintiff generally must be a shareholder not only at the time of the | ||
| transaction that is the subject of the suit, but also through the duration of the derivative suit. Delaware law also requires that the derivative plaintiff make a demand on the directors of the corporation to assert the corporate claim before the suit may be prosecuted by the derivative plaintiff, unless such demand would be futile. In such derivative and class actions, the court has discretion to permit the winning party to recover attorneys’ fees incurred in connection with such action. | ||||
140
Table of Contents
Cyprus Law | Delaware Law | |||
| Inspection of Books and Records | Under the Cyprus Companies Law, the books and records of the company shall, except when they are duly closed, during business hours (subject to such reasonable restrictions as the company may by its articles or in general meeting impose, so that not less than two hours in each day are allowed for inspection) be open to the inspection of any shareholder without any charge.
Furthermore, any shareholder and any holder of debentures of a company are entitled to be furnished on demand, without charge, with a copy of the last balance sheet of the company, including every document required by law to be annexed thereto, together with a copy of the auditors’ report on the balance sheet. | All shareholders of a Delaware corporation have the right, upon written demand, to inspect or obtain copies of the corporation’s shares ledger and its other books and records for any purpose reasonably related to such person’s interest as a shareholder. | ||
| Variation of Rights of Shares | Under the Cyprus Companies Law, generally any change to the amount of the company’s share capital, the division of the company’s share capital into additional classes, or any change to the rights attached to any class of shares must be approved by a separate vote of each class of shares affected. | Under Delaware Law, a corporation may vary the rights of a class of shares with the approval of a majority of the outstanding shares of such class, unless the certificate of incorporation provides otherwise. | ||
| Amendment of GoverningDocuments | Under the Cyprus Companies Law a company may alter the objects contained in its memorandum by a special resolution of the shareholders of the company and the alteration shall not take effect until, and except in so far as, it is confirmed on petition by a court in Cyprus.
The articles of association of a company may be altered or additions may be made to it by special resolution of the shareholders of the company. | Under Delaware law, amendments to a corporation’s certificate of incorporation require the approval of shareholders holding a majority of the outstanding shares entitled to vote on the amendment. If a class vote on the amendment is required by Delaware law, a majority of the outstanding stock of the class is required, unless a greater proportion is specified in the certificate of incorporation or by other provisions of Delaware law. Under Delaware law, the board of directors may amend bylaws if so authorized in the certificate of incorporation. The shareholders of a Delaware corporation also have the power to amend bylaws. | ||
141
Table of Contents
Cyprus Law | Delaware Law | |||
Dividends and Repurchases | Under the Cyprus Companies Law and our Articles of Association, dividends may only be paid out of net accumulated profits. Dividends may be declared at a general meeting of shareholders, but no dividend may exceed the amount recommended by the directors. In addition, the directors may on their own declare and pay interim dividends. The directors may, before recommending any dividend, set aside out of the profits of the Company such sums as they think proper as a reserve or reserves.
No distribution of dividends may be made when, on the closing date of the last fiscal year, the net assets, as set out in our Company’s annual accounts are, or following such a distribution would become, lower than the amount of the subscribed share capital plus those reserves which may not be distributed under law or our Articles of Association.
Interim dividends can only be paid if interim accounts are drawn up showing that funds available for distribution are sufficient and the amount to be distributed may not exceed the total profits made since the end of the last fiscal year for which the annual accounts have been drawn up, plus any profits brought forward and sums drawn from reserves available for this purpose, minus any losses brought forward and sums to be placed to reserve pursuant to the requirements of the law and our Articles of Association.
In general, a public company may acquire its own shares either directly or through a person acting in its name, provided that the articles of the company allow this and as long as the conditions of the Cyprus Companies Law are met. These conditions include the following:
• shareholder approval via special resolution;
| Delaware law permits a corporation to declare and pay dividends out of statutory surplus or, if there is no surplus, out of net profits for the fiscal year in which the dividend is declared and/or for the preceding fiscal year as long as the amount of capital of the corporation following the declaration and payment of the dividend is not less than the aggregate amount of the capital represented by the issued and outstanding stock of all classes having a preference upon the distribution of assets.
Under Delaware law, any corporation may purchase or redeem its own shares, except that generally it may not purchase or redeem those shares if the capital of the corporation is impaired at the time or would become impaired as a result of the redemption. A corporation may, however, purchase or redeem capital shares that are entitled upon any distribution of its assets to a preference over another class or class of its shares if the shares are to be retired and the capital reduced. |
142
Table of Contents
Cyprus Law | Delaware Law | |||
• the total nominal value of shares acquired by or on behalf of the company, including shares previously acquired and held by the company, may not exceed 10% of the company’s subscribed capital;
• the company must pay for shares repurchased out of net profits;
• such repurchases may not have the effect of reducing the company’s net assets below from the amount specified in Section 169A(1) of the Cyprus Companies Law which provides that on the closing date of the last fiscal year the net assets, as already set out in the company’s annual accounts are, or following such distribution would become, lower than the amount of the subscribed capital plus those reserves which may not be distributed under the law. Where the uncalled part of the subscribed capital is not included in the assets shown in the balance sheet, this amount shall not be calculated in the amount of the subscribed capital. The company may only acquire shares that have been fully paid up;
• Notices containing information regarding share repurchases and shareholder approval thereof must be published in two daily newspapers prior to each repurchase;
• The board of directors of the company shall have an obligation to draw up immediately a list of |
143
Table of Contents
Cyprus Law | Delaware Law | |||
shareholders who are the source of the acquired shares;
• Repurchases may not prejudice the satisfaction of creditors’ claims; and
• Share repurchases must be duly recorded with the Registrar of Companies and the Official Receiver in Cyrus.
The Cyprus Companies law further provides that prior to the company repurchasing its shares, the board of directors must:
• determine that the company’s share price is declining; and
• obtain a certificate from the Company’s auditors stating that the share price is significantly lower than the true value such shares. | ||||
Pre-emption Rights | Under the Cyprus Companies Law, each existing shareholder has a right of pre-emption entitling them to the right to subscribe for their pro-rata shares of any new share issuance made by the company for cash consideration.
If all the shareholders do not fully exercise all their pre-emption rights, the board of directors may decide to offer and sell the remaining shares to third parties at a price and on terms as determined by the board of directors, if at all.
Shareholders’ pre-emption rights may be waived by a Majority Resolution. In connection with such waiver, the board of directors must present a written report indicating the reasons why the right of pre-emption should be waived and justifying the proposed issue price. | Delaware law does not provide shareholders with pre-emption rights. | ||
144
Table of Contents
Cyprus Law | Delaware Law | |||
Dissolution; Winding Up | Under the Cyprus Companies Law, a company may be voluntarily dissolved, liquidated or wound up if the board of directors adopts a declaration of solvency and a majority of the shareholders entitled to vote thereon approve the appointment of a liquidator.
In addition, a company may be wound up by judicial action for the inability to pay its debts. | Under the Delaware Law, unless the board of directors approves the proposal to dissolve, dissolution must be approved by all shareholders entitled to vote thereon. Only if the dissolution is initiated by the board of directors may it be approved by a simple majority of the corporation’s outstanding shares. Delaware law allows a Delaware corporation to include in its certificate of incorporation a supermajority voting requirement in connection with dissolutions initiated by the board. |
Registration Rights
Under the terms of a shareholders agreement we entered into in November 2009 with our shareholders Network18 Holdings Limited, SAIF II Mauritius Company Limited and GS Home Shopping Inc., which we refer to collectively as our principal shareholders, we have granted certain registration rights to certain holders of our “registrable shares,” as described below. Under this agreement, “registrable shares” means:
| • | any ordinary or preference shares held by any of the principal shareholders or the employees or management of our company; and |
| • | any ordinary shares of our company issued in respect of the shares described in paragraph (i) above pursuant to stock splits, stock dividends, reclassifications, recapitalizations or similar events; |
provided that shares that are registrable shares shall cease to be registrable shares:
| • | upon any sale pursuant to a registration statement or Rule 144 under the Securities Act; |
| • | with respect to a principal shareholder, when such principal shareholder is eligible to sell, transfer or otherwise convey all of such principal shareholder’s registrable shares without restriction pursuant to applicable law; or |
| • | upon any sale in any manner to a person or entity which is not entitled to the rights provided by the shareholders agreement. |
At any time or from time to time after the date falling 180 days after the completion of this offering, subject to the terms of the shareholders agreement and the lock-up agreements described in this prospectus, GS Home Shopping Inc. or SAIF II Mauritius Company Limited may request that our company effect a registration under the Securities Act of all or any part of the registrable shares owned by the principal shareholders.
At any time after our company becomes eligible to file a registration statement on Form F-3 (or any similar or successor form for which our company then qualifies relating to secondary offerings), SAIF II Mauritius Company Limited will have the right to require our company to effect an unlimited number of registration statements of all or any portion of the registrable shares held by SAIF II Mauritius Company Limited.
Whenever our company proposes to file a registration statement including, but not limited to, registration statements relating to secondary offerings of securities of our company (but excluding registration statements relating to the paragraphs above and relating to employee benefit plans or with respect to corporate reorganizations) at any time and from time to time, our company will, at least 30 days prior to such filing, give
145
Table of Contents
written notice to all principal shareholders of its intention to do so and, upon the written request of any principal shareholder(s) given within 20 days after our company provides such notice, our company will, as expeditiously as possible, use its reasonable efforts to cause all registrable shares that our company has been requested by such principal shareholder(s) to register or to be registered under the Securities Act to the extent necessary to permit their sale or other disposition in accordance with the intended methods of distribution specified in the request of such principal shareholder(s), provided that our company shall have the right to postpone or withdraw any such registration effected without obligation to any principal shareholder.
We are obligated to pay registration expenses of all registrations under the shareholders agreement, subject to certain limitations. For this purpose, the term “registration expenses” means all expenses incurred by our company in complying with the shareholders agreement, including (without limitation) all registration and filing fees, exchange listing fees, printing expenses, road show expenses, fees and disbursements of counsel for our company, the reasonable fees and expenses of one special counsel selected by the selling shareholders to represent the selling shareholders, state “blue sky” fees and expenses, fees and expenses of our independent auditors and the expense of any special audits incidental to or required by any such registration, but excluding underwriting discounts, selling commissions and the fees and expenses of selling shareholders’ own counsel (other than the counsel selected to represent all the selling shareholders).
History of Share Issuances
The following is a summary of our share and equity-linked issuances since April 1, 2009.
Ordinary and Preference Shares
In November 2009, we issued 2,046,464 ordinary shares to Network18 Holdings Limited for $2,332,969 in cash.
In November 2009, we issued 3,654,437 ordinary shares to Network18 Holdings Limited for $5,000,000 in cash.
In November 2009, we issued 13,542,728 Class G preference shares to GS Home Shopping Inc. for $18,529,160 in cash.
In March 2010, we issued 730,682 Class A preference shares to SAIF II Mauritius Company Limited for $29,227 in cash.
In May 2012, we consummated a share capital reorganization, which included a reduction and subsequent increase in share capital that resulted in an issued share capital of $3,502,056.84 divided into 46,308,665 ordinary shares, 27,700,028 Class A preference shares and 13,542,728 Class G preference shares, held as follows:
| • | 2,500 Class A preference shares and 46,308,665 ordinary shares being held by Network18 Holdings Limited; prior to the reorganization, Network18 Holdings Limited held 2,500 Class A preference shares, 15,625,000 Class B preference shares and 41,923,401 ordinary shares; |
| • | 27,697,528 Class A preference shares being held by SAIF II Mauritius Company Limited; prior to the reorganization, SAIF II Mauritius Company Limited held 13,664,682 Class A preference shares and 50,000,000 Class B preference shares; and |
| • | 13,542,728 Class G preference shares being held by GS Home Shopping Inc. |
Our preference shares will be converted into a total of 41,242,756 ordinary shares on or before the completion of this offering.
146
Table of Contents
Warrants and Related Subordinated Loans
In November 2011, we issued 1,500,000 warrants to purchase Class A preference shares to our three principal shareholders. Network18 Holdings Limited subscribed to 793,000 of these warrants, SAIF II Mauritius Company Limited subscribed to 475,000 and GS Home Shopping Inc. subscribed to 232,000. All of the warrants will be mandatorily convertible into Class A preference shares on a one-for-7.310519 share basis as a result of this initial public offering. The subscription price for the warrants was $10 per warrant, which SAIF II Mauritius Company Limited and GS Home Shopping Inc. paid in full at the time of issuance, and upon conversion of the warrants, neither of these investors will be required to pay additional amounts. Network18 Holdings Limited, however, paid only $7,930 at the time of issuance, with the balance and related accruals thereon payable upon conversion of the warrants. At the time of the issuance of these warrants, Network18 extended us a rupee-denominated subordinated loan in an amount equal to the balance payable by Network18 Holdings Limited on its warrants. The interest rate is equal to the prime lending rate of the State Bank of India, which as of July 31, 2012 was 14.0% per annum, and is reset on a quarterly basis. Interest and principal on this loan are due and payable at the time the warrants are subject to mandatory conversion and will equal the proceeds we receive from Network18 Holdings Limited in connection with this conversion. As of July 31, 2012, the amount outstanding under the loan was 401.5 million ($7.9 million), which was also the largest amount that had been outstanding under the loan up to that date.
In March 2012, we issued 500,000 warrants to purchase Class A preference shares to two of our three principal shareholders. Network18 Holdings Limited subscribed to 422,659 of these warrants and GS Home Shopping Inc. subscribed to 77,341. All of the warrants will be mandatorily convertible into Class A preference shares on a one-for-4.050031 share basis as a result of this initial public offering. The purchase price for the warrants is $10 per warrant, which GS Home Shopping Inc. paid in full at the time of issuance, and upon conversion of the warrants, this investor will not be required to pay additional amounts. Network18 Holdings Limited, however, paid only $4,227 at the time of issuance, with the balance and related accruals thereon payable upon conversion of the warrants. At the time of the issuance of these warrants, Network18 extended us a rupee-denominated subordinated loan in an amount equal to the balance payable by Network18 Holdings Limited on its warrants. The interest rate is equal to the prime lending rate of the State Bank of India, which as of July 31, 2012 was 14.5% per annum, and is reset on a quarterly basis. Interest and principal on this loan are due and payable at the time the warrants are subject to mandatory conversion and will equal the proceeds we receive from Network18 Holdings Limited in connection with this conversion. As of July 31, 2012, the amount outstanding was 191.5 million ($3.8 million), which was also the largest amount that had been outstanding under the loan up to that date.
By the completion of this offering, all outstanding warrants will be converted into an aggregate of 12,990,793 ordinary shares. In addition, the balance payable by Network18 Holdings Limited in connection with this conversion will be applied to repay all amounts due to Network18 under the subordinated loans described above. See “Principal and Selling Shareholders.”
Share Incentive Plans
Under our share option plan, we have granted options to certain of our executive officers and other employees. As of March 31, 2012, options in respect of an aggregate of 2,177,000 ordinary shares were outstanding. No options have been granted since March 31, 2012.
Under our stock appreciation rights scheme, we granted a total of 2,260,000 stock appreciation rights to certain of our executive officers and other employees in November 2012. These are the first, and to date, the only grants under the stock appreciation rights scheme.
147
Table of Contents
SHARES ELIGIBLE FOR FUTURE SALE
Before this offering, there has not been a public market for any of our securities. Future sales of substantial amounts of our ordinary shares in the public markets after this offering, or the perception that such sales may occur, could adversely affect market prices prevailing from time to time. As described below, only a limited number of our ordinary shares currently outstanding will be available for sale immediately after this offering due to contractual and legal restrictions on resale. Nevertheless, after these restrictions lapse, future sales of substantial amounts of our ordinary shares in the public market in the United States, including ordinary shares issued upon exercise of outstanding options or upon transfer of ordinary shares, or the possibility of such sales, could negatively affect the market price in the United States of our ordinary shares and our ability to raise equity capital in the future.
Upon the completion of this offering, we will have outstanding ordinary shares, assuming no exercise of the underwriters’ option to purchase additional ordinary shares. Of that amount, ordinary shares will be publicly held by investors participating in this offering, and ordinary shares will be held by our existing shareholders, who may be our “affiliates” as that term is defined in Rule 144 under the Securities Act. As defined in Rule 144, an “affiliate” of an issuer is a person that directly, or indirectly through one or more intermediaries, controls, or is controlled by, or is under common control with, the issuer.
All of the ordinary shares sold in the offering will be freely transferable in the United States by persons other than our “affiliates” without restriction or further registration under the Securities Act. Ordinary shares purchased by one of our “affiliates” may not be resold, except pursuant to an effective registration statement or an exemption from registration, including an exemption under Rule 144 under the Securities Act described below.
The ordinary shares that will be held by existing shareholders are, and ordinary shares issuable upon exercise of options and outstanding following the completion of this offering will be, “restricted securities” as that term is defined in Rule 144 under the Securities Act. These restricted securities may be sold in the United States only if they are registered or if they qualify for an exemption from registration under Rule 144 or Rule 701 under the Securities Act. These rules are described below.
Lock-Up Agreements
In connection with this offering, we, our officers and directors, certain of our employees and the selling shareholder and our other principal shareholders have agreed that, for a period of 180 days from the date of this prospectus, we and they will not, without the prior written consent of Citigroup Global Markets Inc., dispose of or hedge any shares or any securities convertible into or exchangeable for our ordinary shares. The restrictions described in the preceding sentence do not apply to:
| • | the sale of shares to the underwriters; |
| • | the issuance by us of shares upon the exercise of options or stock appreciation rights or the conversion of securities outstanding on the date of this prospectus; or |
| • | the grant by us of share options under our share option plan or stock appreciation rights under our stock appreciation rights scheme. |
In addition, in the case of each provider of a lock-up agreement other than our company, the restrictions described above do not apply to:
| • | the exercise of share options or stock appreciation rights outstanding on the date of this prospectus; or |
| • | distributions by such person of shares as a gift, as approved by Citigroup; or |
| • | distributions by such persons to limited partners or general partners of such person, provided that such recipient or distributee agrees to be bound by the restrictions described above. |
148
Table of Contents
Citigroup in its sole discretion may release any of the securities subject to these lock-up agreements at any time, which, in the case of officers and directors, shall be with notice. Notwithstanding the foregoing, if (i) during the last 17 days of the 180-day restricted period, we issue an earnings release or material news or a material event relating to our company occurs; or (ii) prior to the expiration of the 180-day restricted period, we announce that we will release earnings results during the 16-day period beginning on the last day of the 180-day restricted period, the restrictions described above shall continue to apply until the expiration of the 18-day period beginning on the issuance of the earnings release or the occurrence of the material news or material event.
The underwriters do not have any agreements or understandings, tacit or explicit, or any present intent to release the lock-ups early.
Immediately following the completion of this offering, shareholders subject to lock-up agreements will hold ordinary shares representing approximately % of our then outstanding ordinary shares, or ordinary shares representing approximately % of our then outstanding ordinary shares, if the underwriters exercise their over-allotment option to purchase additional ordinary shares in full.
Rule 144
In general, under Rule 144 under the Securities Act as currently in effect, beginning 90 days after the date of this prospectus, a person who is not, and has not been at any time during the three months preceding a sale, our affiliate and who has beneficially owned ordinary shares that are “restricted securities” within the meaning of Rule 144 for more than six months would be entitled to sell an unlimited number of those ordinary shares, subject only to the availability of current public information about us. A non-affiliate who has beneficially owned ordinary shares that are “restricted securities” for at least one year from the later of the date these ordinary shares were acquired from us or from our affiliate would be entitled to freely sell those ordinary shares.
A person who is deemed to be an affiliate of ours and who has beneficially owned ordinary shares that are “restricted securities” for at least six months would be entitled to sell, within any three-month period, a number of ordinary shares that is not more than the greater of:
| • | 1.0% of the number of our ordinary shares then outstanding, which will equal approximately ordinary shares immediately after this offering; or |
| • | the average weekly reported trading volume of our ordinary shares on during the four calendar weeks proceeding the date on which a notice of the sale on Form 144 is filed with the SEC by such person. |
Sales under Rule 144 by persons who are deemed to be our affiliates are also subject to manner-of-sale provisions, notice requirements and the availability of current public information about us.
In addition, in each case, these shares would remain subject to lock-up arrangements and would only become eligible for sale when the lock-up period expires.
Rule 701
Beginning 90 days after the date of this prospectus, persons who acquired ordinary shares under a written compensatory plan or contract may be entitled to sell such shares in reliance on Rule 701 under the Securities Act. Rule 701 permits affiliates to sell their Rule 701 shares under Rule 144 without complying with the holding period requirements of Rule 144. Rule 701 further provides that non-affiliates may sell these shares in reliance on Rule 144 without complying with the current information or holding period requirements. However, executive officers that are subject to lock-up arrangements would only become eligible to sell any Rule 701 shares when the lock-up period expires.
149
Table of Contents
Registration Rights
Upon completion of this offering, our existing principal shareholders will be entitled to request that we register their ordinary shares under the Securities Act, following the expiration of the contractual lock-up described in “— Lock-up Agreements” above. See “Description of Share Capital — Registration Rights.”
150
Table of Contents
The following discussion of the material Indian, Cyprus and US federal income tax consequences of an investment in our ordinary shares is based upon laws and relevant interpretations thereof in effect as of the date of this prospectus, all of which are subject to change. This discussion does not deal with all possible tax consequences relating to an investment in our ordinary shares, such as the tax consequences under state, local, non-Indian, non-US and non-Cyprus tax laws.
To the extent that the discussion relates to matters of Cyprus tax law, it represents the opinion of Aristodemou Loizides Yiolitis LLC, our special Cyprus counsel. To the extent the discussion relates to matters of Indian tax law, it represents the opinion of Amarchand & Mangaldas & Suresh A. Shroff & Co., our special Indian counsel. To the extent that the discussion relates to matters of US federal income tax law (not including any of our expectations), and subject to the qualifications herein, it represents the opinion of Sidley Austin LLP, our special US counsel.
Cyprus Taxation
General Cyprus Tax Considerations
Tax Residency. A company is considered to be a resident of Cyprus for tax purposes if its management and control is exercised from Cyprus.
With respect to the individual shareholders, an individual is considered to be a resident of Cyprus for tax purposes if he or she is physically present in Cyprus for a period or periods exceeding in aggregate more than 183 days in any calendar year.
Rates of Taxation. A company which is considered to be a resident of Cyprus for tax purposes is subject to corporate income tax in Cyprus on its worldwide income or other benefits from any business, subject to certain exemptions. Cyprus’ corporate income tax rate is 10%.
A special contribution for the defense of the Republic of Cyprus, or defense tax, also applies to certain selected types of income received by or credited to resident companies. Defense tax applies, subject to certain exemptions, at the following tax rates:
| • | 3% on 75% of rental income; |
| • | 15% on interest income either not arising in the ordinary course of the business, or not closely connected thereto; and |
| • | 20% on dividend income received from a company tax resident abroad. Such dividends are liable to taxation if (i) the foreign company paying the dividend engages directly or indirectly more than 50% in activities which lead to investment income, and (ii) the foreign tax burden on the income of the company paying the dividend is substantially lower than the tax burden in Cyprus (e.g., a tax rate of 5% or more is not considered to be substantially lower). |
Dividend income received by a Cyprus tax resident company from another Cyprus tax resident company is exempt from special contribution for defense unless the dividends are paid indirectly after the expiry of four years from the end of the year in which the profits are generated out of which the dividend is distributed.
Defense tax is levied on the gross amount of income without any deduction for expenses.
Capital gains tax is levied in Cyprus at the flat rate of 20% on profits from the disposal of immovable property located in Cyprus or the shares of companies which own immovable property located in Cyprus (unless the shares are listed on a recognized stock exchange).
151
Table of Contents
Taxation of Income and Gains of Our Holding Company
Gains from the Disposal of Securities. Any gain from disposal of securities by our holding company should be exempt from Cyprus corporate income tax irrespective of the trading nature of the gain, the number of shares held or the holding period. Such gains are also outside the scope of Cyprus capital gains tax provided that the company the shares of which are disposed of does not own directly any immovable property located in Cyprus, or even if it owns such immovable property its shares are listed on a recognized stock exchange.
Profit from the Disposal of Titles is Exempt from Tax. The following investment products fall within the meaning of titles: ordinary shares, founder’s shares, preference shares, options on titles, debentures, bonds, short positions on titles, futures/forwards on titles, swaps on titles, depositary receipts on titles such as ADRs and GDRs, rights of claim on bonds and debentures but not including rights on interest arising from such instruments, index participations only if they represent titles, repurchase agreements or repos on titles, participations on certain companies, units in open-ended or closed-ended collective investment schemes which have been established, registered and operate under the provisions of the law of the country in which they have been established. Examples of such collective investment schemes are: investment trusts, investment funds, mutual funds, unit trusts, real estate investment trusts, international collective investment schemes, undertakings for collective investments in transferable securities and other similar investment organizations.
Dividends to be Received by the Company. Dividend income (whether received from a Cypriot resident or non Cyprus tax resident company) is exempt from Cyprus corporate income tax. Dividend income from a Cypriot tax resident company is exempt from defense tax, unless the dividend is paid indirectly after the expiry of four years from the end of the year in which the profits are generated out of which the dividend is distributed. Dividend income received from non-Cypriot resident companies is exempt from defense tax, unless the company paying the dividend engages more than 50% directly or indirectly in activities which lead to passive income and the foreign tax burden of the company paying the dividend is substantially lower than the tax burden on the income of the company in Cyprus receiving the dividend (in practice “foreign tax burden being significantly lower” means that such company is taxed at an effective tax rate of less than 5%). If the defense tax exemption does not apply, dividends from non-Cypriot resident companies are subject to 20% defense tax. Indian withholding tax can be credited against any such defense tax payable in Cyprus. The amount of the credit cannot exceed the amount which would be ascertained if the amount of the income was computed in accordance with the provisions of Cyprus income tax law.
Interest Income. Any interest accruing to our holding company in the ordinary course of its business, including interest which is loosely connected with the ordinary course of its business qualifies as business income (active interest income) and is subject to corporate income tax in Cyprus at a rate of 10% after the deduction of any relevant business expenses. Such interest income is exempt from defense tax.
If interest income is not considered to arise in the ordinary course of business including interest which is closely connected with the ordinary course of its business, the income is subject to defense tax at a rate of 15% on a gross basis and exempt from corporate income tax. Specifically, interest income arising in connection with the provision of loans to related or associated parties should be generally considered as income arising from activities closely connected with the ordinary carrying on of business activities and should as such be exempt from defense tax and only be subject to Cyprus corporate income tax.
As a matter of principle, the assessment of whether interest income is derived from the ordinary course of business is decided on a case-by-case basis.
Deductibility of Interest Expense. According to Cyprus tax law, interest expenses are tax deductible if they are incurred wholly and exclusively for the production of taxable income. However, no deduction is allowed for interest applicable or deemed to be applicable to the cost of purchasing assets not used for business purposes. Under a recent amendment to Cyprus tax law, in cases where shares are acquired directly or indirectly in a
152
Table of Contents
wholly owned subsidiary and if the subsidiary does not own any assets not used in the business, there will be no interest expense restriction. In cases where the subsidiary holds assets both used and not used in the business, then the interest restriction will be applied as a percentage of assets not used in business to total assets. This amendment in Cyprus tax law applies to the acquisition of shares after January 1, 2012. For investment in subsidiaries acquired prior to January 1, 2012, interest expense that corresponds (or is deemed to correspond) to the acquisition of the investment should not be tax deductible in Cyprus for a period of seven years. Consequently, if our holding company holds assets that are deemed not to be used in the business, then all or part of the interest incurred by our holding company on loans for the acquisition or financing of such assets should be considered non-deductible for tax purposes in Cyprus for a period of seven years from the date these assets were acquired.
Taxation of Income and Gains of the Shareholders
Gains from Disposal of Shares by the Shareholders.A gain realized on the sale of our shares by a non-resident holder is not subject to taxation in Cyprus.
Dividends to be Received by the Shareholders. Dividends to be received by individual or corporate shareholders non-resident in Cyprus are not subject to taxation in Cyprus, either by way of withholding or otherwise.
Dividends to be received by individual shareholders resident in Cyprus are subject to defense tax at the rate of 20%, and the Company is required to withhold such tax from the dividend.
Deemed Distribution Rules. Defense tax at the rate of 20% is payable by a Cypriot resident company on deemed dividend distributions to the extent its shareholders (both individuals and companies) are Cypriot tax residents. These deemed distribution rules do not apply to non-resident shareholders. Under these rules a Cypriot resident company which does not distribute at least 70% of its after-tax profits within two years from the end of the year in which the profits arose, is deemed to have distributed this amount as a dividend two years after that year-end. The amount of this deemed dividend distribution (which is subject to defense tax) is reduced by any actual dividend paid out of the profits of the relevant year at any time up to the date of the deemed distribution. Profits for deemed distribution dividend purposes means the accounting profits arrived at using generally acceptable accounting principles but after the deduction of any transfer to reserves as specified by any law. Any offset of group losses as well as any amounts, including additional depreciation, which emanate from or are the result of revaluing movable or immovable property do not affect accounting profits.
Prospective investors are advised to consult their tax advisors with respect to their particular tax situations and the tax effects of an investment in our shares.
Indian Taxation
The discussion contained herein is based on the applicable tax laws of India as in effect on the date hereof and is subject to possible changes in Indian law that may come into effect after such date. Prospective investors should consult their own tax advisers as to the consequences of purchasing the ordinary shares, including, without limitation, the consequences of the receipt of dividend and the sale, transfer or disposition of the ordinary shares.
Dividend payments to our holding company by our subsidiary are subject to withholding or dividend distribution tax in India, at an effective rate of 16.61%, including applicable cess and surcharge. Any dividend income in respect of our ordinary shares will not be subject to any withholding or deduction in respect of Indian income tax laws so long as our holding company is deemed to be tax resident in Cyprus.
153
Table of Contents
Pursuant to recent amendments to the Indian Income Tax Act, 1961, as amended, income arising directly or indirectly through the sale of a capital asset, including any share or interest in a company or entity registered or incorporated outside India, will be liable to tax in India, if such share or interest derives, directly or indirectly, its value substantially from assets located in India and whether or not the seller of such share or interest has a residence, place of business, business connection, or any other presence in India. All of our assets are located in India. The amendments do not deal with the interplay between the Indian Income Tax Act, 1961, as amended, and the double taxation avoidance agreements that India has entered into with countries such as the United States, in case of an indirect transfer. Accordingly, the implications of the recent amendments are presently unclear.
U.S. Federal Income Taxation
The following discussion describes the material United States federal income tax consequences associated with the acquisition, ownership and disposition of our ordinary shares as of the date hereof. The discussion set forth below is applicable only to U.S. Holders (as defined below) and does not purport to be a comprehensive description of all tax considerations that may be relevant to a particular person’s decision to acquire the ordinary shares. Except where noted, this discussion applies only to a U.S. Holder that holds shares as capital assets for United States federal income tax purposes. As used herein, the term “U.S. Holder” means a beneficial owner of an ordinary share that is for United States federal income tax purposes:
| • | an individual citizen or resident of the United States; |
| • | a corporation (or other entity treated as a corporation for United States federal income tax purposes) created or organized in or under the laws of the United States, any state thereof or the District of Columbia; |
| • | an estate the income of which is subject to United States federal income taxation regardless of its source; or |
| • | a trust if it (1) is subject to the primary supervision of a court within the United States and one or more United States persons have the authority to control all substantial decisions of the trust or (2) has a valid election in effect under applicable United States Treasury regulations to be treated as a United States person. |
This discussion does not describe alternative minimum tax consequences or all of the United States federal income tax consequences applicable to you if you are subject to special treatment under the United States federal income tax laws, including if you are a broker, a dealer or trader in securities or currencies, a financial institution, a regulated investment company, a real estate investment trust, a cooperative, an insurance company, a pension plan, a tax-exempt entity, a person holding our shares as part of a hedging, integrated or conversion transaction, a constructive sale, a wash sale or a straddle, a person who owns or is deemed to own 10% or more of our voting stock, a person holding our shares in connection with a trade or business conducted outside of the United States, a partnership or other pass-through entity for United States federal income tax purposes, a U.S. expatriate or a person whose “functional currency” for United States federal income tax purposes is not the United States dollar. The discussion below is based upon the provisions of the United States Internal Revenue Code of 1986, as amended (the “Code”), and regulations (including proposed regulations), rulings and judicial decisions thereunder as of the date hereof, and such authorities may be replaced, revoked or modified, possibly with retroactive effect, so as to result in United States federal income tax consequences different from those discussed below.
If a partnership holds our shares, the tax treatment of a partner will generally depend upon the status of the partner and the activities of the partnership. If you are a partnership holding our shares or a partner in a partnership holding our shares, you should consult your tax advisors as to the particular United States federal income tax consequences of acquiring, holding and disposing of the shares.
154
Table of Contents
This discussion does not contain a detailed description of all the United States federal income tax consequences to you in light of your particular circumstances and does not address the effects of any state, local or non-United States tax laws.If you are considering the purchase, ownership or disposition of our ordinary shares, you should consult your own tax advisors concerning the United States federal income tax consequences to you in light of your particular situation as well as any other consequences to you arising under U.S. federal, state and local laws and the laws of any other applicable taxing jurisdiction in light of your particular circumstances.
Taxation of Distributions
Subject to the passive foreign investment company, or PFIC, rules discussed below, the gross amount of distributions on the shares will be taxable as dividends to the extent paid out of our current or accumulated earnings and profits, as determined under United States federal income tax principles. Because we do not expect to keep track of earnings and profits in accordance with United States federal income tax principles, you should expect that a distribution in respect of the ordinary shares will generally be treated and reported as a dividend to you. Such dividend income will be includable in your gross income as ordinary income on the day actually received by you or on the day received by your nominee or agent that holds the shares on your behalf. Such dividends will not be eligible for the dividends received deduction allowed to corporations in respect of dividends received from other U.S. corporations under the Code.
With respect to non-corporate U.S. Holders, certain dividends received in taxable years beginning before January 1, 2013 from a qualified foreign corporation may be subject to reduced rates of taxation. A foreign corporation is treated as a qualified foreign corporation with respect to dividends paid by that corporation on shares that are readily tradable on an established securities market in the United States. We have applied to list ordinary shares on the NYSE and expect such shares to be considered readily tradable on an established securities market. We would also be a qualified foreign corporation if we are eligible for the benefits of the income tax treaty between the United States and Cyprus, (or another income tax treaty within the United States). However, even if the shares are readily tradable on an established securities market in the United States and/or we are eligible for the benefits of the income tax treaty between the United States and Cyprus, (or another income tax treaty within the United States) we will not be treated as a qualified foreign corporation if we are a PFIC for the taxable year in which we pay a dividend or were a PFIC for the preceding taxable year. Non-corporate holders that do not meet a minimum holding period requirement during which they are not protected from a risk of loss or that elect to treat the dividend income as “investment income” pursuant to Section 163(d)(4) of the Code will not be eligible for the reduced rates of taxation regardless of our status as a qualified foreign corporation. For this purpose, the minimum holding period requirement will not be met if a share has been held by a holder for 60 days or less during the 121-day period beginning on the date which is 60 days before the date on which such share becomes ex-dividend with respect to such dividend, appropriately reduced by any period in which such holder is protected from risk of loss. In addition, the rate reduction will not apply to dividends if the recipient of a dividend is obligated to make related payments with respect to positions in substantially similar or related property. This disallowance applies even if the minimum holding period has been met. You should consult your own tax advisors regarding the availability of the reduced tax rate on dividends in light of your particular circumstances.
Subject to certain conditions and limitations imposed by United States federal income tax rules relating to the availability of the foreign tax credit, some of which vary depending upon the U.S. Holder’s circumstances, any foreign withholding taxes on dividends will be treated as foreign taxes eligible for credit against your United States federal income tax liability. The application of the rules governing foreign tax credits depends on the particular circumstances of each U.S. Holder. For purposes of calculating the foreign tax credit, dividends paid on the ordinary shares will be treated as income from sources outside the United States and will generally constitute “passive category income.”
155
Table of Contents
The rules governing the foreign tax credit are complex and involve the application of rules that depend on your particular circumstances. You are urged to consult your tax advisors regarding the availability of the foreign tax credit under your particular circumstances.
Passive Foreign Investment Company
Based on the composition of our income and valuation of our assets, we do not believe we were a PFIC for our taxable year ending March 31, 2012 and do not expect to be a PFIC for United States federal income tax purposes for our taxable year ending March 31, 2013, and we do not expect to become one in the future. However, because PFIC status is an annual factual determination that cannot be made until after the close of each taxable year and depends on the composition of a company’s income and assets and the market value of its assets from time to time, there can be no assurance that we will not be a PFIC for any taxable year.
In general, a non-United States corporation will be treated as a PFIC for U.S. federal income tax purposes for any taxable year in which:
| • | at least 75% of its gross income is passive income (the “income” test), or |
| • | at least 50% of the value (determined based on a quarterly average) of its gross assets is attributable to assets that produce, or are held for the production of, passive income (the “asset” test). |
For this purpose, passive income generally includes dividends, interest, royalties and rents (except for certain royalties and rents derived from the active conduct of a trade or business), certain gains from commodities and securities transactions and the excess of gains over losses from the disposition of assets which produce passive income. If we own, directly or indirectly, at least 25% (by value) of the stock of another corporation, we will be treated, for purposes of the PFIC tests described above, as directly owning our proportionate share of the other corporation’s assets and receiving our proportionate share of the other corporation’s income.
If we were a PFIC for any year during which you hold our shares, we would continue to be treated as a PFIC for all succeeding years during which you held our shares unless we cease to be a PFIC and you make a “deemed sale” election with respect to our shares. If such election is made, you will be deemed to have sold our shares you hold at their fair market value on the last day of the last taxable year in which we qualified as a PFIC, and any gain from such deemed sale would be subject to the consequences described below. After the deemed sale election, our shares with respect to which the deemed sale election was made will not be treated as shares in a PFIC unless we subsequently become a PFIC.
If we are a PFIC for any taxable year during which you hold our shares, you will be subject to special tax rules with respect to any “excess distribution” received and any gain realized from a sale or other disposition, including a pledge, of shares, unless you make a “mark-to-market” election as discussed below. Distributions you receive in a taxable year that are greater than 125% of the average annual distributions you received during the shorter of the three preceding taxable years or your holding period for the shares will be treated as excess distributions. Under these special tax rules:
| • | the excess distribution or gain will be allocated ratably over your holding period for your ordinary shares, |
| • | the amount allocated to the current taxable year, and any taxable year prior to the first taxable year in which we were a PFIC, will be treated as ordinary income, and |
| • | the amount allocated to each other year will be subject to tax at the highest applicable tax rate in effect for corporations or individuals, as appropriate, for that taxable year and the interest charge generally applicable to underpayments of tax will be imposed on the resulting tax attributable to each such year. |
156
Table of Contents
The tax liability for amounts allocated to years prior to the year of disposition, or “excess distribution,” cannot be offset by any net operating losses for such years, and gains (but not losses) realized on the sale of the shares cannot be treated as capital and will be subject to the “excess distribution” regime described above, even if you hold the shares as capital assets.
In addition, non-corporate U.S. Holders will not be eligible for reduced rates of taxation on any dividends received from us in taxable years beginning prior to January 1, 2013 if we are a PFIC in our taxable year in which such dividends are paid or in the preceding taxable year.
You will be required to file Internal Revenue Service Form 8621 annually regarding any distributions received on the ordinary shares and any gain realized on the disposition of the ordinary shares if you hold our ordinary shares in any year in which we are classified as a PFIC, and other reporting requirements may apply.
If we are a PFIC for any taxable year during which a U.S. Holder holds our ordinary shares and any of our non-United States subsidiaries is also a PFIC, a U.S. Holder would be treated as owning a proportionate amount (by value) of the shares of the lower-tier PFIC for purposes of the application of these rules. Under these circumstances, a U.S. Holder would be subject to United States federal income tax on (i) a distribution on the shares of a lower-tier PFIC and (ii) a disposition of shares of a lower-tier PFIC, both as if such U.S. Holder directly held the shares of such lower-tier PFIC. You are urged to consult your tax advisors about the application of the PFIC rules to any of our subsidiaries.
In certain circumstances, in lieu of being subject to the excess distribution rules discussed above, you may make an election to include gain on the stock of a PFIC as ordinary income under a mark-to-market method, provided that such stock is regularly traded in other than de minimis quantities for at least 15 days during each calendar quarter on a qualified exchange, as defined in applicable U.S. Treasury Regulations. We have applied to list ordinary shares on the NYSE and expect such shares to be “regularly traded” for purposes of the mark-to-market election.
If you make an effective mark-to-market election, you will include in each year that we are a PFIC, as ordinary income the excess of the fair market value of your ordinary shares at the end of the year over your adjusted tax basis in the ordinary shares. You will be entitled to deduct as an ordinary loss in each such year the excess of your adjusted tax basis in the ordinary shares over their fair market value at the end of the year, but only to the extent of the net amount previously included in income as a result of the mark-to-market election. If you make an effective mark-to-market election, any gain you recognize upon the sale or other disposition of your ordinary shares in a year in which we are a PFIC will be treated as ordinary income. Any loss will be treated as ordinary loss, but only to the extent of the net amount of previously included income as a result of the mark-to-market election.
Your adjusted tax basis in the shares will be increased by the amount of any income inclusion and decreased by the amount of any deductions under the mark-to-market rules. If you make a mark-to-market election, it will be effective for the taxable year for which the election is made and all subsequent taxable years unless the ordinary shares are no longer regularly traded on a qualified exchange or the Internal Revenue Service consents to the revocation of the election. A mark-to-market election should be made by filing IRS Form 8621 in the first taxable year during which the U.S. Holder held the ordinary shares and in which we are a PFIC. A mark-to-market election would not be available with respect to a subsidiary PFIC of ours that a U.S. Holder is deemed to own for the purposes of the PFIC rules; accordingly, a U.S. Holder would not be able to mitigate certain of the adverse U.S. “excess distribution” federal income tax consequences of its deemed ownership of stock in our subsidiary PFICs by making a mark-to-market election. You are urged to consult your tax advisor about the availability of the mark-to-market election and whether making the election would be advisable in your particular circumstances.
157
Table of Contents
Alternatively, holders of PFIC shares can sometimes avoid the rules described above by electing to treat such PFIC as a “qualified electing fund” under Section 1295 of the Code. However, this option is not available to you because we do not intend to comply with the requirements, or furnish you with the information, necessary to permit you to make this election.
You are urged to consult your tax advisors concerning the United States federal income tax consequences of holding ordinary shares if we are considered a PFIC in any taxable year.
Sale or Other Disposition of Ordinary Shares
For United States federal income tax purposes, you will recognize taxable gain or loss on any sale or exchange or other taxable disposition of an ordinary share in an amount equal to the difference between the amount realized for the share and your tax basis in the ordinary share, in each case as determined in United States dollars. Subject to the discussion above under “Passive Foreign Investment Company,” such gain or loss will be capital gain or loss. Capital gains of non-corporate U.S. Holders derived with respect to capital assets held for more than one year are eligible for reduced rates of taxation. The deductibility of capital losses is subject to limitations. Any gain or loss recognized by you will generally be treated as United States source gain or loss for U.S. foreign tax credit purposes and will generally constitute passive category income or less.
As discussed below under “Taxation — Indian Taxation,” US Holders may be subject to Indian tax with respect to any income arising from the sale of ordinary shares. Because any gain recognized by a US Holder is generally treated as United States source gain, if any Indian tax is imposed on such gain, the US Holder may not be able to utilize the foreign tax credit relating to such Indian tax unless such holder has foreign source income in the same category from other sources. You are encouraged to consult your tax advisor regarding the availability of the U.S. foreign tax credit in your particular circumstances.
Information Reporting and Backup Withholding
In general, information reporting will apply to distributions in respect of our ordinary shares and the proceeds from the sale, exchange or redemption of our ordinary shares that are paid to you within the United States or through certain U.S.-related financial intermediaries, unless you are an exempt recipient. Backup withholding may apply to such payments if you fail to (i) provide a taxpayer identification number or (ii) certify that you are not subject to backup withholding. U.S. Holders who are required to establish their exemption from backup withholding must provide such certification on Internal Revenue Service Form W-9. U.S. Holders should consult their tax advisors regarding the application of the United States information reporting and backup withholding rules.
Backup withholding is not an additional tax. Any amounts withheld under the backup withholding rules will be allowed as a refund or a credit against your United States federal income tax liability provided the required information is timely furnished to the Internal Revenue Service.
Recent Tax Legislation
For taxable years beginning after December 31, 2012, certain U.S. Holders that are individuals, estates or trusts will be subject to an additional 3.8% tax on all or a portion of their “net investment income,” which may include all or a portion of their dividends and net gains from the disposition of shares. If you are a U.S. Holder that is an individual, estate or trust, you should consult your tax advisors regarding the applicability of this tax to your income and gains in respect of your investment in the ordinary shares.
Under recently enacted legislation, the Hiring Incentives to Restore Employment Act (the “HIRE Act”), individuals that (i) are either (a) a U.S. citizen, (b) a resident alien for any part of the year, (c) a nonresident alien that has made an election to be treated as a resident alien for purposes of filing a joint U.S. federal income tax
158
Table of Contents
return or (d) a nonresident alien who is abona fide resident of American Samoa or Puerto Rico and (ii) own “specified foreign financial assets” with an aggregate value in excess of $50,000 on the last day of the taxable year (or with an aggregate value in excess of $75,000 at any time during the taxable year), will generally be required to file an information report on IRS Form 8938 with respect to such assets with their U.S. federal tax returns. “Specified foreign financial assets” include any financial accounts maintained by foreign financial institutions, as well as any of the following, but only if they are held for investment and not held in accounts maintained by financial institutions: (i) stocks and securities issued by non-United States persons, (ii) financial instruments and contracts that have non-United States issuers or counterparties, and (iii) interests in foreign entities. Holders that are individuals are urged to consult their tax advisors regarding the application of this legislation to their ownership of shares of our ordinary stock.
159
Table of Contents
Citigroup Global Markets Inc. is acting as sole book-running manager of the offering and as representative of the underwriters named below. Subject to the terms and conditions stated in the underwriting agreement dated the date of this prospectus, each underwriter named below has severally agreed to purchase, and we and the selling shareholders have agreed to sell to that underwriters, the number of ordinary shares set forth opposite the underwriter’s name.
Underwriter | Number of Ordinary shares | |
Citigroup Global Markets Inc | ||
| ||
Total | ||
|
The underwriting agreement provides that the obligations of the underwriters to purchase the ordinary shares included in this offering are subject to approval of legal matters by counsel and to other conditions. The underwriters are obligated to purchase all the ordinary shares (other than those covered by the over-allotment option described below) if they purchase any of the ordinary shares.
Ordinary shares sold by the underwriters to the public will initially be offered at the initial public offering price set forth on the cover of this prospectus. Any ordinary shares sold by the underwriters to securities dealers may be sold at a discount from the initial public offering price not to exceed $ per ordinary share. If all the ordinary shares are not sold at the initial offering price, the underwriters may change the offering price and the other selling terms. The representative has advised us and the selling shareholders that they do not intend to make sales to discretionary accounts.
If the underwriters sell more ordinary shares than the total number set forth in the table above, we and some of the selling shareholders have granted to the underwriters an option, exercisable for 30 days from the date of this prospectus, to purchase up to additional ordinary shares at the public offering price less the underwriting discount. The underwriters may exercise the option solely for the purpose of covering over-allotments, if any, in connection with this offering. To the extent the option is exercised, each underwriter must purchase a number of additional ordinary shares approximately proportionate to that underwriter’s initial purchase commitment. Any ordinary shares issued or sold under the option will be issued and sold on the same terms and conditions as the other ordinary shares that are the subject of this offering.
We, our officers and directors, certain of our employees and the selling shareholders and our other principal shareholders have agreed that, for a period of 180 days from the date of this prospectus, we and they will not, without the prior written consent of Citigroup, dispose of or hedge any shares or any securities convertible into or exchangeable for our ordinary shares. The restrictions described in the preceding sentence do not apply to:
| • | the sale of shares to the underwriters; |
| • | the issuance by us of shares upon the exercise of options or stock appreciation rights or the conversion of securities outstanding on the date of this prospectus; or |
| • | the grant by us of share options under our share option plan or stock appreciation rights under our stock appreciation rights scheme. |
In addition, in the case of each provider of a lock-up agreement other than our company, the restrictions described above do not apply to:
| • | the exercise of share options or stock appreciation rights outstanding on the date of this prospectus; or |
| • | distributions by such person of shares as a gift, as approved by Citigroup; or |
| • | distributions by such persons to limited partners or general partners of such person, provided that such recipient or distributee agrees to be bound by the restrictions described above. |
160
Table of Contents
Citigroup in its sole discretion may release any of the securities subject to these lock-up agreements at any time, which, in the case of officers and directors, shall be with notice. Notwithstanding the foregoing, if (i) during the last 17 days of the 180-day restricted period, we issue an earnings release or material news or a material event relating to our company occurs; or (ii) prior to the expiration of the 180-day restricted period, we announce that we will release earnings results during the 16-day period beginning on the last day of the 180-day restricted period, the restrictions described above shall continue to apply until the expiration of the 18-day period beginning on the issuance of the earnings release or the occurrence of the material news or material event.
Prior to this offering, there has been no public market for our ordinary shares. Consequently, the initial public offering price for the ordinary shares was determined by negotiations between us, the selling shareholders and the representative. Among the factors considered in determining the initial public offering price were our results of operations, our current financial condition, our future prospects, our markets, the economic conditions in and future prospects for the industry in which we compete, our management, and currently prevailing general conditions in the equity securities markets, including current market valuations of publicly traded companies considered comparable to our company. We cannot assure you, however, that the price at which the shares will sell in the public market after this offering will not be lower than the initial public offering price or that an active trading market in our shares will develop and continue after this offering.
Our ordinary shares have been approved for listing on under the symbol “ .”
The following table shows the underwriting discounts and commissions that we and the selling shareholders are to pay to the underwriters in connection with this offering. These amounts are shown assuming both no exercise and full exercise of the underwriters’ over-allotment option.
| Paid by NW18 HSN Holdings Plc | Paid by Selling Shareholders | |||||||||||||||
| No Exercise | Full Exercise | No Exercise | Full Exercise | |||||||||||||
Per share | $ | $ | $ | $ | ||||||||||||
Total | $ | $ | $ | $ | ||||||||||||
We and the selling shareholders estimate that our respective portions of the total expenses of this offering will be $ and $ . The estimated expenses of this offering that are payable by us, exclusive of the underwriting discounts and commissions, are approximately $2.3 million, including registration fees of approximately $10,000, listing fees of approximately $150,000, estimated printing fees of approximately $650,000, estimated legal fees and expenses of approximately $1.2 million and estimated accounting fees and expenses of approximately $300,000.
In connection with the offering, the underwriters may purchase and sell ordinary shares in the open market. Purchases and sales in the open market may include short sales, purchases to cover short positions, which may include purchases pursuant to the over-allotment option and stabilizing purchases.
| • | Short sales involve secondary market sales by the underwriters a greater number of shares than they are required to purchase in the offering. |
| • | “Covered” short sales are sales of shares in an amount up to the number of shares represented by the underwriters’ over-allotment option. |
| • | “Naked” short sales are sales of shares in an amount in excess of the number of shares represented by the underwriters’ over-allotment option. |
| • | Covering transactions involve purchases of shares either pursuant to the underwriters’ over-allotment option or in the open market after the distribution has been completed in order to cover short positions. |
161
Table of Contents
| • | To close a naked short position, the underwriters must purchase shares in the open market after the distribution has been completed. A naked short position is more likely to be created if the underwriters are concerned that there may be downward pressure on the price of the shares in the open market after pricing that could adversely affect investors who purchase in the offering. |
| • | To close a covered short position, the underwriters must purchase shares in the open market after the distribution has been completed or must exercise the over-allotment option. In determining the source of shares to close the covered short position, the underwriters will consider, among other things, the price of shares available for purchase in the open market as compared to the price at which they may purchase shares through the over-allotment option. |
| • | Stabilizing transactions involve bids to purchase shares so long as the stabilizing bids do not exceed a specified maximum. Purchases to cover short positions and stabilizing purchases, as well as other purchases by the underwriters for their own accounts, may have the effect of preventing or retarding a decline in the market price of the shares. They may also cause the price of the shares to be higher than the price that would otherwise exist in the open market in the absence of these transactions. The underwriters may conduct these transactions on , in the over-the-counter market or otherwise. If the underwriters commence any of these transactions, they may discontinue them at any time. |
Conflicts of Interest
The underwriters are full service financial institutions engaged in various activities, which may include securities trading, commercial and investment banking, financial advisory, investment management, principal investment, hedging, financing and brokerage activities. The underwriters and their respective affiliates have in the past performed commercial banking, investment banking and advisory services for us from time to time for which they have received customary fees and reimbursement of expenses and may, from time to time, engage in transactions with and perform services for us, including payment gateway services, in the ordinary course of their business for which they may receive customary fees and reimbursement of expenses. In the ordinary course of their various business activities, the underwriters and their respective affiliates may make or hold a broad array of investments and actively trade debt and equity securities (or related derivative securities) and financial instruments (which may include bank loans and/or credit default swaps) for their own account and for the accounts of their customers and may at any time hold long and short positions in such securities and instruments. Such investment and securities activities may involve our securities and instruments or the securities and instruments of our principal shareholders.
We and the selling shareholders have agreed to indemnify the underwriters against certain liabilities, including liabilities under the Securities Act, or to contribute to payments the underwriters may be required to make because of any of those liabilities.
The underwriters may be contacted at the following address: Citigroup Global Markets Inc., c/o Citigroup Global Markets Inc., 388 Greenwich Street, New York, New York 10013, USA.
Notice to Prospective Investors in the European Economic Area.
In relation to each member state of the European Economic Area that has implemented the Prospectus Directive (each, a relevant member state), with effect from and including the date on which the Prospectus Directive is implemented in that relevant member state (the relevant implementation date), an offer of ordinary shares described in this prospectus may not be made to the public in that relevant member state other than:
| • | to any legal entity which is a qualified investor as defined in the Prospectus Directive; |
| • | to fewer than 100 or, if the relevant member state has implemented the relevant provision of the 2010 PD Amending Directive, 150 natural or legal persons (other than qualified investors as defined in the |
162
Table of Contents
Prospectus Directive), as permitted under the Prospectus Directive, subject to obtaining the prior consent of the relevant dealer or dealers nominated by us for any such offer; or |
| • | in any other circumstances falling within Article 3(2) of the Prospectus Directive, |
provided that no such offer of ordinary shares shall require us or any underwriter to publish a prospectus pursuant to Article 3 of the Prospectus Directive.
For purposes of this provision, the expression an “offer of securities to the public” in any relevant member state means the communication in any form and by any means of sufficient information on the terms of the offer and the shares to be offered so as to enable an investor to decide to purchase or subscribe for the shares, as the expression may be varied in that member state by any measure implementing the Prospectus Directive in that member state, and the expression “Prospectus Directive” means Directive 2003/71/EC (and amendments thereto, including the 2010 PD Amending Directive, to the extent implemented in the relevant member state) and includes any relevant implementing measure in the relevant member state. The expression 2010 PD Amending Directive means Directive 2010/73/EU.
The sellers of the ordinary shares have not authorized and do not authorize the making of any offer of ordinary shares through any financial intermediary on their behalf, other than offers made by the underwriters with a view to the final placement of the ordinary shares as contemplated in this prospectus. Accordingly, no purchaser of the ordinary shares, other than the underwriters, is authorized to make any further offer of the ordinary shares on behalf of the sellers or the underwriters.
Notice to Prospective Investors in the United Kingdom
This prospectus is only being distributed to, and is only directed at, persons in the United Kingdom that are qualified investors within the meaning of Article 2(1)(e) of the Prospectus Directive that are also (i) investment professionals falling within Article 19(5) of the Financial Services and Markets Act 2000 (Financial Promotion) Order 2005 (the “Order”) or (ii) high net worth entities, and other persons to whom it may lawfully be communicated, falling within Article 49(2)(a) to (d) of the Order (each such person being referred to as a “relevant person”). This prospectus and its contents are confidential and should not be distributed, published or reproduced (in whole or in part) or disclosed by recipients to any other persons in the United Kingdom. Any person in the United Kingdom that is not a relevant person should not act or rely on this document or any of its contents.
Notice to Prospective Investors in France
Neither this prospectus nor any other offering material relating to the ordinary shares described in this prospectus has been submitted to the clearance procedures of the Autorité des Marchés Financiers or of the competent authority of another member state of the European Economic Area and notified to the Autorité des Marchés Financiers. The ordinary shares have not been offered or sold and will not be offered or sold, directly or indirectly, to the public in France. Neither this prospectus nor any other offering material relating to the ordinary shares has been or will be:
| • | released, issued, distributed or caused to be released, issued or distributed to the public in France; or |
| • | used in connection with any offer for subscription or sale of the ordinary shares to the public in France. |
Such offers, sales and distributions will be made in France only:
| • | to qualified investors (investisseurs qualifiés) and/or to a restricted circle of investors (cercle restreint d’investisseurs), in each case investing for their own account, all as defined in, and in accordance with articles L.411-2, D.411-1, D.411-2, D.734-1, D.744-1, D.754-1 and D.764-1 of the French Code monétaire et financier; |
163
Table of Contents
| • | to investment services providers authorized to engage in portfolio management on behalf of third parties; or |
| • | in a transaction that, in accordance with article L.411-2-II-1°-or-2°-or 3° of the French Code monétaire et financier and article 211-2 of the General Regulations (Règlement Général) of the Autorité des Marchés Financiers, does not constitute a public offer (appel public à l’épargne). |
The ordinary shares may be resold directly or indirectly, only in compliance with articles L.411-1, L.411-2, L.412-1 and L.621-8 through L.621-8-3 of the French Code monétaire et financier.
Notice to Prospective Investors in Hong Kong
The ordinary shares may not be offered or sold in Hong Kong by means of any document other than in circumstances which do not constitute an offer to the public within the meaning of the Companies Ordinance (Cap. 32, Laws of Hong Kong), or (ii) to “professional investors” within the meaning of the Securities and Futures Ordinance (Cap. 571, Laws of Hong Kong) and any rules made thereunder, or (iii) in other circumstances which do not result in the document being a “prospectus” within the meaning of the Companies Ordinance (Cap. 32, Laws of Hong Kong) and no advertisement, invitation or document relating to the ordinary shares may be issued or may be in the possession of any person for the purpose of issue (in each case whether in Hong Kong or elsewhere), which is directed at, or the contents of which are likely to be accessed or read by, the public in Hong Kong (except if permitted to do so under the laws of Hong Kong) other than with respect to the ordinary shares which are or are intended to be disposed of only to persons outside Hong Kong or only to “professional investors” within the meaning of the Securities and Futures Ordinance (Cap. 571, Laws of Hong Kong) and any rules made thereunder.
Notice to Prospective Investors in Japan
The ordinary shares offered in this prospectus have not been registered under the Securities and Exchange Law of Japan. The ordinary shares have not been offered or sold and will not be offered or sold, directly or indirectly, in Japan or to, or for the account of any resident of Japan, except (i) pursuant to an exemption from the registration requirements of the Securities and Exchange Law and (ii) in compliance with any other applicable requirements of Japanese law.
Notice to Prospective Investors in Singapore
This prospectus has not been registered as a prospectus with the Monetary Authority of Singapore. Accordingly, this prospectus and any other document or material in connection with the offer or sale, or invitation for subscription or purchase, of the ordinary shares may not be circulated or distributed, nor may the ordinary shares be offered or sold, or be made the subject of an invitation for subscription or purchase, whether directly or indirectly, to persons in Singapore other than (i) to an institutional investor under Section 274 of the Securities and Futures Act, Chapter 289 of Singapore, or the SFA, (ii) to a relevant person pursuant to Section 275(1), or any person pursuant to Section 275(1A), and in accordance with the conditions specified in Section 275 of the SFA or (iii) otherwise pursuant to, and in accordance with the conditions of, any other applicable provision of the SFA, in each case subject to compliance with conditions set forth in the SFA.
Where the ordinary shares are subscribed or purchased under Section 275 of the SFA by a relevant person which is:
| • | a corporation (which is not an accredited investor (as defined in Section 4A of the SFA)) the sole business of which is to hold investments and the entire share capital of which is owned by one or more individuals, each of whom is an accredited investor; or |
| • | a trust (where the trustee is not an accredited investor) whose sole purpose is to hold investments and each beneficiary of the trust is an individual who is an accredited investor, |
164
Table of Contents
shares, debentures and units of shares and debentures of that corporation or the beneficiaries’ rights and interest (howsoever described) in that trust shall not be transferred within six months after that corporation or that trust has acquired the shares pursuant to an offer made under Section 275 of the SFA except:
| • | to an institutional investor (for corporations, under Section 274 of the SFA) or to a relevant person defined in Section 275(2) of the SFA, or to any person pursuant to an offer that is made on terms that such shares, debentures and units of shares and debentures of that corporation or such rights and interest in that trust are acquired at a consideration of not less than S$200,000 (or its equivalent in a foreign currency) for each transaction, whether such amount is to be paid for in cash or by exchange of securities or other assets, and further for corporations, in accordance with the conditions, specified in Section 275 of the SFA; |
| • | where no consideration is or will be given for the transfer; or |
| • | where the transfer is by operation of law. |
Notice to Prospective Investors in India
This document has not been and will not be registered as a prospectus or a statement in lieu of prospectus with any registrar of companies in India. This document has not been and will not be reviewed or approved by any regulatory authority in India, including the Securities and Exchange Board of India, any registrar of companies in India or any stock exchange in India. This document and this offering of ordinary shares are not and should not be construed as an invitation, offer or sale of any securities to the public in India. Other than in compliance with the private placement exemptions under applicable laws and regulations in India, including the Companies Act, 1956, as amended, our ordinary shares have not been, and will not be, offered or sold to the public or any member of the public in India. This document is strictly personal to the recipient and neither this document nor the offering of our ordinary shares is calculated to result, directly or indirectly, in our ordinary shares becoming available for subscription or purchase by persons other than those receiving the invitation or offer.
Notice to Prospective Investors in Cyprus
This offering of ordinary shares may not be offered, marketed or sold in the Republic of Cyprus.
165
Table of Contents
We are being represented by Sidley Austin LLP with respect to legal matters of United States federal securities and New York state laws. Certain legal matters of United States federal securities and New York state laws in connection with this offering will be passed upon for the underwriters by Latham & Watkins LLP. The validity of the ordinary shares offered in this offering and legal matters as to Cyprus law will be passed upon for us by Aristodemou Loizides Yiolitis LLC. Certain legal matters as to Indian law will be passed upon for us by Amarchand & Mangaldas & Suresh A. Shroff & Co. and for the underwriters by Khaitan & Co. Latham & Watkins LLP may rely upon Khaitan & Co. with respect to certain matters governed by Indian law and upon Aristodemou Loizides Yiolitis LLC with respect to matters governed by Cyprus law.
166
Table of Contents
Our consolidated statement of financial positions as at April 1, 2009, March 31, 2010, 2011 and 2012, and the related consolidated statements of comprehensive income (loss), changes in equity (deficit) and cash flows for each of the years in the three-year period ended March 31, 2012, have been included herein in reliance upon the report of Grant Thornton India LLP, an independent registered public accounting firm, appearing elsewhere herein, on the authority of such firm as experts in accounting and auditing. The offices of Grant Thornton India LLP are located at L-41, Connaught Circus, New Delhi, 110001.
167
Table of Contents
WHERE YOU CAN FIND MORE INFORMATION
We have filed with the SEC a registration statement on Form F-1, including relevant exhibits and schedules, under the Securities Act with respect to the ordinary shares to be sold in this offering. This prospectus, which constitutes a part of the registration statement, does not contain all of the information contained in the registration statement and the exhibits and schedules in the registration statement. You should read the registration statement and its exhibits and schedules for further information with respect to us and our ordinary shares. Statements contained in this prospectus regarding the contents of any agreement, contract or other document referred to are not necessarily complete and reference is made in each instance to the copy of the contract or document filed as an exhibit to the registration statement.
Upon completion of this offering, we will be subject to the information requirements of the Exchange Act applicable to foreign private issuers, which are different from the requirements applicable to domestic US issuers. As a foreign private issuer, we will be required to file reports, including annual reports on Form 20-F, reports on Form 6-K and other information with the SEC. We intend to submit to the SEC quarterly reports on Form 6-K, which will include unaudited quarterly financial information, for the first three quarters of each fiscal year, in addition to our annual report on Form 20-F, which will include audited annual financial information. As we are a foreign private issuer, our annual report on Form 20-F will be due four months after the end of each fiscal year.
All information filed with the SEC can be inspected and copied at the public reference facilities maintained by the SEC at 100 F Street, N.E., Washington, D.C. 20549. You can request copies of these documents upon payment of a duplicating fee, by writing to the SEC. Please call the SEC at 1-800-SEC-0330 for further information on the operation of the public reference rooms. The SEC maintains a website at www.sec.gov that contains reports, proxy and information statements and other information regarding registrants that make electronic filings through its Electronic Data Gathering, Analysis, and Retrieval, or EDGAR, system. All our Exchange Act reports and other SEC filings will be available through the EDGAR system.
As a foreign private issuer, we are exempt under the Exchange Act from, among other things, the rules prescribing the furnishing and content of proxy statements, and our executive officers, directors and principal shareholders are exempt from the reporting and “short-swing profit” recovery provisions contained in Section 16 of the Exchange Act.
The registration statement on Form F-1, including relevant exhibits and schedules, will be filed with the Registrar of Companies in Nicosia, Cyprus.
168
Table of Contents
INDEX TO CONSOLIDATED FINANCIAL STATEMENTS
| F-2 | ||||
| F-3 | ||||
| F-5 | ||||
| F-6 | ||||
| F-8 | ||||
| F-11 | ||||
F-1
Table of Contents
REPORT OF INDEPENDENT REGISTERED PUBLIC ACCOUNTING FIRM
The Board of Directors and Shareholders
TV18 HSN Holdings Limited
We have audited the accompanying consolidated statements of financial position of TV18 HSN Holdings Limited and its subsidiary (collectively “the Company”) as at April 1, 2009, March 31, 2010, March 31, 2011 and March 31, 2012, and the related consolidated statements of comprehensive income (loss), changes in equity (deficit) and cash flows for each of the three years in the period ended March 31, 2012. These consolidated financial statements are the responsibility of the Company’s management. Our responsibility is to express an opinion on these financial statements based on our audits.
We conducted our audits in accordance with the standards of the Public Company Accounting Oversight Board (United States). Those standards require that we plan and perform the audit to obtain reasonable assurance about whether the financial statements are free of material misstatement. The Company is not required to have, nor were we engaged to perform an audit of its internal control over financial reporting. Our audit included consideration of internal control over financial reporting as a basis for designing audit procedures that are appropriate in the circumstances, but not for the purpose of expressing an opinion on the effectiveness of the Company’s internal control over financial reporting. Accordingly, we express no such opinion. An audit also includes examining, on a test basis, evidence supporting the amounts and disclosures in the financial statements, assessing the accounting principles used and significant estimates made by management, as well as evaluating the overall financial statement presentation. We believe that our audits provide a reasonable basis for our opinion.
In our opinion, the consolidated financial statements referred to above present fairly, in all material respects, the financial position of TV18 HSN Holdings Limited and its subsidiary as at April 1, 2009, March 31, 2010, March 31, 2011 and March 31, 2012, and the results of their operations and their cash flows for each of the three years ended March 31, 2012 in conformity with International Financial Reporting Standards as issued by the International Accounting Standards Board.
Grant Thornton India LLP
New Delhi, India
August 29, 2012
F-2
Table of Contents
TV18 HSN HOLDINGS LIMITED
CONSOLIDATED STATEMENTS OF FINANCIAL POSITION
| Notes | As at April 1, 2009 | As at March 31, 2010 | As at March 31, 2011 | As at March 31, 2012 | ||||||||||||||
| (in US$) | ||||||||||||||||||
ASSETS | ||||||||||||||||||
Non-current assets | ||||||||||||||||||
Goodwill | 5 | — | — | — | 195,465 | |||||||||||||
Other intangible assets | 6 | 81,897 | 67,704 | 182,566 | 234,624 | |||||||||||||
Property, plant and equipment | 7 | 3,425,502 | 3,485,763 | 3,986,803 | 3,130,542 | |||||||||||||
Security deposits | 9.2 | 315,826 | 488,585 | 511,895 | 482,725 | |||||||||||||
Current tax assets | 287,977 | 714,711 | 1,616,124 | 2,162,333 | ||||||||||||||
Other non-current assets | 10 | 202,795 | 120,815 | 174,678 | 289,076 | |||||||||||||
|
|
|
|
|
|
|
| |||||||||||
Total non-current assets | 4,313,997 | 4,877,578 | 6,472,066 | 6,494,765 | ||||||||||||||
|
|
|
|
|
|
|
| |||||||||||
Current assets | ||||||||||||||||||
Trade receivables | 12 | 495,176 | 893,393 | 639,087 | 1,100,339 | |||||||||||||
Bank deposits and short term investments | 9.3 | 1,599,538 | 22,302,159 | 5,900,132 | 680,176 | |||||||||||||
Cash and cash equivalents | 14 | 5,663,742 | 1,317,103 | 1,873,147 | 1,449,065 | |||||||||||||
Other current assets | 13 | 4,172,103 | 5,699,665 | 7,486,589 | 12,071,208 | |||||||||||||
|
|
|
|
|
|
|
| |||||||||||
Total current assets | 11,930,559 | 30,212,320 | 15,898,955 | 15,300,788 | ||||||||||||||
|
|
|
|
|
|
|
| |||||||||||
Total assets | 16,244,556 | 35,089,898 | 22,371,021 | 21,795,553 | ||||||||||||||
|
|
|
|
|
|
|
| |||||||||||
F-3
Table of Contents
TV18 HSN HOLDINGS LIMITED
CONSOLIDATED STATEMENTS OF FINANCIAL POSITION — (Continued)
| Notes | As at April 1, 2009 | As at March 31, 2010 | As at March 31, 2011 | As at March 31, 2012 | ||||||||||||||
| (in US$) | ||||||||||||||||||
EQUITY (DEFICIT) AND LIABILITIES | ||||||||||||||||||
EQUITY (DEFICIT) | ||||||||||||||||||
Share capital | 16.1 | 1,966,360 | 5,390,332 | 5,390,332 | 5,390,332 | |||||||||||||
Share premium | 16.2 | 4,398,000 | 62,601,357 | 62,601,357 | 62,601,357 | |||||||||||||
Convertible warrants | — | — | — | 7,077,930 | ||||||||||||||
Accumulated deficit | (30,376,741 | ) | (45,454,105 | ) | (58,132,255 | ) | (80,674,748 | ) | ||||||||||
Employee share based payment reserve | 1,717,689 | 2,599,180 | 3,954,097 | 4,523,218 | ||||||||||||||
Currency translation reserve | — | 870,166 | 907,541 | (244,523 | ) | |||||||||||||
Advance against share capital | — | — | 825 | 22,230 | ||||||||||||||
|
|
|
|
|
|
|
| |||||||||||
Total equity (deficit) | (22,294,692 | ) | 26,006,930 | 14,721,897 | (1,304,204 | ) | ||||||||||||
|
|
|
|
|
|
|
| |||||||||||
LIABILITIES | ||||||||||||||||||
Non-current liabilities | ||||||||||||||||||
Employee benefits obligations | 17.2 | 11,648 | 33,080 | 62,077 | 108,747 | |||||||||||||
Loans and borrowings | 9.5 | 26,326,703 | 21,638 | 21,727 | — | |||||||||||||
Derivative financial liabilities | 9.4 | 4,340,000 | — | — | — | |||||||||||||
|
|
|
|
|
|
|
| |||||||||||
Total non-current liabilities | 30,678,351 | 54,718 | 83,804 | 108,747 | ||||||||||||||
|
|
|
|
|
|
|
| |||||||||||
Current liabilities | ||||||||||||||||||
Employee benefits obligations | 17.2 | 102,767 | 103,421 | 215,992 | 251,747 | |||||||||||||
Trade payables | 19.1 | 5,688,892 | 4,642,641 | 2,668,984 | 6,264,528 | |||||||||||||
Loans and borrowings | 9.5 | 37,507 | 10,818 | — | 11,313,068 | |||||||||||||
Derivative financial liabilities | 9.4 | — | — | — | 180,000 | |||||||||||||
Bank overdraft | 5,348 | 1,160,080 | 565,635 | 575,736 | ||||||||||||||
Current tax liabilities | — | — | 1,489 | — | ||||||||||||||
Other current liabilities | 19.2 | 2,026,383 | 3,111,290 | 4,113,220 | 4,405,931 | |||||||||||||
|
|
|
|
|
|
|
| |||||||||||
Total current liabilities | 7,860,897 | 9,028,250 | 7,565,320 | 22,991,010 | ||||||||||||||
|
|
|
|
|
|
|
| |||||||||||
Total liabilities | 38,539,248 | 9,082,968 | 7,649,124 | 23,099,757 | ||||||||||||||
|
|
|
|
|
|
|
| |||||||||||
Total equity (deficit) and liabilities | 16,244,556 | 35,089,898 | 22,371,021 | 21,795,553 | ||||||||||||||
|
|
|
|
|
|
|
| |||||||||||
(The accompanying notes are an integral part of these consolidated financial statements)
F-4
Table of Contents
TV18 HSN HOLDINGS LIMITED
CONSOLIDATED STATEMENTS OF COMPREHENSIVE INCOME (LOSS)
| Notes | For the Year Ended March 31, 2010 | For the Year Ended March 31, 2011 | For the Year Ended March 31, 2012 | |||||||||||
| (in US$) | ||||||||||||||
Revenue from operations | 15 | 14,641,660 | 19,193,976 | 24,457,696 | ||||||||||
Employee benefits expense | 17 | (4,331,792 | ) | (6,250,058 | ) | (8,565,265 | ) | |||||||
Freight and collection expenses | (4,625,708 | ) | (6,614,492 | ) | (11,831,176 | ) | ||||||||
Carriage fees | (4,278,553 | ) | (5,254,384 | ) | (6,196,806 | ) | ||||||||
Airtime expenses | (293,165 | ) | (631,075 | ) | (264,773 | ) | ||||||||
Call centre expenses | (1,073,360 | ) | (2,026,997 | ) | (3,378,750 | ) | ||||||||
Advertisement and business promotion expenses | (2,169,498 | ) | (3,854,693 | ) | (7,440,183 | ) | ||||||||
Other operating expenses | 18 | (4,488,310 | ) | (7,357,820 | ) | (8,282,000 | ) | |||||||
Depreciation and amortization | 6 & 7 | (773,550 | ) | (989,612 | ) | (1,249,653 | ) | |||||||
Finance income | 20.1 | 730,217 | 1,159,520 | 1,092,729 | ||||||||||
Finance costs | 20.2 | (8,412,815 | ) | (51,026 | ) | (884,312 | ) | |||||||
|
|
|
|
|
| |||||||||
Loss before tax | (15,074,874 | ) | (12,676,661 | ) | (22,542,493 | ) | ||||||||
|
|
|
|
|
| |||||||||
Income tax expense | 21 | (2,490 | ) | (1,489 | ) | — | ||||||||
|
|
|
|
|
| |||||||||
Loss after tax | (15,077,364 | ) | (12,678,150 | ) | (22,542,493 | ) | ||||||||
|
|
|
|
|
| |||||||||
Other comprehensive income (loss): | ||||||||||||||
Exchange differences on translating foreign operations | 870,166 | 37,375 | (1,152,064 | ) | ||||||||||
|
|
|
|
|
| |||||||||
Total comprehensive loss for the year attributable to the owners of the Company | (14,207,198 | ) | (12,640,775 | ) | (23,694,557 | ) | ||||||||
|
|
|
|
|
| |||||||||
Loss per share (basic and diluted) | 22 | (0.27 | ) | (0.18 | ) | (0.33 | ) | |||||||
(The accompanying notes are an integral part of these consolidated financial statements)
F-5
Table of Contents
TV18 HSN HOLDINGS LIMITED
CONSOLIDATED STATEMENTS OF CASH FLOWS
| Year Ended March 31, 2010 | Year Ended March 31, 2011 | Year Ended March 31, 2012 | ||||||||||
| (in US$) | ||||||||||||
(A) Cash flow from operating activities | ||||||||||||
Loss before tax | (15,074,874 | ) | (12,676,661 | ) | (22,542,493 | ) | ||||||
Adjustments for: | ||||||||||||
Depreciation and amortization | 773,550 | 989,612 | 1,249,653 | |||||||||
Finance costs | 8,412,815 | 51,026 | 884,312 | |||||||||
Employee share based payment expense | 881,491 | 1,354,917 | 569,121 | |||||||||
Finance income | (730,217 | ) | (1,159,520 | ) | (1,092,729 | ) | ||||||
Changes in trade payables and other current liabilities | (881,665 | ) | (909,587 | ) | 4,506,453 | |||||||
Changes in trade receivables | (318,804 | ) | 258,665 | (576,852 | ) | |||||||
Changes in security deposits and other current assets | (919,601 | ) | (1,692,649 | ) | (5,194,302 | ) | ||||||
|
|
|
|
|
| |||||||
Cash used in operations | (7,857,305 | ) | (13,784,197 | ) | (22,196,837 | ) | ||||||
Net proceeds from the sale of short term investments | 1,088,408 | 830,117 | — | |||||||||
Taxes paid | (374,177 | ) | (861,716 | ) | (800,938 | ) | ||||||
|
|
|
|
|
| |||||||
Net cash used in operating activities | (7,143,074 | ) | (13,815,796 | ) | (22,997,775 | ) | ||||||
|
|
|
|
|
| |||||||
(B) Cash flow from investing activities | ||||||||||||
Purchase of property, plant and equipment and intangible assets | (388,894 | ) | (1,555,446 | ) | (958,704 | ) | ||||||
Consideration for business combination | — | — | (207,813 | ) | ||||||||
Proceeds from sale of property, plant and equipment | 1,278 | 238 | — | |||||||||
Interest received | 65,637 | 1,442,315 | 372,982 | |||||||||
Investment in bank deposits | (20,007,390 | ) | — | — | ||||||||
Proceeds from maturity of bank deposits | — | 15,133,801 | 4,651,912 | |||||||||
|
|
|
|
|
| |||||||
Net cash (used in)/from investing activities | (20,329,369 | ) | 15,020,908 | 3,858,377 | ||||||||
|
|
|
|
|
| |||||||
F-6
Table of Contents
TV18 HSN HOLDINGS LIMITED
CONSOLIDATED STATEMENTS OF CASH FLOWS — (Continued)
| Year Ended March 31, 2010 | Year Ended March 31, 2011 | Year Ended March 31, 2012 | ||||||||||
| (in US$) | ||||||||||||
(C ) Cash flows from financing activities | ||||||||||||
Proceeds from issue of equity shares | 25,891,357 | — | — | |||||||||
Proceeds from borrowings | — | — | 10,733,583 | |||||||||
Advance against share capital received | — | 825 | 21,405 | |||||||||
Repayment of borrowings | (3,176,666 | ) | (10,856 | ) | (11,219 | ) | ||||||
Interest paid on borrowings | (397,088 | ) | (51,026 | ) | (221,287 | ) | ||||||
Issue of convertible warrant classified as equity | — | — | 7,077,930 | |||||||||
Issue of convertible warrant classified as liability | — | — | 777,637 | |||||||||
|
|
|
|
|
| |||||||
Net cash from/(used in) financing activities | 22,317,603 | (61,057 | ) | 18,378,049 | ||||||||
|
|
|
|
|
| |||||||
Net change in cash and cash equivalents | (5,154,840 | ) | 1,144,055 | (761,349 | ) | |||||||
Cash and cash equivalents at the beginning of the year (net of bank overdraft) | 5,658,394 | 157,023 | 1,307,512 | |||||||||
Effect of exchange differences on cash and cash equivalents | (346,531 | ) | 6,434 | 327,166 | ||||||||
|
|
|
|
|
| |||||||
Cash and cash equivalents at the end of the year (net of bank overdraft) | 157,023 | 1,307,512 | 873,329 | |||||||||
|
|
|
|
|
| |||||||
Note:
Non-cash transaction: During the year ended March 31, 2010, pursuant to the shareholders’ agreement entered into between the shareholders of the Company i.e. Network18 Holdings Limited, Mauritius, SAIF II Mauritius Company Limited and GS Home Shopping Inc. (‘GSHS’), GSHS was issued Class G Preference Shares convertible into ordinary shares in the ratio of 1:1. Further, in accordance with the aforementioned shareholders’ agreement, the conversion ratio of Class B preference shares into Class A preference shares (whose conversion ratio into ordinary shares of the Company is fixed at 1:1 — Refer Note 16.1) and ordinary shares was fixed and accordingly an amount of US$ 35,735,972 was reclassified to equity from derivative liability (US$ 9,120,000) and financial liability at amortized cost (US$ 26,615,972).
(The accompanying notes are an integral part of these consolidated financial statements)
F-7
Table of Contents
TV18 HSN HOLDINGS LIMITED
CONSOLIDATED STATEMENT OF CHANGES IN EQUITY (DEFICIT)
| Share Capital | Share Premium | Convertible Warrants(1) | Accumulated Deficit | Employee Share Based Payment Reserve | Currency Translation Reserve | Advance Against Share Capital | Total Attributable to Owners of Parent | |||||||||||||||||||||||||
| (in US$) | ||||||||||||||||||||||||||||||||
Balance as at April 1, 2009 | 1,966,360 | 4,398,000 | — | (30,376,741 | ) | 1,717,689 | — | — | (22,294,692 | ) | ||||||||||||||||||||||
Share based payment expense | — | — | — | — | 881,491 | — | — | 881,491 | ||||||||||||||||||||||||
Reclassification to equity on account of fixing of conversion ratio of Class B preference shares into Class A preference shares and ordinary shares (Refer Note 16.1) | 2,625,000 | 33,110,972 | — | — | — | — | — | 35,735,972 | ||||||||||||||||||||||||
Issue of share capital | 798,972 | 25,092,385 | — | — | — | — | — | 25,891,357 | ||||||||||||||||||||||||
|
|
|
|
|
|
|
|
|
|
|
|
|
|
|
| |||||||||||||||||
Transactions with owners | 3,423,972 | 58,203,357 | — | — | 881,491 | — | — | 62,508,820 | ||||||||||||||||||||||||
Loss for the year | — | — | — | (15,077,364 | ) | — | — | — | (15,077,364 | ) | ||||||||||||||||||||||
Other comprehensive income: | ||||||||||||||||||||||||||||||||
Exchange differences on translating foreign operation | — | — | — | — | — | 870,166 | — | 870,166 | ||||||||||||||||||||||||
|
|
|
|
|
|
|
|
|
|
|
|
|
|
|
| |||||||||||||||||
Total comprehensive loss for the year | — | — | — | (15,077,364 | ) | — | 870,166 | — | (14,207,198 | ) | ||||||||||||||||||||||
|
|
|
|
|
|
|
|
|
|
|
|
|
|
|
| |||||||||||||||||
Balance as at March 31, 2010 | 5,390,332 | 62,601,357 | — | (45,454,105 | ) | 2,599,180 | 870,166 | — | 26,006,930 | |||||||||||||||||||||||
|
|
|
|
|
|
|
|
|
|
|
|
|
|
|
| |||||||||||||||||
F-8
Table of Contents
TV18 HSN HOLDINGS LIMITED
CONSOLIDATED STATEMENT OF CHANGES IN EQUITY (DEFICIT) — (Continued)
| Share Capital | Share Premium | Convertible Warrants(1) | Accumulated Deficit | Employee Share Based Payment Reserve | Currency Translation Reserve | Advance Against Share Capital | Total Attributable to Owners of Parent | |||||||||||||||||||||||||
| (in US$) | ||||||||||||||||||||||||||||||||
Balance as at April 1, 2010 | 5,390,332 | 62,601,357 | — | (45,454,105 | ) | 2,599,180 | 870,166 | — | 26,006,930 | |||||||||||||||||||||||
Exercise price for share options exercised | — | — | — | — | — | — | 825 | 825 | ||||||||||||||||||||||||
Share based payment expense | — | — | — | — | 1,354,917 | — | — | 1,354,917 | ||||||||||||||||||||||||
|
|
|
|
|
|
|
|
|
|
|
|
|
|
|
| |||||||||||||||||
Transactions with owners | — | — | — | — | 1,354,917 | — | 825 | 1,355,742 | ||||||||||||||||||||||||
Loss for the year | — | — | — | (12,678,150 | ) | — | — | — | (12,678,150 | ) | ||||||||||||||||||||||
Other comprehensive income: | ||||||||||||||||||||||||||||||||
Exchange differences on translating foreign operation | — | — | — | — | — | 37,375 | — | 37,375 | ||||||||||||||||||||||||
|
|
|
|
|
|
|
|
|
|
|
|
|
|
|
| |||||||||||||||||
Total comprehensive loss for the year | — | — | — | (12,678,150 | ) | — | 37,375 | — | (12,640,775 | ) | ||||||||||||||||||||||
|
|
|
|
|
|
|
|
|
|
|
|
|
|
|
| |||||||||||||||||
Balance as at March 31, 2011 | 5,390,332 | 62,601,357 | — | (58,132,255 | ) | 3,954,097 | 907,541 | 825 | 14,721,897 | |||||||||||||||||||||||
|
|
|
|
|
|
|
|
|
|
|
|
|
|
|
| |||||||||||||||||
F-9
Table of Contents
TV18 HSN HOLDINGS LIMITED
CONSOLIDATED STATEMENT OF CHANGES IN EQUITY (DEFICIT) — (Continued)
| Share Capital | Share Premium | Convertible Warrants(1) | Accumulated Deficit | Employee Share Based Payment Reserve | Currency Translation Reserve | Advance Against Share Capital | Total Attributable to Owners of Parent | |||||||||||||||||||||||||
| (in US$) | ||||||||||||||||||||||||||||||||
Balance as at April 1, 2011 | 5,390,332 | 62,601,357 | — | (58,132,255 | ) | 3,954,097 | 907,541 | 825 | 14,721,897 | |||||||||||||||||||||||
Issue of convertible instruments (net of subscription amount receivable) | — | — | 7,077,930 | — | — | — | — | 7,077,930 | ||||||||||||||||||||||||
Share based payment expense | — | — | — | — | 569,121 | — | — | 569,121 | ||||||||||||||||||||||||
Exercise price for share options exercised | — | — | — | — | — | — | 21,405 | 21,405 | ||||||||||||||||||||||||
|
|
|
|
|
|
|
|
|
|
|
|
|
|
|
| |||||||||||||||||
Transactions with owners | — | — | 7,077,930 | — | 569,121 | — | 21,405 | 7,668,456 | ||||||||||||||||||||||||
Loss for the year | — | — | — | (22,542,493 | ) | — | — | — | (22,542,493 | ) | ||||||||||||||||||||||
Other comprehensive income: | ||||||||||||||||||||||||||||||||
Exchange differences on translating foreign operation | — | — | — | — | — | (1,152,064 | ) | — | (1,152,064 | ) | ||||||||||||||||||||||
|
|
|
|
|
|
|
|
|
|
|
|
|
|
|
| |||||||||||||||||
Total comprehensive loss for the year | — | — | — | (22,542,493 | ) | — | (1,152,064 | ) | — | (23,694,557 | ) | |||||||||||||||||||||
|
|
|
|
|
|
|
|
|
|
|
|
|
|
|
| |||||||||||||||||
Balance as at March 31, 2012 | 5,390,332 | 62,601,357 | 7,077,930 | (80,674,748 | ) | 4,523,218 | (244,523 | ) | 22,230 | (1,304,204 | ) | |||||||||||||||||||||
|
|
|
|
|
|
|
|
|
|
|
|
|
|
|
| |||||||||||||||||
| (1) | During the year ended March 31, 2012, the Company issued 793,000, 475,000 and 232,000 warrants to its shareholders — Network 18 Holdings Limited, SAIF II Mauritius Company Limited and GS Home Shopping Inc. respectively. The warrants are convertible into Class A preference shares in the ratio of 1:1 (also refer Note 26c). |
(The accompanying notes are an integral part of these consolidated financial statements)
F-10
Table of Contents
TV18 HSN HOLDINGS LIMITED
NOTES TO THE CONSOLIDATED FINANCIAL STATEMENTS
1 Nature of operations
TV18 HSN Holdings Limited (“the Company”) was incorporated in Cyprus on April 29, 2006 under the Cyprus Companies Law, Cap 113.
TV18 HSN Holdings Limited through its subsidiary, TV18 Home Shopping Network Limited (hereinafter collectively referred to as “the Group”), is primarily engaged in providing the platform to vendors for the distribution of consumer goods through the television channel owned by TV 18 Home Shopping Network Limited, its website and call centers.
2 General information and statement of compliance with IFRS
The Company is a ‘Company limited by shares’ incorporated and domiciled in Cyprus. The address of the Company’s registered office and principal place of business is 10, Diomidous Street, Alphamega Akropolis Building, 3rd Floor, Office 401, 2024 Nicosia, Cyprus.
The consolidated financial statements of the Group have been prepared in accordance with International Financial Reporting Standards (“IFRS”) as issued by the International Accounting Standards Board (“IASB”).
These are the Group’s first consolidated financial statements prepared in accordance with IFRS. The date of transition to IFRS is April 1, 2009.
3 Summary of significant accounting policies
3.1 Overall considerations and first-time adoption of IFRS
The consolidated financial statements have been prepared using accounting policies specified by those IFRSs that are in effect at March 31, 2012.
The significant accounting policies that have been applied in the preparation of these consolidated financial statements are summarized below. These accounting policies have been applied in preparing the consolidated financial statements for the years ended March 31, 2010, March 31, 2011 and March 31, 2012 and the opening consolidated statement of financial position at the date of transition (except for certain exemptions available/exceptions to retrospective application upon transition to IFRS), hereinafter referred to as “the financial statements” or “these financial statements.” The resulting differences between the IFRS carrying amounts and the carrying amounts of the assets and liabilities in the financial statements of the entities within the Group as at April 1, 2009 prepared as per the respective previous generally accepted accounting principles (“GAAP”), are recognized directly in equity (deficit) at the date of transition to IFRS.
The Group has applied IFRS 1First-time Adoption of International Financial Reporting Standards(Revised 2008) in preparing these financial statements. As the holding company, TV18 HSN Holdings Limited, Cyprus was not required under its local laws to prepare and issue consolidated financial statements as per its previous GAAP, these financial statements do not include reconciliations from a previous GAAP to IFRS.
F-11
Table of Contents
TV18 HSN HOLDINGS LIMITED
NOTES TO THE CONSOLIDATED FINANCIAL STATEMENTS — (Continued)
IFRS 1 provides mandatory and optional exemptions of which the Group has applied the following, on transition to IFRS in these financial statements:
Retirement benefit obligations
The Group has applied the exemption under IFRS 1 relating to the disclosure of the present value of defined benefit obligations for the current and previous four annual periods. In accordance with the exemption such disclosure has been made only for the accounting periods prospectively from the date of transition to IFRS, i.e. April 1, 2009.
Currency translation reserve
The Group has deemed the foreign currency translation differences at the date of transition to be zero. After the date of transition, translation differences arising on translation of foreign operation are recognized in consolidated Statement of Comprehensive Income (Loss) and included in a separate ‘currency translation reserve’ within equity.
Estimates
The Group has used estimates under IFRS that are consistent with those applied under previous GAAP (with adjustment for accounting policy differences).
An overview of standards, amendments and interpretations to IFRSs issued but not yet effective, and which have not been adopted early by the Group are presented in note 3.23.
3.2 Presentation of financial statements
The financial statements are presented in accordance with IAS 1Presentation of Financial Statements(Revised 2007). The Group has elected to present all items of income and expenses recognized in the year in a single ‘Statement of Comprehensive Income (Loss).’
The Group has presented four statements of financial position in its first IFRS financial statements.
3.3 Basis of consolidation
The Group’s consolidated financial statements include financial statements of TV18 HSN Holding Limited, the parent company and of its subsidiary TV18 Home Shopping Network Limited (“its Subsidiary” or “the Subsidiary”) as at April 1, 2009 and for the years ended March 31, 2010, March 31, 2011 and March 31, 2012.
All transactions and balances between the Company and its subsidiary are eliminated on consolidation including unrealized gains and losses on transactions between entities within the Group. Amounts reported in the financial statements of subsidiary have been adjusted where necessary to ensure consistency with the accounting policies adopted by the Group.
3.4 Business combinations
Business combinations are accounted for using the acquisition method under the revised IFRS 3 Business Combinations (IFRS 3R). The consideration transferred by the Group to obtain control of a business is calculated
F-12
Table of Contents
TV18 HSN HOLDINGS LIMITED
NOTES TO THE CONSOLIDATED FINANCIAL STATEMENTS — (Continued)
as the sum of the acquisition-date fair values of assets transferred, liabilities incurred and the equity interests issued by the Group, which includes the fair value of any asset or liability arising from a contingent consideration arrangement. Acquisition costs are expensed as incurred.
The Group recognizes identifiable assets acquired and liabilities assumed, including contingent liabilities, in a business combination regardless of whether they have been previously recognized in the acquiree’s financial statements prior to the acquisition. Assets acquired and liabilities assumed are generally measured at their acquisition-date fair values.
Goodwill is stated after separate recognition of identifiable intangible assets. It is calculated as the excess of the sum of a) fair value of consideration transferred, b) the recognized amount of any non-controlling interest in the acquiree and c) acquisition-date fair value of any existing equity interest in the acquiree, over the acquisition-date fair values of identifiable net assets. Goodwill represents the future economic benefits arising from a business combination that are not individually identified and separately recognized. Goodwill is carried at cost less accumulated impairment losses.
If the fair values of identifiable net assets exceed the sum calculated above, the excess amount i.e (gain on a bargain purchase) is recognized in profit or loss immediately.
3.5 Foreign currency translation
Functional and presentation currency
The financial statements are presented in US Dollar (“US$”) which is also the functional currency of the parent company. The functional currency of the Company has been determined as US$ since majority of the funding of the Company is denominated in US$. The functional currency of the Subsidiary is Indian Rupees (“INR”).
Foreign currency transactions and balances
Foreign currency transactions are initially recorded in the functional currency of the applicable company using the spot exchange rates prevailing on the dates of the transactions. Foreign exchange gains and losses resulting from the settlement of such transactions and from the remeasurement of monetary items at year-end exchange rates are recognized in the profit or loss of the period in which they arise.
Non-monetary items measured at historical cost are translated using the exchange rates at the date of the transaction. Non-monetary items measured at fair value are translated using the exchange rates at the date when fair value was determined.
Foreign operations
In the Group’s financial statements, all assets, liabilities and transactions of the Subsidiary are translated into US$ upon consolidation. The functional currency of the Subsidiary of the Group was Indian Rupees and has remained unchanged during the reporting period.
Assets and liabilities have been translated into US$ at the closing rate at the applicable statement of financial position date. Income and expenses have been translated into US$ the average rate prevailing over of the year. Exchange differences are charged/credited to other comprehensive income and recognized in the currency translation reserve in equity.
F-13
Table of Contents
TV18 HSN HOLDINGS LIMITED
NOTES TO THE CONSOLIDATED FINANCIAL STATEMENTS — (Continued)
3.6 Segment reporting
IFRS 8 “Operating Segments” requires the segment information presented in the financial statements to be that which is used internally by the chief operating decision maker to evaluate the performance of the business and decide how to allocate resources.
The Group has two channels of promoting the sales of its vendors i.e. web site (www.homeshop18.com) and television channel. The Group has identified following two operating segments:
Television (“TV”) Business — is on account of the commission income generated from the vendors based on sales through the broadcast of the television channel Home Shop 18.
Internet business — is on account of the commission income generated from the vendors based on sales through the Subsidiary’s websitewww.homeshop18.com.
Management monitors the operating results of the aforementioned segments separately for the purpose of making decisions about resource allocation and performance assessment. Segment performance is evaluated based on earnings before interest, tax, depreciation and amortization. The Group’s chief operating decision maker is not provided information on segment assets and liabilities and accordingly this information has not been disclosed in the footnote on segment reporting.
Segment information is presented in accordance with IFRS 8 for years ended March 31, 2011 and March 31, 2012 since the Internet business was commenced in the year ended March 31, 2011 only. There was no effect on the recognition and measurement of financial statement items upon transition to IFRS.
3.7 Revenue
Revenue primarily comprises agency commission earned and reimbursement of freight and collection expenses from vendors.
Revenue is measured by reference to the fair value of consideration received or receivable by the Group for services provided.
Revenue is recognized when the amount of revenue can be measured reliably, collection is probable, the costs incurred or to be incurred can be measured reliably, and when the criteria of recognition have been met.
Agency commission revenue and reimbursement of freight and collection expenses is recognized at the time of delivery of products by the courier companies to customers in accordance with contracted terms with the vendors.
3.8 Operating and other expenses
Operating and other expenses are recognized in Statement of Comprehensive Income (Loss) upon utilization of the service.
3.9 Intangible assets
Intangible assets include acquired software used in production / administration. These are accounted for using the cost model whereby capitalized costs are amortized on a straight-line basis over their estimated useful
F-14
Table of Contents
TV18 HSN HOLDINGS LIMITED
NOTES TO THE CONSOLIDATED FINANCIAL STATEMENTS — (Continued)
lives, as these assets are considered to have a finite life. Residual values and useful lives are reviewed at each reporting date. In addition, they are subject to impairment testing as further discussed in note 3.12. The useful life of intangibles has been estimated to be 5 years.
Acquired computer software licenses are capitalized on the basis of the costs incurred to acquire and install the specific software. Costs associated with maintaining computer software, i.e. expenditure relating to patches and other minor updates as well as their installation, is expensed as incurred.
All amortization and impairment charges (or reversals if any) are included within ‘Depreciation and amortization.’
3.10 Property, plant and equipment
Leasehold improvements, IT and office equipment, plant and machinery and electrical installations, furniture and fixtures and vehicles are stated at cost of acquisition less accumulated depreciation and accumulated impairment provisions, if any.
Depreciation is recognized on a straight-line basis based on useful life to write down the cost less estimated residual value of property, plant and equipment. The periods generally applicable are:
Asset Description | Useful Life | |||
IT and office equipment | 3-7 years | |||
Plant and machinery and electrical installations | 2-8 years | |||
Furniture and fixtures | 7-10 years | |||
Vehicles | 7 years | |||
Leasehold improvements are amortized over the expected useful lives of the underlying assets (determined by reference to comparable owned assets) or over the term of the lease, whichever is shorter.
Material residual value estimates and estimates of useful life are updated as required, but at least annually, whether or not the asset is revalued.
Gains or losses arising on the disposal of property, plant and equipment are determined as the difference between the disposal proceeds and the carrying amount of the assets and are recognized in the Statement of Comprehensive Income (Loss).
3.11 Operating leases
Leases other than those which transfer substantially all the risks and benefits incidental to ownership of the leased item are treated as operating leases. Operating lease payments are recognized as an expense in the Statement of Comprehensive Income (Loss) on a straight line basis over the lease term.
3.12 Impairment testing of goodwill, intangible assets and property, plant and equipment
For the purposes of assessing impairment, assets are grouped at the lowest levels for which there are largely independent cash inflows (cash-generating units). As a result, some assets are tested individually for impairment and some are tested at cash-generating unit level. Goodwill is allocated to those cash-generating units that are
F-15
Table of Contents
TV18 HSN HOLDINGS LIMITED
NOTES TO THE CONSOLIDATED FINANCIAL STATEMENTS — (Continued)
expected to benefit from synergies of the related business combination and represent the lowest level within the Group at which management monitors goodwill.
Cash-generating units to which goodwill has been allocated are tested for impairment at least annually. Individual assets or cash-generating units are tested for impairment whenever events or changes in circumstances indicate that the carrying amount may not be recoverable.
An impairment loss is recognized for the amount by which the asset’s or cash-generating unit’s carrying amount exceeds its recoverable amount, which is the higher of fair value less costs to sell and value-in-use. To determine the value-in-use, management estimates expected future cash flows from each cash-generating unit and determines a suitable interest rate in order to calculate the present value of those cash flows. The data used for impairment testing procedures are directly linked to the latest approved budget, adjusted as necessary to exclude the effects of future reorganizations and asset enhancements. Discount factors are determined individually for each cash-generating unit and reflect their respective risk profiles as assessed by management.
Impairment losses for cash-generating units reduce first the carrying amount of any goodwill allocated to that cash-generating unit. Any remaining impairment loss is charged pro rata to the assets in the cash-generating unit. With the exception of goodwill all assets are subsequently reassessed for indications that an impairment loss previously recognized may no longer exist. An impairment charge is reversed, if the cash-generating unit’s recoverable amount exceeds its carrying amount.
3.13 Financial instruments
Financial assets and financial liabilities are recognized when the Group becomes a party to the contractual provisions of a financial instrument.
Financial assets are derecognized when the contractual rights to the cash flows from the financial asset expire, or when the financial asset and all related substantial risks and rewards are transferred.
A financial liability is derecognized when it is extinguished, discharged, cancelled or expires.
Financial assets and financial liabilities are measured initially at fair value plus transactions costs, except for financial assets and financial liabilities carried at fair value through profit or loss, which are measured initially at fair value.
Financial assets and financial liabilities are measured subsequently as described below.
Financial assets
For the purpose of subsequent measurement, financial assets are classified into the following categories upon initial recognition:
| • | Loans and receivables |
| • | Financial assets at fair value through profit or loss (“FVTPL”) |
| • | Held-to-maturity investments (“HTM”) |
| • | Available-for-sale financial assets (“AFS”). |
F-16
Table of Contents
TV18 HSN HOLDINGS LIMITED
NOTES TO THE CONSOLIDATED FINANCIAL STATEMENTS — (Continued)
The category determines subsequent measurement and whether any resulting income and expense is recognized in profit or loss or in other comprehensive income.
All financial assets except for those at fair value through profit or loss are subject to review for impairment at least at each reporting date. Financial assets are impaired when there is any objective evidence that a financial asset or a group of financial assets is impaired. Different criteria to determine impairment are applied for each category of financial assets, which are described below.
All income and expenses relating to financial assets that are recognized in profit or loss are presented within ‘finance costs’ or ‘finance income,’ except for impairment of trade receivables which is presented within ‘other operating expenses.’
Loans and receivables
Loans and receivables are non-derivative financial assets with fixed or determinable payments that are not quoted in an active market. After initial recognition these are measured at amortized cost using the effective interest method, less provision for impairment. Discounting is omitted where the effect of discounting is immaterial. The Group’s cash and cash equivalents, trade and most other receivables fall into this category of financial instruments.
Individually significant receivables are considered for impairment when they are past due or when there is other objective evidence that a specific counterparty will default. Impairment of loans and receivables are recognized in the consolidated Statement of Comprehensive Income (Loss) within “other operating expenses”
Financial assets at fair value through profit or loss
Financial assets at fair value through profit or loss include financial assets that are either classified as held for trading or that meet certain conditions and are designated at fair value through profit or loss upon initial recognition. All derivative financial instruments fall into this category, except for those designated and effective as hedging instruments, for which the hedge accounting requirements apply.
Assets in this category are measured at fair value with gains or losses recognized in profit or loss. The fair values of derivative financial instruments are determined by reference to active market transactions or using a valuation technique where no active market exists.
Held-to-maturity investments
Held-to-maturity investments are non-derivative financial assets with fixed or determinable payments and fixed maturity other than loans and receivables. Investments are classified as held-to-maturity if the Group has the intention and ability to hold them until maturity.
Held-to-maturity investments are measured subsequently at amortized cost using the effective interest method. If there is objective evidence that the investment is impaired, the financial asset is measured at the present value of estimated future cash flows. Any changes to the carrying amount of the investment, including impairment losses, are recognized in profit or loss.
F-17
Table of Contents
TV18 HSN HOLDINGS LIMITED
NOTES TO THE CONSOLIDATED FINANCIAL STATEMENTS — (Continued)
Available-for-sale financial assets
Available-for-sale financial assets are non-derivative financial assets that are either designated to this category or do not qualify for inclusion in any of the other categories of financial assets.
Available-for-sale financial assets are measured at fair value. Gains and losses are recognized in Statement of Comprehensive Income (Loss) and reported within the available-for-sale reserve within equity, except for impairment losses and foreign exchange differences on monetary assets, which are recognized in profit or loss. When the asset is disposed of or is determined to be impaired, the cumulative gain or loss recognized in other comprehensive income is reclassified from the equity reserve to profit or loss and presented as a reclassification adjustment within the Statement of Comprehensive Income (Loss). Interest calculated using the effective interest method and dividends are recognized in profit or loss within ‘finance income.’
Financial liabilities
The Group’s financial liabilities include borrowings, trade and other payables and derivative financial instruments.
Financial liabilities are measured subsequently at amortized cost using the effective interest method except for financial liabilities held for trading or designated at fair value through profit or loss, that are carried subsequently at fair value with gains or losses recognized in profit or loss. All derivative financial instruments that are not designated and effective as hedging instruments are accounted for at fair value through profit or loss.
All interest-related charges are included within ‘finance costs.’
Derivative financial instruments
A specific accounting treatment is required for derivatives designated as hedging instruments in cash flow hedge relationships. To qualify for hedge accounting, the hedging relationship must meet several strict conditions with respect to documentation, probability of occurrence of the hedged transaction and hedge effectiveness. All other derivative financial instruments are accounted for at fair value through profit or loss. The Group has not designated any financial instruments as hedging instruments.
Derivative financial instruments are carried at fair value determined in accordance with a valuation technique with differences in transaction price and fair value so determined recognized in profit or loss.
3.14 Income taxes
Tax expense comprises the sum of deferred tax and current tax.
Current income tax assets and/or liabilities comprise those obligations to, or claims from, revenue authorities relating to the current or prior reporting periods, that are unpaid at the reporting date. Current tax is payable on taxable profit, which differs from profit or loss in the financial statements. Calculation of current tax is based on tax rates and tax laws that have been enacted or substantively enacted by the end of the reporting period.
Deferred income taxes are calculated using the liability method on temporary differences between the carrying amounts of assets and liabilities and their tax bases. However, deferred tax is not provided on the initial recognition of an asset or liability unless the related transaction is a business combination or affects tax or
F-18
Table of Contents
TV18 HSN HOLDINGS LIMITED
NOTES TO THE CONSOLIDATED FINANCIAL STATEMENTS — (Continued)
accounting profit. Deferred tax on temporary differences associated with investments in subsidiary is not provided if reversal of these temporary differences can be controlled by the Group and it is probable that reversal will not occur in the foreseeable future.
Deferred tax assets and liabilities are calculated, without discounting, at tax rates that are expected to apply to their respective period of realization, provided they are enacted or substantively enacted by the end of the reporting period.
Deferred tax assets are recognized to the extent that it is probable that they will be able to be utilized against future taxable income based on the Group’s forecast of future operating results which are adjusted for significant non-taxable income and expenses and specific limits to the use of any unused tax loss or credit. Deferred tax liabilities are always provided for in full.
Deferred tax assets and liabilities are offset only when the Group has a right and intention to set off current tax assets and liabilities from the same taxation authority.
Changes in deferred tax assets or liabilities are recognized as a component of tax income or expense in profit or loss, except where they relate to items that are recognized in other comprehensive income or directly in equity, in which case the related deferred tax is also recognized in other comprehensive income or equity, respectively.
3.15 Cash and cash equivalents
Cash and cash equivalents comprise cash on hand, in current accounts and deposits accounts that are readily convertible into known amounts of cash and which are subject to an insignificant risk of changes in value.
3.16 Equity, reserves and dividend payments
Share capital represents the nominal value of shares that have been issued.
Additional paid-in-capital includes any premiums received on issue of share capital and other contribution of shareholders of the Group. Any transaction costs associated with the issuing of shares are deducted from additional paid-in-capital, net of any related income tax benefits.
Foreign currency translation differences arising on the translation of the Subsidiary are included in the currency translation reserve (Refer note 3.5).
Retained earnings include current and prior period retained profits.
All transactions with owners of the parent are recorded separately within equity.
3.17 Post-employment benefits and short-term employee benefits
Post-employment benefits
The Group provides post-employment benefits through defined contribution and defined benefit plans.
A defined contribution plan is a plan under which the Group pays fixed contributions into an independent fund administered by the government. The Group has no legal or constructive obligations to pay further
F-19
Table of Contents
TV18 HSN HOLDINGS LIMITED
NOTES TO THE CONSOLIDATED FINANCIAL STATEMENTS — (Continued)
contributions after its payment of the fixed contribution. The contributions recognized in respect of defined contribution plans are expensed in the period that relevant employee services are rendered.
Plans that do not meet the definition of a defined contribution plan are defined benefit plans. The defined benefit plan sponsored by the Group defines the amount of benefit that an employee will receive on retirement by reference to length of service and final salary.
The liability recognized in the statement of financial position for the defined benefit plans is the present value of the defined benefit obligation (“DBO”) at the reporting date, together with adjustments for unrecognized actuarial gains or losses and past service costs.
Management estimates the DBO annually with the assistance of independent actuaries. The estimate of its post-retirement benefit obligations is based on standard rates of inflation, medical cost trends and mortality. It also takes into account the Group’s specific anticipation of future salary increases. Discount factors are determined close to each year-end by reference to government bonds that have terms to maturity approximating the terms of the related liability. Any actuarial gains or losses are recognized in the statement of other comprehensive income in the period in which they arise.
Interest expenses related to DBO are included in “finance costs” in profit or loss and all other post-employment benefit expenses are included in employee benefits expense.
Short-term employee benefits
Short term employee benefits such as salaries, bonus, paid annual leave and sick leave are accrued in the year in which the associated services are rendered by employees of the Group.
The liability in respect of compensated absence becomes due or is expected to be availed with one year from the reporting date and is accordingly considered as short term employee benefits and included in ‘employee benefits obligations’ measured at the undiscounted amount that the Group expects to pay as a result of the unused entitlement.
3.18 Share-based employee remuneration
The Group operates equity-settled share-based remuneration plans for its employees. None of the Group’s currently effective plans feature any options for a cash settlement.
Employee services received in exchange for the grant of any share-based payment are measured at their fair values. Where employees are rewarded using share-based payments, the fair values of employees services are determined indirectly by reference to the fair value of the equity instruments granted. This fair value is measured at the grant date.
Share-based remuneration is ultimately recognized as an expense in profit or loss with a corresponding credit to ‘Employee share based payment reserve’ within equity.
If vesting periods or other vesting conditions apply, the expense is allocated over the vesting period, based on the best available estimate of the number of share options expected to vest. Non-market vesting conditions are included in assumptions about the number of options that are expected to become exercisable. Estimates are subsequently revised, if there is any indication that the number of share options expected to vest differs from
F-20
Table of Contents
TV18 HSN HOLDINGS LIMITED
NOTES TO THE CONSOLIDATED FINANCIAL STATEMENTS — (Continued)
previous estimates. Any cumulative adjustment prior to vesting is recognized in the current period. No adjustment is made to any expense recognized in prior periods if share options ultimately exercised are different to that estimated on vesting.
Upon exercise of share options, the proceeds received net of any directly attributable transaction costs up to the nominal value of the shares issued are allocated to share capital with any excess being recorded as additional paid-in-capital.
3.19 Provisions, contingent liabilities and contingent assets
Provisions are recognized when present obligations as a result of a past event will probably lead to an outflow of economic resources from the Group and amounts can be estimated reliably. Timing or amount of the outflow may still be uncertain. A present obligation arises from the presence of a legal or constructive commitment that has resulted from past events, for example, legal disputes or onerous contracts. Provisions are not recognized for future operating losses.
Provisions are measured at the estimated expenditure required to settle the present obligation, based on the most reliable evidence available at the reporting date, including the risks and uncertainties associated with the present obligation. Provisions are discounted to their present values, where the time value of money is material.
Any reimbursement that the Group can be virtually certain to collect from a third party with respect to the obligation is recognized as a separate asset. However, this asset may not exceed the amount of the related provision.
All provisions are reviewed at each reporting date and adjusted to reflect the current best estimate.
In those cases where the possible outflow of economic resources as a result of present obligations is considered improbable or remote, no liability is recognized.
3.20 Earnings (loss) per share
Basic earnings or loss per share represents the profit or loss for the year, divided by the weighted average number of shares entitled to distribution of profits outstanding during the period.
Diluted earnings or loss per share is determined by adjusting the profit or loss attributable to shareholders entitled to distribution of profits and the weighted average number of shares outstanding for the effects of all potential dilutive shares which comprise share options granted to employees and convertible instruments issued to shareholders.
3.21 Significant management judgment in applying accounting policies
The following are significant management judgments in applying the accounting policies of the Group that have the most significant effect on the financial statements. Key estimation uncertainties are described in note 3.22.
F-21
Table of Contents
TV18 HSN HOLDINGS LIMITED
NOTES TO THE CONSOLIDATED FINANCIAL STATEMENTS — (Continued)
Taxation
The assessment of the probability of future taxable income in which deferred tax assets can be utilized is based on the Group’s latest approved budget forecast, which is adjusted for significant non-taxable income and expenses and specific limits to the use of any unused tax loss or credit. If a positive forecast of taxable income indicates the probable use of a deferred tax asset, especially when it can be utilized without a time limit, that deferred tax asset is usually recognized in full.
Determination of functional currency of entities within the Group
The functional currency of the holding company is determined to be the currency in which funds from financing activities are generated and dividend to shareholders shall be distributed. The functional currency of the subsidiary company is determined to be the currency of the primary economic environment in which it operates.
3.22 Estimation uncertainty
When preparing the financial statements management undertakes a number of judgments, estimates and assumptions about recognition and measurement of assets, liabilities, income and expenses.
The actual results are likely to differ from the judgments, estimates and assumptions made by management, and will seldom equal the estimated results.
Information about significant judgments, estimates and assumptions that have the most significant effect on recognition and measurement of assets, liabilities, income and expenses are discussed below.
Share-based employee remuneration (note 17.1)
The share options granted by the Group to its employees have been valued indirectly with respect to the fair values of the equity instruments granted, using valuation techniques. In valuing the share options, the management is required to estimate the inputs made to the valuation models. These inputs include, inter alia, fair value of the shares of the Company at the grant date, volatility of shares, risk free rate of return, dividend yield and expected life of the option.
Useful lives of depreciable assets (note 7)
The assessment of the useful lives of these assets requires judgment. Depreciation and amortization is charged to the Statement of Comprehensive Income (Loss) based on the useful life selected. This assessment requires estimation of the period over which the Group will benefit from the assets.
Assessing whether assets meet the required criteria for initial capitalization requires judgment. This requires a determination of whether the assets will result in future benefits to the Group.
Defined benefit liability (note 17.2)
Management estimates the defined benefit liability annually with the assistance of independent actuaries; however, the actual outcome may vary due to estimation uncertainties. The defined benefit liability is based on, inter alia, standard rates of inflation, medical cost trends and mortality. It also takes into account the Group’s
F-22
Table of Contents
TV18 HSN HOLDINGS LIMITED
NOTES TO THE CONSOLIDATED FINANCIAL STATEMENTS — (Continued)
specific anticipation of future salary increases. Discount factors are determined close to each year-end by reference to government bond rates that have terms to maturity approximating the terms of the related liability.
Fair value measurement considerations (note 9)
Fair value of financial instruments for which no active market exists is established using a valuation technique. Valuation techniques include, inter alia, using recent arm’s length market transactions between knowledgeable, willing parties, if available, reference to the current fair value of another instrument that is substantially the same, discounted cash flow analysis and option pricing models.
3.23 Standards, amendments and interpretations to existing standards that are not yet effective and have not been adopted early by the Group
At the date of authorization of these financial statements, certain new standards, amendments and interpretations to existing standards have been published but are not yet effective, and have not been adopted early by the Group.
Management anticipates that all of the relevant pronouncements will be adopted in the Group’s accounting policy for the first period beginning after the effective date of the pronouncement.
Information on new standards, amendments and interpretations that are expected to be relevant to the financial statements is provided below. Other than as specified below, the impact of initial application of these pronouncements is not presently reasonably estimable.
IFRS 9 Financial Instruments — Classification and Measurement (effective for annual periods beginning on or after January 1, 2015)
IFRS 9 seeks to reduce complexity of the current rules on financial instruments as mandated in IAS 39. IFRS 9 has fewer classification and measurement categories as compared to IAS 39 and has eliminated the categories of held to maturity, available for sale and loans and receivables. Further, it eliminates the rule-based requirement of segregating embedded derivatives and tainting rules pertaining to held to maturity investments. For an investment in an equity instrument which is not held for trading, IFRS 9 permits irrevocable election, on initial recognition, on an individual share-by-share basis, to present all fair value changes from the investment in Other Comprehensive income. Amount recognized in other comprehensive income would, never be reclassified in to profit or loss.
Further, IFRS 9 addresses the problem of volatility in profit and loss arising from an issuer choosing to measure its own debt at fair value. With the new requirements, an entity choosing to measure a liability at fair value will present the portion of the change in its fair value due to changes in the entity’s own credit risk in other comprehensive income rather than within profit or loss.
IFRS 10 Consolidated Financial Statements (effective for annual periods beginning on or after January 1, 2013)
IFRS 10 supersedes IAS 27 Consolidated and Separate Financial Statements and SIC-12 Consolidation — Special Purpose Entities. It introduces a new, principle-based definition of control which will apply to all investees to determine the scope of consolidation.
F-23
Table of Contents
TV18 HSN HOLDINGS LIMITED
NOTES TO THE CONSOLIDATED FINANCIAL STATEMENTS — (Continued)
IFRS 10 uses control as the single basis for consolidation, irrespective of the nature of the investee, eliminating the risks and rewards approach included in SIC-12. IFRS 10 identifies the following three elements of control:
| • | Power over the investee; |
| • | Exposure, or rights, to variable returns from involvement with the investee; and |
| • | The ability to use power over the investee to affect the amount of the investor’s returns. |
An investor must possess all three elements to conclude it controls the investee. The assessment of control is based on all facts and circumstances and the conclusion is reassessed if there is an indication that there are changes to at least one of the three elements of control.
The new standard is not expected to cause any change to the entities being consolidated in the Group.
IFRS 12 Disclosure of Interests in Other Entities (effective for annual periods beginning on or after January 1, 2013)
IFRS 12 combines the disclosure requirements for subsidiaries, joint arrangements, associates and structured entities within a comprehensive disclosure standard.
It aims to provide more transparency on ‘borderline’ consolidation decisions and enhances disclosures about unconsolidated structured entities in which an investor or sponsor has involvement.
The Company has not early adopted IFRS 12 in these financial statements. The application of this new standard will not have any impact on recognition and measurement principles applied by the Company and will only add or modify disclosures in the financial statements.
IFRS 13 Fair valuation Measurement (effective for annual periods beginning on or after January 1, 2013)
IFRS 13:
| • | Defines fair value |
| • | Sets out in a single IFRS a framework for measuring fair value |
| • | Requires disclosure about fair value measurement |
IFRS 13 applies when another IFRS requires or permits fair value measurement or disclosure about fair value measurements, except for:
| • | Shares based payment transaction within the scope of IFRS 2, share based payment. |
| • | Leasing transactions within the scope of IAS 17, Leases. |
| • | Measurement that have some similarities to fair value but that are not fair value, such as “net realizable value” of Inventories as per IAS 2 or “Value in Use” as per IAS 36 Impairments of assets. |
F-24
Table of Contents
TV18 HSN HOLDINGS LIMITED
NOTES TO THE CONSOLIDATED FINANCIAL STATEMENTS — (Continued)
Amendment to IAS 1 Presentation of Financial statements
The amendments to IAS 1 require an entity to group items presented in consolidated statement of “Other comprehensive income” into those that, in accordance with other IFRSs;
| (a) | will not be reclassified subsequently to profit or loss, |
| (b) | will be reclassified subsequently to profit or loss when specific conditions are met. |
The amendments are applicable for annual periods beginning on or after July 1, 2012.
IAS 19 Employee Benefits (effective for annual periods beginning on or after January 1, 2013)
The IASB has issued an amended version of IAS 19 Employee Benefits, which includes a number of targeted improvements throughout the Standard. The main changes improve the comparability and understandability of changes arising from defined benefit plans by removing options and requiring entities to recognize changes immediately. This is intended to provide users of financial statements with a much clearer picture of an entity’s obligations resulting from the provision of defined benefit plans and how those obligations will affect the entity.
The amended version does this by:
| • | Eliminating the ‘corridor method’ which allowed entities the option to defer the recognition of actuarial gains and losses. |
| • | Streamlining the presentation of changes in assets and liabilities arising from defined benefit plans, including requiring remeasurement to be presented in other comprehensive income, thereby separating those changes from changes that many perceive to be the result of an entity’s day-to-day operations |
| • | Enhancing the disclosure requirements for defined benefit plans, providing better information about the characteristics of defined benefit plans and the risks that entities are exposed to through participation in them. |
In addition to these major changes, the amended version of IAS 19 makes changes to a number of other areas.
IAS 27 (Revised) Separate Financial Statements (effective for annual periods beginning on or after January 1, 2013)
Consequential changes have been made to IAS 27 as a result of the publication of the new IFRSs. IAS 27 will now solely address separate financial statements, the requirements for which are substantially unchanged.
F-25
Table of Contents
TV18 HSN HOLDINGS LIMITED
NOTES TO THE CONSOLIDATED FINANCIAL STATEMENTS — (Continued)
4 Segment Reporting
| For the Year Ended | ||||||||||||||||||||||||||||||||||||||||||||||||||
| Television | Internet | Unallocated | Total | |||||||||||||||||||||||||||||||||||||||||||||||
| March 31, 2010 | March 31, 2011 | March 31, 2012 | March 31, 2010 | March 31, 2011 | March 31, 2012 | March 31, 2010 | March 31, 2011 | March 31, 2012 | March 31, 2010 | March 31, 2011 | March 31, 2012 | |||||||||||||||||||||||||||||||||||||||
| (in US$) | ||||||||||||||||||||||||||||||||||||||||||||||||||
Gross transaction value | 44,186,924 | 60,758,606 | 77,740,349 | — | 1,810,590 | 30,806,603 | — | — | — | 44,186,924 | 62,569,196 | 108,546,952 | ||||||||||||||||||||||||||||||||||||||
|
|
|
|
|
|
|
|
|
|
|
|
|
|
|
|
|
|
|
|
|
|
|
| |||||||||||||||||||||||||||
Segment revenue(1) | (A) | 14,641,660 | 18,842,528 | 20,494,249 | — | 351,448 | 3,963,447 | — | — | — | 14,641,660 | 19,193,976 | 24,457,696 | |||||||||||||||||||||||||||||||||||||
Direct operating expenses | ||||||||||||||||||||||||||||||||||||||||||||||||||
Freight and collection expenses | 4,625,708 | 6,481,566 | 8,393,506 | — | 132,926 | 3,437,670 | — | — | — | 4,625,708 | 6,614,492 | 11,831,176 | ||||||||||||||||||||||||||||||||||||||
Call centre expenses | 1,073,360 | 1,832,522 | 2,333,220 | — | 194,475 | 1,045,530 | — | — | — | 1,073,360 | 2,026,997 | 3,378,750 | ||||||||||||||||||||||||||||||||||||||
Carriage fees | 4,278,553 | 5,254,384 | 6,196,806 | — | — | — | — | — | — | 4,278,553 | 5,254,384 | 6,196,806 | ||||||||||||||||||||||||||||||||||||||
Airtime expenses | 293,165 | 631,075 | 264,773 | — | — | — | — | — | — | 293,165 | 631,075 | 264,773 | ||||||||||||||||||||||||||||||||||||||
|
|
|
|
|
|
|
|
|
|
|
|
|
|
|
|
|
|
|
|
|
|
|
| |||||||||||||||||||||||||||
| (B) | 10,270,786 | 14,199,547 | 17,188,305 | — | 327,401 | 4,483,200 | — | — | — | 10,270,786 | 14,526,948 | 21,671,505 | ||||||||||||||||||||||||||||||||||||||
|
|
|
|
|
|
|
|
|
|
|
|
|
|
|
|
|
|
|
|
|
|
|
| |||||||||||||||||||||||||||
Contribution | (C) = (A) – (B) | 4,370,874 | 4,642,981 | 3,305,944 | — | 24,047 | (519,753 | ) | — | — | — | 4,370,874 | 4,667,028 | 2,786,191 | ||||||||||||||||||||||||||||||||||||
|
|
|
|
|
|
|
|
|
|
|
|
|
|
|
|
|
|
|
|
|
|
|
| |||||||||||||||||||||||||||
Operating expenses — fixed | ||||||||||||||||||||||||||||||||||||||||||||||||||
Employee benefits expenses(2) | 3,450,301 | 3,268,755 | 3,468,505 | — | 349,750 | 2,645,772 | — | 1,276,636 | 1,570,147 | 3,450,301 | 4,895,141 | 7,684,424 | ||||||||||||||||||||||||||||||||||||||
Production and programming costs(3) | 1,228,095 | 1,679,117 | 1,645,676 | — | — | 94,948 | — | — | — | 1,228,095 | 1,679,117 | 1,740,624 | ||||||||||||||||||||||||||||||||||||||
Other operating expenses(4) | 3,260,215 | 5,341,053 | 5,414,756 | — | 162,410 | 897,270 | — | 175,240 | 229,350 | 3,260,215 | 5,678,703 | 6,541,376 | ||||||||||||||||||||||||||||||||||||||
|
|
|
|
|
|
|
|
|
|
|
|
|
|
|
|
|
|
|
|
|
|
|
| |||||||||||||||||||||||||||
| (D) | 7,938,611 | 10,288,925 | 10,528,937 | — | 512,160 | 3,637,990 | — | 1,451,876 | 1,799,497 | 7,938,611 | 12,252,961 | 15,966,424 | ||||||||||||||||||||||||||||||||||||||
|
|
|
|
|
|
|
|
|
|
|
|
|
|
|
|
|
|
|
|
|
|
|
| |||||||||||||||||||||||||||
Operating earnings before interest, tax, depreciation and amortization | (E) = (C) – (D) | (3,567,737 | ) | (5,645,944 | ) | (7,222,993 | ) | — | (488,113 | ) | (4,157,743 | ) | — | (1,451,876 | ) | (1,799,497 | ) | (3,567,737 | ) | (7,585,933 | ) | (13,180,233 | ) | |||||||||||||||||||||||||||
|
|
|
|
|
|
|
|
|
|
|
|
|
|
|
|
|
|
|
|
|
|
|
| |||||||||||||||||||||||||||
F-26
Table of Contents
TV18 HSN HOLDINGS LIMITED
NOTES TO THE CONSOLIDATED FINANCIAL STATEMENTS — (Continued)
| For the Year Ended | ||||||||||||||||||||||||||||||||||||||||||||||||||
| Television | Internet | Unallocated | Total | |||||||||||||||||||||||||||||||||||||||||||||||
| March 31, 2010 | March 31, 2011 | March 31, 2012 | March 31, 2010 | March 31, 2011 | March 31, 2012 | March 31, 2010 | March 31, 2011 | March 31, 2012 | March 31, 2010 | March 31, 2011 | March 31, 2012 | |||||||||||||||||||||||||||||||||||||||
| (in US$) | ||||||||||||||||||||||||||||||||||||||||||||||||||
Customer acquisition cost(5) | ||||||||||||||||||||||||||||||||||||||||||||||||||
Search engine marketing cost | — | 34,799 | — | — | 385,297 | 2,671,534 | — | — | — | — | 420,096 | 2,671,534 | ||||||||||||||||||||||||||||||||||||||
Redemption of gift coupons | 957,456 | 2,068,613 | 1,401,936 | — | 56,199 | 1,422,369 | — | — | — | 957,456 | 2,124,812 | 2,824,305 | ||||||||||||||||||||||||||||||||||||||
Branding | 1,212,042 | 1,309,785 | 581,090 | — | — | 1,363,254 | — | — | — | 1,212,042 | 1,309,785 | 1,944,344 | ||||||||||||||||||||||||||||||||||||||
|
|
|
|
|
|
|
|
|
|
|
|
|
|
|
|
|
|
|
|
|
|
|
| |||||||||||||||||||||||||||
| (F) | 2,169,498 | 3,413,197 | 1,983,026 | — | 441,496 | 5,457,157 | — | — | — | 2,169,498 | 3,854,693 | 7,440,183 | ||||||||||||||||||||||||||||||||||||||
|
|
|
|
|
|
|
|
|
|
|
|
|
|
|
|
|
|
|
|
|
|
|
| |||||||||||||||||||||||||||
Segment loss | (E) – (F) | (5,737,235 | ) | (9,059,141 | ) | (9,206,019 | ) | — | (929,609 | ) | (9,614,900 | ) | — | (1,451,876 | ) | (1,799,497 | ) | (5,737,235 | ) | (11,440,626 | ) | (20,620,416 | ) | |||||||||||||||||||||||||||
|
|
|
|
|
|
|
|
|
|
|
|
|
|
|
|
|
|
|
|
|
|
|
| |||||||||||||||||||||||||||
Share based payment expense | (881,491 | ) | (1,354,917 | ) | (569,121 | ) | ||||||||||||||||||||||||||||||||||||||||||||
Finance income | 730,217 | 1,159,520 | 1,092,729 | |||||||||||||||||||||||||||||||||||||||||||||||
Finance cost | (8,412,815 | ) | (51,026 | ) | (884,312 | ) | ||||||||||||||||||||||||||||||||||||||||||||
Depreciation and amortization | (773,550 | ) | (989,612 | ) | (1,249,653 | ) | ||||||||||||||||||||||||||||||||||||||||||||
Remuneration to selling shareholder of acquired business (Refer note 5, “Business combination”) | — | — | (311,720 | ) | ||||||||||||||||||||||||||||||||||||||||||||||
|
|
|
|
|
| |||||||||||||||||||||||||||||||||||||||||||||
Loss before tax as per financial statements | (15,074,874 | ) | (12,676,661 | ) | (22,542,493 | ) | ||||||||||||||||||||||||||||||||||||||||||||
|
|
|
|
|
| |||||||||||||||||||||||||||||||||||||||||||||
| (1) | Gross transaction value refers to the total value of all products shipped by vendors through the Company’s platform during the relevant year, net of related returns. |
| (2) | Employee benefits expenses comprise of expenses as per note 17, excluding ‘Share based payment expense.’ |
| (3) | Production and programming costs comprise of contracted media professionals fees, show production expenses, production consumables, studio equipment and costume hire charges, uplinking expenses and website development expenses included in ‘Other operating expenses’ as per note 18. |
| (4) | Other operating expenses represent ‘Other operating expenses’ as per Statement of Comprehensive Income (Loss) excluding ‘Production and programming costs’ as per footnote 2 above. |
| (5) | Customer acquisition cost represents ‘Advertisement and business promotion expenses’ as per Statement of Comprehensive Income (Loss). |
F-27
Table of Contents
TV18 HSN HOLDINGS LIMITED
NOTES TO THE CONSOLIDATED FINANCIAL STATEMENTS — (Continued)
5 Business combination
On June 16, 2011, TV18 Home Shopping Network Limited, subsidiary of the Company, acquired an online books portal named CoinJoos.com. The acquisition was made to enhance the Group’s position in books selling category.
The details of the business combination are as follows:
| (in US$) | ||||
Amount settled in cash | 195,465 | |||
The consideration paid is not been attributable to any specific identifiable assets and accordingly the aforementioned consideration has been recognized as “Goodwill” in these consolidated financial statements.
Further, as per the Group’s agreement with the previous owners of CoinJoos, an amount of US$ 831,255 is payable upon achievement of certain milestones subject to continued employment of one of the previous owners of CoinJoos upto June 30, 2013. As per management, such milestones are likely to be achieved and accordingly, such amount has been/shall be recognized as “employee benefits expense” in these consolidated financial statements.
Contribution of business acquired to the Group results
Since the Group provides a platform of sale for several product categories, it is impracticable to determine the amount of revenue and profit/loss generated from ‘books’ category. Accordingly, the Group has not disclosed the information required by paragraph B64 (q) of IFRS 3,Business Combinations.
F-28
Table of Contents
TV18 HSN HOLDINGS LIMITED
NOTES TO THE CONSOLIDATED FINANCIAL STATEMENTS — (Continued)
6 Other intangible assets
The Group’s other intangible assets comprise computer software. The carrying amounts for the reporting periods are analyzed as follows:
| Computer Software | ||||
| (in US$) | ||||
Cost | ||||
Balance as at April 1, 2009 | 109,569 | |||
— Additions | — | |||
— Disposals | — | |||
— Effect of movement in exchange rates | 14,103 | |||
|
| |||
Balance as at March 31, 2010 | 123,672 | |||
|
| |||
Balance as at April 1, 2010 | 123,672 | |||
— Additions | 148,937 | |||
— Disposals | — | |||
— Effect of movement in exchange rates | 4,492 | |||
|
| |||
Balance as at March 31, 2011 | 277,101 | |||
|
| |||
Balance as at April 1, 2011 | 277,101 | |||
— Additions | 135,364 | |||
— Disposals | — | |||
— Acquired through business combinations | — | |||
— Effect of movement in exchange rates | (43,304 | ) | ||
|
| |||
Balance as at March 31, 2012 | 369,161 | |||
|
| |||
Accumulated amortization | ||||
Balance as at April 1, 2009 | 27,672 | |||
— Amortization for the year | 23,575 | |||
— Disposals | — | |||
— Effect of movement in exchange rates | 4,721 | |||
|
| |||
Balance as at March 31, 2010 | 55,968 | |||
|
| |||
Balance as at April 1, 2010 | 55,968 | |||
— Amortization for the year | 37,170 | |||
— Disposals | — | |||
— Effect of movement in exchange rates | 1,397 | |||
|
| |||
Balance as at March 31, 2011 | 94,535 | |||
|
| |||
Balance as at April 1, 2011 | 94,535 | |||
— Amortization for the year | 55,320 | |||
— Disposals | — | |||
— Effect of movement in exchange rates | (15,318 | ) | ||
|
| |||
Balance as at March 31, 2012 | 134,537 | |||
|
| |||
Carrying value | ||||
As at April 1, 2009 | 81,897 | |||
As at March 31, 2010 | 67,704 | |||
As at March 31, 2011 | 182,566 | |||
As at March 31, 2012 | 234,624 | |||
F-29
Table of Contents
TV18 HSN HOLDINGS LIMITED
NOTES TO THE CONSOLIDATED FINANCIAL STATEMENTS — (Continued)
7 Property, plant and equipment
The Group’s property, plant and equipment comprise leasehold improvements, Information Technology (IT) and office equipment, plant and machinery and electrical installations, furniture and fixtures and vehicles. The carrying amount can be analyzed as follows:
Particulars | Leasehold Improvements | IT and Office Equipment | Plant & Machinery and Electrical Installations | Furniture and Fixtures | Vehicles | Capital Work in Progress | Total | |||||||||||||||||||||
| (in US$) | ||||||||||||||||||||||||||||
Cost | ||||||||||||||||||||||||||||
Balance as at April 1, 2009 | 1,141,902 | 560,902 | 2,175,790 | 260,313 | 44,314 | — | 4,183,221 | |||||||||||||||||||||
— Additions | 55,640 | 31,874 | 143,932 | 20,974 | 54,265 | 82,209 | 388,894 | |||||||||||||||||||||
— Disposals | — | (2,861 | ) | — | — | — | — | (2,861 | ) | |||||||||||||||||||
— Effect of movement in exchange rates | 149,712 | 73,621 | 287,126 | 34,536 | 8,372 | 4,043 | 557,410 | |||||||||||||||||||||
|
|
|
|
|
|
|
|
|
|
|
|
|
| |||||||||||||||
Balance as at March 31, 2010 | 1,347,254 | 663,536 | 2,606,848 | 315,823 | 106,951 | 86,252 | 5,126,664 | |||||||||||||||||||||
|
|
|
|
|
|
|
|
|
|
|
|
|
| |||||||||||||||
Balance as at April 1, 2010 | 1,347,254 | 663,536 | 2,606,848 | 315,823 | 106,951 | 86,252 | 5,126,664 | |||||||||||||||||||||
— Additions | 250,808 | 335,679 | 832,516 | 52,086 | 21,672 | — | 1,492,761 | |||||||||||||||||||||
— Disposals/adjustments | — | — | (2,623 | ) | — | — | (86,252 | ) | (88,875 | ) | ||||||||||||||||||
— Effect of movement in exchange rates | 20,065 | 14,349 | 46,079 | 4,563 | 1,630 | — | 86,686 | |||||||||||||||||||||
|
|
|
|
|
|
|
|
|
|
|
|
|
| |||||||||||||||
Balance as at March 31, 2011 | 1,618,127 | 1,013,564 | 3,482,820 | 372,472 | 130,253 | — | 6,617,236 | |||||||||||||||||||||
|
|
|
|
|
|
|
|
|
|
|
|
|
| |||||||||||||||
Balance as at April 1, 2011 | 1,618,127 | 1,013,564 | 3,482,820 | 372,472 | 130,253 | — | 6,617,236 | |||||||||||||||||||||
— Additions | 487,054 | 211,207 | 115,717 | 9,362 | — | — | 823,340 | |||||||||||||||||||||
— Disposals | — | — | — | — | — | — | — | |||||||||||||||||||||
— Effect of movement in exchange rates | (234,845 | ) | (141,524 | ) | (450,058 | ) | (47,953 | ) | (16,574 | ) | — | (890,954 | ) | |||||||||||||||
|
|
|
|
|
|
|
|
|
|
|
|
|
| |||||||||||||||
Balance as at March 31, 2012 | 1,870,336 | 1,083,247 | 3,148,479 | 333,881 | 113,679 | — | 6,549,622 | |||||||||||||||||||||
|
|
|
|
|
|
|
|
|
|
|
|
|
| |||||||||||||||
Accumulated depreciation | ||||||||||||||||||||||||||||
Balance as at April 1, 2009 | 224,474 | 142,303 | 333,560 | 48,942 | 8,440 | — | 757,719 | |||||||||||||||||||||
— Depreciation for the year | 227,997 | 122,213 | 356,866 | 34,878 | 8,021 | — | 749,975 | |||||||||||||||||||||
— Disposals | — | (1,148 | ) | — | — | — | — | (1,148 | ) | |||||||||||||||||||
— Effect of movement in exchange rates | 40,105 | 24,270 | 60,484 | 8,015 | 1,481 | — | 134,355 | |||||||||||||||||||||
|
|
|
|
|
|
|
|
|
|
|
|
|
| |||||||||||||||
Balance as at March 31, 2010 | 492,576 | 287,638 | 750,910 | 91,835 | 17,942 | — | 1,640,901 | |||||||||||||||||||||
|
|
|
|
|
|
|
|
|
|
|
|
|
| |||||||||||||||
Balance as at April 1, 2010 | 492,576 | 287,638 | 750,910 | 91,835 | 17,942 | — | 1,640,901 | |||||||||||||||||||||
— Depreciation for the year | 284,391 | 168,515 | 443,622 | 39,361 | 16,553 | — | 952,442 | |||||||||||||||||||||
— Disposals | — | — | (946 | ) | — | — | — | (946 | ) | |||||||||||||||||||
— Effect of movement in exchange rates | 11,392 | 6,704 | 17,559 | 1,836 | 545 | — | 38,036 | |||||||||||||||||||||
|
|
|
|
|
|
|
|
|
|
|
|
|
| |||||||||||||||
Balance as at March 31, 2011 | 788,359 | 462,857 | 1,211,145 | 133,032 | 35,040 | — | 2,630,433 | |||||||||||||||||||||
|
|
|
|
|
|
|
|
|
|
|
|
|
| |||||||||||||||
F-30
Table of Contents
TV18 HSN HOLDINGS LIMITED
NOTES TO THE CONSOLIDATED FINANCIAL STATEMENTS — (Continued)
Particulars | Leasehold Improvements | IT and Office Equipment | Plant & Machinery and Electrical Installations | Furniture and Fixtures | Vehicles | Capital Work in Progress | Total | |||||||||||||||||||||
| (in US$) | ||||||||||||||||||||||||||||
Balance as at April 1, 2011 | 788,359 | 462,857 | 1,211,145 | 133,032 | 35,040 | — | 2,630,433 | |||||||||||||||||||||
— Depreciation for the year | 405,466 | 229,487 | 496,177 | 45,890 | 17,313 | — | 1,194,333 | |||||||||||||||||||||
— Disposals | — | — | — | — | — | — | — | |||||||||||||||||||||
— Effect of movement in exchange rates | (124,410 | ) | (72,534 | ) | (183,599 | ) | (19,655 | ) | (5,488 | ) | — | (405,686 | ) | |||||||||||||||
|
|
|
|
|
|
|
|
|
|
|
|
|
| |||||||||||||||
Balance as at March 31, 2012 | 1,069,415 | 619,810 | 1,523,723 | 159,267 | 46,865 | — | 3,419,080 | |||||||||||||||||||||
|
|
|
|
|
|
|
|
|
|
|
|
|
| |||||||||||||||
Carrying value | ||||||||||||||||||||||||||||
As at April 1, 2009 | 917,428 | 418,599 | 1,842,230 | 211,371 | 35,874 | — | 3,425,502 | |||||||||||||||||||||
As at March 31, 2010 | 854,678 | 375,898 | 1,855,938 | 223,988 | 89,009 | 86,252 | 3,485,763 | |||||||||||||||||||||
As at March 31, 2011 | 829,768 | 550,707 | 2,271,675 | 239,440 | 95,213 | — | 3,986,803 | |||||||||||||||||||||
As at March 31, 2012 | 800,921 | 463,437 | 1,624,756 | 174,614 | 66,814 | — | 3,130,542 | |||||||||||||||||||||
The Group has contractual commitments for acquisition of property, plant and equipment amounting to US$ Nil, US$ 238,138, US$ 214,319 and US$ Nil as at April 1, 2009, March 31, 2010, March 31, 2011, and March 31, 2012 respectively. Based on the Group’s detailed cash flow forecasts, which takes into account all forecast revenue and expenses, the Board believes that the Group has sufficient funds available to meet these commitments as they fall due.
The tangible assets worth US$ 2,508,074 were pledged by the Group as on April 1, 2009 towards term loan from a bank.
8 Operating leases as lessee
The Group’s operating lease payments are due in respect of premises taken on lease for its operations. The Group’s future minimum operating lease payments in respect of premises taken on lease are as follows:
| Minimum Lease Payments Due | Total | |||||||||||||||
| Within 1 Year | 1 to 5 Years | After 5 Years | ||||||||||||||
| (in US$) | ||||||||||||||||
April 1, 2009 | 1,190,211 | 4,460,172 | — | 5,650,383 | ||||||||||||
March 31, 2010 | 1,407,216 | 3,627,027 | — | 5,034,243 | ||||||||||||
March 31, 2011 | 1,555,187 | 3,579,193 | 49,702 | 5,184,082 | ||||||||||||
March 31, 2012 | 1,134,275 | 750,734 | — | 1,885,009 | ||||||||||||
Lease payments recognized as an expense for the years ended March 31, 2010, March 31, 2011 and March 31, 2012 amount to US$ 944,523, US$ 1,458,732 and US$ 1,531,930 respectively. This amount consists of minimum lease payments. No sublease payments or contingent rent payments were made or received. Assets held under lease agreements are used exclusively by the Group.
The rental contracts for the office premises have an average non-cancelable term of 3 year to 6 years.
The Group’s operating lease agreements do not contain any contingent rent clauses. Some of the operating lease agreements contain renewal and escalation clauses. None of the agreements have restrictions such as those concerning dividends, additional debt and further leasing.
F-31
Table of Contents
TV18 HSN HOLDINGS LIMITED
NOTES TO THE CONSOLIDATED FINANCIAL STATEMENTS — (Continued)
9 Financial assets and liabilities
9.1 Categories of financial assets and liabilities
The carrying amounts presented in the statement of financial position relate to the following categories of assets and liabilities:
| As at April 1, 2009 | As at March 31, 2010 | As at March 31, 2011 | As at March 31, 2012 | |||||||||||||
| (in US$) | ||||||||||||||||
Financial assets | ||||||||||||||||
Loans and receivables | ||||||||||||||||
— Trade receivables | 495,176 | 893,393 | 639,087 | 1,100,339 | ||||||||||||
— Cash and cash equivalents | 5,663,742 | 1,317,103 | 1,873,147 | 1,449,065 | ||||||||||||
— Fixed deposits with banks | — | 21,464,317 | 5,900,132 | 680,176 | ||||||||||||
— Other short term financial assets | 2,857,709 | 3,949,760 | 4,837,944 | 8,356,401 | ||||||||||||
— Security deposits | 315,826 | 488,585 | 511,895 | 482,725 | ||||||||||||
|
|
|
|
|
|
|
| |||||||||
| 9,332,453 | 28,113,158 | 13,762,205 | 12,068,706 | |||||||||||||
Financial assets at fair value through profit or loss (held for trading) | ||||||||||||||||
— Investments in mutual funds (held for trading) | 1,599,538 | 837,842 | — | — | ||||||||||||
|
|
|
|
|
|
|
| |||||||||
Total | 10,931,991 | 28,951,000 | 13,762,205 | 12,068,706 | ||||||||||||
|
|
|
|
|
|
|
| |||||||||
Financial liabilities | ||||||||||||||||
Financial liabilities measured at amortized cost: | ||||||||||||||||
Trade payables | 5,688,892 | 4,642,641 | 2,668,984 | 6,264,528 | ||||||||||||
Loans and borrowings | 26,364,210 | 32,456 | 21,727 | 11,313,068 | ||||||||||||
Other current liabilities | 207,837 | 20,153 | 64,994 | 56,755 | ||||||||||||
Bank overdraft | 5,348 | 1,160,080 | 565,635 | 575,736 | ||||||||||||
Provision for expenses | 1,384,183 | 2,635,560 | 3,607,031 | 3,666,158 | ||||||||||||
|
|
|
|
|
|
|
| |||||||||
| 33,650,470 | 8,490,890 | 6,928,371 | 21,876,245 | |||||||||||||
Financial liabilities at fair value through profit or loss | ||||||||||||||||
Derivative financial liabilities | 4,340,000 | — | — | 180,000 | ||||||||||||
|
|
|
|
|
|
|
| |||||||||
Total | 37,990,470 | 8,490,890 | 6,928,371 | 22,056,245 | ||||||||||||
|
|
|
|
|
|
|
| |||||||||
Refer note 3.13 for a description of the accounting policies for each category of financial instruments. Information relating to fair values is presented in the related notes. The methods used to measure fair value of financial instruments measured at fair value are described in note 9.6. A description of the Group’s risk management objectives and policies for financial instruments is given in note 24.
Financial assets as at April 1, 2009, March 31, 2010, March 31, 2011 and March 31, 2012 include assets worth US$ 10,616,165, US$ Nil, US$ Nil and US$ Nil respectively pledged as collateral for term loan from a bank.
F-32
Table of Contents
TV18 HSN HOLDINGS LIMITED
NOTES TO THE CONSOLIDATED FINANCIAL STATEMENTS — (Continued)
9.2 Security deposit
Interest free unsecured security deposits are placed with owners of the properties leased to the Group and with various service providers. These security deposits have been discounted to arrive at their fair values at initial recognition using applicable market interest rates. The management estimates the fair value of these deposits not to be materially different from the amounts recognized in the financial statements at amortized cost at each reporting period-end.
9.3 Bank deposits and short term investments
| As at April 1, 2009 | As at March 31, 2010 | As at March 31, 2011 | As at March 31, 2012 | |||||||||||||
| (in US$) | ||||||||||||||||
Mutual funds | 1,599,538 | 837,842 | — | — | ||||||||||||
Fixed deposits with banks | — | 21,464,317 | 5,900,132 | 680,176 | ||||||||||||
|
|
|
|
|
|
|
| |||||||||
| 1,599,538 | 22,302,159 | 5,900,132 | 680,176 | |||||||||||||
|
|
|
|
|
|
|
| |||||||||
Mutual funds are carried at their fair value determined by reference to their daily published net asset values. The carrying value of fixed deposits with banks is considered a reasonable approximation of fair value.
9.4 Derivative financial liabilities
The carrying amounts for the Group’s derivative financial instruments may be further analyzed as follows:
| As at April 1, 2009 | As at March 31, 2010 | As at March 31, 2011 | As at March 31, 2012 | |||||||||||||
| (in US$) | ||||||||||||||||
Embedded derivative in convertible instruments | 4,340,000 | — | — | 180,000 | ||||||||||||
|
|
|
|
|
|
|
| |||||||||
| 4,340,000 | — | — | 180,000 | |||||||||||||
|
|
|
|
|
|
|
| |||||||||
The Group has issued convertible instruments which provide a minimum return to the holders of those instruments by specifying a ‘floor’ conversion ratio (Refer Note 9.5 below for details). The range of returns in excess of the ‘floor’ conversion ratio is assessed by the management as an embedded derivative which is carried at fair value with fair value changes recognized in profit or loss.
F-33
Table of Contents
TV18 HSN HOLDINGS LIMITED
NOTES TO THE CONSOLIDATED FINANCIAL STATEMENTS — (Continued)
9.5 Loans and borrowings
Borrowings include the following financial liabilities measured at amortized cost:
| As at April 1, 2009 | As at March 31, 2010 | As at March 31, 2011 | As at March 31, 2012 | |||||||||||||
| (in US$) | ||||||||||||||||
Non-current | ||||||||||||||||
Convertible preference shares | 23,413,970 | — | — | — | ||||||||||||
Term loans | 2,912,733 | — | 21,727 | — | ||||||||||||
Vehicle loan | — | 21,638 | — | — | ||||||||||||
|
|
|
|
|
|
|
| |||||||||
| 26,326,703 | 21,638 | 21,727 | — | |||||||||||||
|
|
|
|
|
|
|
| |||||||||
Current | ||||||||||||||||
Convertible warrants | — | — | — | 597,637 | ||||||||||||
Term loans | 37,507 | — | — | 10,707,022 | ||||||||||||
Vehicle loan | — | 10,818 | — | 8,409 | ||||||||||||
|
|
|
|
|
|
|
| |||||||||
| 37,507 | 10,818 | — | 11,313,068 | |||||||||||||
|
|
|
|
|
|
|
| |||||||||
Total loans and borrowings | 26,364,210 | 32,456 | 21,727 | 11,313,068 | ||||||||||||
|
|
|
|
|
|
|
| |||||||||
Convertible preference shares
On May 17, 2008, the Company issued 65,625,000 Class B preference shares of face value of US$ 0.04 at a premium of US$ 0.28. These preference shares carried a fixed cumulative dividend at the rate of 0.001% per annum (which is recognized as a financial liability) and were convertible into such number of ordinary shares of the Company that represent 13.47% (“base conversion ratio”) of the issued and paid-up capital of the Company (immediately following such conversion). The preference shares are convertible only immediately prior to the Initial Public Offer (“IPO”) and public listing of ordinary shares. As per the terms of the shareholders’ agreement between Network18 Holdings Limited, Mauritius and SAIF II Mauritius Company Limited dated May 17, 2006, the shareholders will cause the Company to undertake the IPO.
In the event, the conversion of Class B preference shares on the basis of base conversion ratio yields less than 20% internal rate of return (“IRR”), then the base conversion ratio shall be adjusted such that the preference shares yield a minimum IRR of 20% upon conversion and pursuant to the IPO.
Further, as per the terms of issue of Class B preference shares, if the conversion ratio results in inter se economic interest of Network18 Holdings Limited, Mauritius and SAIF II Mauritius Company Limited in the Company to reduce below the ratio of 51:49, the voting rights associated with the ordinary shares shall be adjusted so as to maintain inter se voting rights at a ratio of 51:49.
The contract to provide an IRR of 20% upon conversion and pursuant to the IPO is a non-derivative financial instrument that will be settled by the Company issuing a variable number of its own equity instruments and is classified as a financial liability at amortized cost. The financial liability is initially measured at fair value by discounting the contractual cash flows of the instrument using a discount rate for a similar instrument without the conversion feature.
The conversion feature is assessed as an embedded derivative which is initially measured at fair value. Fair value of the derivative is determined on the inception using binomial lattice method. Subsequent to initial
F-34
Table of Contents
TV18 HSN HOLDINGS LIMITED
NOTES TO THE CONSOLIDATED FINANCIAL STATEMENTS — (Continued)
recognition, derivatives are measured at fair value, and changes therein are accounted through the Statement of Comprehensive Income (Loss).
The fair value of the financial liability as at April 1, 2009 is US$ 23,930,000.
During the year ended March 31, 2010, the conversion ratio of Class B preference shares into class A preference shares and ordinary shares was fixed by virtue of shareholders’ agreement between the shareholders of the Company and accordingly the carrying amounts of derivative liability and financial liability at amortized cost were reclassified to equity. Equity instruments are instruments that evidence a residual interest in the assets of an entity after deducting all of its liabilities. Class A preference shares are convertible into ordinary shares of the Company in a fixed conversion ratio of 1:1 and their holders are entitled to voting rights which are at par with the rights of ordinary shareholders.
Term loans
The term loan outstanding as on April 1, 2009 carried an interest rate equivalent to a discount of 2.5% p.a. over the lender bank’s prime lending rate. The loan was repayable in 18 monthly installments after a moratorium period of 30 months. The loan was secured with first exclusive charge over current assets and moveable property, plant and equipment of the Subsidiary. Further, the loan was secured by unconditional and irrevocable personal guarantee of Mr. Raghav Bahl (who exercises indirect significant influence over the Company) and unconditional and irrevocable corporate guarantee of Network18 Media & Investments Limited, the indirect majority shareholder in the Company.
Term loans outstanding as on March 31, 2012 are taken from a related party and carry an interest rate equivalent to the prime lending rate of State Bank of India to be reset on a quarterly basis. The loan is repayable after the expiry of 12 months from the date of disbursement and is unsecured.
Convertible warrants
On March 16, 2012 (“the closing date”), the Company issued warrants to some of its shareholders. These warrants are convertible within 12 months from the closing date into Class A preference shares at a pre-determined discount to the valuation of the Company in the event the Company undertakes an IPO or is acquired or does a primary issuance of securities to an external investor. In case the aforementioned events do not happen within the stipulated 12-month period, the warrants are convertible at a valuation to be decided amongst the shareholders.
The aforementioned pre-determined discount is a form of assured return to the holders of warrants which is a non-derivative financial instrument that will be settled by the Company issuing a variable number of its own equity instruments and is classified as a financial liability at amortized cost. The financial liability is initially measured at fair value by discounting the contractual cash flows of the instrument using a discount rate for a similar instrument without the conversion feature.
The conversion feature is assessed as an embedded derivative which is initially measured at fair value. Fair value of the derivative is determined on the inception using binomial lattice method. Subsequent to initial recognition, derivatives are measured at fair value, and changes therein are accounted through the Statement of Comprehensive Income (Loss).
F-35
Table of Contents
TV18 HSN HOLDINGS LIMITED
NOTES TO THE CONSOLIDATED FINANCIAL STATEMENTS — (Continued)
9.6 Financial instruments measured at fair value
The Group has early adopted the amendments to IFRS 7 Improving Disclosures about Financial Instruments effective from January 1, 2009. These amendments require the Group to present certain information about financial instruments measured at fair value in the statement of financial position. As per the standard, in the first year of application comparative information need not be presented for the disclosures required by the amendment.
Accordingly, the disclosure for the fair value hierarchy is presented only as at March 31, 2010, March 31, 2011 and March 31, 2012.
The following tables present financial assets and liabilities measured at fair value in the statement of financial position in accordance with the fair value hierarchy. This hierarchy groups financial assets and liabilities into three levels based on the significance of inputs used in measuring the fair value of the financial assets and liabilities. The fair value hierarchy has the following levels:
Level 1: quoted prices (unadjusted) in active markets for identical assets or liabilities;
Level 2: inputs other than quoted prices included within Level 1 that are observable for the asset or liability, either directly (i.e. as prices) or indirectly (i.e. derived from prices); and
Level 3: inputs for the asset or liability that are not based on observable market data (unobservable inputs).
The level within which the financial asset or liability is classified is determined based on the lowest level of significant input to the fair value measurement.
The financial assets and liabilities measured at fair value in the statement of financial position are grouped into the fair value hierarchy as on March 31, 2012 as follows:
| Level 1 | Level 2 | Level 3 | Total | |||||||||||||
| (in US$) | ||||||||||||||||
Liabilities | ||||||||||||||||
Embedded derivative in convertible instruments | — | — | 180,000 | 180,000 | ||||||||||||
|
|
|
|
|
|
|
| |||||||||
Total | — | — | 180,000 | 180,000 | ||||||||||||
|
|
|
|
|
|
|
| |||||||||
F-36
Table of Contents
TV18 HSN HOLDINGS LIMITED
NOTES TO THE CONSOLIDATED FINANCIAL STATEMENTS — (Continued)
Refer Note 9.4 for brief description of derivatives embedded in debt instruments issued by the Group. Such derivatives are fair valued using a valuation technique which applies the following assumptions in determining the fair value of embedded derivative:
The fair value of the separable embedded derivative is measured using the binomial lattice model. Measurement inputs include business enterprise value on valuation date, expected term of the instrument, US risk free rate (as the instrument is denominated in US$), expected dividend yield and expected volatility (based on weighted average historic volatility of comparable companies). These assumptions are summarized in the table below:
Parameter | Assumption | |||
Expected life of option (years) | 1 | |||
Volatility (based on volatility of entities in similar industry) | 33.94 | % | ||
Risk free interest rate (United States) | 0.16 | % | ||
Dividend yield | 0 | % | ||
Required internal rate of return | 17.14 | % | ||
Along with the assumptions mentioned above, the valuation model considered the equity value of the Company which was derived using the following assumptions:
Parameter | Assumption | |||
Cash flow projections for 10 years |
| As per internal estimates |
| |
Weighted average cost of capital | 20 | % | ||
Perpetuity growth rate | 5 | % | ||
Income tax rate | 32.45 | % | ||
Debt free net working capital as % of revenue | -3 | % | ||
Losses on fair valuation of the embedded derivative are presented within ‘finance costs.’
The financial assets and liabilities measured at fair value in the statement of financial position are grouped into the fair value hierarchy as on March 31, 2010 as follows:
| Level 1 | Level 2 | Level 3 | Total | |||||||||||||
| (in US$) | ||||||||||||||||
Assets | ||||||||||||||||
Investments in mutual funds | 837,842 | — | — | 837,842 | ||||||||||||
|
|
|
|
|
|
|
| |||||||||
Total | 837,842 | �� | — | — | 837,842 | |||||||||||
|
|
|
|
|
|
|
| |||||||||
The fair value of the Group’s investments in mutual funds has been determined by reference to their published net asset values at the reporting date. Gains and losses are recorded within ‘finance income’ or ‘finance costs’ as appropriate.
F-37
Table of Contents
TV18 HSN HOLDINGS LIMITED
NOTES TO THE CONSOLIDATED FINANCIAL STATEMENTS — (Continued)
Level 3 fair value measurements
The Group’s financial liabilities classified in Level 3 are measured using valuation techniques based on significant inputs that are not based on observable market data. The financial instruments within this level can be reconciled from beginning to ending balances as follows:
| Financial Liabilities at Fair Value Through Profit or Loss | ||||
| (in US$) | ||||
Opening balance as on April 1, 2011 | — | |||
Gains/(losses) recognized in Statement of Comprehensive Income (Loss) | — | |||
Purchases | 180,000 | |||
Sales | — | |||
Issues | — | |||
Settlements | — | |||
|
| |||
Closing balance as on March 31, 2012 | 180,000 | |||
|
| |||
Losses recognized in Statement of Comprehensive Income (Loss) for the period are presented in ‘finance costs’ and can be attributed to liabilities outstanding/not outstanding at the end of the reporting period as follows:
| As at March 31, 2010 | As at March 31, 2011 | As at March 31, 2012 | ||||||||||
| (in US$) | ||||||||||||
Liabilities outstanding at the end of the reporting period | — | — | — | |||||||||
Liabilities not outstanding at the end of the reporting period | 4,780,000 | — | — | |||||||||
|
|
|
|
|
| |||||||
Total | 4,780,000 | — | — | |||||||||
|
|
|
|
|
| |||||||
There have been no transfers into or out of level 3 in the reporting periods under review.
10 Other non-current assets
| As at April 1, 2009 | As at March 31, 2010 | As at March 31, 2011 | As at March 31, 2012 | |||||||||||||
| (in US$) | ||||||||||||||||
Prepaid lease rentals | 202,795 | 120,815 | 174,678 | 88,838 | ||||||||||||
Capital advances | — | — | — | 200,238 | ||||||||||||
|
|
|
|
|
|
|
| |||||||||
| 202,795 | 120,815 | 174,678 | 289,076 | |||||||||||||
|
|
|
|
|
|
|
| |||||||||
Prepaid lease rentals are recognized at the inception of lease as the difference between security deposits paid as per lease agreement and fair value thereof. Prepaid lease rental is recognized as an expense in the Statement of Comprehensive Income / (Loss) on straight line basis over the lease term.
F-38
Table of Contents
TV18 HSN HOLDINGS LIMITED
NOTES TO THE CONSOLIDATED FINANCIAL STATEMENTS — (Continued)
11 Deferred tax assets and liabilities
Recognized deferred tax assets and liabilities
Deferred taxes arising from temporary differences and unused tax losses can be summarized as follows:
Deferred Tax Liabilities (Assets) | April 1, 2009 | Recognized in Profit and Loss | March 31, 2010 | Recognized in Profit and Loss | March 31, 2011 | Recognized in Profit and Loss | March 31, 2012 | |||||||||||||||||||||
| (in US$) | ||||||||||||||||||||||||||||
Property, plant and equipment and intangible assets | 56,024 | (33,548 | ) | 22,476 | (22,476 | ) | — | — | — | |||||||||||||||||||
Loans and borrowings | 10,649 | �� | (10,649 | ) | — | — | — | — | — | |||||||||||||||||||
Short term investments | 21,237 | (17,392 | ) | 3,845 | (3,845 | ) | — | — | — | |||||||||||||||||||
Disallowances under tax laws | (87,910 | ) | 61,589 | (26,321 | ) | 26,321 | — | — | — | |||||||||||||||||||
|
|
|
|
|
|
|
|
|
|
|
|
|
| |||||||||||||||
Total | — | — | — | — | — | — | — | |||||||||||||||||||||
|
|
|
|
|
|
|
|
|
|
|
|
|
| |||||||||||||||
Unrecognized Deferred Tax Assets
Deferred tax assets have not been recognized in respect of the following items:
Particulars | As at April 1, 2009 | As at March 31, 2010 | As at March 31, 2011 | As at March 31, 2012 | ||||||||||||
| (in US$) | ||||||||||||||||
Deductible temporary differences | 547,185 | 2,047,796 | 1,005,520 | 1,252,377 | ||||||||||||
Unabsorbed tax loss and depreciation | 17,735,257 | 24,932,961 | 38,152,581 | 53,921,706 | ||||||||||||
|
|
|
|
|
|
|
| |||||||||
Total | 18,282,442 | 26,980,757 | 39,158,101 | 55,174,083 | ||||||||||||
|
|
|
|
|
|
|
| |||||||||
The carry forward tax losses as at March 31, 2012 expire as follows:
Loss for the Period | Losses With Expiry | Losses With No Expiry | ||||||||||||||
| Tax Loss | Expires On | Tax Loss | Unabsorbed Depreciation | |||||||||||||
| (in US$) | ||||||||||||||||
Year ended March 31, 2007 | 822,890 | March 31, 2015 | — | 10,980 | ||||||||||||
Year ended March 31, 2008 | 7,385,300 | March 31, 2016 | 4,498 | 267,400 | ||||||||||||
Year ended March 31, 2009 | 8,392,380 | March 31, 2017 | 98,610 | 680,400 | ||||||||||||
Year ended March 31, 2010 | 3,785,660 | March 31, 2018 | 16,390 | 534,590 | ||||||||||||
Year ended March 31, 2011 | 10,504,670 | March 31, 2019 | 36,549 | 757,430 | ||||||||||||
Year ended March 31, 2012 | 19,813,970 | March 31, 2020 | 4,493 | 805,496 | ||||||||||||
|
|
|
|
|
| |||||||||||
Total | 50,704,870 | 160,540 | 3,056,296 | |||||||||||||
|
|
|
|
|
| |||||||||||
Deferred tax assets have not been recognized in respect of these losses because it is not probable at the reporting date that future taxable profit will be available against which the Group will be able to utilize the benefits of such tax losses.
F-39
Table of Contents
TV18 HSN HOLDINGS LIMITED
NOTES TO THE CONSOLIDATED FINANCIAL STATEMENTS — (Continued)
12. Trade receivables
The carrying amounts of trade receivables are analyzed as follows:
| As at April 1, 2009 | As at March 31, 2010 | As at March 31, 2011 | As at March 31, 2012 | |||||||||||||
| (in US$ ) | ||||||||||||||||
Gross value | 512,015 | 912,399 | 658,187 | 1,117,008 | ||||||||||||
Less: Allowance for credit losses | (16,839 | ) | (19,006 | ) | (19,100 | ) | (16,669 | ) | ||||||||
|
|
|
|
|
|
|
| |||||||||
Net trade receivables | 495,176 | 893,393 | 639,087 | 1,100,339 | ||||||||||||
|
|
|
|
|
|
|
| |||||||||
The net carrying value of trade receivables is considered a reasonable approximation of fair value.
All of the Group’s trade receivables have been reviewed for indicators of impairment. The impaired trade receivables are mostly due from customers that are in the process of reconciling their balances with the Group.
The movement in the allowance for credit losses can be reconciled as follows:
| For the Year March 31, 2010 | For the Year March 31, 2011 | For the Year March 31, 2012 | ||||||||||
| (in US$) | ||||||||||||
Opening balance | 16,839 | 19,006 | 19,100 | |||||||||
Amounts written off | — | 115 | — | |||||||||
Provision made during the year | — | — | — | |||||||||
Provisions reversed during the year | — | — | — | |||||||||
Effect of movement in exchange rates | 2,167 | (21 | ) | (2,431 | ) | |||||||
|
|
|
|
|
| |||||||
Closing balance | 19,006 | 19,100 | 16,669 | |||||||||
|
|
|
|
|
| |||||||
An analysis of net unimpaired trade receivables that are past due is given in note 24.
13. Other current assets
The carrying amount of other current assets are analyzed as follows:
| As at April 1, 2009 | As at March 31, 2010 | As at March 31, 2011 | As at March 31, 2012 | |||||||||||||
| (in US$) | ||||||||||||||||
Financial assets — loans and receivables | ||||||||||||||||
Receivables due from courier agencies | 1,905,803 | 2,938,700 | 2,846,108 | 4,196,613 | ||||||||||||
Loans | 561,315 | 647,645 | 654,752 | 571,574 | ||||||||||||
Advances recoverable | 390,591 | 351,412 | 1,337,084 | 3,581,142 | ||||||||||||
Security deposits | — | 12,003 | — | 7,072 | ||||||||||||
|
|
|
|
|
|
|
| |||||||||
| 2,857,709 | 3,949,760 | 4,837,944 | 8,356,401 | |||||||||||||
|
|
|
|
|
|
|
| |||||||||
Non-financial assets | ||||||||||||||||
Input tax receivables | 1,205,712 | 1,568,563 | 2,089,405 | 2,801,434 | ||||||||||||
Prepaid expenses | 108,682 | 181,342 | 559,240 | 913,373 | ||||||||||||
|
|
|
|
|
|
|
| |||||||||
Total | 1,314,394 | 1,749,905 | 2,648,645 | 3,714,807 | ||||||||||||
|
|
|
|
|
|
|
| |||||||||
Total current assets | 4,172,103 | 5,699,665 | 7,486,589 | 12,071,208 | ||||||||||||
|
|
|
|
|
|
|
| |||||||||
F-40
Table of Contents
TV18 HSN HOLDINGS LIMITED
NOTES TO THE CONSOLIDATED FINANCIAL STATEMENTS — (Continued)
Receivables due from courier agencies
This comprises of amounts collected by the courier agencies in respect of sales made by vendors to the customers near the end of the financial year and not yet remitted to the Group.
Loans
Balance of loans outstanding represents interest bearing loan given.
Advances recoverable
Advances recoverable primarily comprise amounts recoverable from vendors and staff and are carried at cost. Such balances are receivable on demand.
Security deposits
Security deposits are interest free unsecured deposits placed with owners of the properties leased to the Group and other service providers.
The management assesses the fair value of these financial assets not to be materially different from the amounts recognized in the financial statements.
14. Cash and cash equivalents
Cash and cash equivalents include the components as follows: -
| As at April 1, 2009 | As at March 31, 2010 | As at March 31, 2011 | As at March 31, 2012 | |||||||||||||
| (in US$) | ||||||||||||||||
Cash in hand | 396 | 13,065 | 10,877 | 1,106 | ||||||||||||
Cash in current accounts | 5,663,346 | 99,019 | 734,588 | 1,372,251 | ||||||||||||
Cash in deposit accounts | — | 1,205,019 | 1,127,682 | 75,708 | ||||||||||||
|
|
|
|
|
|
|
| |||||||||
Total | 5,663,742 | 1,317,103 | 1,873,147 | 1,449,065 | ||||||||||||
|
|
|
|
|
|
|
| |||||||||
15. Revenue from operations
| For the Year Ended March 31, 2010 | For the Year Ended March 31, 2011 | For the Year Ended March 31, 2012 | ||||||||||
| (in US$) | ||||||||||||
Commission on sale of products | 10,681,349 | 13,624,153 | 18,570,200 | |||||||||
Sponsorship income | 19,003 | 102,288 | 48,836 | |||||||||
Subscription income | 50,520 | 12,941 | 1,039 | |||||||||
Reimbursement of freight and collection expenses | 3,890,788 | 5,454,594 | 5,837,621 | |||||||||
|
|
|
|
|
| |||||||
Total | 14,641,660 | 19,193,976 | 24,457,696 | |||||||||
|
|
|
|
|
| |||||||
F-41
Table of Contents
TV18 HSN HOLDINGS LIMITED
NOTES TO THE CONSOLIDATED FINANCIAL STATEMENTS — (Continued)
16. Equity
16.1 Share capital
The share capital of TV18 HSN Holdings Limited consists of:
| • | Ordinary shares with a par value of US$ 0.04 per share. |
| • | Preference shares — Class A with a par value of US$ 0.04 per share |
| • | Preference shares — Class B with a par value of US$ 0.04 per share |
| • | Preference shares — Class G with a par value of US$ 0.04 per share |
Rights, preferences and restrictions attached to each class of shares:
Preference shares are entitled to fixed cumulative dividend at the rate of 0.001% per annum.
Further, all shareholders are equally eligible to receive dividends and represent one vote at the shareholders’ meeting of TV18 HSN Holdings Limited.
F-42
Table of Contents
TV18 HSN HOLDINGS LIMITED
NOTES TO THE CONSOLIDATED FINANCIAL STATEMENTS — (Continued)
The total number of shares of the Company for each class of share as on each statement of financial position date is summarized as follows:
| As at April 1, 2009 | As at March 31, 2010 | As at March 31, 2011 | As at March 31, 2012 | |||||||||||||
Ordinary shares | ||||||||||||||||
Total number of authorized shares | 80,900,000 | 80,900,000 | 80,900,000 | 80,900,000 | ||||||||||||
Shares issued and fully paid up: | ||||||||||||||||
Beginning of the year | 36,222,500 | 41,923,401 | 41,923,401 | |||||||||||||
Share issue | 5,700,901 | — | — | |||||||||||||
Shares issued and fully paid | 36,222,500 | 41,923,401 | 41,923,401 | 41,923,401 | ||||||||||||
Shares reserved for issue under share based payments | 2,587,316 | 2,733,482 | 2,733,482 | 2,733,482 | ||||||||||||
Nominal value of ordinary shares (in US$) | 1,448,900 | 1,676,936 | 1,676,936 | 1,676,936 | ||||||||||||
Preference shares — Class A | ||||||||||||||||
Total number of authorized shares | 32,875,000 | 32,875,000 | 32,875,000 | 32,875,000 | ||||||||||||
Shares issued and fully paid up: | ||||||||||||||||
Beginning of the year | ` | 12,936,500 | 13,667,182 | 13,667,182 | ||||||||||||
Share issue | 730,682 | — | — | |||||||||||||
Shares issued and fully paid | 12,936,500 | 13,667,182 | 13,667,182 | 13,667,182 | ||||||||||||
Shares reserved for issue under convertible warrants (excluding warrants classified as financial liability) | — | — | — | 1,500,000 | ||||||||||||
Nominal value of Class A preference shares (in US$) | 517,460 | 546,687 | 546,687 | 546,687 | ||||||||||||
Preference shares — Class B | ||||||||||||||||
Total number of authorized shares | — | 65,625,000 | 65,625,000 | 65,625,000 | ||||||||||||
Shares issued and fully paid up: | ||||||||||||||||
Beginning of the year | — | 65,625,000 | 65,625,000 | |||||||||||||
Addition on account of fixing of conversion ratio of Class B preference shares into Class A preference shares and ordinary shares | 65,625,000 | — | — | |||||||||||||
Shares issued and fully paid | — | 65,625,000 | 65,625,000 | 65,625,000 | ||||||||||||
Nominal value of Class B preference shares (in US$) | — | 2,625,000 | 2,625,000 | 2,625,000 | ||||||||||||
Preference shares — Class G | ||||||||||||||||
Total number of authorized shares | — | 14,000,000 | 14,000,000 | 14,000,000 | ||||||||||||
Shares issued and fully paid up: | ||||||||||||||||
Beginning of the year | — | 13,542,728 | 13,542,728 | |||||||||||||
Share issue | 13,542,728 | — | — | |||||||||||||
Shares issued and fully paid | — | 13,542,728 | 13,542,728 | 13,542,728 | ||||||||||||
Nominal value of Class G preference shares (in US$) | — | 541,709 | 541,709 | 541,709 | ||||||||||||
Nominal value of share capital (in US$) | 1,966,360 | 5,390,332 | 5,390,332 | 5,390,332 | ||||||||||||
Class A and G preference shares are convertible into ordinary shares of the Company in the ratio of 1:1. 65,625,000 Class B preference shares are convertible into 4,385,264 ordinary shares and 14,032,846 Class A preference shares.
F-43
Table of Contents
TV18 HSN HOLDINGS LIMITED
NOTES TO THE CONSOLIDATED FINANCIAL STATEMENTS — (Continued)
Note 1:
During the year ended March 31, 2011, the Company filed a scheme of arrangement (“the Scheme”) for implementing certain changes to its authorized and issued share capital as discussed below:
| Before Giving Effect to the Scheme | After Giving Effect to the Scheme | |||||||
| No. of Shares | No. of Shares | |||||||
Authorized | ||||||||
Ordinary shares | 80,900,000 | 80,900,000 | ||||||
Class A | 32,875,000 | 98,500,000 | ||||||
Class B | 65,625,000 | — | ||||||
Class G | 14,000,000 | 14,000,000 | ||||||
|
|
|
| |||||
| 193,400,000 | 193,400,000 | |||||||
|
|
|
| |||||
Issued | ||||||||
Ordinary shares | 41,923,401 | 46,308,665 | ||||||
Class A | 13,667,182 | 27,700,028 | ||||||
Class B | 65,625,000 | — | ||||||
Class G | 13,542,728 | 13,542,728 | ||||||
|
|
|
| |||||
| 134,758,311 | 87,551,421 | |||||||
|
|
|
| |||||
As a part of the Scheme, the nominal value of share capital was proposed to be reduced by US$ 1,888,275 with a corresponding credit to share premium. The Scheme was approved by the Hon’ble Nicosia District Court on May 10, 2012 and filed with the Registrar of Companies on May 10, 2012.
16.2 Share premium
Proceeds received in addition to the nominal value of the ordinary shares and convertible preference shares classified as equity have been included in share premium.
The share premium comprises of the amounts as below:
| As at April 1, 2009 | As at March 31, 2010 | As at March 31, 2011 | As at March 31, 2012 | |||||||||||||
| (in US$) | ||||||||||||||||
Ordinary shares | 50,100 | 7,155,034 | 7,155,034 | 7,155,034 | ||||||||||||
Class A preference shares | 4,347,900 | 4,347,900 | 4,347,900 | 4,347,900 | ||||||||||||
Class B preference shares | — | 33,110,972 | 33,110,972 | 33,110,972 | ||||||||||||
Class G preference shares | — | 17,987,451 | 17,987,451 | 17,987,451 | ||||||||||||
|
|
|
|
|
|
|
| |||||||||
Total | 4,398,000 | 62,601,357 | 62,601,357 | 62,601,357 | ||||||||||||
|
|
|
|
|
|
|
| |||||||||
F-44
Table of Contents
TV18 HSN HOLDINGS LIMITED
NOTES TO THE CONSOLIDATED FINANCIAL STATEMENTS — (Continued)
17. Employee benefits expense
Expenses recognized for employee benefits are analyzed below:
| For the Year Ended March 31, 2010 | For the Year Ended March 31, 2011 | For the Year Ended March 31, 2012 | ||||||||||
| (in US$) | ||||||||||||
Salaries, wages, allowances and bonus | 3,231,247 | 4,397,614 | 7,345,852 | |||||||||
Employee share based payment expense | 881,491 | 1,354,917 | 569,121 | |||||||||
Staff welfare expenses | 76,531 | 136,320 | 190,933 | |||||||||
Contribution to defined contribution plans | 121,421 | 221,431 | 332,177 | |||||||||
Other employee benefits | 21,102 | 139,776 | 127,182 | |||||||||
|
|
|
|
|
| |||||||
Total | 4,331,792 | 6,250,058 | 8,565,265 | |||||||||
|
|
|
|
|
| |||||||
17.1 Share based employee remuneration
The Company has implemented an equity-settled employee share based payment arrangement by offering share options to the employees of its subsidiary company in India viz. TV18 Home Shopping Network Limited.
In 2008, the Company established a share option program in Cyprus, named the TV18 HSN Holdings Limited Employee Stock Option Plan, 2008 (“ESOP 2008”), which was approved by the shareholders of the Company vide shareholders resolution dated April 7, 2008. The ESOP 2008 entitles the eligible employees to purchase ordinary shares of the Company. A description of the share based payment arrangement of the Company is given below:
Particulars | TV18 HSN Holdings Limited Share Option Plan 2008 | |
Exercise price | The exercise price in respect of the options shall be decided by the Compensation Committee | |
Vesting conditions | Options granted till October 22, 2010: Graded vesting — 25% on the expiry of one year from the grant date, 25% on the expiry of two years from the grant date, 25% on the expiry of three years from the grant date and 25% on the expiry of four years from the grant date.
Options granted after October 22, 2010: Options will vest on the expiry of one year from the grant date. | |
Exercise Period | The options can be exercised within a period of 48 months from the date of vesting. | |
F-45
Table of Contents
TV18 HSN HOLDINGS LIMITED
NOTES TO THE CONSOLIDATED FINANCIAL STATEMENTS — (Continued)
The number and weighted average exercise price of share options are as follows:
Particulars | Options (nos.) | Weighted Average Exercise Price (US$) | ||||||
Year ended March 31, 2010 | ||||||||
Outstanding as at April 1, 2009 | 1,806,000 | 0.11 | ||||||
Granted | 98,000 | 0.43 | ||||||
Forfeited | 52,000 | 0.11 | ||||||
Exercised | — | |||||||
Outstanding as at March 31, 2010 | 1,852,000 | 0.13 | ||||||
Exercisable as at March 31, 2010 | 438,500 | 0.11 | ||||||
Weighted average remaining contractual life (in years) | 4.62 | |||||||
Year ended March 31, 2011 | ||||||||
Outstanding as at April 1, 2010 | 1,852,000 | 0.13 | ||||||
Granted | 619,000 | 0.09 | ||||||
Forfeited | 64,500 | 0.18 | ||||||
Exercised | 7,500 | 0.11 | ||||||
Outstanding as at March 31, 2011 | 2,399,000 | 0.12 | ||||||
Exercisable as at March 31, 2011 | 1,874,000 | 0.11 | ||||||
Weighted average remaining contractual life (in years) | 3.53 | |||||||
Year ended March 31, 2012 | ||||||||
Outstanding as at April 1, 2011 | 2,399,000 | 0.12 | ||||||
Granted | 45,000 | 0.10 | ||||||
Forfeited | 72,500 | 0.17 | ||||||
Exercised | 194,500 | 0.10 | ||||||
Outstanding as at March 31, 2012 | 2,177,000 | 0.12 | ||||||
Exercisable as at March 31, 2012 | 2,002,000 | 0.11 | ||||||
Weighted average remaining contractual life (in years) | 2.54 | |||||||
The weighted average equity value of the Company close to the date of options exercised during the year ended March 31, 2011 and March 31, 2012 was US$ 1.58 and US$ 2.33 respectively.
F-46
Table of Contents
TV18 HSN HOLDINGS LIMITED
NOTES TO THE CONSOLIDATED FINANCIAL STATEMENTS — (Continued)
The total amount to be expensed over the vesting period is determined by reference to the fair value of the options granted. The fair values of options granted were determined using Black-Scholes option pricing model that takes into account factors specific to the share incentive plans along with other external inputs. Expected volatility has been determined by reference to the average volatility for comparable companies for corresponding option term. The following principal assumptions were used in the valuation:
Year ended March 31, 2010
| Particulars | ||||||||||||||||
Grant Date | January 29, 2010 | |||||||||||||||
Vesting Date | January 29, 2011 | January 29, 2012 | January 29, 2013 | January 29, 2014 | ||||||||||||
Fair value of option at grant date (US$) | 1.30 | 1.32 | 1.34 | 1.36 | ||||||||||||
Weighted average equity value (US$) | 1.58 | 1.58 | 1.58 | 1.58 | ||||||||||||
Exercise price | 0.43 | 0.43 | 0.43 | 0.43 | ||||||||||||
Expected volatility | 72.62 | % | 68.79 | % | 66.64 | % | 64.63 | % | ||||||||
Option life (in years) | 5.00 | 6.00 | 7.00 | 8.00 | ||||||||||||
Dividend yield | 0 | % | 0 | % | 0 | % | 0 | % | ||||||||
Risk-free interest rate | 2.32 | % | 2.69 | % | 3.06 | % | 3.23 | % | ||||||||
Year ended March 31, 2011
| Particulars | ||||||||||||||||||||
Grant Date | August 4, 2010 | January 4, 2011 | ||||||||||||||||||
Vesting Date | August 4, 2011 | August 3, 2012 | August 3, 2013 | August 4, 2014 | January 4, 2012 | |||||||||||||||
Fair value of option at grant date | 2.06 | 2.06 | 2.06 | 2.07 | 2.11 | |||||||||||||||
Weighted average equity value (US$) | 2.13 | 2.13 | 2.13 | 2.13 | 2.20 | |||||||||||||||
Exercise price | 0.09 | 0.09 | 0.09 | 0.09 | 0.10 | |||||||||||||||
Expected volatility | 74.97 | % | 70.55 | % | 67.31 | % | 66.18 | % | 59.01 | % | ||||||||||
Option life (in years) | 5.00 | 6.00 | 7.00 | 8.00 | 5.00 | |||||||||||||||
Dividend yield | 0 | % | 0 | % | 0 | % | 0 | % | 0 | % | ||||||||||
Risk-free interest rate | 1.61 | % | 1.96 | % | 2.32 | % | 2.53 | % | 2.01 | % | ||||||||||
Year ended March 31, 2012
| Particulars | ||||||||
Grant Date | April 29, 2011 | February 29, 2011 | ||||||
Vesting Date | April 29, 2012 | February 29,2012 | ||||||
Fair value of option at grant date (US$) | 1.86 | 2.25 | ||||||
Weighted average equity value (US$) | 1.95 | 2.33 | ||||||
Exercise price | 0.10 | 0.09 | ||||||
Expected volatility | 57.93 | % | 59.35 | % | ||||
Option life (in years) | 5 | 5 | ||||||
Dividend yield | 0.00 | % | 0.00 | % | ||||
Risk-free interest rate | 1.97 | % | 0.77 | % | ||||
Note:The shareholders of the Company vide resolution dated October 26, 2010 altered the vesting and exercise period for options granted to 6 eligible employees (1,790,000 options). Accordingly, all options vested immediately and the eligible employees were permitted to exercise all the options granted to them within a period of 48 months from date of vesting.
F-47
Table of Contents
TV18 HSN HOLDINGS LIMITED
NOTES TO THE CONSOLIDATED FINANCIAL STATEMENTS — (Continued)
The modification did not result in any incremental fair value granted. For the purpose of determining how the incremental fair value was measured, following principal assumptions were used:
| Pre-modification | Post-modification | |||||||||||||||||||||||||||||||||||||||
Grant date | April 9, 2008 | August 4, 2010 | April 9, 2008 | August 4, 2010 | ||||||||||||||||||||||||||||||||||||
Modification date | October 22, 2010 | October 22, 2010 | ||||||||||||||||||||||||||||||||||||||
Equity value (US$) | 2.22 | 2.22 | 2.22 | 2.22 | 2.22 | 2.22 | 2.22 | 2.22 | 2.22 | 2.22 | ||||||||||||||||||||||||||||||
Exercise price (US$) | 0.11 | 0.11 | 0.11 | 0.11 | 0.43 | 0.43 | 0.43 | 0.43 | 0.11 | 0.43 | ||||||||||||||||||||||||||||||
Term (years) | 2.5 | 3.5 | 4.5 | 5.5 | 4.8 | 5.8 | 6.8 | 7.8 | 1.5 | 3.8 | ||||||||||||||||||||||||||||||
Volatility | 77.03 | % | 67.61 | % | 60.43 | % | 74.40 | % | 60.34 | % | 72.68 | % | 69.40 | % | 67.45 | % | 44.96 | % | 65.16 | % | ||||||||||||||||||||
Risk free Rate (US) | 0.43 | % | 0.67 | % | 0.98 | % | 1.31 | % | 1.08 | % | 1.42 | % | 1.78 | % | 2.04 | % | 0.27 | % | 0.77 | % | ||||||||||||||||||||
Dividend rate | 0 | % | 0 | % | 0 | % | 0 | % | 0 | % | 0 | % | 0 | % | 0 | % | 0 | % | 0 | % | ||||||||||||||||||||
17.2 Employee benefits obligations
The liabilities recognized for post-employment and other short term employee benefits in the statement of financial position consist of the following amounts:
| As at April 1, 2009 | As at March 31, 2010 | As at March 31, 2011 | As at March 31, 2012 | |||||||||||||
| (in US$) | ||||||||||||||||
Non-current: | ||||||||||||||||
Defined benefit plans | 11,648 | 33,080 | 62,077 | 108,747 | ||||||||||||
|
|
|
|
|
|
|
| |||||||||
| 11,648 | 33,080 | 62,077 | 108,747 | |||||||||||||
|
|
|
|
|
|
|
| |||||||||
Current: | ||||||||||||||||
Defined benefit plans | 32,032 | 36,739 | 88,382 | 102,499 | ||||||||||||
Other short-term employee benefits | 70,735 | 66,682 | 127,610 | 149,248 | ||||||||||||
|
|
|
|
|
|
|
| |||||||||
| 102,767 | 103,421 | 215,992 | 251,747 | |||||||||||||
|
|
|
|
|
|
|
| |||||||||
Total | 114,415 | 136,501 | 278,069 | 360,494 | ||||||||||||
|
|
|
|
|
|
|
| |||||||||
The current portion of these liabilities represents the Group’s obligations to its current and former employees that are expected to be settled during the period of 12 months following the statement of financial position date. Other short-term employee obligations arise from accrued holiday entitlement at the reporting date.
Defined benefit plans — Gratuity
The Group provides gratuity benefit to its employees working in India. The gratuity plan is a defined benefit plan that, at retirement or termination of employment, provides eligible employees with a lump sum payment, which is a function of the last drawn salary and completed years of service. The liability recognized in the statements of financial position in respect of gratuity plan is the present value of the defined benefit obligation at the year-end less the fair value of plan assets, if any, together with adjustments for unrecognized past–service costs. The defined benefit obligation is calculated annually by an independent actuary using projected unit credit method. The present value of the defined benefit obligation is determined by discounting the estimated future cash outflows based on management’s assumptions. This discount rate is based upon the market yield available on government bonds with a term that matches that of the liabilities. The salary increase takes into account inflation, seniority, promotion and other relevant factors.
F-48
Table of Contents
TV18 HSN HOLDINGS LIMITED
NOTES TO THE CONSOLIDATED FINANCIAL STATEMENTS — (Continued)
Changes in the present value of the defined benefit obligation with respect to gratuity are as follows:
| As at April 1, 2009 | As at March 31, 2010 | As at March 31, 2011 | As at March 31, 2012 | |||||||||||||
| (in US$) | ||||||||||||||||
Reconciliation of funded status | ||||||||||||||||
A. Change in benefit obligation | ||||||||||||||||
Opening balance of defined benefits obligations | 43,680 | 69,819 | 150,459 | |||||||||||||
Interest cost | 3,759 | 5,912 | 11,870 | |||||||||||||
Current service cost | 26,579 | 53,911 | 72,836 | |||||||||||||
Benefits paid | — | — | (1,330 | ) | ||||||||||||
Actuarial loss/(gain) | (10,783 | ) | 18,398 | 1,631 | ||||||||||||
Exchange difference | 6,584 | 2,419 | (24,220 | ) | ||||||||||||
|
|
|
|
|
|
|
| |||||||||
Closing balance of defined benefits obligations | 43,680 | 69,819 | 150,459 | 211,246 | ||||||||||||
|
|
|
|
|
|
|
| |||||||||
B. Defined benefit obligation (net) | 43,680 | 69,819 | 150,459 | 211,246 | ||||||||||||
|
|
|
|
|
|
|
| |||||||||
Classified as: | ||||||||||||||||
Non-current liability | 11,648 | 33,080 | 62,077 | 108,747 | ||||||||||||
Current liability | 32,032 | 36,739 | 88,382 | 102,499 | ||||||||||||
|
|
|
|
|
|
|
| |||||||||
C. Amounts recognized in the Statement of Comprehensive Income (Loss) | ||||||||||||||||
Current service cost | 26,579 | 53,911 | 72,836 | |||||||||||||
Interest cost | 3,759 | 5,912 | 11,870 | |||||||||||||
Total actuarial loss/ (gain) recognized in the year | (10,783 | ) | 18,398 | 1,631 | ||||||||||||
|
|
|
|
|
| |||||||||||
Expense recognized in the Statement of Comprehensive Income (Loss) | 19,555 | 78,221 | 86,337 | |||||||||||||
|
|
|
|
|
| |||||||||||
Interest costs have been included in ‘Finance costs’ (Refer note 20.2). All other expenses summarized above were included within ‘employee benefits expense.’
For determination of the gratuity obligation, the following actuarial assumptions were used:
| As at April 1, 2009 | As at March 31, 2010 | As at March 31, 2011 | As at March 31, 2012 | |||||||||||||
Discount rate | 7 | % | 8 | % | 8 | % | 8.50 | % | ||||||||
Expected rate of salary increases | 6 | % | 6 | % | 6 | % | 6 | % | ||||||||
Average life expectancy (years) | | As per mortality table of Life Insurance Corporation of India (1994-96), duly modified | | |||||||||||||
F-49
Table of Contents
TV18 HSN HOLDINGS LIMITED
NOTES TO THE CONSOLIDATED FINANCIAL STATEMENTS — (Continued)
18. Other operating expenses
| For the Year Ended March 31, 2010 | For the Year Ended March 31, 2011 | For the Year Ended March 31, 2012 | ||||||||||
| (in US$) | ||||||||||||
Contracted media professionals fees | 572,599 | 838,749 | 937,392 | |||||||||
Show production expenses | 43,352 | 155,542 | 134,525 | |||||||||
Production consumables | 107,276 | 86,842 | 71,315 | |||||||||
Studio equipment and costume hire charges | 110,370 | 218,261 | 181,039 | |||||||||
Uplinking expenses | 345,419 | 365,921 | 344,355 | |||||||||
Website development expenses | 49,079 | 13,802 | 71,998 | |||||||||
Rent expense | 944,523 | 1,458,732 | 1,531,930 | |||||||||
Communication expenses | 605,630 | 1,000,113 | 1,248,762 | |||||||||
Travelling and conveyance | 501,244 | 973,954 | 1,243,446 | |||||||||
Loss on exchange rate fluctuation (net) | 342 | —�� | — | |||||||||
Repairs and maintenance | 433,959 | 796,461 | 951,804 | |||||||||
Legal and professional | 296,792 | 605,958 | 508,589 | |||||||||
Electricity expense | 213,106 | 343,164 | 420,390 | |||||||||
Insurance | 53,204 | 81,534 | 109,308 | |||||||||
Miscellaneous expenses | 211,415 | 418,787 | 527,147 | |||||||||
|
|
|
|
|
| |||||||
Total | 4,488,310 | 7,357,820 | 8,282,000 | |||||||||
|
|
|
|
|
| |||||||
19. Trade payables and other current liabilities
19.1 Trade payables
Trade payables are summarized as follows:
| As at April 1, 2009 | As at March 31, 2010 | As at March 31, 2011 | As at March 31, 2012 | |||||||||||||
| (in US$) | ||||||||||||||||
Consideration collected on behalf of vendors for sales to customers | 3,368,941 | 3,603,727 | 910,200 | 2,053,016 | ||||||||||||
Other trade payables | 2,319,951 | 1,038,914 | 1,758,784 | 4,211,512 | ||||||||||||
|
|
|
|
|
|
|
| |||||||||
Total | 5,688,892 | 4,642,641 | 2,668,984 | 6,264,528 | ||||||||||||
|
|
|
|
|
|
|
| |||||||||
19.2 Other current liabilities
Other current liabilities are summarized as follows:
| As at April 1, 2009 | As at March 31, 2010 | As at March 31, 2011 | As at March 31, 2012 | |||||||||||||
| (in US$) | ||||||||||||||||
Provision for expenses | 1,384,183 | 2,635,560 | 3,607,031 | 3,666,158 | ||||||||||||
Advance from customers | 133,089 | 143,628 | 22,396 | 141,096 | ||||||||||||
Statutory dues | 111,159 | 119,249 | 222,047 | 349,414 | ||||||||||||
Employee dues | 22,770 | 33,090 | 37,102 | 33,313 | ||||||||||||
Provision for wealth tax and fringe benefits tax | 13,755 | 6,020 | 6,060 | 5,605 | ||||||||||||
Miscellaneous liabilities | 361,427 | 173,743 | 218,584 | 210,345 | ||||||||||||
|
|
|
|
|
|
|
| |||||||||
Total | 2,026,383 | 3,111,290 | 4,113,220 | 4,405,931 | ||||||||||||
|
|
|
|
|
|
|
| |||||||||
F-50
Table of Contents
TV18 HSN HOLDINGS LIMITED
NOTES TO THE CONSOLIDATED FINANCIAL STATEMENTS — (Continued)
The carrying value of trade payables and other current liabilities is considered a reasonable approximation of fair value.
20. Finance income and finance costs
20.1 Finance income
Finance income is analyzed as follows:
| For the Year Ended March 31, 2010 | For the Year Ended March 31, 2011 | For the Year Ended March 31, 2012 | ||||||||||
| (in US$) | ||||||||||||
Interest income from deposits with banks | 507,580 | 1,037,757 | 119,958 | |||||||||
Interest income from financial assets carried at amortized cost | 47,605 | 65,303 | 819,354 | |||||||||
Others | 54,508 | 56,460 | 153,417 | |||||||||
Total interest income for financial assets not carried at fair value through profit or loss | 609,693 | 1,159,520 | 1,092,729 | |||||||||
Gain on fair valuation of financial assets classified as held for trading | 120,524 | — | — | |||||||||
|
|
|
|
|
| |||||||
Total | 730,217 | 1,159,520 | 1,092,729 | |||||||||
|
|
|
|
|
| |||||||
20.2 Finance costs
Finance costs are analyzed as follows:
| For the Year Ended March 31, 2010 | For the Year Ended March 31, 2011 | For the Year Ended March 31, 2012 | ||||||||||
| (in US$) | ||||||||||||
Interest expenses for borrowings at amortized cost | 3,619,024 | 26,200 | 858,870 | |||||||||
Finance costs on employee benefit obligations | 3,759 | 5,912 | 11,870 | |||||||||
Bank charges | 10,032 | 18,914 | 13,572 | |||||||||
Loss on fair valuation of embedded derivative (Refer note below) | 4,780,000 | — | — | |||||||||
|
|
|
|
|
| |||||||
Total | 8,412,815 | 51,026 | 884,312 | |||||||||
|
|
|
|
|
| |||||||
Note:
As mentioned in Note 9.5 above, the conversion feature embedded in Class B preference share is a derivative financial liability which was initially measured at fair value and subsequent fair value changes up to the date of fixing of conversion ratio of Class B preference shares into Class A preference shares and ordinary shares during the year ended March 31, 2010, was recognized in the Statement of Comprehensive Income (Loss).
F-51
Table of Contents
TV18 HSN HOLDINGS LIMITED
NOTES TO THE CONSOLIDATED FINANCIAL STATEMENTS — (Continued)
21. Income tax expense
Tax expense reported in Statement of Comprehensive Income (Loss) for the years ended March 31, 2010, March 31, 2011 and March 31, 2012 is as follows:
| For the Year Ended March 31, 2010 | For the Year Ended March 31, 2011 | For the Year Ended March 31, 2012 | ||||||||||
| (in US$) | ||||||||||||
Current tax expense | 2,490 | 1,489 | — | |||||||||
|
|
|
|
|
| |||||||
Total | 2,490 | 1,489 | — | |||||||||
|
|
|
|
|
| |||||||
The relationship between the expected tax expense based on the domestic effective tax rate of the Company at 10% for the years ended March 31, 2010, March 31, 2011 and March 31, 2012 respectively and the reported tax expense in Statement of Comprehensive Income (Loss) can be reconciled as follows:
| For the Year Ended March 31, 2010 | For the Year Ended March 31, 2011 | For the Year Ended March 31, 2012 | ||||||||||
| (in US$) | ||||||||||||
Loss before tax | 15,074,874 | 13,133,758 | (22,542,493 | ) | ||||||||
Tax rate | 10 | % | 10 | % | 10 | % | ||||||
|
|
|
|
|
| |||||||
Expected tax benefit | (1,507,487 | ) | (1,313,376 | ) | (2,254,249 | ) | ||||||
Effect of tax rates in foreign jurisdictions | (1,683,540 | ) | (2,928,660 | ) | (5,044,095 | ) | ||||||
Expenses not deductible for tax purposes | 1,116,586 | 604,297 | 222,821 | |||||||||
Unabsorbed tax losses, depreciation and deductible temporary differences for which no deferred tax asset was recognized | 2,076,931 | 3,639,228 | 7,075,523 | |||||||||
Actual tax expense | 2,490 | 1,489 | — | |||||||||
|
|
|
|
|
| |||||||
22. Loss per share
Basic loss per share has been calculated using the loss attributable to shareholders of the parent company as the numerator. The following is the reconciliation of the loss attributable to ordinary shareholders used in the computation of basic loss per share for the years ended March 31, 2010, 2011 and 2012:
Particulars | Year Ended March 31, 2010 | Year Ended March 31, 2011 | Year Ended March 31, 2012 | |||||||||
Loss after tax | (15,077,364 | ) | (12,678,150 | ) | (22,542,493 | ) | ||||||
Loss attributable to holders of participating equity instruments — Class A and Class G preference shares | (4,838,883 | ) | (4,989,944 | ) | (8,872,412 | ) | ||||||
Loss attributable to ordinary shareholders | (10,238,481 | ) | (7,688,206 | ) | (13,670,081 | ) | ||||||
The weighted average number of ordinary shares outstanding during the reporting period used as the denominator in computation of basic loss per share is as follows:
Particulars | Year Ended March 31, 2010 | Year Ended March 31, 2011 | Year Ended March 31, 2012 | |||||||||
Weighted average number of ordinary shares outstanding | 38,339,462 | 41,923,401 | 41,923,401 | |||||||||
As at March 31, 2012, 2,177,000 employee share options (March 31, 2011: 2,399,000 and March 31, 2010: 1,852,000), 3,335,698 convertible warrants (March 31, 2011: Nil and March 31, 2010: Nil), 13,667,182 Class A
F-52
Table of Contents
TV18 HSN HOLDINGS LIMITED
NOTES TO THE CONSOLIDATED FINANCIAL STATEMENTS — (Continued)
preference shares (March 31, 2011: 13,667,182 and March 31, 2010: 13,667,182), 65,625,000 Class B preference shares (March 31, 2011: 65,625,000 and March 31, 2010: 65,625,000) and 13,542,728 Class G preference shares (March 31, 2011: 13,542,728 and March 31, 2010: 13,542,728) were excluded from the weighted average number of potential ordinary shares used for the calculation of diluted loss per share as their effect would have been anti-dilutive. Accordingly, the numerator used for calculating diluted earnings per share has not been adjusted.
The following table summarizes the potential ordinary share transactions that occurred after the respective reporting periods and that would have changed the number of potential ordinary shares of the Company outstanding at the end of the respective periods by more than 1% if those transactions had occurred before the end of the respective reporting periods:
Particulars | After March 31, 2010 | After March 31, 2011 | After March 31, 2012 | |||||||||
Convertible warrants classified as equity instruments | — | 1,500,000 | — | |||||||||
Convertible warrants classified as financial liability | — | 1,835,698 | — | |||||||||
|
|
|
|
|
| |||||||
| — | 3,335,698 | — | ||||||||||
|
|
|
|
|
| |||||||
23. Related party transactions
The Group’s related parties include:
| (i) | Person that has significant influence over the Group, |
| (ii) | Key management personnel, |
| (iii) | Entities exercising joint control over the Group (including entities exercising control on such entities), |
| (iv) | Entities exercising significant influence over the Group (including entities exercising control on such entities), |
| (v) | Entities which are jointly controlled by entities mentioned at (iii) above |
| (vi) | Entities under significant influence of entities mentioned at (iii) above |
| (vii) | Entities controlled or jointly controlled by persons mentioned at (i) and (ii) above |
| (viii) | Post-employment benefit plans of entities related to the Group mentioned at (iii) to (vii) above |
Outstanding balances are usually settled in cash. Unless otherwise specified, loans and advances recoverable from related parties are unsecured and are repayable on demand.
Transactions with KMPs
| For the Year Ended March 31, 2010 | For the Year Ended March 31, 2011 | For the Year Ended March 31, 2012 | ||||||||||
| (in US$) | ||||||||||||
Salaries including bonuses* | 789,211 | 641,346 | 926,799 | |||||||||
Contribution to defined contribution plans | 27,210 | 19,040 | 26,780 | |||||||||
Share based payments | 711,243 | 698,098 | — | |||||||||
|
|
|
|
|
| |||||||
Total | 1,527,664 | 1,358,484 | 953,579 | |||||||||
|
|
|
|
|
| |||||||
| * | Does not include gratuity and compensated absences as these are provided for the Group as a whole and hence individual figures cannot be determined |
F-53
Table of Contents
TV18 HSN HOLDINGS LIMITED
NOTES TO THE CONSOLIDATED FINANCIAL STATEMENTS — (Continued)
Transactions with entities exercising joint control or significant influence over the Group (including entities exercising control on such entities)
| For the Year Ended March 31, 2010 | For the Year Ended March 31, 2011 | For the Year Ended March 31, 2012 | ||||||||||
| (in US$) | ||||||||||||
Commission on sale of products | 1,068 | — | — | |||||||||
Reimbursement of expenses (received) | 57,348 | 61,295 | 47,407 | |||||||||
Reimbursement of expenses (paid) | 144,114 | 197,918 | 131,132 | |||||||||
Expenditure for services received | 10,090 | 4,523 | 12,121 | |||||||||
Reclassification of Class B preference shares into Class A preference shares and ordinary shares due to fixing of conversion ratio | 35,735,972 | — | — | |||||||||
Finance costs in respect of Class B preference shares | 7,982,002 | — | — | |||||||||
Issue of preference shares (including share premium) | 18,558,387 | — | — | |||||||||
Issue of ordinary shares (including share premium) | 7,332,970 | — | — | |||||||||
Issue of convertible warrants classified as equity | — | — | 7,077,930 | |||||||||
Issue of convertible warrants classified as financial liability (including derivative component) | — | — | 777,637 | |||||||||
Loans taken | — | — | 15,928,928 | |||||||||
Loans repaid | — | — | 5,195,345 | |||||||||
Interest on loan taken | — | — | 785,191 | |||||||||
Interest income on subscription amount receivable in respect of convertible instruments issued | — | — | 747,496 | |||||||||
Transactions with other related parties
| For the Year Ended March 31, 2010 | For the Year Ended March 31, 2011 | For the Year Ended March 31, 2012 | ||||||||||
| (in US$) | ||||||||||||
Commission on sale of products | 1,485,322 | 1,628,727 | 161,637 | |||||||||
Finance income | 54,508 | 56,460 | 53,638 | |||||||||
Purchase of asset | 71,896 | 48,115 | — | |||||||||
Reimbursement of expenses (received) | 747,879 | 716,398 | 13,856 | |||||||||
Reimbursement of expenses (paid) | 339,272 | 206,389 | 238,979 | |||||||||
Amount collected on behalf of | 7,545,776 | 7,644,956 | 413,255 | |||||||||
Expenditure for services received | 4,221,006 | 3,540,179 | 3,544,340 | |||||||||
Loans taken | 21,115 | — | — | |||||||||
Loans repaid | 21,115 | — | — | |||||||||
F-54
Table of Contents
TV18 HSN HOLDINGS LIMITED
NOTES TO THE CONSOLIDATED FINANCIAL STATEMENTS — (Continued)
Balances at the year end — entities exercising joint control or significant influence over the Group (including entities exercising control on such entities)
| As at April 1, 2009 | As at March 31, 2010 | As at March 31, 2011 | As at March 31, 2012 | |||||||||||||
| (in US$) | ||||||||||||||||
Advances recoverable | — | 25,378 | 16,778 | 46,094 | ||||||||||||
Trade payables | 28,107 | 46,502 | 59,889 | 132,581 | ||||||||||||
Corporate guarantees given to Group | 4,906,771 | — | — | — | ||||||||||||
Ordinary shares (including share premium) | 1,499,000 | 8,831,970 | 8,831,970 | 8,831,970 | ||||||||||||
Convertible preference shares classified as equity (including share premium) | 4,865,360 | 59,159,720 | 59,159,720 | 59,159,720 | ||||||||||||
Convertible preference shares classified as financial liability | 27,753,970 | — | — | — | ||||||||||||
Convertible warrants classified as equity (net of subscription amount receivable) | — | — | — | 7,077,930 | ||||||||||||
Convertible warrants classified as financial liability (including derivative liability) | — | — | — | 777,637 | ||||||||||||
Loans taken (including interest accrued thereon) | — | — | — | 10,707,022 | ||||||||||||
Interest accrued on subscription amount receivable in respect of convertible instruments issued | — | — | — | 747,496 | ||||||||||||
Balances at the year end — other related parties
| As at | As at | As at | As at | |||||||||||||
| April 1, 2009 | March 31, 2010 | March 31, 2011 | March 31, 2012 | |||||||||||||
| (in US$) | ||||||||||||||||
Loans | 561,315 | 647,645 | 654,752 | 571,574 | ||||||||||||
Advances recoverable | 16,224 | 51,226 | 280,008 | 57,143 | ||||||||||||
Trade payables | 2,273,892 | 761,859 | 432,773 | 2,548,684 | ||||||||||||
24. Financial instrument risks
The Group is exposed to various risks in relation to financial instruments. The Group’s financial assets and liabilities by category are summarized in note 9. The main types of risks are market risk, credit risk and liquidity risk.
The Group’s risk management is coordinated at its headquarters, in close co-operation with the board of directors, and focuses on securing the Group’s short to medium term cash flows. The Group does not engage in trading of financial assets for speculative purposes.
Interest rate sensitivity
A majority of financing of the Group has come from a mix of ordinary, convertible preference shares with nominal dividends, convertible warrants and term loans from banks. Term loans from banks outstanding as at April 1, 2009 are variable interest rate instruments. Further, the only interest bearing financial assets held by the Group are fixed deposits with banks. Such deposits bear a fixed rate of interest.
For variable interest rate liabilities, the analysis is prepared assuming the amount of liability outstanding at the balance sheet date was outstanding for the whole year.
F-55
Table of Contents
TV18 HSN HOLDINGS LIMITED
NOTES TO THE CONSOLIDATED FINANCIAL STATEMENTS — (Continued)
An increase of one hundred basis points in interest rates at the reporting date would have increased deficit as on April 1, 2009 by US$ 29,127 and loss for the year ended March 31, 2012 by US$ 100,958. This analysis assumes that all other variables remain constant. A decrease of one hundred basis points in the interest rates at the reporting date would have had equal but opposite effect, on the basis that all other variables remain constant. There are no floating rate liabilities as on March 31, 2010 and 2011.
A one hundred basis point rise or fall in interest rates represents a large but realistic movement which can easily be multiplied to give sensitivities at different interest rates.
The sensitivity analysis provided are hypothetical only and should be used with caution as the impacts provided are not necessarily indicative of the actual impacts that would be experienced because the Group’s actual exposure to market rates changes as the Group’s portfolio of debt, cash and foreign currency contracts changes. In addition, the effect of a change in a particular market variable on fair values or cash flows is calculated without considering interrelationships between the various market rates or mitigating actions that would be taken by the Group. The changes in valuations are estimates of the impact of changes in market variables and are not a prediction of future events or anticipated gains or losses.
Price Risk Sensitivity
For the mutual funds, an average volatility of 7% and 5% respectively has been observed during the years ended March 31, 2009 and March 31, 2010 (based on CRISIL Composite Bond Fund Index). This volatility figure is considered to be a suitable basis for estimating how Statement of Comprehensive Income (Loss) and equity would have been affected by changes in market risk that were reasonably possible at the reporting date. If the prices of underlying securities increased or decreased by 7%, equity as on April 1, 2009 would have changed by US$ 111,968. Similarly, if the prices of underlying securities increased or decreased by 5%, loss for the year ended March 31, 2010 and equity as on that date would have changed by US$ 44,160.
In respect of conversion option in Class B preference shares,
| • | A 5% change in volatility would have resulted in approximate change in deficit as on April 1, 2009 by US$ 415,000 |
| • | A 5% change in equity value of the Company would have resulted in approximate change in deficit as on April 1, 2009 by US$ 430,000 |
| • | A 5% change in risk-free interest rate would not have resulted in any significant change in deficit as on April 1, 2009 |
In respect of liability component of Class B preference shares, a change of 100 basis points in interest rates would have changed its fair value by approximately US$ 450,000.
In respect of conversion feature in convertible warrants, since those instruments were issued close to the end of the reporting period i.e. on March 16, 2012, a change in assumptions used for fair valuation would not have significantly changed the loss for the year ended March 31, 2012 or deficit as on that date.
Credit risk analysis
Credit risk is the risk that counterparty fails to discharge an obligation to the Group. The Group’s financial assets which could expose it to credit risk primarily include trade receivables, receivables from courier agencies, loans, advances recoverable and cash and cash equivalents.
F-56
Table of Contents
TV18 HSN HOLDINGS LIMITED
NOTES TO THE CONSOLIDATED FINANCIAL STATEMENTS — (Continued)
The Group’s maximum exposure to credit risk is limited to the carrying amount of financial assets recognized at reporting date:
| As at April 1, 2009 | As at March 31, 2010 | As at March 31, 2011 | As at March 31, 2012 | |||||||||||||
| (in US$) | ||||||||||||||||
Trade receivables | 495,176 | 893,393 | 639,087 | 1,100,339 | ||||||||||||
Receivables from courier agencies | 1,905,803 | 2,938,700 | 2,846,108 | 4,196,613 | ||||||||||||
Security deposits | 315,826 | 500,588 | 511,895 | 489,797 | ||||||||||||
Loans | 561,315 | 647,645 | 654,752 | 571,574 | ||||||||||||
Advances recoverable | 390,591 | 351,412 | 1,337,084 | 3,581,142 | ||||||||||||
Fixed deposits with banks | — | 21,464,317 | 5,900,132 | 680,176 | ||||||||||||
Cash and cash equivalents (except cash on hand) | 5,663,346 | 1,304,038 | 1,862,270 | 1,447,959 | ||||||||||||
|
|
|
|
|
|
|
| |||||||||
Total | 9,332,057 | 28,100,093 | 13,751,328 | 12,067,600 | ||||||||||||
|
|
|
|
|
|
|
| |||||||||
Trade receivables and receivables from courier agencies
Exposure to credit risk in respect of outstanding trade receivables is limited since the consideration for sales from vendors to customers is collected by the Group (through courier agencies or payment gateways provided on Group’s website) on behalf of the vendors (related payables are included in note 19.1 ‘Trade payables’) and accordingly the commission on products sold through its distribution channels is received in advance. The residual credit risk is on account of consideration for sales from vendors to customers which is collected by the courier agencies but not yet remitted to the Group at the year-end. The Group has not experienced any default in recovery from these courier agencies.
The Group’s maximum exposure to credit risk is limited to the carrying amount of financial assets recognized at the reporting date.
An analysis of age of trade receivables at each statement of financial position date is summarized as follows:
| As at April 1, 2009 | As at March 31, 2010 | As at March 31, 2011 | As at March 31, 2012 | |||||||||||||||||||||||||||||
| Gross | Impairment | Gross | Impairment | Gross | Impairment | Gross | Impairment | |||||||||||||||||||||||||
| (in US$) | ||||||||||||||||||||||||||||||||
Not past due | 418,872 | — | 360,139 | — | 395,305 | — | 1,054,814 | — | ||||||||||||||||||||||||
Past due less than 6 months | 87,723 | (11,419 | ) | 543,714 | (13,586 | ) | 257,462 | (13,680 | ) | 53,827 | (11,249 | ) | ||||||||||||||||||||
Past due more than six months but not more than twelve months | — | — | — | — | — | — | — | — | ||||||||||||||||||||||||
More than one year | 5,420 | (5,420 | ) | 8,546 | (5,420 | ) | 5,420 | (5,420 | ) | 8,367 | (5,420 | ) | ||||||||||||||||||||
|
|
|
|
|
|
|
|
|
|
|
|
|
|
|
| |||||||||||||||||
| 512,015 | (16,839 | ) | 912,399 | (19,006 | ) | 658,187 | (19,100 | ) | 1,117,008 | (16,669 | ) | |||||||||||||||||||||
|
|
|
|
|
|
|
|
|
|
|
|
|
|
|
| |||||||||||||||||
F-57
Table of Contents
TV18 HSN HOLDINGS LIMITED
NOTES TO THE CONSOLIDATED FINANCIAL STATEMENTS — (Continued)
An analysis of age of receivables from courier agencies at each statement of financial position date is summarized as follows:
| As at April 1, 2009 | As at March 31, 2010 | As at March 31, 2011 | As at March 31, 2012 | |||||||||||||||||||||||||||||
| Gross | Impairment | Gross | Impairment | Gross | Impairment | Gross | Impairment | |||||||||||||||||||||||||
| (in US$) | ||||||||||||||||||||||||||||||||
Not past due | 1,502,088 | — | 1,132,715 | — | 1,715,836 | — | 3,962,948 | — | ||||||||||||||||||||||||
Past due less than 6 months | 403,715 | — | 1,805,985 | — | 1,130,272 | — | 233,665 | — | ||||||||||||||||||||||||
|
|
|
|
|
|
|
|
|
|
|
|
|
|
|
| |||||||||||||||||
| 1,905,803 | — | 2,938,700 | — | 2,846,108 | — | 4,196,613 | — | |||||||||||||||||||||||||
|
|
|
|
|
|
|
|
|
|
|
|
|
|
|
| |||||||||||||||||
The amounts collected by courier agencies are considered past due after they are outstanding beyond the remittance cycle, as applicable, which varies from case to case. Trade receivables are impaired in full when recoverability is considered doubtful based on estimates made by management.
Commission on sale of products receivable from the top three courier agencies amounted to US$ 410,680, US$ 903,360, US$ 629,150 and US$ 1,042,720 also constituting 97%, 99%, 96% and 93% of trade receivables as at April 1, 2009, March 31, 2010, March 31, 2011 and March 31, 2012 respectively.
Receivables from top three courier agencies on account of collections made but not remitted to the Group amounted to US$ 1,886,366, US$ 2,910,267, US$ 2,803,430 and US$ 4,037,192 also constituting 97%, 99%, 99% and 96% of such receivables as at April 1, 2009, March 31, 2010, March 31, 2011 and March 31, 2012 respectively.
Management considers the credit quality of trade receivables and receivables from courier agencies that are not past due or not impaired to be good. No collateral is held for trade receivables and receivables from courier agencies.
Loans and advances recoverable
Loans and advances recoverable are given in the ordinary course of business. Credit risk in loans and advances recoverable is managed through monitoring of creditworthiness of the counterparties and by granting credit approvals in the normal course of the business.
All the loans and advances recoverable are not past due as at the respective year-ends. Loans and advances are considered past due in accordance with the contractual terms negotiated with the respective counterparties. Loans and advances recoverable are impaired in full when recoverability is considered doubtful based on estimates made by management.
Loan outstanding at each date of statement of financial position is recoverable from one counterparty. Advances recoverable from top three vendors whose products are sold through the Group’s channels amounted to US$ 2,521,867 also constituting 70% of advances recoverable as at March 31, 2012. As at April 1, 2009, March 31, 2010 and March 31, 2011, the Group is not exposed to any significant credit risk exposure to any single counterparty or any group of counterparties having similar characteristics.
Management considers the credit quality of loans and advances that are not past due or not impaired to be good. No collateral is held for loans and advances recoverable.
F-58
Table of Contents
TV18 HSN HOLDINGS LIMITED
NOTES TO THE CONSOLIDATED FINANCIAL STATEMENTS — (Continued)
Cash and cash equivalents (except cash on hand) and fixed deposits with banks
The management considers the credit quality of current accounts and deposits with banks to be good and reviews the banking relationships on an on–going basis.
The Group does not require any security in respect of the above financial assets. There are no impairment provisions as at each statement of financial position date against these financial assets, except as disclosed in respect of trade receivables above. The management considers that all the above financial assets that are not impaired or past due for each of the statement of financial position dates under review are of good credit quality.
Liquidity risk analysis
Liquidity risk is the risk that the Group might be unable to meet its obligations. Liquidity needs of the Group are monitored on the basis of monthly and yearly projections. The Group manages its liquidity needs by continuously monitoring scheduled debt servicing payments for long-term financial liabilities as well as forecast cash inflows and outflows due in day-to-day business. Liquidity needs are monitored in various time bands, on a day-to-day and week-to-week basis, as well as on the basis of a rolling 30-day projection.
Long-term liquidity needs for a 180-day and a 360-day lookout period are identified monthly. Net cash requirement are compared to available borrowing facilities in order to determine headroom or any shortfalls. This analysis shows if the available borrowings are expected to be sufficient over the lookout period.
Short term liquidity requirements comprises mainly of trade payables and employee dues arising during normal course of business as on each statement of financial position date. The Group maintains a minimum of sixty days of short term liquidity requirements in cash and cash equivalents and short term investments. Long term liquidity requirement is assessed by the management on periodical basis and is managed through internal accruals and through funding commitments from shareholders.
As at each statement of financial position date, the Group’s liabilities having contractual maturities (including interest payments where applicable) are summarized as follows:
As at April 1, 2009:
| Carrying Amount | Contractual Cash Flows | 6 Months or Less | 6-12 Months | 1-5 Years | ||||||||||||||||
| (in US$) | ||||||||||||||||||||
Non-derivative liabilities | ||||||||||||||||||||
Loans and borrowings@ | 26,364,210 | 3,809,470 | 221,410 | 220,200 | 3,367,860 | |||||||||||||||
Trade payables | 5,688,892 | 5,688,892 | 5,688,892 | — | — | |||||||||||||||
Bank overdraft | 5,348 | 5,348 | 5,348 | — | — | |||||||||||||||
Other current liabilities (excluding advance from customers, statutory dues, employee dues and provision for wealth and fringe benefits tax) | 1,592,020 | 1,592,020 | 1,592,020 | — | — | |||||||||||||||
|
|
|
|
|
|
|
|
|
| |||||||||||
Total | 33,650,470 | 11,095,730 | 7,507,670 | 220,200 | 3,367,860 | |||||||||||||||
|
|
|
|
|
|
|
|
|
| |||||||||||
Derivative financial liabilities@ | 4,340,000 | — | — | — | — | |||||||||||||||
|
|
|
|
|
|
|
|
|
| |||||||||||
| @ | Refer note 9.5 on Class B preference shares. Since the instrument is convertible into ordinary shares and Class A preference shares of the Company, the carrying amount has not been considered in the contractual cash flows. |
F-59
Table of Contents
TV18 HSN HOLDINGS LIMITED
NOTES TO THE CONSOLIDATED FINANCIAL STATEMENTS — (Continued)
As at March 31, 2010:
| Carrying Amount | Contractual Cash Flows | 6 Months or Less | 6-12 Months | 1-5 Years | ||||||||||||||||
| (in US$) | ||||||||||||||||||||
Non-derivative liabilities | ||||||||||||||||||||
Loans and borrowings | 32,456 | 32,456 | 10,818 | — | 21,638 | |||||||||||||||
Trade payables | 4,642,641 | 4,642,641 | 4,642,641 | — | — | |||||||||||||||
Bank overdraft | 1,160,080 | 1,160,080 | 1,160,080 | — | — | |||||||||||||||
Other current liabilities (excluding advance from customers, statutory dues, employee dues and provision for wealth and fringe benefits tax) | 2,655,713 | 2,655,713 | 2,655,713 | — | — | |||||||||||||||
|
|
|
|
|
|
|
|
|
| |||||||||||
Total | 8,490,890 | 8,490,890 | 8,469,252 | — | 21,638 | |||||||||||||||
|
|
|
|
|
|
|
|
|
| |||||||||||
Derivative financial liabilities | — | — | — | — | — | |||||||||||||||
|
|
|
|
|
|
|
|
|
| |||||||||||
As at March 31, 2011:
| Carrying Amount | Contractual Cash Flows | 6 Months or Less | 6-12 Months | 1-5 Years | ||||||||||||||||
| (in US$) | ||||||||||||||||||||
Non-derivative liabilities | ||||||||||||||||||||
Loans and borrowings | 21,727 | 21,727 | — | — | 21,727 | |||||||||||||||
Trade payables | 2,668,984 | 2,668,984 | 2,668,984 | — | — | |||||||||||||||
Bank overdraft | 565,635 | 565,635 | 565,635 | — | — | |||||||||||||||
Other current liabilities (excluding advance from customers, statutory dues, employee dues and provision for wealth and fringe benefits tax) | 3,672,025 | 3,672,025 | 3,672,025 | — | — | |||||||||||||||
|
|
|
|
|
|
|
|
|
| |||||||||||
Total | 6,928,371 | 6,928,371 | 6,906,644 | — | 21,727 | |||||||||||||||
|
|
|
|
|
|
|
|
|
| |||||||||||
Derivative financial liabilities | — | — | — | — | — | |||||||||||||||
|
|
|
|
|
|
|
|
|
| |||||||||||
As at March 31, 2012:
| Carrying Amount | Contractual Cash Flows | 6 Months or Less | 6-12 Months | 1-5 Years | ||||||||||||||||
| (in US$) | ||||||||||||||||||||
Non-derivative liabilities | ||||||||||||||||||||
Loans and borrowings* | 11,313,068 | 10,926,343 | 7,401,717 | 3,524,626 | — | |||||||||||||||
Trade payables | 6,264,528 | 6,264,528 | 6,264,528 | — | — | |||||||||||||||
Bank overdraft | 575,736 | 575,736 | 575,736 | — | — | |||||||||||||||
Other current liabilities (excluding advance from customers, statutory dues, employee dues and provision for wealth and fringe benefits tax) | 3,722,913 | 3,722,913 | 3,576,314 | 146,599 | — | |||||||||||||||
|
|
|
|
|
|
|
|
|
| |||||||||||
Total | 21,876,245 | 21,489,520 | 17,818,295 | 3,671,225 | — | |||||||||||||||
|
|
|
|
|
|
|
|
|
| |||||||||||
Derivative financial liabilities* | 180,000 | — | — | — | — | |||||||||||||||
|
|
|
|
|
|
|
|
|
| |||||||||||
| * | Refer note 9.5 on convertible warrants. Since the instrument is convertible into Class A preference shares of the Company, the carrying amount has not been considered in the contractual cash flows. |
F-60
Table of Contents
TV18 HSN HOLDINGS LIMITED
NOTES TO THE CONSOLIDATED FINANCIAL STATEMENTS — (Continued)
25. Capital management policies and procedures
The Group’s capital management objectives are:
| a) | to ensure the Group’s ability to continue as a going concern and |
| b) | to provide an adequate return to shareholders. |
The Group monitors capital on the basis of the carrying amount of equity, convertible financial instruments, derivatives embedded in those convertible financial instruments and term loans from related parties. The Group manages the capital structure and makes adjustments to it in the light of changes in economic conditions and the risk characteristics of the underlying assets.
| As at April 1, 2009 | As at March 31, 2010 | As at March 31, 2011 | As at March 31, 2012 | |||||||||||||
Equity (deficit) | (22,294,692 | ) | 26,006,930 | 14,721,897 | (1,304,204 | ) | ||||||||||
Convertible instruments | 23,413,970 | — | — | 597,637 | ||||||||||||
Derivative financial liabilities | 4,340,000 | — | — | 180,000 | ||||||||||||
Term loans from related parties | — | — | — | 10,707,022 | ||||||||||||
|
|
|
|
|
|
|
| |||||||||
| 5,459,278 | 26,006,930 | 14,721,897 | 10,180,455 | |||||||||||||
|
|
|
|
|
|
|
| |||||||||
Since its inception, the Group has been focusing on building platforms for vendors for distribution of consumer goods. Group has invested significantly in setting up the infrastructure and its corporate brand. Accordingly, being in its early stages, the Group has experienced operating losses and negative cash flows from operations. However, the ultimate majority shareholder, Network18 Media & Investments Limited, has assured continued financial support to the Group for the foreseeable future and based on that financial support, these financial statements have been prepared on a going concern basis.
26. Events subsequent to reporting period:
| a. | The subsidiary company has entered into an arrangement with a bank on April 23, 2012 to avail a credit facility for working capital equivalent to US$ 7,658,433 which comprises the following: |
| - | Working capital demand loan of US$ 5,743,825 at interest rate to be decided at the time of disbursement but not lesser than ‘Base Rate’ (Base Rate on the date of arrangement was 11%), and |
| - | Cash credit of US$ 1,914,608 at interest rate of 13.5% per annum (floating) |
| b. | The Board of Directors, vide written resolution dated August 6, 2012, adopted a Stock Appreciation Rights Scheme named the TV18 HSN Holdings Limited Stock Appreciation Rights Scheme, 2012 (‘SARs Scheme’) that allows the Company to grant stock appreciation rights to the eligible employees of the Company and its subsidiaries, whether working in India or out of India. The SARs Scheme will be administered by a Compensation Committee of the Board of Directors of the Company. |
As per the terms of the SARs Scheme, each stock appreciation right may be settled either in cash or by the issue of shares at the sole option of the Compensation Committee.
The Compensation Committee is entitled to determine the vesting schedule for stock appreciation rights as the committee deems fit. Stock appreciation rights that are not exercised within the applicable exercise period will automatically lapse. The stock appreciation rights granted under the SARs Scheme can be exercised within a period of 48 months from vesting date. In case of staggered vesting (as determined by the Compensation Committee), the period of 48 months shall be considered from each vesting date. The stock
F-61
Table of Contents
TV18 HSN HOLDINGS LIMITED
NOTES TO THE CONSOLIDATED FINANCIAL STATEMENTS — (Continued)
appreciation rights can be exercised only after a liquidity event (as defined in the SARs Scheme) and in the absence of a liquidity event during the exercise period, stock appreciation rights granted shall automatically lapse.
| c. | The Board of Directors at their meeting held on August 3, 2012 approved the change in conversion ratio of 1,500,000 convertible warrants issued to the shareholders of the Company (Refer note 9.5) from 1:1 to 1:7.310519. |
| d. | As mentioned in Note 16.1, the scheme of arrangement for implementing certain changes to the authorized and issued share capital of the Company was approved by the Hon’ble Nicosia District Court on May 10, 2012 and filed with the Registrar of Companies on May 10, 2012. |
27. Authorization of financial statements
The financial statements were approved by the Board of Directors on August 29, 2012.
For and on behalf of Board of Directors |
Chairman & Managing Director |
F-62
Table of Contents
Shares
NW18 HSN Holdings Plc
Ordinary Shares
PRELIMINARY PROSPECTUS
, 2012
Citigroup
Until , 2012 (25 days after the date of this prospectus), all dealers that buy, sell or trade shares of our ordinary shares whether or not participating in this offering, may be required to deliver a prospectus. This is in addition to the dealers’ obligation to deliver a prospectus when acting as underwriters and with respect to their unsold allotments or subscriptions.
Table of Contents
PART II
INFORMATION NOT REQUIRED IN PROSPECTUS
Item 6. Indemnification of Directors and Officers.
Our post-offering Articles of Association will provide for indemnification, to the extent permitted by Cyprus Companies Law, of each of our directors and officers out of our assets against any losses or liabilities which he or she may sustain or incur in the execution of his or her duties, including liability incurred by such person in defending any proceedings, whether civil or criminal, in which judgment is given in his or her favor or in which he or she is acquitted or in connection with any application under Section 383 of the Cyprus Companies Law. Section 383 of the Cyprus Companies Law provides the following: (a) if in any proceeding for negligence, default, breach of duty or breach of trust against an officer of a company or a person employed by a company as auditor (whether or not such person is an officer of the company), it appears to the court hearing the case that that such officer or person is or may be liable in respect of the negligence, default, breach of duty or breach of trust, but that such officer or person acted honestly and reasonably, and that, having regard to all the circumstances of the case, including those connected with such officer or person’s appointment, such officer or person ought fairly to be excused for the negligence, default, breach of duty or breach of trust, that court may relieve such officer or person, either wholly or partly, from liability on such terms as the court may think fit; and (b) where such officer or person has reason to apprehend that any claim will or might be made against such officer or person in respect of any negligence, default, breach of duty or trust, such officer or person may apply to court for relief, and the court on any such application shall have the same power to relieve such officer or person as under Section 383 of the Cyprus Companies Law, it would have had if it had been a court before which proceedings against that person for negligence, default, breach of duty or breach of trust had been brought.
Under the articles of association of our subsidiary, which is an Indian corporation, our executive officers, all of whom are also employees of our subsidiary are entitled to indemnification by our subsidiary against loss in defending any proceeding brought against them in their capacity as officers of the subsidiary, if the indemnified officer or director receives judgment in his favor or is acquitted or discharged in such proceeding as well as in connection with certain applications under Indian companies law in which relief is granted to him by the court.
We maintain a directors and officers liability insurance policy which insures our directors and officers against damages and cost of defense, settlement and payment of judgments arising from any claim made against our directors or officers for wrongful acts committed in the course of their service to us in those capacities. As of the date of this prospectus, no claims for directors and officers liability insurance have been filed under this policy against any of our directors or officers, and we are not aware of any pending or threatened litigation or proceeding involving any of our directors or officers in which indemnification is sought.
The underwriting agreement, the form of which will be filed as Exhibit 1.1 to this Registration Statement, will also provide for indemnification of us and our officers and directors.
Insofar as indemnification for liabilities arising under the Securities Act may be permitted to directors, officers or persons controlling us pursuant to the foregoing provisions, we have been informed that in the opinion of the Securities and Exchange Commission such indemnification is against public policy as expressed in the Securities Act and is therefore unenforceable.
Item 7. Recent Sales of Unregistered Securities.
Since April 1, 2009, we have issued the following securities (including options to acquire our shares and stock appreciation rights) without registering them under the Securities Act. All our securities were sold through private placements either (i) outside the United States to foreign persons, or (ii) inside the United States to accredited investors or to a limited number of persons in transactions not involving any public offering. All our
II-1
Table of Contents
options to purchase ordinary shares and stock appreciation rights and the ordinary shares issued upon the exercise of such options and stock appreciation rights were issued to executive officers and other employees and were in respect of ordinary shares not exceeding 15% of our issued share capital. Accordingly, we believe that each of the following issuances were exempt from registration under the Securities Act in reliance on Section 4(2), Regulation S or Rule 701 of the Securities Act. No underwriters were involved in any of these issuances and none of these transactions involved any underwriting discounts or commissions. In the table below, the numbers of securities corresponding to grants of options under our share option plan have not been adjusted to reflect any subsequent lapses, forfeitures, exercises or expirations of these options.
Purchaser | Date of Sale or Issuance | Number of Securities | Consideration | Type of Securities | ||||||||
Network18 Holdings Limited | November 3, 2009 | 2,046,464 | $ | 2,332,969 | Ordinary shares | |||||||
Network18 Holdings Limited | November 24, 2009 | 3,654,437 | 5,000,000 | Ordinary shares | ||||||||
GS Home Shopping Inc. | November 24, 2009 | 13,542,728 | 18,529,160 | Class G preference shares | ||||||||
SAIF II Mauritius Company Limited | March 19, 2010 | 730,682 | 29,227 | Class A preference shares | ||||||||
Network18 Holdings Limited | May 17, 2012 | 46,308,665 | * | Ordinary shares | ||||||||
| 2,500 | Class A preference shares | |||||||||||
SAIF II Mauritius Company Limited | May 17, 2012 | 27,697,528 | * | Class A preference shares | ||||||||
GS Home Shopping Inc. | May 17, 2012 | 13,542,728 | * | Class G preference shares | ||||||||
Network18 Holdings Limited | November 16, 2011 | 793,000 | 7,930 | Warrants to purchase Class A preference shares | ||||||||
SAIF II Mauritius Company Limited | November 16, 2011 | 475,000 | 4,750,000 | Warrants to purchase Class A preference shares | ||||||||
GS Home Shopping Inc. | November 16, 2011 | 232,000 | 2,320,000 | Warrants to purchase Class A preference shares | ||||||||
Network18 Holdings Limited | March 14, 2012 | 422,659 | 4,227 | Warrants to purchase Class A preference shares | ||||||||
GS Home Shopping Inc. | March 14, 2012 | 77,341 | 773,410 | Warrants to purchase Class A preference shares | ||||||||
Sundeep Malhotra | April 9, 2008 | 1,275,000 | 0.11** | Options to purchase ordinary shares | ||||||||
Atrash Aman | April 9, 2008 | 80,000 | 0.11** | Options to purchase ordinary shares | ||||||||
Raman Kumar Gulati | April 9, 2008 | 80,000 | 0.11** | Options to purchase ordinary shares | ||||||||
Certain employees | April 9, 2008 | 414,000 | 0.11** | Options to purchase ordinary shares | ||||||||
II-2
Table of Contents
Purchaser | Date of Sale or Issuance | Number of Securities | Consideration | Type of Securities | ||||||||
Certain employees | January 29, 2010 | 98,000 | 0.43** | Options to purchase ordinary shares | ||||||||
Narasimha Jayakumar | August 4, 2010 | 100,000 | 0.09** | Options to purchase ordinary shares | ||||||||
Atrash Aman | August 4, 2010 | 70,000 | 0.09** | Options to purchase ordinary shares | ||||||||
Raman Kumar Gulati | August 4, 2010 | 70,000 | 0.09** | Options to purchase ordinary shares | ||||||||
Certain employees | August 4, 2010 | 80,000 | 0.09** | Options to purchase ordinary shares | ||||||||
Sachin Rastogi | January 4, 2011 | 100,000 | 0.10** | Options to purchase ordinary shares | ||||||||
Vishwanath Magapu | January 4, 2011 | 75,000 | 0.10** | Options to purchase ordinary shares | ||||||||
Girish Keswani | January 4, 2011 | 20,000 | 0.10** | Options to purchase ordinary shares | ||||||||
Certain employees | January 4, 2011 | 104,000 | 0.10** | Options to purchase ordinary shares | ||||||||
Girish Keswani | April 29, 2011 | 10,000 | 0.10** | Options to purchase ordinary shares | ||||||||
Certain employees | April 29, 2011 | 22,000 | 0.10** | Options to purchase ordinary shares | ||||||||
Certain employees | February 3, 2012 | 13,000 | 0.09** | Options to purchase ordinary shares | ||||||||
Sundeep Malhotra | November 2, 2012 | 800,000 | 0.13*** | Stock appreciation rights | ||||||||
Sundeep Malhotra | November 2, 2012 | 400,000 | 1.37*** | Stock appreciation rights | ||||||||
Sachin Rastogi | November 2, 2012 | 75,000 | 1.37*** | Stock appreciation rights | ||||||||
Vishwanath Magapu | November 2, 2012 | 75,000 | 1.37*** | Stock appreciation rights | ||||||||
Dhruva Sankararkrishnan Chandrie | November 2,2012 | 50,000 | 0.13*** | Stock appreciation rights | ||||||||
Dhruva Sankararkrishnan Chandrie | November 2, 2012 | 100,000 | 1.37*** | Stock appreciation rights | ||||||||
Narasimha Jayakumar | November 2, 2012 | 100,000 | 1.37*** | Stock appreciation rights | ||||||||
II-3
Table of Contents
Purchaser | Date of Sale or Issuance | Number of Securities | Consideration | Type of Securities | ||||||||
Atrash Aman | November 2, 2012 | 75,000 | 1.37*** | Stock appreciation rights | ||||||||
Raman Kumar Gulati | November 2, 2012 | 75,000 | 1.37*** | Stock appreciation rights | ||||||||
Girish Keswani | November 2, 2012 | 40,000 | 0.13*** | Stock appreciation rights | ||||||||
Girish Keswani | November 2, 2012 | 50,000 | 1.37*** | Stock appreciation rights | ||||||||
Certain employees | November 2, 2012 | 420,000 | 1.37*** | Stock appreciation rights | ||||||||
Certain current and/or former employees | November 2, 2012 | 205,750 | 21,032.50 | † | Ordinary shares | |||||||
Notes:
| * | These shares were issued in connection with our share capital reorganization, which included a reduction and subsequent increase in share capital. All prior shareholdings of this shareholder were replaced by the shares issued upon the May 17, 2012 consummation of the share capital reorganization. For more information on the shareholdings of this shareholder immediately prior to the consummation of this reorganization, see the third paragraph of the “Description of Share Capital” section in the prospectus portion of this registration statement. |
| ** | These options to purchase ordinary shares were granted to each of these employees as consideration for their services to our company. Each option under our share option plan is exercisable for one of our ordinary shares. The dollar amount in this column is the exercise price per option. |
| *** | These stock appreciation rights were granted to each of these employees as consideration for their services to our company. Stock appreciation rights under our stock appreciation rights scheme may be settled in cash or our ordinary shares at our election. The dollar amount in this column is the exercise price per stock appreciation right. |
| † | This figure is the aggregate exercise price paid in connection with the exercise of share options in respect of which ordinary shares were issued on the indicated date. |
Item 8. Statement Schedules.
| (a) | Exhibits |
See the Exhibit Index for a complete list of all exhibits filed as part of this registration, which Exhibit Index is incorporated herein by reference.
| (b) | Financial Statement Schedules |
Schedules have been omitted because the information required to be set forth therein is not applicable or is shown in the consolidated financial statements or the notes thereto.
Item 9. Undertakings.
The undersigned registrant hereby undertakes to provide to the underwriter at the closing specified in the underwriting agreements, certificates in such denominations and registered in such names as required by the underwriter to permit prompt delivery to each purchaser.
Insofar as indemnification for liabilities arising under the Securities Act may be permitted to directors, officers and controlling persons of the registrant pursuant to the provisions described in Item 6, or otherwise, the registrant has been advised that in the opinion of the Securities and Exchange Commission such indemnification
II-4
Table of Contents
is against public policy as expressed in the Securities Act and is therefore unenforceable. In the event that a claim for indemnification against such liabilities (other than the payment by the registrant of expenses incurred or paid by a director, officer or controlling person of the registrant in the successful defense of any action, suit or proceeding) is asserted by such director, officer or controlling person in connection with the securities being
registered, the registrant will, unless in the opinion of its counsel the matter has been settled by controlling precedent, submit to a court of appropriate jurisdiction the question whether such indemnification by it is against public policy as expressed in the Securities Act and will be governed by the final adjudication of such issue.
The undersigned registrant hereby undertakes that:
| (1) | For purposes of determining any liability under the Securities Act, the information omitted from the form of prospectus filed as part of this registration statement in reliance upon Rule 430A and contained in a form of prospectus filed by the registrant under Rule 424(b)(1) or (4) or 497(h) under the Securities Act shall be deemed to be part of this registration statement as of the time it was declared effective. |
| (2) | For the purpose of determining any liability under the Securities Act, each post-effective amendment that contains a form of prospectus shall be deemed to be a new registration statement relating to the securities offered therein, and the offering of such securities at that time shall be deemed to be the initial bona fide offering thereof. |
II-5
Table of Contents
SIGNATURES
Pursuant to the requirements of the Securities Act of 1933, the registrant certifies that it has reasonable grounds to believe that it meets all of the requirements for filing on Form F-1 and has duly caused this registration statement to be signed on its behalf by the undersigned, thereunto duly authorized, in Noida, Uttar Pradesh, India, on , 2012.
| NW18 HSN Holdings Plc | ||||
By: |
| |||
| Name: | Sundeep Malhotra | |||
| Title: | Chief Executive Officer | |||
We, the undersigned executive officers and directors of NW18 HSN Holdings Plc and its subsidiaries hereby severally constitute and appoint Mr. Sachin Rastogi and Ms. Kshipra Jatana, and each of them singly (with full power to each of them to act alone), our true and lawful attorneys-in-fact and agents, with full power of substitution and resubstitution in each of them for him and in his name, place and stead, and in any and all capacities, to sign any and all amendments (including post-effective amendments) to this Registration Statement (or any other Registration Statement for the same offering that is to be effective upon filing pursuant to Rule 462(b) under the Securities Act), and to file the same, with all exhibits thereto and other documents in connection therewith, with the Securities and Exchange Commission, granting unto said attorneys-in-fact and agents, and each of them, full power and authority to do and perform each and every act and thing requisite or necessary to be done in and about the premises, as full to all intents and purposes as he might or could do in person, hereby ratifying and confirming all that said attorneys-in-fact and agents or any of them or their or his substitute or substitutes may lawfully do or cause to be done by virtue hereof.
Pursuant to the requirements of the Securities Act, this Registration Statement has been signed by the following persons in the capacities held on , 2012.
Signature | Title | |
Sundeep Malhotra | Chief Executive Officer (principal executive officer) | |
Sachin Rastogi | Chief Financial Officer (principal financial and accounting officer) | |
Raghav Bahl | Director | |
| Independent Director | |
Ravi Chandra Adusumalli | Director | |
Deepak Gaur | Director | |
II-6
Table of Contents
Signature | Title | |
Joon Shick Kim | Director | |
Raman Deep Singh Bawa | Director | |
Sarbvir Singh | Director | |
Saikumar Balasubramanian | Director | |
II-7
Table of Contents
SIGNATURE OF AUTHORIZED REPRESENTATIVE OF THE REGISTRANT IN THE UNITED STATES
Pursuant to the Securities Act, the undersigned, the duly authorized representative in the United States of NW18 HSN Holdings Plc has signed this Registration Statement or amendment thereto in the City of Newark, Delaware on , 2012.
AUTHORIZED U.S. REPRESENTATIVE | ||||
| By: |
| |||
Name: | Donald J. Puglisi | |||
Title: | Managing Director Puglisi & Associates | |||
II-8
Table of Contents
EXHIBIT INDEX
No. | Description | |
| 1.1 | Form of underwriting agreement.* | |
| 3.1 | Form of Memorandum and Articles of Association, to be effective upon the closing of this offering.* | |
| 4.1 | Form of ordinary share certificate.* | |
| 5.1 | Opinion of Aristodemou Loizides Yiolitis LLC.** | |
| 8.1 | Opinion of Aristodemou Loizides Yiolitis LLC as to certain Cyprus tax matters.** | |
| 8.2 | Opinion of Amarchand & Mangaldas & Suresh A. Shroff & Co. as to certain Indian tax matters.** | |
| 8.3 | Opinion of Sidley Austin LLP as to certain US tax matters.** | |
| 10.1.1 | Share option plan.** | |
| 10.1.2 | Resolution dated October 26, 2010 amending the share option plan.** | |
| 10.1.3 | Resolution dated August 6, 2012 amending the share option plan.** | |
| 10.2 | Stock appreciation rights plan.** | |
| 10.3.1 | Amended and restated shareholders agreement dated November 13, 2009 by and among the shareholders named therein and our company.** | |
| 10.3.2 | Amendment to amended and restated shareholders agreement dated November 13, 2009.* | |
| 10.4 | Master services agreement between iEnergizer IT Services Private Limited and TV18 Home Shopping Network Limited dated December 20, 2010.** | |
| 10.5.1 | Lease deed dated July 3, 2007 between IT Infrastructure Providers Private Limited as Lessors and TV18 Home Shopping Network Private Limited as Lessee.** | |
| 10.5.2 | Lease deed dated September 1, 2012 between Akshay Vanijya & Finance Private Limited as Lessor and TV18 Home Shopping Network Limited as Lessee.** | |
| 10.6.1 | Agreement between Magus Customer Dialog Private Limited and TV18 Home Shopping Network Limited dated June 21, 2008.** | |
| 10.6.2 | Addendum dated April 1, 2011 to agreement dated June 21, 2008 between Magus Customer Dialog Private Limited and TV18 Home Shopping Network Limited.** | |
| 10.7 | Financial support letter dated August 16, 2012 issued by Network18 Media & Investments Limited.** | |
| 10.8.1 | Sanction letter dated April 23, 2012 from The Ratnakar Bank Limited.** | |
| 10.8.2 | Bank credit facility agreement dated April 27, 2012 between The Ratnakar Bank Limited and TV18 Home Shopping Network Limited.** | |
| 10.8.3 | Corporate guarantee dated April 27, 2012 of Network18 Media & Investments Limited.** | |
| 10.8.4 | Personal guarantee dated April 27, 2012 of Mr. Raghav Bahl.** | |
| 10.8.5 | Composite deed of hypothecation dated April 27, 2012.** | |
| 10.9 | Licensing agreement dated September 1, 2012 between Network18 Media & Investments Limited and TV18 HSN Holdings Limited.** | |
| 21.1 | List of subsidiaries of NW18 HSN Holdings Plc.** | |
| 23.1 | Consent of Aristodemou Loizides Yiolitis LLC (see Exhibit 5.1 and Exhibit 8.1).** | |
| 23.2 | Consent of Amarchand & Mangaldas & Suresh A. Shroff & Co. (see Exhibit 8.2).** | |
| 23.3 | Consent of Sidley Austin LLP (see Exhibit 8.3).** | |
Table of Contents
No. | Description | |
| 23.4 | Consent of Grant Thornton India LLP, registered public accounting firm. | |
| 23.5 | Consent of Grant Thornton (Cyprus) Ltd.* | |
| 23.6 | Consent of FICCI-KPMG.* | |
| 23.7 | Consent of The Economist Intelligence Unit.* | |
| 23.8 | Consent of CRISIL Research.* | |
| 23.9 | Consent of Google Analytics.* | |
| 23.10 | Consent of McKinsey Global Institute.* | |
| 24.1 | Power of Attorney (contained on signature page).* | |
| 99.1 | Special report prepared pursuant to the requirements of Cyprus law.* | |
| 99.2 | Schedule pursuant to the requirements of Cyprus law.** | |
| 99.3 | Draft registration statement on Form F-1, submitted confidentially by the Registrant to the Securities and Exchange Commission on September 27, 2012. | |
Note:
| * | To be submitted or filed by amendment |
| ** | Previously submitted |