UNITED STATES
SECURITIES AND EXCHANGE COMMISSION
Washington, D.C. 20549
FORM N-CSR
CERTIFIED SHAREHOLDER REPORT OF REGISTERED
MANAGEMENT INVESTMENT COMPANIES
811-22742
(Investment Company Act File Number)
Principal Real Estate Income Fund
(Exact Name of Registrant as Specified in Charter)
1290 Broadway, Suite 1100
Denver, CO 80203
(Address of Principal Executive Offices)
Erin D. Nelson
Principal Real Estate Income Fund
1290 Broadway, Suite 1100
Denver, CO 80203
(Name and Address of Agent for Service)
(303) 623-2577
(Registrant’s Telephone Number)
Date of Fiscal Year End: October 31
Date of Reporting Period: April 30, 2014
| Item 1. | Reports to Stockholders. |

TABLE OF CONTENTS
| | |
Principal Real Estate Income Fund | | Performance Overview |
| | April 30, 2014 (Unaudited) |
Principal Real Estate Income Fund (“PGZ” or the “Fund”) was launched June 25, 2013. As of April 30, 2014 the Fund was 65% allocated to Commercial Mortgage Backed Securities (“CMBS”) and 35% allocated to global real estate securities, primarily Real Estate Investment Trusts (“REITs”). For the 6-month period ended April 30, 2014, the Fund delivered a net return of 11.74%, assuming dividends are reinvested back into the Fund, based on the closing market share price of $18.95 on April 30, 2014. This compares to the return of the S&P 500® Index, over the same time period, of 8.36% assuming dividends are reinvested into the index. This also compares to the return of the Barclays U.S. Aggregate Bond Index of 1.74% and the MSCI World Index of 6.32%.
The April 30, 2014 closing market price of $18.95 represented a 7.6% discount to the Fund’s Net Asset Value (“NAV”). This compares to an average 9.8% discount for Equity Real Estate closed-end funds and a 7.7% discount for Mortgage-Backed Securities closed-end funds, according to CEFConnect. These discounts to NAV reflect the volatility that has occurred in the closed-end fund market since June 2013, as expectations for higher interest rates have negatively impacted the attractiveness of the market.
Based on NAV, the Fund has returned 9.08%, including dividends, for the 6-month period ended April 30, 2014. Fund investments benefited from continued strong investor demand for CMBS and global real estate securities, as subdued market volatility and an unexpected rally in interest rates left investors looking for yield alternatives in public commercial real estate. CMBS and global real estate securities also benefited from ongoing improvement in real estate fundamentals. In the U.S., demand for space is outpacing supply which is helping to stabilize or increase rents and lower vacancies across major property types in major markets across the country, resulting in higher net operating income at the property level. Globally, real estate markets are exhibiting a generally solid investment landscape with pockets of both strength and weakness.
CMBS
CMBS is realizing the benefit of improving real estate fundamentals in the form of lower delinquencies and a higher-than-expected percentage of maturing loans being able to refinance. As of April 30, 2014, delinquencies on CMBS loans have improved to a post-financial crisis percentage not seen since April 2010 at 6.1%, according to Barclay’s Research. Additionally, the pace of new 30-day delinquencies has slowed to a pace that is 84% lower than 2010 levels and 47% lower than the trailing-12 month pace ended April 30, 2014, according to Wells Fargo Securities, LLC research. This data shows that the month of April experienced the lowest one-month amount of newly delinquent loans since August 2008. Improving fundamentals and availability of capital have also increased the percentage of maturing loans (10 year loans originated in 2004 and 7 year loans originated in 2007) that have been able to refinance during 2014. The maturing loan refinance rate increased from 30-40% in the second half of 2012 to 70% during 2013. If loans that paid off up to three months after their maturity date are included in these figures, the refinance rate has increased to over 90%, according to Morningstar Credit Ratings, LLC. The continued growth of the new issue CMBS market is helping to provide the capital needed to refinance these loans. New issue CMBS supply is projected to be approximately $90-100 billion in 2014 compared to roughly $1 billion in 2009, $10 billion in 2010, $28 billion in 2011, $43 billion in 2012 and $85 billion in 2013. The improvement in commercial real estate fundamentals and availability of capital are two key variables, with the third being interest rates, that will have a direct impact on the performance of CMBS through 2017. The peak years of issuance pre-financial crisis were 2005-2007. Issuance during those years included $147 billion in 2005, $172 billion in 2006 and $202 billion in 2007, with the majority of loans originated in those years being ten year
| | |
| | | |
Semi-Annual Report | April 30, 2014 | | 1 |
| | |
Principal Real Estate Income Fund | | Performance Overview |
| | April 30, 2014 (Unaudited) |
loans. This means the maturity cycle in 2015-2017 and corresponding percentage of loans that can be refinanced will have a direct impact on recoveries for bonds issued during those pre-crisis years. With respect to interest rates, the CMBS bonds held in the portfolio have benefited from being shorter duration securities which has made the portfolio less exposed to interest rate volatility. These bonds continue to attract investors searching for short duration, high yield options. The duration of the CMBS portfolio in the Fund was 2.84 years as of April 30, 2014.
We believe the outlook for CMBS remains positive in 2014 barring an unforeseen macro-economic shock that impacts market volatility, interest rates and economic growth. Demand for short duration, high yield is expected to persist in 2014 and, assuming the continuation of slow economic growth, real estate fundamentals are expected to continue to improve as well. Longer-term, the continued growth of CMBS issuance will be important for the market as the height of the maturity cycle approaches in 2015-2017.
GLOBAL REAL ESTATE SECURITIES
The FTSE EPRA NAREIT Developed GTR Index returned 3.75% versus the MSCI World Index which returned 6.32% over the trailing 6 months as of April 30, 2014. As such, global real estate securities’ returns lagged global equities. Despite investor optimism about an improved economic growth outlook in the second half of 2013, GDP growth thus far in 2014 has been sluggish and yields on U.S. Treasuries thus reversed their upward trajectory of last fall and have declined and remained low in recent months. As such, investors similarly reversed course and rotated away from growth-oriented sectors and back into yield-oriented investments, including real estate securities. Investors remain watchful for signs of a structural rise in interest rates, but global GDP growth has yet to appreciably accelerate and there are many deflationary pressures globally so interest rates have remained low.
Within the global real estate securities portion of the portfolio, returns have been strongest in the UK and Sweden, up 33.1% and 25.7%, respectively, over the past six months as signs of continued economic improvement in Europe provided momentum for the stocks. The portfolio’s UK holdings especially benefited from owning UK self-storage operator, Safestore Holdings, which was up nearly 65% over the period on an improved outlook for the UK housing sector, which is a driver of self-storage demand. The stock also reacted positively to the successful leasing of its development properties, along with a new CEO’s focus on improving operations. In contrast, the weakest performing stocks in the portfolio for the period were Hong Kong listed stocks of companies engaged in China, with the portfolio’s holdings there having declined approximately 22% as investors worry about the pace of GDP deceleration and the slowing pace of new residential sales across China.
Our proprietary financial model utilized to measure global real estate securities valuation levels indicated roughly fair value at the end of April 2014, similar to what was indicated at the end of the October 2013. This measure examines the spread between the stocks’ forward looking implied unlevered internal rates of returns (“IRRs”) to global treasury yields. That spread, or ‘risk premium’, of 4.6% as of the end of April 2014 is approximately in line with the trailing 10 year average of 4.4%.
Following some recent U.S. and global macroeconomic sluggishness, which were in part impacted by an unseasonably cold winter, we are encouraged about the medium- to longer-term growth prospects in the U.S. and globally and are thus positioning the real estate securities portion of the portfolio towards stocks which not only offer attractive dividend yields, but the prospects for stronger earnings growth.
| | |
Principal Real Estate Income Fund | | Performance Overview |
| | April 30, 2014 (Unaudited) |
OUTLOOK
The outlook for interest rates will continue to be a significant factor influencing the near-term performance of CMBS and global real estate securities. We believe both sectors are poised to deliver attractive returns in a stable rate environment, and the recent moderation in interest rates has created a more constructive near-term outlook. Longer-term, if rates break out of the current range in response to an improving global economy, this would likely result in increased earnings growth for commercial real estate properties; a positive for both the CMBS and global property securities markets. In the meantime, periods of near-term volatility may present opportunities for positive long-term performance.
References:
The Premium/Discount is the amount (stated in dollars or percent) by which the selling or purchase price of a fund is greater than (premium) or less than (discount) its face amount/value or net asset value (NAV).
Issuance information – JPMorgan
The internal rate of return on an investment is defined as the discount rate at which the present value of all future cash flows is equal to the initial investment or, in other words, the rate at which an investment breaks even.
| | |
| | | |
Semi-Annual Report | April 30, 2014 | | 3 |
| | |
Principal Real Estate Income Fund | | Performance Overview |
| | April 30, 2014 (Unaudited) |
The Principal Real Estate Income Fund’s investment objective is to seek to provide high current income, with capital appreciation as a secondary objective, by investing in commercial real estate-related securities. There can be no assurance that the Fund will achieve its investment objective.
PERFORMANCE as of April 30, 2014
| | | | | | |
| TOTAL RETURNS(1) | | CUMULATIVE |
Fund | | YTD | | 6 Month | | Since Inception(2) |
Net Asset Value (NAV)(3) | | 10.70% | | 9.08% | | 14.98% |
Market Price(4) | | 14.57% | | 11.74% | | 1.50% |
Barclays U.S. Aggregate Bond Index | | 2.70% | | 1.74% | | 3.93% |
MSCI World Index | | 2.30% | | 6.32% | | 21.33% |
S&P 500® Index | | 2.56% | | 8.36% | | 20.69% |
| (1) | Total returns assume reinvestment of all distributions. |
| (2) | The Fund commenced operations on June 25, 2013. |
| (3) | Performance returns are net of management fees and other Fund expenses. |
| (4) | Market price is the value at which the Fund trades on an exchange. This market price can be more or less than its NAV. |
Performance data quoted represents past performance. Past performance does not guarantee future results. Investment return and principal value of an investment will fluctuate so that an investor’s shares, when sold or redeemed, may be worth more or less than the original cost. Current performance data may be higher or lower than actual data quoted. For the most current month-end performance data please call 855.838.9485.
Total Annual Expense Ratio as a Percentage of Net Assets Attributable to Common Shares (Assuming the Use of Leverage Equal to 33 1/3% of the Fund’s Total Assets), per the prospectus, 2.62%.
Total Annual Expense Ratio as a Percentage of Net Assets Attributable to Common Shares (Assuming No Limited Leverage), per the prospectus, 1.48%.
The Fund is a closed-end fund and does not continuously issue shares for sale as open-end mutual funds do. Since the initial public offering, the Fund now trades in the secondary market. Investors wishing to buy or sell shares need to place orders through an intermediary or broker. The share price of a closed-end fund is based on the market’s value.
Barclay’s U.S. Aggregate Bond Index - A broad-based benchmark that measures the investment grade, U.S. dollar-denominated, fixed rate taxable bond market, including Treasuries, government related and corporate securities, MBS (agency fixed-rate and hybrid ARM pass throughs), ABS, and CMBS.
MSCI World Index - MSCI’s market capitalization weighted index is composed of companies representative of the market structure of 23 developed market countries in North America, Europe, and the Asia/Pacific Region.
S&P 500® Index - A large cap U.S. equities index that includes 500 leading companies and captures approximately 80% coverage of available market capitalization.
An investor cannot invest directly in an index.
ALPS Advisors, Inc. is the investment adviser to the Fund.
Principal Real Estate Investors, LLC is the investment sub-adviser to the Fund. Principal Real Estate Investors, LLC is not affiliated with ALPS Advisors, Inc. or any of its affiliates.
| | |
Principal Real Estate Income Fund | | Performance Overview |
| | April 30, 2014 (Unaudited) |
GROWTH OF A HYPOTHETICAL $10,000 INVESTMENT
The graph below illustrates the growth of a hypothetical $10,000 investment assuming the purchase of shares of beneficial interest at the closing market price (NYSE: PGZ) of $19.10 on June 25, 2013, and tracking its progress through April 30, 2014.
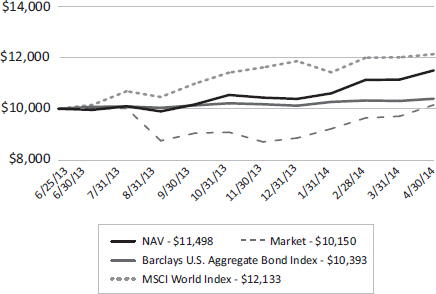
Past performance does not guarantee future results. Performance will fluctuate with changes in market conditions. Current performance may be lower or higher than the performance data shown. Performance information does not reflect the deduction of taxes that shareholders would pay on Fund distributions or the sale of Fund shares. An investment in the Fund involves risk, including loss of principal.
SECTOR ALLOCATIONS^
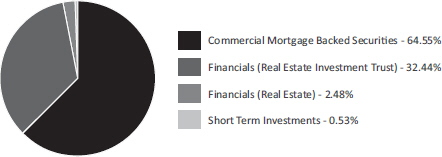
| ^ | Holdings are subject to change. |
| | Percentages are based on total investments. |
| | |
| | | |
Semi-Annual Report | April 30, 2014 | | 5 |
| | |
Principal Real Estate Income Fund | | Statement of Investments |
| | April 30, 2014 (Unaudited) |
| | | | | | | | |
| Description | | Shares | | | Value (Note 2) | |
| |
COMMON STOCKS (48.13%) | | | | | | | | |
| | |
Real Estate Management/Services (2.85%) | | | | | | | | |
Atrium European Real Estate, Ltd. | | | 96,100 | | | $ | 553,295 | |
Citycon OYJ | | | 472,400 | | | | 1,769,534 | |
Fabege AB | | | 50,700 | | | | 710,730 | |
Hyprop Investments, Ltd., REIT | | | 134,000 | | | | 1,001,513 | |
| | | | | | | | |
| | | | | | | 4,035,072 | |
| | | | | | | | |
| | |
Real Estate Operating/Development (1.37%) | | | | | | | | |
Agile Property Holdings, Ltd. | | | 476,000 | | | | 386,181 | |
Country Garden Holdings Co., Ltd. | | | 1,069,000 | | | | 428,816 | |
KWG Property Holding, Ltd. | | | 400,000 | | | | 221,335 | |
Sino Land Co., Ltd. | | | 356,000 | | | | 532,649 | |
Terrace Hill Group PLC(a) | | | 830,890 | | | | 370,006 | |
| | | | | | | | |
| | | | | | | 1,938,987 | |
| | | | | | | | |
| | |
REITS-Apartments (3.88%) | | | | | | | | |
Advance Residence Investment Corp. | | | 269 | | | | 608,595 | |
Camden Property Trust | | | 9,700 | | | | 664,353 | |
Campus Crest Communities, Inc. | | | 178,200 | | | | 1,534,302 | |
Canadian Apartment Properties REIT | | | 139,400 | | | | 2,674,679 | |
| | | | | | | | |
| | | | | | | 5,481,929 | |
| | | | | | | | |
| | |
REITS-Diversified (17.52%) | | | | | | | | |
Altarea | | | 11,000 | | | | 2,060,211 | |
Cambridge Industrial Trust | | | 2,697,000 | | | | 1,591,912 | |
CapitaCommercial Trust | | | 552,000 | | | | 704,475 | |
Digital Realty Trust, Inc. | | | 45,400 | | | | 2,424,360 | |
Dundee Real Estate Investment Trust, Class A | | | 92,000 | | | | 2,424,123 | |
EPR Properties | | | 45,200 | | | | 2,423,172 | |
Frasers Commercial Trust | | | 1,415,000 | | | | 1,433,397 | |
Land Securities Group PLC | | | 37,100 | | | | 665,229 | |
Liberty Property Trust | | | 52,200 | | | | 1,957,500 | |
Mirvac Group | | | 568,000 | | | | 923,423 | |
Nomura Real Estate Master Fund, Inc. | | | 1,330 | | | | 1,389,387 | |
Retail Properties of America, Inc., Class A | | | 45,300 | | | | 648,696 | |
Spring Real Estate Investment Trust | | | 3,864,000 | | | | 1,495,173 | |
Stockland | | | 610,100 | | | | 2,204,778 | |
Top REIT, Inc. | | | 119 | | | | 516,227 | |
Wereldhave N.V. | | | 22,900 | | | | 1,924,324 | |
| | | | | | | | |
| | | | | | | 24,786,387 | |
| | | | | | | | |
| | |
REITS-Health Care (2.58%) | | | | | | | | |
Assura Group, Ltd. | | | 325,000 | | | | 241,440 | |
Aviv REIT, Inc. | | | 18,558 | | | | 489,746 | |
Medical Properties Trust, Inc. | | | 125,500 | | | | 1,694,250 | |
| | |
Principal Real Estate Income Fund | | Statement of Investments |
| | April 30, 2014 (Unaudited) |
| | | | | | | | |
| Description | | Shares | | | Value (Note 2) | |
| |
REITS-Health Care (2.58%) (continued) | | | | | | | | |
Primary Health Properties PLC | | | 202,200 | | | $ | 1,222,185 | |
| | | | | | | | |
| | | | | | | 3,647,621 | |
| | | | | | | | |
| | |
REITS-Hotels (2.31%) | | | | | | | | |
Hospitality Properties Trust | | | 70,100 | | | | 2,106,505 | |
Summit Hotel Properties, Inc. | | | 127,500 | | | | 1,155,150 | |
| | | | | | | | |
| | | | | | | 3,261,655 | |
| | | | | | | | |
| | |
REITS-Mortgage (1.17%) | | | | | | | | |
CYS Investments, Inc. | | | 193,100 | | | | 1,660,660 | |
| | | | | | | | |
| | |
REITS-Office Property (3.00%) | | | | | | | | |
Brandywine Realty Trust | | | 89,100 | | | | 1,296,405 | |
Highwoods Properties, Inc. | | | 41,500 | | | | 1,674,525 | |
Hulic Reit, Inc.(a) | | | 77 | | | | 107,477 | |
Mori Trust Sogo REIT, Inc. | | | 330 | | | | 494,507 | |
Workspace Group PLC | | | 69,600 | | | | 674,519 | |
| | | | | | | | |
| | | | | | | 4,247,433 | |
| | | | | | | | |
| | |
REITS-Shopping Centers (11.78%) | | | | | | | | |
Charter Hall Retail REIT | | | 564,500 | | | | 2,024,256 | |
Federation Centres, Ltd. | | | 936,900 | | | | 2,167,239 | |
Fortune Real Estate Investment Trust | | | 1,217,000 | | | | 955,963 | |
Hammerson PLC | | | 68,500 | | | | 659,810 | |
Kite Realty Group Trust | | | 89,300 | | | | 553,660 | |
Ramco-Gershenson Properties Trust | | | 73,400 | | | | 1,209,632 | |
RioCan Real Estate Investment Trust | | | 116,400 | | | | 2,891,813 | |
Starhill Global REIT | | | 1,489,000 | | | | 962,025 | |
Vastned Retail N.V. | | | 38,600 | | | | 1,985,158 | |
Weingarten Realty Investors | | | 30,000 | | | | 936,000 | |
Westfield Retail Trust | | | 780,000 | | | | 2,311,530 | |
| | | | | | | | |
| | | | | | | 16,657,086 | |
| | | | | | | | |
| | |
REITS-Single Tenant (0.21%) | | | | | | | | |
Agree Realty Corp. | | | 10,000 | | | | 298,700 | |
| | | | | | | | |
| | |
REITS-Storage/Warehousing (1.46%) | | | | | | | | |
Safestore Holdings PLC | | | 531,000 | | | | 2,064,273 | |
| | | | | | | | |
| | |
TOTAL COMMON STOCKS (Cost $64,620,436) | | | | | | | 68,079,803 | |
| |
| | |
| | | |
Semi-Annual Report | April 30, 2014 | | 7 |
| | |
Principal Real Estate Income Fund | | Statement of Investments |
| | April 30, 2014 (Unaudited) |
| | | | | | | | |
| Description | | Shares | | | Value (Note 2) | |
| |
PREFERRED STOCKS (1.28%) | | | | | | | | |
| | |
REITS-Apartments (0.06%) | | | | | | | | |
Apartment Investment & Management Co., Series Z, 7.000% | | | 3,012 | | | $ | 77,559 | |
| | | | | | | | |
| | |
REITS-Hotels (0.51%) | | | | | | | | |
Hersha Hospitality Trust, Series B, 8.000% | | | 27,400 | | | | 726,648 | |
| | | | | | | | |
| | |
REITS-Office Property (0.29%) | | | | | | | | |
SL Green Realty Corp., Series I, 6.500% | | | 16,300 | | | | 403,588 | |
| | | | | | | | |
| | |
REITS-Regional Malls (0.42%) | | | | | | | | |
Glimcher Realty Trust, Series G, 8.125% | | | 7,241 | | | | 184,645 | |
Pennsylvania Real Estate Investment Trust, Series B, 7.375% | | | 16,200 | | | | 413,100 | |
| | | | | | | | |
| | | | | | | 597,745 | |
| | | | | | | | |
| | |
TOTAL PREFERRED STOCKS (Cost $1,757,078) | | | | | | | 1,805,540 | |
| |
| | | | | | | | | | | | | | |
| | | Rate | | Maturity
Date | | | Principal
Amount | | | Value (Note 2) | |
| |
COMMERCIAL MORTGAGE BACKED SECURITIES (91.33%) | | | | | | | | | | | | | | |
Commercial Mortgage Backed Securities-Other (66.82%) | | | | | | | | | | | | | | |
Bank of America Commercial Mortgage Trust, Series 2008-1(b) | | 6.289% | | | 01/10/18 | | | $ | 5,000,000 | | | $ | 5,432,055 | |
Commercial Mortgage Trust, Pass- Through Certificates, Series 2007-C1 | | 5.416% | | | 02/15/40 | | | | 10,000,000 | | | | 10,095,190 | |
Commercial Mortgage Trust, Series 2007-CD4(b) | | 5.398% | | | 12/11/49 | | | | 12,500,000 | | | | 9,758,237 | |
Commercial Mortgage Trust, Series 2007-GG9(b) | | 5.505% | | | 02/10/17 | | | | 7,500,000 | | | | 6,490,995 | |
Credit Suisse Commercial Mortgage Trust Series 2006-C4(b) | | 5.538% | | | 09/15/39 | | | | 10,000,000 | | | | 9,762,510 | |
FHLMC Multifamily Structured Pass Through Certificates, Series 2011-KAIV(b)(c) | | 3.615% | | | 06/25/41 | | | | 9,000,000 | | | | 1,896,489 | |
FHLMC Multifamily Structured Pass Through Certificates, Series 2012-K706(b)(c) | | 1.901% | | | 12/25/18 | | | | 28,580,000 | | | | 2,162,163 | |
FHLMC Multifamily Structured Pass Through Certificates, Series 2012-K707(b)(c) | | 1.806% | | | 01/25/19 | | | | 27,555,000 | | | | 2,013,306 | |
| | |
Principal Real Estate Income Fund | | Statement of Investments |
| | April 30, 2014 (Unaudited) |
| | | | | | | | | | | | | | |
| | | Rate | | Maturity
Date | | | Principal
Amount | | | Value (Note 2) | |
| |
Commercial Mortgage Backed Securities-Other (66.82%) (continued) | | | | | | | | | | | | | | |
FHLMC Multifamily Structured Pass Through Certificates,
Series 2012-K709(b)(c) | | 1.700% | | | 04/25/40 | | | $ | 30,601,130 | | | $ | 2,222,407 | |
FHLMC Multifamily Structured Pass Through Certificates,
Series 2012-K710(b)(c) | | 1.660% | | | 06/25/42 | | | | 27,830,000 | | | | 2,028,306 | |
Goldman Sachs Commercial Mortgage Securities, Series 2013-GC13 D(b)(d) | | 4.073% | | | 07/10/46 | | | | 3,000,000 | | | | 2,672,100 | |
Goldman Sachs Mortgage Securities Trust 2013-GC16(b)(d) | | 5.315% | | | 11/10/46 | | | | 2,342,405 | | | | 2,252,862 | |
JPMorgan Chase Commercial Mortgage Securities Trust 2007-CIBC19(b) | | 5.698% | | | 05/12/17 | | | | 3,500,000 | | | | 3,009,538 | |
JPMorgan Chase Commercial Mortgage Securities Trust 2013-C16(b)(d) | | 5.009% | | | 11/15/23 | | | | 2,117,483 | | | | 2,029,938 | |
JPMorgan Chase Commercial Mortgage Securities Trust, Series 2006-CIBC16 | | 5.623% | | | 05/12/45 | | | | 7,500,000 | | | | 7,627,080 | |
JPMorgan Chase Commercial Mortgage Securities Trust,
Series 2006-CIBC17(b) | | 5.489% | | | 12/12/43 | | | | 3,899,000 | | | | 2,915,278 | |
LB-UBS Commercial Mortgage Trust 2006-C7 | | 5.407% | | | 11/15/16 | | | | 5,000,000 | | | | 4,364,895 | |
Wachovia Bank Commercial Mortgage Trust, Series 2006-C29(b) | | 5.368% | | | 11/15/48 | | | | 13,000,000 | | | | 12,697,217 | |
Wachovia Bank Commercial Mortgage Trust, Series 2007-C30(b) | | 5.413% | | | 12/15/43 | | | | 5,000,000 | | | | 5,084,955 | |
| | | | | | | | | | | | | | |
| | | | | | | | | | | | | 94,515,521 | |
| | | | | | | | | | | | | | |
| | | | |
Commercial Mortgage Backed Securities-Subordinated (24.51%) | | | | | | | | | | | | | | |
Bank of America Commercial Mortgage Trust, Series 2006-6 | | 5.480% | | | 10/10/45 | | | | 3,000,000 | | | | 2,572,158 | |
Commercial Mortgage Trust, Series 2013-CR11 Class E(b)(d) | | 4.371% | | | 10/10/23 | | | | 5,108,000 | | | | 4,130,074 | |
Commercial Mortgage Trust, Series 2014-CR14(b)(d) | | 3.496% | | | 01/10/24 | | | | 2,000,000 | | | | 1,456,612 | |
JPMorgan Chase Commercial Mortgage Securities Trust,
Series 2006- CIBC14(b) | | 5.502% | | | 12/12/44 | | | | 7,560,000 | | | | 7,447,091 | |
Merrill Lynch Mortgage Trust 2006-C1(b) | | 5.657% | | | 05/12/39 | | | | 9,000,000 | | | | 7,493,031 | |
Merrill Lynch Mortgage Trust, Series 2005-CIP1(b) | | 5.174% | | | 08/12/15 | | | | 5,000,000 | | | | 4,975,070 | |
Merrill Lynch-CFC Commercial Mortgage Trust, Series 2006-2(b)(d) | | 5.875% | | | 06/12/46 | | | | 2,000,000 | | | | 1,899,046 | |
| | |
| | | |
Semi-Annual Report | April 30, 2014 | | 9 |
| | |
Principal Real Estate Income Fund | | Statement of Investments |
| | April 30, 2014 (Unaudited) |
| | | | | | | | | | | | | | |
| | | Rate | | Maturity
Date | | | Principal
Amount | | | Value (Note 2) | |
| |
Commercial Mortgage Backed Securities-Subordinated (24.51%) (continued) | | | | | | | | | | | | | | |
Merrill Lynch-CFC Commercial Mortgage Trust, Series 2006-3(b) | | 5.554% | | | 09/12/16 | | | $ | 2,500,000 | | | $ | 1,968,950 | |
Morgan Stanley Bank of America Merrill Lynch Commercial Mortgage Trust,
Series 2013-C8(b)(d) | | 4.311% | | | 02/15/23 | | | | 3,000,000 | | | | 2,722,752 | |
| | | | | | | | | | | | | | |
| | | | | | | | | | | | | 34,664,784 | |
| | | | | | | | | | | | | | |
| | | | |
TOTAL COMMERCIAL MORTGAGE BACKED SECURITIES (Cost $122,118,969) | | | | | | | | | | | | | 129,180,305 | |
| |
| | | | | | | | | | |
| | | 7-Day
Yield | | Shares | | | Value (Note 2) | |
| |
SHORT TERM INVESTMENTS (0.75%) | | | | | | | | | | |
State Street Institutional Liquid Reserves Fund, Institutional Class | | 0.074% | | | 1,052,927 | | | | 1,052,927 | |
| | | | | | | | | | |
| | | |
TOTAL SHORT TERM INVESTMENTS (Cost $1,052,927) | | | | | | | | | 1,052,927 | |
| |
| | | |
TOTAL INVESTMENTS (141.49%) (Cost $189,549,410) | | | | | | | | $ | 200,118,575 | |
| | | |
Liabilities in Excess of Other Assets (-41.49%) | | | | | | | | | (58,677,520) | |
| |
NET ASSETS (100.00%) | | | | | | | | $ | 141,441,055 | |
| |
| (a) | Non-income producing security. |
| (b) | Interest rate will change at a future date. Interest rate shown reflects the rate in effect at April 30, 2014. |
| (c) | Interest only security. |
| (d) | Security exempt from registration under Rule 144A of the Securities Act of 1933. Such securities may normally be sold to qualified institutional buyers in transactions exempt from registration. The total value of Rule 144A securities amounts to $17,163,384, which represents approximately 12.13% of net assets as of April 30, 2014. |
Common Abbreviations:
AB - Aktiebolag is the Swedish equivalent of the term corporation.
FHLMC - Federal Home Loan Mortgage Corporation.
N.V. - Naamloze vennootshap is the Dutch term for a public limited liability corporation.
OYJ - Osakeyhtio is the Finnish equivalent of a public stock company.
PLC - Public Limited Company.
REIT - Real Estate Investment Trust.
| | |
See Notes to Financial Statements |
10 | | www.principalcef.com |
| | |
Principal Real Estate Income Fund | | Investment Composition |
| | April 30, 2014 (Unaudited) |
Geographic Breakdown as of April 30, 2014 (unaudited)
| | | | | | | | |
| | | Value (Note 2) | | | % Value* | |
| |
Australia | | | $9,631,226 | | | | 4.81% | |
Canada | | | 7,990,615 | | | | 3.99% | |
Cayman Islands | | | 607,516 | | | | 0.30% | |
China | | | 428,816 | | | | 0.21% | |
Finland | | | 1,769,534 | | | | 0.88% | |
France | | | 2,060,211 | | | | 1.03% | |
Great Britain | | | 5,656,022 | | | | 2.83% | |
Guernsey | | | 241,440 | | | | 0.12% | |
Hong Kong | | | 2,027,822 | | | | 1.02% | |
Japan | | | 3,116,193 | | | | 1.56% | |
Jersey | | | 553,295 | | | | 0.28% | |
Netherlands | | | 3,909,482 | | | | 1.95% | |
Singapore | | | 5,647,772 | | | | 2.83% | |
South Africa | | | 1,001,513 | | | | 0.50% | |
Sweden | | | 710,730 | | | | 0.36% | |
United States | | | 154,766,388 | | | | 77.33% | |
| | | | |
| | | $200,118,575 | | | | 100.00% | |
| | | | |
*Percentages are based on total investments.
Holdings are subject to change.
| | |
| | | |
Semi-Annual Report | April 30, 2014 | | 11 |
| | |
Principal Real Estate Income Fund | | |
Statement of Assets and Liabilities | | April 30, 2014 (Unaudited) |
| | | | |
ASSETS: | | | | |
Investments, at value | | $ | 200,118,575 | |
Receivable for investments sold | | | 903,511 | |
Interest receivable | | | 767,235 | |
Dividends receivable | | | 326,820 | |
Prepaid and other assets | | | 47,200 | |
| |
Total Assets | | | 202,163,341 | |
| |
| |
LIABILITIES: | | | | |
Payable to custodian due to overdraft | | | 192 | |
Loan payable | | | 60,000,000 | |
Interest due on loan payable | | | 65,506 | |
Payable for investments purchased | | | 315,713 | |
Payable to adviser | | | 172,051 | |
Payable to administrator | | | 29,570 | |
Payable to transfer agent | | | 4,600 | |
Payable for trustee fees | | | 19,015 | |
Other payables | | | 115,639 | |
| |
Total Liabilities | | | 60,722,286 | |
| |
Net Assets | | $ | 141,441,055 | |
| |
| |
NET ASSETS CONSIST OF: | | | | |
Paid-in capital | | $ | 131,510,397 | |
Distributions in excess of net investment income | | | (911,791) | |
Accumulated net realized gain on investments and foreign currency transactions | | | 273,478 | |
Net unrealized appreciation on investments and translation of assets and liabilities denominated in foreign currencies | | | 10,568,971 | |
| |
Net Assets | | $ | 141,441,055 | |
| |
| |
PRICING OF SHARES: | | | | |
Net Assets | | $ | 141,441,055 | |
Shares of beneficial interest outstanding (unlimited number of shares authorized, no par value per share) | | | 6,899,800 | |
| |
Net assets value, offering and redemption price per share | | $ | 20.50 | |
| |
| |
Cost of Investments | | $ | 189,549,410 | |
| | |
See Notes to Financial Statements |
12 | | www.principalcef.com |
| | |
Principal Real Estate Income Fund | | Statement of Operations |
| | For the Six Months Ended April 30, 2014 (Unaudited) |
| | | | |
INVESTMENT INCOME: | | | | |
Interest | | $ | 5,314,889 | |
Dividends (net of foreign withholding tax of $138,027) | | | 1,859,655 | |
| |
Total Investment Income | | | 7,174,544 | |
| |
| |
EXPENSES: | | | | |
Investment advisory fees | | | 1,016,469 | |
Interest on loan | | | 388,134 | |
Administration fees | | | 153,373 | |
Transfer agent fees | | | 11,323 | |
Audit fees | | | 15,372 | |
Legal fees | | | 59,243 | |
Custodian fees | | | 19,253 | |
Trustee fees | | | 40,426 | |
Printing fees | | | 832 | |
Insurance fees | | | 28,668 | |
Federal income tax | | | 42,992 | |
Other | | | 37,545 | |
| |
Total Expenses | | | 1,813,630 | |
| |
Net Investment Income | | | 5,360,914 | |
| |
| |
REALIZED AND UNREALIZED GAIN/(LOSS) ON INVESTMENTS AND FOREIGN CURRENCY: | | | | |
Net realized gain/(loss) on: | | | | |
Investments | | | 243,424 | |
Foreign currency transactions | | | (4,926) | |
| |
Net realized gain | | | 238,498 | |
| |
Net change in unrealized appreciation/(depreciation) on: | | | | |
Investments | | | 5,735,778 | |
Translation of assets and liabilities denominated in foreign currencies | | | (179) | |
| |
Net change in unrealized appreciation | | | 5,735,599 | |
| |
Net Realized and Unrealized Gain on Investments and Foreign Currency | | | 5,974,097 | |
| |
Net Increase in Net Assets Resulting from Operations | | $ | 11,335,011 | |
| |
| | |
See Notes to Financial Statements | | |
Semi-Annual Report | April 30, 2014 | | 13 |
| | |
Principal Real Estate Income Fund | | |
Statement of Changes in Net Assets | | |
| | | | | | | | |
| | | For the Six
Months Ended
April 30, 2014
(Unaudited) | | | For the Period June 25, 2013
(Commencement) to
October 31, 2013 | |
| |
| | |
OPERATIONS: | | | | | | | | |
Net investment income | | $ | 5,360,914 | | | $ | 2,216,237 | |
Net realized gain on investments and foreign currency transactions | | | 238,498 | | | | 32,792 | |
Net change in unrealized appreciation on investments and translation of assets and liabilities denominated in foreign currencies | | | 5,735,599 | | | | 4,833,372 | |
| |
Net increase in net assets resulting from operations | | | 11,335,011 | | | | 7,082,401 | |
| |
| | |
DISTRIBUTIONS TO SHAREHOLDERS: | | | | | | | | |
From net investment income | | | (5,692,335) | | | | (2,794,419) | |
| |
Net decrease in net assets from distributions to shareholders | | | (5,692,335) | | | | (2,794,419) | |
| |
| | |
CAPITAL SHARE TRANSACTIONS: | | | | | | | | |
Proceeds from sales of shares, net of offering costs | | | – | | | | 120,078,000 | |
Proceeds from underwriters’ over-allotment option exercised, net of offering costs | | | – | | | | 11,332,389 | |
| |
Net increase in net assets from capital share transactions | | | – | | | | 131,410,389 | |
| |
| | |
Net Increase in Net Assets | | | 5,642,676 | | | | 135,698,371 | |
| |
| | |
NET ASSETS: | | | | | | | | |
Beginning of period | | | 135,798,379 | | | | 100,008 | |
| |
End of period (including distributions in excess of net investment income of $(911,791) and $(580,370)) | | $ | 141,441,055 | | | $ | 135,798,379 | |
| |
| | |
OTHER INFORMATION: | | | | | | | | |
Share Transactions: | | | | | | | | |
Shares outstanding - beginning of period | | | 6,899,800 | | | | 5,236 | |
Shares issued in connection with initial public offering | | | – | | | | 6,300,000 | |
Shares issued from underwriters’ over-allotment options exercised | | | – | | | | 594,564 | |
| |
Net increase in shares outstanding | | | – | | | | 6,894,564 | |
| |
Shares outstanding - end of period | | | 6,899,800 | | | | 6,899,800 | |
| |
| | |
See Notes to Financial Statements |
14 | | www.principalcef.com |
| | |
Principal Real Estate Income Fund | | Statement of Cash Flows |
| | For the Six Months Ended April 30, 2014 (Unaudited) |
| | | | |
CASH FLOWS FROM OPERATING ACTIVITIES: | | | | |
Net increase in net assets from operations | | $ | 11,335,011 | |
Adjustments to reconcile net increase in net assets from operations to net cash used in operating activities: | | | | |
Purchase of investment securities | | | (18,249,371) | |
Proceeds from disposition of investment securities | | | 19,221,254 | |
Net proceeds from short-term investment securities | | | 104,985 | |
Net realized (gain)/loss on: | | | | |
Investments | | | (243,424) | |
Net change in unrealized (appreciation)/depreciation on: | | | | |
Investments | | | (5,735,778) | |
Translation of assets and liabilities denominated in foreign currencies | | | 179 | |
Discounts and premiums amortized | | | (756,321) | |
Decrease in interest receivable | | | 6,884 | |
Increase in dividends receivable | | | (80,930) | |
Decrease in prepaid and other assets | | | 64,476 | |
Decrease in payable to custodian due to overdraft | | | (20,759) | |
Increase in interest due on loan payable | | | 2,638 | |
Increase in payable to transfer agent | | | 1,908 | |
Increase in payable to adviser | | | 3,936 | |
Increase in payable to administrator | | | 2,816 | |
Increase in payable for trustee fees | | | 265 | |
Increase in other payables | | | 36,264 | |
| |
Net cash provided by operating activities | | $ | 5,694,033 | |
| |
| |
CASH FLOWS FROM FINANCING ACTIVITIES: | | | | |
Cash distributions paid | | $ | (5,693,854) | |
| |
Net cash used in financing activities | | $ | (5,693,854) | |
| |
| |
Effect of exchange rates on cash | | $ | (179) | |
| |
Net increase in cash | | $ | – | |
Cash, beginning balance | | $ | – | |
Cash, ending balance | | $ | – | |
| |
SUPPLEMENTAL DISCLOSURE OF CASH FLOW INFORMATION: | | | | |
Cash paid during the period for interest from bank borrowing: | | $ | 385,496 | |
| | |
See Notes to Financial Statements | | |
Semi-Annual Report | April 30, 2014 | | 15 |
| | |
Principal Real Estate Income Fund | | Financial Highlights |
| | For a share outstanding throughout the periods presented. |
| | | | | | | | | | |
| | | For the Six Months Ended
April 30, 2014
(Unaudited) | | For the Period June 25, 2013
(Commencement) to October 31, 2013 |
| | |
Net asset value - beginning of period | | | $ | 19.68 | | | | $ | 19.10 | |
Income/(loss) from investment operations: | | | | | | | | | | |
Net investment income(a) | | | | 0.78 | | | | | 0.33 | |
Net realized and unrealized gain on investments | | | | 0.87 | | | | | 0.70 | |
Total income from investment operations | | | | 1.65 | | | | | 1.03 | |
| | |
Less distributions to common shareholders: | | | | | | | | | | |
From net investment income | | | | (0.83) | | | | | (0.41) | |
Total distributions | | | | (0.83) | | | | | (0.41) | |
| | |
Capital share transactions: | | | | | | | | | | |
Common share offering costs charged to paid-in capital | | | | – | | | | | (0.04) | |
Total capital share transactions | | | | – | | | | | (0.04) | |
Net increase in net asset value | | | | 0.82 | | | | | 0.58 | |
Net asset value - end of period | | | $ | 20.50 | | | | $ | 19.68 | |
Market price - end of period | | | $ | 18.95 | | | | $ | 17.76 | |
| | |
Total Return(b) | | | | 9.08% | | | | | 5.40% | |
Total Return - Market Price(b) | | | | 11.74% | | | | | (9.16%) | |
| | |
Supplemental Data: | | | | | | | | | | |
Net assets, end of period (in thousands) | | | $ | 141,441 | | | | $ | 135,798 | |
Ratios to Average Net Assets: | | | | | | | | | | |
Total expenses | | | | 2.70% | (c) | | | | 2.15% | (c) |
Total expenses excluding interest expense | | | | 2.13% | (c) | | | | 1.99% | (c) |
Net investment income | | | | 8.00% | (c) | | | | 5.01% | (c) |
Total expenses to average managed assets(d) | | | | 1.87% | (c) | | | | 1.93% | (c) |
Portfolio turnover rate | | | | 9% | (e) | | | | 1% | (e) |
Borrowings at End of Period | | | | | | | | | | |
Aggregate Amount Outstanding (in thousands) | | | $ | 60,000 | | | | $ | 60,000 | |
Asset Coverage Per $1,000 (in thousands) | | | $ | 3,357 | | | | $ | 3,263 | |
| (a) | Calculated using average shares throughout the period. |
| (b) | Total investment return is calculated assuming a purchase of common share at the opening on the first day and a sale at closing on the last day of each period reported. For purposes of this calculation, dividends and distributions, if any, are assumed to be reinvested at prices obtained under the Fund’s dividend reinvestment plan. Total investment returns do not reflect brokerage commissions, if any, and are not annualized. |
| (d) | Average managed assets represent net assets applicable to common shares plus average amount of borrowings during the period. |
| | |
See Notes to Financial Statements |
16 | | www.principalcef.com |
| | |
Principal Real Estate Income Fund | | Notes to Financial Statements |
| | April 30, 2014 (Unaudited) |
1. ORGANIZATION
Principal Real Estate Income Fund (the ‘‘Fund’’) is a Delaware statutory trust registered as a non-diversified, closed-end management investment company under the Investment Company Act of 1940, as amended (the ‘‘1940 Act’’). The Fund commenced operations on June 25, 2013. Prior to that date, the Fund had no operations other than matters relating to its organization and the sale and issuance of 5,236 common shares of beneficial interest in the Fund (“Common Shares”) to ALPS Advisors, Inc. (“AAI”) at a price of $19.10 per share, net of 4.50% sales load. AAI agreed to pay all of the Fund’s organizational expenses.
The Fund’s investment objective is to seek to provide high current income, with capital appreciation as a secondary investment objective, by investing in commercial real estate-related securities. There can be no assurance that the Fund will achieve its investment objective. An investment in the Fund may not be appropriate for all investors.
Investing in the Fund involves risks, including exposure to below-investment grade investments. The Fund’s net asset value will vary and its distribution rate may vary and both may be affected by numerous factors, including changes in the market spread over a specified benchmark, market interest rates and performance of the broader equity markets. Fluctuations in net asset value may be magnified as a result of the Fund’s use of leverage.
2. SIGNIFICANT ACCOUNTING POLICIES
Use of Estimates: The preparation of the financial statements in accordance with accounting principles generally accepted in the United States of America (“GAAP”) requires management to make estimates and assumptions that affect the reported amounts and disclosures in the financial statements during the period reported. Management believes the estimates and security valuations are appropriate; however, actual results may differ from those estimates, and the security valuations reflected in the financial statements may differ from the value the Fund’s ultimately realize upon sale of the securities. The financial statements have been prepared as of the close of the New York Stock Exchange (“NYSE”) on April 30, 2014.
Portfolio Valuation: The net asset value per Common Share of the Fund is determined no less frequently than daily, on each day that the NYSE is open for trading, as of the close of regular trading on the NYSE (normally 4:00 p.m. New York time). The Fund’s net asset value per Common Share is calculated in the manner authorized by the Fund’s Board of Trustees (the “Board”). Net asset value is computed by dividing the value of the Fund’s total assets, less its liabilities by the number of shares outstanding.
The Board has established the following procedures for valuation of the Fund’s assets under normal market conditions. Marketable securities listed on foreign or U.S. securities exchanges generally are valued at closing sale prices or, if there were no sales, at the mean between the closing bid and asked prices on the exchange where such securities are principally traded. Marketable securities listed on the NASDAQ Stock Market LLC (the “NASDAQ”) are valued at the NASDAQ official closing price. Unlisted or listed securities for which closing sale prices are not available are valued at the mean between the latest bid and asked prices. An option is valued at the price provided by an independent pricing service approved by the Board. Over-the-counter
| | |
| | | |
Semi-Annual Report | April 30, 2014 | | 17 |
| | |
Principal Real Estate Income Fund | | Notes to Financial Statements |
| | April 30, 2014 (Unaudited) |
options are valued at the mean between the latest bid and asked prices provided by dealers. Financial futures contracts listed on commodity exchanges and exchange-traded options are valued at closing settlement prices.
The Fund values commercial mortgage backed securities and other debt securities not traded in an organized market on the basis of valuations provided by an independent pricing service, approved by the Board, which uses information with respect to transactions in such securities, quotations from dealers, market transactions for comparable securities, various relationships between securities and yield to maturity in determining value. Debt securities having a remaining maturity of sixty days or less when purchased and debt securities originally purchased with maturities in excess of sixty days but which currently have maturities of sixty days or less are valued at amortized cost. If the independent pricing service is unable to provide a price for a security, if the price provided by the independent pricing service is deemed unreliable, or if events occurring after the close of the market for a security but before the time as of which the Fund values its Common Shares would materially affect net asset value, such security will be valued at its fair value as determined in good faith under procedures approved by the Board.
When applicable, fair value of an investment is determined by the Board or a committee of the Board or a designee of the Board. In fair valuing the Fund’s investments, consideration is given to several factors, which may include, among others, the following: the fundamental business data relating to the issuer, borrower, or counterparty; an evaluation of the forces which influence the market in which the investments are purchased and sold; the type, size and cost of the investment; the financial statements of the issuer, borrower, or counterparty, as applicable; the credit quality and cash flow of the issuer, borrower, or counterparty, as applicable, based on the sub-advisor’s or external analysis; the information as to any transactions in or offers for the investment; the price and extent of public trading in similar securities (or equity securities) of the issuer, or comparable companies; the coupon payments; the quality, value and saleability of collateral, if any, securing the investment; the business prospects of the issuer, borrower, or counterparty, as applicable, including any ability to obtain money or resources from a parent or affiliate and an assessment of the issuer’s, borrower’s, or counterparty’s management; the prospects for the industry of the issuer, borrower, or counterparty, as applicable, and multiples (of earnings and/or cash flow) being paid for similar businesses in that industry; and other relevant factors.
Securities Transactions and Investment Income: Investment security transactions are accounted for on a trade date basis. Dividend income is recorded on the ex-dividend date. Certain dividend income from foreign securities will be recorded, in the exercise of reasonable diligence, as soon as a Fund is informed of the dividend if such information is obtained subsequent to the ex-dividend date and may be subject to withholding taxes in these jurisdictions. Interest income, which includes amortization of premium and accretion of discount, is recorded on the accrual basis. Realized gains and losses from securities transactions and unrealized appreciation and depreciation of securities are determined using the first-in first-out cost basis method for both financial reporting and tax purposes.
Fair Value Measurements: The Fund discloses the classification of its fair value measurements following a three-tier hierarchy based on the inputs used to measure fair value. Inputs refer broadly to the assumptions that market participants would use in pricing the asset or liability,
| | |
Principal Real Estate Income Fund | | Notes to Financial Statements |
| | April 30, 2014 (Unaudited) |
including assumptions about risk. Inputs may be observable or unobservable. Observable inputs reflect the assumptions market participants would use in pricing the asset or liability that are developed based on market data obtained from sources independent of the reporting entity. Unobservable inputs reflect the reporting entity’s own assumptions about the assumptions market participants would use in pricing the asset or liability that are developed based on the best information available.
Various inputs are used in determining the value of the Fund’s investments as of the end of the reporting period. When inputs used fall into different levels of the fair value hierarchy, the level in the hierarchy within which the fair value measurement falls is determined based on the lowest level input that is significant to the fair value measurement in its entirety. The designated input levels are not necessarily an indication of the risk or liquidity associated with these investments.
These inputs are categorized in the following hierarchy under applicable financial accounting standards:
| | | | | | |
| | Level 1 | | – | | Unadjusted quoted prices in active markets for identical investments, unrestricted assets or liabilities that a Fund has the ability to access at the measurement date; |
| | | |
| | Level 2 | | – | | Quoted prices which are not active, quoted prices for similar assets or liabilities in active markets or inputs other than quoted prices that are observable (either directly or indirectly) for substantially the full term of the asset or liability; and |
| | | |
| | Level 3 | | – | | Significant unobservable prices or inputs (including the Fund’s own assumptions in determining the fair value of investments) where there is little or no market activity for the asset or liability at the measurement date. |
The following is a summary of the inputs used to value the Fund’s investments as of April 30, 2014:
Principal Real Estate Income Fund
| | | | | | | | | | | | | | | | |
Investments in Securities at Value* | | Level 1 -
Quoted Prices | | | Level 2 - Other Significant Observable Inputs | | | Level 3 -
Significant
Unobservable
Inputs | | | Total | |
Common Stocks | | $ | 68,079,803 | | | $ | – | | | $ | – | | | $ | 68,079,803 | |
Preferred Stocks | | | 1,805,540 | | | | – | | | | – | | | | 1,805,540 | |
Commercial Mortgage Backed Securities | | | – | | | | 129,180,305 | | | | – | | | | 129,180,305 | |
Short Term Investments | | | 1,052,927 | | | | – | | | | – | | | | 1,052,927 | |
Total | | $ | 70,938,270 | | | $ | 129,180,305 | | | $ | – | | | $ | 200,118,575 | |
| * | See Statement of Investments for industry classifications. |
The Fund recognizes transfers between levels as of the end of the period. For the six months ended April 30, 2014, the Fund did not have any significant transfers between Level 1 and Level 2 securities. The Fund did not have any securities which used significant unobservable inputs (Level 3) in determining fair value.
| | |
| | | |
Semi-Annual Report | April 30, 2014 | | 19 |
| | |
Principal Real Estate Income Fund | | Notes to Financial Statements |
| | April 30, 2014 (Unaudited) |
Commercial Mortgage Backed Securities (“CMBS”): As part of its investments in commercial real estate related securities, the Fund will invest in CMBS which are subject to certain risks associated with direct investments in CMBS. A CMBS is a type of mortgage-backed security that is secured by a loan (or loans) on one or more interests in commercial real estate property. Investments in CMBS are subject to the various risks which relate to the pool of underlying assets in which the CMBS represents an interest. CMBS may be backed by obligations (including certificates of participation in obligations) that are principally secured by commercial real estate loans or interests therein having multi-family or commercial use. Securities backed by commercial real estate assets are subject to securities market risks as well as risks similar to those of direct ownership of commercial real estate loans because those securities derive their cash flows and value from the performance of the commercial real estate underlying such investments and/or the owners of such real estate.
Real Estate Investment Trusts (“REITs”): As part of its investments in real estate related securities, the Fund will invest in REITs and are subject to certain risks associated with direct investment in REITs. REITs possess certain risks which differ from an investment in common stocks. REITs are financial vehicles that pool investors’ capital to acquire, develop and/or finance real estate and provide services to their tenants. REITs may concentrate their investments in specific geographic areas or in specific property types, e.g., regional malls, shopping centers, office buildings, apartment buildings and industrial warehouses. REITs may be affected by changes in the value of their underlying properties and by defaults by borrowers or tenants. REITs depend generally on their ability to generate cash flow to make distributions to shareowners, and certain REITs have self-liquidation provisions by which mortgages held may be paid in full and distributions of capital returns may be made at any time.
As REITs generally pay a higher rate of dividends than most other operating companies, to the extent application of the Fund’s investment strategy results in the Fund investing in REIT shares, the percentage of the Fund’s dividend income received from REIT shares will likely exceed the percentage of the Fund’s portfolio that is comprised of REIT shares. Distributions received by the Fund from REITs may consist of dividends, capital gains and/or return of capital.
Dividend income from REITs is recognized on the ex-dividend date. The calendar year-end amounts of ordinary income, capital gains, and return of capital included in distributions received from the Fund’s investments in REITs are reported to the Fund after the end of the calendar year; accordingly, the Fund estimates these amounts for accounting purposes until the characterization of REIT distributions is reported to the Fund after the end of the calendar year. Estimates are based on the most recent REIT distribution information available.
The performance of a REIT may be affected by its failure to qualify for tax-free pass-through of income under the Internal Revenue Code of 1986, as amended (the “Code”), or its failure to maintain exemption from registration under the 1940 Act. Due to the Fund’s investments in REITs, the Fund may also make distributions in excess of the Fund’s earnings and capital gains. Distributions, if any, in excess of the Fund’s earnings and profits will first reduce the adjusted tax basis of a holder’s Common Shares and, after that basis has been reduced to zero, will constitute capital gains to the Common Shareholder.
| | |
Principal Real Estate Income Fund | | Notes to Financial Statements |
| | April 30, 2014 (Unaudited) |
Concentration Risk: The Fund invests in companies in the real estate industry, which may include CMBS, REITs, REIT-like structures, and other securities that are secured by, or otherwise have exposure to, real estate. Any fund that concentrates in a particular segment of the market will generally be more volatile than a fund that invests more broadly. Any market price movements, regulatory changes, or economic conditions affecting CMBS, REITs, REIT-like structures, and real estate more generally, will have a significant impact on the Fund’s performance.
Foreign Currency Risk: The Fund expects to invest in securities denominated or quoted in currencies other than the U.S. dollar; changes in foreign currency exchange rates may affect the value of securities owned by the Fund, the unrealized appreciation or depreciation of investments and gains on and income from investments. Currencies of certain countries may be volatile and therefore may affect the value of securities denominated in such currencies, which means that the Fund’s net asset value could decline as a result of changes in the exchange rates between foreign currencies and the U.S. dollar. These risks often are heightened for investments in smaller, emerging capital markets.
The accounting records of the Fund are maintained in U.S. dollars. Prices of securities denominated in foreign currencies are translated into U.S. dollars at the closing rates of the exchanges at period end. Amounts related to the purchase and sale of foreign securities and investment income are translated at the rates of exchange prevailing on the respective dates of such transactions.
The Fund does not isolate that portion of the results of operations resulting from changes in foreign exchange rates on investments from the fluctuations arising from changes in market prices of securities held. Such fluctuations are included with the net realized and unrealized gain or loss from investments.
Reported net realized foreign exchange gains or losses arise from sales of foreign currencies, currency gains or losses realized between the trade and settlement dates on securities transactions, and the difference between the amounts of dividends, interest, and foreign withholding taxes recorded on the Fund’s books and the U.S. dollar equivalent of the amounts actually received or paid. Net unrealized foreign exchange gains and losses arise from changes in the fair values of assets and liabilities, other than investments in securities at fiscal period-end, resulting from changes in exchange rates.
A foreign currency contract is a commitment to purchase or sell a foreign currency at a future date, at a negotiated rate. The Fund may enter into foreign currency contracts to settle specific purchases or sales of securities denominated in a foreign currency and for protection from adverse exchange rate fluctuation. Risks to a Fund include the potential inability of the counterparty to meet the terms of the contract.
3. LEVERAGE
As one form of Borrowing (as defined in note 4 below), the Fund may enter into a credit facility with one or more commercial banks. Any such borrowings would constitute leverage. Such a facility is not expected to be convertible into any other securities of the Fund; outstanding amounts are expected to be pre-payable by the Fund prior to final maturity without significant
| | |
| | | |
Semi-Annual Report | April 30, 2014 | | 21 |
| | |
Principal Real Estate Income Fund | | Notes to Financial Statements |
| | April 30, 2014 (Unaudited) |
penalty and there are not expected to be any sinking fund or mandatory retirement provisions. Outstanding amounts would be payable at maturity or such earlier times as required by the agreement. The Fund may be required to prepay outstanding amounts under the facility or incur a penalty rate of interest in the event of the occurrence of certain events of default. The Fund would be expected to indemnify the lenders under the facility against liabilities they may incur in connection with the facility.
Under normal market conditions, the Fund’s policy is to utilize leverage through Borrowings and the issuance of preferred shares in an amount that represents approximately 33 1/3% of the Fund’s total assets, including proceeds from such Borrowings and issuances (or approximately 50% of the Fund’s net assets). It is possible that the assets of the Fund will decline due to market conditions such that this 33 1/3% limit will be exceeded. In that case, the leverage risk to shareholders will increase. Borrowings will be subject to interest costs, which may or may not be recovered by appreciation of the securities purchased. In certain cases, interest costs may exceed the return received on the securities purchased.
The Fund maintains a $70,000,000 line of credit with State Street Bank and Trust Company (“SSB”). As of April 30, 2014, the Fund has drawn down $60,000,000 from the SSB line of credit, which was the maximum borrowing outstanding during the period. The Fund is charged interest rate of 0.90% (per annum) above the three-month LIBOR rate of 0.23% (as of April 30, 2014) for borrowing under this credit agreement, on the last day of the interest period. Borrowing under this credit agreement, the Fund is charged a commitment fee on the average daily unused balance of the line of credit at the rate of 0.15% per annum. Per the terms of the credit agreement, the Fund paid an upfront fee of 0.10% on the total line of credit balance, which is amortized through the maturity date of the line of credit, September 22, 2014. The Fund pledges its investment securities as the collateral for the line of credit per the terms of the agreement. The average interest rate charged and the average outstanding loan payable for the period ending April 30, 2014 was as follows:
| | | | |
Average Interest Rate | | | 1.144% | |
Average Outstanding Loan Payable | | $ | 60,000,000 | |
4. INVESTMENT ADVISORY AND OTHER AGREEMENTS
AAI serves as the Fund’s investment adviser pursuant to an Investment Advisory Agreement with the Fund. As compensation for its services to the Fund, AAI receives an annual investment advisory fee of 1.05% based on the Fund’s average Total Managed Assets (as defined below). Pursuant to an Investment Sub-Advisory Agreement, AAI has retained Principal Real Estate Investors, LLC (‘‘PrinRei’’) as the Fund’s sub-advisor and will pay PrinRei an annual fee of 0.55% based on the Fund’s Total Managed Assets.
A trustee and certain officers of the Fund are also officers of AAI.
ALPS Fund Services, Inc. (‘‘AFS’’), an affiliate of AAI, serves as administrator to the Fund. Under an Administration, Bookkeeping and Pricing Services Agreement, AFS is responsible for calculating the net asset values, providing additional fund accounting and tax services, and providing fund administration and compliance-related services to the Fund. AFS is entitled to receive a monthly fee at the annual rate of 0.15% based on the Fund’s average Total Managed Assets, as defined below, plus out-of-pocket expenses.
| | |
Principal Real Estate Income Fund | | Notes to Financial Statements |
| | April 30, 2014 (Unaudited) |
DST Systems, Inc. (‘‘DST’’), the parent company of AAI and AFS, serves as the Transfer Agent to the Fund. Under the Transfer Agency Agreement, DST is responsible for maintaining all shareholder records of the Fund. DST is entitled to receive an annual minimum fee of $22,500 plus out-of-pocket expenses.
Total Managed Assets: For these purposes, the term Total Managed Assets is defined as the value of the total assets of the Fund minus the sum of all accrued liabilities of the Fund (other than aggregate liabilities representing Limited Leverage, as defined below), calculated as of 4:00 p.m. Eastern time on such day or as of such other time or times as the Board may determine in accordance with the provisions of applicable law and of the declaration and bylaws of the Fund and with resolutions of the Board as from time to time in force. Under normal market conditions, the Fund’s policy is to utilize leverage through Borrowings (as defined below) and through the issuance of preferred shares (if any) in an amount that represents approximately 33 1/3% of the Fund’s total assets, including proceeds from such Borrowings and issuances (collectively, ‘‘Limited Leverage’’). ‘‘Borrowings’’ are defined to include: amounts received by the Fund pursuant to loans from banks or other financial institutions; amounts borrowed from banks or other parties through reverse repurchase agreements; amounts received by the Fund from the Fund’s issuance of any senior notes or similar debt securities. Other than with respect to reverse repurchase agreements, Borrowings do not include trading practices or instruments that, according to the SEC or its staff, may cause senior securities concerns, and are intended to include transactions that are subject to the asset coverage requirements in Section 18 of the 1940 Act for the issuance of senior securities evidencing indebtedness (e.g., bank borrowings and the Fund’s issuance of any senior notes or similar securities) and senior securities in the form of stock (e.g., the Fund’s issuance of preferred shares).
5. DISTRIBUTIONS
The Fund intends to make monthly distributions to Common Shareholders out of the net investment income of the Fund, after payment of interest on any outstanding borrowings or dividends on any outstanding preferred shares. The Fund may also retain cash reserves if deemed appropriate by PrinREI to meet the terms of any leverage or derivatives transaction. Such distributions shall be administered by DST. While a portion of the Fund’s distributed income may qualify as qualified dividend income, all or a portion of the Fund’s distributed income may also be fully taxable. Any such income distributions, as well as any distributions by the Fund of net realized short-term capital gains, will be taxed as ordinary income. A portion of the distributions the Fund receives from its investments likely will be treated as return of capital. While the Fund anticipates distributing some or all of such return of capital, it is not required to do so in order to maintain its status as a ‘‘regulated investment company’’ under Subchapter M of the Code.
6. COMPENSATION OF OFFICERS AND TRUSTEES
The Fund pays no salaries or compensation to any of its interested Trustee or Officers. The three independent Trustees of the Fund receive an annual retainer of $17,000 and an additional $2,000 for attending each meeting of the Board. The independent Trustees are also reimbursed for all reasonable out-of-pocket expenses relating to attendance at meetings of the Board.
| | |
| | | |
Semi-Annual Report | April 30, 2014 | | 23 |
| | |
Principal Real Estate Income Fund | | Notes to Financial Statements |
| | April 30, 2014 (Unaudited) |
7. CAPITAL TRANSACTIONS
The Fund is a statutory trust established under the laws of the state of Delaware by an Agreement and Declaration of Trust dated August 31, 2012, as amended and restated through the date hereof. The Declaration of Trust provides that the Trustees of the Fund may authorize separate classes of shares of beneficial interest. The Trustees have authorized an unlimited number of Common Shares. The Fund intends to hold annual meetings of Common Shareholders in compliance with the requirements of the NYSE.
The Fund issued 6,300,000 Common Shares in its initial public offering on June 25, 2013. An additional 594,564 Common Shares were issued on August 9, 2013. These Common Shares were issued at $20.00 per share before the underwriting discount of $0.90 per share. Offering costs of $275,783 (representing $0.04 per Common Share) were offset against proceeds of the offerings and have been charged to paid-in capital of the Common Shares. AAI agreed to pay those offering costs of the Fund (other than the sales load) that exceeded $0.04 per Common Share.
Additional shares of the Fund may be issued under certain circumstances pursuant to the Fund’s Automatic Dividend Reinvestment Plan, as defined within the Fund’s organizational documents. Additional information concerning the Automatic Dividend Reinvestment Plan is included within this report.
8. PORTFOLIO INFORMATION
For the six months ended April 30, 2014, the cost of purchases and proceeds from sales of securities, excluding short-term securities, were as follows:
| | |
| Purchases | | Sales |
$ 17,358,791 | | $ 20,124,765 |
9. TAXES
Classification of Distributions: Net investment income/(loss) and net realized gain/(loss) may differ for financial statement and tax purposes. The character of distributions made during the year from net investment income or net realized gains may differ from its ultimate characterization for federal income tax purposes. Also, due to the timing of dividend distributions, the fiscal year in which amounts are distributed may differ from the fiscal year in which the income or realized gain was recorded by the Funds.
The amounts and characteristics of tax basis distributions and composition of distributable earnings/(accumulated losses) are finalized at fiscal year-end and are not available for the six months ended April 30, 2014.
| | |
Principal Real Estate Income Fund | | Notes to Financial Statements |
| | April 30, 2014 (Unaudited) |
The tax character of distributions paid during the period June 25, 2013 to October 31, 2013, was as follows:
Principal Real Estate Income Fund
| | | | |
| | | For the Period Ended
October 31, 2013 | |
Ordinary Income | | $ | 2,794,419 | |
Total | | $ | 2,794,419 | |
Tax Basis of Investments: Net unrealized appreciation/(depreciation) of investments based on federal tax cost as of April 30, 2014, were as follows:
| | | | |
Principal Real Estate Income Fund | | | | |
Cost of investments for income tax purposes | | $ | 189,549,800 | |
Gross appreciation on investments (excess of value over tax cost) | | $ | 12,585,793 | |
Gross depreciation on investments (excess of tax cost over value) | | | (2,017,018 | ) |
Net unrealized appreciation on investments | | $ | 10,568,775 | |
The differences between book-basis and tax-basis are primarily due to deferral of losses from wash sales and investments in passive foreign investment companies.
Federal Income Tax Status: For federal income tax purposes, the Fund currently qualifies, and intends to remain qualified, as a regulated investment company under the provisions of Subchapter M of the Internal Revenue Code of 1986, as amended, by distributing substantially all of its investment company taxable net income and realized gain, not offset by capital loss carryforwards, if any, to its shareholders. No provision for federal income taxes has been made. During the current six month period, the Fund paid an excise tax of $42,993 as required under Internal Revenue Code §4982 primarily due to the timing of income inclusions from Passive Foreign Investment Companies (“PFICs”) held by the Fund at the end of the prior fiscal year.
The Fund did not have a liability for any unrecognized tax benefits. The Fund files U.S. federal, state, and local tax returns as required. The Fund’s tax returns are subject to examination by the relevant tax authorities until expiration of the applicable statute of limitations which is generally three years after the filing of the tax return. The Fund’s commencement date was June 25, 2013; therefore, no tax returns have been filed.
Subsequent to April 30, 2014, the Fund paid the following distributions:
| | | | | | |
Ex Date | | Record Date | | Payable Date | | Rate (per share) |
May 15, 2014 | | May 19, 2014 | | May 29, 2014 | | $0.140 |
June 12, 2014 | | June 16, 2014 | | June 26, 2014 | | $0.140 |
| | |
| | | |
Semi-Annual Report | April 30, 2014 | | 25 |
| | |
Principal Real Estate Income Fund | | Notes to Financial Statements |
| | April 30, 2014 (Unaudited) |
10. INDEMNIFICATIONS
Under the Fund’s organizational documents, its officers and Trustees are indemnified against certain liability arising out of the performance of their duties with respect to the Fund. In addition, in the normal course of business, the Trust, on behalf of the Fund, enters into contracts with vendors and others that provide general indemnification. The Fund’s maximum exposure under these arrangements is unknown, as this would involve future claims that may be made against the Trust and/or the Fund. Based on experience, however, the Fund expects the risk of loss to be remote.
| | |
Principal Real Estate Income Fund | | Dividend Reinvestment Plan |
| | April 30, 2014 (Unaudited) |
Unless the registered owner of Common Shares elects to receive cash by contacting DST Systems, Inc. (the “Plan Administrator”), all dividends declared on Common Shares will be automatically reinvested by the Plan Administrator for shareholders in the Fund’s Automatic Dividend Reinvestment Plan (the “Plan”), in additional Common Shares. Common Shareholders who elect not to participate in the Plan will receive all dividends and other distributions in cash paid by check mailed directly to the shareholder of record (or, if the Common Shares are held in street or other nominee name, then to such nominee) by the Plan Administrator as dividend disbursing agent. Participation in the Plan is completely voluntary and may be terminated or resumed at any time without penalty by notice if received and processed by the Plan Administrator prior to the dividend record date; otherwise such termination or resumption will be effective with respect to any subsequently declared dividend or other distribution. Such notice will be effective with respect to a particular dividend or other distribution (together, a “Dividend”). Some brokers may automatically elect to receive cash on behalf of Common Shareholders and may re-invest that cash in additional Common Shares.
The Plan Administrator will open an account for each Common Shareholder under the Plan in the same name in which such Common Shareholder’s Common Shares are registered. Whenever the Fund declares a Dividend payable in cash, non-participants in the Plan will receive cash and participants in the Plan will receive the equivalent in Common Shares. The Common Shares will be acquired by the Plan Administrator for the participants’ accounts, depending upon the circumstances described below, either (i) through receipt of additional unissued but authorized Common Shares from the Fund (“Newly Issued Common Shares”) or (ii) by purchase of outstanding Common Shares on the open market (“Open-Market Purchases”) on the NYSE or elsewhere. If, on the payment date for any Dividend, the closing market price plus estimated brokerage commissions per Common Share is equal to or greater than the NAV per Common Share, the Plan Administrator will invest the Dividend amount in Newly Issued Common Shares on behalf of the participants. The number of Newly Issued Common Shares to be credited to each participant’s account will be determined by dividing the dollar amount of the Dividend by the NAV per Common Share on the payment date; provided that, if the NAV is less than or equal to 95% of the closing market value on the payment date, the dollar amount of the Dividend will be divided by 95% of the closing market price per Common Share on the payment date. If, on the payment date for any Dividend, the NAV per Common Share is greater than the closing market value plus estimated brokerage commissions, the Plan Administrator will invest the Dividend amount in Common Shares acquired on behalf of the participants in Open-Market Purchases.
In the event of a market discount on the payment date for any Dividend, the Plan Administrator will have until the last business day before the next date on which the Common Shares trade on an “ex-dividend” basis or 30 days after the payment date for such Dividend, whichever is sooner (the “Last Purchase Date”), to invest the Dividend amount in Common Shares acquired in Open-Market Purchases. It is contemplated that the Fund will pay monthly income Dividends. If, before the Plan Administrator has completed its Open-Market Purchases, the market price per Common Share exceeds the NAV per Common Share, the average per Common Share purchase price paid by the Plan Administrator may exceed the NAV of the Common Shares, resulting in the acquisition of fewer Common Shares than if the Dividend had been paid in Newly Issued Common Shares on the Dividend payment date. Because of the foregoing difficulty with respect to Open-Market Purchases, the Plan provides that if the Plan Administrator is unable to invest the full Dividend amount in Open-Market Purchases during the purchase period or if the market discount shifts to a market premium during the purchase period, the Plan Administrator may cease making
| | |
| | | |
Semi-Annual Report | April 30, 2014 | | 27 |
| | |
Principal Real Estate Income Fund | | Dividend Reinvestment Plan |
| | April 30, 2014 (Unaudited) |
Open-Market Purchases and may invest the uninvested portion of the Dividend amount in Newly Issued Common Shares at the NAV per Common Share at the close of business on the Last Purchase Date provided that, if the NAV is less than or equal to 95% of the then current market price per Common Share, the dollar amount of the Dividend will be divided by 95% of the market price on the payment date for purposes of determining the number of shares issuable under the Plan.
The Plan Administrator maintains all shareholders’ accounts in the Plan and furnishes written confirmation of all transactions in the accounts, including information needed by shareholders for tax records. Common Shares in the account of each Plan participant will be held by the Plan Administrator on behalf of the Plan participant, and each shareholder proxy will include those shares purchased or received pursuant to the Plan. The Plan Administrator will forward all proxy solicitation materials to participants and vote proxies for shares held under the Plan in accordance with the instructions of the participants.
In the case of Common Shareholders such as banks, brokers or nominees which hold shares for others who are the beneficial owners, the Plan Administrator will administer the Plan on the basis of the number of Common Shares certified from time to time by the record shareholder’s name and held for the account of beneficial owners who participate in the Plan.
There will be no brokerage charges with respect to Common Shares issued directly by the Fund. However, each participant will pay a pro rata share of brokerage commissions incurred in connection with Open-Market Purchases. The automatic reinvestment of Dividends will not relieve participants of any federal, state or local income tax that may be payable (or required to be withheld) on such Dividends. Participants that request a sale of Common Shares through the Plan Administrator are subject to brokerage commissions.
The Fund reserves the right to amend or terminate the Plan. There is no direct service charge to participants with regard to purchases in the Plan; however, the Fund reserves the right to amend the Plan to include a service charge payable by the participants.
All correspondence or questions concerning the Plan should be directed to the Plan Administrator.
| | |
Principal Real Estate Income Fund | | Additional Information |
| | April 30, 2014 (Unaudited) |
FUND PROXY VOTING POLICIES
The Fund has adopted a Proxy Voting Policy used to determine how the Fund votes proxies relating to its portfolio securities. Under the Fund’s Proxy Voting Policy, the Fund has, subject to the oversight of the Board, delegated to the Sub-Adviser the following duties: (1) to make the proxy voting decisions for the Fund, subject to the exceptions described below; and (2) to assist the Fund in disclosing its respective proxy voting record as required by Rule 30b1-4 under the 1940 Act.
In cases where a matter with respect to which the Fund was entitled to vote presents a conflict between the interest of the Fund’s shareholders, on the one hand, and those of the Fund’s investment adviser, principal underwriter, or an affiliated person of the Fund, its investment adviser, or principal underwriter, on the other hand, the Fund shall always vote in the best interest of the Fund’s shareholders. For purposes of this Policy a vote shall be considered in the best interest of the Fund’s shareholders when a vote is cast consistent with (a) a specific voting policy as set forth in the Sub-Adviser’s Proxy Voting Policy (described below), provided such specific voting policy was approved by the Board; or (b) the decision of the Trust’s Proxy Voting Committee (as described above).
The Fund CCO shall ensure that each Sub-Adviser has adopted a Proxy Voting Policy, which it uses to vote proxies for its clients, including the Fund.
A. General: The Fund believes that the voting of proxies is an important part of portfolio management as it represents an opportunity for shareholders to make their voices heard and to influence the direction of a company. The Fund is committed to voting corporate proxies in the manner that best serves the interests of the Fund’s shareholders.
B. Delegation to the Adviser and Sub-Adviser: The Fund believes that the Adviser or the Sub-Adviser is in the best position to make individual voting decisions for the Fund consistent with this Policy. Therefore, subject to the oversight of the Board, the Sub-Adviser is hereby delegated the following duties:
(1) to make the proxy voting decisions for the Fund, in accordance with the Sub-Adviser’s Proxy Voting Policy, except as provided herein; and
(2) to assist the Fund in disclosing its respective proxy voting record as required by Rule 30b1-4 under the 1940 Act, including providing the following information for each matter with respect to which the Fund is entitled to vote: (a) information identifying the matter voted on; (b) whether the matter was proposed by the issuer or by a security holder; (c) whether and how the Fund cast its vote; and (d) whether the Fund cast its vote for or against management.
The Board, including a majority of the independent trustees of the Board, must approve the Sub-Adviser’s Proxy Voting and Disclosure Policy (the “Adviser Voting Policy”) as it relates to the Fund. The Board must also approve any material changes to the Sub-Adviser Voting Policy no later than six (6) months after adoption by an Adviser.
| | |
| | | |
Semi-Annual Report | April 30, 2014 | | 29 |
| | |
Principal Real Estate Income Fund | | Additional Information |
| | April 30, 2014 (Unaudited) |
C. Conflicts: In cases where a matter with respect to which a Fund was entitled to vote presents a conflict between the interest of the Fund’s shareholders, on the one hand, and those of the Fund’s investment adviser, principal underwriter, or an affiliated person of the Fund, its investment adviser, or principal underwriter, on the other hand, the Fund shall always vote in the best interest of the Fund’s shareholders. For purposes of this Policy a vote shall be considered in the best interest of the Fund’s shareholders when a vote is cast consistent with the specific voting policy as set forth in Sub-Adviser Voting Policy, provided such specific voting policy was approved by the Board.
PORTFOLIO HOLDINGS
The Fund files a complete schedule of portfolio holdings with the Commission for the first and third quarters of each fiscal year on Form N–Q within 60 days after the end of the period. Copies of the Fund’s Form N–Q are available without a charge, upon request, by contacting the Fund at 1–855–838–9485 and on the Commission’s website at http://www.sec.gov. You may also review and copy Form N–Q at the Commission’s Public Reference Room in Washington, D.C. For more information about the operation of the Public Reference Room, please call the Commission at 1–800–SEC–0330.
SECTION 19(A) NOTICES
The following table sets forth the estimated amount of the sources of distribution for purposes of Section 19 of the Investment Company Act of 1940, as amended, and the related rules adopted there under. A Fund estimates the following percentages, of the total distribution amount per share, attributable to (i) current and prior fiscal year net investment income, (ii) net realized short-term capital gain, (iii) net realized long-term capital gain and (iv) return of capital or other capital source as a percentage of the total distribution amount. These percentages are disclosed for the fiscal year-to-date cumulative distribution amount per share for the Fund. The amounts and sources of distributions reported in these 19(a) notices are only estimates and not for tax reporting purposes. The actual amounts and sources of the amounts for tax reporting purposes will depend upon the Fund’s investment experience during the remainder of the calendar year and may be subject to changes based on tax regulations. The Fund will send you a Form 1099-DIV for the calendar year that will tell you how to report these distributions for federal income tax purposes.
| | | | | | | | | | | | | | | | |
Per Share Cumulative Distributions for the six months ended April 30, 2014 | | | | Percentage of the Total Cumulative Distributions for the six months ended April 30, 2014 |
Net Investment Income | | Net
Realized
Capital
Gains | | Return of
Capital | | Total Per
Share | | | | Net
Investment
Income | | Net
Realized
Capital
Gains | | Return of
Capital | | Total Per
Share |
| $ 0.7394 | | $ 0.0227 | | $ 0.0629 | | $ 0.8250 | | | | 89.63% | | 2.74% | | 7.63% | | 100.00% |
| | |
Principal Real Estate Income Fund | | Additional Information |
| | April 30, 2014 (Unaudited) |
SHAREHOLDER MEETING RESULTS
On April 14, 2014, the Principal Real Estate Income Fund (the “Fund”) held its Annual Meeting of Shareholders to consider the proposal set forth below. The following votes were recorded:
Proposal 1: The election of two (2) Trustees of the Fund, each to hold office for the term indicated or until their successors are duly elected and qualified.
Election of Thomas A. Carter as Class I Trustee of the Fund, term to expire at 2017 Annual Meeting
| | | | | | | | |
| | | Number of Shares | | | % of Shares Voted | |
Affirmative | | | 5,761,763.000 | | | | 98.238% | |
Withheld | | | 103,357.000 | | | | 1.762% | |
Total | | | 5,865,120.000 | | | | 100.000% | |
Election of Jerry G. Rutledge as Class I Trustee of the Fund, term to expire at 2017 Annual Meeting
| | | | | | | | |
| | | Number of Shares | | | % of Shares Voted | |
Affirmative | | | 5,684,066.000 | | | | 96.913% | |
Withheld | | | 181,054.000 | | | | 3.087% | |
Total | | | 5,865,120.000 | | | | 100.000% | |
CUSTODIAN AND TRANSFER AGENT
State Street Bank and Trust Company, located at State Street Financial Center, One Lincoln Street, Boston, MA 02111, serves as the Fund’s custodian and will maintain custody of the securities and cash of the Fund.
DST Systems, Inc., located at 333 West 11th Street, 5th Floor, Kansas City, Missouri 64105, serves as the Fund’s transfer agent and registrar.
LEGAL MATTERS
Mayer Brown LLP, Chicago, Illinois, serves as legal counsel to the Trust.
INDEPENDENT REGISTERED PUBLIC ACCOUNTING FIRM
Cohen Fund Audit Services, Ltd. is the independent registered public accounting firm for the Fund.
| | |
| | | |
Semi-Annual Report | April 30, 2014 | | 31 |

| | Not applicable to semi-annual report. |
| Item 3. | Audit Committee Financial Expert. |
| | Not applicable to semi-annual report. |
| Item 4. | Principal Accountant Fees and Services. |
| | Not applicable to semi-annual report. |
| Item 5. | Audit Committee of Listed Registrants. |
| Item 6. | Schedule of Investments. |
| | | | |
| | (a) | | Scheduleof Investments is included as part of the Report to Stockholders filed under Item 1 of this form. |
| | |
| | (b) | | Not applicable to the Registrant. |
| Item 7. | Disclosure of Proxy Voting Policies and Procedures for Closed-End Management Investment Companies. |
| | Not applicable to semi-annual report. |
| Item 8. | Portfolio Managers of Closed-End Management Investment Companies. |
| | (a) Not applicable to semi-annual report. |
| Item 9. | Purchases of Equity Securities by Closed-End Management Company and Affiliated Purchasers. |
| Item 10. | Submission of Matters to a Vote of Security Holders. |
| | There have been no material changes to the procedures by which shareholders may recommend nominees to the Board of Trustees. |
| Item 11. | Controls and Procedures. |
| | | | |
| | (a) | | The Registrant’s principal executive officer and principal financial officer have concluded that the Registrant’s disclosure controls and procedures (as defined in Rule 30a-3(c) under the Investment Company Act of 1940, as amended) are effective based on their evaluation of these controls and procedures as of a date within 90 days of the filing date of this document. |
| | | | |
| | (b) | | There was no change in the Registrant’s internal control over financial reporting (as defined in Rule 30a-3(d) under the Investment Company Act of 1940, as amended) during the second fiscal quarter of the period covered by this report that has materially affected, or is reasonably likely to materially affect, the Registrant’s internal control over financial reporting. |
| | |
Items 12. | | Exhibits. | | |
| | |
| | (a)(1) | | Not applicable to semi-annual report. |
| | |
| | (a)(2) | | The certifications required by Rule 30a-2(a) of the Investment Company Act of 1940, as amended, and Section 302 of the Sarbanes-Oxley Act of 2002 are attached hereto as
Ex-99.Cert. |
| | |
| | (a)(3) | | Not applicable. |
| | |
| | (b) | | A certification for the Registrant’s Principal Executive Officer and Principal Financial Officer, as required by Rule 30a-2(b) of the Investment Company Act of 1940, as amended, and Section 906 of the Sarbanes-Oxley Act of 2002 are attached hereto as
Ex-99.906Cert. |
SIGNATURES
Pursuant to the requirements of the Securities Exchange Act of 1934 and the Investment Company Act of 1940, the registrant has duly caused this report to be signed on its behalf by the undersigned, thereunto duly authorized.
PRINCIPAL REAL ESTATE INCOME FUND
| | | | | | | | |
| By: | | (Signature and Title) | | | | /s/ Thomas A. Carter | | |
| | | | | | Thomas A. Carter | | |
| Date: | | June 30, 2014 | | | | President and Principal Executive Officer | | |
Pursuant to the requirements of the Securities Exchange Act of 1934 and the Investment Company Act of 1940, this report has been signed below by the following persons on behalf of the registrant and in the capacities and on the dates indicated.
| | | | | | | | |
| By: | | (Signature and Title) | | | | /s/ Thomas A. Carter | | |
| | | | | | Thomas A. Carter | | |
| Date: | | June 30, 2014 | | | | President and Principal Executive Officer | | |
| | | | |
| By: | | (Signature and Title) | | | | /s/ Patrick D. Buchanan | | |
| | | | | | Patrick D. Buchanan | | |
| Date: | | June 30, 2014 | | | | Treasurer and Principal Financial Officer | | |